Embed Size (px)
Citation preview

Financial Results for FY2015
DATA BOOK
Takeda Pharmaceutical Company Limited (TSE code 4502)
Contact: Global Finance, IR
TEL: +81-3-3278-2306
http://www.takeda.com/
Quarterly Announcements / Presentations
http://www.takeda.com/investor-information/results/
I. Overview of Takeda group 1
■ Number of subsidiaries and affiliates by business segment
II. Financial Results
1. Financial highlights 2
2. Consolidated Statements of Income 3
3. Revenue / Product Sales 4-6
◆ Revenue by Regions
◆ Ethical Drugs Revenue [Consolidated]
◆ Ethical Drugs Revenue [Emerging Markets]
◆ Ethical Drugs: Global major products' sales
◆ Ethical Drugs: US major products' sales (in US$)
◆ Ethical Drugs: Japan major products' sales
◆ Consumer Healthcare: Major products' sales
4. Consolidated Statement of Financial Position 7-8
5. Consolidated Statement of Cash Flows 8
6. Segment Information 9
7. Capital expenditure, depreciation and amortization and impairment losses 9
8. Number of employees 10
9. Shareholders 11
10. Financial ratios 12
III. Pipeline
1. Development Activities 13-17
■ Oncology
■ Gastroenterology
■ CNS
■ Vaccines
■ Specialty CV
■ Others
■ Recent progress in stage
■ Discontinued projects
■ Revised collaboration agreement
■ Clinical study protocol summaries
2. Research Activities 18
■ Main joint research activities
Contents

★Wako Pure Chemical Industries, Ltd. 《Production/Sales》
And others
Takeda Pharm
aceutical Com
pany Limited
Japan
【Ethical drugs】
<United States >★Takeda Pharmaceuticals International, Inc.
★Takeda Pharmaceuticals U.S.A., Inc.★Millennium Pharmaceuticals, Inc.
★Takeda California, Inc.★Takeda Vaccines, Inc.★Takeda Development Center Americas, Inc.★Takeda Ventures, Inc.
<Europe and Canada>★Takeda Europe Holdings B.V.★Takeda A/S★Takeda Pharmaceuticals International AG
★Takeda Pharmaceuticals Europe, Limited
★Takeda GmbH
★Takeda Pharma Vertrieb GmbH & Co. KG ★Takeda Italia S.p.A.★Takeda Austria GmbH★Takeda Pharma Ges.m.b.H★Takeda France S.A.S.★Takeda Pharma A/S
★Takeda AS ★Takeda Belgium SCA/CVA★Takeda Christiaens SCA/CVA★Takeda UK Limited ★ Takeda Oy★Takeda Pharma AG★Takeda Farmaceutica Espana S.A.★Takeda Nederland B.V.★Takeda Pharma AB★Takeda Pharma Sp. z o.o.★Takeda Hellas S.A.★Takeda Ireland Limited★Takeda Cambridge Limited★Takeda Development Centre Europe Ltd.★Takeda Canada Inc.
<Russia/CIS>★Takeda Pharmaceuticals Limited
Liability Company★Takeda Ukraine LLC★Takeda Kazakhstan LLP
<Latin America>★Takeda Distribuidora Ltda.★Multilab Indústria e Comércio de
Produtos Farmacêuticos Ltda. ★Takeda Pharma Ltda.★Takeda Mexico S.A. de C.V.★Takeda Pharma, S.A.
<Asia>★Takeda (China) Holdings Co., Ltd.
★Takeda Pharmaceuticals (Asia Pacific) Pte. Ltd.
★Guangdong Techpool Bio-Pharma Co., Ltd.
★Takeda Pharmaceutical (China)Company Limited
★Tianjin Takeda Pharmaceuticals. Co., Ltd.★Takeda Pharmaceuticals Korea Co., Ltd.★Takeda (Thailand), Ltd. ★Takeda Pharmaceuticals Taiwan, Ltd.★P.T. Takeda Indonesia★Takeda Healthcare Philippines Inc.★Takeda Development Center Asia, Pte. Ltd.★Takeda Vaccines Pte. Ltd.
<Others>★Takeda (Pty.) Ltd.★Takeda Pharmaceuticals Australia Pty. Ltd.
And others
《Supervision of the U.S.Sales & Marketing/Research/ Development》
《 Holding Company/Sales》《Sales/Research/Development》
《Research》《Research/Development 》《Development 》《Research-related Venture Investment 》
《Holding Company》《Holding Company》《Supervision of Sales &Marketing for areas otherthan Japan and the U.S.》
《Supervision of EuropeSales & Marketing》
《Production/Sales/Research/Development 》《Sales》《Production/Sales》《Production/Sales 》《Sales 》《Sales》《Production/Sales/Development》
《Production/Sales》《Sales》《Production/Sales》《Sales》《Sales》《Sales》《Sales》《Sales》《Sales》《Production/Sales》《Sales》《Production》《Research》《Development 》《Sales》
《Sales》
《Sales》《Sales》
《Sales》《Production/Sales/Research/Development 》
《Production/Sales》《Production/Sales 》《Production/Sales》
《Holding Company/ Development》
《Supervision of AsiaSales & Marketing》
《Production/Sales/Research/Development》
《Sales》
《Production/Sales》《Sales》《Sales》《Sales》《Production/Sales》《Sales》《Development》《Research/Development》
《Sales》《Sales》
★Nihon Pharmaceutical Co., Ltd.
And others
【Ethical drugs】
《Production/Sales/
Research/Development》
Overseas
★Takeda Healthcare Products Co., Ltd.◎Amato Pharmaceutical Products, Ltd.
《Production》
《Production/Sales/Research/Development》
【Consumer Healthcare】
Sales of products Consign processing
Supply of raw materials
Others
★:Consolidated subsidiaries
◎:Equity method affiliates
I. Overview of Takeda groupThe Takeda Group consists of 151 companies, including the parent company submitting these consolidated financial statements, 135 consolidated subsidiaries (including partnership) and 15 affiliates accounted for by the equity method. The following chart shows the main business areas of the Takeda Group, the position of the companies that make up the Group within their respective areas of business, and relationships with each business segment.
【Others】
■ Number of subsidiaries and affiliates by business segment
< FY2015 4Q>
Japan Overseas Japan OverseasEthical drugs 4 111 2 5 122Consumer healthcare 1 0 1 0 2Others 13 6 7 0 26
18 117 10 5 1500 -3 -1 -3 -7
Total
Total
vs. FY2014
Consolidated subsidiaries Companies applied"equity method"
1

II. Financial Results1. Financial highlights (more detail will be available in Page 3 and onward)
Consolidated operating results(Billion JPY)
FY13 FY14 FY15 vs. FY14increase/decrease
FY16Forecasts
Revenue 1,691.7 1,777.8 1,807.4 29.6 1.7% 1,720.0
Overseas revenue 957.8 1,065.0 1,119.3 54.3 5.1% 1,100.0
<% of Revenue> <56.6%> <59.9%> <61.9%> <2.0pt> <64.0%>
Revenue of ethical drugs segment 1,529.1 1,614.5 1,648.7 34.2 2.1% 1,560.0
R&D expenses *1 341.6 352.9 345.9 -7.0 -2.0% 325.0
<% of Revenue> <20.2%> <19.9%> <19.1%> <-0.7pt> <18.9%>
Operating profit 139.3 -129.3 130.8 260.1 - 135.0
<% of Revenue> <8.2%> < 7.3%> <7.2%> <14.5pt> <7.8%>
Profit before income taxes 158.9 -145.4 120.5 266.0 - 132.5
<% of Revenue> <9.4%> < 8.2%> <6.7%> <14.8pt> <7.7%>
Net profit for the year 109.6 -143.0 83.5 226.5 -
<% of Revenue> <6.5%> < 8.0%> <4.6%> <12.7pt>
Profit attributable to owners of the Company 106.7 -145.8 80.2 225.9 - 88.0
<% of Revenue> <6.3%> < 8.2%> <4.4%> <12.6pt> <5.1%>
Core earnings *2 314.2 288.3 292.4 4.1 1.4%
<% of Revenue> <18.6%> <16.2%> <16.2%> <-0.0pt>
Consolidated financial position(Billion JPY)
FY13 End FY14 End FY15 Endvs. FY14
End
Total assets 4,569.1 4,296.2 3,824.1 -472.1
Total liabilities 2,028.5 2,090.0 1,812.9 -277.1
Total equity 2,540.6 2,206.2 2,011.2 -195.0
Equity attributable to owners of the Company 2,470.7 2,137.0 1,948.7 -188.4
Ratio of equity attributable to owners of the Company to total assets
54.1% 49.7% 51.0% 1.2pt
Shares FY13 End FY14 End FY15 End
Number of shares outstanding (1,000) 789,681 789,924 790,284
Treasury stock (1,000) 213 4,032 6,745
Stock price at year-end (JPY) 4,892 5,999 5,136
Total market value (Billion JPY) 3,863.1 4,738.8 4,058.9
ROE・EPS・Dividend (JPY) FY13 FY14 FY15 vs. FY14
Return on equity attributable to owners of the Company
4.5% -6.3% 3.9% -
Basic earnings per share 135.10 -185.37 102.26 -
Annual dividends per share 180.00 180.00 180.00 -
Dividend pay-out ratio 133.2% - 176.0% -
Exchange rate(JPY) FY13 FY14 FY15FY16
Assumptions
US$ Average (Apr.-Mar.) 100 109 121 110
Euro Average (Apr.-Mar.) 133 139 132 125
*2 Profit from regular business calculated by deducting any temporary factors such as impacts from business combination accounting and from amortization/impairment loss of intangible assets etc., from operating profit.
*1 Because of starting the new organizational structure and changing managerial accounting method from FY15, allocation accounts for some expenses have changed. For the purpose to compare FY14 expenses with the FY15 expenses under the same basis (underlying), amounts roughly estimated for this change are adjusted in FY14.
2
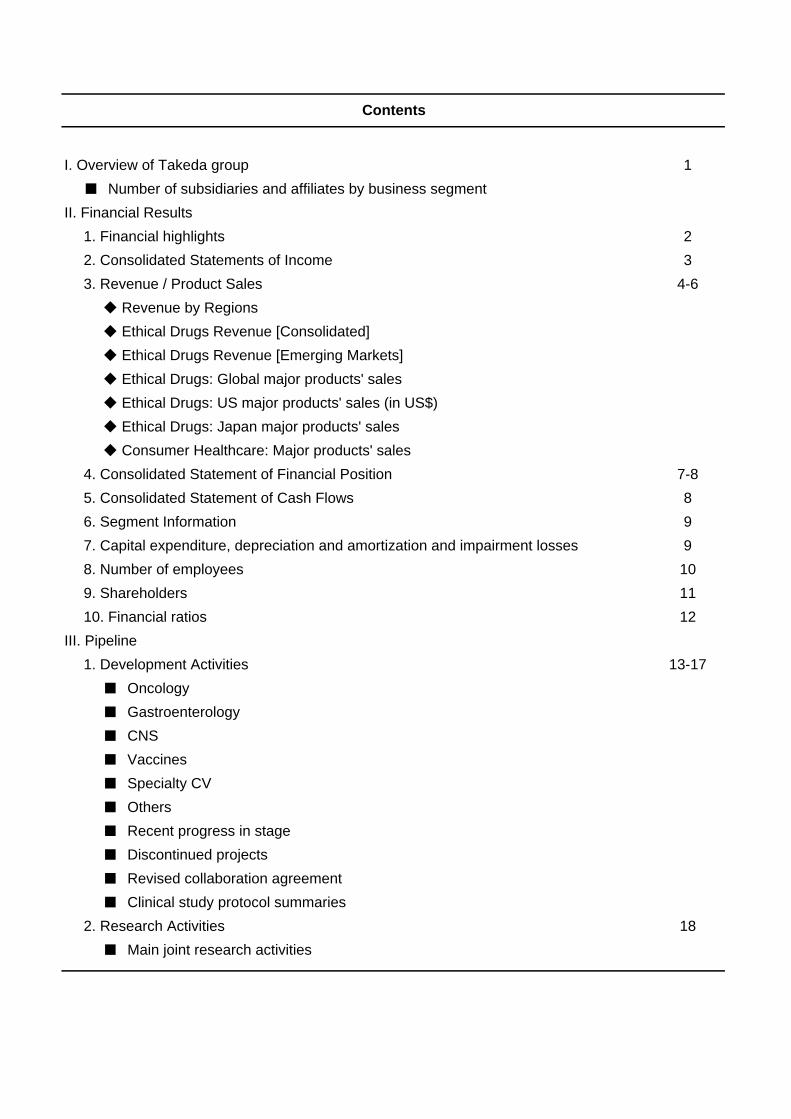
2. Consolidated Statement of Income
(Billions of Yen)
FY13 FY14 FY15 vs. FY14increase/decrease
FY16Forecasts
Revenue 1,691.7 1,777.8 1,807.4 29.6 1.7% 1,720.0
Royalty income and service income 86.3 87.5 56.5 -31.1 -35.5%
Cost of sales *1 490.3 528.1 535.4 7.3 1.4%
<% of revenue> <29.0%> <29.7%> <29.6%> <-0.1pt>
Gross Profit 1,201.4 1,249.8 1,272.0 22.2 1.8%
<% of revenue> <71.0%> <70.3%> <70.4%> <0.1pt>
SG&A expenses *1 556.2 634.7 650.8 16.1 2.5%
<% of revenue> <32.9%> <35.7%> <36.0%> <0.3pt>
Sales and Marketing expenses 436.6 460.6 24.0 5.5%
General Administrative expenses 198.1 190.2 -7.9 -4.0%
R&D expenses *1 341.6 352.9 345.9 -7.0 -2.0% 325.0
<% of revenue> <20.2%> <19.9%> <19.1%> <-0.7pt> <18.9%>
Amortization and impairment losses on intangible assets associated with products
143.2 176.4 125.1 -51.3 -29.1% 140.0
Other operating income 23.9 107.2 25.1 -82.1 -76.6%
Government grant income 2.6 3.1 3.7 0.6 18.6%
Rental income 4.3 3.9 3.4 -0.5 -11.6%
Gains on sales of assets held for sale 6.6 32.8 0.1 -32.8 -99.8%
Royalty income on transfer of operations 4.7 6.5 4.9 -1.6 -24.4%
Others *2 5.6 60.8 12.9 -47.9 -78.7%
Other operating expenses 45.0 322.2 44.4 -277.8 -86.2%
Expenses directly attributable to rental income 5.0 2.2 5.0 2.7 121.6%
Donations and contributions 3.2 1.5 2.4 1.0 64.0%
Restructuring expenses *3 21.7 31.2 25.8 -5.4 -17.4%
Loss on Actos litigation - 274.1 - -274.1 -100.0%
Others 15.1 13.2 11.2 -2.0 -15.0%
Operating profit 139.3 -129.3 130.8 260.1 - 135.0
<% of revenue> <8.2%> <-7.3%> <7.2%> <14.5pt> <7.8%>
Financial income 49.3 15.4 21.6 6.3 40.9%
Interest income 1.4 2.3 2.3 0.0 0.1%
Dividends income 3.3 3.3 3.3 0.1 2.0%
Gains on sales of available-for-salefinancial assets
40.5 8.9 15.1 6.2 69.3%
Foreign exchange gains including gains onvaluation of derivatives
4.1 - - - -
Interest on tax refund - - - - -
Others 0.0 0.9 0.9 0.1 6.6%
Financial expenses 30.7 32.9 31.9 -0.9 -2.9%
Interest expenses 4.9 5.8 5.3 -0.5 -9.1%
Fair value adjustments of contingentconsiderations
11.0 16.2 7.6 -8.6 -53.1%
Impairment losses on available-for-salefinancial assets
0.8 1.7 2.3 0.7 41.1%
Foreign exchange losses including losses onvaluation of derivatives
11.8 3.9 14.0 10.2 -
Others 2.3 5.3 2.7 -2.7 -49.7%
Share of profit of associates accounted for using the equity method
1.0 1.3 -0.0 -1.3 -
Profit before tax 158.9 -145.4 120.5 266.0 - 132.5
Income tax expenses 49.3 -2.4 37.1 39.5 -
Net profit for the period 109.6 -143.0 83.5 226.5 -
<% of revenue> <6.5%> <-8.0%> <4.6%> <12.7pt>
Attributable to Owners of the Company 106.7 -145.8 80.2 225.9 - 88.0
<% of revenue> <6.3%> <-8.2%> <4.4%> <12.6pt> <5.1%>
Total comprehensive income for the period 343.7 -180.9 -39.6 141.3 -
<% of revenue> <20.3%> <-10.2%> <-2.2%> <8.0pt>
Attributable to Owners of the Company 339.2 -186.6 -40.3 146.3 -
<% of revenue> <20.0%> <-10.5%> <-2.2%> <8.3pt>
Effective tax rate
Japanese statutory tax rate 38.0% 35.6% 33.0% -2.6pt
Effective tax rate 31.0% 1.7% 30.7% 29.1pt
*3 Expenses from reorganization, such as the consolidation of a number of sites and functions (including the potential merger or liquidation of subsidiaries)and the reduction of the workforce to build an efficient operating model.
*1 Because of starting the new organizational structure and changing managerial accounting method from FY15, allocation accounts for some expenses havechanged. For the purpose to compare FY14 expenses with the FY15 expenses under the same basis (underlying), amounts roughly estimated for this changeare adjusted in FY14.Amounts adjusted are + 7.1 bln yen for cost of sales, + 22.1 bln yen for SG&A expenses, and - 29.2 bln yen for R&D expenses.
*2 Fair value adjustments of contingents considerations are included in "Others".
3

◆ Revenue by Regions (Billions of Yen)
FY13 FY14 FY15 vs FY14increase/decrease
1,691.7 1,777.8 1,807.4 29.6 1.7%
733.9 712.8 688.1 -24.7 -3.5%
957.8 1,065.0 1,119.3 54.3 5.1%
<56.6%> <59.9%> <61.9%> <2.0pt>
352.1 426.1 514.4 88.3 20.7%
<20.8%> <24.0%> <28.5%> <4.5pt>
320.0 325.3 309.3 -16.0 -4.9%
<18.9%> <18.3%> <17.1%> <-1.2pt>
89.6 81.3 61.8 -19.5 -24.0%
<5.3%> <4.6%> <3.4%> <-1.2pt>
81.2 85.4 68.4 -17.0 -19.9%
<4.8%> <4.8%> <3.8%> <-1.0pt>
85.4 111.4 126.0 14.5 13.1%
<5.0%> <6.3%> <7.0%> <0.7pt>
29.5 35.5 39.4 3.9 11.1%
<1.7%> <2.0%> <2.2%> <0.2pt>
86.3 87.5 56.5 -31.1 -35.5%
2.6 8.8 7.2 -1.6 -17.8%
83.7 78.8 49.3 -29.5 -37.5%
◆ Ethical Drugs Revenue [Consolidated] (Billions of Yen)
FY13 FY14 FY15 vs FY14increase/decrease
Net Sales in Japan 580.0 553.2 535.1 -18.2 -3.3%
Net Sales Overseas 863.3 974.3 1,057.7 83.4 8.6%
318.9 394.9 495.3 100.4 25.4%
Europe and Canada 265.6 287.1 283.5 -3.6 -1.2%
89.5 79.5 61.5 -18.0 -22.7%
80.6 80.1 66.0 -14.0 -17.5%
Asia 80.5 102.4 116.6 14.1 13.8%
Other 28.1 30.3 34.9 4.5 14.9%
Royalty income and service income 85.8 86.9 55.8 -31.1 -35.8%
Japan 2.1 8.1 6.6 -1.5 -18.7%
Overseas 83.7 78.8 49.3 -29.6 -37.5%
Total ethical drugs revenue 1,529.1 1,614.5 1,648.7 34.2 2.1%
Ratio of overseas ethical drugs revenue 61.9% 65.2% 67.1% 1.9pt
(Billions of Yen)
FY13 FY14 FY15 vs FY14increase/decrease
Total revenue in emerging markets 2,808.3 3,137.1 2,904.2 -232.9 -7.4%
China 552.3 659.5 107.2 19.4%
Brazil 575.6 435.4 -140.2 -24.4%
Russia 476.4 380.7 -95.7 -20.1%
* Revenue amount includes royalty income and service income.
** "Total revenue in emerging markets" includes the revenue amounts in emerging markets other than "China", Russia" and "Brazil."
◆ Ethical Drugs Revenue [Emerging Markets]
3. Revenue / Product Sales
Total revenue
Japan
Overseas
<% of revenue>
United States
<% of revenue>
Europe and Canada
<% of revenue>
Russia/CIS
<% of revenue>
Latin America
<% of revenue>
Asia
<% of revenue>
Other
<% of revenue>
Royalty income and service income
Japan
Overseas
United States
* Revenue amount is classified into countries or regions based on the customer location.** Effective from FY14, the Company changed the regional classification to ensure consistency with its global organizational structure (previous"North America" was divided into "United States" and "Canada", and "Canada" and previous "Europe" were integrated into "Europe andCanada"). For fair comparison purpose, the amounts reported in the periods of FY13 were modified according to the new classification.*** Other region includes Middle East, Oceania and Africa.
Russia/CIS
Latin America
* Revenue amount is classified into countries or regions based on the customer location.** Effective from FY14, the Company changed the regional classification to ensure consistency with its global organizational structure (previous"North America" was divided into "United States" and "Canada", and "Canada" and previous "Europe" were integrated into "Europe andCanada"). For fair comparison purpose, the amounts reported in the periods of FY13 were modified according to the new classification.*** Other region includes Middle East, Oceania and Africa.
4

◆ Ethical Drugs: Global major products' sales *1 (Billion JPY)
FY14 FY15 vs. PrYReportedGrowth
UnderlyingGrowth
FY16Forecasts *2
Velcade United States 110.8 131.6 20.9 18.8% 7.3%
Other than United States 41.9 30.4 -11.5 -27.5% -34.7%
Total 152.7 162.0 9.3 6.1% -4.2%
Leuprorelin Japan 57.6 53.8 -3.8 -6.5% -6.5%
United States 15.9 17.3 1.4 8.9% 6.0%
Europe and Canada 36.4 35.3 -1.1 -3.0% 0.5%
Emerging Markets 14.2 18.0 3.8 27.1% 21.6%
Total 124.0 124.4 0.4 0.3% 0.5%
Pantoprazole United States 11.0 13.6 2.6 23.9% 15.9%
Europe and Canada 49.3 43.4 -5.9 -12.0% -8.4%
Emerging Markets 43.4 43.7 0.3 0.7% 0.0%
Total 103.7 100.8 -3.0 -2.9% -2.0%
Lansoprazole Japan 52.5 41.3 -11.3 -21.4% -21.4%
United States 28.7 27.5 -1.2 -4.1% -12.7%
Europe and Canada 11.7 10.5 -1.2 -9.9% -5.5%
Emerging Markets 10.1 10.2 0.1 1.2% -2.7%
Total 102.9 89.5 -13.4 -13.1% -15.2%
Entyvio United States 20.1 63.1 42.9 - 192.5%
Europe and Canada 7.7 21.9 14.2 184.7% -
Emerging Markets 0.0 1.3 1.2 - -
Total 27.8 86.2 58.3 - 199.1%
Candesartan Japan 94.6 58.5 -36.1 -38.1% -38.1%
United States 2.1 1.3 -0.8 -38.5% -45.0%
Europe and Canada 17.7 12.5 -5.1 -29.1% -30.8%
Emerging Markets 11.4 12.4 1.1 9.3% 1.9%
Total 125.7 84.8 -41.0 -32.6% -33.4%
Dexilant United States 53.5 64.0 10.6 19.8% 8.6%
Europe and Canada 4.9 5.4 0.5 11.2% 16.7%
Emerging Markets 3.9 5.7 1.7 44.0% 50.1%
Total 62.3 75.1 12.8 20.6% 11.9%
Azilva Japan 45.4 59.0 13.7 30.1% 30.1%
Total 45.4 59.0 13.7 30.1% 30.1%
Nesina Japan 38.4 36.9 -1.5 -3.9% -3.9%
United States 4.1 5.3 1.2 29.0% 16.8%
Europe and Canada 0.6 3.5 2.9 - -
Emerging Markets 1.3 3.3 2.0 163.2% 169.8%
Total 44.3 48.9 4.6 10.5% 10.4%
Colcrys United States 58.8 46.5 -12.4 -21.0% -28.9%
Total 58.8 46.5 -12.4 -21.0% -28.9%
Uloric United States 32.6 41.8 9.2 28.4% 16.7%
Europe and Canada 0.6 0.7 0.1 12.5% 17.5%
Total 33.2 42.5 9.3 28.1% 16.7%
Amitiza United States 31.9 37.2 5.3 16.5% 5.6%
Europe and Canada 0.0 0.1 0.1 - -
Total 32.0 37.3 5.3 16.7% 5.7%
Adcetris Japan 2.8 3.1 0.3 12.5% 12.5%
Europe and Canada 16.3 17.4 1.1 6.6% 9.5%
Emerging Markets 3.6 7.2 3.6 102.7% 124.9%
Total 22.9 27.6 4.8 20.8% 27.6%
Brintellix United States 13.6 24.5 10.9 79.9% 63.7%
Total 13.6 24.5 10.9 79.9% 63.7%
Takecab Japan 3.2 8.4 5.2 161.0% 161.0%
Total 3.2 8.4 5.2 161.0% 161.0%
Ninlaro United States - 4.0 4.0 - -
Total - 4.0 4.0 - -
*1 Sales amount includes royalty income and service income.
*2 FY16 Forecasts: Arrows show growth from FY15 results (reported basis).
± <10% +10% ~ 20% +20% ~ 30% + >30% -10% ~ 20% -20% ~ 30% - >30%
5

◆ Ethical Drugs: US major products' sales (in US$)*(Millions of US$)
FY13 FY14 FY15 vs PrYincrease/decrease
Velcade 953 1,017 1,079 62 6.1%
Dexilant 449 488 530 42 8.6%
Entyvio - 179 524 345 192.5%
Colcrys 520 542 386 -157 -28.9%
Uloric 266 297 347 50 16.7%
Amitiza 257 291 308 16 5.6%
Prevacid(lansoprazole)
295 254 222 -32 -12.6%
Brintellix 4 124 203 79 63.7%
Contrave - 19 56 37 199.9%
Ninlaro - - 34 34 -
*Product sales (royalty income and service income are excluded).
◆ Ethical Drugs: Japan major products' sales(Billions JPY)
LaunchedTherapeutic
ClassFY13 FY14 FY15 vs PrY
increase/decrease
Azilva * (12. 5) Hypertension 25.3 45.4 59.0 13.7 30.1%
Blopress *(candesartan)
(99. 6) Hypertension 125.8 94.6 58.5 -36.1 -38.1%
Leuplin(leuprorelin)
(92. 9)Prostate cancer,
breast cancer and endometriosis
64.5 57.6 53.8 -3.8 -6.5%
Takepron *(lansoprazole)
(92.12) Peptic ulcers 67.6 52.5 41.3 -11.3 -21.4%
Enbrel (05. 3)Rheumatoid
arthritis45.4 41.2 40.8 -0.4 -0.9%
Nesina * (10. 6) Diabetes 38.0 38.4 36.9 -1.5 -3.9%
Lotriga (13. 1) Hyperlipidemia 5.2 13.2 22.3 9.1 69.0%
Vectibix (10. 6) Colorectal cancer 19.4 18.3 18.4 0.0 0.3%
Reminyl (11. 3)Alzheimer-type
dementia12.3 13.9 16.0 2.0 14.5%
Benet (02. 5) Osteoporosis 11.6 10.4 9.7 -0.7 -6.5%
Basen (94. 9) Diabetes 16.1 11.2 8.7 -2.5 -22.5%
Actos *(pioglitazone)
(99.12) Diabetes 15.5 10.8 8.5 -2.3 -21.3%
Takecab (15. 2)Acid-related
Diseases- 3.2 8.4 5.2 161.0%
Rozerem (10. 7) Insomnia 6.0 6.6 7.4 0.8 12.4%
Adcetris (14. 4)Malignant
Lymphoma- 2.8 3.1 0.3 12.5%
* The figures include the amounts of fixed dose combinations.
◆ Consumer Healthcare: Major products' sales(Billions JPY)
FY13 FY14 FY15 vs PrYincrease/decrease
Alinamin tablet 19.6 20.7 25.2 4.6 22.1%
Alinamin drink 15.1 14.9 14.9 0.1 0.4%
Benza 10.4 9.7 9.8 0.2 1.7%
Biofermin 8.4 8.1 8.6 0.5 6.1%
Borraginol 4.4 4.1 4.5 0.4 8.9%
6
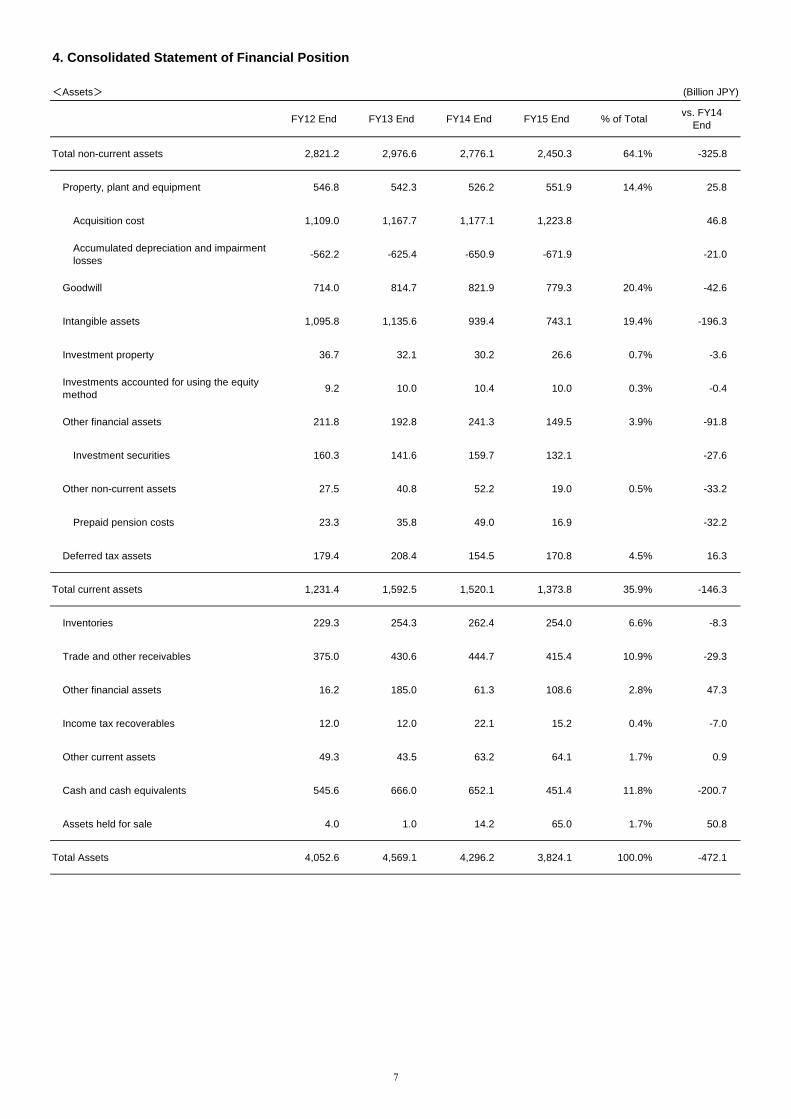
4. Consolidated Statement of Financial Position
<Assets> (Billion JPY)
FY12 End FY13 End FY14 End FY15 End % of Totalvs. FY14
End
Total non-current assets 2,821.2 2,976.6 2,776.1 2,450.3 64.1% -325.8
Property, plant and equipment 546.8 542.3 526.2 551.9 14.4% 25.8
Acquisition cost 1,109.0 1,167.7 1,177.1 1,223.8 46.8
Accumulated depreciation and impairmentlosses
-562.2 -625.4 -650.9 -671.9 -21.0
Goodwill 714.0 814.7 821.9 779.3 20.4% -42.6
Intangible assets 1,095.8 1,135.6 939.4 743.1 19.4% -196.3
Investment property 36.7 32.1 30.2 26.6 0.7% -3.6
Investments accounted for using the equitymethod
9.2 10.0 10.4 10.0 0.3% -0.4
Other financial assets 211.8 192.8 241.3 149.5 3.9% -91.8
Investment securities 160.3 141.6 159.7 132.1 -27.6
Other non-current assets 27.5 40.8 52.2 19.0 0.5% -33.2
Prepaid pension costs 23.3 35.8 49.0 16.9 -32.2
Deferred tax assets 179.4 208.4 154.5 170.8 4.5% 16.3
Total current assets 1,231.4 1,592.5 1,520.1 1,373.8 35.9% -146.3
Inventories 229.3 254.3 262.4 254.0 6.6% -8.3
Trade and other receivables 375.0 430.6 444.7 415.4 10.9% -29.3
Other financial assets 16.2 185.0 61.3 108.6 2.8% 47.3
Income tax recoverables 12.0 12.0 22.1 15.2 0.4% -7.0
Other current assets 49.3 43.5 63.2 64.1 1.7% 0.9
Cash and cash equivalents 545.6 666.0 652.1 451.4 11.8% -200.7
Assets held for sale 4.0 1.0 14.2 65.0 1.7% 50.8
Total Assets 4,052.6 4,569.1 4,296.2 3,824.1 100.0% -472.1
7
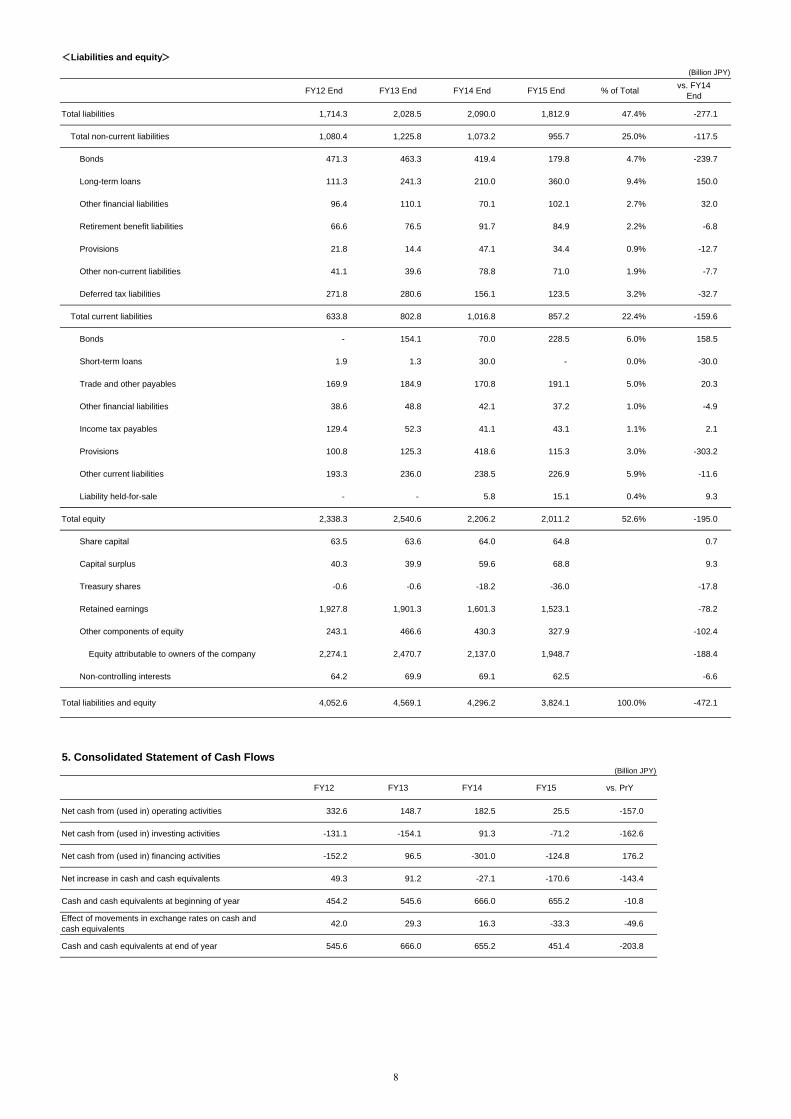
<Liabilities and equity>
(Billion JPY)
FY12 End FY13 End FY14 End FY15 End % of Totalvs. FY14
End
Total liabilities 1,714.3 2,028.5 2,090.0 1,812.9 47.4% -277.1
Total non-current liabilities 1,080.4 1,225.8 1,073.2 955.7 25.0% -117.5
Bonds 471.3 463.3 419.4 179.8 4.7% -239.7
Long-term loans 111.3 241.3 210.0 360.0 9.4% 150.0
Other financial liabilities 96.4 110.1 70.1 102.1 2.7% 32.0
Retirement benefit liabilities 66.6 76.5 91.7 84.9 2.2% -6.8
Provisions 21.8 14.4 47.1 34.4 0.9% -12.7
Other non-current liabilities 41.1 39.6 78.8 71.0 1.9% -7.7
Deferred tax liabilities 271.8 280.6 156.1 123.5 3.2% -32.7
Total current liabilities 633.8 802.8 1,016.8 857.2 22.4% -159.6
Bonds - 154.1 70.0 228.5 6.0% 158.5
Short-term loans 1.9 1.3 30.0 - 0.0% -30.0
Trade and other payables 169.9 184.9 170.8 191.1 5.0% 20.3
Other financial liabilities 38.6 48.8 42.1 37.2 1.0% -4.9
Income tax payables 129.4 52.3 41.1 43.1 1.1% 2.1
Provisions 100.8 125.3 418.6 115.3 3.0% -303.2
Other current liabilities 193.3 236.0 238.5 226.9 5.9% -11.6
Liability held-for-sale - - 5.8 15.1 0.4% 9.3
Total equity 2,338.3 2,540.6 2,206.2 2,011.2 52.6% -195.0
Share capital 63.5 63.6 64.0 64.8 0.7
Capital surplus 40.3 39.9 59.6 68.8 9.3
Treasury shares -0.6 -0.6 -18.2 -36.0 -17.8
Retained earnings 1,927.8 1,901.3 1,601.3 1,523.1 -78.2
Other components of equity 243.1 466.6 430.3 327.9 -102.4
Equity attributable to owners of the company 2,274.1 2,470.7 2,137.0 1,948.7 -188.4
Non-controlling interests 64.2 69.9 69.1 62.5 -6.6
Total liabilities and equity 4,052.6 4,569.1 4,296.2 3,824.1 100.0% -472.1
5. Consolidated Statement of Cash Flows(Billion JPY)
FY12 FY13 FY14 FY15 vs. PrY
Net cash from (used in) operating activities 332.6 148.7 182.5 25.5 -157.0
Net cash from (used in) investing activities -131.1 -154.1 91.3 -71.2 -162.6
Net cash from (used in) financing activities -152.2 96.5 -301.0 -124.8 176.2
Net increase in cash and cash equivalents 49.3 91.2 -27.1 -170.6 -143.4
Cash and cash equivalents at beginning of year 454.2 545.6 666.0 655.2 -10.8
Effect of movements in exchange rates on cash andcash equivalents
42.0 29.3 16.3 -33.3 -49.6
Cash and cash equivalents at end of year 545.6 666.0 655.2 451.4 -203.8
8

6. Segment Information
(Billions of Yen)
FY13 FY14 FY15 vs. FY14increase/decrease
FY16Forecasts
Revenue 1,691.7 1,777.8 1,807.4 29.6 1.7% 1,720.0
Ethical drugs 1,529.1 1,614.5 1,648.7 34.2 2.1%
Japan 582.1 561.3 541.7 -19.7 -3.5%
Overseas 947.0 1,053.2 1,107.0 53.8 5.1%
Consumer healthcare 72.9 73.6 80.1 6.5 8.9%
Others 89.8 89.7 78.6 -11.1 -12.4%
Operating Profit 139.3 -129.3 130.8 260.1 - 135.0
Ethical drugs 112.1 -178.9 102.8 281.7 -
<% of Ethical drugs revenue> <7.3%> <-11.1%> <6.2%> <17.3pt>
Consumer healthcare 16.4 17.2 18.9 1.7 10.0%
<% of Consumer healthcare revenue> <22.5%> <23.4%> <23.6%> <0.2pt>
Others 10.8 32.4 9.1 -23.4 -72.0%
<% of Others revenue> <12.0%> <36.2%> <11.5%> <-24.6pt>
7. Capital expenditure, depreciation and amortization and impairment losses
(Billions of Yen)
FY13 FY14 FY15 vs. FY14increase/decrease
FY16Forecasts
Capital expenditures 99.4 101.6 136.8 35.3 34.8% 175.0
Tangible assets* 43.9 53.7 94.0 40.3 75.2%
Intangible assets 55.5 47.9 42.8 -5.1 -10.5%
* Excluding increase due to acquisition.
Depreciation and amortization 187.3 191.6 181.2 -10.3 -5.4%
Depreciation of tangible assets* 59.3 58.7 53.4 -5.3 -9.0%
Amortization of intangible assets 127.9 132.9 127.8 -5.1 -3.8%
Amortization associated with products 120.1 123.2 118.7 -4.5 -3.6%
* Excluding depreciation for investment assets.
Impairment losses 27.5 68.4 15.2 -53.2 -77.8%
Impairment losses associated with products 23.1 53.2 6.4 -46.8 -88.0%
Amortization and impairment losseson intangible assets associated with products
143.2 176.4 * 125.1 -51.3 -29.1% * 140.0
* From fiscal 2016, amortization and impairment losses of R&D-related intangible assets, such as R&D pipeline assets and platformtechnology, will no longer be booked as "R&D expenses", and will be reclassified and reported under the planned new account name of"Amortization and impairment losses on intangible assets associated with products, R&D pipeline and platform technology" with a FY16forecast of 140 billion JPY. The reclassified amount in fiscal 2015 would have been 6.6 billion JPY, making the corresponding consolidatedamount to be 131.8 billion JPY.
9
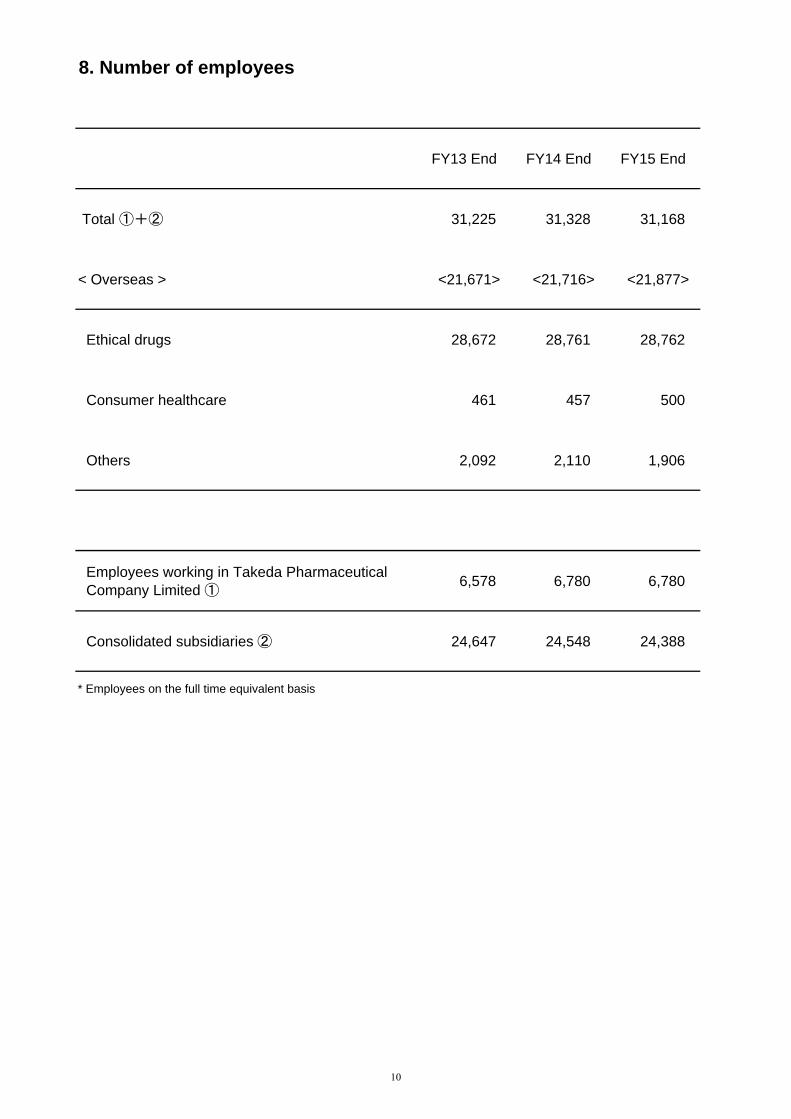
8. Number of employees
FY13 End FY14 End FY15 End
Total ①+② 31,225 31,328 31,168
< Overseas > <21,671> <21,716> <21,877>
Ethical drugs 28,672 28,761 28,762
Consumer healthcare 461 457 500
Others 2,092 2,110 1,906
Employees working in Takeda Pharmaceutical Company Limited ①
6,578 6,780 6,780
Consolidated subsidiaries ② 24,647 24,548 24,388
* Employees on the full time equivalent basis
10

9. Shareholders
【By ownership】
FY13 End FY14 End FY15 End vs. FY14 End
Japanese No. of shareholders 313 277 291 14 Institutional Investors No. of shares(1000) 235,353 235,524 252,537 17,013
% of shares outstanding 29.80 29.82 31.96 2.14 Japanese No. of shareholders 67 47 64 17 Securities Companies No. of shares(1000) 38,582 41,794 38,448 -3,346
% of shares outstanding 4.88 5.29 4.87 -0.43 Japanese No. of shareholders 1,890 1,567 1,515 -52 Business Corporations No. of shares(1000) 41,626 41,751 41,133 -619
% of shares outstanding 5.27 5.29 5.20 -0.08 Overseas No. of shareholders 883 891 876 -15 Institutional Investors No. of shares(1000) 223,377 255,976 248,822 -7,153 and Others % of shares outstanding 28.29 32.40 31.49 -0.91 Japanese No. of shareholders 305,206 266,344 262,674 -3,670 Individual Investors No. of shares(1000) 250,612 214,742 209,197 -5,545 and Others % of shares outstanding 31.74 27.18 26.47 -0.71 Takeda No. of shares(1000) 130 138 147 9
% of shares outstanding 0.02 0.02 0.02 0.00
【By number of shares held each】
FY13 End FY14 End FY15 End vs. FY14 End
5,000,000~ No. of shareholders 21 25 24 -1 No. of shares(1000) 267,568 311,874 333,589 21,716 % of shares outstanding 33.88 39.48 42.21 2.73
1,000,000~ No. of shareholders 91 82 79 -3 4,999,999 No. of shares(1000) 203,000 190,704 182,566 -8,139
% of shares outstanding 25.71 24.14 23.10 -1.04 100,000~ No. of shareholders 273 280 266 -14
999,999 No. of shares(1000) 85,950 88,306 79,611 -8,695 % of shares outstanding 10.88 11.18 10.07 -1.11
10,000~ No. of shareholders 2,472 2,126 2,091 -35 99,999 No. of shares(1000) 50,890 44,904 43,975 -929
% of shares outstanding 6.45 5.70 5.56 -0.14 1,000~ No. of shareholders 63,080 52,696 51,050 -1,646
9,999 No. of shares(1000) 126,265 106,438 103,367 -3,071 % of shares outstanding 15.99 13.48 13.08 -0.40
100~ No. of shareholders 232,953 205,140 203,532 -1,608 999 No. of shares(1000) 55,762 47,466 46,955 -511
% of shares outstanding 7.06 6.01 5.94 -0.07 Less than 99 No. of shareholders 9,470 8,778 8,379 -399
No. of shares(1000) 247 231 221 -10 % of shares outstanding 0.03 0.03 0.03 -0.00
No. of shareholders 308,360 269,127 265,421 -3,706 No. of shares(1000) 789,681 789,924 790,284 361
【10 largest shareholders】
No. of sharesheld (1,000)
% of sharesoutstanding
No. of sharesincrease/decrease
(1,000)
Previousranking
1 Nippon Life Insurance Company 50,760 6.42 - <1>
2 The Master Trust Bank of Japan, Ltd. (Trust account) 36,308 4.59 5,262 <2>
3 Japan Trustee Services Bank, Ltd. (Trust account) 33,223 4.20 6,641 <3>
4 30,670 3.88 11,329 <4>
5 Takeda Science Foundation 17,912 2.27 - <5>
6 15,000 1.90 - <6>
7 13,741 1.74 2,384 <8>
8 11,358 1.44 -2,023 <7>
9 10,903 1.38 2,462 <11>
10 10,044 1.27 -132 <9>
JP Morgan Chase Bank 380055
Barclays Securities Japan Limited
Japan Trustee Services Bank, Ltd. (Trust account 7)
Change from FY14 End
Shareholders
Total
STATE STREET BANK AND TRUST COMPANY 505225
JP Morgan Chase Bank 385147
State Street Bank West Client-Treaty 505234
FY15 End
11

10. Financial ratios
FY13 FY14 FY15
[Growth rates]
Revenue (%) 8.6 5.1 1.7
Operating profit (%) 114.3 - -
Net profit (%) * -28.2 - -
[Profitability ratios]
Gross profit margin (%) *** 71.0 70.3 70.4
Operating margin (%) 8.2 -7.3 7.2
Net margin (%) * 6.3 -8.2 4.4
Return on total assets (%) * 2.5 -3.3 2.0
Return on equity attributable to owners of the Company (ROE) (%)
4.5 -6.3 3.9
[Stability ratios] Ratio of equity attributable to owners of the Company to total assets (%)
54.1 49.7 51.0
Current ratio (%) 198.4 149.5 160.3
Non-current assets to long-term capital (%) * 80.5 86.5 84.4
[Efficiency ratios]
Asset turnover (times) 0.37 0.41 0.47
Fixed-asset turnover (times) 0.57 0.64 0.74
Notes and accounts receivable turnover (times) **
4.45 4.40 4.69
[Other ratios]
R&D expenses to revenue (%) 20.2 21.5 19.1
Equity attributable to owners of the Company per share (JPY)
3,130 2,719 2,487
Basic earnings per share (EPS) (JPY) * 135.10 -185.37 102.26
Growth Rate of EPS (%) -28.2 - -155.2
Payout ratio (%) 133.2 - 176.0
Dividend on equity attributable to owners of the Company (DOE) (%)
6.0 6.2 6.9
* Ratios are calculated based on amounts attributable to owners of the Company.
** "Notes and accounts receivable turnover" are after adjustment of outstanding balance at each fiscal year end and/or1st half of fiscal year if the ending day falls on weekend or holiday, and to be paid on the beginning day of the followingfiscal term.*** Because of starting the new organizational structure and changing managerial accounting method from FY15,allocation accounts for some expenses have changed. For the purpose to compare FY14 expenses with the FY15expenses under the same basis (underlying), amounts roughly estimated for this change are adjusted in FY14.
12
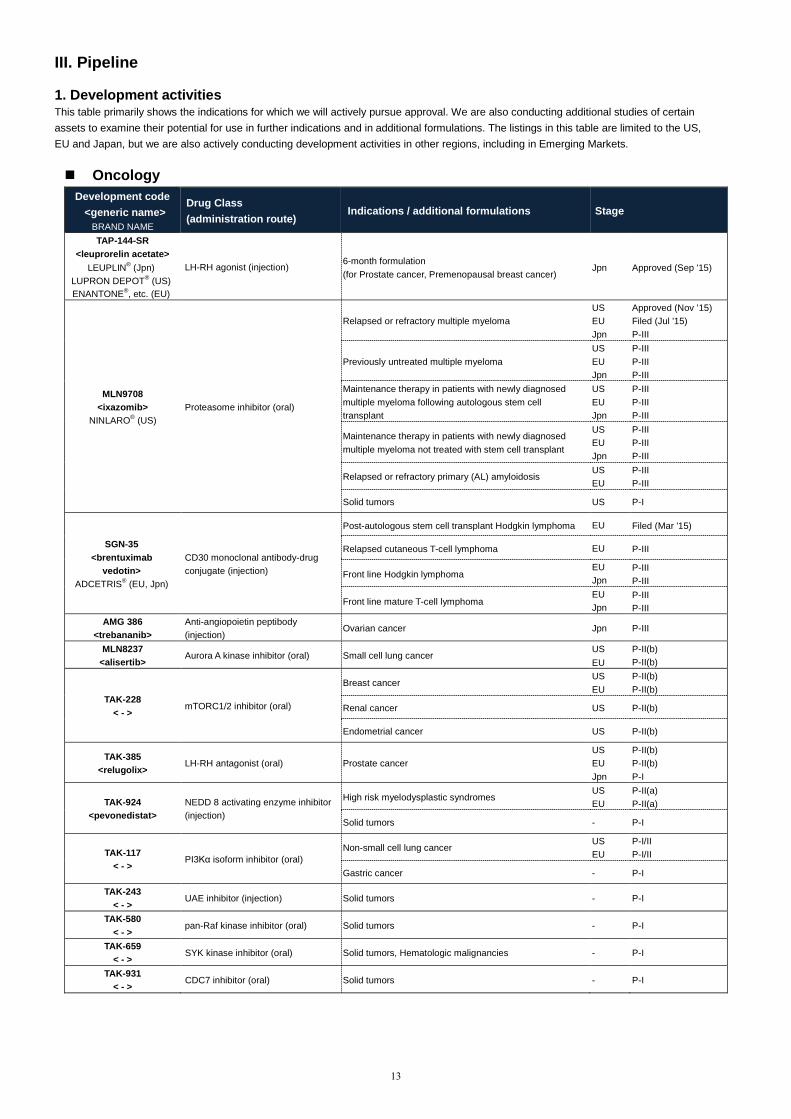
III. Pipeline
1. Development activitiesThis table primarily shows the indications for which we will actively pursue approval. We are also conducting additional studies of certain
assets to examine their potential for use in further indications and in additional formulations. The listings in this table are limited to the US,
EU and Japan, but we are also actively conducting development activities in other regions, including in Emerging Markets.
OncologyDevelopment code
<generic name> BRAND NAME
Drug Class
(administration route) Indications / additional formulations Stage
TAP-144-SR
<leuprorelin acetate>
LEUPLIN® (Jpn)
LUPRON DEPOT® (US)
ENANTONE®, etc. (EU)
LH-RH agonist (injection) 6-month formulation
(for Prostate cancer, Premenopausal breast cancer) Jpn Approved (Sep '15)
MLN9708
<ixazomib>
NINLARO® (US)
Proteasome inhibitor (oral)
Relapsed or refractory multiple myeloma
US
EU
Jpn
Approved (Nov ’15)
Filed (Jul '15)
P-III
Previously untreated multiple myeloma
US
EU
Jpn
P-III
P-III
P-III
Maintenance therapy in patients with newly diagnosed
multiple myeloma following autologous stem cell
transplant
US
EU
Jpn
P-III
P-III
P-III
Maintenance therapy in patients with newly diagnosed
multiple myeloma not treated with stem cell transplant
US
EU
Jpn
P-III
P-III
P-III
Relapsed or refractory primary (AL) amyloidosis US
EU
P-III
P-III
Solid tumors US P-I
SGN-35
<brentuximab
vedotin>
ADCETRIS® (EU, Jpn)
CD30 monoclonal antibody-drug
conjugate (injection)
Post-autologous stem cell transplant Hodgkin lymphoma EU Filed (Mar '15)
Relapsed cutaneous T-cell lymphoma EU P-III
Front line Hodgkin lymphoma EU
Jpn P-III
P-III
Front line mature T-cell lymphoma EU
Jpn P-III
P-III
AMG 386
<trebananib>
Anti-angiopoietin peptibody
(injection) Ovarian cancer Jpn P-III
MLN8237
<alisertib> Aurora A kinase inhibitor (oral) Small cell lung cancer
US
EU
P-II(b)
P-II(b)
TAK-228
< - > mTORC1/2 inhibitor (oral)
Breast cancer US
EU
P-II(b)
P-II(b)
Renal cancer US P-II(b)
Endometrial cancer US P-II(b)
TAK-385
<relugolix> LH-RH antagonist (oral) Prostate cancer
US
EU
Jpn
P-II(b)
P-II(b)
P-I
TAK-924
<pevonedistat>
NEDD 8 activating enzyme inhibitor
(injection)
High risk myelodysplastic syndromes US
EU
P-II(a)
P-II(a)
Solid tumors - P-I
TAK-117
< - > PI3Kα isoform inhibitor (oral)
Non-small cell lung cancer US
EU
P-I/II
P-I/II
Gastric cancer - P-I
TAK-243
< - > UAE inhibitor (injection) Solid tumors - P-I
TAK-580
< - > pan-Raf kinase inhibitor (oral) Solid tumors - P-I
TAK-659
< - > SYK kinase inhibitor (oral) Solid tumors, Hematologic malignancies - P-I
TAK-931
< - > CDC7 inhibitor (oral) Solid tumors - P-I
13

GastroenterologyDevelopment code
<generic name> BRAND NAME
Drug Class
(administration route) Indications / additional formulations Stage
TAK-390MR
<dexlansoprazole>
DEXILANT® (US, EU)
Proton pump inhibitor (oral)
Orally disintegrating tablet (for Acid-related diseases) US Approved (Jan '16)
Acid-related diseases in adolescents US
EU
Filed (Sep '15)
Filed (Sep '15)
MLN0002
<vedolizumab>
ENTYVIO® (US, EU)
Humanized monoclonal antibody
against α4β7 integrin (injection)
Ulcerative colitis Jpn P-III
Crohn's disease Jpn P-III
Subcutaneous fomulation
(for Ulcerative colitis, Crohn's disease)
US
EU
Jpn
P-III
P-III
P-III
<lubiprostone>
AMITIZA® (US) Chloride channel activator (oral)
New formulation US P-III
Pediatric functional constipation US P-III
TAK-828
< - > RORγt inverse agonist (oral) Crohn's disease - P-I
CNSDevelopment code
<generic name> BRAND NAME
Drug Class
(administration route) Indications / additional formulations Stage
<glatiramer acetate>
COPAXONE® (Jpn) Immunomodulator (injection) Relapse prevention of multiple sclerosis Jpn Approved (Sep '15)
Lu AA21004
<vortioxetine>
BRINTELLIX® (US)*1
Multimodal anti-depressant (oral)
Addition of clinical data to the product label regarding the
effect of vortioxetine on certain aspects of cognitive
function in adults with Major Depressive Disorder
US
FDA Complete
Response Letter
(Mar '16)
Major depressive disorder Jpn P-III
Attention Deficit Hyperactivity Disorder (ADHD) in adult
patients US P-II(a)
AD-4833/TOMM40 Insulin sensitizer (oral) /
Biomarker assay Delay of onset of mild cognitive impairment due to
Alzheimer's disease
US
EU P-III
P-III
TVP-1012*2
<rasagiline>
Monoamine oxidase B (MAO-B)
inhibitor (oral) Parkinson's disease Jpn P-III
TAK-063
< - > PDE10A inhibitor (oral) Schizophrenia US P-II(a)
TAK-058
< - > 5-HT3 receptor antagonist (oral)
Schizophrenia, especially cognitive impairment associated
with schizophrenia - P-I
TAK-653
< - > AMPA receptor potentiator (oral) Psychiatric disorders, Neurological diseases - P-I
TAK-831
< - >
D-amino acid oxidase (DAAO)
inhibitor (oral) Cerebellar ataxia, Negative symptoms and/or cognitive
impairment associated with schizophrenia - P-I
TAK-915
< - > PDE2A inhibitor (oral)
Negative symptoms and/or cognitive impairment
associated with schizophrenia - P-I
TAK-935
< - > CH24H inhibitor (oral) Epilepsy - P-I
*1 BRINTELLIX® will be marketed in the United States under the new name TRINTELLIX starting in June of 2016.
*2 Brand name in Teva territories: AZILECT®
14
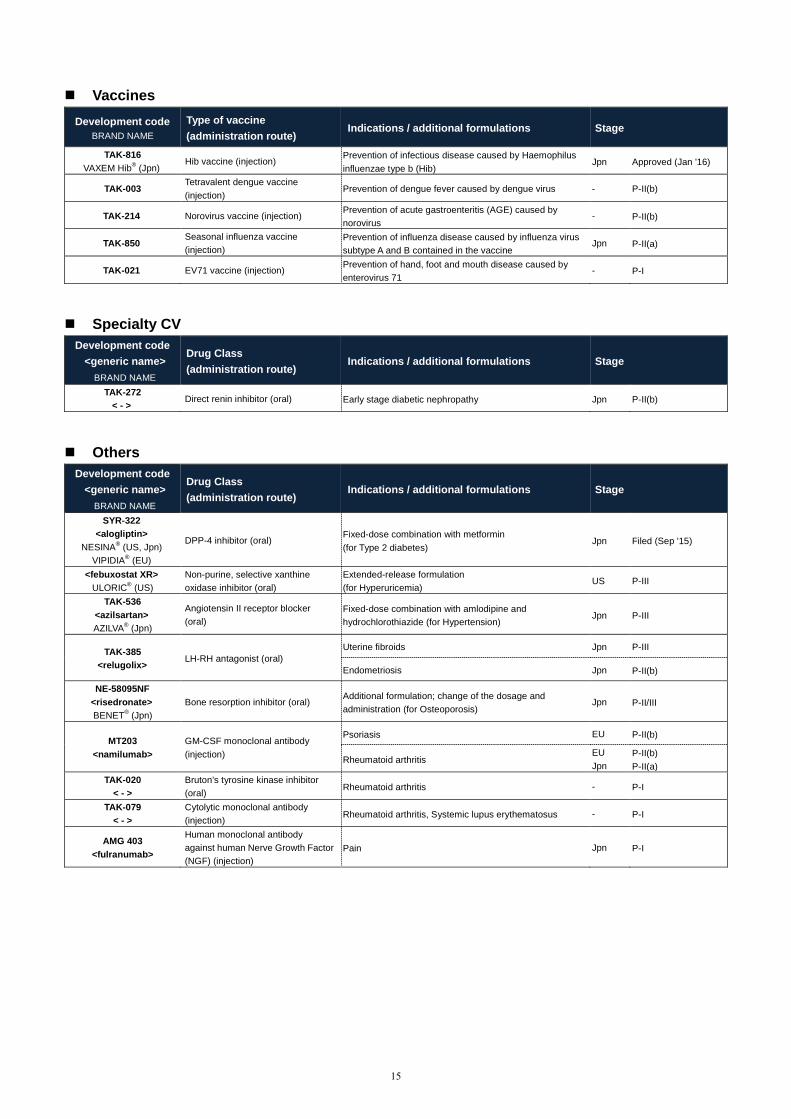
Vaccines
Development code BRAND NAME
Type of vaccine
(administration route) Indications / additional formulations Stage
TAK-816
VAXEM Hib® (Jpn) Hib vaccine (injection)
Prevention of infectious disease caused by Haemophilus
influenzae type b (Hib) Jpn Approved (Jan '16)
TAK-003 Tetravalent dengue vaccine
(injection) Prevention of dengue fever caused by dengue virus - P-II(b)
TAK-214 Norovirus vaccine (injection) Prevention of acute gastroenteritis (AGE) caused by
norovirus - P-II(b)
TAK-850 Seasonal influenza vaccine
(injection) Prevention of influenza disease caused by influenza virus
subtype A and B contained in the vaccine Jpn P-II(a)
TAK-021 EV71 vaccine (injection) Prevention of hand, foot and mouth disease caused by
enterovirus 71 - P-I
Specialty CVDevelopment code
<generic name>
BRAND NAME
Drug Class
(administration route) Indications / additional formulations Stage
TAK-272
< - > Direct renin inhibitor (oral) Early stage diabetic nephropathy Jpn P-II(b)
OthersDevelopment code
<generic name>
BRAND NAME
Drug Class
(administration route) Indications / additional formulations Stage
SYR-322
<alogliptin>
NESINA® (US, Jpn)
VIPIDIA® (EU)
DPP-4 inhibitor (oral) Fixed-dose combination with metformin
(for Type 2 diabetes) Jpn Filed (Sep '15)
<febuxostat XR>
ULORIC® (US)
Non-purine, selective xanthine
oxidase inhibitor (oral)
Extended-release formulation
(for Hyperuricemia) US P-III
TAK-536
<azilsartan>
AZILVA® (Jpn)
Angiotensin II receptor blocker
(oral) Fixed-dose combination with amlodipine and
hydrochlorothiazide (for Hypertension) Jpn P-III
TAK-385
<relugolix> LH-RH antagonist (oral)
Uterine fibroids Jpn P-III
Endometriosis Jpn P-II(b)
NE-58095NF
<risedronate>
BENET® (Jpn)
Bone resorption inhibitor (oral) Additional formulation; change of the dosage and
administration (for Osteoporosis) Jpn P-II/III
MT203
<namilumab>
GM-CSF monoclonal antibody
(injection)
Psoriasis EU P-II(b)
Rheumatoid arthritis EU
Jpn
P-II(b)
P-II(a)
TAK-020
< - >
Bruton’s tyrosine kinase inhibitor
(oral) Rheumatoid arthritis - P-I
TAK-079
< - >
Cytolytic monoclonal antibody
(injection) Rheumatoid arthritis, Systemic lupus erythematosus - P-I
AMG 403
<fulranumab>
Human monoclonal antibody
against human Nerve Growth Factor
(NGF) (injection) Pain Jpn P-I
15

Recent progress in stage [Progress in stage disclosed since release of FY2014 results (May 15th, 2015)]
Development code <generic name>
Indications / additional formulations Country/Region Progress in stage
<glatiramer acetate> Relapse prevention of multiple sclerosis Jpn Approved (Sep '15)
TAP-144-SR
<leuprorelin acetate> 6-month formulation (for Prostate cancer, Premenopausal breast cancer) Jpn Approved (Sep '15)
MLN9708
<ixazomib> Relapsed or refractory multiple myeloma US Approved (Nov '15)
TAK-390MR
<dexlansoprazole> Orally disintegrating tablet (for Acid-related diseases) US Approved (Jan '16)
TAK-816 Prevention of infectious disease caused by Haemophilus influenzae
type b (Hib) Jpn Approved (Jan '16)
MLN9708
<ixazomib> Relapsed or refractory multiple myeloma EU Filed (Jul '15)
TAK-390MR
<dexlansoprazole> Acid-related diseases in adolescents US, EU Filed (Sep '15)
SYR-322
<alogliptin> Fixed-dose combination with metformin (for Type 2 diabetes) Jpn Filed (Sep '15)
MLN0002
<vedolizumab> Subcutaneous fomulation (for Ulcerative colitis, Crohn's disease) US, EU, Jpn P-III
TAK-228
< - > Renal cancer US P-II(b)
TAK-228
< - > Endometrial cancer US P-II(b)
TAK-063
< - > Schizophrenia US P-II(a)
TAK-850 Prevention of influenza disease caused by influenza virus
subtype A and B contained in the vaccine Jpn P-II(a)
TAK-924
<pevonedistat> High risk myelodysplastic syndromes US, EU P-II(a)
MT203
<namilumab> Rheumatoid arthritis Jpn P-II(a)
TAK-117
< - > Non small cell lung cancer US, EU P-I/II
TAK-653
< - > Psychiatric disorders, Neurological diseases - P-I
TAK-831
< - >
Cerebellar ataxia, Negative symptoms and/or
cognitive impairment associated with schizophrenia - P-I
TAK-915
< - >
Negative symptoms and/or cognitive impairment associated with
schizophrenia - P-I
Lu AA21004
<vortioxetine>
Addition of clinical data to the product label regarding the effect of
vortioxetine on certain aspects of cognitive function in adults with Major
Depressive Disorder
US
FDA Complete
Response Letter
(Mar '16)
TAK-385
<relugolix> Uterine fibroids Jpn P-III
TAK-828
< - > Crohn's disease - P-I
TAK-931
< - > Solid tumors - P-I
Progress in stage disclosed since the announcement of FY2015 Q3 results (February 3rd, 2016) are listed under the bold dividing line
16

Discontinued projects [Discontinuation disclosed since release of FY2014 results (May 15th, 2015)]
Development code
<generic name> Indications (Stage) Reason
Lu AA21004
<vortioxetine> Generalized anxiety disorder (US P-III)
Discontinued due to re-evaluation of the lifecycle management development
program.
TAK-114
< - > Ulcerative colitis (US, EU P-II) Potential for a better product profile with a similar candidate compound.
TAK-264
< - > Gastric cancer, Pancreatic cancer (US, EU P-II) Development terminated due to lack of efficacy.
TAK-137
< - > Psychiatric disorders, Neurological diseases (P-I) Pharmacokinetic variability led to decrease in safety margin.
TAK-272
< - > Hypertension (P-I) Reconsideration of the development program for TAK-272.
TAK-733
< - > Solid tumors (P-I) Development terminated based on a strategic portfolio decision.
Lu AA24530
< - >
Major depressive disorder, Generalized anxiety
disorder (P-I)
Lu AA24530 was investigated for major depression but has not been in active
clinical development since 2009, and following the success of Brintellix
(vortioxetine), it has been decided to discontinue further development.
TAK-648
< - > Diabetic nephropathy (P-I) Development terminated based on a strategic portfolio decision.
Discontinued projects disclosed since the announcement of FY2015 Q3 results (February 3rd, 2016) are listed under the bold dividing line
Revised collaboration agreement [Revision disclosed since release of FY2014 results (May 15th, 2015)]
Development code
<generic name> Indications (Stage) Reason
TAK-233
< - > Women's health (P-I)
Takeda has granted an exclusive license to Outpost Medicine for the
worldwide development and commercialization rights to TAK-233. Although a
promising therapeutic, TAK-233 lay outside of Takeda’s core therapeutic
areas of focus, and therefore Takeda looked for an opportunity to out-license
the asset so it could continue to be studied and developed.
Clinical study protocol summariesAll clinical study protocol summaries are disclosed on the English-language web-site (http://www.takeda.com/c-t/) and all clinical study
protocol information in the Japanese-language is disclosed on the Japanese-language web-site (http://www.takeda.co.jp/c-t/).
We anticipate that this disclosure assure transparency of information on the clinical trials for the benefit of healthcare professionals, their
patients and other stakeholders, which we believe will contribute to the appropriate use of Takeda’s products worldwide.
17

2. Research Activities
Main joint research activities
Oncology Partner Country Research subject Schedule
Seattle Genetics US Antibody-Drug Conjugate technology Mar '09 -
Mersana Therapeutics US Antibody-Drug Conjugate technology Apr '14 -
ImmunoGen, Inc. US Antibody-Drug Conjugate technology Mar '15 -
National Cancer Center of Japan Japan
A partnership to develop basic research to clinical development by
promoting exchanges among researchers, physicians, and others
engaged in anti-cancer drug discovery and cancer biology
research
Apr '15 - Apr '18
Gastroenterology Partner Country Research subject Schedule
Cour Pharmaceutical Development
Company US
Immune modulating therapies for the potential treatment of celiac
disease and other gastrointestinal diseases, utilizing Cour’s
Tolerizing Immune Modifying nanoParticle (TIMP) platform
Dec '15 -
Enterome France
Microbiome targets thought to play crucial roles in gastrointestinal
disorders, including inflammatory bowel diseases (e.g. ulcerative
colitis) and motility disorders (e.g. irritable bowel syndrome).
Jan '16 -
enGene Canada Novel therapies for specialty gastrointestinal (GI) diseases using
enGene’s “Gene Pill” gene delivery platform Jan '16 -
CNS Partner Country Research subject Schedule
Zinfandel Pharmaceuticals US Alzheimer’s Disease Biomarker TOMM40 Dec '10 -
Kyoto University Japan Treatments for obesity and schizophrenia based on CNS control Jan '11 - Mar '16
NsGene US Encapsulated cell therapies for the potential treatment of
Parkinson’s disease Jan '16 -
Other / Multiple Therapeutic Area Partner Country Research subject Schedule
Tri-Institutional Therapeutics Discovery
Institute US
Collaboration of academic institutions and industry to more
effectively develop innovative treatments and therapies Oct '13 - Jun '17
Trianni, Inc. US
Trianni’s transgenic mouse platform to identify fully human
monoclonal antibodies against disease targets in all therapeutic
areas
Mar '14 -
MacroGenics US
Product candidates that will be directed against jointly selected
pairs of molecular targets and using MacroGenics’ Dual-Affinity
Re-Targeting (DART®) proprietary platform.
Sep '14 -
Keio University, Niigata University Japan
The search for and functional analysis of disease-related
RNA-binding proteins, that may lead to treatments in the areas
such as CNS and oncology.
Mar '15 - Mar '18
Center for iPS Cell Research Application
(CiRA), Kyoto University Japan
Clinical applications of iPS cells in areas such as heart failure,
diabetes mellitus, neuro-psychiatric disorders and cancer Apr '15 - Mar '25
Gencia LLC US
Mitochondrial Associated Glucocorticoid Receptors (MAGR)
agonists for potential use primarily in hematological and
inflammatory diseases
Aug '15 -
18


![SUMMARY OF FINANCIAL STATEMENTS [IFRS ...SUMMARY OF FINANCIAL STATEMENTS [IFRS] (CONSOLIDATED) Financial Results for the Fiscal Year Ended March 31, 2014 May 8, 2014 Takeda Pharmaceutical](https://img.dokumen.tips/doc/110x75/5ece4cbfb1af104f892b6602/summary-of-financial-statements-ifrs-summary-of-financial-statements-ifrs.jpg)