Embed Size (px)
Citation preview

BT Group plc
Registered Office: 81 Newgate Street London EC1A 7AJ Registered in England and Wales no. 4190816
www.btplc.com
BT Group Communications BT Centre 81 Newgate Street London EC1A 7AJ
Financial results
31 October 2013
BT GROUP PLC
RESULTS FOR THE SECOND QUARTER AND HALF YEAR TO 30 SEPTEMBER 2013
BT Group plc (BT.L) today announced its results for the second quarter and half year to 30 September 2013.
Second quarter to 30 September 2013
Half year to 30 September 2013
£m Change1 £m Change
1
Revenue2 4,491 0% 8,940 (1)%
Underlying revenue excluding transit
(0.5)% (0.8)%
EBITDA2 1,434 (4)% 2,874 (2)%
Profit before tax - adjusted2 609 2% 1,204 3%
- reported 499 (10)% 948 (13)%
Earnings per share - adjusted2 6.0p 2% 11.9p 3%
- reported 7.8p 16% 12.2p 1%
Interim dividend 3.4p 13%
Normalised free cash flow3
610 £294m 550 £358m
Net debt 8,074 £(963)m
Gavin Patterson, Chief Executive Officer, commenting on the results, said: “These are good results, with growth in earnings per share and free cash flow. “This has been our strongest ever quarter for fibre take-up with Openreach net connections up 70%. Our fibre network now passes more than 17 million premises. It is open to all and many other service providers have now got behind it. “BT Sport has made a confident start and is already delivering for viewers. More than two million of our customers are signed up to it and our wholesale contract with Virgin Media means it is available to around four million homes in total. It is also delivering for the business, helping us achieve a record 93% share
4 of broadband net adds in the
quarter, our lowest line losses for five years and 4% revenue growth in our BT Retail Consumer business. “BT Retail’s Business division again saw good growth in IT services while BT Global Services and BT Wholesale both generated strong order books. “I feel privileged to be the new CEO of BT and am determined to build on the strong foundations that are already in place. These are exciting times for the company and we are determined to deliver our strategy with energy and discipline.” Financial highlights for the second quarter:
Key revenue measure5 down 0.5% compared with a 5.5% decline in the prior year
EBITDA decline reflects the expected BT Sport investment
Efficiencies from cost transformation programmes running at a faster pace than in the first quarter
Profit before tax2 and earnings per share
2 up 2%
Interim dividend up 13% to 3.4p
Outlook reaffirmed
1 Results for the second quarter and half year to 30 September 2012 have been restated, see Note 1 to the condensed consolidated financial statements 2 Before specific items 3 Before specific items, purchases of telecommunications licences, pension deficit payments and the cash tax benefit of pension deficit payments 4 DSL and fibre, excluding cable 5 Underlying revenue excluding transit

2
RESULTS FOR THE SECOND QUARTER AND HALF YEAR TO 30 SEPTEMBER 2013
Group results
Second quarter to 30 September Half year to 30 September
2013 20121 Change 2013 2012
1 Change
£m £m % £m £m %
Revenue
- adjusted2 4,491 4,493 0 8,940 8,997 (1)
- reported (see Note below)
4,491 4,408 2 8,940 8,912 0
- underlying excluding transit (0.5) (0.8)
EBITDA
- adjusted2 1,434 1,488 (4) 2,874 2,940 (2)
- reported (see Note below) 1,382 1,353 2 2,738 2,803 (2)
Operating profit
- adjusted2 757 766 (1) 1,500 1,495 0
- reported 705 631 12 1,364 1,358 0
Profit before tax
- adjusted2 609 599 2 1,204 1,166 3
- reported 499 556 (10) 948 1,093 (13)
Earnings per share
- adjusted2 6.0p 5.9p 2 11.9p 11.5p 3
- reported 7.8p 6.7p 16 12.2p 12.1p 1
Interim dividend
3.4p 3.0p 13
Capital expenditure 595 596 0 1,191 1,218 (2)
Normalised free cash flow3
610 316 93 550 192 186
Net debt
8,074 9,037 (11)
Note: Reported revenue and EBITDA in the second quarter and half year to 30 September 2012 included a specific item charge of £85m and £58m, respectively, relating to the retrospective regulatory impact of the Court of Appeal decision on ladder pricing.
Line of business results2
Revenue
EBITDA
Free cash flow3
Second quarter to 2013 20121 Change 2013 2012
1 Change 2013 2012
1 Change
30 September £m £m % £m £m % £m £m %
BT Global Services 1,694 1,757 (4) 201 182 10 74 (119) n/m
BT Retail 1,843 1,808 2 429 495 (13) 254 334 (24)
BT Wholesale 624 616 1 159 143 11 154 63 144
Openreach 1,271 1,283 (1) 642 664 (3) 311 328 (5)
Other and intra-group items (941) (971) 3 3 4 (25) (183) (290) 37
Total 4,491 4,493 0 1,434 1,488 (4) 610 316 93
1 Restated, see Note 1 to the condensed consolidated financial statements 2 Before specific items which are defined below 3 Before specific items, purchases of telecommunications licences, pension deficit payments and the cash tax benefit of pension deficit payments n/m = not meaningful

3
Notes:
a. The commentary focuses on the trading results on an adjusted basis being before specific items. Unless otherwise stated, revenue, operating costs, earnings before interest, tax, depreciation and amortisation (EBITDA), operating profit, profit before tax, net finance expense, earnings per share (EPS) and normalised free cash flow are measured before specific items. This is consistent with the way that financial performance is measured by management and is reported to the Board and the Operating Committee and assists in providing a meaningful analysis of the trading results of the group. The directors believe that presentation of the group’s results in this way is relevant to the understanding of the group’s financial performance as specific items are those that in management’s judgement need to be disclosed by virtue of their size, nature or incidence. In determining whether an event or transaction is specific, management considers quantitative as well as qualitative factors such as the frequency or predictability of occurrence. Specific items may not be comparable to similarly titled measures used by other companies. Reported revenue, reported operating costs, reported EBITDA, reported operating profit, reported profit before tax, reported net finance expense, reported EPS and reported free cash flow are the equivalent unadjusted or statutory measures.
b. Underlying revenue, underlying costs and underlying EBITDA are measures which seek to reflect the underlying performance of the group that will
contribute to long-term profitable growth and as such exclude the impact of acquisitions and disposals, foreign exchange movements and any specific items. We focus on the trends in underlying revenue excluding transit revenue as transit traffic is low-margin and is significantly affected by reductions in mobile termination rates.
Enquiries Press office: Ross Cook Tel: 020 7356 5369 Investor relations: Damien Maltarp Tel: 020 7356 4909 The second quarter and half year 2013/14 results presentation for analysts and investors will be held in London at 9.00am today and a simultaneous webcast will be available at www.bt.com/results Results for the third quarter to 31 December 2013 are expected to be announced on Friday 31 January 2014. About BT BT is one of the world’s leading providers of communications services and solutions, serving customers in more than 170 countries. Its principal activities include the provision of networked IT services globally; local, national and international telecommunications services to its customers for use at home, at work and on the move; broadband and internet products and services and converged fixed/mobile products and services. BT consists principally of four lines of business: BT Global Services, BT Retail, BT Wholesale and Openreach. BT Retail is in the process of dividing into two separate lines of business, BT Consumer and BT Business. In the year ended 31 March 2013, BT Group’s reported revenue was £18,103m
1 with reported profit before taxation
of £2,315m1.
British Telecommunications plc (BT) is a wholly-owned subsidiary of BT Group plc and encompasses virtually all businesses and assets of the BT Group. BT Group plc is listed on stock exchanges in London and New York. For more information, visit www.btplc.com 1 Restated, see Note 1 to the condensed consolidated financial statements

4
BT Group plc GROUP RESULTS FOR THE SECOND QUARTER TO 30 SEPTEMBER 2013
Overview We have made further progress towards profitable revenue growth. Underlying revenue excluding transit was down only 0.5%, compared with a decline of 5.5% in the prior year, with the effect of regulation offsetting some strong performances within the business.
The rollout of our fibre broadband network continues at a strong pace. We have now passed more than 17m premises in the UK with more than 2m homes and businesses now using our fibre-based services. All of our major communications provider (CP) customers are actively marketing and selling fibre. This contributed to Openreach’s best ever quarter for fibre take-up with 316,000 net connections, an increase of 70%. We added 195,000 retail fibre broadband customers, up 24%, and our base now stands at around 1.7m. The UK broadband market
1 grew by
168,000 in the quarter, 12% more than the second quarter last year, of which our share was 156,000, up 92%.
We are making progress with extending the reach of fibre to rural areas. We have now won 44 regional contracts3,
supporting the government’s focus on regional fibre broadband, and are already rolling out fibre in 13 of these. This quarter we delivered the successful launch of BT Sport. It now has over 2m customers and we saw the benefit it is having on our broadband, TV and line customer numbers. Our line losses were the lowest for five years and our retail share of broadband market growth
1 was the highest on record, at 93%. The wholesale contract we agreed
with Virgin Media takes the reach of BT Sport to around 4m homes.
BT Global Services’ investments in the high-growth regions of the world continue to help offset revenue declines elsewhere. BT Business saw good growth in IT services and BT Wholesale’s performance was supported by our investments in IP Exchange. BT Global Services and BT Wholesale both generated strong order books.
We are focusing on improving our end-to-end processes – not only will this improve customer service but it will also generate efficiencies across the group. We achieved further savings in the quarter as we drive cost transformation across our business and implement our group-wide restructuring programme. Excluding our investment in BT Sport, our cost efficiency savings are running at a faster pace than in the first quarter.
Income statement Our key measure of the group’s revenue trend, underlying revenue excluding transit, was down 0.5% as the impact of regulatory price reductions was largely offset by a strong performance in BT Retail’s Consumer business. Adjusted revenue of £4,491m was flat with a £36m positive impact from foreign exchange movements and an £8m positive impact from acquisitions partly offset by a £24m reduction in transit revenue.
Operating costs2 were up 2%. Our underlying operating costs
2 excluding transit were up 1% as the efficiencies
from our cost transformation programmes were more than offset by our investment of around £140m in BT Sport and an £18m increase in the non-cash pensions operating charge. Excluding these, underlying operating costs
2
excluding transit were down 5%.
Net labour costs decreased by 2%. Payments to telecommunications operators were down 2% due to lower mobile termination rates. Property and energy costs were 3% lower partly reflecting the insourcing of our facilities management and our focus on energy efficiency which offset higher energy prices. Network operating and IT costs were 4% lower as we rationalise our networks and systems. Other operating costs increased by 13% principally due to BT Sport.
Adjusted EBITDA of £1,434m was down 4%. This included the impact of our investment in BT Sport, which was consistent with our indication last quarter. Excluding the impact of foreign exchange movements and acquisitions, underlying EBITDA was also down 4%.
Depreciation and amortisation of £677m was down 6% reflecting the more efficient delivery of our capital expenditure programmes over the last few years. Net finance expense was £148m, a decrease of 12% mainly due to lower net debt and a lower average interest rate.
Adjusted profit before tax of £609m was up 2% as the lower depreciation and amortisation and net finance expense more than offset the decline in EBITDA. Reported profit before tax (which includes specific items) was £499m, down 10%. The effective tax rate on profit before specific items was 22.3% (Q2 2012/13: 22.7%). 1 DSL and fibre, excluding cable 2 Before depreciation and amortisation 3 Includes Broadband Delivery UK programme, Cornwall and Northern Ireland

5
Adjusted EPS was 6.0p, up 2%, and reported EPS (which includes specific items) was 7.8p, up 16%. These are based on a weighted average number of shares in issue of 7,864m (Q2 2012/13: 7,839m). Specific items Specific items resulted in a net credit after tax of £140m (Q2 2012/13: £65m). Specific items included group-wide restructuring charges of £52m and net interest expense on pensions of £58m (Q2 2012/13: £29m). The UK Finance Act 2013 introduced further reductions in the UK corporation tax rate from 23% to 21% on 1 April 2014 and from 21% to 20% on 1 April 2015. As a result, a specific tax credit of £231m (Q2 2012/13: £76m) has been recognised for the re-measurement of deferred tax balances. Capital expenditure Capital expenditure was flat at £595m. Free cash flow Normalised free cash flow was an inflow of £610m, an increase of £294m compared with the prior year. This reflects improvements in working capital in BT Global Services and lower tax and VAT payments, partly offset by an instalment of around £120m for Premier League football broadcast rights and lower EBITDA. Specific items resulted in a net cash outflow of £72m (Q2 2012/13: £90m) and mainly comprised restructuring costs of £50m and property rationalisation costs of £18m. Reported free cash flow, which includes the cash tax benefit from pension deficit payments of £19m (Q2 2012/13: £162m) and is after specific items, was £557m (Q2 2012/13: £388m). Net debt and liquidity Net debt was £8,074m at 30 September 2013, £16m higher than at 30 June 2013 and £963m lower than the prior year. The movement in the quarter largely reflects the reported free cash inflow of £557m and an inflow of £42m from the exercise of employee share options, which were largely offset by dividend payments of £507m and an outflow of £77m for the purchase of 23m shares under our share buyback programme. At 30 September 2013 cash and current investment balances were £1.2bn and available facilities were £1.5bn providing us with a strong liquidity and funding position. During the second half of 2013/14 £0.3bn of term debt and £0.5bn of short-term borrowing is repayable. Pensions The IAS 19 net pension position at 30 September 2013 was a deficit of £5.4bn net of tax (£6.7bn gross of tax), compared with £4.0bn (£5.2bn gross of tax) at 30 June 2013. The higher deficit primarily reflects a reduction in the discount rate due to a tightening in corporate credit spreads, and an increase in future inflation expectations. The IAS 19 accounting position and key assumptions for the valuation are provided in Note 10. Regulation As expected, regulatory charge controls impacted revenue and EBITDA in the quarter. We estimate that the WLR, LLU and ISDN30 charge controls will have a negative impact of around £120m on group revenue and EBITDA in
the year and that the Leased Lines Charge Control will have an annual negative impact of around £50m£100m on group revenue and EBITDA this year and next. Ofcom published its final statement on its review of the wholesale narrowband market in September. On 1 January 2014 prices for fixed call termination will be significantly reduced with the effect partly offset by a higher fixed call origination price cap. Price controls will continue until 30 September 2016. Dividends In line with our full year outlook for 10%−15% growth in dividends per share, the Board has declared an interim dividend of 3.4p per share, up 13%, and totalling £268m (Q2 2012/13: £236m). It will be paid on 3 February 2014 to shareholders on the register on 27 December 2013. The ex-dividend date is 23 December 2013. The election date for participation in BT’s Dividend Investment Plan in respect of this dividend is 27 December 2013. The final dividend for the year to 31 March 2013 of 6.5p per share, amounting to £512m, was approved at the Annual General Meeting on 17 July 2013. Outlook Our outlook is unchanged. We continue to expect an improved trend in underlying revenue excluding transit in 2013/14 compared with 2012/13. We expect adjusted EBITDA to be £6.0bn−£6.1bn in 2013/14, £6.2bn−£6.3bn in 2014/15 and to grow further in 2015/16. We expect capital expenditure in 2013/14 and 2014/15 to be broadly level with 2012/13 and normalised free cash flow to be around £2.3bn in 2013/14, around £2.6bn in 2014/15 and to grow further in 2015/16.
6
GROUP RESULTS FOR THE HALF YEAR TO 30 SEPTEMBER 2013
Income statement Our key measure of the group’s revenue trend, underlying revenue excluding transit, was down 0.8% in the first half mainly reflecting the anticipated impact of regulatory price reductions. Adjusted revenue of £8,940m was down 1% with a £75m reduction in transit revenue, a £68m positive impact from foreign exchange movements and a £16m positive net impact from acquisitions and disposals. Underlying operating costs
1 excluding transit were flat as efficiencies from our cost transformation programmes
offset the investment in BT Sport and a £31m increase in the non-cash pensions operating charge. Operating costs
1 were also flat.
Net labour costs decreased by 3%. Payments to telecommunications operators were down 5% due to lower mobile termination rates. Property and energy costs were down 4% and network operating and IT costs were flat. Other operating costs increased by 10% principally due to BT Sport. Adjusted EBITDA, which includes the impact of our investment in BT Sport, was £2,874m, down 2%. Excluding foreign exchange movements and the net impact from acquisitions and disposals, underlying EBITDA was down 3%. Depreciation and amortisation of £1,374m was down 5% reflecting the more efficient delivery of our capital expenditure programmes over the last few years. Net finance expense was £294m, down 13% mainly due to lower net debt and a lower average interest rate. Adjusted profit before tax of £1,204m was up 3% as the lower depreciation and amortisation and net finance expense more than offset the decline in EBITDA. Reported profit before tax (which includes specific items) was £948m, down 13%.
The effective tax rate on profit before specific items was 22.5% (HY 2012/13: 22.7%).
Adjusted EPS was 11.9p, up 3%, and reported EPS (after specific items) was 12.2p, up 1%. These are based on a weighted average number of shares in issue of 7,852m (HY 2012/13: 7,813m). Specific items Specific items resulted in a net credit after tax of £26m (HY 2012/13: £42m). Specific items include group-wide restructuring charges of £136m and net interest expense on pensions of £117m (HY 2012/13: £57m). A specific tax credit of £231m (HY 2012/13: £76m) has also been recognised for the re-measurement of deferred tax balances. Capital expenditure Capital expenditure was £1,191m, down 2%. Free cash flow Normalised free cash flow was an inflow of £550m, an increase of £358m compared with the prior year. This reflects improvements in working capital in BT Global Services, lower tax and VAT payments and lower cash capital expenditure, partly offset by an instalment of around £120m for Premier League football broadcast rights and lower EBITDA. Specific items resulted in a net cash outflow of £206m (HY 2012/13: £123m) and mainly comprised restructuring costs of £156m and property rationalisation costs of £30m. Reported free cash flow, which includes the cash tax benefit from pension deficit payments of £39m (HY 2012/13: £324m), and is after specific items, was £383m (HY 2012/13: £393m). Related party transactions Transactions with related parties during the half year to 30 September 2013 are disclosed in Note 14.
Principal risks and uncertainties A summary of the group’s principal risks and uncertainties is provided in Note 15. 1 Before depreciation and amortisation

7
OPERATING REVIEW BT Global Services
Second quarter to 30 September Half year to 30 September
2013 20121 Change 2013 2012
1 Change
£m £m £m % £m £m £m %
Revenue 1,694 1,757 (63) (4) 3,390 3,488 (98) (3)
- underlying excluding transit (5) (4)
Operating costs 1,493 1,575 (82) (5) 3,007 3,135 (128) (4)
EBITDA 201 182 19 10 383 353 30 8
Depreciation & amortisation 150 152 (2) (1) 301 308 (7) (2)
Operating profit 51 30 21 70 82 45 37 82
Capital expenditure 120 125 (5) (4) 231 253 (22) (9)
Operating cash flow 74 (119) 193 n/m (206) (382) 176 46
1 Restated, see Note 1 to the condensed consolidated financial statements
n/m = not meaningful
Revenue Underlying revenue excluding transit decreased by 5%, partly reflecting the expected smaller benefit from contract milestones compared with the prior year. We expect this to reverse to give a larger year on year benefit in the third quarter. In the quarter, an increase in revenue in the high-growth regions of Asia Pacific, Latin America, Turkey, the Middle East and Africa was offset by declines elsewhere. Reported revenue was down 4% including a £9m decline in transit revenue and a £28m positive impact from foreign exchange movements. Total order intake in the quarter was £1.5bn, up 19%. We signed contracts throughout our key geographies, covering the main industry sectors and services from across our portfolio. In the consumer packaged goods sector, we signed a contract with Unilever for global network outsourcing, including a network providing voice, data, video and mobility services to the company’s 173,000 employees across nearly 100 countries. In the global banking and financial services sector, we will provide Visa Europe with a new access platform for its card authorisation, and clearing and settlement services. In the manufacturing sector, Fiat Spa and CNH Industrial renewed their global outsourcing contract. In the UK, Wipro Systems asked us to provide the wide area networking and voice services supporting its service delivery to a leading British utility company while ManpowerGroup contracted for global wide area networking services. Operating results Operating costs were down 5% but underlying operating costs excluding transit declined by 8% reflecting the reduction in revenue and the benefit of our cost transformation programmes. During the quarter we continued to make good progress on increasing the cost efficiency and reliability of our network. We completed the closure of our remaining legacy global data network, migrating the last customers to our strategic global network which provides improved reliability and service. We are enhancing our end-to-end service processes, back-office efficiency across Europe, and continuing to improve the way in which we procure access circuits and customer premises equipment. EBITDA increased by 10% mainly driven by our cost transformation initiatives. Depreciation and amortisation reduced by 1% and operating profit improved by £21m. Capital expenditure was down 4% contributing to EBITDA less capital expenditure increasing by £24m to £81m. Operating cash flow was an inflow of £74m. This was an improvement of £193m compared with the prior year which had been impacted by the timing of contract-related receipts and the delay in some debtor receipts.

8
BT Retail
Second quarter to 30 September Half year to 30 September
2013 20121 Change 2013 2012
1 Change
£m £m £m % £m £m £m %
Revenue 1,843 1,808 35 2 3,640 3,602 38 1
- underlying excluding transit 2 1
Operating costs 1,414 1,313 101 8 2,715 2,614 101 4
EBITDA 429 495 (66) (13) 925 988 (63) (6)
Depreciation & amortisation 106 126 (20) (16) 217 249 (32) (13)
Operating profit 323 369 (46) (12) 708 739 (31) (4)
Capital expenditure 91 105 (14) (13) 183 208 (25) (12)
Operating cash flow 254 334 (80) (24) 514 582 (68) (12)
1 Restated, see Note 1 to the condensed consolidated financial statements
Revenue Revenue and underlying revenue excluding transit were up 2%. Consumer
2 revenue increased by 4%, a significant improvement compared with the first quarter. The increase was
driven by 17% growth in broadband and TV revenue following the successful launch of BT Sport in August, and helped by a smaller decline in calls and lines revenue compared with previous quarters, down only 1%. We now have more than 2m BT Sport retail customers which include customers watching via satellite, BT TV, online or via the app. During the quarter we also signed a contract with Virgin Media which increases the reach of BT Sport to around 4m households. BT Sport had a positive impact on our line, broadband and TV customer numbers in the quarter. Consumer
2 line
losses of 65,000 were 64% better than last year and the lowest for five years. We added 156,000 retail broadband customers, representing 93% of the DSL and fibre broadband market net additions, taking our broadband customer base to around 7m. We added 195,000 retail fibre broadband customers and now have around 1.7m. We also added 70,000 TV customers taking the base to over 900,000
3. We now have 5.2m BT Wi-fi hot spots with usage
more than doubling to 6.6bn minutes in the quarter. We have strengthened our TV proposition to include Sky Movies and have launched new channel packs that allow customers to build a TV service tailored to their needs. The launch of our latest router, the slimline Hub 5, will offer our fibre customers market-leading wireless reliability using the latest technology. Business revenue was flat as 7% growth in IT services and 6% higher broadband revenue were offset by a 5% decline in calls and lines revenue. BT Enterprises underlying revenue decreased by 1%, the result of lower hardware sales in BT Conferencing. BT Ireland underlying revenue excluding transit increased by 2%, in line with the first quarter, reflecting growth in the business division. Operating results Operating costs increased by 8%. Excluding our investment in BT Sport of around £140m, they were down 3% reflecting the benefits of our cost transformation programmes. EBITDA was down £66m, or 13%. Depreciation and amortisation decreased by 16% due to lower capital expenditure in recent years, and operating profit was down 12%. Capital expenditure was down 13% reflecting the additional broadband-related investment in the prior year. Operating cash flow decreased by 24%, partly reflecting the first of two instalments of around £120m for this season’s Premier League football broadcast rights. 2 Includes customers in Northern Ireland 3 Only includes those BT Sport customers who watch the channels through BT TV

9
BT Wholesale
Second quarter to 30 September Half year to 30 September
2013 20121 Change 2013 2012
1 Change
£m £m £m % £m £m £m %
Revenue 624 616 8 1 1,262 1,294 (32) (2)
- underlying excluding transit 3 1
Operating costs 465 473 (8) (2) 946 988 (42) (4)
EBITDA 159 143 16 11 316 306 10 3
Depreciation & amortisation 62 62 0 0 126 126 0 0
Operating profit 97 81 16 20 190 180 10 6
Capital expenditure 63 57 6 11 127 129 (2) (2)
Operating cash flow 154 63 91 144 123 55 68 124
1 Restated, see Note 1 to the condensed consolidated financial statements
Revenue Underlying revenue excluding transit increased by 3%, or 1% excluding the impact of the Court of Appeal decision on ladder pricing in the second quarter of last year. The increase in revenue was primarily due to 18% growth in managed solutions revenue and 23% growth in IP services helped by IP Exchange voice minutes increasing by around 60%. These were largely offset by a 12% decline in broadband revenue, as lines continue to migrate to LLU, and a 15% decline, excluding ladder pricing, in traditional calls and lines revenue. Reported revenue increased by 1% despite a £9m decline in transit revenue from mobile termination rate reductions. Total order intake was £409m, up 33%. We signed a contract with EE for migration of its transit and terminating traffic onto IP Exchange, which will reduce its network costs and enable the provision of new services to its customers. We also signed contracts with: Spitfire, for exclusive supply of Ethernet services; Timico Technology Group, for the migration of IP voice traffic to IP Exchange and the management of their broadband and wholesale calls estate; and Nine Telecom, being a contract re-sign and expansion for increased volumes of wholesale calls. Operating results Operating costs excluding transit were flat, as lower labour and selling and general administration costs offset higher cost of sales. Reported operating costs decreased by 2%, reflecting lower transit revenue. EBITDA increased by 11%, or 3% excluding ladder pricing. With depreciation and amortisation being flat, operating profit increased by 20% or 5% excluding ladder pricing. Capital expenditure increased by 11% due to higher spend on the IP Exchange platform to increase its capacity to meet growing demand. Operating cash flow was an inflow of £154m due to the timing of customer receipts and lower VAT payments.
10
Openreach
Second quarter to 30 September Half year to 30 September
2013 20121 Change 2013 2012
1 Change
£m £m £m % £m £m £m %
Revenue 1,271 1,283 (12) (1) 2,516 2,553 (37) (1)
Operating costs 629 619 10 2 1,269 1,256 13 1
EBITDA 642 664 (22) (3) 1,247 1,297 (50) (4)
Depreciation & amortisation 355 357 (2) (1) 724 715 9 1
Operating profit 287 307 (20) (7) 523 582 (59) (10)
Capital expenditure 268 278 (10) (4) 548 564 (16) (3)
Operating cash flow 311 328 (17) (5) 580 617 (37) (6)
1 Restated, see Note 1 to the condensed consolidated financial statements
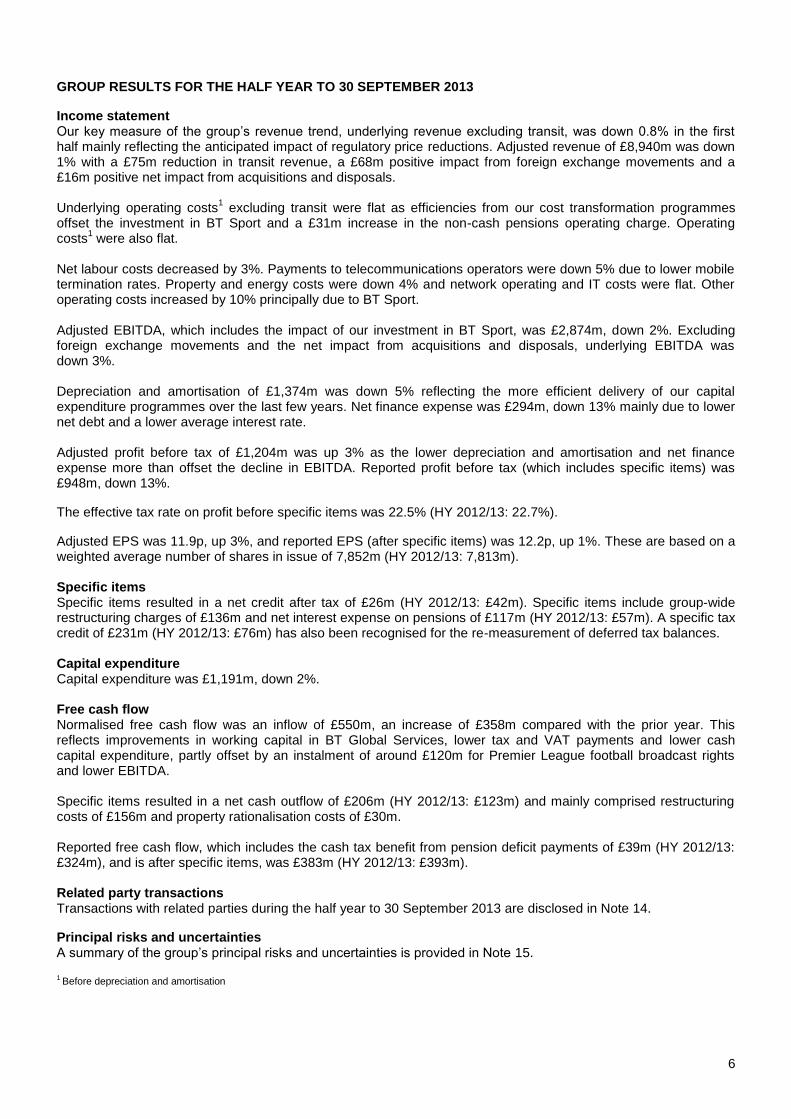
Revenue Revenue declined by 1% as regulatory price changes had a negative impact of around £70m, or the equivalent of around 5%. This was partly offset by growth in fibre broadband revenue, which again more than doubled, and a 3% increase in Ethernet revenue driven by higher volumes. We achieved 316,000 net fibre connections in the quarter, an increase of 70%, helping to bring the number of homes and businesses now connected to over 2m. All of our major CP customers are now engaged in marketing and selling fibre and the external net additions in the quarter have more than quadrupled.
We are making progress with extending the reach of fibre to rural areas. Overall, we have now won 44 regional contracts
2. We have commenced surveys and civil works in 22 of these and started rolling out fibre in a further 13
including Cornwall, North Yorkshire, Wales, Surrey and Rutland, passing more than 100,000 premises in the quarter. We have now passed more than 17m premises in total with our fibre broadband network. We have started field trials in Braintree and Barnet to see how effective vectoring
3 is at increasing speeds for more
customers across our fibre broadband network. The physical line base declined by 8,000 compared with a 38,000 decline last year. Over the past 12 months, our physical line base has increased by 140,000. Operating results Operating costs increased by 2% due to pay inflation and the additional engineering resource we have recruited to support fibre provision in rural areas. This contributed to EBITDA declining 3%. With depreciation and amortisation down 1%, operating profit was down 7%. Capital expenditure decreased by 4% reflecting £15m of grant income relating to our investment in the regional broadband programme. Operating cash flow decreased by 5%. 2 Includes Broadband Delivery UK programme, Cornwall and Northern Ireland 3 Vectoring reduces interference between signals in co-located copper wires, thereby improving end-user data speeds in fibre-to-the-cabinet networks

11
FINANCIAL STATEMENTS Group income statement For the second quarter to 30 September 2013
Before Specific
specific items items Total
Note £m £m £m
Revenue 2 4,491 - 4,491
Operating costs 3 (3,734) (52) (3,786)
Operating profit 757 (52) 705
Finance expense (149) (58) (207)
Finance income 1 - 1
Net finance expense (148) (58) (206)
Profit before tax 609 (110) 499
Tax (136) 250 114
Profit for the period 473 140 613
Earnings per share
- basic 9 6.0p
7.8p
- diluted 5.7p
7.4p
Group income statement For the second quarter to 30 September 2012
Before Specific
specific items items Total
Restated
1 Restated
1 Restated
1
Note £m £m £m
Revenue 2 4,493 (85) 4,408
Operating costs 3 (3,727) (50) (3,777)
Operating profit 766 (135) 631
Finance expense (174) (29) (203)
Finance income 5 - 5
Net finance expense (169) (29) (198) Share of post tax profits of associates and
joint ventures 2 - 2
Profit on disposal of interest in associate - 121 121
Profit before tax 599 (43) 556
Tax (136) 108 (28)
Profit for the period 463 65 528
Earnings per share - basic 9 5.9p
6.7p
- diluted 5.6p
6.4p
1 See Note 1 to the condensed consolidated financial statements

12
Group income statement For the half year to 30 September 2013
Before Specific
specific items items Total Note £m £m £m
Revenue 2 8,940 - 8,940
Operating costs 3 (7,440) (136) (7,576)
Operating profit 1,500 (136) 1,364
Finance expense (298) (117) (415)
Finance income 4 - 4
Net finance expense (294) (117) (411)
Share of post tax losses of associates and joint ventures (2) - (2)
Loss on disposal of interest in associate - (3) (3)
Profit before tax 1,204 (256) 948
Tax (271) 282 11
Profit for the period 933 26 959
Earnings per share - basic 9 11.9p
12.2p
- diluted 11.3p
11.6p
Group income statement For the half year to 30 September 2012
Before Specific
specific items items Total
Restated
1 Restated
1 Restated
1
Note £m £m £m
Revenue 2 8,997 (85) 8,912
Operating costs 3 (7,502) (52) (7,554)
Operating profit 1,495 (137) 1,358
Finance expense (346) (57) (403)
Finance income 8 - 8
Net finance expense (338) (57) (395)
Share of post tax profits of associates and joint ventures 9 - 9
Profit on disposal of interest in associate - 121 121
Profit before tax 1,166 (73) 1,093
Tax (265) 115 (150)
Profit for the period 901 42 943
Earnings per share - basic 9 11.5p
12.1p
- diluted 11.0p
11.5p
1 See Note 1 to the condensed consolidated financial statements

13
Group statement of comprehensive income For the second quarter and half year to 30 September
Second quarter to 30 September
Half year to 30 September
2013 2012 2013 2012
Restated
1
Restated
1
£m £m £m £m
Profit for the period 613 528 959 943
Other comprehensive income (loss)
Items that will not be reclassified to the income statement
Actuarial losses relating to retirement benefit obligations (1,383) (1,461) (597) (1,386)
Tax on actuarial losses 60 323
(121) 265
Items that may be reclassified subsequently to the income statement
Exchange differences on translation of foreign operations (107) (34) (120) (56)
Fair value movements on available-for-sale assets 11 30 7 30
Fair value movements on cash flow hedges:
- net fair value losses (413) (304) (390) (246)
- recognised in income and expense 286 157 249 187
Tax on components of other comprehensive income that may be reclassified (44) 33 (43) 11
Other comprehensive loss for the period, net of tax (1,590) (1,256) (1,015) (1,195)
Total comprehensive loss for the period (977) (728) (56) (252) 1 See Note 1 to the condensed consolidated financial statements
Group statement of changes in equity For the half year to 30 September 2013
Share capital Reserves Total equity
£m £m £m
At 1 April 2013 408 (670) (262)
Total comprehensive loss for the period - (56) (56)
Share-based payments - 4 4
Net issuance of own shares - (100) (100)
Dividends to shareholders - (512) (512)
At 30 September 2013 408 (1,334) (926)
For the half year to 30 September 2012
£m £m £m
At 1 April 2012 408 900 1,308
Total comprehensive loss for the period - (252) (252)
Share-based payments - 39 39
Net issuance of own shares - (69) (69)
Dividends to shareholders - (449) (449)
At 30 September 2012 408 169 577

14
Group cash flow statement For the second quarter and half year to 30 September
Second quarter to 30 September
Half year to 30 September
2013 2012 2013 2012
Restated
1 Restated
1
£m £m £m £m
Profit before tax 499 556 948 1,093
Depreciation and amortisation 677 722 1,374 1,445
Net finance expense 206 198 411 395
Profit on disposal of subsidiary - - - (7)
(Profit) loss on disposal of associate - (121) 3 (121)
Associates and joint ventures - (2) 2 (9)
Share-based payments 16 19 34 39
Increase in working capital (74) (247) (822) (855)
Provisions, pensions and other non-cash movements 10 29 43 61
Cash generated from operations 1,334 1,154 1,993 2,041
Tax paid (72) (19) (83) (28)
Net cash inflow from operating activities 1,262 1,135 1,910 2,013
Cash flow from investing activities
Interest received 2 3 3 5
Dividends received from associates - 1 - 1
Proceeds on disposal of property, plant and equipment 2 5 4 8
Acquisition of subsidiaries, net of cash acquired (16) (6) (18) (6)
Sale of subsidiaries, net of bank overdrafts - - - 17
Acquisition of joint ventures - (4) (2) (5)
Disposal of associates and joint ventures - 157 2 157
Purchases of property, plant and equipment and software (636) (624) (1,238) (1,288)
Sale of non-current asset investments - - - 1
Purchase of current financial assets (1,797) (2,144) (4,291) (4,707)
Sale of current financial assets 1,876 2,418 3,907 3,956
Net cash used in investing activities (569) (194) (1,633) (1,861)
Cash flow from financing activities
Interest paid (73) (132) (296) (347)
Equity dividends paid (507) (444) (508) (445)
New borrowings 7 1 400 796
Repayment of borrowings (2) (303) (3) (305)
Repayment of finance lease liabilities (11) (6) (11) (11)
Cash flows from derivatives related to net debt (84) (91) (180) -
Net proceeds on (repayment of) commercial paper - 6 (158) 219
Proceeds on issue of own shares 42 81 52 85
Repurchase of ordinary share capital (77) (72) (152) (154)
Net cash used in financing activities (705) (960) (856) (162)
Net decrease in cash and cash equivalents (12) (19) (579) (10)
Opening cash and cash equivalents 345 328 919 323
Net decrease in cash and cash equivalents (12) (19) (579) (10)
Effect of exchange rate changes (18) (3) (25) (7)
Closing cash and cash equivalents including overdrafts 315 306 315 306
Add back bank overdrafts 7 5 7 5
Closing cash and cash equivalents 322 311 322 311 1 See Note 1 to the condensed consolidated financial statements

15
Group balance sheet 30 September 30 September 31 March
2013 2012 2013
£m £m £m
Non-current assets
Intangible assets 3,167 2,977 3,258
Property, plant and equipment 13,984 14,235 14,153
Derivative financial instruments 609 937 1,080
Investments 69 181 64
Associates and joint ventures 23 30 28
Trade and other receivables 157 188 184
Deferred tax assets 1,387 911 1,438
19,396 19,459 20,205
Current assets
Programme rights 254 - -
Inventories 132 110 103
Trade and other receivables 3,095 3,193 2,877
Current tax receivables - - 16
Derivative financial instruments 74 82 170
Investments 916 1,265 531
Cash and cash equivalents 322 311 924
4,793 4,961 4,621
Current liabilities
Loans and other borrowings 2,437 2,700 1,736
Derivative financial instruments 158 125 74
Trade and other payables 5,137 4,956 5,521
Current tax liabilities 241 141 100
Provisions 99 263 120
8,072 8,185 7,551
Total assets less current liabilities 16,117 16,235 17,275
Non-current liabilities
Loans and other borrowings 7,264 8,291 8,277
Derivative financial instruments 650 948 802
Retirement benefit obligations 6,676 4,001 5,856
Other payables 896 863 883
Deferred tax liabilities 1,096 1,016 1,209
Provisions 461 539 510
17,043 15,658 17,537
Equity
Ordinary shares 408 408 408
(Deficit) reserves (1,334) 169 (670)
Total (deficit) equity (926) 577 (262)
16,117 16,235 17,275

16
NOTES TO THE CONDENSED CONSOLIDATED FINANCIAL STATEMENTS 1 Basis of preparation and accounting policies These condensed consolidated financial statements (‘the financial statements’) comprise the financial results of BT Group plc for the quarters and half years to 30 September 2013 and 2012 together with the audited balance sheet at 31 March 2013. The financial statements for the half year to 30 September 2013 have been reviewed by the auditors and their review opinion is on page 24. The financial statements have been prepared in accordance with the Disclosure and Transparency Rules (DTR) of the Financial Conduct Authority and with IAS 34 Interim Financial Reporting as adopted by the European Union. The financial statements should be read in conjunction with the annual financial statements for the year to 31 March 2013. After making enquiries, the directors have a reasonable expectation that the group has adequate resources to continue in operational existence for the foreseeable future. Accordingly, they continue to adopt the going concern basis in preparing the half year financial statements. Except as described below and other than income taxes which are accrued using the tax rate that is expected to be applicable for the full financial year, the financial statements have been prepared in accordance with the accounting policies as set out in the financial statements for the year to 31 March 2013 and have been prepared under the historical cost convention as modified by the revaluation of financial assets and liabilities (including derivative financial instruments) at fair value. These financial statements do not constitute statutory accounts within the meaning of Section 434 of the Companies Act 2006. Statutory accounts for the year to 31 March 2013 were approved by the Board of Directors on 9 May 2013, published on 23 May 2013 and delivered to the Registrar of Companies. The report of the auditors on those accounts was unqualified and did not contain any statement under Section 498 of the Companies Act 2006. The financial instrument disclosures newly required by IAS 34 are provided in Note 11. Changes in presentation and restatements Effective from 1 April 2013, we have made a number of changes that simplify our internal trading and more closely align our line of business financial results with our regulatory accounts. We have also adjusted the disclosure of our lines of business to reflect customer account moves and to better reflect their commercial activity. In order to present historical information on a consistent basis, we have revised comparative information for the year ended 31 March 2013 for a number of items that impact the financial results of individual lines of business, but have no impact on the total group results. To simplify our reporting, starting from 1 April 2013 we no longer separately report other operating income. We have re-presented items previously reported as other operating income, as either revenue or a reduction in operating costs, as appropriate. Other operating income before specific items was £392m in the year ended 31 March 2013 (Q2 2012/13: £86m, HY 2012/13: £174m). This change increases group revenue by £86m for the year ended 31 March 2013 (Q2 2012/13: £19m, HY 2012/13: £39m) and reduces operating costs by £306m (Q2 2012/13: £67m, HY 2012/13: £135m). There is no impact on the group’s EBITDA or profit before tax. Finally, IAS 19 Employee Benefits (Revised) came into effect from 1 April 2013 and we have restated comparative figures to reflect the position had it applied before this date. For the year ended 31 March 2013, this has increased operating costs by £38m (Q2 2012/13: £9m, HY 2012/13: £20m) and has reduced net finance income on pensions (treated as a specific item) by £148m (Q2 2012/13: £37m, HY 2012/13: £73m), resulting in an overall reduction of £38m in EBITDA (Q2 2012/13: £9m, HY 2012/13: £20m) and adjusted profit before tax. Reported profit before tax and reported profit after tax, which are after the impact of specific items, are reduced by £186m (Q2 2012/13: £46m, HY 2012/13: £93m) and £143m (Q2 2012/13: £37m, HY 2012/13: £73m), respectively. There is no impact on the group’s free cash flow.
More details are set out in our related press release published on 13 June 2013.

17
2 Operating results – by line of business1
External revenue
Internal revenue
Group revenue EBITDA
Operating profit (loss)
£m £m £m £m £m
Second quarter to 30 September 2013
BT Global Services 1,694 - 1,694 201 51
BT Retail 1,703 140 1,843 429 323
BT Wholesale 624 - 624 159 97
Openreach 455 816 1,271 642 287
Other and intra-group items2 15 (956) (941) 3 (1)
Total 4,491 - 4,491 1,434 757
Second quarter to 30 September 20123
BT Global Services 1,757 - 1,757 182 30
BT Retail 1,674 134 1,808 495 369
BT Wholesale 616 - 616 143 81
Openreach 433 850 1,283 664 307
Other and intra-group items2 13 (984) (971) 4 (21)
Total 4,493 - 4,493 1,488 766
Half year to 30 September 2013
BT Global Services 3,390 - 3,390 383 82
BT Retail 3,364 276 3,640 925 708
BT Wholesale 1,262 - 1,262 316 190
Openreach 894 1,622 2,516 1,247 523
Other and intra-group items2 30 (1,898) (1,868) 3 (3)
Total 8,940 - 8,940 2,874 1,500
Half year to 30 September 20123
BT Global Services 3,488 - 3,488 353 45
BT Retail 3,338 264 3,602 988 739
BT Wholesale 1,294 - 1,294 306 180
Openreach 848 1,705 2,553 1,297 582
Other and intra-group items2 29 (1,969) (1,940) (4) (51)
Total 8,997 - 8,997 2,940 1,495
1 Before specific items 2 Elimination of intra-group revenue, which is included in the total revenue of the originating business 3 Restated, see Note 1 to the condensed consolidated financial statements

18
3 Operating costs Second quarter
to 30 September Half year to 30 September
2013 2012 2013 2012
Restated
1
Restated
1
£m £m £m £m
Direct labour costs 1,173 1,182 2,354 2,375
Indirect labour costs 216 214 426 435
Leaver costs 4 16 10 39
Total labour costs 1,393 1,412 2,790 2,849
Capitalised labour (245) (243) (483) (480)
Net labour costs 1,148 1,169 2,307 2,369
Payments to telecommunications operators 639 653 1,285 1,350
Property and energy costs 251 259 497 520
Network operating and IT costs 149 156 313 312
Other costs 870 768 1,664 1,506
Operating costs before depreciation and specific items 3,057 3,005 6,066 6,057
Depreciation and amortisation 677 722 1,374 1,445
Total operating costs before specific items 3,734 3,727 7,440 7,502
Specific items (Note 4) 52 50 136 52
Total operating costs 3,786 3,777 7,576 7,554
4 Specific items The group separately identifies and discloses those items that in management’s judgement need to be disclosed by virtue of their size, nature or incidence (termed ‘specific items’). This is consistent with the way that financial performance is measured by management and assists in providing a meaningful analysis of the trading results of the group. Specific items may not be comparable to similarly titled measures used by other companies.
Second quarter to 30 September
Half year to 30 September
2013 2012 2013 2012
Restated
1
Restated
1
£m £m £m £m
Specific revenue
Retrospective regulatory rulings - 85 - 85
Specific operating costs
Profit on disposal of subsidiary - - - (7)
Retrospective regulatory rulings - (27) - (27)
Restructuring charges 52 17 136 25
Provision for claims - 43 - 43
Impairment charge - 17 - 18
Specific operating costs 52 50 136 52
EBITDA impact (Note 7) 52 135 136 137
Net interest expense on pensions 58 29 117 57
(Profit) loss on disposal of interest in associate - (121) 3 (121)
Net specific items charge before tax 110 43 256 73
Tax credit on specific items before tax (19) (32) (51) (39)
Tax credit on re-measurement of deferred tax (231) (76) (231) (76)
Net specific items credit after tax (140) (65) (26) (42) 1 See Note 1 to the condensed consolidated financial statements
19
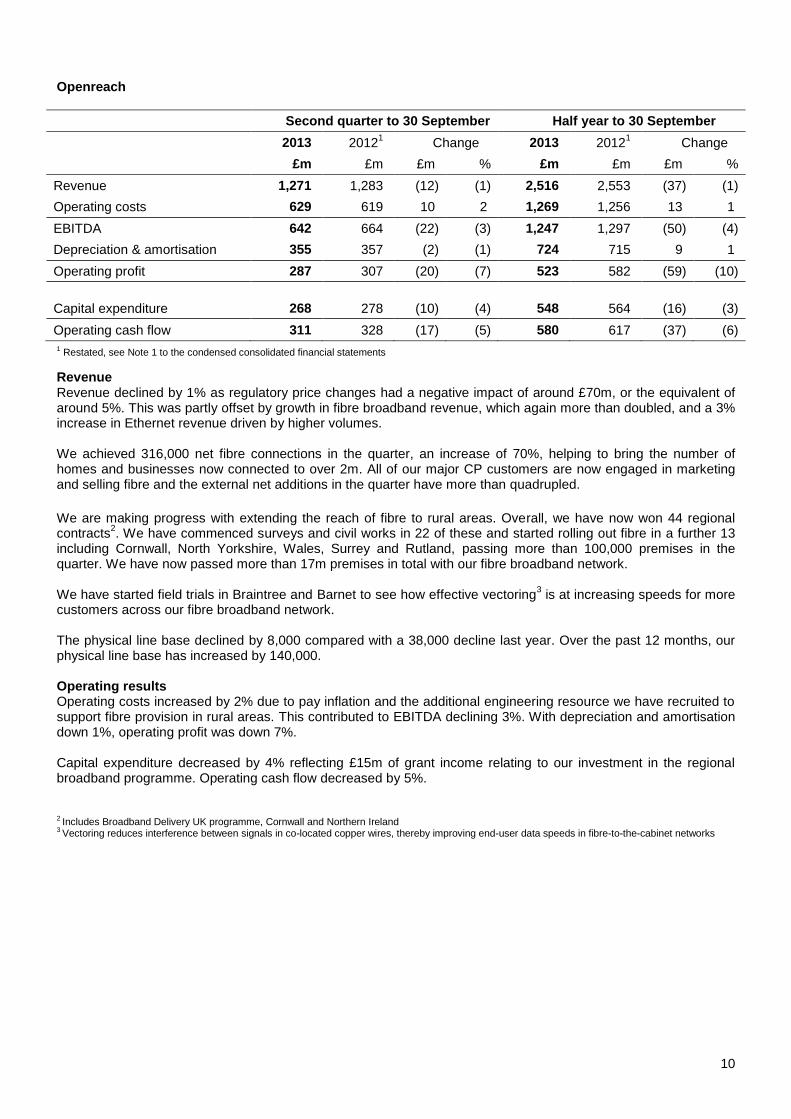
5 Free cash flow Free cash flow is not a measure defined under IFRS but is a key indicator used by management to assess operational performance.
Second quarter to 30 September
Half year to 30 September
2013 2012 2013 2012
£m £m £m £m
Cash generated from operations
1,334 1,154 1,993 2,041
Tax paid (72) (19) (83) (28)
Net cash inflow from operating activities
1,262 1,135
1,910 2,013
Included in cash flows from investing activities Net purchase of property, plant, equipment and
software (634) (619) (1,234) (1,280)
Dividends received from associates - 1 - 1
Interest received 2 3 3 5
Sale of non-current asset investments - - - 1
Included in cash flows from financing activities
Interest paid (73) (132) (296) (347)
Reported free cash flow 557 388
383 393
Net cash outflow from specific items 72 90
206 123
Cash tax benefit of pension deficit payments (19) (162) (39) (324)
Normalised free cash flow 610 316 550 192
6 Net debt Net debt is not a measure defined under IFRS but is a key indicator used by management to assess operational performance.
30 September 2013
30 September 2012
31 March 2013
£m £m £m
Loans and other borrowings1 9,701 10,991 10,013
Cash and cash equivalents (322) (311) (924)
Current investments (916) (1,265) (531)
8,463 9,415 8,558
Adjustments:
To re-translate currency denominated balances at
swapped rates where hedged (125) (34) (417)
To remove fair value adjustments and accrued interest applied to reflect the effective interest method (264) (344) (344)
Net debt 8,074 9,037 7,797
1 Includes overdrafts of £7m at 30 September 2013 (30 September 2012: £5m; 31 March 2013: £5m)

20
7 Reconciliation of earnings before interest, taxation, depreciation and amortisation Earnings before interest, taxation, depreciation and amortisation (EBITDA) is not a measure defined under IFRS, but is a key indicator used by management to assess operational performance. A reconciliation of reported profit before tax to adjusted EBITDA is provided below.
Second quarter to 30 September
Half year to 30 September
2013 2012 2013 2012
Restated
1
Restated
1
£m £m £m £m
Reported profit before tax 499 556 948 1,093 Share of post tax (profits) losses of
associates and joint ventures - (2) 2 (9) (Profit) loss on disposal of interest in
associate - (121) 3 (121)
Net finance expense 206 198 411 395
Operating profit 705 631 1,364 1,358
Depreciation and amortisation 677 722 1,374 1,445
Reported EBITDA 1,382 1,353 2,738 2,803
Specific items (Note 4) 52 135 136 137
Adjusted EBITDA 1,434 1,488 2,874 2,940
8 Reconciliation of adjusted profit before tax
Second quarter to 30 September
Half year to 30 September
2013 2012 2013 2012
Restated
1
Restated
1
£m £m £m £m
Reported profit before tax 499 556 948 1,093
Specific items (Note 4) 110 43 256 73
Adjusted profit before tax 609 599 1,204 1,166
9 Reconciliation of adjusted earnings per share
Second quarter to 30 September
Half year to 30 September
2013 2012 2013 2012
Restated
1
Restated
1
pence per share pence per share
Reported basic earnings per share 7.8 6.7 12.2 12.1
Per share impact of specific items (1.8) (0.8) (0.3) (0.6)
Adjusted earnings per share 6.0 5.9 11.9 11.5 1 See Note 1 to the condensed consolidated financial statements

21
10 Pensions
30 September 2013 30 June 2013
£bn £bn
IAS 19 liabilities - BTPS (45.8) (44.5) Assets - BTPS 39.3 39.5 Other schemes (0.2) (0.2)
IAS 19 deficit, gross of tax (6.7) (5.2)
IAS 19 deficit, net of tax (5.4) (4.0)
Discount rate (nominal) 4.30% 4.45% Discount rate (real) 1.07% 1.26% RPI inflation 3.20% 3.15%
CPI inflation 0.75% below RPI for three years and 1.20% below
RPI thereafter
0.75% below RPI for three years and 1.20% below
RPI thereafter
11 Financial instruments and risk management Fair value of financial assets and liabilities measured at amortised cost
At 30 September 2013, the fair value of loans and borrowings is £11,360m (31 March 2013: £12,014m) and the carrying value is £9,701m (31 March 2013: £10,013m).
The fair value of the following financial assets and liabilities approximate their carrying amount:
Cash and cash equivalents
Trade and other receivables
Trade and other payables
Provisions
Investments classified as loans and receivables
The group’s activities expose it to a variety of financial risks: market risk (including interest rate risk and foreign exchange risk); credit risk; and liquidity risk. There have been no changes in our risk management policy since 31 March 2013. The group’s hedging policies use derivative financial instruments to manage financial risk. Our hedging activity seeks to protect against changes in the fair value of fixed-rate long term financial instruments due to movements in market interest rates and to reduce the variability in future interest and currency cash flows on assets and liabilities which bear interest at variable rates and/or are in a foreign currency. Fair value estimation
Financial instruments measured at fair value consist of derivative financial instruments and investments classified as available-for-sale or designated at fair value through profit and loss. These instruments are further analysed by three levels of valuation methodology which are:
Level 1 – uses quoted prices in active markets for identical assets or liabilities
Level 2 – uses inputs for the asset or liability other than quoted prices, that are observable either directly or indirectly
Level 3 – uses inputs for the asset or liability that are not based on observable market data, such as internal models or other valuation methods.
The fair value of the group’s outstanding derivative financial assets and liabilities were estimated using discounted cash flow models and market rates of interest and foreign exchange at the balance sheet date.

22
30 September 2013
Level 1 £m
Level 2 £m
Level 3 £m
Total held at
fair value £m
Total held at amortised
cost £m
Total £m
Investments
Available-for-sale 52 915 8 975 - 975
Fair value through profit and loss 9 - - 9 - 9
Loans and receivables - - - - 1 1
Derivative assets
Designated in a hedge - 557 - 557 - 557
Fair value through profit and loss - 126 - 126 - 126
Total assets 61 1,598 8 1,667 1 1,668
Derivative liabilities
Designated in a hedge - 548 - 548 - 548
Fair value through profit and loss - 260 - 260 - 260
Total liabilities - 808 - 808 - 808
31 March 2013
Level 1 £m
Level 2 £m
Level 3 £m
Total held at
fair value £m
Total held at amortised
cost £m
Total £m
Investments
Available-for-sale 45 530 8 583 - 583
Fair value through profit and loss 11 - - 11 - 11
Loans and receivables - - - - 1 1
Derivative assets
Designated in a hedge - 1,041 - 1,041 - 1,041
Fair value through profit and loss - 209 - 209 - 209
Total assets 56 1,780 8 1,844 1 1,845
Derivative liabilities
Designated in a hedge - 550 - 550 - 550
Fair value through profit and loss - 326 - 326 - 326
Total liabilities - 876 - 876 - 876
No gains or losses have been recognised in the income statement in respect of Level 3 assets held at 30 September 2013. There were no changes to the valuation methods or transfers between levels 1, 2 and 3 during the half year.
12 Share capital
In the half year to 30 September 2013 91m shares (HY 2012/13: 164m) at a total cost of £248m (HY 2012/13: £454m), calculated at a weighted average cost per share, were issued or transferred from Own shares to satisfy obligations under all-employee and executive share plans. 13 Capital commitments
Capital expenditure for property, plant and equipment and software contracted for at the balance sheet date but not yet incurred was £406m (31 March 2013: £355m; 30 September 2012: £386m).

23
14 Related party transactions
Following the disposal of a 14.1% interest in Tech Mahindra Limited in the second quarter last year, the group does not have any significant associates or joint ventures for which related party disclosures are required. During the half year to 30 September 2012, the group purchased services in the normal course of business and on an arm’s length basis from its then associate, Tech Mahindra Limited. The value of services purchased was £99m.
15 Principal risks and uncertainties
We have processes for identifying, evaluating and managing our risks. Details of our principal risks and uncertainties can be found on pages 24 to 27 of the Annual Report & Form 20-F 2013 and are summarised below. All of them have the potential to have an adverse impact on our business, revenue, profits, assets, liquidity and capital resources.
The risks that could impact the security of our data or the continuity of our operations and services
The risks associated with complex and high value national and multinational customer contracts
The risks associated with a significant funding obligation in relation to our defined benefit pension scheme
The risks arising from operating in markets which are characterised by high levels of change and strong competition
The risks associated with some of our activities being subject to significant price and other regulatory controls
The risks associated with operating under a wide range of local and international anti-corruption and bribery laws, trade sanctions and import and export controls
The risk there could be a failure of any of our critical third-party suppliers to meet their obligations
There have been no significant changes to the principal risks and uncertainties in the half year to 30 September 2013, some or all of which have the potential to impact our results or financial position during the remaining six months of the financial year.
STATEMENT OF DIRECTORS’ RESPONSIBILITIES The directors confirm, to the best of their knowledge, that this condensed set of financial statements has been prepared in accordance with IAS 34 as adopted by the European Union and that the Interim Management Report includes a fair review of the information required by Rules 4.2.7 and 4.2.8 of the Disclosure and Transparency Rules of the United Kingdom’s Financial Conduct Authority. The names and functions of the BT Group plc board can be found at: http://www.btplc.com/thegroup/ourcompany/theboard/ourboard/index.htm
By order of the Board
Gavin Patterson Tony Chanmugam Chief Executive Officer Group Finance Director 30 October 2013

24
Independent review report to BT Group plc on the half year interim financial information
Introduction We have been engaged by the company to review the condensed set of financial statements in the half year financial report for the six months ended 30 September 2013, which comprises the Group income statement, the Group statement of comprehensive income, the Group statement of changes in equity, the Group cash flow statement, the Group balance sheet and related notes. We have read the other information contained in the half year financial report and considered whether it contains any apparent misstatements or material inconsistencies with the information in the condensed set of financial statements. Directors’ responsibilities The half year financial report is the responsibility of, and has been approved by, the directors. The directors are responsible for preparing the half year financial report in accordance with the Disclosure and Transparency Rules of the United Kingdom's Financial Conduct Authority. As disclosed in Note 1, the annual financial statements of the group are prepared in accordance with IFRSs as adopted by the European Union. The condensed set of financial statements included in this half year financial report has been prepared in accordance with International Accounting Standard 34, ‛Interim Financial Reporting’, as adopted by the European Union. Our responsibility Our responsibility is to express to the company a conclusion on the condensed set of financial statements in the half year financial report based on our review. This report, including the conclusion, has been prepared for and only for the company for the purpose of the Disclosure and Transparency Rules of the Financial Conduct Authority and for no other purpose. We do not, in producing this report, accept or assume responsibility for any other purpose or to any other person to whom this report is shown or into whose hands it may come save where expressly agreed by our prior consent in writing. Scope of review We conducted our review in accordance with International Standard on Review Engagements (UK and Ireland) 2410, ‘Review of Interim Financial Information Performed by the Independent Auditor of the Entity’ issued by the Auditing Practices Board for use in the United Kingdom. A review of interim financial information consists of making enquiries, primarily of persons responsible for financial and accounting matters, and applying analytical and other review procedures. A review is substantially less in scope than an audit conducted in accordance with International Standards on Auditing (UK and Ireland) and consequently does not enable us to obtain assurance that we would become aware of all significant matters that might be identified in an audit. Accordingly, we do not express an audit opinion. Conclusion Based on our review, nothing has come to our attention that causes us to believe that the condensed set of financial statements in the half year financial report for the six months ended 30 September 2013 is not prepared, in all material respects, in accordance with International Accounting Standard 34 as adopted by the European Union and the Disclosure and Transparency Rules of the United Kingdom's Financial Conduct Authority. PricewaterhouseCoopers LLP Chartered Accountants London 30 October 2013 Notes: The maintenance and integrity of the group’s website is the responsibility of the directors; the work carried out by the audi tors does not involve consideration of these matters and, accordingly, the auditors accept no responsibility for any changes that may have occurred to the financial statements since they were initially presented on the website. Legislation in the United Kingdom governing the preparation and dissemination of financial statements may differ from legislation in other jurisdictions.

25
Forward-looking statements – caution advised Certain statements in this results release are forward-looking and are made in reliance on the safe harbour provisions of the US Private Securities Litigation Reform Act of 1995. These statements include, without limitation, those concerning: current and future years’ outlook, including revenue trends, EBITDA, capital expenditure and normalised free cash flow; BT Sport; our fibre broadband roll-out programme and progress with our rural network; the impact of regulation; continuing cost transformation; progressive dividends; and liquidity and funding. Although BT believes that the expectations reflected in these forward-looking statements are reasonable, it can give no assurance that these expectations will prove to have been correct. Because these statements involve risks and uncertainties, actual results may differ materially from those expressed or implied by these forward-looking statements. Factors that could cause differences between actual results and those implied by the forward-looking statements include, but are not limited to: material adverse changes in economic conditions in the markets served by BT; future regulatory actions, decisions and conditions or requirements in BT’s operating areas, including competition from others; selection by BT and its lines of business of the appropriate trading and marketing models for its products and services; fluctuations in foreign currency exchange rates and interest rates; technological innovations, including the cost of developing new products, networks and solutions and the need to increase expenditures for improving the quality of service; prolonged adverse weather conditions resulting in a material increase in overtime, staff or other costs, or impact on customer service; developments in the convergence of technologies; the anticipated benefits and advantages of new technologies, products and services, not being realised; the timing of entry and profitability of BT in certain communications markets; significant changes in market shares for BT and its principal products and services; the underlying assumptions and estimates made in respect of major customer contracts proving unreliable; the aims of the group-wide restructuring programme not being achieved; and general financial market conditions affecting BT’s performance and ability to raise finance. BT undertakes no obligation to update any forward-looking statements whether as a result of new information, future events or otherwise.