Embed Size (px)
Citation preview
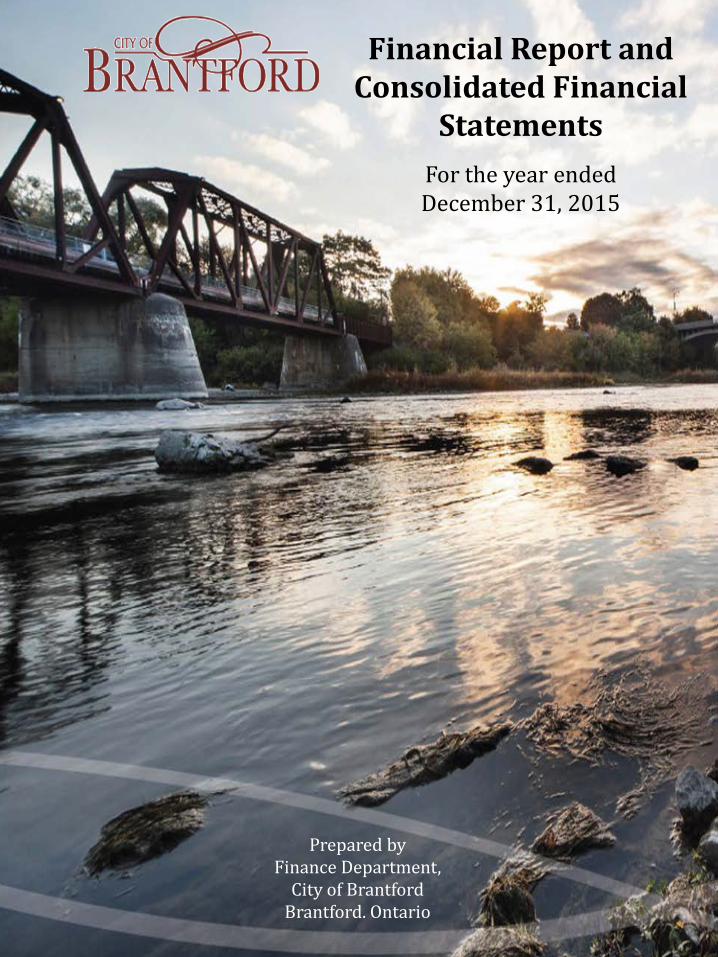
Financial Report and Consolidated Financial
Statements
For the year ended December 31, 2015
Prepared by Finance Department,
City of Brantford Brantford. Ontario

Financial Report and Consolidated Financial Statements
For the Year Ended December 31, 2015
The Corporation of the City of Brantford
Brantford, Ontario, Canada
Prepared by Finance Department,
City of Brantford

INTRODUCTORY SECTION GFOA Award 5
Welcome to Brantford 6
Brantford City Council 7
Corporate Organizational Chart 8
Message from the City Treasurer, Director of Finance 9
FINANCIAL SECTION CITY OF BRANTFORD CONSOLIDATED FINANCIAL STATEMENTS
Management Report 28
Independent Auditors’ Report 29
Consolidated Statement of Financial Position 30
Consolidated Statement of Operations 31
Consolidated Statement of Changes in Net Financial Assets 32
Consolidated Statement of Cash Flows 33
Notes to the Consolidated Financial Statements 34
Schedule of Tangible Capital Assets 56
Schedule of Segmented Information 57 CITY OF BRANTFORD TRUST FUNDS FINANCIAL STATEMENTS 60
BRANTFORD PUBLIC LIBRARY FINANCIAL STATEMENTS 66
BRANTFORD MUNICIPAL NON-PROFIT HOUSING CORPORATION FINANCIAL STATEMENTS 81
JOHN NOBLE HOME FINANCIAL STATEMENTS 94
BRANT COUNTY HEALTH UNIT FINANCIAL STATEMENTS 107
BRANTFORD DOWNTOWN BUSINESS IMPROVEMENT AREA FINANCIAL STATEMENTS 133
STATISTICAL SECTION Five-Year Financial Review 141
FINANCIAL INFORMATION RETURN 2015 Financial Information Return 149
CONTENTS Page

INTRODUCTION

Page 5

• Police • Fire & Rescue • Affordable Housing • Ontario Works • Child Care
The City of Brantford is a community of over 97,000 residents located in the heart of southern Ontario situated along the picturesque Grand River. With direct access to Highway 403 and close proximity to several major highways, rail lines and three major ports of entry, Brantford is a destination of choice for new residents, businesses and visitors alike. With our diverse manufacturing sector and continually growing post-secondary presence, Brantford is transforming to meet the challenges of a new economy. Offering metropolitan amenities with a charming small town feel, Brantford is a lively community with historic neighbourhoods and a rich industrial legacy.
Location
Strategically centred in the largest industrial corridor of the free world, and ideally situated 55 miles southwest of Toronto and less than 90 minutes from Buffalo, N.Y., Brantford offers manufacturers, distributors and service companies the best of both worlds. Brantford is directly connected to the Trans-Canada Highway #401 immediately to the west, and the Queen Elizabeth Way to the East by Highway 403.
• Population: 97,862
Employment Brantford has a local workforce of over 74,000 and over 800,000 within a 30-minute commuter shed. Brantford’s top private sector business employers include:
• Ferrero Canada Ltd. • OLG Brantford Casino • S.C Johnson and Son Ltd. • NCO Financial Services • ConAgra Foods
Higher Education The City of Brantford is proud to be home to four post-secondary institutions.
• Laurier Brantford • Conestoga College • Nipissing University • McMaster University
Population
Essential Services • Water & Waste Water • Waste Management • Transportation
Services • Public Transit
WELCOME TO BRANTFORD
Page 6
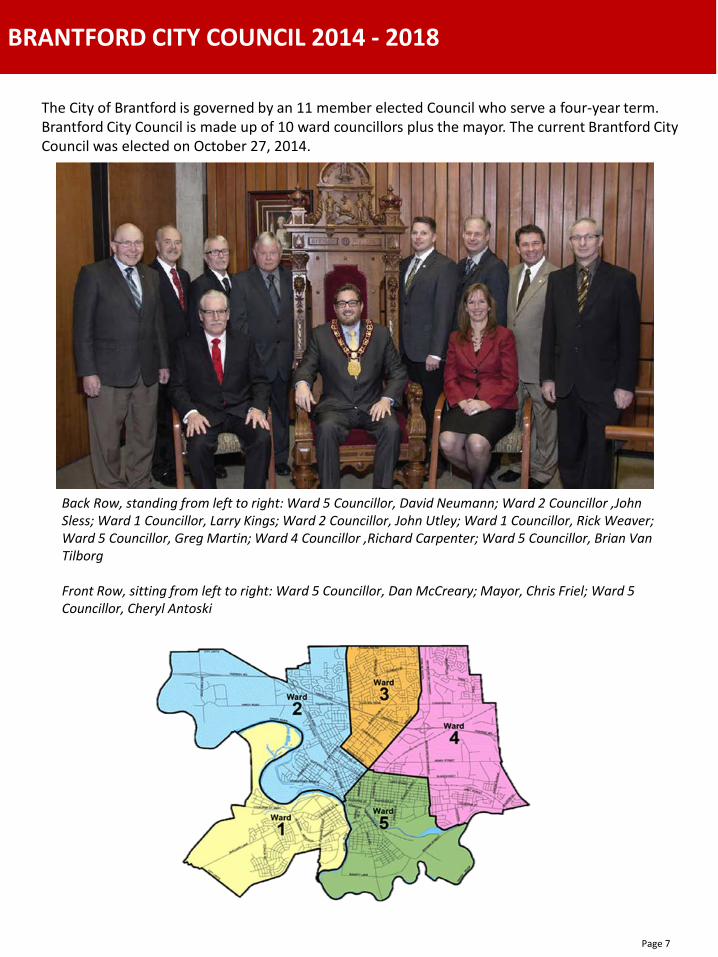
The City of Brantford is governed by an 11 member elected Council who serve a four-year term. Brantford City Council is made up of 10 ward councillors plus the mayor. The current Brantford City Council was elected on October 27, 2014.
Back Row, standing from left to right: Ward 5 Councillor, David Neumann; Ward 2 Councillor ,John Sless; Ward 1 Councillor, Larry Kings; Ward 2 Councillor, John Utley; Ward 1 Councillor, Rick Weaver; Ward 5 Councillor, Greg Martin; Ward 4 Councillor ,Richard Carpenter; Ward 5 Councillor, Brian Van Tilborg Front Row, sitting from left to right: Ward 5 Councillor, Dan McCreary; Mayor, Chris Friel; Ward 5 Councillor, Cheryl Antoski
BRANTFORD CITY COUNCIL 2014 - 2018
Page 7
CORPORATE ORGANIZATIONAL CHART
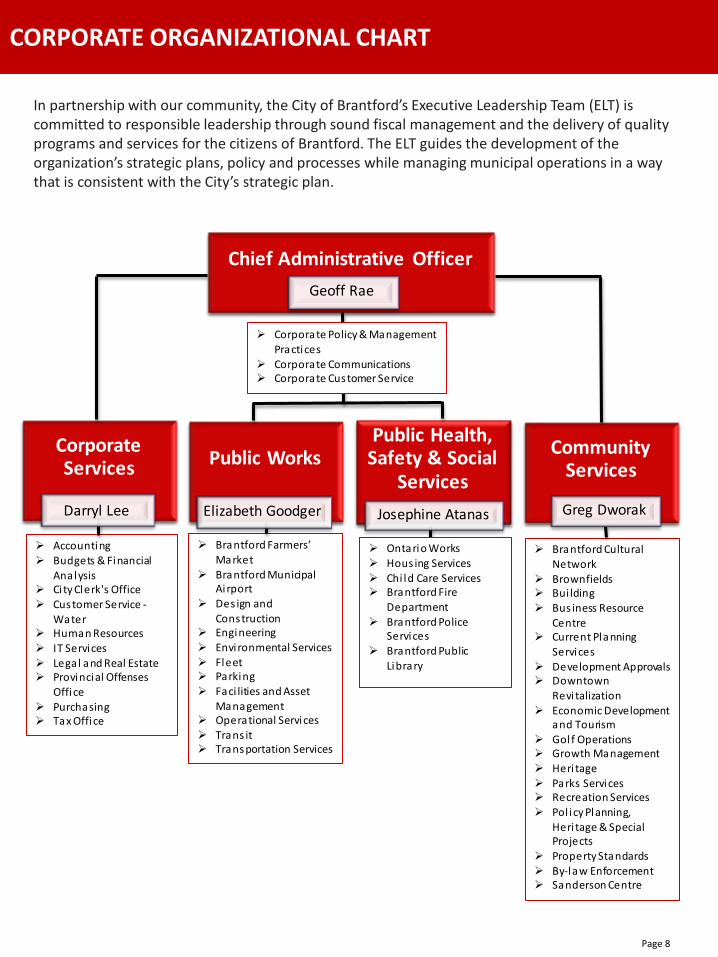
In partnership with our community, the City of Brantford’s Executive Leadership Team (ELT) is committed to responsible leadership through sound fiscal management and the delivery of quality programs and services for the citizens of Brantford. The ELT guides the development of the organization’s strategic plans, policy and processes while managing municipal operations in a way that is consistent with the City’s strategic plan.
Public Works Community Services
Chief Administrative Officer
Corporate Services
Geoff Rae
Public Health, Safety & Social
Services
Corporate Policy & Management Practices
Corporate Communications Corporate Customer Service
Accounting Budgets & Financial
Analysis City Clerk's Office Customer Service -
Water Human Resources IT Services Legal and Real Estate Provincial Offenses
Office Purchasing Tax Office
Brantford Cultural Network
Brownfields Bui lding Bus iness Resource
Centre Current Planning
Services Development Approvals Downtown
Revi talization Economic Development
and Tourism Golf Operations Growth Management Heri tage Parks Services Recreation Services Pol icy Planning,
Heri tage & Special Projects
Property Standards By-law Enforcement Sanderson Centre
Ontario Works Hous ing Services Chi ld Care Services Brantford Fire
Department Brantford Police
Services Brantford Public
Library
Brantford Farmers’ Market
Brantford Municipal Ai rport
Des ign and Construction
Engineering Environmental Services Fleet Parking Faci lities and Asset
Management Operational Services Trans it Transportation Services
Greg DworakJosephine Atanas Elizabeth GoodgerDarryl Lee
Page 8
The City of Brantford is pleased to present its Financial Report for the year ended December 31, 2015. The Financial Report has been prepared in accordance with the Municipal Act and is based on the reporting standards set by the Public Sector Accounting Board of the Chartered Professional Accountants of Canada. This Financial Report communicates to taxpayers, residents, local businesses, and other interested parties the City’s 2015 financial performance. In addition to key financial results, the report provides an overview of the City’s newly launched Community Strategic Plan along with significant achievements, priorities for the future, financial processes, and the City’s strategic financial plan. The financial operations of the City of Brantford are guided by our commitment to fiscal responsibility and transparency. The financial decisions and priorities identified by Brantford City Council are facilitated through ongoing, accountable and open communications with the citizens of our community.
In 2015, The Government Finance Officers Association of the United States and Canada (GFOA) awarded the City of Brantford the “Canadian Award of Excellence” in Financial Reporting (CAnFR Program) and the “Distinguished Budget Presentation Award”. The City is proud to be a recipient of these prestigious awards and will continue to demonstrate comprehensive and transparent reporting. The City’s 2015 financial results continue to demonstrate strong leadership of Council and excellence in financial planning and fiscal management. However, the City is faced with significant local, provincial, and national cost pressures. • Local pressures include an aging workforce,
maintaining infrastructure in a state of good repair, and meeting the demands of growth.
• Provincial pressures include ongoing issues
with the implementation of the Social Services Management System, and the unpredictable nature of certain expenditures such as social assistance.
• National pressures include increasing energy
costs, and fluctuations in currency exchange rates.
Like most municipalities, the City is working diligently to find efficiencies to assist with these pressures while providing a high level of service to its citizens.
MESSAGE FROM THE CITY TREASURER, DIRECTOR OF FINANCE
Page 9

OUR MISSION, VISION, AND VALUES
Our Mission The City of Brantford, in partnership with our community, is committed to responsible leadership through sound fiscal management and the delivery of quality programs and services for the citizens of Brantford.
Our Vision Our vision is to be a contemporary community, thriving in a modern economy. The Brantford of tomorrow will be progressive and prosperous, a place that respects its past and embraces its future.
Integrity We are honest, open and sincere in the way we treat our community and our citizens. We are united in our beliefs that together we will create a better place to live – always remaining true to ourselves. Commitment We are committed to putting citizens first by providing excellent service and exceptional experiences. By focusing on our citizens our employees are engaged in challenging and meaningful work that enables the people of our community to thrive and prosper. Innovation We are proactive in our thinking and our actions – introducing new ideas and finding innovative ways to bring them to life. We support and nurture new solutions that drive progress.
Lifelong Learning Education is the gateway to making lasting change. We believe strongly in continuously educating staff to meet new challenges and ensure growth within our organization and our community. Accessible As an organization we are dedicated to promoting the independence, dignity, integration, and equality of opportunity for persons with disabilities by ensuring the accessibility of our facilities and services. We pride ourselves on the fact that accessibility is engrained in our corporate culture and the way we conduct our day-to-day business.
Our Values
Page 10

Brantford’s Community Strategic Plan was founded on a community based consultation process including significant input from residents, businesses, community organizations and staff has resulted in a clear vision with goals and actions that reflect the collective values of our community. From this, four strategic goals evolved, providing the framework for “Shaping Our Future: Brantford’s Community Strategic Plan.” Goals established include:
1. Economic Vitality & Innovation 2. High Quality of Life & Caring for All Citizens 3. Managed Growth & Environmental Leadership 4. Excellence in Governance & Municipal Management
Today, these goals continue to reflect the needs and vision of our community and will be used to assist Council in setting priorities and utilizing resources during the remainder of their term through to 2018. Strategic actions have been proposed that will continue to work towards our community’s long-term desired outcomes. We are pleased to report the progress made towards meeting each of our strategic goals in Brantford’s 2015 Financial Report and Consolidated Financial Statements.
Brantford’s Community Strategic Plan SHAPING OUR FUTURE
Page 11

A strong, diversified economic base provides opportunities for both citizens and potential investors while enhancing innovation and education.
Key Accomplishments • 11 new industrial firms, creating 177 new jobs • Expansion of 14 existing firms, creating 241 new jobs • Brantford recorded the third most valuable
construction year in its history in 2015, with $164 million in building permits issued.
• Downtown building construction was just over $4 million, a fourfold increase over 2014
• 5 new major commercial investments creating 360 jobs
• Sports tourism created an estimated economic impact of $3.5 million from 56 events
• Provided $298,648 in grants for 9 projects with a total investment of $11.5 million
Brantford is committed to ensuring a safe and healthy community for all citizens, while providing a high quality of living through recreation, sports, arts and culture.
Key Accomplishments • Provided $150,000 in arts and cultural grants to enhance programs and services of 6
not-for-profit arts and cultural organizations • Worked with 27 community partners to increase the number of digital spaces to
connect residents with digital literacy training, hosting over 1,000 participants • 7,669 parent visits with 928 children served through the early years literacy
program • Increased Parks and Recreation programming by $167,933 with substantial growth
in fitness, aquatics and summer camp participation • Increased housing assets by $6.5 million • “Housing First” program assisted 25 participants
Page 12
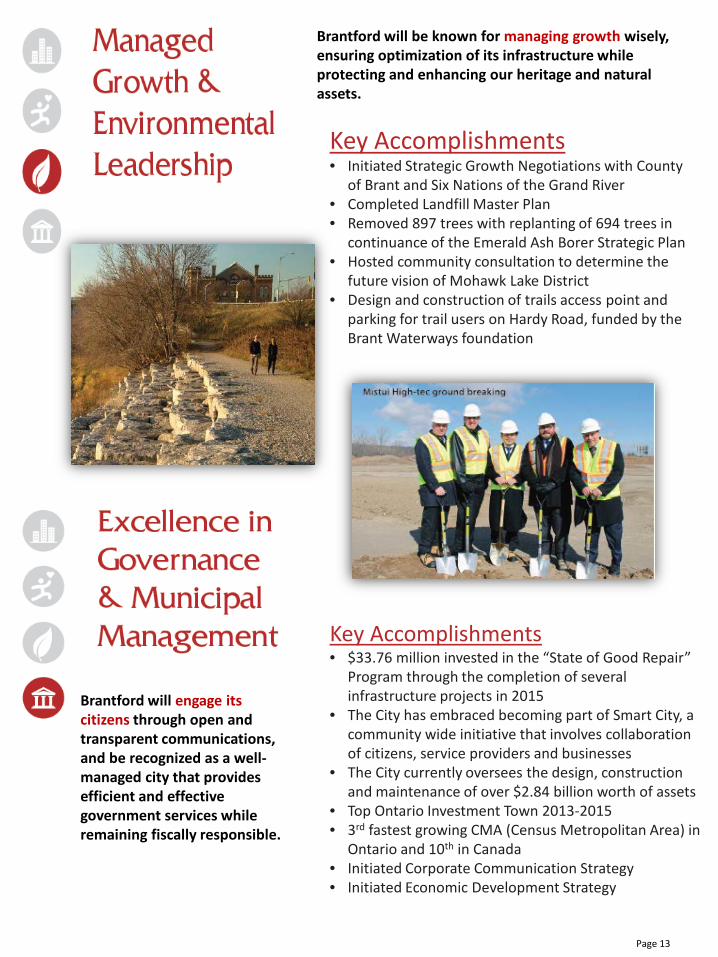
Brantford will be known for managing growth wisely, ensuring optimization of its infrastructure while protecting and enhancing our heritage and natural assets.
Key Accomplishments • Initiated Strategic Growth Negotiations with County
of Brant and Six Nations of the Grand River • Completed Landfill Master Plan • Removed 897 trees with replanting of 694 trees in
continuance of the Emerald Ash Borer Strategic Plan • Hosted community consultation to determine the
future vision of Mohawk Lake District • Design and construction of trails access point and
parking for trail users on Hardy Road, funded by the Brant Waterways foundation
Brantford will engage its citizens through open and transparent communications, and be recognized as a well-managed city that provides efficient and effective government services while remaining fiscally responsible.
Key Accomplishments • $33.76 million invested in the “State of Good Repair”
Program through the completion of several infrastructure projects in 2015
• The City has embraced becoming part of Smart City, a community wide initiative that involves collaboration of citizens, service providers and businesses
• The City currently oversees the design, construction and maintenance of over $2.84 billion worth of assets
• Top Ontario Investment Town 2013-2015 • 3rd fastest growing CMA (Census Metropolitan Area) in
Ontario and 10th in Canada • Initiated Corporate Communication Strategy • Initiated Economic Development Strategy
Page 13

OUR COMMISSIONS
Corporate Services Commission
The City of Brantford Corporate Services Commission consists of 5 departments staffed by 122 full-time employees. Services provided by Corporate Services are a blend of both inward facing corporate support services and a number of external customer facing services which the public interacts with regularly. As a result, our customer group is extremely varied and broad.
2015 Major Project - Unified Communications Project
During 2015 a corporate-wide telephone system was implemented that ushered the City into a new era of communicating internally as well as externally and gave the City the ability to communicate and collaborate from anywhere, on any device using any communication method.
• Purchasing implemented an electronic bidding system.
• Council approval of bi-weekly pay starting January 1, 2017
• Completion of a corporate insurance actuarial review
• Electronic pay slips • Accounts payable electronic funds transfer with
email notifications
Commission Priorities for 2016 • Acquisition and implementation of a new integrated
budgeting software • Update the Municipal Real Estate Master Plan
including rationalizing the City’s current property inventory, the identification of property needs and strategic property acquisitions
• Compensation and pay equity review • Corporate Information Technology Strategic Plan
update
Other Projects and Events
Page 14

Community Services Commission
The City of Brantford Community Services Commission consists of 7 departments staffed by 295 full-time employees. Services provided by Community Services are geared towards growth related activities in the City and providing a high quality of life and caring for all citizens.
Other Projects and Events
Commission Priorities for 2016
• Parks and Recreation Master Plan • Economic Development Strategy • Greenwich/Mohawk Lake District Secondary Plan • Healthy Brantford – Healthy Kids Community Challenge • Southwest Community Centre Project • Sanderson Centre new marquee sign • Playground Replacement Program • Introduction of the City’s first bicycle skills park • Sydenham/Pearl Brownfield remediation
2015 Major Project - Kiwanis Field Project
During 2015, the City of Brantford partnered with the Grand Erie District School Board to construct a new state-of-the-art outdoor athletic facility. Featuring a synthetic turf field, an 8 lane rubberized track as well as permanent bleacher seating, a central press box, electronic scoreboard and light standards for night time use. The field is scheduled to open in June 2016.
• Brantford Civic Centre new stadium seating • Hosted Rogers Hometown Hockey with Ron
MacLean • Construction commenced for the new Proshop/
maintenance shop at Northridge Golf Course
• Inception of the City’s community gardens program
• Word Nutella Day held at Wayne Gretzky Sport Center attracted over 6,000 people
Page 15
Public Health, Safety and Social Services Commission
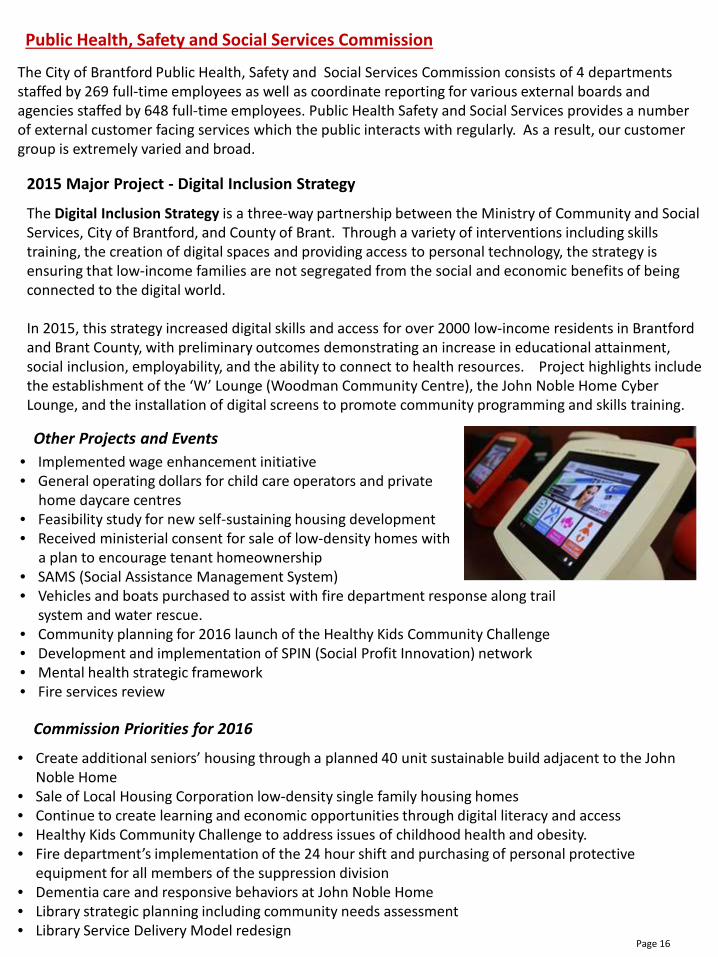
The City of Brantford Public Health, Safety and Social Services Commission consists of 4 departments staffed by 269 full-time employees as well as coordinate reporting for various external boards and agencies staffed by 648 full-time employees. Public Health Safety and Social Services provides a number of external customer facing services which the public interacts with regularly. As a result, our customer group is extremely varied and broad.
Commission Priorities for 2016
• Create additional seniors’ housing through a planned 40 unit sustainable build adjacent to the John Noble Home
• Sale of Local Housing Corporation low-density single family housing homes • Continue to create learning and economic opportunities through digital literacy and access • Healthy Kids Community Challenge to address issues of childhood health and obesity. • Fire department’s implementation of the 24 hour shift and purchasing of personal protective
equipment for all members of the suppression division • Dementia care and responsive behaviors at John Noble Home • Library strategic planning including community needs assessment • Library Service Delivery Model redesign
Other Projects and Events
2015 Major Project - Digital Inclusion Strategy
The Digital Inclusion Strategy is a three-way partnership between the Ministry of Community and Social Services, City of Brantford, and County of Brant. Through a variety of interventions including skills training, the creation of digital spaces and providing access to personal technology, the strategy is ensuring that low-income families are not segregated from the social and economic benefits of being connected to the digital world. In 2015, this strategy increased digital skills and access for over 2000 low-income residents in Brantford and Brant County, with preliminary outcomes demonstrating an increase in educational attainment, social inclusion, employability, and the ability to connect to health resources. Project highlights include the establishment of the ‘W’ Lounge (Woodman Community Centre), the John Noble Home Cyber Lounge, and the installation of digital screens to promote community programming and skills training.
• Implemented wage enhancement initiative • General operating dollars for child care operators and private home daycare centres • Feasibility study for new self-sustaining housing development • Received ministerial consent for sale of low-density homes with a plan to encourage tenant homeownership • SAMS (Social Assistance Management System) • Vehicles and boats purchased to assist with fire department response along trail
system and water rescue. • Community planning for 2016 launch of the Healthy Kids Community Challenge • Development and implementation of SPIN (Social Profit Innovation) network • Mental health strategic framework • Fire services review
Page 16

Public Works Commission
The City of Brantford Public Works Commission consists of 5 departments staffed by 313 full-time employees. Services provided by Public Works are a blend of both inward facing corporate support services and a number of external customer facing services which the public interacts with regularly. As a result, our customer group is extremely varied and broad.
Commission Priorities for 2016
• Transportation Master Plan implementation • Develop and update Brantford standards for
infrastructure design, repair and replace existing infrastructure, plan and design services to accommodate for future growth
• Implement recommendations of SCADA master plan for water and wastewater systems
• Develop wastewater treatment master plan • Expand asset management strategy • Implement activity tracking and work management • Completion of the comprehensive operations review
of Brantford Transit • Transit electronic pre-boarding announcements
outside of buses (AODA) • Modernize winter control process and procedures to
increase effectiveness and efficiency • Service delivery and meeting minimum maintenance
standards
• Completed the Landfill Master Plan • Commencement of Brantford Transit’s
operational review • Repaired 4288.73m2 of sidewalk • Purchased 3 new conventional transit and 5 new specialized transit buses • Completion of Alexander Drive pumping stations
and improvements • Completed first phase of Dunsdon Street water
main relining west of North park Street
Other Projects and Events
2015 Major Project - In-house operations of wastewater treatment facilities
During 2015, the Environmental Services department successfully brought wastewater treatment operations in-house which will result in a $100,000 savings in annual operating costs. The wastewater treatment system consists of one wastewater treatment plant and 8 sanitary pumping stations and included an additional 8 staff.
Page 17
The City’s Strategic Financial Plan is a framework to guide City Council and the City’s departments, boards, and committees in their financial planning and decision-making processes. Through this, the outcome is to improve and strengthen the long-term financial health of the City. Objectives
To focus on cost efficient and effective service and program delivery. To maximize revenues through a variety of sources. To use debt in a fiscally responsible manner. To properly maintain and fund the City’s physical assets. To account for and fund liabilities. To ensure that user fees remain regionally competitive. To ensure that growth will pay its fair share of growth related infrastructure costs. To establish a stable and equitable tax burden policy for the community.
Financial Policies Below are some of the financial policies adopted to assist in achieving the financial objectives listed above. • Financial Management Policy - Proposals for new services or service level adjustments
(mandatory or discretionary) will be presented to Finance Committee for consideration. These proposals shall include impacts on the operating and capital budgets, funding sources, human resource requirements, performance measures, and long-term financial impact.
• Development Charges - The City will be guided by the principle that growth shall pay for itself. • User Fees - The City will strive to increase user fees as a percentage of overall funding by
identifying new areas where user fees can be implemented and by ensuring that existing fees are updated based on increases in the associated costs to provide the service.
• Asset Management and Liability Policies - The City will include increased funding within its annual Capital funding to include lifecycle costing for all of the City’s tangible capital assets to be fully implemented by 2017.
• Capital Budget Management Process – The City has moved to a Ten-Year Capital Budget process with one year of detailed project information and ten years of financial information identified. The Ten-Year Capital Budget will be reevaluated and updated on an annual basis by staff for consideration by Council.
• Debt Management Policies – For Tax-Supported debt, debt carrying costs must be paid through the City’s Operating Budget, while for Rate-Supported debt, debt carrying costs must be paid through user fees.
STRATEGIC FINANCIAL PLAN
Page 18

Annual Budget Process Operating Budget The City of Brantford uses the budget as a means of allocating resources to provide services, and maintain the infrastructure that residents and businesses in the City of Brantford depend on. The operating budget is prepared each year along with a multi-year forecast for the next three years to assist staff and Council with the decision-making process. Our 2015 operating budget process began in June of 2014 and was approved by council on March 7, 2015. The operating budget provides for the everyday operation of our services. It includes salaries and benefits, the purchase of services from other groups, companies or agencies, along with costs for repairs and maintenance, materials and supplies. The budget process requires each department and commission to review their existing budgets in comparison to historical spending based on their current level of service. In addition to a review of prior spending patterns, adjustments are made for known process improvements and efficiencies, the economic indicators of the community, and business plans of the corporation as set out by Council. Department budgets are completed in early September and presented and reviewed by the Senior Management Team followed by the Estimates Committee, concluding with an approved budget.
Capital Budget Our capital budget has the same timeframe as that of our operating budget, with a common goal of balancing our immediate and future needs with affordability. Capital projects and assets include vehicles, roads, bridges, water lines, buildings, software systems, and equipment. The capital budget is prepared in detail for the next year with a summary of priorities provided for the next 10 years. At the City we use various forms of financing to support our capital plan. This includes debt financing, funding from other levels of government, reserves (accumulated from previous planning), and the levy (current year taxes), etc. The development of a long term capital forecast and the related financing strategy is needed to ensure our municipal infrastructure is maintained. The bulk of our capital spent occurs in our Public Works area (road network, water and sewer systems, facilities and equipment, transit system and bridges), and to a smaller extent, in Corporate Services (information technology systems), Community Services (parks, playgrounds and recreational facilities), and Public Health (housing and emergency services).
FINANCIAL MANAGEMENT PROCESSES
Page 19

The City of Brantford annually prepares audited consolidated financial statements which comprise the consolidated statement of financial position as at December 31st, and the consolidated statements of operations, cash flows, and changes in net financial assets for the year then ended.
Auditor’s Responsibility The external auditor is responsible for expressing an opinion on our consolidated financial statements based on their audit. The audit is conducted in accordance with Canadian Generally Accepted Auditing Standards which require that they comply with ethical requirements and plan and perform the audit to obtain reasonable assurance as to whether the consolidated financial statements are free from material misstatement. The audit is performed using procedures that assess the risk of material misstatement whether due to fraud or error. In their review, the auditor considers internal control relevant to the entity’s preparation and fair representation of the consolidated financial statements in order to design audit procedures that are appropriate in the circumstances.
Management’s Responsibility Management’s responsibility for the financial statements is for the preparation and fair presentation of our consolidated statements in accordance with Canadian Generally Accepted Accounting Principles and for internal controls that management has deemed to be necessary for the financial statements to be free from material misstatement.
Councillor’s Responsibility
The mandate of Council is to provide oversight to staff and the external auditors and is responsible to review internal and external reports, work plans, including the External Auditor’s Annual Audit Plan, as well as the consolidated financial statements and audit report findings.
ANNUAL AUDIT PROCESS
Page 20

RESERVES AND RESERVE FUNDS: The City of Brantford manages several reserves and reserve funds for the main purposes of funding capital expenditure projects, mitigating the impact of future obligations, stabilizing operating costs and balancing specific budget items. In 2015, the balance of reserve and reserve funds is $123.9 million (2014 - $108.2 million). This represents an increase of $15.7 million over the prior year. The City’s most significant reserve fund balances include: water and wastewater, social housing, transportation, sick leave, and industrial development. Reserves and reserve funds are included in the accumulated surplus balance. Deferred revenues from obligatory reserve funds are reported on the Consolidated Statement of Financial Position and are comprised of contributions received from federal and provincial gas tax, development charges and other payments from developers for future projects. In 2015, the balance of deferred revenues - obligatory reserve funds is $53.0 million (2014 - $43.3 million). This represents an increase of $9.7 million from the prior year. The reserve and reserve fund balances are monitored on an ongoing basis to ensure they remain sufficient to meet long-term financial commitments and to allow the City to take advantage of financial opportunities as they become known. The following chart shows the historical trend of reserve and reserve fund balances since 2011:
Page 21

EXPENSES:
In 2015, Total Expenses on the Consolidated Statement of Operations total $278.6 million (2014 $290.3 million) representing a decrease of $11.7 million.
2015 Expenses by Service and Other Expenses (In $ millions)
General government - $12.8 million Protection services - $58.4 million Transportation services - $35.4 million Environmental services - $48.8 million Health services - $6.8 million Social and family services - $58.7 million Social housing - $20.1 million Recreation and cultural services - $32.0 million Planning and development - $5.6 million
2015 Expenses by Type and Other Expenses (In $ millions)
Salaries, wages and benefits - $125.3 million Materials - $47.3 million Contracted services - $25.0 million External transfers - $40.6 million Amortization - $34.2 million Debt servicing - $1.5 million Other expenditures - $4.6 million
Page 22

REVENUES AND OTHER INCOME:
In 2015, Total Revenues amounted to $291.2 million (2014 - $294.8 million) representing a decrease of $3.6 million. The sources and breakdown of revenues are provided in the chart below:
Taxation revenues in 2015 total $134.1 million (2014 - $131.3 million) which represents an
increase of $2.8 million or 2.1% over the prior year.
User charges for 2015 are $55.6 million (2014 - $56.8 million), a decrease of $1.2 million or 2.0% from the prior year.
Government transfers for 2015 total $62.6 million (2014 - $65.2 million). This represents an
annual decrease of $2.6 million.
In 2015, deferred revenue earned is $1.8 million (2014 - $7.3 million), a decrease of $5.5 million over the prior year due to a decrease in development charge spending in 2015.
Page 23

FINANCIAL LIABILITIES:
Total Financial Liabilities at 2015 year end are $210.2 million (2014 - $202.0 million), representing an increase of $8.2 million over the prior year.
Accounts payable and accrued liabilities increased from $36.9 million in 2014 to $42.1 million in 2015 due to the timing of payments at year end.
Deferred revenues – obligatory reserve funds are $53.0 million in 2015 (2014 - $43.3 million), representing an increase of $9.7 million from the prior year due to an increase in development charge revenue collected but not yet spent.
Landfill closure and post closure liability increased from $24.7 million in 2014 to $28.5 million in 2015. The $3.8 million increase is due to an increase in estimated expenses used in the calculation of the future liability estimate.
Contaminated sites liability is now recognized in 2015 in accordance with new reporting
requirements under PSAB 3260 and is applied retroactively. The liability for 2015 is $20.8 million (2014 - $37.7 million) resulting in a decrease of $16.9 million. The decrease is a result of remediation expenses which occurred during the year thus reducing the contaminated sites liability.
Net long term liabilities are $43.7 million (2014 - $37.8 million) representing an increase of $5.9 million. Additional debt was issued for John Noble Home in 2015.
NON-FINANCIAL ASSETS:
Total Non-financial assets at year end are $718.9 million (2014 $720.1 million) representing a decrease of $1.1 million over the prior year. Non-financial assets consist of tangible capital assets, inventories and prepaid expenses with tangible capital assets representing over 98% of the total balance.
Page 24

The consolidated financial statements of the Corporation of the City of Brantford are prepared by management in accordance with Canadian public sector accounting standards as recommended by the Public Sector Accounting Board of CPA Canada. The consolidated financial statements include the assets, liabilities, revenue and expenses of the City. The reporting entity is composed of all organizations, committees and local boards accountable for the administration of their financial affairs and resources to the City and which are owned or controlled by the City. These consolidated financial statements include:
Brant and Brantford Local Housing Corporation
Brantford Downtown Business Improvement Area
Brantford Municipal Non-Profit Housing Corporation
Brantford Police Services Board
Brantford Public Library
John Noble Home Government Business Enterprises include Brantford Energy Corporation. In accordance with Public Sector Accounting Standards this is accounted for on a modified equity basis in which the business enterprise’s accounting principles are not adjusted to conform to those of the City, and inter-organizational transactions and balances are not eliminated. The financial statements of Brantford Energy Corporation are prepared in accordance with International Financial Reporting Standards. The City‘s Trust Fund and their related operations administered by the municipality are not consolidated but are reported separately. Non-consolidated entities include the Brant County Health Unit. The following information summarizes the financial results from the 2015 consolidated financial statements:
FINANCIAL ASSETS: Total Financial Assets at 2015 year end are $292.3 million (2014 - $270.3 million). This represents an increase of $22.0 million over the prior year.
During 2015, cash and cash equivalents increased by $3.7 million to $30.4 million (2014 - $26.7 million).
Receivables increased by $2.1 million in 2015. The balance of receivables at December 31, 2015 is $23.8 million (2014 - $21.7 million).
Investments increased by $13.0 million in 2015 primarily due to a $9 million debenture received at year end. The balance of investments at December 31, 2015 is $177.6 million (2014 - $164.6 million).
Investment in Brantford Energy Corporation in 2015 increased by $2.0 million over the prior year. The balance at December 31, 2015 is $32.7 million (2014 - $30.7 million).
Notes receivables for Brantford Power Inc. and Brantford Hydro Inc. remain unchanged at $24.2 million and $1.3 million respectively.
2015 Financial Year in Review
Page 25

As the City of Brantford continues to grow, our objective is to maintain a high standard of programs and services while meeting the needs of a growing economy. We project that net spending for the upcoming fiscal year will be within budget estimates and we will continue to use financial management policies and best practices to ensure the most efficient and effective use of the City’s financial resources.
Catherine Brubacher, City Treasurer, Director of Finance June 13, 2016
CONCLUSION
Page 26

FINANCIAL SECTION

Page 28
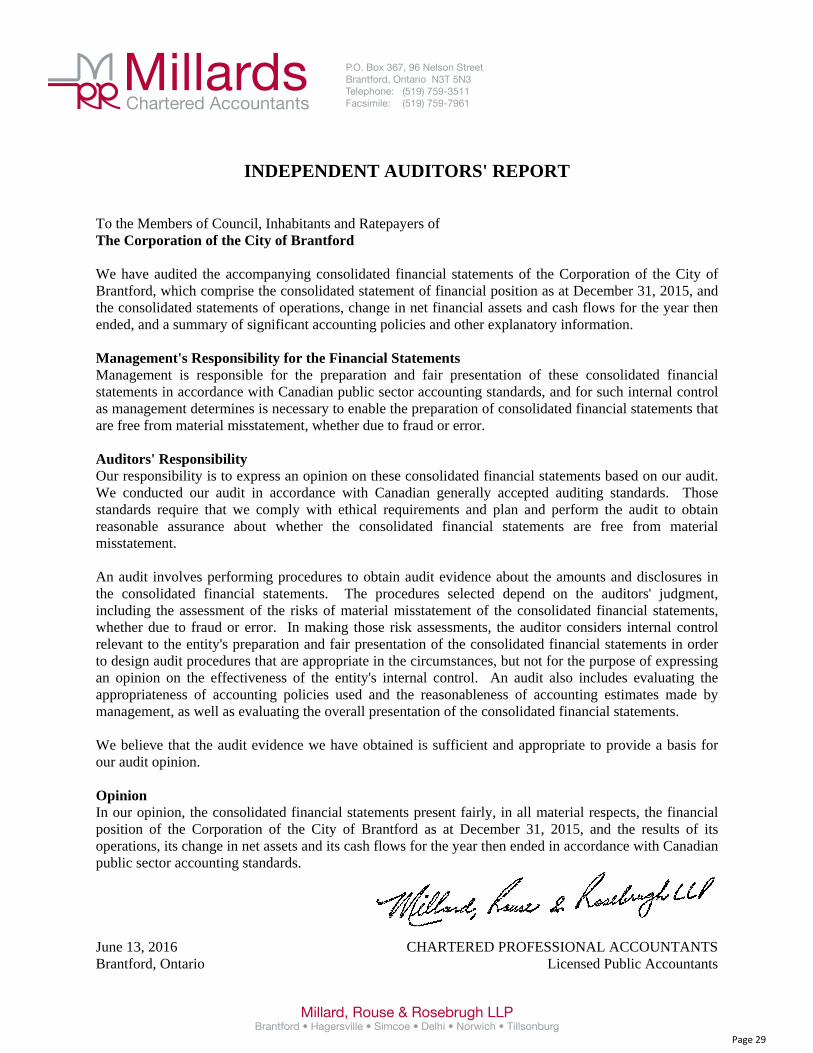
INDEPENDENT AUDITORS' REPORT To the Members of Council, Inhabitants and Ratepayers of The Corporation of the City of Brantford We have audited the accompanying consolidated financial statements of the Corporation of the City of Brantford, which comprise the consolidated statement of financial position as at December 31, 2015, and the consolidated statements of operations, change in net financial assets and cash flows for the year then ended, and a summary of significant accounting policies and other explanatory information. Management's Responsibility for the Financial Statements Management is responsible for the preparation and fair presentation of these consolidated financial statements in accordance with Canadian public sector accounting standards, and for such internal control as management determines is necessary to enable the preparation of consolidated financial statements that are free from material misstatement, whether due to fraud or error. Auditors' Responsibility Our responsibility is to express an opinion on these consolidated financial statements based on our audit. We conducted our audit in accordance with Canadian generally accepted auditing standards. Those standards require that we comply with ethical requirements and plan and perform the audit to obtain reasonable assurance about whether the consolidated financial statements are free from material misstatement. An audit involves performing procedures to obtain audit evidence about the amounts and disclosures in the consolidated financial statements. The procedures selected depend on the auditors' judgment, including the assessment of the risks of material misstatement of the consolidated financial statements, whether due to fraud or error. In making those risk assessments, the auditor considers internal control relevant to the entity's preparation and fair presentation of the consolidated financial statements in order to design audit procedures that are appropriate in the circumstances, but not for the purpose of expressing an opinion on the effectiveness of the entity's internal control. An audit also includes evaluating the appropriateness of accounting policies used and the reasonableness of accounting estimates made by management, as well as evaluating the overall presentation of the consolidated financial statements. We believe that the audit evidence we have obtained is sufficient and appropriate to provide a basis for our audit opinion. Opinion In our opinion, the consolidated financial statements present fairly, in all material respects, the financial position of the Corporation of the City of Brantford as at December 31, 2015, and the results of its operations, its change in net assets and its cash flows for the year then ended in accordance with Canadian public sector accounting standards.
June 13, 2016 CHARTERED PROFESSIONAL ACCOUNTANTS Brantford, Ontario Licensed Public Accountants
Millard, Rouse & Rosebrugh LLPBrantford • Hagersville • Simcoe • Delhi • Norwich • Tillsonburg
MillardsChartered Accountants
P.O. Box 367, 96 Nelson StreetBrantford, Ontario N3T 5N3Telephone: (519) 759-3511Facsimile: (519) 759-7961
Page 29

CORPORATION OF THE CITY OF BRANTFORD
CONSOLIDATED STATEMENT OF FINANCIAL POSITION
As at December 31 2015 2014(Restated Note 2)
FINANCIAL ASSETSCash and cash equivalents 30,401,872 26,731,519
Taxes receivable (Note 6) 5,491,585 4,865,004
Accounts and grants receivable (Note 7) 18,316,504 16,840,750
Inventories held for resale 40,286 44,481
Land held for resale 2,256,250 1,114,983
Investments (Note 8) 177,616,667 164,558,557
Investment in Brantford Energy Corporation (Note 10) 32,728,724 30,688,232
Note receivable - Brantford Power Inc. (Note 10) 24,189,168 24,189,168
Note receivable - Brantford Hydro Inc. (Note 10) 1,303,335 1,303,335
TOTAL FINANCIAL ASSETS 292,344,391 270,336,029
LIABILITIESAccounts payable and accrued liabilities (Note 9) 42,090,963 36,889,613
Deferred revenues - obligatory reserve funds (Note 11) 52,951,817 43,334,339
Vested sick leave (Note 12) 3,270,342 3,194,146
Post employment/retirement benefits (Note 12) 18,389,167 17,927,498
Accrued interest on long term liabilities 458,155 442,497
Landfill closure and post closure liability (Note 13) 28,511,294 24,694,625
Contaminated Sites Liability (Note 14) 20,833,965 37,676,497
Net long term liabilities (Note 16) 43,713,876 37,795,207
TOTAL LIABILITIES 210,219,579 201,954,422
NET FINANCIAL ASSETS 82,124,812 68,381,607
NON-FINANCIAL ASSETSTangible capital assets (net) (Schedule 1) 705,483,548 704,329,844
Inventories (Note 3) 8,111,375 9,541,743
Prepaid expenses 5,326,868 6,183,941
718,921,791 720,055,528
NET ASSETS 801,046,603 788,437,135
ACCUMULATED SURPLUS (NOTE 18) 801,046,603 788,437,135
The accompanying notes are an integral part of these financial statements.Page 1
Page 30

CORPORATION OF THE CITY OF BRANTFORD
CONSOLIDATED STATEMENT OF OPERATIONS
As at December 31 Budget(Note 27)
2015 2014(Restated Note 2)
REVENUESTaxation (Note 19) 137,388,118 134,079,310 131,289,499
User charges (Note 20) 56,086,118 55,624,247 56,778,237
Government transfers (Note 21) 67,080,171 62,561,054 65,249,274
Rents and concessions 8,044,168 8,399,915 8,628,530
Investment income 1,415,000 1,218,765 1,169,406
Interest earned on reserves and reserve funds 2,611,766 2,630,012 2,298,999
Casino revenue 5,100,000 5,011,651 5,064,697
Deferred revenue earned 1,813,750 1,813,751 7,338,007
Provincial Offenses Act and other fines 2,130,050 1,882,583 2,177,994
Licences and permits 2,406,824 2,228,561 2,044,832
Penalties and interest on taxes 1,700,000 1,643,994 1,706,372
Contributed tangible capital assets 1,316,950 1,316,950 3,594,089
Income from Brantford Energy Corporation (Note 22) 2,651,362 2,651,362 2,651,362
Change in equity in Brantford Energy Corporation 2,364,493 2,040,492 2,276,006
Other revenues (Note 23) 7,048,727 8,136,243 2,572,454
TOTAL REVENUES 299,157,497 291,238,890 294,839,758
EXPENSESGeneral government 15,893,317 12,776,552 13,746,164
Protection services 56,716,895 58,427,865 55,770,143
Transportation services 35,788,287 35,402,747 40,636,518
Environmental services 49,107,498 48,791,614 54,532,954
Health services 6,837,424 6,844,401 6,662,201
Social and family services 63,066,205 58,696,778 57,228,327
Social housing 20,040,293 20,074,199 19,900,852
Recreation and cultural services 34,484,508 32,003,292 32,149,677
Planning and development 5,704,969 5,611,974 9,695,718
TOTAL EXPENSES 287,639,396 278,629,422 290,322,554
ANNUAL SURPLUS (DEFICIT) FROM OPERATIONS 11,518,101 12,609,468 4,517,204ACCUMULATED SURPLUS, BEGINNING OF YEAR 788,437,135 788,437,135 783,919,931
ACCUMULATED SURPLUS, END OF YEAR 799,955,236 801,046,603 788,437,135
The accompanying notes are an integral part of these financial statements.Page 2
Page 31

CORPORATION OF THE CITY OF BRANTFORD
CONSOLIDATED STATEMENT OF CHANGE IN NET FINANCIAL ASSETS
For the Year Ended December 31, 2015 Budget 2015 2014(Restated Note 2)
Annual Surplus 11,518,101 12,609,468 4,517,201
Amortization of tangible capital assets 32,452,833 34,248,827 33,525,948
Contributed (Donated) tangible capital assets (1,316,950) (1,316,950) (3,594,089)
Acquisition of tangible capital assets (34,377,443) (34,377,443) (31,545,598)
Loss/(Gain) on disposal of tangible capital assets and landinventory 112,520 112,520 7,534,463
Proceeds on disposal of tangible capital assets 179,342 179,342 52,021
Acquisition of inventory and prepaid expense - 2,287,441 2,291,437
Increase (Decrease) in Net Financial Assets 8,568,403 13,743,205 12,781,383
Net Financial Assets, Beginning of Year 68,381,607 68,381,607 55,600,224
Net Financial Assets, End of Year 76,950,010 82,124,812 68,381,607
The accompanying notes are an integral part of these financial statements.Page 3
Page 32
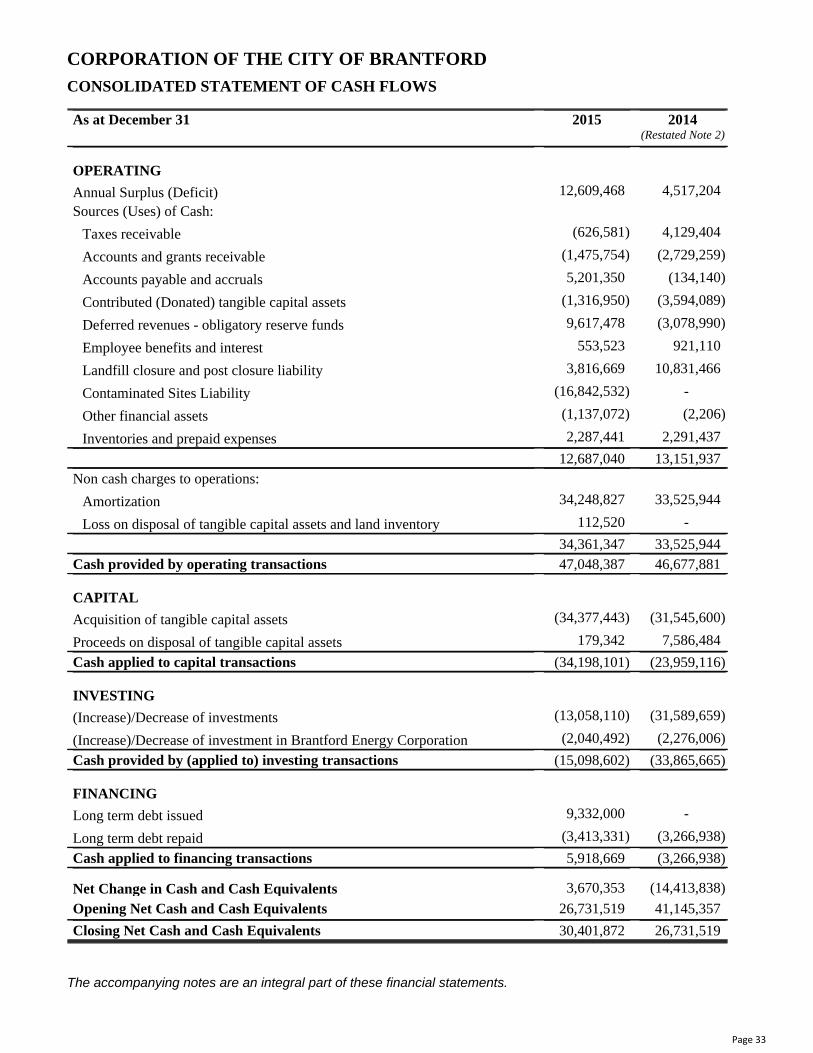
CORPORATION OF THE CITY OF BRANTFORD
CONSOLIDATED STATEMENT OF CASH FLOWS
As at December 31 2015 2014(Restated Note 2)
OPERATING
Annual Surplus (Deficit) 12,609,468 4,517,204
Sources (Uses) of Cash:
Taxes receivable (626,581) 4,129,404
Accounts and grants receivable (1,475,754) (2,729,259)
Accounts payable and accruals 5,201,350 (134,140)
Contributed (Donated) tangible capital assets (1,316,950) (3,594,089)
Deferred revenues - obligatory reserve funds 9,617,478 (3,078,990)
Employee benefits and interest 553,523 921,110
Landfill closure and post closure liability 3,816,669 10,831,466
Contaminated Sites Liability (16,842,532) -
Other financial assets (1,137,072) (2,206)
Inventories and prepaid expenses 2,287,441 2,291,437
12,687,040 13,151,937Non cash charges to operations:
Amortization 34,248,827 33,525,944
Loss on disposal of tangible capital assets and land inventory 112,520 -
34,361,347 33,525,944Cash provided by operating transactions 47,048,387 46,677,881
CAPITAL
Acquisition of tangible capital assets (34,377,443) (31,545,600)
Proceeds on disposal of tangible capital assets 179,342 7,586,484
Cash applied to capital transactions (34,198,101) (23,959,116)
INVESTING
(Increase)/Decrease of investments (13,058,110) (31,589,659)
(Increase)/Decrease of investment in Brantford Energy Corporation (2,040,492) (2,276,006)
Cash provided by (applied to) investing transactions (15,098,602) (33,865,665)
FINANCING
Long term debt issued 9,332,000 -
Long term debt repaid (3,413,331) (3,266,938)
Cash applied to financing transactions 5,918,669 (3,266,938)
Net Change in Cash and Cash Equivalents 3,670,353 (14,413,838)
Opening Net Cash and Cash Equivalents 26,731,519 41,145,357
Closing Net Cash and Cash Equivalents 30,401,872 26,731,519
The accompanying notes are an integral part of these financial statements.Page 4
Page 33
CORPORATION OF THE CITY OF BRANTFORD
NOTES TO THE CONSOLIDATED FINANCIAL STATEMENTSFor the year ended December 31, 2015
The Corporation of the City of Brantford is a Municipality in the Province of Ontario, Canada. It conductsits operations guided by the provisions of provincial statutes such as the Municipal Act and relatedlegislation.
1. SUMMARY OF SIGNIFICANT ACCOUNTING POLICIES
The consolidated financial statements of the Corporation of the City of Brantford (the “City”) are preparedby management in accordance with Canadian public sector accounting standards as recommended by thePublic Sector Accounting Board of CPA Canada.
The preparation of financial statements in conformity with Canadian public sector accounting standardsrequires management to make estimates and assumptions that affect the reported amounts of assets andliabilities and disclosure of contingent assets and liabilities at the date of the financial statements, and thereported amounts of revenues and expenditures during the period. Since precise determination of manyassets and liabilities is dependent upon future events, the preparation of periodic financial statementsnecessarily involves the use of estimates and approximations. These have been made using carefuljudgment. Actual results could differ from these estimates. Significant aspects of the accounting policiesadopted by the City are as follows:
(a) Reporting Entities
(i) Consolidated Entities The consolidated financial statements include the assets, liabilities, revenues and expenses, of the City.The reporting entity is composed of all organizations, committees and local boards accountable for theadministration of their financial affairs and resources to the City and which are owned or controlled bythe City. These consolidated financial statements include:
Brant and Brantford Local Housing CorporationBrantford Downtown Business Improvement AreaBrantford Municipal Non-Profit Housing CorporationBrantford Police Services BoardBrantford Public LibraryJohn Noble Home
Inter-departmental and inter-organizational transactions and balances between these organizations havebeen eliminated.
(ii) Brant and Brantford Local Housing Corporation Effective January 1, 2002, the City entered into a service agreement with the Brant and Brantford LocalHousing Corporation whereby the Housing Corporation transferred all operations to the City. TheHousing Corporation has retained title to its physical assets in the capacity of bare trustee for thebenefit of the City.
Page 5
Page 34

CORPORATION OF THE CITY OF BRANTFORD
NOTES TO THE CONSOLIDATED FINANCIAL STATEMENTSFor the year ended December 31, 2015
1. SUMMARY OF SIGNIFICANT ACCOUNTING POLICIES (continued)
(a) Reporting Entities (continued)
(iii) Non-Consolidated Entities The following local boards, joint local boards, municipal enterprises and utilities are not consolidated:
Brant County Health Unit
(iv) Accounting for School Board Transactions The taxation, other revenues, expenditures, assets and liabilities with respect to the operations of theschool boards are not reflected in the accumulated surplus of these financial statements.
(v) Trust Funds Trust funds and their related operations administered by the municipality are not consolidated, but arereported separately on the Trust Funds statement of continuity and statement of financial position.
(vi) Branford Energy Corporation Brantford Energy Corporation is accounted for on a modified equity basis, consistent with theCanadian public sector accounting standards for government business enterprises. Under the modifiedequity basis, the business enterprise’s accounting principles are not adjusted to conform with those ofthe City, and inter-organizational transactions and balances are not eliminated.
(b) Basis of Accounting
(i) Accrual Basis of Accounting The consolidated financial statements are prepared using the accrual basis of accounting. The accrualbasis of accounting records revenue as it is earned and measurable. Expenses are recognized as theyare incurred and measurable based upon receipt of goods or services and/or the creation of a legalobligation to pay.
(ii) Non-financial Assets Non-financial assets are not available to discharge existing liabilities and are held for use in theprovision of services. They have useful lives extending beyond the current year, and are not intendedfor sale in the ordinary course of operations. The change in non-financial assets during the year,together with the excess of revenues over expenses, provides the change in net financial assets for theyear.
Page 6
Page 35

CORPORATION OF THE CITY OF BRANTFORD
NOTES TO THE CONSOLIDATED FINANCIAL STATEMENTSFor the year ended December 31, 2015
1. SUMMARY OF SIGNIFICANT ACCOUNTING POLICIES (continued)
(b) Basis of Accounting (continued)
(ii) Non-financial Assets (continued)
a) Tangible Capital AssetsUnder Canadian public sector accounting standards guidelines, tangible capital assets are recordedat their historical cost and amortized over their estimated useful life. Tangible capital assets aredefined as non-financial assets with an estimated useful life greater than 1 year, held for use in theproduction or supply of goods and services, not held for resale, in continuous use, and valued inexcess of an established financial threshold.
The capitalization threshold for general assets is $5,000 and $25,000 for infrastructure assets.Individual tangible capital assets with lesser value are expensed and groups of similar assets, suchas library books, fire hoses, or street signs, are recorded as pooled assets based on their year ofacquisition.
Tangible capital assets are recorded at cost which includes amounts directly attributable to theacquisition, construction, development or betterment of the assets. The cost is amortized on astraight-line basis over their estimated useful lives as follows:
Buildings 10 - 50 years
Vehicles:
Transit buses 12 years
Vehicles 5 - 15 years
Computer hardware and software 4 - 15 years
Other:
Machinery and equipment 10 - 20 years
Land improvements 10 - 30 years
Waste, wastewater plants and networks:
Underground networks 50 - 75 years
Water and wastewater plants and facilities 30 - 100 years
Transportation
Roads 15 - 50 years
Bridges, culverts, etc. 20 - 40 years
Expected useful lives are determined based on experience with the asset. Revisions to the estimatesmay be caused by upgrades or renewal expenditures that result in a change in the service level ofthe asset or may revise the life expectancy. These estimates and potential impairment of thetangible capital assets are reviewed annually.
Amortization is calculated beginning in the month the asset is put into service. Assets underconstruction are not amortized until the asset is available for productive use.
Page 7
Page 36
CORPORATION OF THE CITY OF BRANTFORD
NOTES TO THE CONSOLIDATED FINANCIAL STATEMENTSFor the year ended December 31, 2015
1. SUMMARY OF SIGNIFICANT ACCOUNTING POLICIES (continued)
(b) Basis of Accounting (continued)
(ii) Non-financial Assets (continued)
b) Contribution of Tangible Capital AssetsTangible capital assets received as contributions are recorded at their fair market value at the dateof receipt.
c) LeasesLeases are classified as capital leases if they transfer substantially all of the benefits and risksincidental to ownership of property. Leased capital assets are recorded as tangible capital assets.
d) InventoriesInventories held for consumption are not considered tangible capital assets.
(iii) Cash and Cash Equivalents Cash and cash equivalents are comprised of cash on hand, cash held in financial institutions and shortterm investments with original maturities of three months or less from the time of acquisition.
(iv) Government Transfers Government transfers are recognized in the financial statements as revenues in the period in whichevents giving rise to the transfer occur, providing the transfers are authorized, any eligibility criteriahave been met and reasonable estimates of the amounts can be made.
(v) Taxation Revenue Taxation revenue is recorded when property tax bills are levied. Taxation revenue recognized eachyear is adjusted for estimates for expected supplementary taxes, appeals and non-collectible taxes.
(vi) Deferred Revenues - Obligatory Reserve Funds Deferred revenues represent developer and user charges, Federal and Provincial gas tax revenue,Federal and Provincial transit capital funding, Move Ontario roads and bridges capital funding, and B-Home housing program which have been collected, but for which the related services have yet to beperformed. These amounts will be recognized as revenues in the fiscal year the services are performed
(vii)Land Held for Resale Land held for resale is recorded at the lower of cost and net realizable value. Cost includes amounts forimprovements to prepare the land for sale or servicing.
Page 8
Page 37

CORPORATION OF THE CITY OF BRANTFORD
NOTES TO THE CONSOLIDATED FINANCIAL STATEMENTSFor the year ended December 31, 2015
2. RESTATEMENT OF 2014 COMPARATIVE FIGURES
Contaminated Sites
The adoption of Public Sector Accounting Board Standard (PSAB) 3260 has been applied retrospectivelyand prior year periods have been restated. The adoption of PS 3260 has changed amounts reported in theprior period.
Post-Employment/Retirement Benefits and Sick Leave Benefits
During the 2015 year, it was determined that the liability for post-employment/retirement benefits and sickleave benefits were not correctly accrued for in the prior years. This correction has changed amountsreported in the prior period.
Brantford Energy Corporation
The adoption of International Financial Reporting Standards in 2015 for Brantford Energy Corporation hasbeen applied retrospectively and prior year periods have been restated. The adoption has changed amountsreported in the prior period.
Accumulated Surplus as at January 1, 2014
Accumulated surplus, as previously reported 820,766,857
Brantford Energy Corporation IFRS adoption 829,571
Contaminated sites liability (37,676,497)
Accumulated surplus, as restated 783,919,931
Accumulated Surplus as at December 31, 2014
Accumulated surplus, as previously reported 825,679,809
Post-employment/retirement benefits & Sick leave benefits (307,261)
Brantford Energy Corporation IFRS adoption (net impact) 741,084
Contaminated sites liability (37,676,497)
Accumulated surplus, as restated 788,437,135
Annual Surplus as at December 31, 2014
Annual surplus, as previously reported 4,912,952
Change in post-employment/retirement benefits & Sick leave benefits (307,261)
Change in Brantford Energy Corporation due to IFRS adoption (88,487)
Annual surplus, as restated 4,517,204
Page 9
Page 38

CORPORATION OF THE CITY OF BRANTFORD
NOTES TO THE CONSOLIDATED FINANCIAL STATEMENTSFor the year ended December 31, 2015
3. INVENTORIES 2015 2014
Inventories of supplies 742,722 584,923
Land and rehabilitation costs 7,368,653 8,956,820
8,111,375 9,541,743
4. CONTRIBUTIONS TO NON-CONSOLIDATED JOINT BOARDS
Further to Note 1(a)(iii), the following contributions which are included as an expense on the consolidatedstatement of operations were made by the municipality to these boards:
2015 2014
Brant County Health Unit 2,272,168 2,239,587
5. TRUST FUNDS
Trust funds administered by the Municipality amounting to $3,888,076 (2014 - $3,821,592) have not beenincluded in the consolidated statement of financial position nor have their operations been included in theconsolidated statement of operations.
6. TAXES RECEIVABLE 2015 2014
Taxes receivable 10,958,449 11,125,888
Allowance for doubtful accounts (5,466,864) (6,260,884)
5,491,585 4,865,004
7. ACCOUNTS AND GRANTS RECEIVABLE 2015 2014
Accounts receivable 14,118,661 12,175,906
Grant receivable - Federal 2,037,928 2,366,629
Grant receivable - Provincial 2,159,915 2,298,215
18,316,504 16,840,750
Page 10
Page 39

CORPORATION OF THE CITY OF BRANTFORD
NOTES TO THE CONSOLIDATED FINANCIAL STATEMENTSFor the year ended December 31, 2015
8. INVESTMENTS
The total investments of $177,616,667 (2014 - $164,558,557) recorded on the consolidated statement offinancial position at cost, having a market value of $181,507,410 (2014 - $165,115,653) at the end of theyear are comprised of the following:
2015 2014
Provincial 4,104,215 5,126,997
Municipal - own 3,530,582 3,954,041
Municipal - other 14,744,407 17,419,423
Bank 155,237,463 138,058,096
177,616,667 164,558,557
9. ACCOUNTS PAYABLE AND ACCRUED LIABILITIES
Accounts payable and accrued liabilities are comprised of the following:2015 2014
Trade payables 23,068,316 18,441,950
Deposits/Unearned revenue 12,100,454 12,102,759
Payable to the provincial and federal government 6,922,193 6,344,904
42,090,963 36,889,613
10. INVESTMENT IN BRANTFORD ENERGY CORPORATION
In compliance with provincial legislation enacted to restructure the electricity industry in Ontario, Councilapproved the incorporation of the business of the former Brantford Hydro-Electric Commission (“theCommission”). Through its 100 per cent interest in Brantford Energy Corporation, the City retains itsinterest in the electricity business conducted by Brantford Energy Corporation’s wholly-owned subsidiaries,Brantford Power Inc., Brantford Hydro Inc. and Brantford Generation Inc. The four companies areincorporated under the Ontario Business Corporations Act. Brantford Power Inc. provides regulatedelectricity distribution services, Brantford Hydro Inc. provides fibre optics networks, water heater rentaland sentinel lighting services and Brantford Generation Inc. provides electricity generation.
The notes receivable of $25,492,503 are made up of two notes. The Brantford Power Inc. note of$24,189,168 is payable, interest only, at 5.87% per annum, with principal due February 1, 2016. TheBrantford Hydro Inc. note of $1,303,335 is payable, interest only, at 6.25% per annum, with principal dueFebruary 1, 2016. The City has the option to extend the maturity date for successive five year periods. TheCity also has the option to convert the principal sum of the notes into common shares of the corporation at aconversion ratio of $100 per common share. The City renewed the promissory notes on January 9, 2016 fora five year term maturing on February 1, 2021 bearing interest at 4.20%.
Page 11
Page 40
CORPORATION OF THE CITY OF BRANTFORD
NOTES TO THE CONSOLIDATED FINANCIAL STATEMENTSFor the year ended December 31, 2015
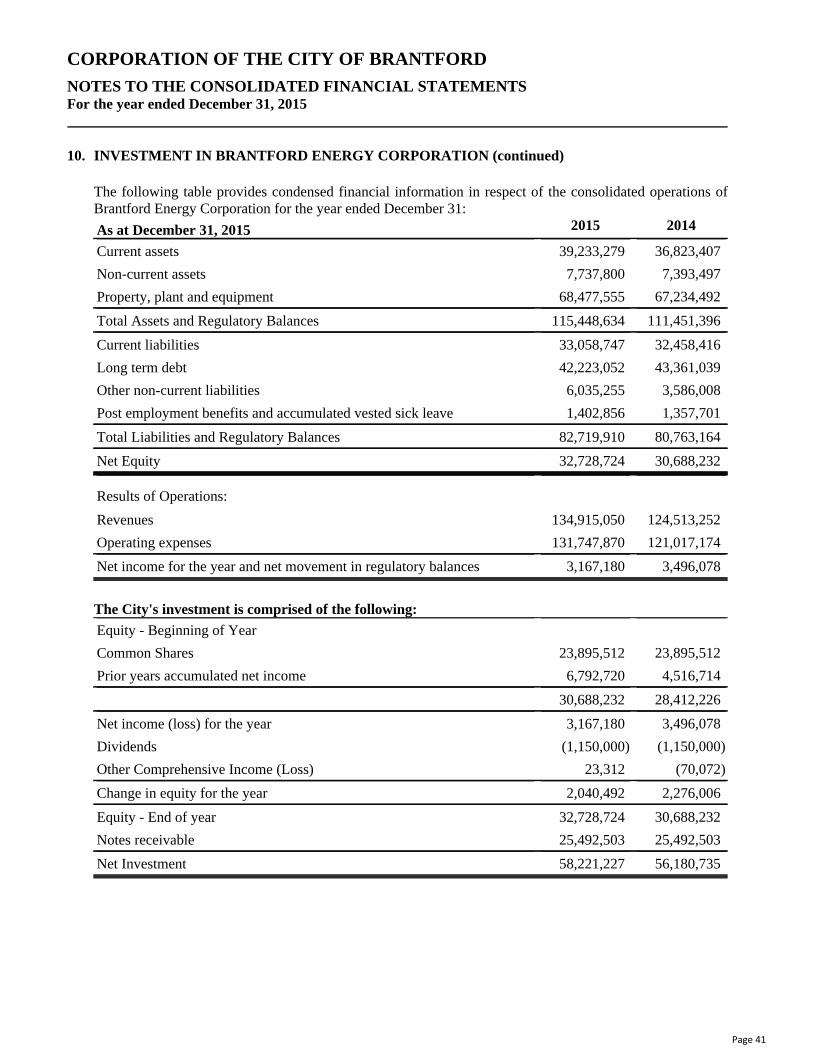
10. INVESTMENT IN BRANTFORD ENERGY CORPORATION (continued)
The following table provides condensed financial information in respect of the consolidated operations ofBrantford Energy Corporation for the year ended December 31:
As at December 31, 2015 2015 2014
Current assets 39,233,279 36,823,407
Non-current assets 7,737,800 7,393,497
Property, plant and equipment 68,477,555 67,234,492
Total Assets and Regulatory Balances 115,448,634 111,451,396
Current liabilities 33,058,747 32,458,416
Long term debt 42,223,052 43,361,039
Other non-current liabilities 6,035,255 3,586,008
Post employment benefits and accumulated vested sick leave 1,402,856 1,357,701
Total Liabilities and Regulatory Balances 82,719,910 80,763,164
Net Equity 32,728,724 30,688,232
Results of Operations:
Revenues 134,915,050 124,513,252
Operating expenses 131,747,870 121,017,174
Net income for the year and net movement in regulatory balances 3,167,180 3,496,078
The City's investment is comprised of the following:
Equity - Beginning of Year
Common Shares 23,895,512 23,895,512
Prior years accumulated net income 6,792,720 4,516,714
30,688,232 28,412,226
Net income (loss) for the year 3,167,180 3,496,078
Dividends (1,150,000) (1,150,000)
Other Comprehensive Income (Loss) 23,312 (70,072)
Change in equity for the year 2,040,492 2,276,006
Equity - End of year 32,728,724 30,688,232
Notes receivable 25,492,503 25,492,503
Net Investment 58,221,227 56,180,735
Page 12
Page 41

CORPORATION OF THE CITY OF BRANTFORD
NOTES TO THE CONSOLIDATED FINANCIAL STATEMENTSFor the year ended December 31, 2015
11. DEFERRED REVENUES - OBLIGATORY RESERVE FUNDS
A requirement of the public sector accounting standards of CPA Canada is that obligatory reserve funds bereported as deferred revenue. This requirement is in place as provincial legislation restricts how these fundsmay be used and under certain circumstances these funds may possibly be refunded. The balances in theobligatory reserve funds of the City are summarized as follows:
2015 2014
Development charges 36,207,745 27,492,767
Subdivision contributions 2,161,212 2,308,266
Recreational land (The Planning Act) 536,710 440,521
Federal gas tax revenues 7,754,933 7,259,243
Provincial gas tax revenues 2,933,151 2,858,453
Provincial roads and bridges capital funding 31,208 31,183
B-Home Housing Program 21,174 154,621
Building Code Act 3,305,684 2,789,285
52,951,817 43,334,339
Continuity of deferred revenue is as follows:2015 2014
Balance, beginning of year 43,334,339 46,413,329
Contributions from:
Federal gas tax 5,423,349 5,571,180
Provincial gas tax 1,214,095 622,493
Development charges act 9,461,629 5,468,032
Developers and others 581,790 879,028
Interest earned 1,057,153 899,131
Total revenue 17,738,016 13,439,864
Deferred revenue utilized:
Federal gas tax 5,100,697 8,006,497
Provincial gas tax 1,206,093 1,174,349
Development charges 1,445,302 7,115,341
Developers and others 368,446 222,667
Total deferred revenue utilized 8,120,538 16,518,854
Balance, end of year 52,951,817 43,334,339
Page 13
Page 42

CORPORATION OF THE CITY OF BRANTFORD
NOTES TO THE CONSOLIDATED FINANCIAL STATEMENTSFor the year ended December 31, 2015
12. POST EMPLOYMENT/RETIREMENT BENEFITS
The City provides certain employee benefits which will require funding in future periods. Under thesickleave benefit plan, unused sick leave can accumulate and employees may become entitled to a cashpayment when they leave the City’s employment. The City also has obligations for amounts owing toformer employees under the Workplace Safety and Insurance Board permanent partial disability pensionand for amounts owing under various benefit programs. An actuarial valuation of future liabilities wascompleted in January 2012 and forms the basis for the estimated liability reported in these financialstatements.
The weighted average assumptions used in the valuation were as follows:2015 2014
Discount rate 3.50% 3.50%
Average compensation increase 2.50% 2.50%
Healthcare cost increases
Initial rate 8.50% 9.00%
Ultimate rate 5.00% 5.00%
Grading period 14 years 15 years
Post Employment/Retirement Benefits
Medical,Dental,
LifeInsurance
Sick LeaveGratuity
DisabilityBenefits
TotalBenefits
2015
Total Benefits
2014
(Restated Note 2)
Accrued Benefit End of Prior Year 14,705,121 3,054,855 540,441 18,300,417 16,825,383
Adjustment to Accrued Benefit Obligationat Jan. 1 - - - - 307,261
Accrued Benefit Obligation at Jan. 1 14,705,121 3,054,855 540,441 18,300,417 17,132,644
Current Period Benefit Cost 740,960 227,503 - 968,463 866,190
Retirement Interest Expense 525,400 110,628 17,853 653,881 640,420
Estimated Benefit Payment (869,306) (243,143) (60,687) (1,173,136) (843,230)
(Gains) Losses (37,264) 186,515 123,747 272,998 504,393
Accrued Benefit Obligation as at December31 15,064,911 3,336,358 621,354 19,022,623 18,300,417
Unrecognized Gains (Losses) 2,702,902 (66,016) - 2,636,886 2,821,227
Liability as at December 31 17,767,813 3,270,342 621,354 21,659,509 21,121,644
The City and the Brantford Public Library have established reserves to mitigate the future impact of theseobligations, as disclosed in Note 26. The balance at the end of the year is $3,799,560 (2014 - $3,724,112).
Page 14
Page 43
CORPORATION OF THE CITY OF BRANTFORD
NOTES TO THE CONSOLIDATED FINANCIAL STATEMENTSFor the year ended December 31, 2015
13. LANDFILL CLOSURE AND POST CLOSURE LIABILITY
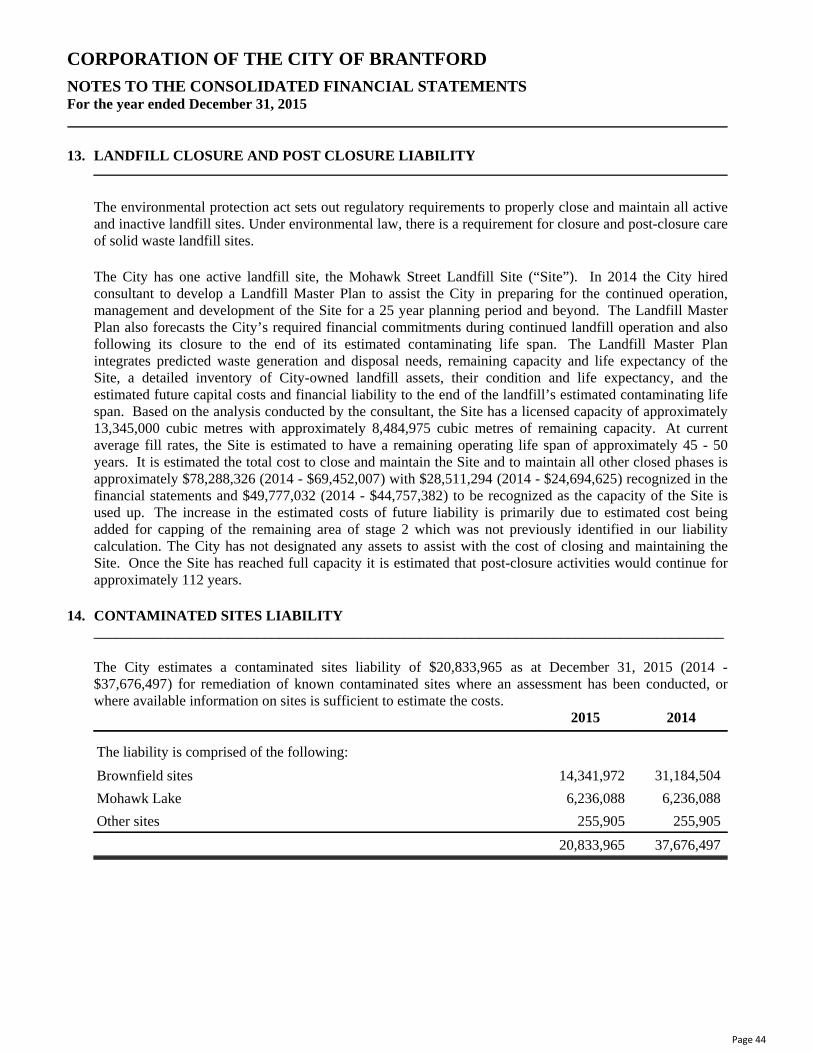
The environmental protection act sets out regulatory requirements to properly close and maintain all activeand inactive landfill sites. Under environmental law, there is a requirement for closure and post-closure careof solid waste landfill sites.
The City has one active landfill site, the Mohawk Street Landfill Site (“Site”). In 2014 the City hiredconsultant to develop a Landfill Master Plan to assist the City in preparing for the continued operation,management and development of the Site for a 25 year planning period and beyond. The Landfill MasterPlan also forecasts the City’s required financial commitments during continued landfill operation and alsofollowing its closure to the end of its estimated contaminating life span. The Landfill Master Planintegrates predicted waste generation and disposal needs, remaining capacity and life expectancy of theSite, a detailed inventory of City-owned landfill assets, their condition and life expectancy, and theestimated future capital costs and financial liability to the end of the landfill’s estimated contaminating lifespan. Based on the analysis conducted by the consultant, the Site has a licensed capacity of approximately13,345,000 cubic metres with approximately 8,484,975 cubic metres of remaining capacity. At currentaverage fill rates, the Site is estimated to have a remaining operating life span of approximately 45 - 50years. It is estimated the total cost to close and maintain the Site and to maintain all other closed phases isapproximately $78,288,326 (2014 - $69,452,007) with $28,511,294 (2014 - $24,694,625) recognized in thefinancial statements and $49,777,032 (2014 - $44,757,382) to be recognized as the capacity of the Site isused up. The increase in the estimated costs of future liability is primarily due to estimated cost beingadded for capping of the remaining area of stage 2 which was not previously identified in our liabilitycalculation. The City has not designated any assets to assist with the cost of closing and maintaining theSite. Once the Site has reached full capacity it is estimated that post-closure activities would continue forapproximately 112 years.
14. CONTAMINATED SITES LIABILITY _____________________________________________________________________________________
The City estimates a contaminated sites liability of $20,833,965 as at December 31, 2015 (2014 -$37,676,497) for remediation of known contaminated sites where an assessment has been conducted, orwhere available information on sites is sufficient to estimate the costs.
2015 2014
The liability is comprised of the following:
Brownfield sites 14,341,972 31,184,504
Mohawk Lake 6,236,088 6,236,088
Other sites 255,905 255,905
20,833,965 37,676,497
Page 15
Page 44

CORPORATION OF THE CITY OF BRANTFORD
NOTES TO THE CONSOLIDATED FINANCIAL STATEMENTSFor the year ended December 31, 2015
14. CONTAMINATED SITES LIABILITY (continued)
The liability was calculated using a present value technique with a discount rate of 1.60%. The estimatedtotal undiscounted expenditures for 2015 is $21,383,247 (2014 - $38,225,779). The liabilities result fromyears of industrial contamination that occurred throughout the 1900’s. The contamination of Mohawk Lakewas the result of storm water drainage and industrial run-off from former manufacturing companies locatedin the Greenwich-Mohawk area. The assumptions and basis of measurement used in estimating the liabilityinclude past land usage, the nature and level of contamination, current land use, length of time to remediatethe site, engineer cost estimates, environmental site assessments and analysis from staff reports.
The amount of estimated recoveries from the Federal Government is $9,640,422 (2014 - $9,640,422);however, completion of the Greenwich-Mohawk remediation project must occur by December 31, 2016 inorder to receive this funding.
15. PENSION AGREEMENTS
Contributions are made to the Ontario Municipal Employees Retirement System (“OMERS”), which is amulti-employer plan, on behalf of all permanent, full-time members of its staff. The plan is a definedbenefit plan which specifies the amount of the retirement benefit to be received by the employees based onthe length of service and rates of pay.
The employer's amount contributed to OMERS for 2015 was $9,112,365 (2014 - $8,988,740) for currentand past service. Employees’ contributions to OMERS in 2015 totalled $9,112,365 (2014 - $8,988,740).
The OMERS pension plan funded ratio, a key indicator of the long-term financial health of the plan,increased in 2015 to 91.50% (2014 - 90.80%) The program deficit in 2015 dropped to $7.0 billion (2014$7.1 billion). With this decrease in deficit OMERS remains on track to being fully funded by 2025.
16. NET LONG TERM LIABILITIES
(a) The balance of the net long term liabilities reported on the consolidated statement of financial position ismade up as follows:
2015 2014
Total long term liabilities incurred by the municipality, including thoseincurred on behalf of school boards, other municipalities and municipalenterprises and outstanding at the end of the year amounted to 43,713,876 37,795,207
The long-term liabilities carry interest rates ranging from 1.12% to 6.875%.
Page 16
Page 45

CORPORATION OF THE CITY OF BRANTFORD
NOTES TO THE CONSOLIDATED FINANCIAL STATEMENTSFor the year ended December 31, 2015
16. NET LONG TERM LIABILITIES (continued)
(b) The net long term liabilities reported in (a) of this note are payable as follows: 2016 to 2020 After 2020
From benefiting landowners and user rates 10,208,385 31,121,864
From consolidated municipal enterprises 1,215,631 740,036
From the County of Brant 49,597 378,363
11,473,613 32,240,263
(c) For the long-term liabilities in (a) of this note, the annual principal payments over the next five yearsand thereafter are as follows:
2016 2,185,943
2017 2,272,604
2018 2,338,378
2019 2,374,316
2020 2,302,372
11,473,613
(d) Included in the long term liabilities are the Municipal Non-Profit Housing Corporation mortgagespayable to the Canadian Mortgage and Housing Corporation for the corporation’s properties; BeckettProject and Branlyn Meadows Project. The buildings are pledged as security for the mortgages. Themortgages are summarized as follows:
2015 2014
Beckett Project
1.12% first mortgage loan to Canada Mortgage and Housing Corporation,due September 2019, payable in monthly installments of $18,607.39 onaccount of principal and interest 819,620 1,031,152
Branlyn Meadows Project
4.37% first mortgage loan to Canada Mortgage and Housing Corporation,due March 2018, payable in monthly installments of $10,023 on accountof principal and interest 1,136,047 1,205,489
1,955,667 2,236,641
(e) As at December 31, 2015, the City held $3,530,582 (2014 - $3,954,041) of the net long term liabilitiesoutstanding.
Page 17
Page 46

CORPORATION OF THE CITY OF BRANTFORD
NOTES TO THE CONSOLIDATED FINANCIAL STATEMENTSFor the year ended December 31, 2015
16. NET LONG TERM LIABILITIES (continued)
(f) The long term liabilities in (a) issued in the name of the Municipality have received approval of theOntario Municipal Board for those approved on or before December 31, 1992. Those approved afterJanuary 1, 1993 have been approved by by-law. The annual principal and interest payments required toservice these liabilities are within the annual debt repayment limit prescribed by the Ministry of MunicipalAffairs and Housing.
17. CHARGES FOR NET LONG TERM LIABILITIES 2015 2014
Total charges for the year for net long term liabilities are as follows:
Principal 3,413,331 3,266,938
Interest 1,535,145 1,651,685
4,948,476 4,918,623
18. ACCUMULATED SURPLUS
Accumulated surplus consists of the following:2015 2014
(Restated Note 2)
For the General Reduction of Taxation:
City - operating fund 200,638 (197,619)
Brantford Downtown Business Improvement Area 3,233 9,092
Brantford Municipal Non-Profit Housing Corporation 27,841 21,076
231,712 (167,451)
Capital fund balance 15,546,389 26,384,601
Brantford Energy Corporation net investment 58,221,227 56,180,735
Reserves 2,418,763 2,109,050
Reserve funds 121,498,485 106,137,730
Invested in tangible capital assets 705,483,548 704,329,844
Invested in land inventory 7,368,653 8,956,820
Prepaid Expense - 1 Market Square Lease 5,026,667 5,800,000
915,563,732 909,898,780
Unfunded liabilities 114,748,841 121,294,194
801,046,603 788,437,135
Page 18
Page 47

CORPORATION OF THE CITY OF BRANTFORD
NOTES TO THE CONSOLIDATED FINANCIAL STATEMENTSFor the year ended December 31, 2015
19. TAXATION _____________________________________________________________________________________
Taxation revenue, reported on the Consolidated Statement of Operations, is made up of the following:
2015 2014
Municipal and school property taxes 165,860,292 164,490,602
Payments in lieu of taxes 4,332,513 3,942,364
Net Property Taxes 170,192,805 168,432,966
Requisitions 36,113,495 37,143,467
Taxation revenue available for municipal purposes 134,079,310 131,289,499
20. USER CHARGES 2015 2014
User charges are comprised of the following:
Environmental services 41,938,142 43,364,522
General government 756,561 755,060
Health services 349,577 340,564
Planning and development 579,328 553,323
Protection services 643,545 510,333
Recreation and cultural services 6,979,400 6,721,709
Social and family services 468,561 546,334
Social Housing 123,372 129,549
Transportation services 3,785,761 3,856,843
55,624,247 56,778,237
Page 19
Page 48

CORPORATION OF THE CITY OF BRANTFORD
NOTES TO THE CONSOLIDATED FINANCIAL STATEMENTSFor the year ended December 31, 2015
21. GOVERNMENT TRANSFERS _____________________________________________________________________________________
Government transfers, reported on the Consolidated Statement of Operations, is made up of the following:2015 2014
Provincial Grants:
Protection services 1,895,207 1,531,902
Transportation services 3,096,783 2,452,276
Environmental services 919,311 774,490
Social and family services 43,633,913 42,116,273
Social Housing 1,768,846 2,103,206
Recreation and cultural services 336,944 728,686
Planning and development 161,550 106,648
Provincial Total 51,812,554 49,813,481
Federal Grants:
Transportation services 4,949,153 7,763,585
Environmental services 4,094 118,017
Social and family services 165,244 104,377
Social Housing 1,449,066 1,616,111
Recreation and cultural services 283,157 480,608
Planning and development 1,350 1,373,810
Federal Total 6,852,064 11,456,508
Other Municipalities Grants:
General Government 2,087 2,317
Protection services 11,767 17,816
Environmental services 506,515 453,267
Social and family services 1,597,213 1,749,750
Social Housing 1,748,056 1,734,211
Recreation and cultural services 5,088 5,937
Planning and development 25,710 15,987
Other Municipalities Total 3,896,436 3,979,285
Total 62,561,054 65,249,274
Page 20
Page 49

CORPORATION OF THE CITY OF BRANTFORD
NOTES TO THE CONSOLIDATED FINANCIAL STATEMENTSFor the year ended December 31, 2015
22. INCOME FROM BRANTFORD ENERGY CORPORATION
Income from Brantford Energy Corporation received by the City is comprised of the following sources:
2015 2014
Interest earned on promissory notes 1,501,362 1,501,362
Dividend received from Brantford Energy Corporation 1,150,000 1,150,000
2,651,362 2,651,362
23. OTHER REVENUES
Other revenues received by the City are comprised of the following sources: 2015 2014
Sale of non inventory items 1,745,076 3,254,982
Donations 670,991 463,573
Transfer from trust funds 118,353 123,570
Loss on disposal of tangible capital assets, inventory and land held forresale (112,520) (7,534,461)
Service Level Agreements 1,382,682 1,742,483
Other recoveries and rebates 4,331,661 4,522,307
8,136,243 2,572,454
24. EMPLOYEE COMPENSATION
The Public Sector Salary Disclosure Act, 1996, requires municipalities to disclose annually the names,positions, salaries and taxable benefits of employees paid $100,000 or more in 2015. In 2015 the City ofBrantford had 118 employees paid $100,000 or more in the calendar year. This information was publishedin the Brantford Expositor and can also be found on the Ministry of Finance website at:
https://www.ontario.ca/page/public-sector-salary-disclosure-2015-all-sectors-and-seconded-employees
Page 21
Page 50

CORPORATION OF THE CITY OF BRANTFORD
NOTES TO THE CONSOLIDATED FINANCIAL STATEMENTSFor the year ended December 31, 2015
25. OPERATIONS OF SCHOOL BOARDS
Further to Note 1(a)(iv), the taxation, other revenues and requisitions and the overlevies (underlevies) of theschool boards are comprised of the following:
2015 2014
Taxation and user charges 36,113,495 37,143,467
Requisitions 36,113,495 37,143,467
Overlevies (Underlevies) - end of year - -
26. RESERVES AND RESERVE FUNDS
The total balance of reserves and reserve funds of $2,418,763 (2014 - $2,109,050) and $121,498,485 (2014- $106,137,730) respectively is made up of the following:
2015 2014
Reserves set aside for specific purposes by Council:
Library - sick leave 180,449 192,093
Library - other 2,238,314 1,916,957
Total Reserves 2,418,763 2,109,050
Reserve funds set aside for specific purposes by Council:
Replacement of equipment 1,477,201 1,835,481
Sick leave 3,619,111 3,532,019
Insurance 2,933,092 3,028,002
Social housing 6,772,178 7,873,590
Protection services 2,420,067 2,231,120
Transportation 5,324,977 5,083,852
Wastewater 33,732,003 27,119,794
Waste disposal 2,140,157 2,039,902
Industrial development 3,400,557 2,148,000
Water 35,828,680 30,104,399
Brownfields 2,503,484 2,468,695
Contingencies 2,395,150 2,395,515
Other 18,951,828 16,277,361
Total Reserve Funds 121,498,485 106,137,730
Total Reserves and Reserve Funds 123,917,248 108,246,780
Page 22
Page 51

CORPORATION OF THE CITY OF BRANTFORD
NOTES TO THE CONSOLIDATED FINANCIAL STATEMENTSFor the year ended December 31, 2015
27. BUDGET FIGURES
The budget data presented in these consolidated financial statements are based upon the 2015 operatingbudget approved by Council. The budget that was approved by Council was not prepared on a basisconsistent with that used to report actual consolidated financial statement results. The budget was approvedon a modified accrual basis while Public Sector Accounting Standards now require a full accrual basis. Thechart below reconciles the approved budget to the budget figures reported in these consolidated financialstatements. In addition, to ensure comparability of expenses, the allocation of program support costscompleted for actual reporting was also applied to the budget amounts.
City Council net approved budget $ 0
Approved Consolidated Local Board budgets (569,341)
Add
Capital project revenues 3,599,286
Interest earned on reserves and reserve funds 2,611,766
Contributed assets 1,316,950
Operating expenses resulting in tangible capital assets 434,460
Capital project recoveries 890,254
Deferred revenue earned 8,120,540
Net Transfers (from) to reserves and reserve funds 32,259,467
Debt principal repayments 3,467,063
Change in equity in Brantford Energy Corporation 2,364,493
Less
Loss on sale of tangible capital assets (112,520)
Interest on long term debt (15,658)
Capital project cost resulting in operating expenses (5,275,734)
Amortization (32,452,833)
Employee post employment benefits (530,090)
Landfill closure and post-closure (3,816,669)
1 Market Square Lease (773,333)
Budget Surplus (Full Accrual) 11,518,101
28. COMPARATIVE FIGURES
Certain of the prior year's figures, provided for purpose of comparison, have been reclassified to conform tothe current year's statement presentation.
Page 23
Page 52

CORPORATION OF THE CITY OF BRANTFORD
NOTES TO THE CONSOLIDATED FINANCIAL STATEMENTSFor the year ended December 31, 2015
29. CONTINGENT LIABILITIES
(a) Corporation of the City of Brantford
(i) An action has been commenced against the City alleging an ongoing duty to consult with aboriginalpersons. The amount and nature of the possible outcome is not determinable at this time and, as a result, noprovision has been made in the financial statements.
(ii) Certain claims have been commenced against the City related to property expropriation. The amountand nature of the possible outcome is not determinable at this time and as a result no provision has beenmade in the financial statements.
(iii) A claim has been commenced against the City by an individual. The claim relates to the City's allegedinvolvement with a property developer and related corporations. The amount and nature of the possibleoutcome is not determinable at this time and, as a result, no provision has been made in the financialstatements. The action is being defended by the City.
(iv) The City has been named as a defendant in an action by a corporation alleging unjust enrichmentfurther to a construction project involving the installation of water and sewer services under the MohawkCanal. The amount and nature of any outcome cannot be determined at this time and, as a result, noprovision has been made in these financial statements. The action is being defended by the City.
(v) A claim has been commenced against the City by an individual. The claim relates to the City's allegednegligence in maintaining its sidewalks. The amount and nature of the possible outcome is notdeterminable at this time and, as a result, no provision has been made in the financial statements. Theaction is being defended by the City.
(vi) A claim has been filed against the City alleging it had no right to levy taxes on lands held in trust for anaboriginal band as the lands were exempt from taxation. The amount and nature of any outcome cannot bedetermined at this time and as a result, no provision has been made in these financial statements.
(vii) A claim has been commenced against the City by a corporation. The claim relates to procurementissues with respect to the City’s tender of the landfill management contract. The amount and nature of thepossible outcome is not determinable at this time, and, as a result, no provision has been made in thefinancial statements. The action is being defended by the City
(viii) A claim has been commenced against the City by an individual alleging property damaged caused bythe City's improper seizure of a vehicle. The amount and nature of the possible outcome is notdeterminable at this time and, as a result, no provision has been made in the financial statements. Theaction is being defended by the City.
Page 24
Page 53

CORPORATION OF THE CITY OF BRANTFORD
NOTES TO THE CONSOLIDATED FINANCIAL STATEMENTSFor the year ended December 31, 2015
29. CONTINGENT LIABILITIES (continued)
(b) Brantford Energy Corporation
(i) General Liability Insurance - The Company has obtained general liability and enhanced directors andofficers insurance coverage from the Municipal Electric Association Reciprocal Insurance Exchange (TheMearie Group) expiring January 1, 2017. The Mearie Group is an insurance reciprocal whereby allmembers through the unincorporated group share risks with each other. Members of the Mearie Group areassessed a premium deposit at policy execution. Should the group experience losses that are in excess ofthe accumulated premium deposits of its members combined with reserves and supplementary insurance,members would be assessed a supplementary or retro assessment on a pro-rata basis for the years in whichthe Company was a member.
As at December 31, 2015, the Company has not been made aware of any additional assessments.Participation in The Mearie Group covers a three year underwriting period which expires on January 1,2016.
(ii) General - From time to time, the Company is involved in various litigation matters arising in theordinary course of its business. The Company has no reason to believe that the disposition of any suchcurrent matter could reasonably be expected to have a materially adverse impact on the Company's financialposition, results of operations or its ability to carry on any of its business activities.
30. CONTRACTUAL OBLIGATIONS AND COMMITMENTS
(a) Corporation of the City of Brantford
(i) Wilfrid Laurier University
Through an agreement in 2011, the City has committed a grant for the development of a new AcademicCentre. The grant in the amount of $1,300,000 is to be paid to the University in annual instalments. Theremaining amount will be paid as follows:
$175,000 for years 2016 to 2017$150,000 for the year 2018
(ii) St. Joseph’s Health Care System
Through an extension of the agreement in 2014, the City has committed to subsidize $1,720,800 for theoperation of the St. Joseph’s Lifecare Centre until 2018. The amount of annual subsidy will be paid asfollows:
$516,240 for the year 2016$344,160 for the year 2017$172,080 for the year 2018
Page 25
Page 54

CORPORATION OF THE CITY OF BRANTFORD
NOTES TO THE CONSOLIDATED FINANCIAL STATEMENTSFor the year ended December 31, 2015
30. CONTRACTUAL OBLIGATIONS AND COMMITMENTS (continued)
(a) Corporation of the City of Brantford (continued)
(iii) YMCA/Laurier Project
Through an agreement in 2014, the City has committed a grant to Wilfrid Laurier University and TheYMCA of Hamilton/Burlington/Brantford for the construction of the Laurier Brantford YMCA AthleticComplex. The grant in the amount of $5,210,000 is to be paid in annual instalments. Commencing in2016, $521,000 will be paid annually over 10 years.
(iv) Financing Leases
The City has entered into financing leases for various equipment, vehicles, and properties with annual leasepayments as follows:
2016 - $1,660,714 2017 - $1,404,532 2018 - $1,281,625
2019 - $1,187,968 2020 to 2024 - $5,860,653
(b) Brantford Energy Corporation
(i) The Company has contracted Wajax Power Systems (Wajax) to provide operations and maintenanceservices for an initial period of ten years expiring in 2020. The Company also has an option to extend theterm of these services for an additional ten years. The annual amount due to Wajax for these services isapproximately $700,000.
(ii) The Company has also entered into an agreement with the City allowing the Company access to theMohawk Street landfill to install, operate and maintain a landfill gas collection and utilization system. Thisagreement expires August 22, 2030.
31. SUBSEQUENT EVENTS ___________________________________________________________________________________
Boundary Adjustments
On January 6, 2016 the City of Brantford and the County of Brant signed a Memorandum of Understanding(MOU) that establishes the basis of a formal boundary agreement between both municipalities. This MOUstates the total land to be transferred to the City is 2,454 hectares.
Brantford Generation Inc.
On March 29, 2016 City Council approved the purchase of all assets of Brantford Generation Inc. for$3,250,000. Included in the transaction is the transfer of all operational obligations and related agreementsrelated to the Mohawk Street Landfill Gas Generation Project pending the necessary regulatory approvals.
Page 26
Page 55

CORPORATION OF THE CITY OF BRANTFORD
TANGIBLE CAPITAL ASSETS - CONTINUITY SCHEDULE SCHEDULE 1
For the year ended December 31, 2015 Land
LandImprovements Building
Machinery& Equipment Infrastructure
Assets UnderConstruction
2015 Total(incl WIP)
2014 Total(incl WIP)
Total Historical Cost:
Balance: Beginning of year 34,608,640 54,425,963 278,197,179 78,690,293 824,901,100 10,497,068 1,281,320,244 1,255,870,272
Add: Additions during the year 99,549 1,254,787 3,066,139 6,788,555 24,027,860 10,140,125 45,377,015 36,835,669
Less: Disposals during the year - 368,518 17,687 3,241,968 1,263,145 9,682,622 14,573,940 11,385,697
Balance: End of year 34,708,190 55,312,232 281,245,631 82,236,880 847,665,815 10,954,571 1,312,123,319 1,281,320,244
Accumulated Amortization
Balance: Beginning of year 169,852 27,552,517 142,132,877 47,870,215 359,264,939 - 576,990,400 548,582,068
Add: Amortization expense - 2,105,596 7,985,570 6,213,032 17,944,630 - 34,248,827 33,525,944
Less: Accumulated amortization on disposals - 312,340 17,687 3,126,679 1,142,751 - 4,599,456 5,117,612
Balance: End of year 169,852 29,345,773 150,100,760 50,956,568 376,066,818 - 606,639,771 576,990,400
Total: NET BOOK VALUE 34,538,338 25,966,459 131,144,872 31,280,312 471,598,997 10,954,571 705,483,548 704,329,844
The accompanying notes are an integral part of these financial statements.Page 27
Page 56
CORPORATION OF THE CITY OF BRANTFORD
SEGMENTED INFORMATION SCHEDULE 2
The City of Brantford is a single tier municipality that provides a wide range of services to its citizens. The major services chosen for segmented disclosureare those for which the percentage of annual operating expenditures is greater than 10% of the Corporation’s total operating expenditures. The revenues andexpenditures reported for each segment includes directly attributable amounts as well as internal charges and recoveries allocated on a reasonable basis. Adescription of each major service and the activities each provide are as follows:
Protection Services
Protection services enhances the quality of life for all citizens and responds to their changing needs by ensuring and promoting public safety in partnershipwith our community. Services provided include fire prevention and suppression, crime prevention, bylaw enforcement, court security, prisonertransportation, protective inspection and control, building permit and inspection services, emergency measures, and administration of the ProvincialOffences Act.
Social and Family Services
Social and Family services ensures a healthy community by providing a social infrastructure to the Citizens of Brantford. Services include generalassistance, income support, employment assistance, childcare, affordable housing and assistance to aged persons.
Transportation Services
The Transportation services department is responsible for the safe and efficient movement of people and goods within the City of Brantford.Responsibilities include road construction and maintenance, traffic signals and signs, winter control, transit operation, developing parking and traffic controlbylaws, implementation and maintenance of street lighting, and management and maintenance of parking garages and lots.
Environmental Services
Environmental services include sanitary sewer system, storm sewer system, waterworks, waste collection, waste disposal and recycling. Responsibilitiesinclude water treatment and maintenance, water distribution, water quality, water conservation, the water pollution control plant, pumping stations, pollutioncontrol, storm and sanitary sewer maintenance, curbside garbage collection, waste diversion, yard waste management, household hazardous waste dayevents and landfill site operations.
Recreation and Cultural Services
This segment includes parks, recreation programs, recreation facilities, golf courses, libraries and cultural services. Responsibilities include managementand provision of recreational services, facilities and programs, administration and maintenance of the main library and St. Paul Avenue branch, operationand maintenance of two public golf courses, preservation of art galleries, museums and the Sanderson Centre for the Performing Arts.
The accompanying notes are an integral part of these financial statements.Page 28
Page 57
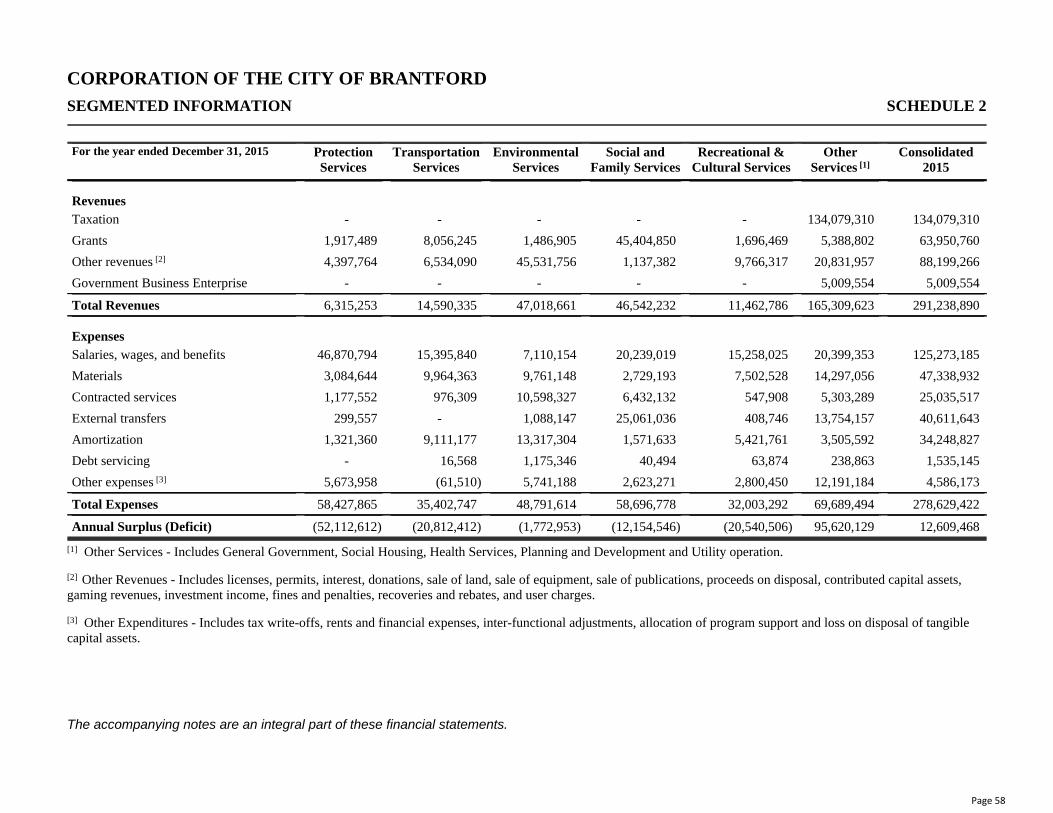
CORPORATION OF THE CITY OF BRANTFORD
SEGMENTED INFORMATION SCHEDULE 2
For the year ended December 31, 2015 ProtectionServices
TransportationServices
EnvironmentalServices
Social andFamily Services
Recreational &Cultural Services
OtherServices [1]
Consolidated2015
RevenuesTaxation - - - - - 134,079,310 134,079,310
Grants 1,917,489 8,056,245 1,486,905 45,404,850 1,696,469 5,388,802 63,950,760
Other revenues [2] 4,397,764 6,534,090 45,531,756 1,137,382 9,766,317 20,831,957 88,199,266
Government Business Enterprise - - - - - 5,009,554 5,009,554
Total Revenues 6,315,253 14,590,335 47,018,661 46,542,232 11,462,786 165,309,623 291,238,890
ExpensesSalaries, wages, and benefits 46,870,794 15,395,840 7,110,154 20,239,019 15,258,025 20,399,353 125,273,185
Materials 3,084,644 9,964,363 9,761,148 2,729,193 7,502,528 14,297,056 47,338,932
Contracted services 1,177,552 976,309 10,598,327 6,432,132 547,908 5,303,289 25,035,517
External transfers 299,557 - 1,088,147 25,061,036 408,746 13,754,157 40,611,643
Amortization 1,321,360 9,111,177 13,317,304 1,571,633 5,421,761 3,505,592 34,248,827
Debt servicing - 16,568 1,175,346 40,494 63,874 238,863 1,535,145
Other expenses [3] 5,673,958 (61,510) 5,741,188 2,623,271 2,800,450 12,191,184 4,586,173
Total Expenses 58,427,865 35,402,747 48,791,614 58,696,778 32,003,292 69,689,494 278,629,422
Annual Surplus (Deficit) (52,112,612) (20,812,412) (1,772,953) (12,154,546) (20,540,506) 95,620,129 12,609,468
[1] Other Services - Includes General Government, Social Housing, Health Services, Planning and Development and Utility operation.
[2] Other Revenues - Includes licenses, permits, interest, donations, sale of land, sale of equipment, sale of publications, proceeds on disposal, contributed capital assets,gaming revenues, investment income, fines and penalties, recoveries and rebates, and user charges.
[3] Other Expenditures - Includes tax write-offs, rents and financial expenses, inter-functional adjustments, allocation of program support and loss on disposal of tangiblecapital assets.
The accompanying notes are an integral part of these financial statements.Page 29
Page 58
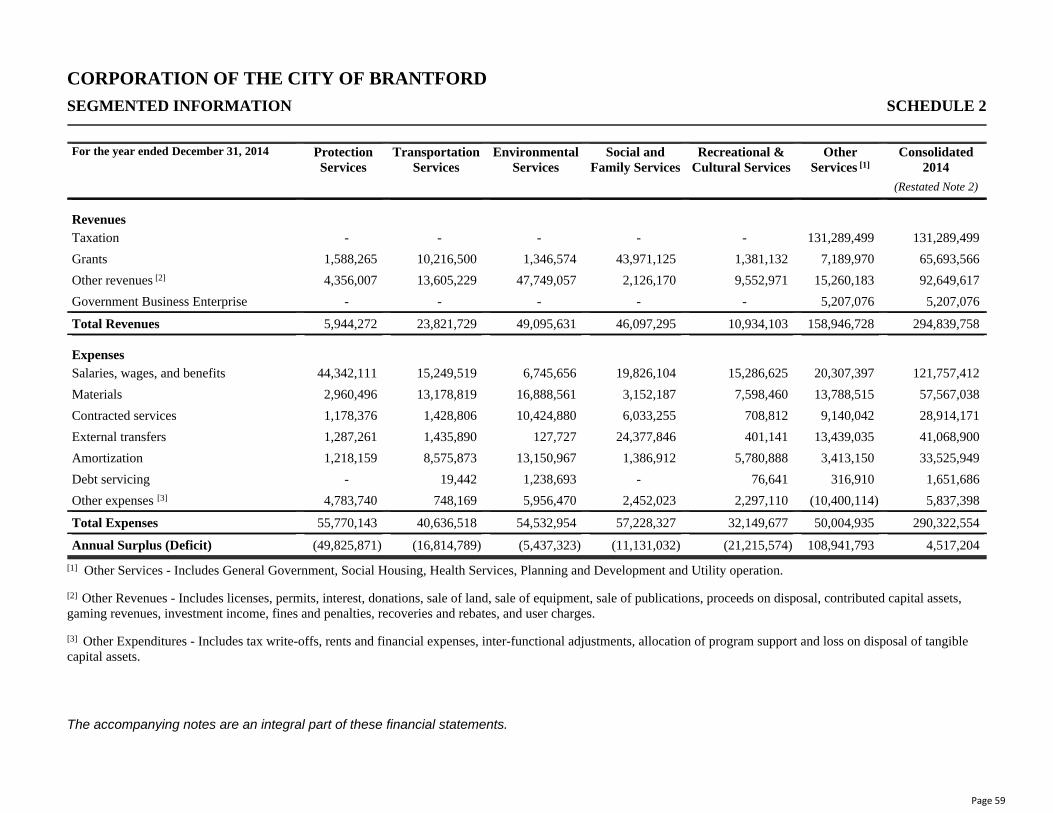
CORPORATION OF THE CITY OF BRANTFORD
SEGMENTED INFORMATION SCHEDULE 2
For the year ended December 31, 2014 ProtectionServices
TransportationServices
EnvironmentalServices
Social andFamily Services
Recreational &Cultural Services
OtherServices [1]
Consolidated2014
(Restated Note 2)
RevenuesTaxation - - - - - 131,289,499 131,289,499
Grants 1,588,265 10,216,500 1,346,574 43,971,125 1,381,132 7,189,970 65,693,566
Other revenues [2] 4,356,007 13,605,229 47,749,057 2,126,170 9,552,971 15,260,183 92,649,617
Government Business Enterprise - - - - - 5,207,076 5,207,076
Total Revenues 5,944,272 23,821,729 49,095,631 46,097,295 10,934,103 158,946,728 294,839,758
ExpensesSalaries, wages, and benefits 44,342,111 15,249,519 6,745,656 19,826,104 15,286,625 20,307,397 121,757,412
Materials 2,960,496 13,178,819 16,888,561 3,152,187 7,598,460 13,788,515 57,567,038
Contracted services 1,178,376 1,428,806 10,424,880 6,033,255 708,812 9,140,042 28,914,171
External transfers 1,287,261 1,435,890 127,727 24,377,846 401,141 13,439,035 41,068,900
Amortization 1,218,159 8,575,873 13,150,967 1,386,912 5,780,888 3,413,150 33,525,949
Debt servicing - 19,442 1,238,693 - 76,641 316,910 1,651,686
Other expenses [3] 4,783,740 748,169 5,956,470 2,452,023 2,297,110 (10,400,114) 5,837,398
Total Expenses 55,770,143 40,636,518 54,532,954 57,228,327 32,149,677 50,004,935 290,322,554
Annual Surplus (Deficit) (49,825,871) (16,814,789) (5,437,323) (11,131,032) (21,215,574) 108,941,793 4,517,204
[1] Other Services - Includes General Government, Social Housing, Health Services, Planning and Development and Utility operation.
[2] Other Revenues - Includes licenses, permits, interest, donations, sale of land, sale of equipment, sale of publications, proceeds on disposal, contributed capital assets,gaming revenues, investment income, fines and penalties, recoveries and rebates, and user charges.
[3] Other Expenditures - Includes tax write-offs, rents and financial expenses, inter-functional adjustments, allocation of program support and loss on disposal of tangiblecapital assets.
The accompanying notes are an integral part of these financial statements.Page 30
Page 59
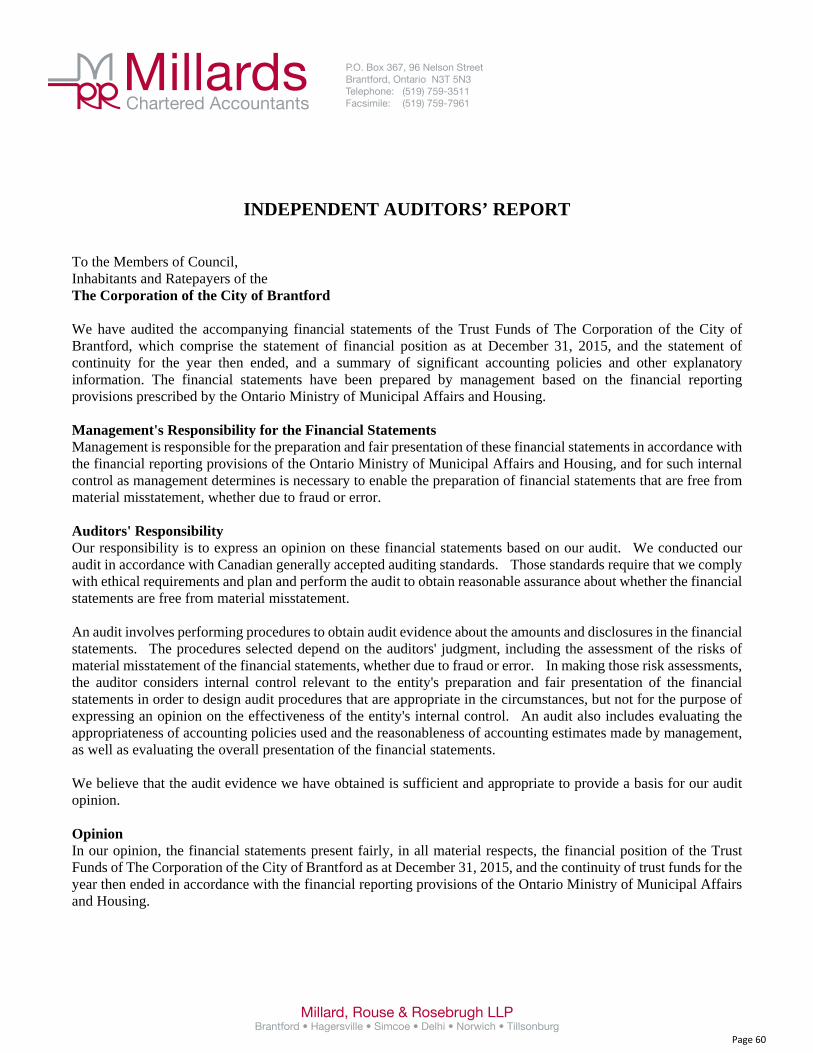
Millard, Rouse & Rosebrugh LLPBrantford • Hagersville • Simcoe • Delhi • Norwich • Tillsonburg
MillardsChartered Accountants
P.O. Box 367, 96 Nelson StreetBrantford, Ontario N3T 5N3Telephone: (519) 759-3511Facsimile: (519) 759-7961
Page 1
INDEPENDENT AUDITORS’ REPORT To the Members of Council, Inhabitants and Ratepayers of the The Corporation of the City of Brantford We have audited the accompanying financial statements of the Trust Funds of The Corporation of the City of Brantford, which comprise the statement of financial position as at December 31, 2015, and the statement of continuity for the year then ended, and a summary of significant accounting policies and other explanatory information. The financial statements have been prepared by management based on the financial reporting provisions prescribed by the Ontario Ministry of Municipal Affairs and Housing. Management's Responsibility for the Financial Statements Management is responsible for the preparation and fair presentation of these financial statements in accordance with the financial reporting provisions of the Ontario Ministry of Municipal Affairs and Housing, and for such internal control as management determines is necessary to enable the preparation of financial statements that are free from material misstatement, whether due to fraud or error. Auditors' Responsibility Our responsibility is to express an opinion on these financial statements based on our audit. We conducted our audit in accordance with Canadian generally accepted auditing standards. Those standards require that we comply with ethical requirements and plan and perform the audit to obtain reasonable assurance about whether the financial statements are free from material misstatement. An audit involves performing procedures to obtain audit evidence about the amounts and disclosures in the financial statements. The procedures selected depend on the auditors' judgment, including the assessment of the risks of material misstatement of the financial statements, whether due to fraud or error. In making those risk assessments, the auditor considers internal control relevant to the entity's preparation and fair presentation of the financial statements in order to design audit procedures that are appropriate in the circumstances, but not for the purpose of expressing an opinion on the effectiveness of the entity's internal control. An audit also includes evaluating the appropriateness of accounting policies used and the reasonableness of accounting estimates made by management, as well as evaluating the overall presentation of the financial statements. We believe that the audit evidence we have obtained is sufficient and appropriate to provide a basis for our audit opinion. Opinion In our opinion, the financial statements present fairly, in all material respects, the financial position of the Trust Funds of The Corporation of the City of Brantford as at December 31, 2015, and the continuity of trust funds for the year then ended in accordance with the financial reporting provisions of the Ontario Ministry of Municipal Affairs and Housing.
Page 60

Page 2
Basis of Accounting and Restriction on Use Without modifying our opinion, we draw attention to Note 1 to the financial statements, which describes the basis of accounting. The financial statements are prepared to assist The Corporation of the City of Brantford to comply with the reporting provisions of the Ministry of Municipal Affairs and Housing. As a result, the financial statements may not be suitable for another purpose. Our report is intended solely for The Corporation of the City of Brantford and Ministry of Municipal Affairs and Housing and should not be used by parties other than The Corporation of the City of Brantford and Ministry of Municipal Affairs and Housing. March 16, 2016 CHARTERED PROFESSIONAL ACCOUNTANTS Brantford, Ontario Licensed Public Accountants
Page 61

See accompanying notes Page3
THE CORPORATION OF THE CITY OF BRANTFORD Trust Funds STATEMENT OF FINANCIAL POSITION
As at December 31 2015 2014
ASSETS
Current Assets
Cash (Note 2) 1,425,036 1,268,376
Investments - at cost (Note 3)
Municipal - own 1,237,559 1,340,048
External - Banks 1,202,950 1,203,294
Accrued interest on investments 38,630 35,688
Inventory 4,593 4,593
3,908,768 3,851,999
LIABILITIES
Due to the City of Brantford 28,164 30,407
FUND BALANCE 3,880,604 3,821,592
3,908,768 3,851,999
Page 62
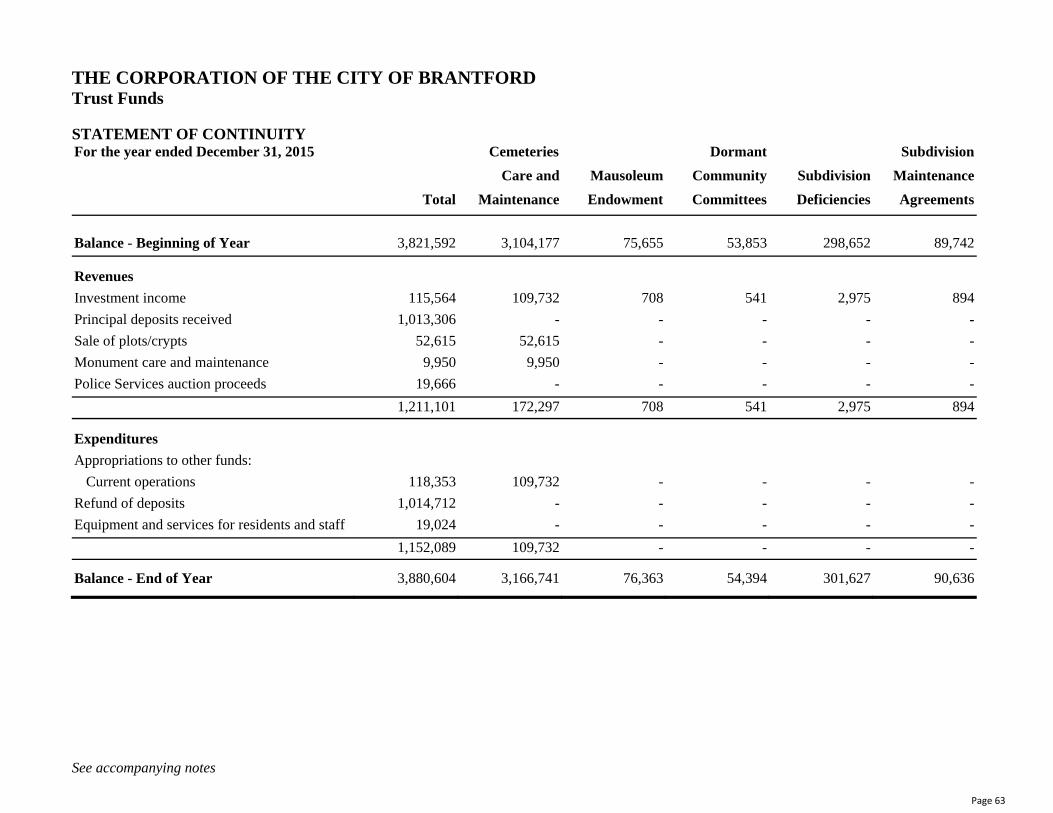
See accompanying notes Page4
THE CORPORATION OF THE CITY OF BRANTFORD Trust Funds STATEMENT OF CONTINUITY For the year ended December 31, 2015 Cemeteries Dormant Subdivision
Care and Mausoleum Community Subdivision Maintenance
Total Maintenance Endowment Committees Deficiencies Agreements
Balance - Beginning of Year 3,821,592 3,104,177 75,655 53,853 298,652 89,742
Revenues
Investment income 115,564 109,732 708 541 2,975 894
Principal deposits received 1,013,306 - - - - -
Sale of plots/crypts 52,615 52,615 - - - -
Monument care and maintenance 9,950 9,950 - - - -
Police Services auction proceeds 19,666 - - - - -
1,211,101 172,297 708 541 2,975 894
Expenditures
Appropriations to other funds:
Current operations 118,353 109,732 - - - -
Refund of deposits 1,014,712 - - - - -
Equipment and services for residents and staff 19,024 - - - - -
1,152,089 109,732 - - - -
Balance - End of Year 3,880,604 3,166,741 76,363 54,394 301,627 90,636
Page 63
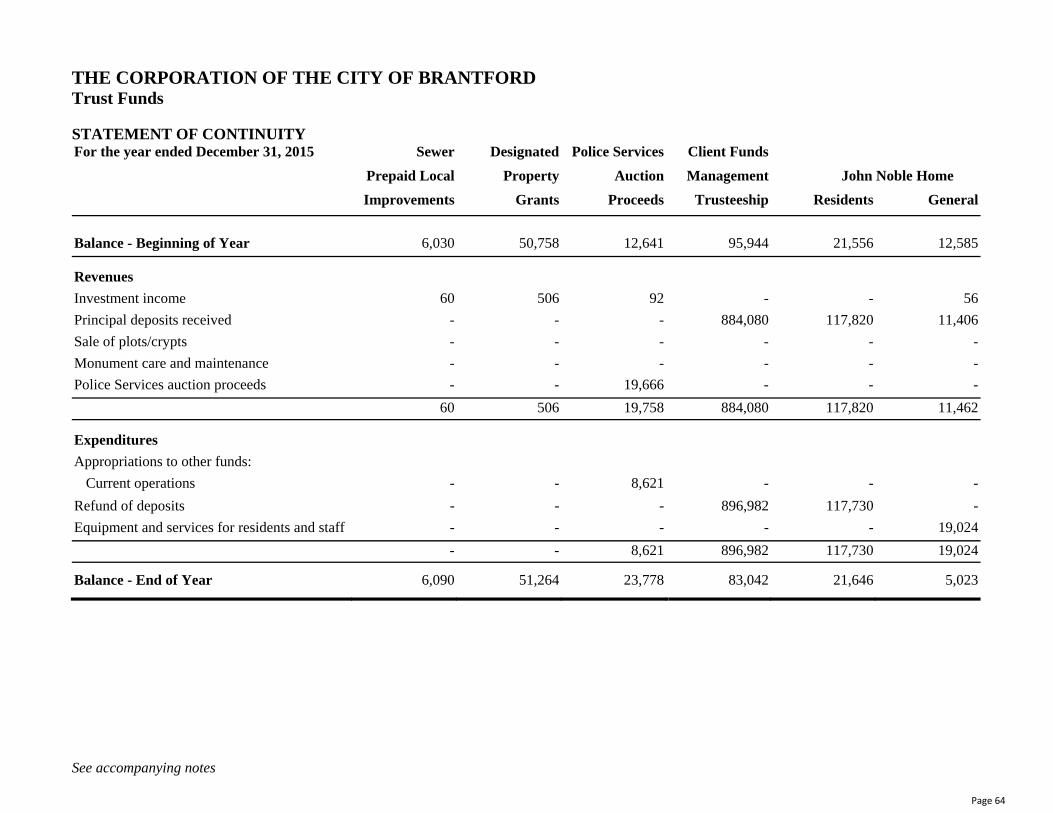
See accompanying notes Page5
THE CORPORATION OF THE CITY OF BRANTFORD Trust Funds STATEMENT OF CONTINUITY For the year ended December 31, 2015 Sewer Designated Police Services Client Funds
Prepaid Local Property Auction Management John Noble Home
Improvements Grants Proceeds Trusteeship Residents General
Balance - Beginning of Year 6,030 50,758 12,641 95,944 21,556 12,585
Revenues
Investment income 60 506 92 - - 56
Principal deposits received - - - 884,080 117,820 11,406
Sale of plots/crypts - - - - - -
Monument care and maintenance - - - - - -
Police Services auction proceeds - - 19,666 - - -
60 506 19,758 884,080 117,820 11,462
Expenditures
Appropriations to other funds:
Current operations - - 8,621 - - -
Refund of deposits - - - 896,982 117,730 -
Equipment and services for residents and staff - - - - - 19,024
- - 8,621 896,982 117,730 19,024
Balance - End of Year 6,090 51,264 23,778 83,042 21,646 5,023
Page 64

Page6
THE CORPORATION OF THE CITY OF BRANTFORD Trust Funds NOTES TO THE FINANCIAL STATEMENTS For the year ended December 31, 2015 1. SUMMARY OF SIGNIFICANT ACCOUNTING POLICIES
The financial statements of the Trust Funds of The Corporation of the City of Brantford are the representation of management prepared in accordance with accounting policies prescribed for Ontario Municipalities by the Ministry of Municipal Affairs and Housing. Since precise determination of many assets and liabilities is dependent upon future events, the preparation of periodic financial statements necessarily involves the use of estimates and approximations. These have been made using careful judgements.
(a) Basis of Accounting
Capital receipts and income are reported on the accrual basis of accounting. Expenditures and capital disbursements are reported on the accrual basis of accounting which recognizes expenditures as they are incurred and measurable as a result of the receipt of goods or services and the creation of the legal obligation to pay.
(b) Inventory
The inventory of mausoleum crypts recorded in the Mausoleum Endowment Trust Fund is recorded at cost.
(c) Investments
Premiums or discounts on the purchase of investments are recognized on acquisition. 2. CASH
All cash is invested in an interest bearing bank account, with the exception of the Client Funds Management Trusteeship bank account.
3. INVESTMENTS
Trust fund investments of $2,440,509 (2014 - $2,543,342) reported on the Statement of Financial Position at cost, have a fair market value of $2,696,165 (2014 - $2,808,349) at the end of the year.
The investments yield interest rates from 2.50% to 5.87% and have maturity dates ranging from 2016 to 2039.
4. STATEMENT OF CASH FLOWS
A statement of cash flows has not been provided as the information is readily available in the financial
statements provided.
Page 65
INDEPENDENT AUDITORS' REPORT
To the Board Members ofThe Public Library Board, Members of Council, Inhabitants andRatepayers of the Corporation of the City of Brantford
We have audited the accompanying financial statements of the Brantford Public Library Board, which comprisethe statement of financial position as at December 31, 2015, and the statement of operations, statement of changesin net financial assets and statement of cash flows for the year then ended, and a summary of significantaccounting policies and other explanatory information.
Management's Responsibility for the Financial StatementsManagement is responsible for the preparation and fair presentation of these financial statements in accordancewith Canadian public sector accounting standards, and for such internal control as management determines isnecessary to enable the preparation of financial statements that are free from material misstatement, whether dueto fraud or error.
Auditors' ResponsibilityOur responsibility is to express an opinion on these financial statements based on our audit. We conducted ouraudit in accordance with Canadian generally accepted auditing standards. Those standards require that wecomply with ethical requirements and plan and perform the audit to obtain reasonable assurance about whether thefinancial statements are free from material misstatement.
An audit involves performing procedures to obtain audit evidence about the amounts and disclosures in thefinancial statements. The procedures selected depend on the auditors' judgment, including the assessment of therisks of material misstatement of the financial statements, whether due to fraud or error. In making those riskassessments, the auditor considers internal control relevant to the entity's preparation and fair presentation of thefinancial statements in order to design audit procedures that are appropriate in the circumstances, but not for thepurpose of expressing an opinion on the effectiveness of the entity's internal control. An audit also includesevaluating the appropriateness of accounting policies used and the reasonableness of accounting estimates madeby management, as well as evaluating the overall presentation of the financial statements.
We believe that the audit evidence we have obtained is sufficient and appropriate to provide a basis for our auditopinion.
Page 1
Millard, Rouse & Rosebrugh LLPBrantford • Hagersville • Simcoe • Delhi • Norwich • Tillsonburg
MillardsChartered Accountants
P.O. Box 367, 96 Nelson StreetBrantford, Ontario N3T 5N3Telephone: (519) 759-3511Facsimile: (519) 759-7961
Page 66
OpinionIn our opinion, the financial statements present fairly, in all material respects, the financial position of theBrantford Public Library Board as at December 31, 2015 and the results of its operations, changes in net assets,and cash flows for the year then ended in accordance with Canadian public sector accounting standards.
May 19, 2016 CHARTERED PROFESSIONAL ACCOUNTANTSBrantford, Ontario Licensed Public Accountants
Page 2
Page 67

BRANTFORD PUBLIC LIBRARY BOARD
STATEMENT OF FINANCIAL POSITION
As at December 31 2015 2014
(Restated Note 5)
Financial AssetsCash 2,633,588 2,243,690Accounts receivable 64,564 69,409Employee computer purchase loans (Note 2) 1,874 2,667
2,700,026 2,315,766
Financial LiabilitiesAccounts payable and accrued liabilities 267,847 200,372Deferred revenue (Note 3) 24,726 14,649Vested sick leave payable (Notes 4 & 5) 198,059 202,514Post employment/retirement benefits (Note 4 & 5) 309,070 296,840
799,702 714,375
Net Financial Assets 1,900,324 1,601,391
Non-Financial AssetsPrepaid expenses 11,310 8,305Tangible capital assets (Schedule 4) 6,314,929 6,642,376
Total Net Assets 8,226,563 8,252,072
Accumulated Surplus - End of Year (Note 6) 8,226,563 8,252,072
See accompanying notes Page 3
Page 68

BRANTFORD PUBLIC LIBRARY BOARD
STATEMENT OF OPERATIONS
For the year ended December 31 2015 2014
(Restated Note 5)
Revenues (Schedule 1)Government transfers 4,378,505 4,294,222Other revenue 288,289 333,674
4,666,794 4,627,896
Expenses (Schedule 2)Salaries and benefits 3,045,047 3,183,521Building 220,037 226,249Other operating expenses 244,730 209,669Administrative expenses 144,506 117,179
3,654,320 3,736,618
Income Before Under-noted Item 1,012,474 891,278
Other Income/(Expense)Amortization of tangible capital assets (1,037,983) (996,747)
Annual Surplus/(Deficit) from Operations (25,509) (105,469)Accumulated Surplus - Beginning of Year 8,252,072 8,664,802Recognition of prior period post employment/retirement
benefits liability (Notes 4 & 5) - (307,261)
Accumulated Surplus - End of Year (Note 6) 8,226,563 8,252,072
See accompanying notes Page 4
Page 69

BRANTFORD PUBLIC LIBRARY BOARD
STATEMENT OF CHANGES IN NET FINANCIAL ASSETS
For the year ended December 31 2015 2014
(Restated Note 5)
Annual Surplus/(Deficit) from Operations (25,509) (105,469)Amortization of tangible capital assets 1,037,983 996,747Acquisition of tangible capital assets (710,536) (683,964)Recognition of post employment/retirement benefits (Note 4 & 5) - (307,261)Change in prepaid expense (3,005) (8,305)
Increase (Decrease) in Net Financial Assets 298,933 (108,252)Net Financial Assets - Beginning of Year 1,601,391 1,709,643
Net Financial Assets - End of Year 1,900,324 1,601,391
See accompanying notes Page 5
Page 70

BRANTFORD PUBLIC LIBRARY BOARD
STATEMENT OF CASH FLOWS
For the year ended December 31 2015 2014
Cash Flows From Operating ActivitiesAnnual Surplus/(Deficit) (25,509) (105,469)
Non-cash charges to operations:Amortization 1,037,983 996,747
1,012,474 891,278
Sources (Uses) of Cash:(Increase)/Decrease in accounts receivable 4,845 142,002(Increase)/Decrease in prepaid expenses (3,005) (8,305)Increase/(Decrease) in accounts payable and accrued liabilities 67,475 (37,699)(Increase)/Decrease in employee computer purchase loans 793 1,591Increase/(Decrease) in deferred revenue 10,077 (1,512)Increae/(Decrease) in post employment/retirement benefits 12,230 -Increase/(Decrease) in vested sick leave (4,455) (2,161)
87,960 93,916
Cash Flows From Capital ActivitiesAcquisition of tangible capital assets (710,536) (683,964)
Net Increase (Decrease) in Cash and Cash Equivalents 389,898 301,230Opening Cash and Cash Equivalents 2,243,690 1,942,460
Closing Cash and Cash Equivalents 2,633,588 2,243,690
See accompanying notes Page 6
Page 71

BRANTFORD PUBLIC LIBRARY BOARD
NOTES TO THE FINANCIAL STATEMENTSFor the year ended December 31, 2015
1. SUMMARY OF SIGNIFICANT ACCOUNTING POLICIES
The financial statements are the representation of management prepared in accordance with Canadiangenerally accepted accounting principles prescribed by the Public Sector Accounting Board of theChartered Professional Accountants of Canada.
(a) MeasurementSince precise determination of many assets and liabilities is dependent upon future events, thepreparation of periodic financial statements necessarily involves the use of estimates andapproximations. These have been made using careful judgments.
(b) Basis of Accountingi) Accrual Basis of Accounting
Expenditures and related sources of financing are reported on the accrual basis of accounting. Theaccrual basis of accounting recognizes revenues in the period in which transactions or eventsoccurred that gave rise to the revenues; expenditures are recognized in the period the goods andservices are acquired and a liability is incurred or transfers are due.
ii) Non-financial Assets, Tangible Capital AssetsNon-financial assets are not available to discharge existing liabilities and are held for use in theprovision of services. They have useful lives extending beyond the current year, and are notintended for sale in the ordinary course of operations. The change in non-financial assets duringthe year, together with the income (deficit) from operations, provides the change in net financialassets for the year.
Tangible capital assetsTangible capital assets are recorded at cost, which includes all amounts that are directly attributableto acquisition, construction, development or betterment of the asset. The cost, less residual value,of the tangible capital assets are amortized on a straight-line basis over their estimated useful livesas follows:
Land improvements 20 yearsBuildings 40 yearsBuilding improvements 10 to 20 yearsMachinery and Equipment 10 to 20 yearsTechnology Equipment 3 to 4 yearsBooks 7 yearsFurniture and Fixtures 10 years
Contribution of tangible capital assetsTangible capital assets received as contributions are recorded at their fair value at the date ofreceipt, and that fair value is also recorded as revenue. Similarly, transfers of assets to third partiesare recorded as an expense equal to the net book value of the asset as of the date of transfer.
iii) Cash and Cash EquivalentsCash and cash equivalents are comprised of cash on hand and cash held in financial institutions.
Page 7
Page 72
BRANTFORD PUBLIC LIBRARY BOARD
NOTES TO THE FINANCIAL STATEMENTSFor the year ended December 31, 2015
1. SUMMARY OF SIGNIFICANT ACCOUNTING POLICIES (continued)
(c) Reserves Reserves are established by the Board for specific expenditures as follows:
a) Grant Opportunity & Projects - To fund projects and to match funds provided by the provincialand/or federal government.
b) Equipment - To provide funds for replacement of library equipment.c) Automated Equipment - To provide funds to upgrade the Information System.d) Sick Leave - To provide funds for sick leave as described in Note 4.e) Material Acquisition - To provide funds for material acquisition commitments of the current
year.
(d) Brantford Public Library TrustIn 1993, the Board established the Brantford Public Library Trust. The objectives of the Trust areto enhance book collections and user access, to fund capital purchases and to match funds forcertain programs from time to time as established by the Board.
The activities of the Trust are to be carried out through two funds. The Endowment Fund is toinclude all monetary gifts and bequests. The Special Purpose Fund is to include all monetary giftsand bequests for which the donor has, as a condition, required the gift or bequest to be used forspecific purposes. To date, no donations have been received in this fund.
Income earned in the Special Purpose Fund will be added to the capital of the Endowment Fund,unless such an addition contravenes any condition made by a donor to the Special Purpose Fund.
(e) Revenue RecognitionGrants, service charges and other revenues are recognized in the year of receipt. Revenue relatingto specified expenditures not yet incurred is recorded as deferred revenue and recognized when thespecified expenditure is made.
(f) Government TransfersGovernment transfers are the transfer of assets from senior levels of government and are not theresult of any exchange transactions, meaning there is no expectation to repay the amounts in thefuture. Government transfers are recognized in the fiscal year in which events giving rise to thetransfer occur, providing the transfer is authorized, any eligibility criteria have been met andreasonable estimates of the amounts can be made.
2. EMPLOYEE COMPUTER PURCHASE LOANS
The Library offers its employees loans to purchase home computers. These loans are to be repaid over atwo year period from the date of the loan. $1,475 of the loans outstanding are expected to be repaid in2016.
Page 8
Page 73

BRANTFORD PUBLIC LIBRARY BOARD
NOTES TO THE FINANCIAL STATEMENTSFor the year ended December 31, 2015
3. DEFERRED REVENUE 2015 2014
Ontario Library Capacity Fund 9,223 -Lost book recovery 15,504 14,649
24,727 14,649
4. POST EMPLOYMENT/RETIREMENT BENEFITS AND SICK LEAVE BENEFITS
The Library provides certain employee benefits which will require funding in future periods.
Regarding post employment/retirement benefits, employees who retire with an OMERS pension areentitled to retirement benefits until age 65. The Library also has obligations owing to former employeesunder various benefit programs.
Under the sick leave benefits plan, unused sick leave can accumulate and employees may become entitledto a cash payment when they leave the Library’s employment.
An actuarial valuation of future liabilities for post employment/retirement benefits and sick leave benefitswas completed in May 2016 and forms the basis for the estimated liability reported in these financialstatements.
The weighted average assumptions used in the valuation were as follows:2015
Discount rate 3.50%Average compensation increase 2.50%Healthcare cost increases
Initial rate 6.25%Ultimate rate 4.50%
Grading period 7 yearsDental care cost increase 3.00%
Post Employment/Retirement BenefitsMedical, Dental,
Life Insurance
VestedSick Leave
Benefits
Total Benefits2015
Accrued Benefit End of PriorYear 296,840 202,514 499,354Accrued Benefit
Obligation at Jan. 1 296,840 202,514 499,354Current Period Benefit Cost 14,015 11,343 25,358Retirement Interest Expense 10,662 7,085 17,747Benefit Payments (12,447) (22,883) (35,330)Liability as at December 31 309,070 198,059 507,129
The Library has established reserves to mitigate the future impact of these obligations, as disclosed inSchedule 3. The balance at the end of the year is $180,449 (2014 - $192,093). There are no anticipatedpayments over the next five years to employees who are eligible to retire for sick leave benefits.
Page 9
Page 74
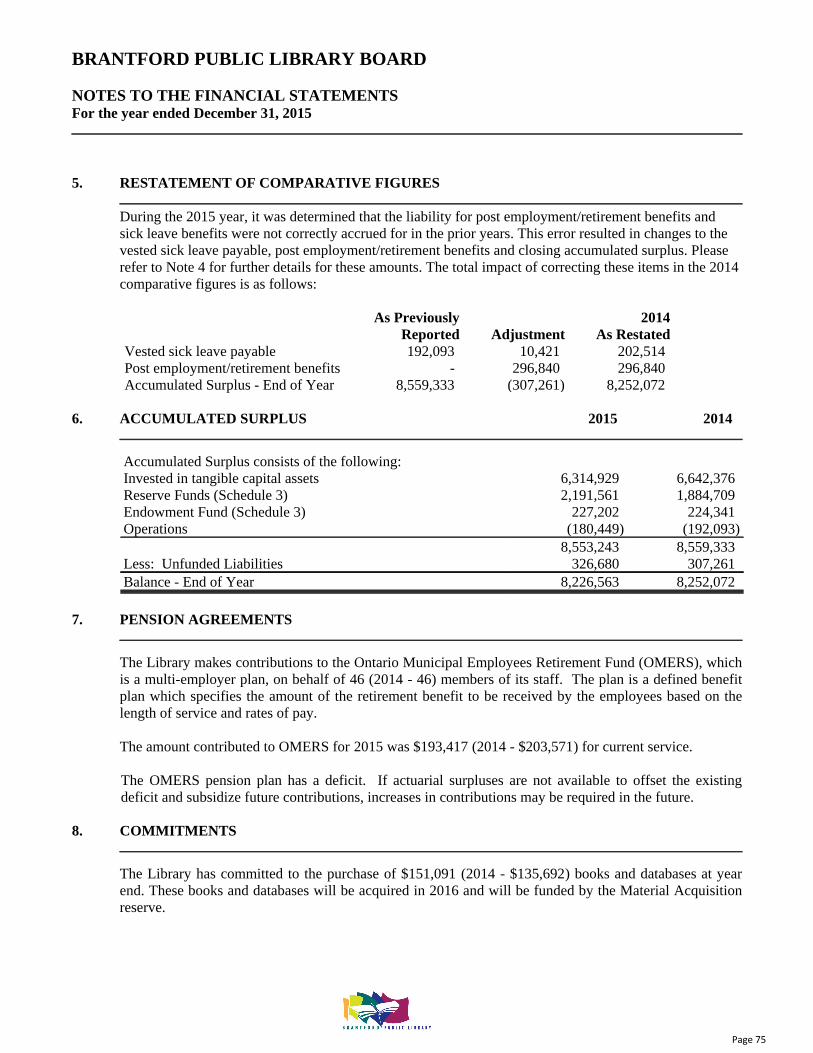
BRANTFORD PUBLIC LIBRARY BOARD
NOTES TO THE FINANCIAL STATEMENTSFor the year ended December 31, 2015
5. RESTATEMENT OF COMPARATIVE FIGURES
During the 2015 year, it was determined that the liability for post employment/retirement benefits andsick leave benefits were not correctly accrued for in the prior years. This error resulted in changes to thevested sick leave payable, post employment/retirement benefits and closing accumulated surplus. Pleaserefer to Note 4 for further details for these amounts. The total impact of correcting these items in the 2014comparative figures is as follows:
As PreviouslyReported Adjustment
2014As Restated
Vested sick leave payable 192,093 10,421 202,514Post employment/retirement benefits - 296,840 296,840Accumulated Surplus - End of Year 8,559,333 (307,261) 8,252,072
6. ACCUMULATED SURPLUS 2015 2014
Accumulated Surplus consists of the following:Invested in tangible capital assets 6,314,929 6,642,376Reserve Funds (Schedule 3) 2,191,561 1,884,709Endowment Fund (Schedule 3) 227,202 224,341Operations (180,449) (192,093)
8,553,243 8,559,333Less: Unfunded Liabilities 326,680 307,261Balance - End of Year 8,226,563 8,252,072
7. PENSION AGREEMENTS
The Library makes contributions to the Ontario Municipal Employees Retirement Fund (OMERS), whichis a multi-employer plan, on behalf of 46 (2014 - 46) members of its staff. The plan is a defined benefitplan which specifies the amount of the retirement benefit to be received by the employees based on thelength of service and rates of pay.
The amount contributed to OMERS for 2015 was $193,417 (2014 - $203,571) for current service.
The OMERS pension plan has a deficit. If actuarial surpluses are not available to offset the existingdeficit and subsidize future contributions, increases in contributions may be required in the future.
8. COMMITMENTS
The Library has committed to the purchase of $151,091 (2014 - $135,692) books and databases at yearend. These books and databases will be acquired in 2016 and will be funded by the Material Acquisitionreserve.
Page 10
Page 75

BRANTFORD PUBLIC LIBRARY BOARD
NOTES TO THE FINANCIAL STATEMENTSFor the year ended December 31, 2015
9. FINANCIAL INSTRUMENTS
Fair ValueThe fair value of financial instruments, such as cash and short-term investments, accounts receivable andaccounts payable, are determined to approximate their recorded values. The fair value of marketablesecurities is based on quoted market values as at year end.
Credit RiskThe Library’s credit risk relates to its accounts receivables. The risk of significant loss is consideredremote.
10. BUDGET AMOUNTS
The Library board budget is developed in accordance with the City of Brantford budget process. Thebudget is set and approved, whereby all costs are anticipated to be expended during the fiscal year. Thebudget figures presented in the financial statements have been adjusted to reflect the accrual basis ofreporting and consequently, all budget amounts related to non-financial asset expenditures have beenremoved. The Brantford Public Library Board operated within its 2015 approved budget.
11. CAPITAL MANAGEMENT
The Library's objective in managing its capital is to maintain financial stability in order to safeguard itsability to continue to provide access to knowledge, literacy and leisure pursuits to its members.
The Library also has a development charges reserve fund held with the City of Brantford in the amount of$1,577,064. This reserve is not an asset of the Library as City Council has control over the funds. Thefunds are to be used for the betterment and for capital projects of the Library.
Page 11
Page 76
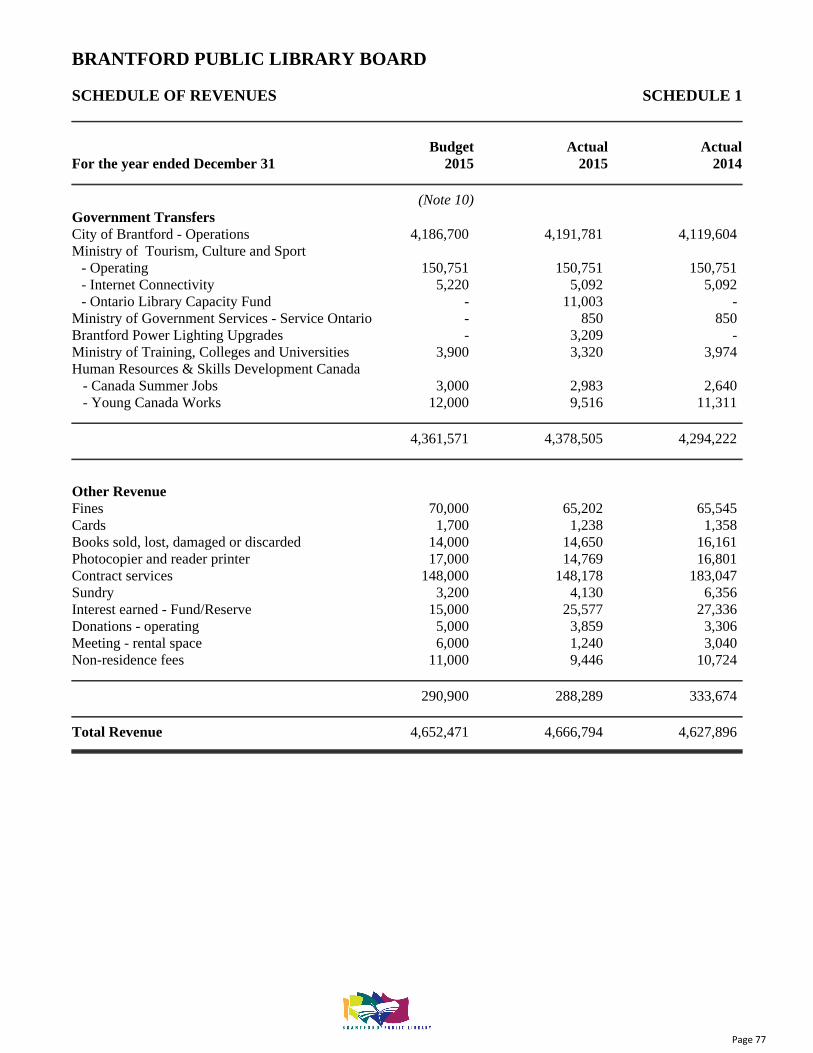
BRANTFORD PUBLIC LIBRARY BOARD
SCHEDULE OF REVENUES SCHEDULE 1
Budget Actual ActualFor the year ended December 31 2015 2015 2014
(Note 10)Government Transfers City of Brantford - Operations 4,186,700 4,191,781 4,119,604Ministry of Tourism, Culture and Sport
- Operating 150,751 150,751 150,751- Internet Connectivity 5,220 5,092 5,092- Ontario Library Capacity Fund - 11,003 -
Ministry of Government Services - Service Ontario - 850 850Brantford Power Lighting Upgrades - 3,209 -Ministry of Training, Colleges and Universities 3,900 3,320 3,974Human Resources & Skills Development Canada - Canada Summer Jobs 3,000 2,983 2,640 - Young Canada Works 12,000 9,516 11,311
4,361,571 4,378,505 4,294,222
Other RevenueFines 70,000 65,202 65,545Cards 1,700 1,238 1,358Books sold, lost, damaged or discarded 14,000 14,650 16,161Photocopier and reader printer 17,000 14,769 16,801Contract services 148,000 148,178 183,047Sundry 3,200 4,130 6,356Interest earned - Fund/Reserve 15,000 25,577 27,336Donations - operating 5,000 3,859 3,306Meeting - rental space 6,000 1,240 3,040Non-residence fees 11,000 9,446 10,724
290,900 288,289 333,674
Total Revenue 4,652,471 4,666,794 4,627,896
Page 12
Page 77

BRANTFORD PUBLIC LIBRARY BOARD
SCHEDULE OF EXPENSES SCHEDULE 2
Budget Actual ActualFor the year ended December 31 2015 2015 2014
(Note 10)Salaries and BenefitsSalaries Staff salaries 2,719,395 2,422,631 2,561,596 Read-On Staff 37,400 53,215 52,119Employee benefits 615,506 569,201 569,806
3,372,301 3,045,047 3,183,521
BuildingLight, heat, water 118,200 121,988 111,411Repairs and maintenance 63,400 46,194 54,686Security 45,300 43,093 52,048Insurance 9,700 8,762 8,104
236,600 220,037 226,249
Other Operating ExpensesAutomated services 156,800 158,789 148,707Internet connectivity 36,300 31,751 29,210New equipment purchases 19,300 17,000 7,197Programming 12,300 15,996 11,098Photocopier rental and supplies 7,700 6,360 5,823Book recoveries & Supplies 7,400 12,527 6,118Book transportation 1,500 2,307 1,516
241,300 244,730 209,669
Administrative ExpensesStationery and software 6,800 12,856 14,090Communications 11,700 12,604 12,075Postage and freight 3,700 3,453 4,434Professional fees 18,400 43,902 23,578Memberships and staff training 24,600 36,665 25,027Marketing and publicity 30,100 19,663 27,245Volunteer and miscellaneous 8,300 15,363 10,730
103,600 144,506 117,179
3,953,801 3,654,320 3,736,618
Page 13
Page 78

BRANTFORD PUBLIC LIBRARY BOARD
SCHEDULE OF CONTINUITY OF RESERVES AND TRUST SCHEDULE 3
For the year ended December 31, 2015Grant
Opportunity &Projects
Equipment AutomatedEquipment
Reserves
Balance - Beginning of Year 161,319 666,413 729,192Transfers from Operations 171,727 102,745 103,417Transfers to Operations (5,000) (71,507) (29,050)Balance - End of Year 328,046 697,651 803,559
For the year ended December 31, 2015Sick Leave
ReserveMaterial
AcquisitionEndowment
Fund(Note 4)
Reserves
Balance - Beginning of Year 192,093 135,692 224,341Transfers from Operations 11,239 181,856 6,261Transfers to Operations (22,883) (135,692) (3,400)Balance - End of Year 180,449 181,856 227,202
Page 14
Page 79

BRANTFORD PUBLIC LIBRARY BOARD
SCHEDULE OF TANGIBLE CAPITAL ASSETS SCHEDULE 4
LandLand
Improvements BuildingBuilding
ImprovementsMachinery &
Equipment 2015 Total 2014 TotalCostBalance - Beginning of Year 638,133 6,993 1,445,667 8,129,348 7,022,384 17,242,525 17,120,020Add: Additions during the year - 61,224 - 18,313 630,999 710,536 683,964Less: Disposals during the year - - - - 652,346 652,346 561,459Balance - End of Year 638,133 68,217 1,445,667 8,147,661 7,001,037 17,300,715 17,242,525
Accumulated AmortizationBalance - Beginning of Year - 1,771 996,783 5,179,724 4,421,871 10,600,149 10,164,861Add: Amortization during the year - 1,658 31,167 243,146 762,012 1,037,983 996,747Less: Accumulated amortization on
disposals - - - - 652,346 652,346 561,459Balance - End of Year - 3,429 1,027,950 5,422,870 4,531,537 10,985,786 10,600,149Net Book Value of Tangible Capital Assets 638,133 64,788 417,717 2,724,791 2,469,500 6,314,929 6,642,376
Page 15
Page 80

INDEPENDENT AUDITORS' REPORT
To the Chair and Members of theBrantford Municipal Non-Profit Housing Corporation
We have audited the accompanying financial statements of Brantford Municipal Non-Profit Housing Corporation,which comprise the statement of financial position as at December 31, 2015, the statement of changes in netassets, the statements of operations of Beckett Project - Shelter, Beckett Project - Non-Shelter, and BranlynMeadows Project - Shelter, the statement of replacement reserve funds, and a summary of significant accountingpolicies and other explanatory information. The financial statements have been prepared by management ofBrantford Municipal Non-Profit Housing Corporation based on the financial reporting provisions of the OntarioMinistry of Municipal Affairs and Housing.
Management's Responsibility for the Financial StatementsManagement is responsible for the preparation and fair presentation of these financial statements in accordancewith the financial reporting provisions of the Ontario Ministry of Municipal Affairs and Housing, and for suchinternal control as management determines is necessary to enable the preparation of financial statements that arefree from material misstatement, whether due to fraud or error.
Auditors' ResponsibilityOur responsibility is to express an opinion on these financial statements based on our audit. We conducted ouraudit in accordance with Canadian generally accepted auditing standards. Those standards require that wecomply with ethical requirements and plan and perform the audit to obtain reasonable assurance about whether thefinancial statements are free from material misstatement.
An audit involves performing procedures to obtain audit evidence about the amounts and disclosures in thefinancial statements. The procedures selected depend on the auditors' judgment, including the assessment of therisks of material misstatement of the financial statements, whether due to fraud or error. In making those riskassessments, the auditor considers internal control relevant to the entity's preparation and fair presentation of thefinancial statements in order to design audit procedures that are appropriate in the circumstances, but not for thepurpose of expressing an opinion on the effectiveness of the entity's internal control. An audit also includesevaluating the appropriateness of accounting policies used and the reasonableness of accounting estimates madeby management, as well as evaluating the overall presentation of the financial statements.
We believe that the audit evidence we have obtained is sufficient and appropriate to provide a basis for our auditopinion.
OpinionIn our opinion, the financial statements present fairly, in all material respects, the financial position of BrantfordMunicipal Non-Profit Housing Corporation as at December 31, 2015 and the results of its operations for the yearthen ended in accordance with the financial reporting provisions of the Ontario Ministry of Municipal Affairs andHousing.
Page 1Millard, Rouse & Rosebrugh LLP
Brantford • Hagersville • Simcoe • Delhi • Norwich • Tillsonburg
MillardsChartered Accountants
P.O. Box 367, 96 Nelson StreetBrantford, Ontario N3T 5N3Telephone: (519) 759-3511Facsimile: (519) 759-7961
Page 81
Basis of Accounting and Restriction on Distribution and UseWithout modifying our opinion, we draw attention to Note 1 to the financial statements, which describes the basisof accounting. The financial statements are prepared to assist Brantford Municipal Non-Profit HousingCorporation to comply with the financial reporting provisions referred to above. As a result, the financialstatements may not be suitable for another purpose. Our report is intended solely for the Directors of BrantfordMunicipal Non-Profit Housing Corporation, the service manager, and the Ontario Ministry of Municipal Affairsand Housing and should not be distributed or used by parties other than the Directors of Brantford MunicipalNon-Profit Housing Corporation, the service manager, and the Ontario Ministry of Municipal Affairs andHousing.
April 18, 2016 CHARTERED PROFESSIONAL ACCOUNTANTSBrantford, Ontario Licensed Public Accountants
Page 2
Page 82

BRANTFORD MUNICIPAL NON-PROFIT HOUSING CORPORATION
STATEMENT OF FINANCIAL POSITION
As at December 31 2015 2014
ASSETSCurrent AssetsAccounts receivable - rent 3,773 6,361Due from City of Brantford 77,037 -Prepaid expenses 14,764 15,751Investments (Market value - $356,836; 2014 - $897,185) 356,836 941,823
452,410 963,935Property, Plant and Equipment (Note 2) 2,348,578 2,629,552
2,800,988 3,593,487
LIABILITIESCurrent LiabilitiesAccounts payable and accrued expenses 4,957 6,742Due to City of Brantford - 546,779Prepaid rent 7,123 6,045Due to Service Manager - City of Brantford 47,351 15,368Current portion of long term liabilities (Note 3) 287,722 280,973
347,153 855,907
Long Term Liabilities (Note 3) 1,667,945 1,955,668Replacement Reserve Funds (Note 4 and Page 8) 365,138 367,925Contributed Surplus 384,895 384,895Net Assets - Page 4 35,857 29,092
2,453,835 2,737,580
2,800,988 3,593,487
Approved on behalf of the Board
.................................................. Director
.................................................. Director
See accompanying notes Page 3
Page 83

BRANTFORD MUNICIPAL NON-PROFIT HOUSING CORPORATION
STATEMENT OF CHANGES IN NET ASSETS
For the year ended December 31 2015 2014
Balance - Beginning of Year 29,092 39,671
Adjust for prior year settlement - Branlyn 114 1,132
Excess of Revenue over Expenses (Expenses over Revenue)Beckett Project - Non-shelter Solar 5,920 -Branlyn Meadows Project - Shelter 731 (11,711)
Balance - End of Year 35,857 29,092
See accompanying notes Page 4
Page 84

BRANTFORD MUNICIPAL NON-PROFIT HOUSING CORPORATION
STATEMENT OF OPERATIONS - BECKETT PROJECT - SHELTER
Budget Actual ActualFor the year ended December 31 2015 2015 2014
RevenueFederal subsidies 86,367 79,742 86,367Service manager subsidies 79,795 79,795 65,471Current year subsidy adjustment - (47,911) (13,474)Rental - Market tenants 388,272 148,821 146,190Rental - RGI tenants - 249,758 236,419Other revenue 15,500 11,770 20,664
569,934 521,975 541,637
ExpensesAmortization - net 152,777 156,533 148,875Taxes paid on city owned property 86,698 87,213 80,203Insurance 10,000 9,361 8,615Interest on long term liability 18,340 8,549 21,908Legal and audit 3,600 3,222 3,279Office administration 5,360 4,110 4,466Repairs and maintenance 132,369 97,547 115,490Replacement reserve 39,520 39,520 38,485Utilities 93,100 85,414 91,432Wages and benefits 28,170 30,506 28,884
569,934 521,975 541,637
Excess of Revenue over Expenses - - -
See accompanying notes Page 5
Page 85

BRANTFORD MUNICIPAL NON-PROFIT HOUSING CORPORATION
STATEMENT OF OPERATIONS - BECKETT PROJECT - NON-SHELTER
For the year ended December 31 2015 2014
RevenueContribution from Municipality 157,605 171,507Sale of Hydro 11,840 -
169,445 171,507
ExpensesInsurance 2,567 2,362Interest on long term liability 3,004 7,697Legal and audit 1,132 1,152Repairs and maintenance 38,505 53,967Utilities 57,398 54,021Amortization 54,999 52,308Transfer to replacement reserve 5,920 -
163,525 171,507
Excess of Revenue over Expenses - Page 4 5,920 -
See accompanying notes Page 6
Page 86

BRANTFORD MUNICIPAL NON-PROFIT HOUSING CORPORATION
STATEMENT OF OPERATIONS - BRANLYN MEADOWS PROJECT - SHELTER
Budget Actual ActualFor the year ended December 31 2015 2015 2014
RevenueService manager subsidy 150,428 151,681 149,753Current year subsidy adjustment - 560 (1,894)Rental - Market tenants 112,000 65,508 70,833
- RGI tenants - 51,122 47,115Other revenue 2,000 3,129 7,983
264,428 272,000 273,790
ExpensesAmortization - net 69,442 69,442 66,505Taxes paid on city owned property 44,412 45,917 43,647Insurance 3,400 3,171 2,918Interest on long term liability 50,836 50,581 53,529Legal and audit 1,300 1,253 1,275Bad debts and collection costs 3,700 6,440 6,249Office administration 400 436 385Repairs and maintenance 67,152 68,804 87,419Replacement reserve 14,651 14,651 14,238Utilities 2,250 2,655 2,936Wages and benefits 6,885 7,919 6,400
264,428 271,269 285,501
Excess of Revenue over Expenses - Page 4 - 731 (11,711)
See accompanying notes Page 7
Page 87

BRANTFORD MUNICIPAL NON-PROFIT HOUSING CORPORATION
STATEMENT OF REPLACEMENT RESERVE FUNDS
For the year ended December 31 2015 2014
Beckett Project
Balance - Beginning of Year 282,634 254,182Provision from operations (Note 4) 39,520 38,485Provision grant - SHRRP 8,728 2,497Interest, net of investment losses (6,275) 12,902Repairs and maintenance expenditure (31,654) (25,432)Contribution from Solar Revenue 5,920 -
Balance - End of Year 298,873 282,634
Branlyn Meadows Project
Balance - Beginning of Year 85,291 90,722Provision from operations (Note 4) 14,651 14,238Provision grant - SHRRP - -Interest, net of investment losses (1,209) 4,259Repairs and maintenance expenditure (32,468) (23,928)
Balance - End of Year 66,265 85,291
Total 365,138 367,925
See accompanying notes Page 8
Page 88
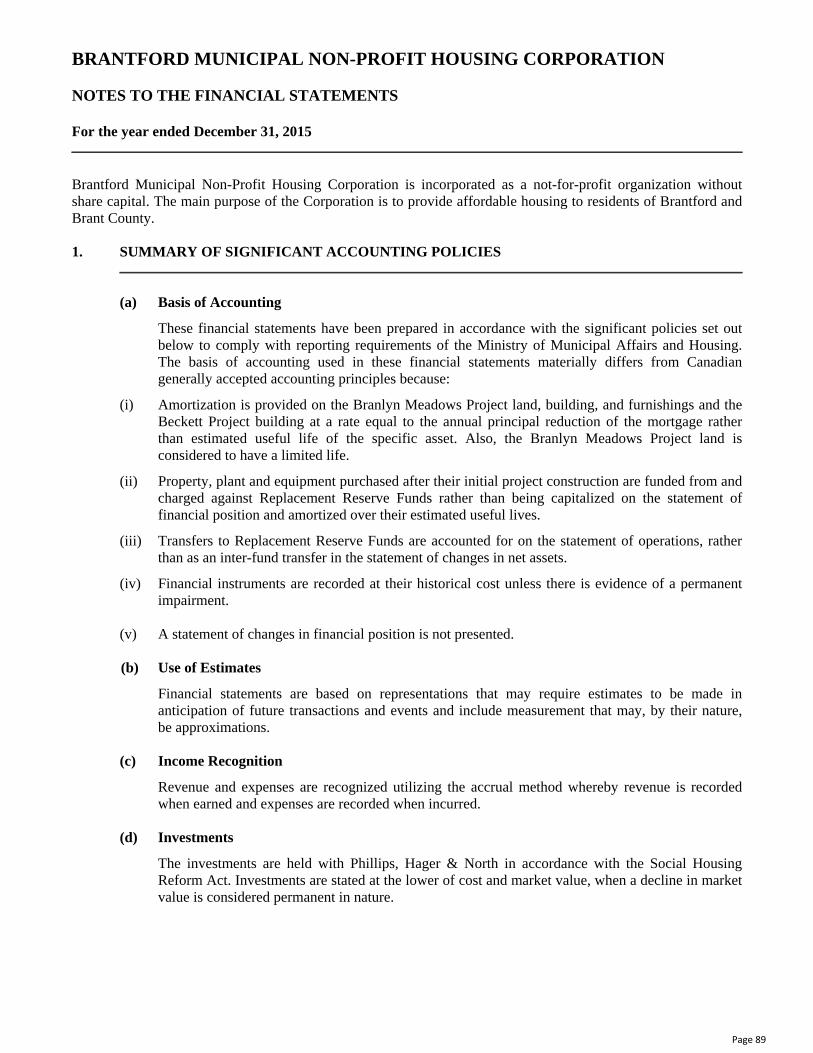
BRANTFORD MUNICIPAL NON-PROFIT HOUSING CORPORATION
NOTES TO THE FINANCIAL STATEMENTS
For the year ended December 31, 2015
Brantford Municipal Non-Profit Housing Corporation is incorporated as a not-for-profit organization withoutshare capital. The main purpose of the Corporation is to provide affordable housing to residents of Brantford andBrant County.
1. SUMMARY OF SIGNIFICANT ACCOUNTING POLICIES
(a) Basis of Accounting
These financial statements have been prepared in accordance with the significant policies set outbelow to comply with reporting requirements of the Ministry of Municipal Affairs and Housing.The basis of accounting used in these financial statements materially differs from Canadiangenerally accepted accounting principles because:
(i) Amortization is provided on the Branlyn Meadows Project land, building, and furnishings and theBeckett Project building at a rate equal to the annual principal reduction of the mortgage ratherthan estimated useful life of the specific asset. Also, the Branlyn Meadows Project land isconsidered to have a limited life.
(ii) Property, plant and equipment purchased after their initial project construction are funded from andcharged against Replacement Reserve Funds rather than being capitalized on the statement offinancial position and amortized over their estimated useful lives.
(iii) Transfers to Replacement Reserve Funds are accounted for on the statement of operations, ratherthan as an inter-fund transfer in the statement of changes in net assets.
(iv) Financial instruments are recorded at their historical cost unless there is evidence of a permanentimpairment.
(v) A statement of changes in financial position is not presented.
(b) Use of Estimates
Financial statements are based on representations that may require estimates to be made inanticipation of future transactions and events and include measurement that may, by their nature,be approximations.
(c) Income Recognition
Revenue and expenses are recognized utilizing the accrual method whereby revenue is recordedwhen earned and expenses are recorded when incurred.
(d) Investments
The investments are held with Phillips, Hager & North in accordance with the Social HousingReform Act. Investments are stated at the lower of cost and market value, when a decline in marketvalue is considered permanent in nature.
Page 9
Page 89

BRANTFORD MUNICIPAL NON-PROFIT HOUSING CORPORATION
NOTES TO THE FINANCIAL STATEMENTS
For the year ended December 31, 2015
1. SUMMARY OF SIGNIFICANT ACCOUNTING POLICIES (CONT'D)
(e) Property, Plant and Equipment and Amortization Beckett Project - Property, plant and equipment are stated at historical cost. Amortization onfurnishings is calculated on a straight line basis over ten years. Building amortization is providedfor in the accounts in annual amounts equal to the principal repayments on the mortgage during theyear.
Branlyn Meadows Project - Property, plant and equipment are stated at historical cost.Amortization is provided for in the accounts in annual amounts equal to the principal mortgagerepayments during the year.
(f) Contributed Surplus
The Corporation purchased land from the Corporation of the City of Brantford which in turngranted the total purchase price to the Corporation. The total amount of costs related to thepurchase of the land has been credited to contributed surplus.
2. PROPERTY, PLANT Accumulated Net Book Value Net Book ValueAND EQUIPMENT Cost Amortization 2015 2014
Beckett Project Land 384,895 - 384,895 384,895Building 5,940,047 5,120,040 820,007 1,031,539Furnishings 53,445 53,445 - -
6,378,387 5,173,485 1,204,902 1,416,434
Branlyn Meadows ProjectLand 490,126 217,457 272,669 289,227Building 1,537,778 682,209 855,569 907,521Furnishings 27,588 12,150 15,438 16,370
2,055,492 911,816 1,143,676 1,213,118
Total 8,433,879 6,085,301 2,348,578 2,629,552
Page 10
Page 90

BRANTFORD MUNICIPAL NON-PROFIT HOUSING CORPORATION
NOTES TO THE FINANCIAL STATEMENTS
For the year ended December 31, 2015
3. LONG TERM LIABILITIES 2015 2014
Beckett Project1.12% first mortgage loan to Canada Mortgage HousingCorporation, due September 2019, payable in monthly installmentsof $18,607 on account of principal and interest 819,620 1,031,152
Branlyn Meadows Project4.37% first mortgage loan to Canada Mortgage and HousingCorporation, due March 2018, payable in monthly installments of$10,023 on account of principal and interest 1,136,047 1,205,489
1,955,667 2,236,641Less: current portion 287,722 280,973
1,667,945 1,955,668
The corporation's land and buildings are pledged as security on the mortgages. Minimum principalrepayment requirements on the mortgages are as follows, assuming the Branlyn Meadows Projectmortgage will be refinanced at a similar rate on maturity:
2016 - 287,7222017 - 293,3752018 - 299,1522019 - 249,1992020 - 86,185
4. REPLACEMENT RESERVE FUNDS
In accordance with the terms of agreements with Canada Mortgage and Housing Corporation and theMinistry of Municipal Affairs and Housing, the Corporation is required to establish a separatereplacement reserve fund and to account for these funds, including interest. The use of these funds isrestricted to the repair and replacement of specific items as permitted by the Ministry of MunicipalAffairs and Housing. The annual contribution for these projects made as directed by the Ministry ofMunicipal Affairs and Housing is:
Beckett Project 39,520Branlyn Meadows Project 14,651
5. RELATED PARTY TRANSACTIONS
The Board of Directors of the Corporation consists of Brantford City Council appointees to the SocialServices Sector Committee. Upon dissolution, after the payments of its liabilities, the Corporation'sremaining property shall be distributed to, or disposed of by, the City of Brantford.
All financial transactions are made on behalf of the Brantford Municipal Non-Profit Housing Corporationby the City of Brantford. Additionally, the staff of the City of Brantford perform all the managementfunctions of the Corporation.
Page 11
Page 91

BRANTFORD MUNICIPAL NON-PROFIT HOUSING CORPORATION
NOTES TO THE FINANCIAL STATEMENTS
For the year ended December 31, 2015
6. STATEMENT OF CHANGES IN FINANCIAL POSITION
A statement of changes in financial position is not required for Ministry of Municipal Affairs andHousing reporting purposes.
7. EMPLOYEE COMPENSATION
As required by the Public Sector Salary Disclosure Act, 1996, no employees were paid a salary of$100,000 or more in 2015 by the Brantford Municipal Non-Profit Housing Corporation.
8. FINANCIAL INSTRUMENTS
Fair Value
The fair value of financial instruments, such as cash and bank, investments, accounts receivable, accountspayable and mortgages payable are determined to approximate their recorded values.
Interest Rate Risk
The Corporation's interest rate risk relates to the refinancing of the Corporation's two mortgages and isdependant on the available interest rates at the time of renewal.
Credit Risk
The Corporation's credit risk relates to its accounts receivable. The risk of significant loss is consideredremote.
Page 12
Page 92

BRANTFORD MUNICIPAL NON-PROFIT HOUSING CORPORATION
SCHEDULE OF PROPERTY, PLANT AND EQUIPMENT AND OTHER LONG TERMLIABILITIES - SHELTER AND NON-SHELTER
SCHEDULE 1
For the year ended December 31, 2015
Property, Plant and Equipment and Long TermLiabilities Shelter Non-Shelter Total
Beckett Project Property, plant and equipment - at cost 4,720,006 1,658,381 6,378,387Less: Accumulated amortization (3,828,379) (1,345,106) (5,173,485)Net Book Value 891,627 313,275 1,204,902Less: Contributed surplus (284,822) (100,073) (384,895)Less: Recovery of interest at refinancing (287) (100) (387)Long Term Liability 606,518 213,102 819,620
Branlyn Meadows ProjectProperty, plant and equipment - at cost 2,055,492 - 2,055,492Less: Accumulated amortization (911,816) - (911,816)Net Book Value 1,143,676 - 1,143,676Less: Interest equity on escrow fund (7,629) - (7,629)Long Term Liability 1,136,047 - 1,136,047
Page 13
Page 93

INDEPENDENT AUDITORS' REPORT
To the Chair and Members of theJohn Noble Home Committee of Management
We have audited the accompanying financial statements of John Noble Home which comprise the statement offinancial position as at December 31, 2015, and the statements of operations and accumulated surplus, change innet financial assets and cash flows for the year then ended, and a summary of significant accounting policies andother explanatory information.
Management's Responsibility for the Financial StatementsManagement is responsible for the preparation and fair presentation of these financial statements in accordancewith Canadian public sector accounting standards, and for such internal control as management determines isnecessary to enable the preparation of financial statements that are free from material misstatement, whether dueto fraud or error.
Auditors' ResponsibilityOur responsibility is to express an opinion on these financial statements based on our audit. We conducted ouraudit in accordance with Canadian generally accepted auditing standards. Those standards require that wecomply with ethical requirements and plan and perform the audit to obtain reasonable assurance about whether thefinancial statements are free from material misstatement.
An audit involves performing procedures to obtain audit evidence about the amounts and disclosures in thefinancial statements. The procedures selected depend on the auditors' judgment, including the assessment of therisks of material misstatement of the financial statements, whether due to fraud or error. In making those riskassessments, the auditor considers internal control relevant to the entity's preparation and fair presentation of thefinancial statements in order to design audit procedures that are appropriate in the circumstances, but not for thepurpose of expressing an opinion on the effectiveness of the entity's internal control. An audit also includesevaluating the appropriateness of accounting policies used and the reasonableness of accounting estimates madeby management, as well as evaluating the overall presentation of the financial statements.
We believe that the audit evidence we have obtained is sufficient and appropriate to provide a basis for our auditopinion.
OpinionIn our opinion, the financial statements present fairly, in all material respects, the financial position of John NobleHome as at December 31, 2015, and the results of its operations, its change in net financial assets and its cashflows for the year then ended in accordance with Canadian public sector accounting standards.
February 25, 2016 CHARTERED PROFESSIONAL ACCOUNTANTSBrantford, Ontario Licensed Public Accountants
Page 1Millard, Rouse & Rosebrugh LLP
Brantford • Hagersville • Simcoe • Delhi • Norwich • Tillsonburg
MillardsChartered Accountants
P.O. Box 367, 96 Nelson StreetBrantford, Ontario N3T 5N3Telephone: (519) 759-3511Facsimile: (519) 759-7961
Page 94

JOHN NOBLE HOME
STATEMENT OF FINANCIAL POSITION
As at December 31 2015 2014
FINANCIAL ASSETSCash and bank 893,704 647,274Accounts receivable - Residents 219,208 261,946
- Other (Note 2) 190,775 204,879- Province of Ontario - Geared to Housing Project 3,464 3,464
Due from City of Brantford - Operating - 202,463Due from County of Brant - Operating - 66,992
1,307,151 1,387,018
LIABILITIESAccounts payable and accrued liabilities 1,109,808 1,044,572Due to City of Brantford - Operating 39,201 -Due to City of Brantford - Capital and special funding 93,557 248,371Due to County of Brant - Operating 150,400 -Due to County of Brant - Capital and special funding 8,012 152,323Due to Province - Funding 81,788 92,069Deferred revenue - Bell Lane Terrace 5,282 3,203
1,488,048 1,540,538
NET FINANCIAL ASSETS (Page 4) (180,897) (153,520)
NON-FINANCIAL ASSETSTangible capital assets (Page 14) 25,918,462 26,935,138Prepaid supplies 167,652 120,610Prepaid expenses 13,244 32,910
26,099,358 27,088,658
TOTAL NET ASSETS 25,918,461 26,935,138
ACCUMULATED SURPLUS (Note 4) 25,918,461 26,935,138
See accompanying notes Page 2
Page 95

JOHN NOBLE HOME
STATEMENT OF OPERATIONS AND ACCUMULATED SURPLUS
Budget Actual ActualFor the year ended December 31 2015 2015 2014
RevenueProvince of Ontario 9,764,248 10,033,805 9,679,344City of Brantford - operations 2,125,957 2,087,725 2,017,674
- capital and special funding - 356,149 842,242County of Brant - operations 855,750 839,308 796,376
- capital and special funding - 141,576 329,691Residents 279,500 348,691 297,583Sundry receipts 42,696 7,351 133,815Bell Lane Terrace (Page 9) - 220,226 219,268
13,068,151 14,034,831 14,315,993
ExpensesMedical nursing services (Page 10) 7,024,319 7,180,168 7,003,412Dietary services (Page 10) 1,318,502 1,347,815 1,317,074Program and support services (Page 10) 716,365 730,306 694,653Housekeeping services (Page 11) 736,897 760,585 775,433Laundry services (Page 11) 410,134 399,483 381,754General, Administrative and Human resources (Page 11) 1,059,090 1,073,300 1,037,633Building and maintenance (Page 12) 1,340,097 1,359,720 1,265,373Raw food and supplements 462,747 465,504 449,459Bell Lane Terrace (Page 9) - 220,226 219,268
13,068,151 13,537,107 13,144,059
Income Before Under-noted Item 497,724 1,171,934
Other Income/(Expense)Amortization of tangible capital assets (1,514,401) (1,514,401) (1,295,676)
Annual Deficit from Operations (1,514,401) (1,016,677) (123,742)Accumulated Surplus - Beginning of Year 26,935,138 27,058,880
Accumulated Surplus - End of Year 25,918,461 26,935,138
See accompanying notes Page 3
Page 96

JOHN NOBLE HOME
STATEMENT OF CHANGE IN NET FINANCIAL ASSETS
For the year ended December 31 2015 2014
Annual Surplus (1,016,677) (123,742)
Amortization of tangible capital assets 1,514,401 1,295,676Acquisition of tangible capital assets (497,725) (1,171,934)Change in supplies inventories (47,042) -Change in prepaid expense 19,666 6,579
Increase (Decrease) in Net Financial Assets (27,377) 6,579Net Financial Assets - Beginning of Year (153,520) (160,099)
Net Financial Assets - End of Year (180,897) (153,520)
STATEMENT OF CASH FLOWS
For the year ended December 31 2015 2014
Cash Flows From Operating ActivitiesAnnual Deficit (1,016,677) (123,742)
Non-cash charges to operations:Amortization of tangible capital assets 1,514,401 1,295,676
497,724 1,171,934
Net change in non-cash working capital balances related to operations (Note 6) 246,431 164,703
Cash provided by (used for) operations 744,155 1,336,637
CapitalAcquisition of tangible capital assets (497,725) (1,171,934)
Net Increase in Cash and Bank 246,430 164,703
Opening Cash and Bank 647,274 482,571
Closing Cash and Bank 893,704 647,274
See accompanying notes Page 4
Page 97

JOHN NOBLE HOME
SCHEDULE OF CONTINUITY OF GENERAL TRUST FUNDS
For the year ended December 31 2015 2014
Balance - Beginning of Year 12,585 24,809
RevenueInterest earned 56 93Donations and other revenue 11,406 11,009
11,462 11,102
ExpensesEquipment and services for residents and staff 19,024 23,326
Balance - End of Year 5,023 12,585
SCHEDULE OF CONTINUITY OF SPECIAL PURPOSE FUND
For the year ended December 31 2015 2014
Balance - Beginning of Year 46,081 62,037
RevenueInterest earned 153 293Donations and other revenue 91,354 76,377
91,507 76,670
ExpensesEquipment and services for residents and staff 82,979 92,626
Balance - End of Year 54,609 46,081
See accompanying notes Page 5
Page 98

JOHN NOBLE HOME
NOTES TO THE FINANCIAL STATEMENTSFor the year ended December 31, 2015
1. SUMMARY OF SIGNIFICANT ACCOUNTING POLICIES
(a) Nature of Operations
The John Noble Home is a 156 bed Municipal Home for the Aged providing long term care. It isoperated jointly by The Corporation of the County of Brant and The Corporation of the City ofBrantford and is legislated by the long term care division of the Ministry of Health under theHomes for the Aged and Rest Homes Act and Bill 101.
The Home also operates 26 affordable housing rental apartments.
(b) Basis of AccountingThese financial statements are prepared by management in accordance with Canadian public sectoraccounting standards as recommended by the Public Sector Accounting Board of CPA Canada.
(c) MeasurementSince precise determination of many assets and liabilities is dependent upon future events, thepreparation of periodic financial statements necessarily involves the use of estimates andapproximations. These have been made using careful judgments.
(d) Current OperationsThe statement of financial position, operations and accumulated surplus and cash flows reflect theday to day operations of the home.
(e) General Trust FundsThe general trust funds are the property of the John Noble Home and are derived from bequests anddonations. The terms of each bequest differ, however, all of the funds are allocated to specificprojects.
(f) Special Purpose FundsThe special purpose fund is the property of the John Noble Home and is from fundraising anddonations. The funds are allocated for specific projects.
(g) Residents' Trust FundsAlthough the residents' trust funds are administered by John Noble Home, the funds are theproperty of the residents. Accordingly, the funds are not reported in the financial statements of theJohn Noble Home.
(h) Revenue RecognitionResident revenue is recorded at the end of each month for the number of days of occupancy. Grantrevenue is recognized when earned and collectability is assured.
(i) Government Transfers
Government transfers are recognized in the financial statements as revenues in the period in whichevents giving rise to the transfer occur, providing the transfers are authorized, any eligibilitycriteria have been met and reasonable estimates of the amounts can be made.
Page 6
Page 99

JOHN NOBLE HOME
NOTES TO THE FINANCIAL STATEMENTSFor the year ended December 31, 2015
1. SUMMARY OF SIGNIFICANT ACCOUNTING POLICIES (Continued)
(j) Tangible Capital AssetsTangible capital assets are stated at cost. Amortization is provided for in the accounts as follows:
Land improvements 40 years straight lineBuilding improvements 40 years straight lineEquipment 5 years straight lineInformation technology 5 years straight lineFurniture and fixtures 10 years straight line
In the year of acquisition and disposal, amortization is provided for at one-half of the above rates.
2. ACCOUNTS RECEIVABLE - OTHER 2015 2014
Alzheimer Day Centre 29,041 31,448Other miscellaneous receivables 161,734 173,431
190,775 204,879
3. BANK LOAN
The John Noble Home holds an unsecured $1,500,000 operating line of credit with the Bank of Montreal.Interest is calculated at prime and any balance is due on demand.
4. ACCUMULATED SURPLUS 2015 2014
Accumulated surplus consists of the following:
Accumulated surplus from operations - -Investment in tangible capital assets 25,918,461 26,935,138
25,918,461 26,935,138
5. PENSION AGREEMENT
The John Noble Home contributes to the Ontario Municipal Employees Retirement Fund (OMERS)which is a multi-employer plan, on behalf of approximately 247 members. The plan is a defined benefitplan which specifies the amount of the retirement benefit to be received by the employees based on thelength of service and rate of pay. The total amount remitted to OMERS for the year 2015 was $596,123(2014 - $566,224). The OMERS pension plan has a deficit. If actuarial surpluses are not available tooffset the existing deficit and subsidize future contributions, increases in contributions will be required inthe future.
Page 7
Page 100
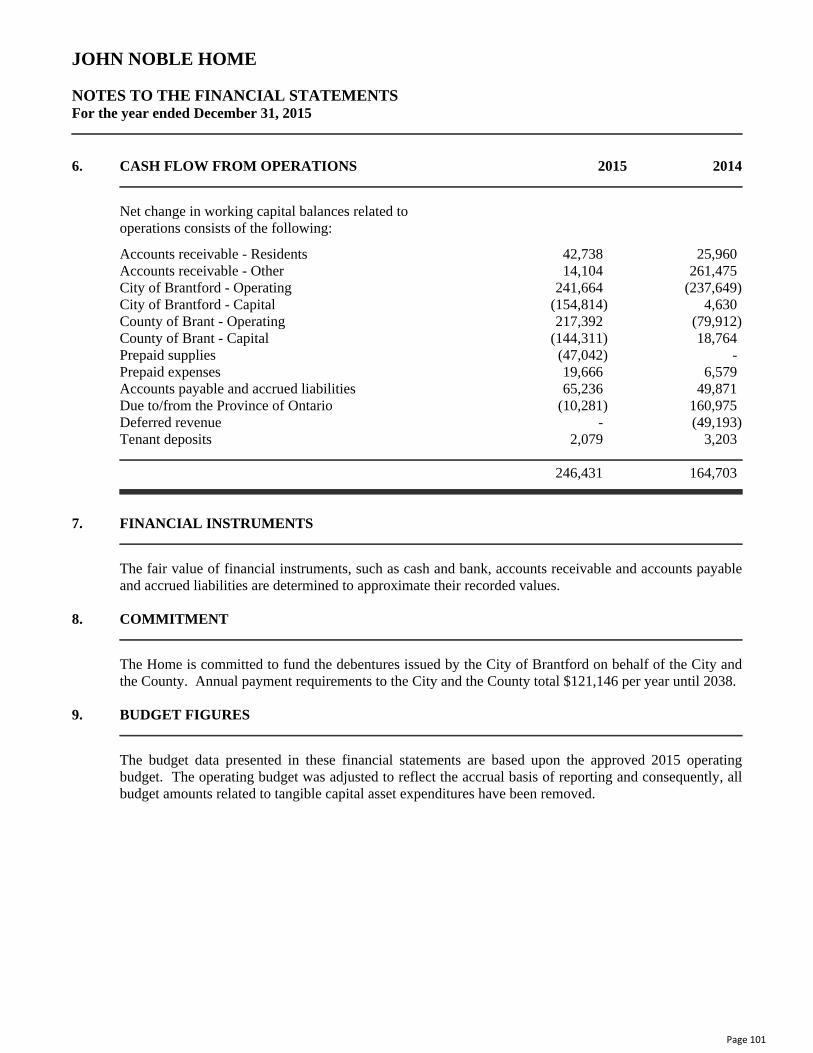
JOHN NOBLE HOME
NOTES TO THE FINANCIAL STATEMENTSFor the year ended December 31, 2015
6. CASH FLOW FROM OPERATIONS 2015 2014
Net change in working capital balances related tooperations consists of the following:
Accounts receivable - Residents 42,738 25,960Accounts receivable - Other 14,104 261,475City of Brantford - Operating 241,664 (237,649)City of Brantford - Capital (154,814) 4,630County of Brant - Operating 217,392 (79,912)County of Brant - Capital (144,311) 18,764Prepaid supplies (47,042) -Prepaid expenses 19,666 6,579Accounts payable and accrued liabilities 65,236 49,871Due to/from the Province of Ontario (10,281) 160,975Deferred revenue - (49,193)Tenant deposits 2,079 3,203
246,431 164,703
7. FINANCIAL INSTRUMENTS
The fair value of financial instruments, such as cash and bank, accounts receivable and accounts payableand accrued liabilities are determined to approximate their recorded values.
8. COMMITMENT
The Home is committed to fund the debentures issued by the City of Brantford on behalf of the City andthe County. Annual payment requirements to the City and the County total $121,146 per year until 2038.
9. BUDGET FIGURES
The budget data presented in these financial statements are based upon the approved 2015 operatingbudget. The operating budget was adjusted to reflect the accrual basis of reporting and consequently, allbudget amounts related to tangible capital asset expenditures have been removed.
Page 8
Page 101

JOHN NOBLE HOME
SCHEDULE OF BELL LANE TERRACE OPERATIONS
Actual ActualFor the year ended December 31 2015 2014
RevenueRental income 175,295 174,795Rental Subsidy - City of Brantford 42,503 41,563Laundry 2,428 2,809Sundry - 101
220,226 219,268
ExpensesRepairs and maintenance 65,834 63,907Utilities 23,988 23,198Cleaning 8,042 8,350Fire alarm monitoring 1,212 2,664Bank charges 4 3
99,080 98,122
Excess of Revenue over Expenses from Operations 121,146 121,146
City/County Financing Charge (Note 9) (121,146) (121,146)
Excess of Revenue over Expenses - -
Page 9
Page 102

JOHN NOBLE HOME
SCHEDULE OF EXPENSES
Budget Actual ActualFor the year ended December 31 2015 2015 2014
Medical Nursing ServicesSalaries and employee benefits 6,779,035 6,973,409 6,819,655Medical supplies 78,000 69,751 74,495Equipment replacement 16,000 6,712 3,577Equipment maintenance 15,000 20,800 7,905Other 42,952 11,129 (159)Incontinence supplies 76,000 81,285 82,280Medical director 17,332 17,082 15,659
7,024,319 7,180,168 7,003,412
Dietary ServicesSalaries and employee benefits 1,255,452 1,297,210 1,263,418Purchased services 5,500 - -Equipment operations and maintenance 14,700 11,189 11,574Supplies 38,300 35,289 36,348Other 4,550 4,127 5,734
1,318,502 1,347,815 1,317,074
Program and Support ServicesSalaries and employee benefits 579,038 584,960 565,832Purchased services 13,163 18,304 15,764Equipment, operations, maintenance and replacement 1,549 1,190 1,229Other 119,000 122,422 107,871Recreation and entertainment 3,615 3,430 3,957
716,365 730,306 694,653
Page 10
Page 103

JOHN NOBLE HOME
SCHEDULE OF EXPENSES
Budget Actual ActualFor the year ended December 31 2015 2015 2014
Housekeeping ServicesSalaries and employee benefits 688,252 720,344 733,131Purchased services 168 51 135Equipment operations and maintenance 2,000 4,894 968Supplies 43,256 35,296 39,879Equipment replacement 3,221 - 1,320
736,897 760,585 775,433
Laundry ServicesSalaries 373,698 369,470 356,681Replacement of linens 10,175 10,595 4,109Equipment operations and maintenance 5,087 4,978 8,262Supplies 21,174 14,440 12,702
410,134 399,483 381,754
General, Administrative and Human ResourcesSalaries and employee benefits 810,852 834,621 756,683Bank charges - (855) (1,405)Purchased services 121,343 73,741 121,507Equipment replacement 10,100 553 9,137O.A.N.H.S.S. membership and meeting expenses 18,550 17,724 28,749Health and safety 5,063 3,430 4,551Other 81,007 127,115 107,339Professional fees 12,175 16,971 11,072
1,059,090 1,073,300 1,037,633
Page 11
Page 104

JOHN NOBLE HOME
SCHEDULE OF EXPENSES
Budget Actual ActualFor the year ended December 31 2015 2015 2014
Building and MaintenanceSalaries and benefits 381,440 369,859 271,498Purchased services 105,030 133,821 123,337Equipment operations and maintenance 117,214 101,224 115,388Miscellaneous supplies 9,347 5,589 10,898Cable TV 3,074 2,467 1,569Electricity 212,180 378,877 306,796Water and sewer charges 72,225 93,597 135,722Heating 220,582 112,244 119,752Telephone 21,825 28,728 24,656Garbage collection 33,813 25,631 38,849Insurance 74,377 77,373 54,420Building and grounds maintenance 126,037 69,110 102,114Expense recoveries (37,047) (38,800) (39,626)
1,340,097 1,359,720 1,265,373
Page 12
Page 105

JOHN NOBLE HOME
SCHEDULE OF TANGIBLE CAPITAL ASSETS For the year ended December 31, 2015
Land and LandImprovements Building
Building - BellLane Terrace
BuildingImprovements Equipment
InformationTechnology
Furniture andFixtures Total 2015 Total 2014
CostBalance, beginning of year 232,634 32,316,697 2,960,846 2,006,531 874,531 147,028 610,503 39,148,770 37,976,836Additions during the year - - - 313,299 4,492 179,934 - 497,725 1,171,934Other - - - - - - - - -Balance, end of year 232,634 32,316,697 2,960,846 2,319,830 879,023 326,962 610,503 39,646,495 39,148,770
Accumulated AmortizationBalance, beginning of year 189,270 8,755,972 1,223,580 1,008,274 445,385 145,843 445,308 12,213,632 10,917,956Amortization during the year 2,021 1,146,846 148,042 90,112 81,946 263 45,171 1,514,401 1,295,676Balance, end of year 191,291 9,902,818 1,371,622 1,098,386 527,331 146,106 490,479 13,728,033 12,213,632Net book value of tangiblecapital assets 41,343 22,413,879 1,589,224 1,221,444 351,692 180,856 120,024 25,918,462 26,935,138
Page 13
Page 106
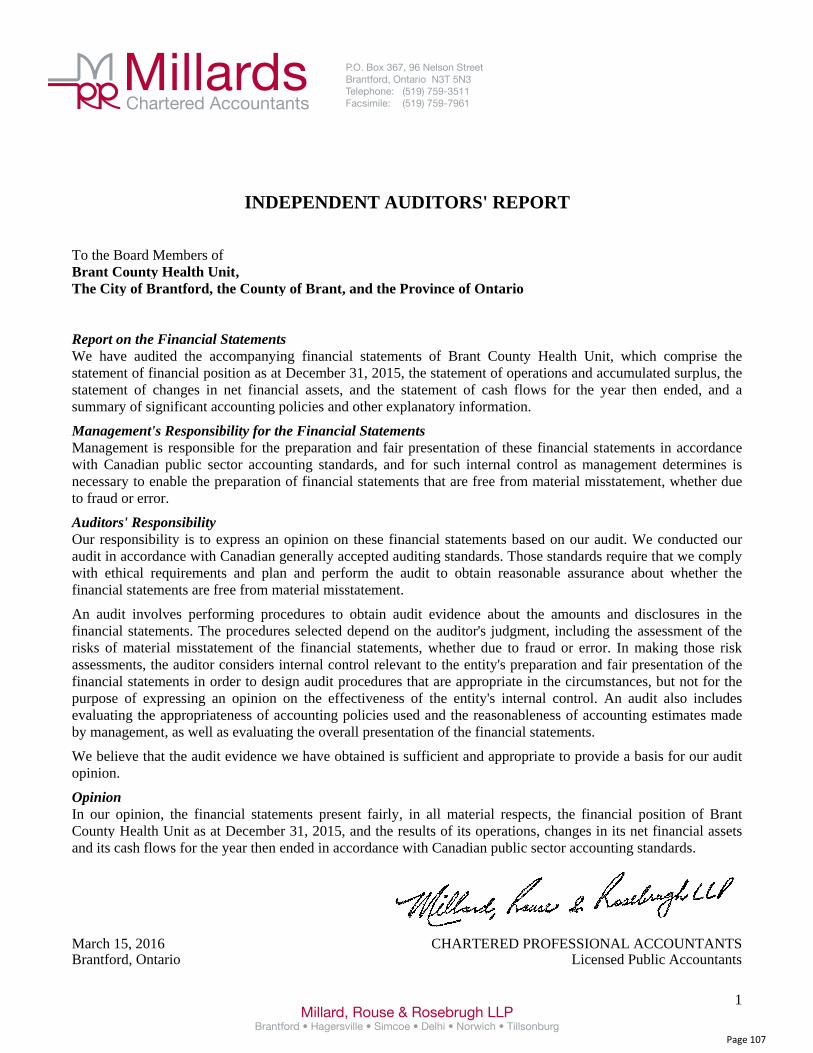
INDEPENDENT AUDITORS' REPORT
To the Board Members ofBrant County Health Unit,The City of Brantford, the County of Brant, and the Province of Ontario
Report on the Financial StatementsWe have audited the accompanying financial statements of Brant County Health Unit, which comprise thestatement of financial position as at December 31, 2015, the statement of operations and accumulated surplus, thestatement of changes in net financial assets, and the statement of cash flows for the year then ended, and asummary of significant accounting policies and other explanatory information.
Management's Responsibility for the Financial StatementsManagement is responsible for the preparation and fair presentation of these financial statements in accordancewith Canadian public sector accounting standards, and for such internal control as management determines isnecessary to enable the preparation of financial statements that are free from material misstatement, whether dueto fraud or error.
Auditors' ResponsibilityOur responsibility is to express an opinion on these financial statements based on our audit. We conducted ouraudit in accordance with Canadian generally accepted auditing standards. Those standards require that we complywith ethical requirements and plan and perform the audit to obtain reasonable assurance about whether thefinancial statements are free from material misstatement.
An audit involves performing procedures to obtain audit evidence about the amounts and disclosures in thefinancial statements. The procedures selected depend on the auditor's judgment, including the assessment of therisks of material misstatement of the financial statements, whether due to fraud or error. In making those riskassessments, the auditor considers internal control relevant to the entity's preparation and fair presentation of thefinancial statements in order to design audit procedures that are appropriate in the circumstances, but not for thepurpose of expressing an opinion on the effectiveness of the entity's internal control. An audit also includesevaluating the appropriateness of accounting policies used and the reasonableness of accounting estimates madeby management, as well as evaluating the overall presentation of the financial statements.
We believe that the audit evidence we have obtained is sufficient and appropriate to provide a basis for our auditopinion.
OpinionIn our opinion, the financial statements present fairly, in all material respects, the financial position of BrantCounty Health Unit as at December 31, 2015, and the results of its operations, changes in its net financial assetsand its cash flows for the year then ended in accordance with Canadian public sector accounting standards.
March 15, 2016 CHARTERED PROFESSIONAL ACCOUNTANTSBrantford, Ontario Licensed Public Accountants
1Millard, Rouse & Rosebrugh LLP
Brantford • Hagersville • Simcoe • Delhi • Norwich • Tillsonburg
MillardsChartered Accountants
P.O. Box 367, 96 Nelson StreetBrantford, Ontario N3T 5N3Telephone: (519) 759-3511Facsimile: (519) 759-7961
Page 107

BRANT COUNTY HEALTH UNIT
STATEMENT OF FINANCIAL POSITION
As at December 31 2015 2014
ASSETSCurrent Assets
Cash and short term investments (Note 3) 1,736,571 2,190,142Accounts receivable (Note 4) 142,133 181,140
1,878,704 2,371,282
LIABILITIES AND FUND BALANCESCurrent Liabilities
Accounts payable and accrued liabilities (Note 5) 962,554 1,454,779Due to Province of Ontario (Note 6) 41,540 120,414Due to City of Brantford (Note 7) - 900Due to County of Brant (Note 7) 200,338 200,338Deferred revenue 713,555 689,034Due to Health Canada (Note 7) 17,325 17,069Helen Van Sickle Fund (Note 8) 79,470 76,150
2,014,782 2,558,684
NET FINANCIAL LIABILITIES (136,078) (187,402)
Non-Financial AssetsPrepaid expenses 56,554 137,013Tangible capital assets (Note 9) 2,131,445 2,318,922
2,187,999 2,455,935
NET ASSETS 2,051,921 2,268,533
ACCUMULATED SURPLUS (Note 10) 2,051,921 2,268,533
Approved on behalf of the Board of Directors
_____________________________ Chair _____________________________ Treasurer
See accompanying notes 2
Page 108

BRANT COUNTY HEALTH UNITSTATEMENT OF OPERATIONS AND ACCUMULATED SURPLUS
2015 2015 2014For the year ended December 31 Budget Actual Actual
RevenuesMOHLTC - Public Health Division 4,521,364 4,555,365 4,530,603MOHLTC - Public Health Division - One time funding 232,410 223,226 286,008MOHLTC - Compensation 110,510 124,020 125,343MOHLTC - Health Promotion Division 3,160,840 3,160,840 3,160,835Ministry of Education 50,250 50,250 50,250Ministry of Children and Youth Services 1,030,735 1,030,733 1,029,138Health Canada 81,130 81,130 95,214City of Brantford 2,272,356 2,272,356 2,240,299County of Brant 914,679 914,679 884,246MOHLTC - Health Promotion Division - 100% funding 381,025 378,229 331,600MOHLTC - Health Promotion Division - One time funding 8,700 8,700 8,700Vaccines 38,500 29,523 43,271Other revenues and user fees 190,420 228,526 240,800
12,992,919 13,057,577 13,026,307
ExpensesAccreditation - - 1,150Advertising and promotional materials 128,692 68,324 152,019Amortization - 251,823 248,669Audit and legal fees 93,900 199,064 173,719Building maintenance and utilities 347,874 311,622 257,475Employee benefits 2,241,461 2,246,558 2,061,932Enhanced program initiatives 174,214 157,150 149,605Fees and honorariums 8,000 4,768 7,096Insurance 20,000 20,090 19,563Postage and courier 6,500 13,050 28,823Professional fees 333,359 443,157 174,454Memberships, subscriptions and publications 27,236 21,681 21,516Office supplies and equipment 114,718 64,806 62,075One-time costs 87,500 33,129 16,899Salaries and wages 8,379,481 8,417,391 8,274,105Special projects 70,000 78,008 76,501Staff development 111,961 97,066 127,492Supplies and services 413,622 356,731 440,603Technology improvements 312,243 316,617 266,500Telephone 55,280 26,812 63,667Travel 66,878 56,983 61,096Vaccine supplies - 29,523 43,271
12,992,919 13,214,353 12,728,230
Annual Surplus Before Deferred Revenueand Expected Settlements - (156,776) 298,077
Current year deferred revenue and expected governmentcontribution settlements (Note 7) - (59,836) (177,124)
Current year deferred capital funding contributions - - (76,662)
Annual Surplus - (216,612) 44,291Accumulated Surplus, beginning of year - 2,268,533 2,224,242
Accumulated Surplus, end of year - 2,051,921 2,268,533
See accompanying notes 3
Page 109
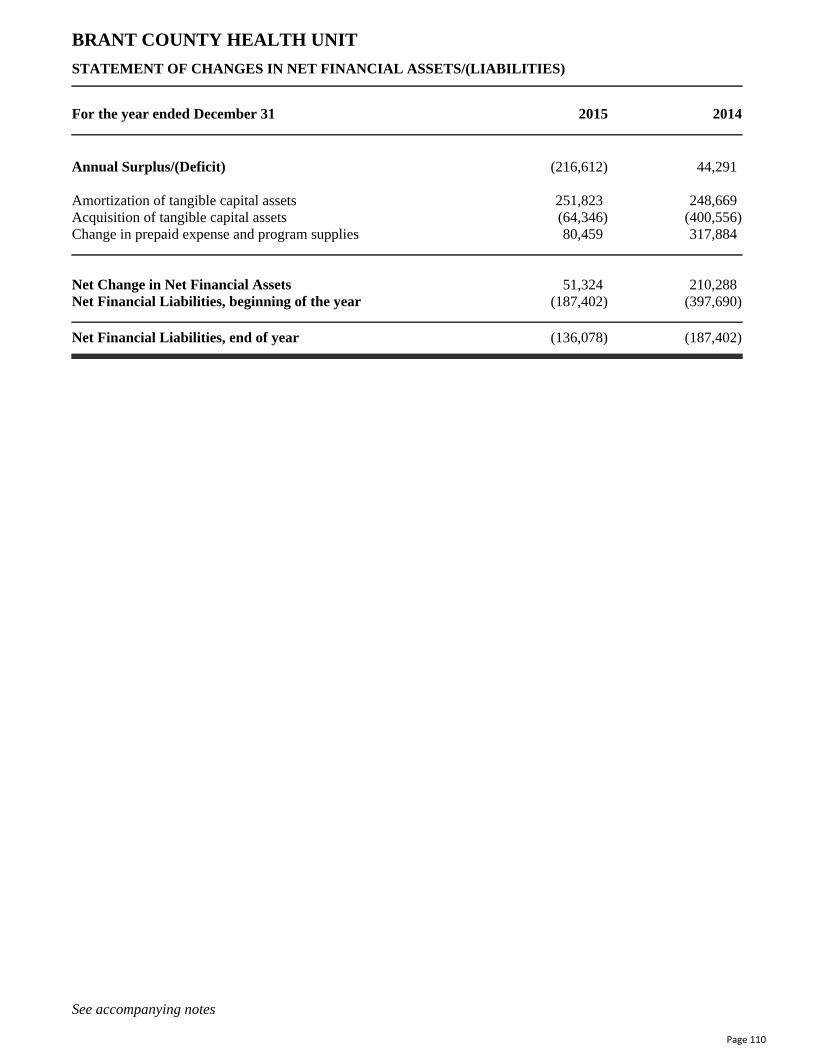
BRANT COUNTY HEALTH UNIT
STATEMENT OF CHANGES IN NET FINANCIAL ASSETS/(LIABILITIES)
For the year ended December 31 2015 2014
Annual Surplus/(Deficit) (216,612) 44,291
Amortization of tangible capital assets 251,823 248,669Acquisition of tangible capital assets (64,346) (400,556)Change in prepaid expense and program supplies 80,459 317,884
Net Change in Net Financial Assets 51,324 210,288Net Financial Liabilities, beginning of the year (187,402) (397,690)
Net Financial Liabilities, end of year (136,078) (187,402)
See accompanying notes 4
Page 110

BRANT COUNTY HEALTH UNIT
SCHEDULE OF FINANCIAL ACTIVITIESCost Shared Programs - Schedule 1
For the year ended December 31 2015 2014
RevenuesMOHLTC - Public Health Division 3,493,560 3,493,554MOHLTC - Public Health Division - One-time funding 203,025 254,938MOHLTC - Compensation 124,020 125,343MOHLTC - Health Promotion Division 3,160,840 3,160,835County of Brant 902,338 872,106City of Brantford 2,241,697 2,209,541Vaccines 29,523 43,271Other revenues and user fees 221,553 219,829
Total Revenues 10,376,556 10,379,417
ExpensesAccreditation - 1,150Advertising and promotional materials 47,557 116,459Amortization 251,823 248,669Audit and legal 97,323 98,042Building maintenance and utilities 308,373 257,475Employee benefits 1,778,283 1,616,667Enhanced program initiatives 157,150 149,605Fees and honorariums 4,768 7,096Insurance 20,090 19,563Postage and courier 13,050 28,823Professional fees 442,407 170,704Memberships, subscriptions and publications 20,596 21,006Office supplies and equipment 56,190 44,075Salaries and wages 6,608,903 6,535,376Special projects 78,008 76,501Staff development 83,170 103,987Supplies and services 223,267 325,899Technology improvements 311,831 266,500Telephone 21,234 53,026Travel 31,626 38,371Vaccine supplies 29,523 43,271
Total Expenses 10,585,172 10,222,265
Excess of Revenues over Expenses (Expenses over Revenues)for the Year Before Expected Settlements and Undernoted Items (208,616) 157,152Current year deferred revenue and expected government contribution settlements (Note 7) (7,998) (36,199)Current year deferred capital contribution funding - (76,662)
Excess of Revenues over Expenses(Expenses over Revenues) for the Year (216,614) 44,291
Reconciliation for Funding PurposesExcess of revenue over expenses for the year as above (216,614) 44,291Add: Amortization 251,823 248,669Less: Capital asset (35,211) (292,960)
Excess of Revenues over Expenses (Expenses over Revenues)for the Year Funding Purposes (2) -
See accompanying notes 5
Page 111
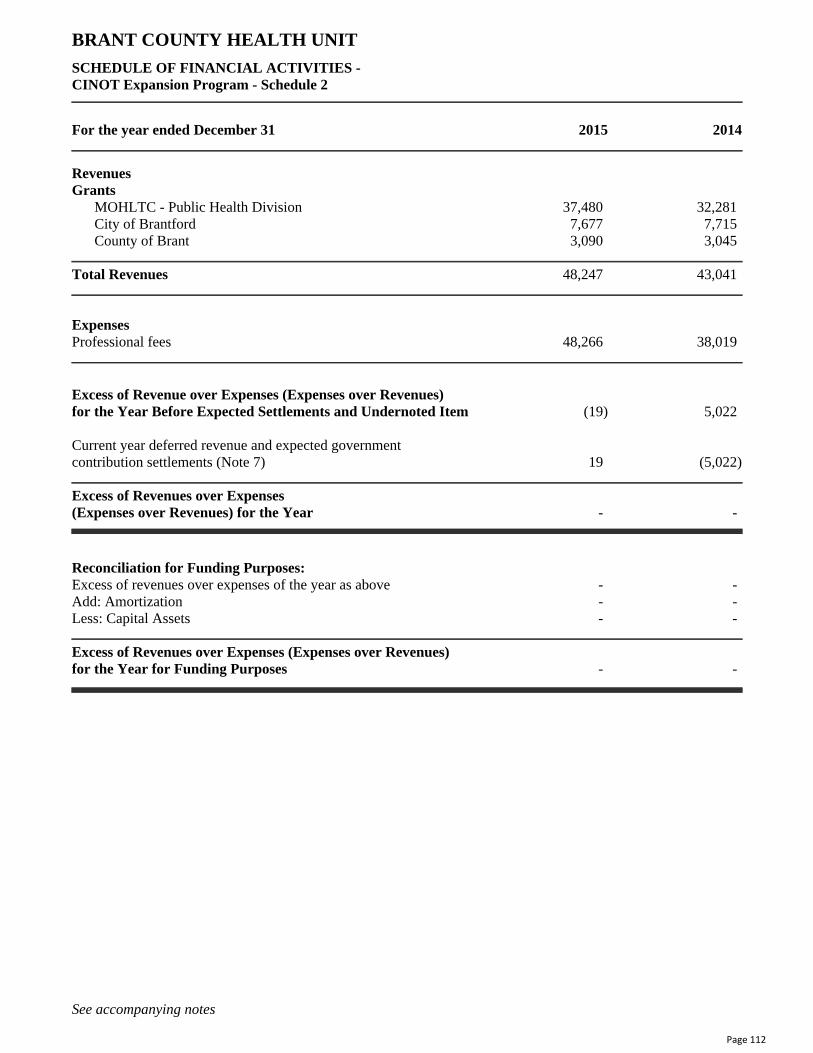
BRANT COUNTY HEALTH UNIT
SCHEDULE OF FINANCIAL ACTIVITIES - CINOT Expansion Program - Schedule 2
For the year ended December 31 2015 2014
RevenuesGrants
MOHLTC - Public Health Division 37,480 32,281City of Brantford 7,677 7,715County of Brant 3,090 3,045
Total Revenues 48,247 43,041
ExpensesProfessional fees 48,266 38,019
Excess of Revenue over Expenses (Expenses over Revenues)for the Year Before Expected Settlements and Undernoted Item (19) 5,022
Current year deferred revenue and expected government contribution settlements (Note 7) 19 (5,022)
Excess of Revenues over Expenses (Expenses over Revenues) for the Year - -
Reconciliation for Funding Purposes:Excess of revenues over expenses of the year as above - -Add: Amortization - -Less: Capital Assets - -
Excess of Revenues over Expenses (Expenses over Revenues)for the Year for Funding Purposes - -
See accompanying notes 6
Page 112

BRANT COUNTY HEALTH UNIT
SCHEDULE OF FINANCIAL ACTIVITIES -CANADA PRENATAL NUTRITION PROGRAM - Schedule 3
For the year ended December 31 2015 2014
RevenuesGrants
Health Canada 81,130 95,214
ExpensesAdvertising 6,304 2,800Employee benefits 10,125 11,093Professional fees 1,781 2,437Office supplies and equipment 750 2,000Salaries and wages 39,513 48,392Staff development 653 96Supplies and services 21,250 10,670Telephone - 472Travel 498 185
Total Expenses 80,874 78,145
Excess of Revenues over Expenses (Expenses over Revenues)for the Year Before Expected Settlements and Undernoted Item 256 17,069
Current year deferred revenue and expected government contributionsettlements (Note 7) (256) (17,069)
Excess of Revenues over Expenses (Expenses over Revenues) for the Year - -
Reconciliation for Funding Purposes:Excess of revenue over expenses for the year as above - -Add: Amortization - -Less: Capital Assets - -
Excess of Revenues over Expenses (Expenses over Revenues)for the Year for Funding Purposes - -
See accompanying notes 7
Page 113

BRANT COUNTY HEALTH UNIT
SCHEDULE OF FINANCIAL ACTIVITIES DATA ANALYSIS COORDINATOR PROGRAM - Schedule 4
For the year ended December 31 2015 2014
RevenuesMinistry of Education 50,250 50,250
ExpensesAudit and legal fees - 750Employee benefits 11,453 11,275Office supplies and equipment - 157Salaries and wages 38,796 37,493Staff development - 519Telephone - 3Travel - 54
Total Expenses 50,249 50,251
Excess of Revenues over Expenses (Expenses over Revenues)for the Year Before Expected Settlements and Undernoted Item 1 (1)
Current year deferred revenue and expected government contributionsettlements (Note 7) (1) 1
Excess of Revenues over Expenses (Expenses over Revenues)for the Year - -
Reconciliation for Funding Purposes:Excess of revenues over expenses for the year as above - -Add: Amortization - -Less: Capital Assets - -
Excess of Revenues over Expenses (Expenses over Revenues)for the Year for Funding Purposes - -
See accompanying notes 8
Page 114

BRANT COUNTY HEALTH UNIT
SCHEDULE OF FINANCIAL ACTIVITIESHealthy Babies Healthy Children - Schedule 5
For the year ended December 31 2015 2014
Revenues Grants
MOHLTC - Public Health Division 1,030,733 930,735Other revenue and user fees 6,972 4,071
Total Revenues 1,037,705 934,806
ExpensesAdvertising 876 4,312Audit and legal fees 750 750Employee benefits 223,618 194,601Memberships, subscriptions and publications 965 50Office supplies and equipment - 665Salaries and wages 783,629 709,688Staff development 3,432 4,084Supplies and services 9,702 4,298Telephone 4,062 7,050Travel 10,670 9,306
Total Expenses 1,037,704 934,804
Excess of Revenues over Expenses (Expenses over Revenues)for the Year Before Expected Settlements and Undernoted Item 1 2
Current year deferred revenue and expected government contributionsettlements (Note 7) (1) (2)
Excess of Revenues over Expenses (Expenses over Revenues) for the Year - -
Reconciliation for Funding Purposes:Excess of revenues over expenses for the year as above - -Add: Amortization - -Less: Capital Assets - -
Excess of Revenues over Expenses (Expenses over Revenues)for the Year for Funding Purposes - -
See accompanying notes 9
Page 115

BRANT COUNTY HEALTH UNIT
SCHEDULE OF FINANCIAL ACTIVITIES -Healthy Smiles Ontario Program - Schedule 6
For the year ended December 31 2015 2014
RevenuesGrants
MOHLTC - Public Health Division 332,900 349,757
ExpensesAdvertising and promotion 9,952 12,392Employee benefits 30,695 26,561Professional fees 41,052 30,421Memberships 120 -Office supplies and equipment 2,591 9,710Repair and maintenance 3,248 -Salaries and wages 149,722 122,623Staff development 1,411 -Supplies and services 66,366 63,204Telephone 244 750Travel 155 244
Total Expenses 305,556 265,905
Excess of Revenues over Expenses (Expenses over Revenues)for the Year Before Expected Settlements and Undernoted Item 27,344 83,852
Current year deferred revenue and expected government contribution settlements (Note 7) (27,344) (83,853)
Excess of Revenues over Expenses (Expenses over Revenues)for the Year - (1)
Reconciliation for Funding Purposes:Excess of revenues over expenses for the year as above - (1)Add: Amortization - -Less: Capital Assets - -
Excess of Revenues over Expenses (Expenses over Revenues)for the Year for Funding Purposes - (1)
See accompanying notes 10
Page 116

BRANT COUNTY HEALTH UNIT
SCHEDULE OF FINANCIAL ACTIVITIES Infection Prevention and Control Nurses Initiative - Schedule 7
For the year ended December 31 2015 2014
RevenueGrants
MOHLTC - Public Health Division 90,100 90,066
ExpensesEmployee benefits 19,389 19,529Salaries and wages 70,711 70,536Telephone - -
Total Expenses 90,100 90,065
Excess of Revenues over Expenses (Expenses over Revenues)for the Year Before Expected Settlements and Undernoted Item - 1
Current year deferred revenue and expected government contributionsettlements (Note 7) - (1)
Excess of Revenues over Expenses (Expenses over Revenues)for the Year - -
Reconciliation for Funding Purposes:Excess of revenues over expenses for the year as above - -Add: Amortization - -Less: Capital Assets - -
Excess of Revenues over Expenses (Expenses over Revenues)for the Year for Funding Purposes - -
See accompanying notes 11
Page 117

BRANT COUNTY HEALTH UNIT
SCHEDULE OF FINANCIAL ACTIVITIES Infectious Diseases Control Initiative (SARS) - Schedule 8
For the year ended December 31 2015 2014
RevenuesGrants
MOHLTC - Public Health Division 166,700 166,670
ExpensesAdvertising 2,522 11,052Employee benefits 31,375 29,223Memberships, subscriptions and publications - 460Office supplies and equipment 3 3,500Salaries and wages 121,186 108,606Staff development 5,981 12,979Supplies and services 5,082 308Telephone 406 505Travel 148 37
Total Expenses 166,703 166,670
Excess of Revenues over Expenses (Expenses over Revenues)for the Year Before Expected Settlements and Undernoted Item (3) -
Current year deferred revenue and expected government contribution settlements (Note 7) 3 -
Excess of Revenues over Expenses (Expenses over Revenues)for the Year - -
Reconciliation for Funding Purposes:Excess of revenue over expenses for the year as above - -Add: Amortization - -Less: Capital Assets - -
Excess of Revenues over Expenses (Expenses over Revenues)for the Year for Funding Purposes - -
See accompanying notes 12
Page 118

BRANT COUNTY HEALTH UNIT
SCHEDULE OF FINANCIAL ACTIVITIES SMALL DRINKING WATER SYSTEMS - Schedule 9
For the year ended December 31 2015 2014
RevenuesGrants
MOHLTC - Public Health Division 27,600 27,575City of Brantford 6,560 6,591County of Brant 2,640 2,601
Total Revenues 36,800 36,767
ExpensesAdvertising - -Employee benefits 6,729 6,706Office supplies and equipment - 1,001Salaries and wages 26,883 25,938Supplies and services - 1,795Staff development - -Technology improvements 2,393 -Telephone 102 807Travel 694 521
Total Expenses 36,801 36,768
Excess of Revenues over Expenses (Expenses over Revenues)for the Year Before Expected Settlements and Undernoted Item (1) (1)
Current year deferred revenue and expected government contribution settlements (Note 7) 1 1
Excess of Revenues over Expenses (Expenses over Revenues)for the Year - -
Reconciliation for Funding PurposesExcess of revenues over expenses for the year as above - -Add: Amortization - -Less: Capital Assets - -
Excess of Revenues over Expenses (Expenses over Revenues)for the Year for Funding Purposes - -
See accompanying notes 13
Page 119
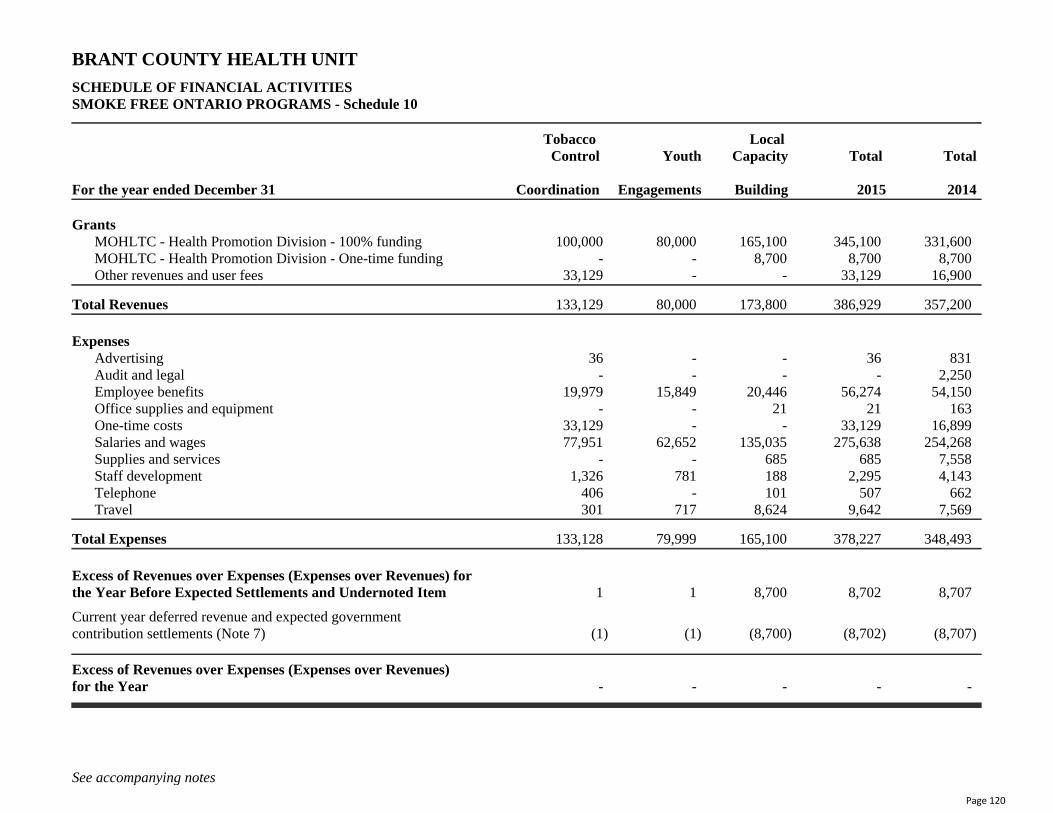
BRANT COUNTY HEALTH UNIT
SCHEDULE OF FINANCIAL ACTIVITIES SMOKE FREE ONTARIO PROGRAMS - Schedule 10
Tobacco Local Control Youth Capacity Total Total
For the year ended December 31 Coordination Engagements Building 2015 2014
GrantsMOHLTC - Health Promotion Division - 100% funding 100,000 80,000 165,100 345,100 331,600MOHLTC - Health Promotion Division - One-time funding - - 8,700 8,700 8,700Other revenues and user fees 33,129 - - 33,129 16,900
Total Revenues 133,129 80,000 173,800 386,929 357,200
ExpensesAdvertising 36 - - 36 831Audit and legal - - - - 2,250Employee benefits 19,979 15,849 20,446 56,274 54,150Office supplies and equipment - - 21 21 163One-time costs 33,129 - - 33,129 16,899Salaries and wages 77,951 62,652 135,035 275,638 254,268Supplies and services - - 685 685 7,558Staff development 1,326 781 188 2,295 4,143Telephone 406 - 101 507 662Travel 301 717 8,624 9,642 7,569
Total Expenses 133,128 79,999 165,100 378,227 348,493
Excess of Revenues over Expenses (Expenses over Revenues) forthe Year Before Expected Settlements and Undernoted Item 1 1 8,700 8,702 8,707
Current year deferred revenue and expected government contribution settlements (Note 7) (1) (1) (8,700) (8,702) (8,707)
Excess of Revenues over Expenses (Expenses over Revenues) for the Year - - - - -
See accompanying notes 14
Page 120

BRANT COUNTY HEALTH UNIT
SCHEDULE OF FINANCIAL ACTIVITIES Vector Borne Disease - Schedule 11
For the year ended December 31 2015 2014
RevenuesGrantsMOHLTC - Public Health Division 69,100 68,838
City of Brantford 16,423 16,452County of Brant 6,610 6,494
Total Revenues 92,133 91,784
ExpensesAdvertising 1,077 4,174Employee benefits 10,638 10,010Office supplies and equipment 5,251 804Salaries and wages 43,514 44,085Supplies and services 25,331 26,872Staff development 124 959Telephone 256 391Technology improvements 2,393 -Travel 3,550 4,488
Total Expenses 92,134 91,783
Excess of Revenues over Expenses (Expenses over Revenues)for the Year Before Expected Settlements and Undernoted Item (1) 1
Current year deferred revenue and expected government contribution settlements (Note 7) 1 (1)
Excess of Revenues over Expenses (Expenses over Revenues)for the Year - -
Reconciliation for Funding PurposesExcess of revenues over expenses for the year as above - -Add: Amortization - -Less: Capital Assets - -
Excess of Revenues over Expenses (Expenses over Revenues)for the Year for Funding Purposes - -
See accompanying notes 15
Page 121

BRANT COUNTY HEALTH UNIT
SCHEDULE OF FINANCIAL ACTIVITIES 9000 Nurses - Schedule 12
Chief SocialNursing Determinants Total Total
For the year ended December 31 Officer of Health 2015 2014
RevenuesGrants
MOHLTC - Health Promotion Division - 100% funding 121,500 180,500 302,000 301,862Ministry of Children and Youth Services - - - 98,403
Total Revenues 121,500 180,500 302,000 400,265
ExpensesEmployee benefits 24,651 39,104 63,755 82,117Salaries and wages 96,849 141,395 238,244 317,099Supplies and services - - - -Staff development - - - 726Telephone - - - -Travel - - - 322
Total Expenses 121,500 180,499 301,999 400,264
Excess of Revenues over Expenses (Expenses over Revenues) forthe Year Before Expected Settlements and Undernoted Item - 1 1 1
Current year deferred revenue and expected government contribution settlements (Note 7) - (1) (1) (2)
Excess of Revenues over Expenses (Expenses over Revenues) for the Year - - - (1)
See accompanying notes 16
Page 122

BRANT COUNTY HEALTH UNIT
SCHEDULE OF FINANCIAL ACTIVITIES Healthy Communities Partnership Fund - Schedule 13
For the year ended December 31 2015 2014
RevenuesGrants
MOHLTC - Public Health Division 20,201 31,070
ExpensesProfessional fees 10,642 4,800Office supplies and equipment 5,049 -
Total Expenses 15,691 4,800
Excess of Revenues over Expenses (Expenses over Revenues) forthe Year Before Expected Settlements and Undernoted Item 4,510 26,270
Current year deferred revenue and expected government contribution settlements (Note 7) (4,510) (26,270)
Excess of Revenues over Expenses (Expenses over Revenues)for the Year - -
Reconciliation for Funding PurposesExcess of revenues over expenses for the year as above - -Add: Amortization - -Less: Capital Assets - -
Excess of Revenues over Expenses (Expenses over Revenues) forthe Year for Funding Purposes - -
See accompanying notes 17
Page 123

BRANT COUNTY HEALTH UNIT
SCHEDULE OF FINANCIAL ACTIVITIES Electronic Cigarettes Act Program - Schedule 14
For the year ended December 31 2015 2014
RevenuesGrants
MOHLTC - Public Health Division 35,925 -
ExpensesEmployee benefits 4,224 -Salaries and wages 20,652 -
Total Expenses 24,876 -
Excess of Revenues over Expenses (Expenses over Revenues) forthe Year Before Expected Settlements and Undernoted Item 11,049 -
Current year deferred revenue and expected government contribution settlements (Note 7) (11,049) -
Excess of Revenues over Expenses (Expenses over Revenues)for the Year - -
Reconciliation for Funding PurposesExcess of revenues over expenses for the year as above - -Add: Amortization - -Less: Capital Assets - -
Excess of Revenues over Expenses (Expenses over Revenues) forthe Year for Funding Purposes - -
See accompanying notes 18
Page 124

BRANT COUNTY HEALTH UNIT
STATEMENT OF CASH FLOWS
For the year ended December 31 2015 2014
Cash Flows From Operating ActivitiesExcess/(lack) of funding over expenses (216,612) 44,291Charges (credits) to income not involving cash
Amortization 251,823 248,669
35,211 292,960
Source (Uses) of Cash:Accounts receivable 39,007 46,975Prepaid expenses and program supplies 80,459 317,884Accounts payable and accrued liabilities (492,225) 123,338Due to Province of Ontario (78,874) (119,825)Deferred revenue 24,521 65,646Due to/from Health Canada 256 (9,223)Due to municipalities (900) (56,247)Funding reserves 3,320 2,374
(424,436) 370,922
Cash Flows From Capital ActivitiesAcquisition of capital assets (64,346) (400,556)
Net Decrease in Cash and Cash Equivalents (453,571) 263,326Opening Cash and Cash Equivalents 2,190,142 1,926,816
Closing Cash and Cash Equivalents 1,736,571 2,190,142
See accompanying notes 19
Page 125

BRANT COUNTY HEALTH UNIT
NOTES TO THE FINANCIAL STATEMENTSFor the year ended December 31, 2015
1. DESCRIPTION OF OPERATIONS
The Brant County Health Unit provides health promotion, disease prevention, and health protectionservices designed to help all members of Brantford and Brant County achieve optimal health. The HealthUnit operates various ongoing and one time programs under the Ontario Public Health Standards. Theseprograms are funded either under the cost shared funding arrangement between the Province of Ontario,the City of Brantford and the County of Brant, or 100% funded by the Province of Ontario.
2. SUMMARY OF SIGNIFICANT ACCOUNTING POLICIES
The financial statements of the Health Unit are the responsibility of management. They have beenprepared in accordance with Canadian generally accepted accounting principles established by the PublicSector Accounting Board of the Chartered Professional Accountants Canada. The Health Unit has adoptedthe following policies:
(a) Basis of Accounting
i) The operations reported in the financial statements reflect all programs.
ii) The operations of the Brant County Health Unit for the general program are funded jointly bythe Ministry of Health and Long-Term Care, The Corporation of the County of Brant and TheCorporation of the City of Brantford. For the other December 31, year end programs, funding isfrom the Ministry of Long-Term Care and Ministry of Children & Youth Services. Each year theamount of expenditure is based upon budgeted approvals and is funded accordingly. Fundingamounts not received at year end are recorded as receivable. Funding amounts in excess of actualexpenditures incurred during the year are recorded as payable to the funding agency or deferred.
Revenue and expenses are reported on the accrual basis of accounting. The accrual basis ofaccounting records revenue as it is earned and measurable. Expenses are recognized as they areincurred and measurable based upon receipt of goods or services and/or the creation of legalobligation to pay.
Government transfers are recognized in the financial statements as revenues in the period in whichthe events giving rise to the transfer occur, providing the transfers are authorized, any eligibilitycriteria have been met, and reasonable estimates of the amounts can be made.
(b) Tangible Capital Assets
Tangible Capital Assets are recorded at cost and amortized on a straight line basis over theireconomic life.
Building 20 years straight line Office Equipment 6-8 years straight lineLeasehold Improvements 25 years straight lineWebsite 10 years straight lineComputer 4-5 years straight-line
In the year of acquisition, amortization is provided for at one-half of the above rates. Noamortization is provided for in the year of disposal.
20
Page 126

BRANT COUNTY HEALTH UNIT
NOTES TO THE FINANCIAL STATEMENTSFor the year ended December 31, 2015
2. SUMMARY OF SIGNIFICANT ACCOUNTING POLICIES (continued)
(c) Funding Settlements
Expected funding settlements for the current year represent the Health Unit's best estimate offunding receivable or repayable to be determined upon final settlement with the respective fundingagency. Final settlements for March year end programs will be adjusted from a calendar year to afiscal year before settlement and therefore the actual cash settlements will differ from the estimatedsettlements on the Statement of Operations. Actual results could differ from management's bestestimates.
(d) Employee Benefits
Pension PlanThe Health Unit accounts for its participation in the Ontario Municipal Employee RetirementSystem (OMERS), which is a multi-employer public sector pension fund. These contributions areexpensed as they are made.
Vacation PayEmployees are entitled to compensation for unused vacation credit when they leave the HealthUnit's employ. The liability with respect to vacation pay is recorded in these financial statements.
(e) Use of Estimates
The preparation of financial statements in accordance with Canadian public sector accountingstandards requires management to make estimates and assumptions that affect the reported amountsof assets and liabilities at the date of the financial statements, and the reported amounts of revenueand expenses during the reporting period. Actual results could differ from management's bestestimates as additional information becomes available in the future.
AmortizationThe amounts recorded for amortization and impairment of capital assets are dependent onestimates of economic useful lives and future cash flows
Legal ContingenciesThe recognized amounts of potential legal claims and liabilities depend on estimates of themagnitude and probability of future costs.
(f) Program Revenues in Excess of Expenditures
The Health Unit administers public health programs funded by the Government of Canada, theProvince of Ontario, the Corporation of the City of Brantford and the Corporation of the County ofBrant. Any unexpended revenue for these programs at December 31, is reported on the statement offinancial position.
21
Page 127
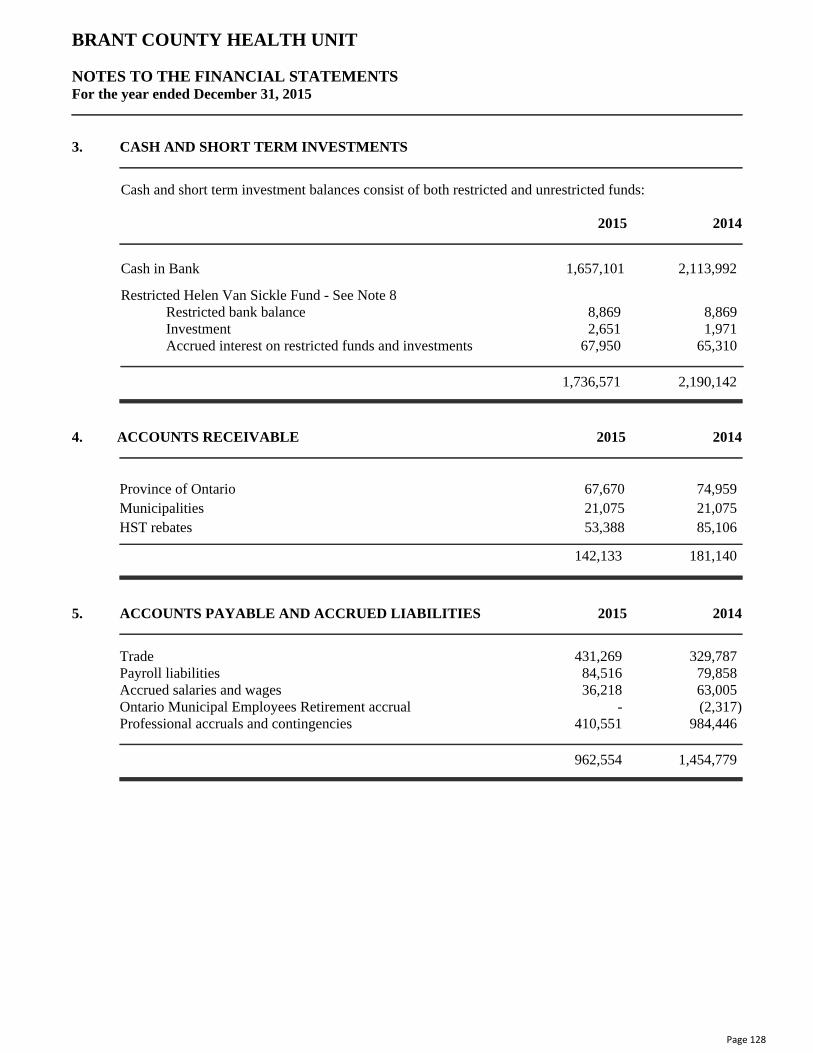
BRANT COUNTY HEALTH UNIT
NOTES TO THE FINANCIAL STATEMENTSFor the year ended December 31, 2015
3. CASH AND SHORT TERM INVESTMENTS
Cash and short term investment balances consist of both restricted and unrestricted funds:
2015 2014
Cash in Bank 1,657,101 2,113,992
Restricted Helen Van Sickle Fund - See Note 8Restricted bank balance 8,869 8,869Investment 2,651 1,971Accrued interest on restricted funds and investments 67,950 65,310
1,736,571 2,190,142
4. ACCOUNTS RECEIVABLE 2015 2014
Province of Ontario 67,670 74,959Municipalities 21,075 21,075HST rebates 53,388 85,106
142,133 181,140
5. ACCOUNTS PAYABLE AND ACCRUED LIABILITIES 2015 2014
Trade 431,269 329,787Payroll liabilities 84,516 79,858Accrued salaries and wages 36,218 63,005Ontario Municipal Employees Retirement accrual - (2,317)Professional accruals and contingencies 410,551 984,446
962,554 1,454,779
22
Page 128
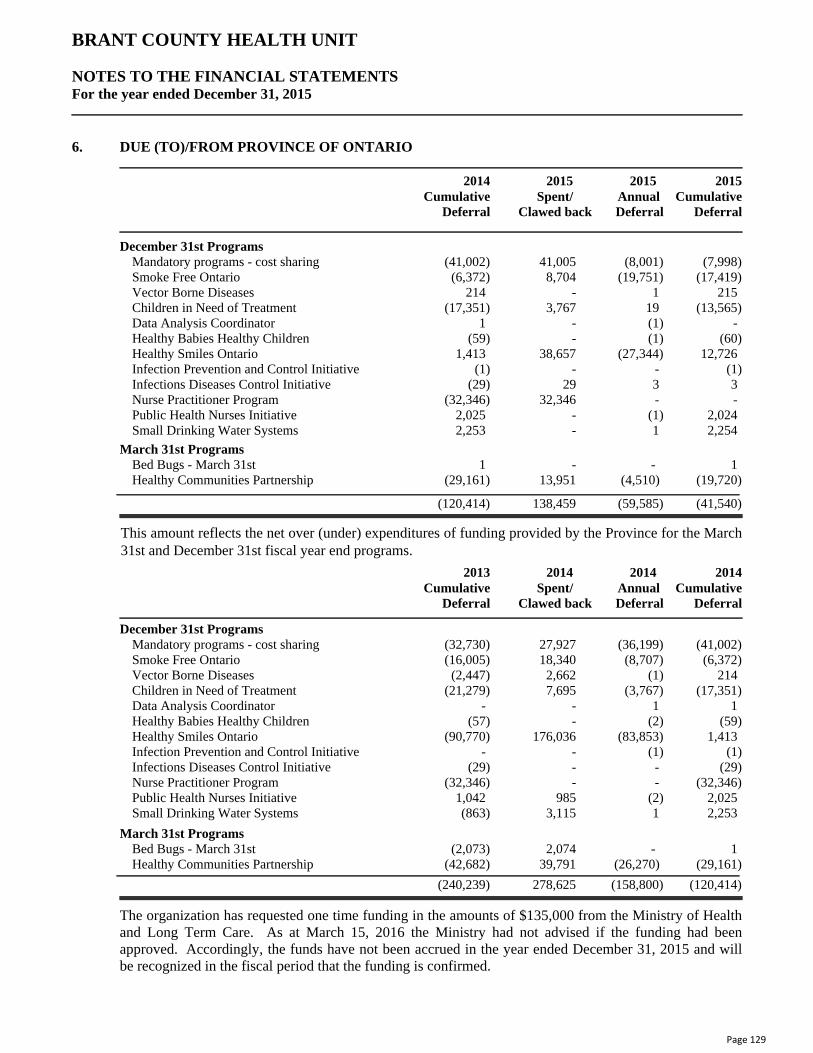
BRANT COUNTY HEALTH UNIT
NOTES TO THE FINANCIAL STATEMENTSFor the year ended December 31, 2015
6. DUE (TO)/FROM PROVINCE OF ONTARIO
2014 2015 2015 2015Cumulative Spent/ Annual Cumulative
Deferral Clawed back Deferral Deferral
December 31st ProgramsMandatory programs - cost sharing (41,002) 41,005 (8,001) (7,998)Smoke Free Ontario (6,372) 8,704 (19,751) (17,419)Vector Borne Diseases 214 - 1 215Children in Need of Treatment (17,351) 3,767 19 (13,565)Data Analysis Coordinator 1 - (1) -Healthy Babies Healthy Children (59) - (1) (60)Healthy Smiles Ontario 1,413 38,657 (27,344) 12,726Infection Prevention and Control Initiative (1) - - (1)Infections Diseases Control Initiative (29) 29 3 3Nurse Practitioner Program (32,346) 32,346 - -Public Health Nurses Initiative 2,025 - (1) 2,024Small Drinking Water Systems 2,253 - 1 2,254
March 31st ProgramsBed Bugs - March 31st 1 - - 1Healthy Communities Partnership (29,161) 13,951 (4,510) (19,720)
(120,414) 138,459 (59,585) (41,540)
This amount reflects the net over (under) expenditures of funding provided by the Province for the March31st and December 31st fiscal year end programs.
2013 2014 2014 2014Cumulative Spent/ Annual Cumulative
Deferral Clawed back Deferral Deferral
December 31st ProgramsMandatory programs - cost sharing (32,730) 27,927 (36,199) (41,002)Smoke Free Ontario (16,005) 18,340 (8,707) (6,372)Vector Borne Diseases (2,447) 2,662 (1) 214Children in Need of Treatment (21,279) 7,695 (3,767) (17,351)Data Analysis Coordinator - - 1 1Healthy Babies Healthy Children (57) - (2) (59)Healthy Smiles Ontario (90,770) 176,036 (83,853) 1,413Infection Prevention and Control Initiative - - (1) (1)Infections Diseases Control Initiative (29) - - (29)Nurse Practitioner Program (32,346) - - (32,346)Public Health Nurses Initiative 1,042 985 (2) 2,025Small Drinking Water Systems (863) 3,115 1 2,253
March 31st ProgramsBed Bugs - March 31st (2,073) 2,074 - 1Healthy Communities Partnership (42,682) 39,791 (26,270) (29,161)
(240,239) 278,625 (158,800) (120,414)
The organization has requested one time funding in the amounts of $135,000 from the Ministry of Healthand Long Term Care. As at March 15, 2016 the Ministry had not advised if the funding had beenapproved. Accordingly, the funds have not been accrued in the year ended December 31, 2015 and willbe recognized in the fiscal period that the funding is confirmed.
23
Page 129
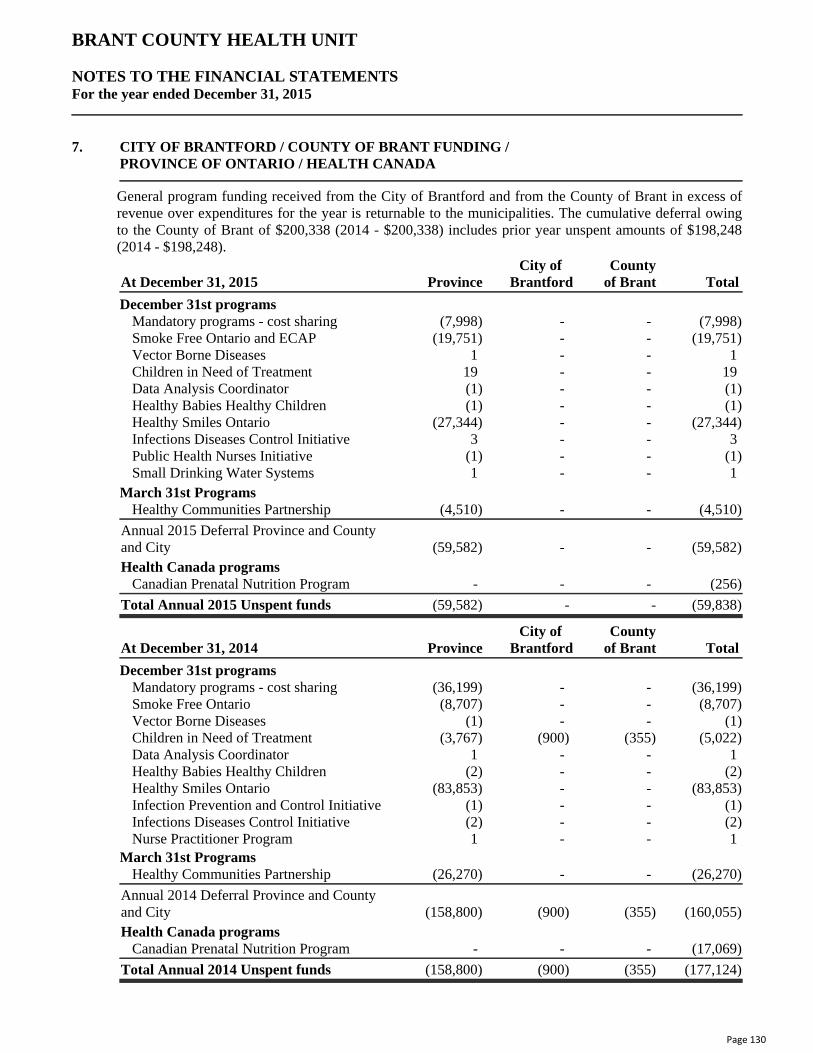
BRANT COUNTY HEALTH UNIT
NOTES TO THE FINANCIAL STATEMENTSFor the year ended December 31, 2015
7. CITY OF BRANTFORD / COUNTY OF BRANT FUNDING /PROVINCE OF ONTARIO / HEALTH CANADA
General program funding received from the City of Brantford and from the County of Brant in excess ofrevenue over expenditures for the year is returnable to the municipalities. The cumulative deferral owingto the County of Brant of $200,338 (2014 - $200,338) includes prior year unspent amounts of $198,248(2014 - $198,248).
City of CountyAt December 31, 2015 Province Brantford of Brant Total
December 31st programsMandatory programs - cost sharing (7,998) - - (7,998)Smoke Free Ontario and ECAP (19,751) - - (19,751)Vector Borne Diseases 1 - - 1Children in Need of Treatment 19 - - 19Data Analysis Coordinator (1) - - (1)Healthy Babies Healthy Children (1) - - (1)Healthy Smiles Ontario (27,344) - - (27,344)Infections Diseases Control Initiative 3 - - 3Public Health Nurses Initiative (1) - - (1)Small Drinking Water Systems 1 - - 1
March 31st ProgramsHealthy Communities Partnership (4,510) - - (4,510)
Annual 2015 Deferral Province and County and City (59,582) - - (59,582)Health Canada programs
Canadian Prenatal Nutrition Program - - - (256)
Total Annual 2015 Unspent funds (59,582) - - (59,838)
City of CountyAt December 31, 2014 Province Brantford of Brant Total
December 31st programsMandatory programs - cost sharing (36,199) - - (36,199)Smoke Free Ontario (8,707) - - (8,707)Vector Borne Diseases (1) - - (1)Children in Need of Treatment (3,767) (900) (355) (5,022)Data Analysis Coordinator 1 - - 1Healthy Babies Healthy Children (2) - - (2)Healthy Smiles Ontario (83,853) - - (83,853)Infection Prevention and Control Initiative (1) - - (1)Infections Diseases Control Initiative (2) - - (2)Nurse Practitioner Program 1 - - 1
March 31st ProgramsHealthy Communities Partnership (26,270) - - (26,270)
Annual 2014 Deferral Province and County and City (158,800) (900) (355) (160,055)Health Canada programs
Canadian Prenatal Nutrition Program - - - (17,069)
Total Annual 2014 Unspent funds (158,800) (900) (355) (177,124)
24
Page 130

BRANT COUNTY HEALTH UNIT
NOTES TO THE FINANCIAL STATEMENTSFor the year ended December 31, 2015
8. HELEN VAN SICKLE FUND 2015 2014
Balance - Beginning of year 76,150 73,776Revenue - Interest earned 3,320 2,374
79,470 76,150
Accumulated9. TANGIBLE CAPITAL ASSETS Cost Amortization 2015 2014
Tangible AssetsLand 129,500 - 129,500 129,500Building 3,120,003 1,794,770 1,325,233 1,311,416Office equipment 494,446 211,951 282,495 311,178Leasehold improvements 70,300 29,526 40,774 43,586Computer 1,128,534 866,548 261,986 421,026
Total Tangible Capital Assets 4,942,783 2,902,795 2,039,988 -
Intangible AssetsWebsite 107,596 16,139 91,457 102,216
5,050,379 2,918,934 2,131,445 2,318,922
10. ACCUMULATED SURPLUS 2015 2014
Accumulated Surplus consists of the following:
Accumulated surplus/(deficit) from operations (79,524) (50,389)Investment in tangible capital assets 2,131,445 2,318,922
Balance - End of Year 2,051,921 2,268,533
11. COMPARATIVE FIGURES
Certain of the prior year's figures, provided for purposes of comparison, have been reclassified to conformwith the current year presentation.
25
Page 131

BRANT COUNTY HEALTH UNIT
NOTES TO THE FINANCIAL STATEMENTSFor the year ended December 31, 2015
12. PENSION AGREEMENT
The Health Unit contributes to the Ontario Municipal Employees Retirement Fund (OMERS), which is amulti-employer plan, on behalf of its employees. This plan is a defined benefit plan which specifies theamount of retirement income to be received by the employees based on length of service and rates of pay.The amount contributed to OMERS for 2015 was $796,783 (2014 - $728,525). These payments are forcurrent service and are included as an expense on the Statement of Operations and Accumulated Surplus.
The OMERS pension plan has a deficit. if actuarial surpluses are not available to offset the existing deficitand subsidize future contributions, increases in contributions will be required in the future.
13. RELATED PARTY TRANSACTIONS
During year ended December 31, 2015, honorariums of $4,768 (2014 - $7,096) were paid to the Board ofDirectors.
14. FINANCIAL INSTRUMENTS
The significant financial risks to which the Health Unit is exposed are credit risk and liquidity risk.
Credit RiskThe Health Unit's exposure to credit risk relates to its accounts receivable. The risk of significant creditloss is considered remote.
Liquidity RiskThe Health Unit's exposure to liquidity risk is dependent on receipt of funds from funding, receivables,and other related sources, whether in the form of Ministry contracts, donations, and/or advances.
15. CONTINGENT LIABILITIES
The Health Unit is subject to legal expenses, severance packages, and mediation fees arising from HumanResources issues.
The amount provided for represents management's best estimate of the Health Unit's liability related tothese issues for which it is probable that an amount will be paid. Because of the nature of these issues, theentity has not disclosed any additional information on the basis that they believe this would be seriouslyprejudicial to their position.
26
Page 132

INDEPENDENT AUDITORS' REPORT
To the Board Members, Council, Inhabitants and RatepayersBrantford Downtown Business Improvement Area of the City of Brantford
We have audited the accompanying financial statements of Brantford Downtown Business Improvement Area,which comprise the statement of financial position as at December 31, 2015, and the statements of revenue,expenses and accumulated surplus, change in net financial assets and cash flows for the year then ended, and asummary of significant accounting policies and other explanatory information.
Management's Responsibility for the Financial StatementsManagement is responsible for the preparation and fair presentation of these financial statements in accordancewith Canadian public sector accounting standards, and for such internal control as management determines isnecessary to enable the preparation of financial statements that are free from material misstatement, whether dueto fraud or error.
Auditors' ResponsibilityOur responsibility is to express an opinion on these financial statements based on our audit. We conducted ouraudit in accordance with Canadian generally accepted auditing standards. Those standards require that wecomply with ethical requirements and plan and perform the audit to obtain reasonable assurance about whether thefinancial statements are free from material misstatement.
An audit involves performing procedures to obtain audit evidence about the amounts and disclosures in thefinancial statements. The procedures selected depend on the auditors' judgment, including the assessment of therisks of material misstatement of the financial statements, whether due to fraud or error. In making those riskassessments, the auditor considers internal control relevant to the entity's preparation and fair presentation of thefinancial statements in order to design audit procedures that are appropriate in the circumstances, but not for thepurpose of expressing an opinion on the effectiveness of the entity's internal control. An audit also includesevaluating the appropriateness of accounting policies used and the reasonableness of accounting estimates madeby management, as well as evaluating the overall presentation of the financial statements.
We believe that the audit evidence we have obtained is sufficient and appropriate to provide a basis for our auditopinion.
OpinionIn our opinion, the financial statements present fairly, in all material respects, the financial position of BrantfordDowntown Business Improvement Area as at December 31, 2015, and the results of its operations and its cashflows for the year then ended in accordance with Canadian public sector accounting standards.
March 10, 2016 CHARTERED PROFESSIONAL ACCOUNTANTSBrantford, Ontario Licensed Public Accountants
Page 1
Millard, Rouse & Rosebrugh LLPBrantford • Hagersville • Simcoe • Delhi • Norwich • Tillsonburg
MillardsChartered Accountants
P.O. Box 367, 96 Nelson StreetBrantford, Ontario N3T 5N3Telephone: (519) 759-3511Facsimile: (519) 759-7961
Page 133
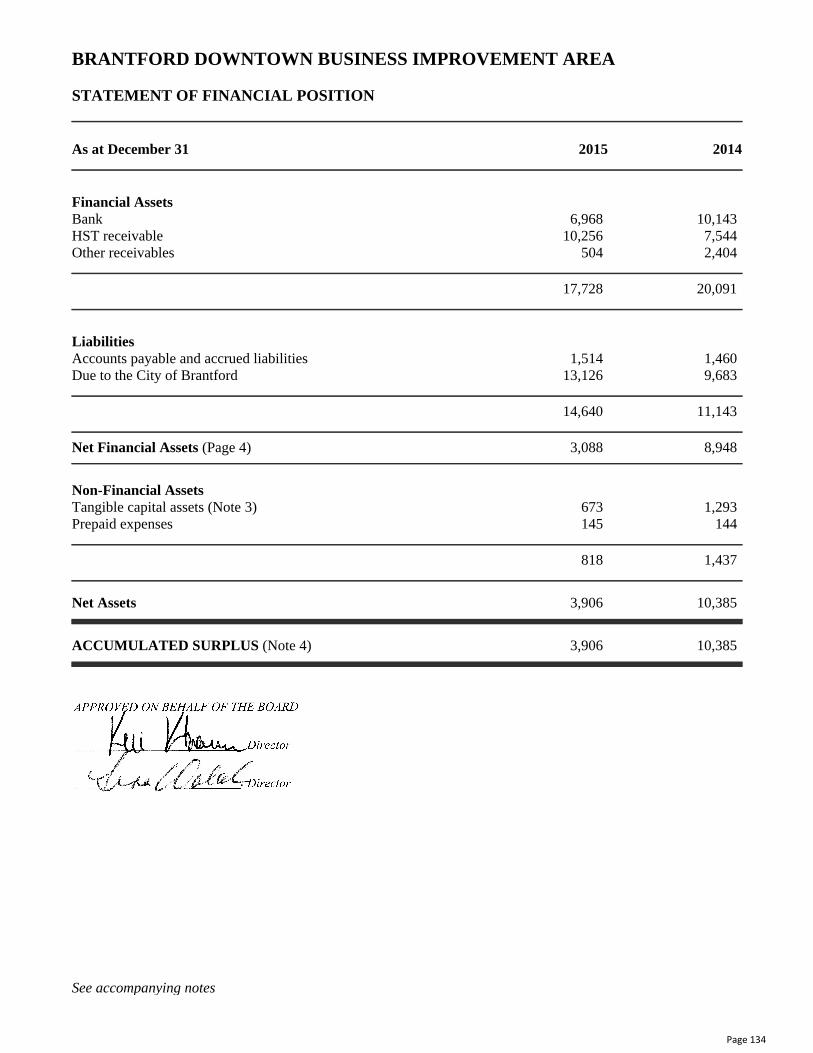
BRANTFORD DOWNTOWN BUSINESS IMPROVEMENT AREA
STATEMENT OF FINANCIAL POSITION
As at December 31 2015 2014
Financial AssetsBank 6,968 10,143HST receivable 10,256 7,544Other receivables 504 2,404
17,728 20,091
LiabilitiesAccounts payable and accrued liabilities 1,514 1,460Due to the City of Brantford 13,126 9,683
14,640 11,143
Net Financial Assets (Page 4) 3,088 8,948
Non-Financial AssetsTangible capital assets (Note 3) 673 1,293Prepaid expenses 145 144
818 1,437
Net Assets 3,906 10,385
ACCUMULATED SURPLUS (Note 4) 3,906 10,385
See accompanying notes Page 2
Page 134

BRANTFORD DOWNTOWN BUSINESS IMPROVEMENT AREA
STATEMENT OF REVENUE, EXPENSES AND ACCUMULATED SURPLUS
For the year ended December 31 Budget 2015 2014
RevenueLevy 178,000 178,001 154,101Supplementaries and deficiencies (10,000) (13,127) (9,683)
168,000 164,874 144,418Interest - - 1Other 2,500 1,250 750
170,500 166,124 145,169
ExpensesSpecial projects 10,000 16,035 9,868Administration Salaries and benefits 86,325 63,102 68,853 Office 36,470 29,556 22,105 Memberships and conferences 5,920 1,714 4,726 Professional fees and insurance 4,900 4,060 3,701Website - 54 302Events 43,885 11,266 13,292Marketing 13,000 46,197 33,041Amortization - 619 788
200,500 172,603 156,676
Annual Deficit (30,000) (6,479) (11,507)Accumulated Surplus - Beginning of Year 10,385 21,892
Accumulated Surplus - End of Year 3,906 10,385
See accompanying notes Page 3
Page 135
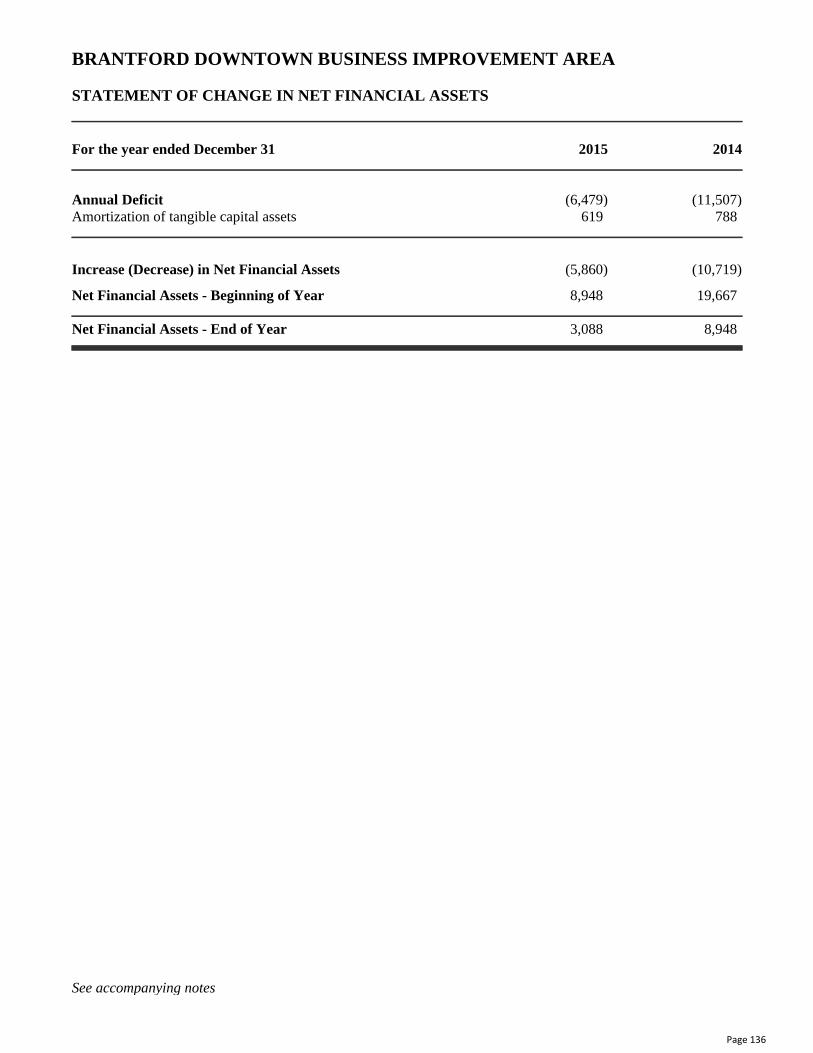
BRANTFORD DOWNTOWN BUSINESS IMPROVEMENT AREA
STATEMENT OF CHANGE IN NET FINANCIAL ASSETS
For the year ended December 31 2015 2014
Annual Deficit (6,479) (11,507)Amortization of tangible capital assets 619 788
Increase (Decrease) in Net Financial Assets (5,860) (10,719)
Net Financial Assets - Beginning of Year 8,948 19,667
Net Financial Assets - End of Year 3,088 8,948
See accompanying notes Page 4
Page 136

BRANTFORD DOWNTOWN BUSINESS IMPROVEMENT AREA
STATEMENT OF CASH FLOWS
For the year ended December 31 2015 2014
Cash Flows from Operating ActivitiesAnnual Deficit (6,479) (11,507)Charges (credits) to income not involving cashAmortization 619 788
(5,860) (10,719)
Net change in non-cash working capital balances related to operations 2,685 (4,950)
Net Decrease in Bank (3,175) (15,669)
Opening Bank 10,143 25,812
Closing Bank 6,968 10,143
See accompanying notes Page 5
Page 137

BRANTFORD DOWNTOWN BUSINESS IMPROVEMENT AREA
NOTES TO THE FINANCIAL STATEMENTSFor the year ended December 31, 2015
1. DESCRIPTION OF BUSINESS
The Brantford Downtown Business Improvement Area is an organization financed by a special levy onmunicipal taxes in a specific geographic area. The levy is collected by the municipality but administeredby the Business Improvement Area (BIA) to implement its program of activities for the year.
The BIA assists in the promoting and improving of Brantford's downtown area.
The BIA is established as a local board through a by-law passed by the municipal council of theCorporation of the City of Brantford.
2. SUMMARY OF SIGNIFICANT ACCOUNTING POLICIES
The financial statements of the Brantford Downtown Business Improvement Area are prepared bymanagement in accordance with Canadian public sector accounting standards as recommended by thePublic Sector Accounting Board of CPA Canada
(a) Basis of Accounting
The accrual basis of accounting is followed, whereby revenues are recorded when earned andexpenses are recorded when incurred.
(b) Use of Estimates
Since precise determination of many assets and liabilities is dependent upon future events, thepreparation of periodic financial statements necessarily involves the use of estimates andapproximations. These have been made using careful judgment.
(c) Government Transfers
Government transfers are recognized in the financial statements as revenues in the period in whichevents giving rise to the transfer occur, providing the transfers are authorized, any eligibilitycriteria have been met and reasonable estimates of the amounts can be made.
(d) Gifts in Kind
Donated goods, services and facilities are not reported in these financial statements.
(e) Tangible Capital Assets
Tangible capital assets are stated at cost. Amortization is provided for in the accounts as follows:
Information technology 4 years straight lineFurniture and fixtures 10 years straight line
In the year of acquisition, amortization is provided for at one-half of the above rates. Noamortization is provided for in the year of disposal.
Page 6
Page 138

BRANTFORD DOWNTOWN BUSINESS IMPROVEMENT AREA
NOTES TO THE FINANCIAL STATEMENTSFor the year ended December 31, 2015
3. TANGIBLE AccumulatedCAPITAL ASSETS Cost Amortization 2015 2014
Information technology 3,568 3,063 505 1,012Furniture and fixtures 1,123 955 168 281
4,691 4,018 673 1,293
4. ACCUMULATED SURPLUS 2015 2014
Accumulated surplus consists of the following:
Accumulated surplus from operations 3,233 9,092Investment in tangible capital assets 673 1,293
3,906 10,385
5. FINANCIAL INSTRUMENTS
The fair value of financial instruments, such as cash and short-term investments, HST/GST receivable andaccounts payable and accrued liabilities are determined to approximate their recorded values.
Page 7
Page 139

STATISTICAL INFORMATION

Five-Year Financial Review(Unaudited)
Municipal Statistics
Fiscal Year 2015 2014 2013 2012 2011
Demographics
Population as at December 31st 97,862 97,499 95,532 94,586 93,650
Area in acres at December 31st 17,986 17,986 17,986 17,986 17,986Employees - continuous full time 1,206 1,215 1,205 1,204 1,262Employees - part time 603 612 583 608 786
Number of households 1 40,315 40,007 39,538 39,268 38,876
1. MPAC
Municipal ProcurementTotal construction contracts awarded 43 51 51 46 35
Total Value of Construction Contract Awarded 23,782,774$ 24,016,092$ 14,896,971$ 20,326,907$ 13,397,898$
Building Permits Issued:Residential properties 699 652 589 606 615 Multi-residential properties 21 12 22 14 26 All other properties 246 218 269 276 270
Total Building Permits Issued 966 882 880 896 911
Value of Building Permits Issued:Residential properties 60,308,000$ 59,121,000$ 33,130,000$ 32,122,000$ 25,727,000$ Multi-residential properties 62,646,000 15,008,000 11,111,000 5,882,000 17,115,000 All other properties 41,039,000 21,062,000 54,013,000 102,275,000 47,952,000
Total Value of Building Permits Issued 163,993,000$ 95,191,000$ 98,254,000$ 140,279,000$ 90,794,000$
Long-Term Debt
Fiscal Year 2015 2014 2013 2012 2011
Long-Term DebtDebt supported by property taxes and user fees 41,330,249$ 35,122,297$ 38,113,895$ 39,538,243$ 32,694,362$ Debt supported by consolidated municipal enterprises 1,955,667 2,236,640 2,504,136 2,763,997 1,338,954.00 Debt supported by the County of Brant 427,960 436,270 444,114 451,517 458,503.00
Total Long-Term Debt 43,713,876$ 37,795,207$ 41,062,145$ 42,753,757$ 34,491,819$
Per capita 446.69 387.65 429.83 452.01 368.31
Per household 1084.31 944.71 1038.55 1088.77 887.23
Interest on Long-Term Debt 1,535,145$ 1,651,685$ 1,756,709$ 1,767,065$ 1,578,122$ Per capita 15.69 16.94 18.39 18.68 16.85Per household 38.08 41.28 44.43 45.00 40.59
Annual Debt Repayment Limit 47,580,883$ 47,258,878$ 45,232,903$ 44,315,113$ 44,855,144$
Page 141

Property Taxation
Fiscal Year 2015 2014 2013 2012 2011
Current Value Assessment by Property Class (in thousands of dollars)
Residential 6,805,855$ 6,597,501$ 6,386,207$ 6,190,122$ 5,865,430$
Multi residential 394,710 379,317 370,017 366,893 342,099
Commercial 1,161,189 1,128,554 1,053,641 1,067,684 980,276
Commercial - vacant 52,026 51,392 46,629 45,156 45,868
Industrial 315,201 341,421 343,678 373,120 369,461
Industrial - vacant 28,087 28,541 31,309 30,354 27,989
Farmland/managed forest 7,022 6,805 5,979 5,389 5,332
Pipeline 22,015 21,561 21,066 20,493 19,956
Total 8,786,105$ 8,555,092$ 8,258,526$ 8,099,211$ 7,656,411$
Tax RatiosResidential 1.00 1.00 1.00 1.00 1.00
Multi-residential 2.05 2.05 2.05 2.06 2.14
Commercial 1.88 1.88 1.88 1.89 1.94
Industrial 2.47 2.47 2.47 2.50 2.63
Farmland/managed forest 0.25 0.25 0.25 0.25 0.25
Pipeline 1.74 1.74 1.74 1.74 1.74
Total Taxable Assessment Per Capita (in thousands of dollars) 89,781$ 87,745$ 86,448$ 85,628$ 81,756$
Commercial & Industrial Assessment as a
Percentage of Total Taxable Assessment17.72% 18.12% 17.86% 18.72% 18.59%
Commercial and Industrial Taxes as a
Percentage of Total Taxes Levied35.61% 36.32% 35.71% 37.95% 39.14%
Taxes Levied:Municipal portion 129,746,796$ 127,347,135$ 124,946,445$ 120,514,018$ 117,490,362$ School board portion 36,113,495 37,143,467 37,166,377 37,279,570 38,740,991
Total 165,860,291$ 164,490,602$ 162,112,822$ 157,793,588$ 156,231,353$
Taxes Receivable, End of Year 5,491,585$ 4,865,004$ 8,994,408$ 8,927,810$ 8,791,019$
Percentage of current year tax levy 3.31% 2.96% 5.55% 5.66% 5.63%
Current Year's Tax Collections 159,293,738$ 157,526,481$ 153,700,721$ 150,238,925$ 148,609,529$
Percentage of current year tax levy 96.04% 95.77% 94.81% 95.21% 95.12%
Total Tax Cash Collections 164,058,073$ 164,692,062$ 162,056,677$ 157,066,007$ 153,701,118$
Page 142

Property Taxation Cont.
Fiscal Year 2015 2014 2013 2012 2011
ResidentialFor general municipal purposes 1.199749% 1.198526% 1.210941% 1.187579% 1.206192%For school board purposes 0.195000% 0.203000% 0.212000% 0.221000% 0.231000%
Total 1.394749% 1.401526% 1.422941% 1.408579% 1.437192%
Multi-ResidentialFor general municipal purposes 2.456126% 2.453622% 2.479038% 2.452232% 2.575823%For school board purposes 0.195000% 0.203000% 0.212000% 0.221000% 0.231000%
Total 2.651126% 2.656622% 2.691038% 2.673232% 2.806823%
New Multi-Residential For general municipal purposes 1.799624% 1.797789% 1.816412% 1.781369% 1.809288%For school board purposes 0.195000% 0.203000% 0.212000% 0.221000% 0.231000%
Total 1.994624% 2.000789% 2.028412% 2.002369% 2.040288%
CommercialFor general municipal purposes 2.250129% 2.247836% 2.271120% 2.241674% 2.335188%For school board purposes 1.430000% 1.460000% 1.490000% 1.490000% 1.628955%
Total 3.680129% 3.707836% 3.761120% 3.731674% 3.964143%
Commercial - VacantFor general municipal purposes 1.575090% 1.573485% 1.589784% 1.569172% 1.634632%For school board purposes 1.001000% 1.022000% 1.043000% 1.043000% 1.140269%
Total 2.576090% 2.595485% 2.632784% 2.612172% 2.774901%
Commercial-New Construction For general municipal purposes 2.250129% 2.247836% 2.271120% 2.241674% 2.335188%For school board purposes 1.190000% 1.220000% 1.260000% 1.260000% 1.330000%
Total 3.440129% 3.467836% 3.531120% 3.501674% 3.665188%
Commercial-New Construction-Vacant For general municipal purposes 1.575090% 1.573485% 1.589784% 1.569172% 1.634632%For school board purposes 0.833000% 0.854000% 0.882000% 0.882000% 0.931000%
Total 2.408090% 2.427485% 2.471784% 2.451172% 2.565632%
IndustrialFor general municipal purposes 2.966797% 2.963955% 2.994657% 2.974173% 3.172285%For school board purposes 1.530000% 1.560000% 1.590000% 1.590000% 1.930000%
Total 4.496797% 4.523955% 4.584657% 4.564173% 5.102285%
Industrial - VacantFor general municipal purposes 2.076885% 2.074768% 2.096260% 2.081921% 2.220600%For school board purposes 1.071000% 1.092000% 1.113000% 1.113000% 1.351000%
Total 3.147885% 3.166768% 3.209260% 3.194921% 3.571600%
Rates of Taxation by Property Class (Expressed as a percentage of current value assessment)
Page 143
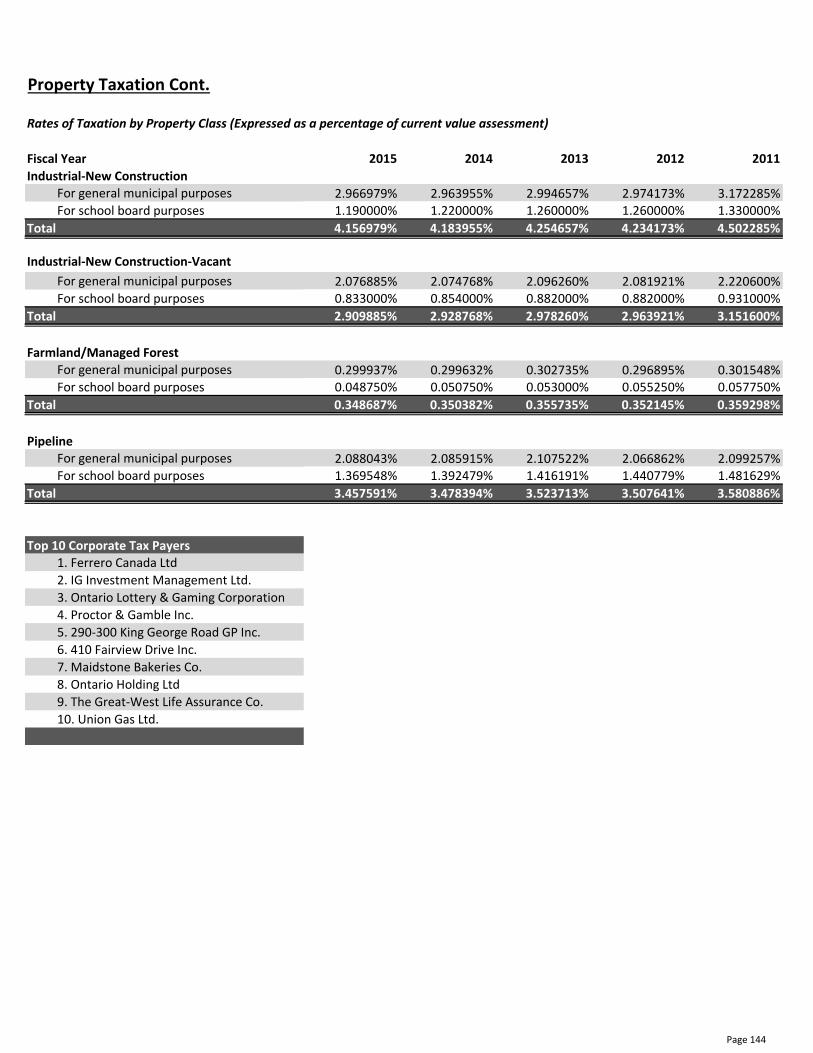
Property Taxation Cont.
Fiscal Year 2015 2014 2013 2012 2011
Industrial-New Construction For general municipal purposes 2.966979% 2.963955% 2.994657% 2.974173% 3.172285%For school board purposes 1.190000% 1.220000% 1.260000% 1.260000% 1.330000%
Total 4.156979% 4.183955% 4.254657% 4.234173% 4.502285%
Industrial-New Construction-Vacant
For general municipal purposes 2.076885% 2.074768% 2.096260% 2.081921% 2.220600%For school board purposes 0.833000% 0.854000% 0.882000% 0.882000% 0.931000%
Total 2.909885% 2.928768% 2.978260% 2.963921% 3.151600%
Farmland/Managed ForestFor general municipal purposes 0.299937% 0.299632% 0.302735% 0.296895% 0.301548%For school board purposes 0.048750% 0.050750% 0.053000% 0.055250% 0.057750%
Total 0.348687% 0.350382% 0.355735% 0.352145% 0.359298%
PipelineFor general municipal purposes 2.088043% 2.085915% 2.107522% 2.066862% 2.099257%For school board purposes 1.369548% 1.392479% 1.416191% 1.440779% 1.481629%
Total 3.457591% 3.478394% 3.523713% 3.507641% 3.580886%
Top 10 Corporate Tax Payers1. Ferrero Canada Ltd
2. IG Investment Management Ltd.
3. Ontario Lottery & Gaming Corporation
4. Proctor & Gamble Inc.
5. 290-300 King George Road GP Inc.
6. 410 Fairview Drive Inc.
7. Maidstone Bakeries Co.
8. Ontario Holding Ltd
9. The Great-West Life Assurance Co.
10. Union Gas Ltd.
Rates of Taxation by Property Class (Expressed as a percentage of current value assessment)
Page 144
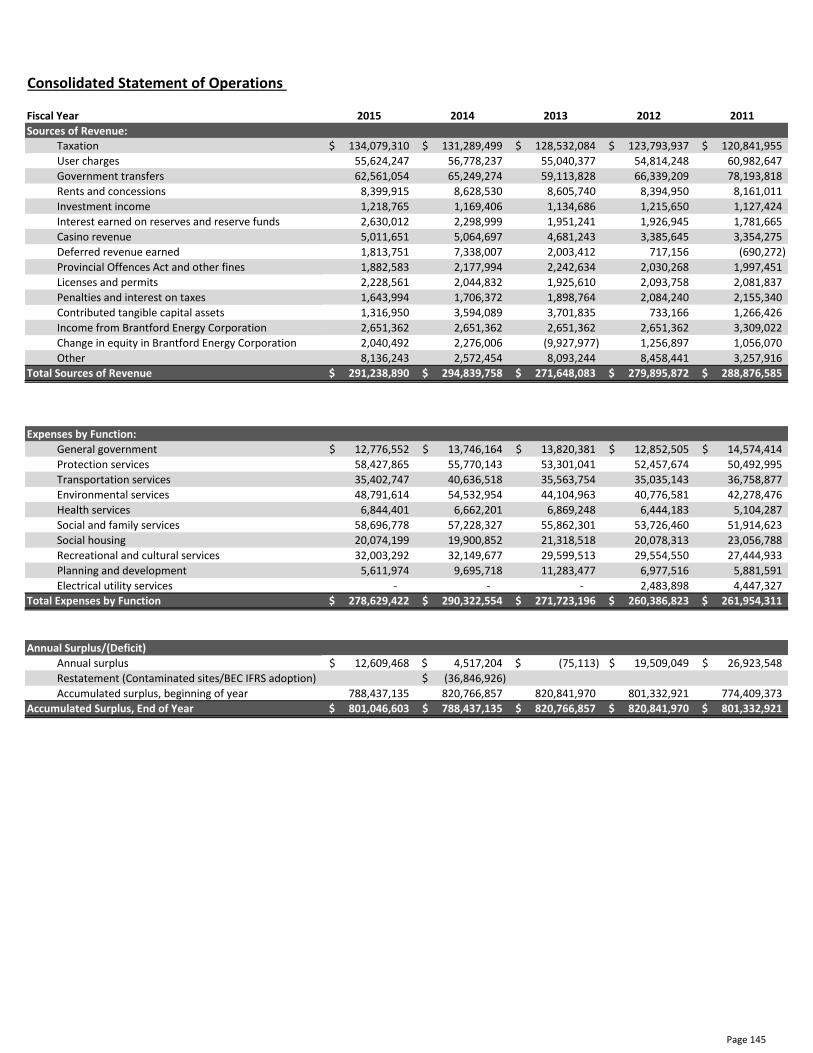
Consolidated Statement of Operations
Fiscal Year 2015 2014 2013 2012 2011
Sources of Revenue:Taxation 134,079,310$ 131,289,499$ 128,532,084$ 123,793,937$ 120,841,955$
User charges 55,624,247 56,778,237 55,040,377 54,814,248 60,982,647
Government transfers 62,561,054 65,249,274 59,113,828 66,339,209 78,193,818
Rents and concessions 8,399,915 8,628,530 8,605,740 8,394,950 8,161,011
Investment income 1,218,765 1,169,406 1,134,686 1,215,650 1,127,424
Interest earned on reserves and reserve funds 2,630,012 2,298,999 1,951,241 1,926,945 1,781,665
Casino revenue 5,011,651 5,064,697 4,681,243 3,385,645 3,354,275
Deferred revenue earned 1,813,751 7,338,007 2,003,412 717,156 (690,272)
Provincial Offences Act and other fines 1,882,583 2,177,994 2,242,634 2,030,268 1,997,451
Licenses and permits 2,228,561 2,044,832 1,925,610 2,093,758 2,081,837
Penalties and interest on taxes 1,643,994 1,706,372 1,898,764 2,084,240 2,155,340
Contributed tangible capital assets 1,316,950 3,594,089 3,701,835 733,166 1,266,426
Income from Brantford Energy Corporation 2,651,362 2,651,362 2,651,362 2,651,362 3,309,022
Change in equity in Brantford Energy Corporation 2,040,492 2,276,006 (9,927,977) 1,256,897 1,056,070
Other 8,136,243 2,572,454 8,093,244 8,458,441 3,257,916
Total Sources of Revenue 291,238,890$ 294,839,758$ 271,648,083$ 279,895,872$ 288,876,585$
Expenses by Function:
General government 12,776,552$ 13,746,164$ 13,820,381$ 12,852,505$ 14,574,414$
Protection services 58,427,865 55,770,143 53,301,041 52,457,674 50,492,995
Transportation services 35,402,747 40,636,518 35,563,754 35,035,143 36,758,877
Environmental services 48,791,614 54,532,954 44,104,963 40,776,581 42,278,476
Health services 6,844,401 6,662,201 6,869,248 6,444,183 5,104,287
Social and family services 58,696,778 57,228,327 55,862,301 53,726,460 51,914,623
Social housing 20,074,199 19,900,852 21,318,518 20,078,313 23,056,788
Recreational and cultural services 32,003,292 32,149,677 29,599,513 29,554,550 27,444,933
Planning and development 5,611,974 9,695,718 11,283,477 6,977,516 5,881,591
Electrical utility services - - - 2,483,898 4,447,327
Total Expenses by Function 278,629,422$ 290,322,554$ 271,723,196$ 260,386,823$ 261,954,311$
Annual Surplus/(Deficit)
Annual surplus 12,609,468$ 4,517,204$ (75,113)$ 19,509,049$ 26,923,548$
Restatement (Contaminated sites/BEC IFRS adoption) (36,846,926)$
Accumulated surplus, beginning of year 788,437,135 820,766,857 820,841,970 801,332,921 774,409,373
Accumulated Surplus, End of Year 801,046,603$ 788,437,135$ 820,766,857$ 820,841,970$ 801,332,921$
Page 145
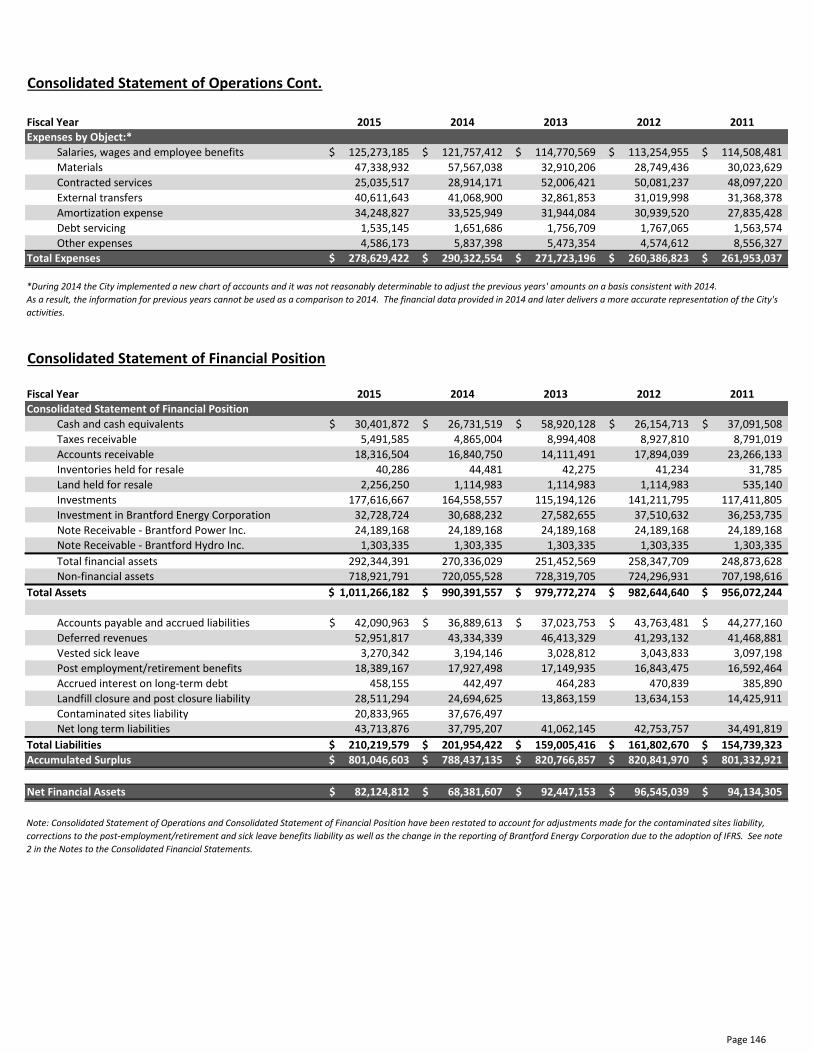
Consolidated Statement of Operations Cont.
Fiscal Year 2015 2014 2013 2012 2011Expenses by Object:*
Salaries, wages and employee benefits 125,273,185$ 121,757,412$ 114,770,569$ 113,254,955$ 114,508,481$
Materials 47,338,932 57,567,038 32,910,206 28,749,436 30,023,629
Contracted services 25,035,517 28,914,171 52,006,421 50,081,237 48,097,220
External transfers 40,611,643 41,068,900 32,861,853 31,019,998 31,368,378
Amortization expense 34,248,827 33,525,949 31,944,084 30,939,520 27,835,428
Debt servicing 1,535,145 1,651,686 1,756,709 1,767,065 1,563,574
Other expenses 4,586,173 5,837,398 5,473,354 4,574,612 8,556,327
Total Expenses 278,629,422$ 290,322,554$ 271,723,196$ 260,386,823$ 261,953,037$
Consolidated Statement of Financial Position
Fiscal Year 2015 2014 2013 2012 2011Consolidated Statement of Financial Position
Cash and cash equivalents 30,401,872$ 26,731,519$ 58,920,128$ 26,154,713$ 37,091,508$
Taxes receivable 5,491,585 4,865,004 8,994,408 8,927,810 8,791,019
Accounts receivable 18,316,504 16,840,750 14,111,491 17,894,039 23,266,133
Inventories held for resale 40,286 44,481 42,275 41,234 31,785
Land held for resale 2,256,250 1,114,983 1,114,983 1,114,983 535,140
Investments 177,616,667 164,558,557 115,194,126 141,211,795 117,411,805
Investment in Brantford Energy Corporation 32,728,724 30,688,232 27,582,655 37,510,632 36,253,735
Note Receivable - Brantford Power Inc. 24,189,168 24,189,168 24,189,168 24,189,168 24,189,168
Note Receivable - Brantford Hydro Inc. 1,303,335 1,303,335 1,303,335 1,303,335 1,303,335
Total financial assets 292,344,391 270,336,029 251,452,569 258,347,709 248,873,628
Non-financial assets 718,921,791 720,055,528 728,319,705 724,296,931 707,198,616
Total Assets 1,011,266,182$ 990,391,557$ 979,772,274$ 982,644,640$ 956,072,244$
Accounts payable and accrued liabilities 42,090,963$ 36,889,613$ 37,023,753$ 43,763,481$ 44,277,160$
Deferred revenues 52,951,817 43,334,339 46,413,329 41,293,132 41,468,881
Vested sick leave 3,270,342 3,194,146 3,028,812 3,043,833 3,097,198
Post employment/retirement benefits 18,389,167 17,927,498 17,149,935 16,843,475 16,592,464
Accrued interest on long-term debt 458,155 442,497 464,283 470,839 385,890
Landfill closure and post closure liability 28,511,294 24,694,625 13,863,159 13,634,153 14,425,911
Contaminated sites liability 20,833,965 37,676,497
Net long term liabilities 43,713,876 37,795,207 41,062,145 42,753,757 34,491,819
Total Liabilities 210,219,579$ 201,954,422$ 159,005,416$ 161,802,670$ 154,739,323$
Accumulated Surplus 801,046,603$ 788,437,135$ 820,766,857$ 820,841,970$ 801,332,921$
Net Financial Assets 82,124,812$ 68,381,607$ 92,447,153$ 96,545,039$ 94,134,305$
*During 2014 the City implemented a new chart of accounts and it was not reasonably determinable to adjust the previous years' amounts on a basis consistent with 2014.
As a result, the information for previous years cannot be used as a comparison to 2014. The financial data provided in 2014 and later delivers a more accurate representation of the City's
activities.
Note: Consolidated Statement of Operations and Consolidated Statement of Financial Position have been restated to account for adjustments made for the contaminated sites liability,
corrections to the post-employment/retirement and sick leave benefits liability as well as the change in the reporting of Brantford Energy Corporation due to the adoption of IFRS. See note
2 in the Notes to the Consolidated Financial Statements.
Page 146

Tangible Capital Assets
Fiscal Year 2015 2014 2013 2012 2011
Tangible Capital Asset CostAssets, beginning of year 1,281,320,244$ 1,255,870,272$ 1,231,000,132$ 1,187,395,901$ 1,148,152,861$ Additions 45,377,015 36,835,669 66,585,965 56,237,165 123,234,827 Disposals and transfers 14,573,940 11,385,697 41,715,825 12,632,934 83,991,789
Tangible Capital Assets, End of Year 1,312,123,319$ 1,281,320,244$ 1,255,870,272$ 1,231,000,132$ 1,187,395,899$
Tangible Capital Asset AmortizationAccumulated amortization, beginning of year 576,990,400$ 548,582,068$ 521,074,337$ 493,734,151$ 472,814,165$ Amortization expense 34,248,827 33,525,944 31,944,084 30,939,520 27,835,430 Accumulated amortization on disposal 4,599,456 5,117,612 4,436,353 3,599,334 6,915,446
Accumulated Amortization, End of Year 606,639,771$ 576,990,400$ 548,582,068$ 521,074,337$ 493,734,149$
Net Book Value of Tangible Capital Assets 705,483,548$ 704,329,844$ 707,288,204$ 709,925,795$ 693,661,750$
Net Book Value of Tangible Capital Assets by ClassLand 34,538,338$ 34,438,789$ 35,979,110$ 35,576,770$ 35,591,310$ Land improvements 25,966,459 26,873,445 26,799,539 27,202,344 22,329,614 Building 131,144,872 136,064,301 142,369,679 112,419,319 117,311,393 Machinery & equipment 31,280,312 30,820,079 30,451,964 29,617,446 31,838,640 Infrastructure 471,598,997 465,636,162 465,388,293 466,502,376 465,633,339 Assets under construction 10,954,570 10,497,068 6,299,619 38,607,540 20,957,454
Total 705,483,548$ 704,329,844$ 707,288,204$ 709,925,795$ 693,661,750$
Page 147

FINANCIAL INFORMATION RETURN

Province of Ontario - Ministry of Municipal Affairs and Housing 16.06.2016 15:102015-V01
2015 FINANCIAL INFORMATION RETURNMunicipality: Brantford C MSO Office: Western Ontario
Tier: Single-Tier Asmt Code: 2906Area: - MAH Code: 40101
Submitting: FIR Schedules Only
Version: 2015-V01
DECLARATION OF THE MUNICIPAL TREASURER
Pursuant to the information required by the Province of Ontario under the Ministry of Municipal Affairs and Housing Act, the following schedules are attached:
Schedule Title
10 CONSOLIDATED STATEMENT OF OPERATIONS: REVENUE
12 GRANTS, USER FEES AND SERVICE CHARGES
20 TAXATION INFORMATION
22 MUNICIPAL AND SCHOOL BOARD TAXATION
24 PAYMENTS-IN-LIEU OF TAXATION
26 TAXATION AND PAYMENTS-IN-LIEU SUMMARY
28 UPPER-TIER ENTITLEMENTS UPPER-TIER ONLY
40 CONSOLIDATED STATEMENT OF OPERATIONS: EXPENSES
42 ADDITIONAL INFORMATION
51 SCHEDULE OF TANGIBLE CAPITAL ASSETS
53 CONSOLIDATED STATEMENT OF CHANGE IN NET FINANCIAL ASSETS (NET DEBT) ANDTANGIBLE CAPITAL ASSET ACQUISITION FINANCING/DONATIONS
54 CONSOLIDATED STATEMENT OF CASH FLOW (SELECT DIRECT OR INDIRECT METHOD)
60 CONTINUITY OF RESERVES AND RESERVE FUNDS
61 DEVELOPMENT CHARGES RESERVE FUNDS
62 DEVELOPMENT CHARGES RATES (INCLUDING SPECIAL AREAS)
70 CONSOLIDATED STATEMENT OF FINANCIAL POSITION
72 CONTINUITY OF TAXES RECEIVABLE SINGLE/LOWER-TIER ONLY
74 LONG TERM LIABILITIES AND COMMITMENTS
76 GOVERNMENT BUSINESS ENTERPRISES (GBE)
77 OTHER ENTITIES (DSSAB, HEALTH UNIT, OTHER AND TOTAL ALL)
79 COMMUNITY IMPROVEMENT PLANS
80 STATISTICAL INFORMATION
81 ANNUAL DEBT REPAYMENT LIMIT
83 NOTES
For the purposes of this Financial Information Return, the amounts disclosed on the attached schedules are in agreement with the books and records of the municipality and its consolidated entities.
This Financial Information Return has been prepared in accordance with the Financial Information Return instructions.
Questions regarding the information contained in the Schedules should be addressed to:
0020 Name . . . . . . . . . . . . . . . . . . . . . . . . . . . . . . . . . . . . . . . . . . . . . . . . . . . . . . . . . . . . . . . . . . . . . . . . . . . . . . Heather Goodman, CPA, CGA
0022 Telephone . . . . . . . . . . . . . . . . . . . . . . . . . . . . . . . . . . . . . . . . . . . . . . . . . . . . . . . . . . . . . . . . . . . . . . . . . . . . . . 519-759-4150 ext. 5298
0024 Fax . . . . . . . . . . . . . . . . . . . . . . . . . . . . . . . . . . . . . . . . . . . . . . . . . . . . . . . . . . . . . . . . . . . . . . . . . . . . . . 519-752-7862
0028 Email (Required) . . . . . . . . . . . . . . . . . . . . . . . . . . . . . . . . . . . . . . . . . . . . . . . . . . . . . . . . . . . . . . . . . . . . . . . . . . . . . . [email protected]
0030 Website address of Municipality . . . . . . . . . . . . . . . . . . . . . . . . . . . . . . . . . . . . . . . . . . . . . . . . . . . . . . . . . . . . . . . . . . . . . . . . . . . . . www.brantford.ca
0091 Municipal Auditor . . . . . . . . . . . . . . . . . . . . . . . . . . . . . . . . . . . . . . . . . . . . . . . . . . . . . . . . . . . . . . . . . . . . . . . . . . . . . . Julie B. Baetz, CPA, CA, LPA, Partner
0092 Municipal Audit Firm . . . . . . . . . . . . . . . . . . . . . . . . . . . . . . . . . . . . . . . . . . . . . . . . . . . . . . . . . . . . . . . . . . . . . . . . . . . . . . Millard, Rouse & Rosebrugh LLP
0095 Municipal Auditor's Email (Required). . . . . . . . . . . . . . . . . . . . . . . . . . . . . . . . . . . . . . . . . . . . . . . . . . . . . . . . . . . . . . . . . . . . . . . . . . . . . . [email protected]
0090 Municipal Treasurer . . . . . . . . . . . . . . . . . . . . . . . . . . . . . . . . . . . . . . . . . . . . . . . . . . . . . . . . . . . . . . . . . . . . . . . . . . . . . . . . . Catherine Brubacher, CPA, CMA
0093 Municipal Treasurer's Email (Required). . . . . . . . . . . . . . . . . . . . . . . . . . . . . . . . . . . . . . . . . . . . . . . . . . . . . . . . . . . . . . . . . . . . . . . . . . . . . . [email protected]
0094 Date . . . . . . . . . . . . . . . . . . . . . . . . . . . . . . . . . . . . . . . . . . . . . . . . . . . . . . . . . . . . . . . . . . . . . . . . . . . . . . 16-Jun-2016
Signature of Municipal Treasurer
Signature Date
0070 Outstanding In-Year Critical Errors . . . . . . . . . . . . . . . . . . . . . . . . . . . . . . . . . . . . . . . . . . . . . . . . . . . . . . . . . . . . . . . . . . . . . . . . . . . . . .. . . . . . . . . . . . . . . . . . .0
0075 Schedule 54: Cashflow - Direct or Indirect Method Chosen. . . . . . . . . . . . . . . . . . . . . . . . . . . . . . . . . . . . . . . . . . . . . . . . . . . . . . . . . . . . . . . . . . . . . . . . . . . . . . . . . . . . . . . . . . . . . . . . . . .. . . . . . . . . . . . . . . . . . .. . . . . . . . . . . . . . . . . . . . . . . . . . . . . . . . . . . . . . INDIRECT
0077 Method used to allocate Program Support to other functions in Schedule 40 . . . . . . . . . . . . . . . . . . . . . . . . . . . . . . . . . . . . . . . . . . . . . . . . . . . . . . . . . . . . . . . . . . . . . . . . . . . . . . . . . . . . . . . . Modified Percentage of Total Expenditures
0078 If "Other Method" is selected in line 0077, please describe method of allocating Program Support . . . . . . . . . . . . . . . . . . . . . . . . . . .
Municipal Data
1
Data Source
2
Municipal Data (#) (List)
0040 Households . . . . . . . . . . . . . . . . . . . . . . . . . . . . . . . . . . . . . . . . . . . . . . . . . . . . . . . . . . . . . . . . . . . . . . . . . . . . . . . . . . . . . . . . . . . . . . . . . . . . . 40,315 MPAC
0041 Population . . . . . . . . . . . . . . . . . . . . . . . . . . . . . . . . . . . . . . . . . . . . . . . . . . . . . . . . . . . . . . . . . . . . . . . . . . . . . . . . . . . . . . . . . . . . . . . . . 97,862 Municipal
0042 Youth Population . . . . . . . . . . . . . . . . . . . . . . . . . . . . . . . . . . . . . . . . . . . . . . . . . . . . . . . . . . . . . . . . . . . . . . . . . . . . . . . . . . . . . . . . . . . . . . . . . .7,591 Municipal
Page 149
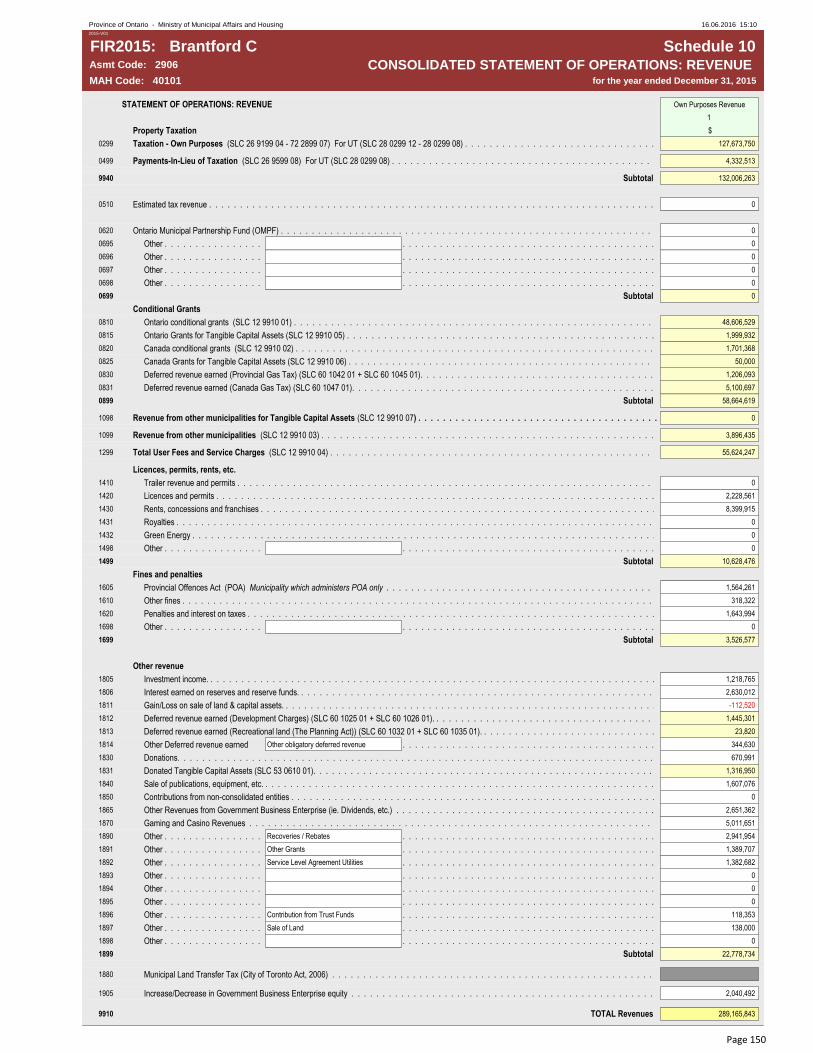
2015 Financial Information Return - Schedule 10 - Consolidated Statement of Operations: RevenueProvince of Ontario - Ministry of Municipal Affairs and Housing 16.06.2016 15:102015-V01
FIR2015: Brantford C Schedule 10Asmt Code: 2906 CONSOLIDATED STATEMENT OF OPERATIONS: REVENUE MAH Code: 40101 for the year ended December 31, 2015
STATEMENT OF OPERATIONS: REVENUE Own Purposes Revenue
1
Property Taxation $
0299 Taxation - Own Purposes (SLC 26 9199 04 - 72 2899 07) For UT (SLC 28 0299 12 - 28 0299 08) . . . . . . . . . . . . . . . . . . . . . . . . . . . . . . . . . . . . . . . . . . . . . . . . . . . . . . . . . . . . . . . . . . . . . . . . . . . . . . 127,673,750
0499 Payments-In-Lieu of Taxation (SLC 26 9599 08) For UT (SLC 28 0299 08) . . . . . . . . . . . . . . . . . . . . . . . . . . . . . . . . . . . . . . . . . . . . . . . . . . . . . . . . . . . . . . . . . . . . . . . . . . . . . . 4,332,513
9940 Subtotal 132,006,263
0510 Estimated tax revenue . . . . . . . . . . . . . . . . . . . . . . . . . . . . . . . . . . . . . . . . . . . . . . . . . . . . . . . . . . . . . . . . . . . . . . . . . . . . . . 0
0620 Ontario Municipal Partnership Fund (OMPF) . . . . . . . . . . . . . . . . . . . . . . . . . . . . . . . . . . . . . . . . . . . . . . . . . . . . . . . . . . . . . . . . . . . . . . . . . 0
0695 Other . . . . . . . . . . . . . . . . . . . . . . . . . . . . . . . . . . . . . . . . . . . . . . . . . . . . . . . . . . . . . . . . . . . . . . . . . . . . . . . . . . . . . . . . . . . . . . . . . . . . . . 0
0696 Other . . . . . . . . . . . . . . . . . . . . . . . . . . . . . . . . . . . . . . . . . . . . . . . . . . . . . . . . . . . . . . . . . . . . . . . . . . . . . . . . . . . . . . . . . . . . . . . . . . . . . . 0
0697 Other . . . . . . . . . . . . . . . . . . . . . . . . . . . . . . . . . . . . . . . . . . . . . . . . . . . . . . . . . . . . . . . . . . . . . . . . . . . . . . . . . . . . . . . . . . . . . . . . . . . . . . 0
0698 Other . . . . . . . . . . . . . . . . . . . . . . . . . . . . . . . . . . . . . . . . . . . . . . . . . . . . . . . . . . . . . . . . . . . . . . . . . . . . . . . . . . . . . . . . . . . . . . . . . . . . . . 0
0699 Subtotal 0
Conditional Grants
0810 Ontario conditional grants (SLC 12 9910 01) . . . . . . . . . . . . . . . . . . . . . . . . . . . . . . . . . . . . . . . . . . . . . . . . . . . . . . . . . . . . . . . . . . . . . . . . . . . . . . 48,606,529
0815 Ontario Grants for Tangible Capital Assets (SLC 12 9910 05) . . . . . . . . . . . . . . . . . . . . . . . . . . . . . . . . . . . . . . . . . . . . . . . . . . . . . . . . . . . . . . . . . . . . . . . . . . . . . . 1,999,932
0820 Canada conditional grants (SLC 12 9910 02) . . . . . . . . . . . . . . . . . . . . . . . . . . . . . . . . . . . . . . . . . . . . . . . . . . . . . . . . . . . . . . . . . . . . . . . . . . . . . . 1,701,368
0825 Canada Grants for Tangible Capital Assets (SLC 12 9910 06) . . . . . . . . . . . . . . . . . . . . . . . . . . . . . . . . . . . . . . . . . . . . . . . . . . . . . . . . . . . . . . . . . . . . . . . . . . . . . . 50,000
0830 Deferred revenue earned (Provincial Gas Tax) (SLC 60 1042 01 + SLC 60 1045 01). . . . . . . . . . . . . . . . . . . . . . . . . . . . . . . . . . . . . . . . . . . . . . . . . . . . . . . . . . . . . . . . . . . . . . . . . . . . . .1,206,093
0831 Deferred revenue earned (Canada Gas Tax) (SLC 60 1047 01). . . . . . . . . . . . . . . . . . . . . . . . . . . . . . . . . . . . . . . . . . . . . . . . . . . . . . . . . . . . . . . . . . . . . . . . . . . . . .5,100,697
0899 Subtotal 58,664,619
1098 Revenue from other municipalities for Tangible Capital Assets (SLC 12 9910 07) . . . . . . . . . . . . . . . . . . . . . . . . . . . . . . . . . . . . . . . . . . . . . . . . . . . . . . . . . . . . . . . . . . . . . . . . . . . . . .0
1099 Revenue from other municipalities (SLC 12 9910 03) . . . . . . . . . . . . . . . . . . . . . . . . . . . . . . . . . . . . . . . . . . . . . . . . . . . . . . . . . . . . . . . . . . . . . . . . . . . . . . 3,896,435
1299 Total User Fees and Service Charges (SLC 12 9910 04) . . . . . . . . . . . . . . . . . . . . . . . . . . . . . . . . . . . . . . . . . . . . . . . . . . . . . . . . . . . . . . . . . . . . . . . . . . . . . . 55,624,247
Licences, permits, rents, etc.
1410 Trailer revenue and permits . . . . . . . . . . . . . . . . . . . . . . . . . . . . . . . . . . . . . . . . . . . . . . . . . . . . . . . . . . . . . . . . . . . . . . . . . . . . . . 0
1420 Licences and permits . . . . . . . . . . . . . . . . . . . . . . . . . . . . . . . . . . . . . . . . . . . . . . . . . . . . . . . . . . . . . . . . . . . . . . . . . . . . . . 2,228,561
1430 Rents, concessions and franchises . . . . . . . . . . . . . . . . . . . . . . . . . . . . . . . . . . . . . . . . . . . . . . . . . . . . . . . . . . . . . . . . . . . . . . . . . . . . . . 8,399,915
1431 Royalties . . . . . . . . . . . . . . . . . . . . . . . . . . . . . . . . . . . . . . . . . . . . . . . . . . . . . . . . . . . . . . . . . . . . . . . . . . . . . . 0
1432 Green Energy . . . . . . . . . . . . . . . . . . . . . . . . . . . . . . . . . . . . . . . . . . . . . . . . . . . . . . . . . . . . . . . . . . . . . . . . . . . . . . 0
1498 Other . . . . . . . . . . . . . . . . . . . . . . . . . . . . . . . . . . . . . . . . . . . . . . . . . . . . . . . . . . . . . . . . . . . . . . . . . . . . . . . . . . . . . . . . . . . . . . . . . . . . . . 0
1499 Subtotal 10,628,476
Fines and penalties
1605 Provincial Offences Act (POA) Municipality which administers POA only . . . . . . . . . . . . . . . . . . . . . . . . . . . . . . . . . . . . . . . . . . . . . . . . . . . . . . . . . . . . . . . . . . . . . . . . . . . . . . 1,564,261
1610 Other fines . . . . . . . . . . . . . . . . . . . . . . . . . . . . . . . . . . . . . . . . . . . . . . . . . . . . . . . . . . . . . . . . . . . . . . . . . . . . . . 318,322
1620 Penalties and interest on taxes . . . . . . . . . . . . . . . . . . . . . . . . . . . . . . . . . . . . . . . . . . . . . . . . . . . . . . . . . . . . . . . . . . . . . . . . . . . . . . 1,643,994
1698 Other . . . . . . . . . . . . . . . . . . . . . . . . . . . . . . . . . . . . . . . . . . . . . . . . . . . . . . . . . . . . . . . . . . . . . . . . . . . . . . . . . . . . . . . . . . . . . . . . . . . . . . 0
1699 Subtotal 3,526,577
Other revenue
1805 Investment income. . . . . . . . . . . . . . . . . . . . . . . . . . . . . . . . . . . . . . . . . . . . . . . . . . . . . . . . . . . . . . . . . . . . . . . . . . . . . . . 1,218,765
1806 Interest earned on reserves and reserve funds. . . . . . . . . . . . . . . . . . . . . . . . . . . . . . . . . . . . . . . . . . . . . . . . . . . . . . . . . . . . . . . . . . . . . . . . . . . . . . . 2,630,012
1811 Gain/Loss on sale of land & capital assets. . . . . . . . . . . . . . . . . . . . . . . . . . . . . . . . . . . . . . . . . . . . . . . . . . . . . . . . . . . . . . . . . . . . . . . . . . . . . . . -112,520
1812 Deferred revenue earned (Development Charges) (SLC 60 1025 01 + SLC 60 1026 01). . . . . . . . . . . . . . . . . . . . . . . . . . . . . . . . . . . . . . . . . . . . . . . . . . . . . . . . . . . . . . . . . . . . . . . . . . . . . . . 1,445,301
1813 Deferred revenue earned (Recreational land (The Planning Act)) (SLC 60 1032 01 + SLC 60 1035 01). . . . . . . . . . . . . . . . . . . . . . . . . . . . . . . . . . . . . . . . . . . . . . . . . . . . . . . . . . . . . . . . . . . . . . . . . . . . . . . 23,820
1814 Other Deferred revenue earned Other obligatory deferred revenue . . . . . . . . . . . . . . . . . . . . . . . . . . . . . . . . . . . . . . . . . . . . . . . . . . . . . . . . . . . . . . . . . . . . . . . . . . . . . . 344,630
1830 Donations. . . . . . . . . . . . . . . . . . . . . . . . . . . . . . . . . . . . . . . . . . . . . . . . . . . . . . . . . . . . . . . . . . . . . . . . . . . . . . 670,991
1831 Donated Tangible Capital Assets (SLC 53 0610 01). . . . . . . . . . . . . . . . . . . . . . . . . . . . . . . . . . . . . . . . . . . . . . . . . . . . . . . . . . . . . . . . . . . . . . . . . . . . . . 1,316,950
1840 Sale of publications, equipment, etc. . . . . . . . . . . . . . . . . . . . . . . . . . . . . . . . . . . . . . . . . . . . . . . . . . . . . . . . . . . . . . . . . . . . . . . . . . . . . . . 1,607,076
1850 Contributions from non-consolidated entities . . . . . . . . . . . . . . . . . . . . . . . . . . . . . . . . . . . . . . . . . . . . . . . . . . . . . . . . . . . . . . . . . . . . . . . . . . . . . . 0
1865 Other Revenues from Government Business Enterprise (ie. Dividends, etc.) . . . . . . . . . . . . . . . . . . . . . . . . . . . . . . . . . . . . . . . . . . . . . . . . . . . . . . . . . . . . . . . . . . . . . . . . . . . . . . 2,651,362
1870 Gaming and Casino Revenues . . . . . . . . . . . . . . . . . . . . . . . . . . . . . . . . . . . . . . . . . . . . . . . . . . . . . . . . . . . . . . . . . . . . . . . . . . . . . . 5,011,651
1890 Other . . . . . . . . . . . . . . . . . . . . . . . .Recoveries / Rebates . . . . . . . . . . . . . . . . . . . . . . . . . . . . . . . . . . . . . . . . . . . . . . . . . . . . . . . . . . . . . . . . . . . . . . . . . . . . . . 2,941,954
1891 Other . . . . . . . . . . . . . . . . . . . . . . . .Other Grants . . . . . . . . . . . . . . . . . . . . . . . . . . . . . . . . . . . . . . . . . . . . . . . . . . . . . . . . . . . . . . . . . . . . . . . . . . . . . . 1,389,707
1892 Other . . . . . . . . . . . . . . . . . . . . . . . .Service Level Agreement Utilities . . . . . . . . . . . . . . . . . . . . . . . . . . . . . . . . . . . . . . . . . . . . . . . . . . . . . . . . . . . . . . . . . . . . . . . . . . . . . . 1,382,682
1893 Other . . . . . . . . . . . . . . . . . . . . . . . . . . . . . . . . . . . . . . . . . . . . . . . . . . . . . . . . . . . . . . . . . . . . . . . . . . . . . . . . . . . . . . . . . . . . . . . . . . . . . . 0
1894 Other . . . . . . . . . . . . . . . . . . . . . . . . . . . . . . . . . . . . . . . . . . . . . . . . . . . . . . . . . . . . . . . . . . . . . . . . . . . . . . . . . . . . . . . . . . . . . . . . . . . . . . 0
1895 Other . . . . . . . . . . . . . . . . . . . . . . . . . . . . . . . . . . . . . . . . . . . . . . . . . . . . . . . . . . . . . . . . . . . . . . . . . . . . . . . . . . . . . . . . . . . . . . . . . . . . . . 0
1896 Other . . . . . . . . . . . . . . . . . . . . . . . .Contribution from Trust Funds . . . . . . . . . . . . . . . . . . . . . . . . . . . . . . . . . . . . . . . . . . . . . . . . . . . . . . . . . . . . . . . . . . . . . . . . . . . . . . 118,353
1897 Other . . . . . . . . . . . . . . . . . . . . . . . .Sale of Land . . . . . . . . . . . . . . . . . . . . . . . . . . . . . . . . . . . . . . . . . . . . . . . . . . . . . . . . . . . . . . . . . . . . . . . . . . . . . . 138,000
1898 Other . . . . . . . . . . . . . . . . . . . . . . . . . . . . . . . . . . . . . . . . . . . . . . . . . . . . . . . . . . . . . . . . . . . . . . . . . . . . . . . . . . . . . . . . . . . . . . . . . . . . . . 0
1899 Subtotal 22,778,734
1880 Municipal Land Transfer Tax (City of Toronto Act, 2006) . . . . . . . . . . . . . . . . . . . . . . . . . . . . . . . . . . . . . . . . . . . . . . . . . . . . . . . . . . . . . . . . . . . . . . . . . . .
1905 Increase/Decrease in Government Business Enterprise equity . . . . . . . . . . . . . . . . . . . . . . . . . . . . . . . . . . . . . . . . . . . . . . . . . . . . . . . . . . . . . . . . . . . . . . . . . . . .2,040,492
9910 TOTAL Revenues 289,165,843
Page 150
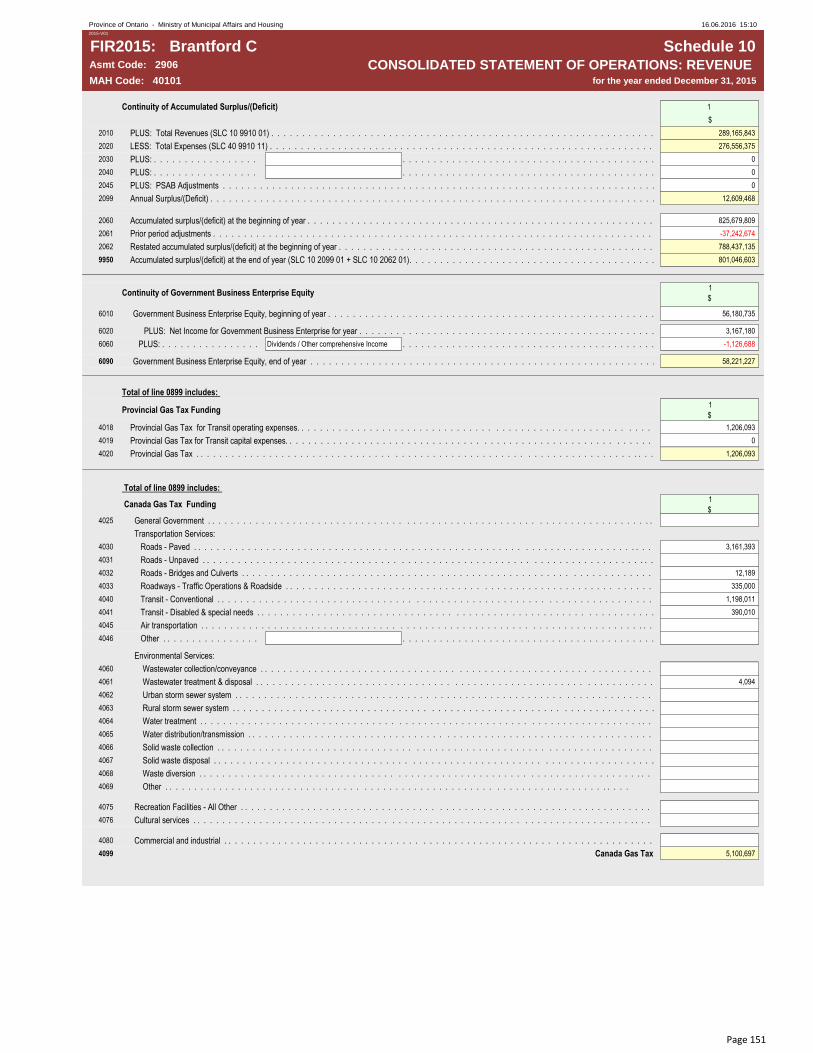
2015 Financial Information Return - Schedule 10 - Consolidated Statement of Operations: RevenueProvince of Ontario - Ministry of Municipal Affairs and Housing 16.06.2016 15:102015-V01
FIR2015: Brantford C Schedule 10Asmt Code: 2906 CONSOLIDATED STATEMENT OF OPERATIONS: REVENUE MAH Code: 40101 for the year ended December 31, 2015
Continuity of Accumulated Surplus/(Deficit) 1
$
2010 PLUS: Total Revenues (SLC 10 9910 01) . . . . . . . . . . . . . . . . . . . . . . . . . . . . . . . . . . . . . . . . . . . . . . . . . . . . . . . . . . . . . . . . . . . . . . . . . . . . . . 289,165,843
2020 LESS: Total Expenses (SLC 40 9910 11) . . . . . . . . . . . . . . . . . . . . . . . . . . . . . . . . . . . . . . . . . . . . . . . . . . . . . . . . . . . . . . . . . . . . . . . . . . . . . . 276,556,375
2030 PLUS: . . . . . . . . . . . . . . . . . . . . . . . . . . . . . . . . . . . . . . . . . . . . . . . . . . . . . . . . . . . . . . . . . . . . . . . . . . . . . . . . . . . . . . . . . . . . . . . . . 0
2040 PLUS: . . . . . . . . . . . . . . . . . . . . . . . . . . . . . . . . . . . . . . . . . . . . . . . . . . . . . . . . . . . . . . . . . . . . . . . . . . . . . . . . . . . . . . . . . . . . . . . . . 0
2045 PLUS: PSAB Adjustments . . . . . . . . . . . . . . . . . . . . . . . . . . . . . . . . . . . . . . . . . . . . . . . . . . . . . . . . . . . . . . . . . . . . . . . . . . . . . . 0
2099 Annual Surplus/(Deficit) . . . . . . . . . . . . . . . . . . . . . . . . . . . . . . . . . . . . . . . . . . . . . . . . . . . . . . . . . . . . . . . . . . . . . . . . . . . . . . 12,609,468
2060 Accumulated surplus/(deficit) at the beginning of year . . . . . . . . . . . . . . . . . . . . . . . . . . . . . . . . . . . . . . . . . . . . . . . . . . . . . . . . . . . . . . . . . . . . . . . . . . . . . . 825,679,809
2061 Prior period adjustments . . . . . . . . . . . . . . . . . . . . . . . . . . . . . . . . . . . . . . . . . . . . . . . . . . . . . . . . . . . . . . . . . . . . . . . . . . . . . . -37,242,674
2062 Restated accumulated surplus/(deficit) at the beginning of year . . . . . . . . . . . . . . . . . . . . . . . . . . . . . . . . . . . . . . . . . . . . . . . . . . . . . . . . . . . . . . . . . . . . . . . . . . . . . . 788,437,135
9950 Accumulated surplus/(deficit) at the end of year (SLC 10 2099 01 + SLC 10 2062 01). . . . . . . . . . . . . . . . . . . . . . . . . . . . . . . . . . . . . . . . . . . . . . . . . . . . . . . . . . . . . . . . . . . . . . . . . . . . . . 801,046,603
Continuity of Government Business Enterprise Equity 1
$
6010 Government Business Enterprise Equity, beginning of year . . . . . . . . . . . . . . . . . . . . . . . . . . . . . . . . . . . . . . . . . . . . . . . . . . . . . . . . . . . . . . . . . . . . . . . . . . . . . . 56,180,735
6020 PLUS: Net Income for Government Business Enterprise for year . . . . . . . . . . . . . . . . . . . . . . . . . . . . . . . . . . . . . . . . . . . . . . . . . . . . . . . . . . . . . . . . . . . . . . . . . . . . . . 3,167,180
6060 PLUS: . . . . . . . . . . . . . . . . . . .Dividends / Other comprehensive Income . . . . . . . . . . . . . . . . . . . . . . . . . . . . . . . . . . . . . . . . . . . . . . . . . . . . . . . . . . . . . . . . . . . . . . . . . . . . . .-1,126,688
6090 Government Business Enterprise Equity, end of year . . . . . . . . . . . . . . . . . . . . . . . . . . . . . . . . . . . . . . . . . . . . . . . . . . . . . . . . . . . . . . . . . . . . . . . . . . . . . .58,221,227
Total of line 0899 includes:
Provincial Gas Tax Funding 1
$
4018 Provincial Gas Tax for Transit operating expenses. . . . . . . . . . . . . . . . . . . . . . . . . . . . . . . . . . . . . . . . . . . . . . . . . . . . . . . . . . . . . . . . . . . . . . . . . . .1,206,093
4019 Provincial Gas Tax for Transit capital expenses. . . . . . . . . . . . . . . . . . . . . . . . . . . . . . . . . . . . . . . . . . . . . . . . . . . . . . . . . . . . . . . . . . . . . . . . . . . 0
4020 Provincial Gas Tax . . . . . . . . . . . . . . . . . . . . . . . . . . . . . . . . . . . . . . . . . . . . . . . . . . . . . . . . . . . . . . . . . . . . . . . . . . . 1,206,093
Total of line 0899 includes:
Canada Gas Tax Funding 1
$
4025 General Government . . . . . . . . . . . . . . . . . . . . . . . . . . . . . . . . . . . . . . . . . . . . . . . . . . . . . . . . . . . . . . . . . . . . . . . . . . .
Transportation Services:
4030 Roads - Paved . . . . . . . . . . . . . . . . . . . . . . . . . . . . . . . . . . . . . . . . . . . . . . . . . . . . . . . . . . . . . . . . . . . . . . . . . . . 3,161,393
4031 Roads - Unpaved . . . . . . . . . . . . . . . . . . . . . . . . . . . . . . . . . . . . . . . . . . . . . . . . . . . . . . . . . . . . . . . . . . . . . . . . . . .
4032 Roads - Bridges and Culverts . . . . . . . . . . . . . . . . . . . . . . . . . . . . . . . . . . . . . . . . . . . . . . . . . . . . . . . . . . . . . . . . . . . . . . . . . . . 12,189
4033 Roadways - Traffic Operations & Roadside . . . . . . . . . . . . . . . . . . . . . . . . . . . . . . . . . . . . . . . . . . . . . . . . . . . . . . . . . . . . . . . . . . . . . . . . . . . 335,000
4040 Transit - Conventional . . . . . . . . . . . . . . . . . . . . . . . . . . . . . . . . . . . . . . . . . . . . . . . . . . . . . . . . . . . . . . . . . . . . . . . . . . . 1,198,011
4041 Transit - Disabled & special needs . . . . . . . . . . . . . . . . . . . . . . . . . . . . . . . . . . . . . . . . . . . . . . . . . . . . . . . . . . . . . . . . . . . . . . . . . . . 390,010
4045 Air transportation . . . . . . . . . . . . . . . . . . . . . . . . . . . . . . . . . . . . . . . . . . . . . . . . . . . . . . . . . . . . . . . . . . . . . . . . . . .
4046 Other . . . . . . . . . . . . . . . . . . . . . . . . . . . . . . . . . . . . . . . . . . . . . . . . . . . . . . . . . . . . . . . . . . . . . . . . . . .. . . . . . . . . . . . . . . . . . . . . . . . . . . . . . . . . . . . . . . . . . . . . . . . . . . . . . . . . . . . . . . . . . . . . . . . . . . . . .
Environmental Services:
4060 Wastewater collection/conveyance . . . . . . . . . . . . . . . . . . . . . . . . . . . . . . . . . . . . . . . . . . . . . . . . . . . . . . . . . . . . . . . . . . . . . . . . . . .
4061 Wastewater treatment & disposal . . . . . . . . . . . . . . . . . . . . . . . . . . . . . . . . . . . . . . . . . . . . . . . . . . . . . . . . . . . . . . . . . . . . . . . . . . . 4,094
4062 Urban storm sewer system . . . . . . . . . . . . . . . . . . . . . . . . . . . . . . . . . . . . . . . . . . . . . . . . . . . . . . . . . . . . . . . . . . . . . . . . . . .
4063 Rural storm sewer system . . . . . . . . . . . . . . . . . . . . . . . . . . . . . . . . . . . . . . . . . . . . . . . . . . . . . . . . . . . . . . . . . . . . . . . . . . .
4064 Water treatment . . . . . . . . . . . . . . . . . . . . . . . . . . . . . . . . . . . . . . . . . . . . . . . . . . . . . . . . . . . . . . . . . . . . . . . . . . .
4065 Water distribution/transmission . . . . . . . . . . . . . . . . . . . . . . . . . . . . . . . . . . . . . . . . . . . . . . . . . . . . . . . . . . . . . . . . . . . . . . . . . . .
4066 Solid waste collection . . . . . . . . . . . . . . . . . . . . . . . . . . . . . . . . . . . . . . . . . . . . . . . . . . . . . . . . . . . . . . . . . . . . . . . . . . .
4067 Solid waste disposal . . . . . . . . . . . . . . . . . . . . . . . . . . . . . . . . . . . . . . . . . . . . . . . . . . . . . . . . . . . . . . . . . . . . . . . . . . .
4068 Waste diversion . . . . . . . . . . . . . . . . . . . . . . . . . . . . . . . . . . . . . . . . . . . . . . . . . . . . . . . . . . . . . . . . . . . . . . . . . . .
4069 Other . . . . . . . . . . . . . . . . . . . . . . . . . . . . . . . . . . . . . . . . . . . . . . . . . . . . . . . . . . . . . . . . . . . . . . . . . . .
4075 Recreation Facilities - All Other . . . . . . . . . . . . . . . . . . . . . . . . . . . . . . . . . . . . . . . . . . . . . . . . . . . . . . . . . . . . . . . . . . . . . . . . . . .
4076 Cultural services . . . . . . . . . . . . . . . . . . . . . . . . . . . . . . . . . . . . . . . . . . . . . . . . . . . . . . . . . . . . . . . . . . . . . . . . . . .
4080 Commercial and industrial . . . . . . . . . . . . . . . . . . . . . . . . . . . . . . . . . . . . . . . . . . . . . . . . . . . . . . . . . . . . . . . . . . . . . . . . . . .
4099 Canada Gas Tax 5,100,697
Page 151

2015 Financial Information Return - Schedule 12 - Grants, User Fees and Service ChargesProvince of Ontario - Ministry of Municipal Affairs and Housing 16.06.2016 15:102015-V01
FIR2015: Brantford C Schedule 12Asmt Code: 2906 GRANTS, USER FEES AND SERVICE CHARGES
MAH Code: 40101 for the year ended December 31, 2015
Ontario Conditional
Grants
Canada Conditional
GrantsOther Municipalities
User Fees and Service
Charges
Ontario Grants - Tangible
Capital Assets
Canada Grants -
Tangible Capital Assets
Other Municipalities -
Tangible Capital Assets
1 2 3 4 5 6 7
$ $ $ $ $ $ $
0299 General government . . . . . . . . . . . . . . . . . . . . . . . . . . . . . . . . . . . . . . . . . . . . . . . . . . . . . . . . . . . . . . . . . . . . . . . 0 0 2,086 756,560 0 0 0
Protection services
0410 Fire . . . . . . . . . . . . . . . . . . . . . . . . . . . . . . . . . . . . . . . . . . . . . . . . . . . . . . . . . . . . . . . . . . . . . . . . . . . . . . . . . . . . . . . . . . . . . . . . . . 0 0 7,322 20,946 0 0 0
0420 Police . . . . . . . . . . . . . . . . . . . . . . . . . . . . . . . . . . . . . . . . . . . . . . . . . . . . . . . . . . . . . . . . . . . . . . . . . . . . . . . . . . . . . . . . . . . . . . . . . . 1,239,108 0 4,445 525,571 0 0 0
0421 Court Security . . . . . . . . . . . . . . . . . . . . . . . . . . . . . . . . . . . . . . . . . . . . . . . . . . . . . . . . . . . . . . . . . . . . . . . . . . . . . . . . . . . . . . . . . . . . . . . . . . 654,979 0 0 0 0 0 0
0422 Prisoner Transportation . . . . . . . . . . . . . . . . . . . . . . . . . . . . . . . . . . . . . . . . . . . . . . . . . . . . . . . . . . . . . . . . . . . . . . . . . . . . . . . . . . . . . . . . . . . . . . . . . . 0 0 0 0 0 0 0
0430 Conservation authority . . . . . . . . . . . . . . . . . . . . . . . . . . . . . . . . . . . . . . . . . . . . . . . . . . . . . . . . . . . . . . . . . . . . . . . . . . . . . . . . . . . . . . . . . . . . . . . . . . 0 0 0 0 0 0 0
0440 Protective inspection and control . . . . . . . . . . . . . . . . . . . . . . . . . . . . . . . . . . . . . . . . . . . . . . . . . . . . . . . . . . . . . . . . . . . . . . . . . . . . . . . . . . . . . . . . . . . . . . . . . . 0 0 0 92,846 0 0 0
0445 Building permit and inspection services . . . . . . . . . . . . . . . . . . . . . . . . . . . . . . . . . . . . . . . . . . . . . . . . . . . . . . . . . . . . . . . . . . . . . . . . . . . . . . . . . . . . . . . . . . . . . . . . . .1,120 0 0 4,183 0 0 0
0450 Emergency measures . . . . . . . . . . . . . . . . . . . . . . . . . . . . . . . . . . . . . . . . . . . . . . . . . . . . . . . . . . . . . . . . . . . . . . . . . . . . . . . . . . . . . . . . . . . . . . . . . . 0 0 0 0 0 0 0
0460 Provincial Offences Act (POA) . . . . . . . . . . . . . . . . . . . . . . . . . . . . . . . . . . . . . . . . . . . . . . . . . . . . . . . . . . . . . . . . . . . . . . . . . . . . . . . . . . . . . . . . . . . . . . . . . . 0
0498 Other . . . . . . . . . . . . . . . . . . . . . . . . . . . . . . . . . . . . . . . . . . . . . . . . . . . . . . . . . . . . . . . . . . . . . . . . . . . . . . 0 0 0 0 0 0 0
0499 Subtotal 1,895,207 0 11,767 643,546 0 0 0
Transportation services
0611 Roads - Paved . . . . . . . . . . . . . . . . . . . . . . . . . . . . . . . . . . . . . . . . . . . . . . . . . . . . . . . . . . . . . . . . . . . . . . . . . . . . . . . . . . . . . . . . . . . . . . . . . . 0 0 0 373,847 1,889,270 0 0
0612 Roads - Unpaved . . . . . . . . . . . . . . . . . . . . . . . . . . . . . . . . . . . . . . . . . . . . . . . . . . . . . . . . . . . . . . . . . . . . . . . . . . . . . . . . . . . . . . . . . . . . . . . . . . 0 0 0 0 0 0 0
0613 Roads - Bridges and Culverts . . . . . . . . . . . . . . . . . . . . . . . . . . . . . . . . . . . . . . . . . . . . . . . . . . . . . . . . . . . . . . . . . . . . . . . . . . . . . . . . . . . . . . . . . . . . . . . . . . 0 0 0 0 0 0 0
0614 Roads - Traffic Operations & Roadside . . . . . . . . . . . . . . . . . . . . . . . . . . . . . . . . . . . . . . . . . . . . . . . . . . . . . . . . . . . . . . . . . . . . . . . . . . . . . . . . . . . . . . . . . . . . . . . . . . 1,120 0 0 26,993 0 0 0
0621 Winter Control - Except sidewalks, Parking Lots . . . . . . . . . . . . . . . . . . . . . . . . . . . . . . . . . . . . . . . . . . . . . . . . . . . . . . . . . . . . . . . . . . . . . . . . . . . . . . . . . . . . . . . . . . . . . . . . . . 0 0 0 0 0 0 0
0622 Winter Control - Sidewalks, Parking Lots Only. . . . . . . . . . . . . . . . . . . . . . . . . . . . . . . . . . . . . . . . . . . . . . . . . . . . . . . . . . . . . . . . . . . . . . . . . . . . . . . . . . . . . . . . . . . . . . . . . . 0 0 0 0 0 0 0
0631 Transit - Conventional . . . . . . . . . . . . . . . . . . . . . . . . . . . . . . . . . . . . . . . . . . . . . . . . . . . . . . . . . . . . . . . . . . . . . . . . . . . . . . . . . . . . . . . . . . . . . . . . . 300 0 0 2,894,869 0 0 0
0632 Transit - Disabled & special needs . . . . . . . . . . . . . . . . . . . . . . . . . . . . . . . . . . . . . . . . . . . . . . . . . . . . . . . . . . . . . . . . . . . . . . . . . . . . . . . . . . . . . . . . . . . . . . . . . 0 0 0 120,412 0 0 0
0640 Parking . . . . . . . . . . . . . . . . . . . . . . . . . . . . . . . . . . . . . . . . . . . . . . . . . . . . . . . . . . . . . . . . . . . . . . . . . . . . . . . . . . . . . . . . . . . . . . . . . . 0 0 0 346,470 0 0 0
0650 Street lighting . . . . . . . . . . . . . . . . . . . . . . . . . . . . . . . . . . . . . . . . . . . . . . . . . . . . . . . . . . . . . . . . . . . . . . . . . . . . . . . . . . . . . . . . . . . . . . . . . . 0 0 0 0 0 0 0
0660 Air transportation . . . . . . . . . . . . . . . . . . . . . . . . . . . . . . . . . . . . . . . . . . . . . . . . . . . . . . . . . . . . . . . . . . . . . . . . . . . . . . . . . . . . . . . . . . . . . . . . . . 0 0 0 23,170 0 0 0
0698 Other . . . . . . . . . . . . . . . . . . . . . . . . . . . . . . . . . . . . . . . . . . . . . . . . . . . . . . . . . . . . . . . . . . . . . . . . . . . . . . 0 0 0 0 0 0 0
0699 Subtotal 1,420 0 0 3,785,761 1,889,270 0 0
Environmental services
0811 Wastewater collection/conveyance. . . . . . . . . . . . . . . . . . . . . . . . . . . . . . . . . . . . . . . . . . . . . . . . . . . . . . . . . . . . . . . . . . . . . . . . . . . . . . . . . . . . . . . . . . . . . . . . . . 0 0 0 9,046,898 0 0 0
0812 Wastewater treatment & disposal . . . . . . . . . . . . . . . . . . . . . . . . . . . . . . . . . . . . . . . . . . . . . . . . . . . . . . . . . . . . . . . . . . . . . . . . . . . . . . . . . . . . . . . . . . . . . . . . . . 5,000 0 0 7,376,285 0 0 0
0821 Urban storm sewer system . . . . . . . . . . . . . . . . . . . . . . . . . . . . . . . . . . . . . . . . . . . . . . . . . . . . . . . . . . . . . . . . . . . . . . . . . . . . . . . . . . . . . . . . . . . . . . . . . . 0 0 0 0 0 0 0
0822 Rural storm sewer system . . . . . . . . . . . . . . . . . . . . . . . . . . . . . . . . . . . . . . . . . . . . . . . . . . . . . . . . . . . . . . . . . . . . . . . . . . . . . . . . . . . . . . . . . . . . . . . . . . 0 0 0 0 0 0 0
0831 Water treatment . . . . . . . . . . . . . . . . . . . . . . . . . . . . . . . . . . . . . . . . . . . . . . . . . . . . . . . . . . . . . . . . . . . . . . . . . . . . . . . . . . . . . . . . . . . . . . . . . . 0 0 278,583 11,759,824 0 0 0
0832 Water distribution/transmission . . . . . . . . . . . . . . . . . . . . . . . . . . . . . . . . . . . . . . . . . . . . . . . . . . . . . . . . . . . . . . . . . . . . . . . . . . . . . . . . . . . . . . . . . . . . . . . . . . 0 0 227,932 9,781,261 0 0 0
0840 Solid waste collection . . . . . . . . . . . . . . . . . . . . . . . . . . . . . . . . . . . . . . . . . . . . . . . . . . . . . . . . . . . . . . . . . . . . . . . . . . . . . . . . . . . . . . . . . . . . . . . . . . 0 0 0 0 0 0 0
0850 Solid waste disposal . . . . . . . . . . . . . . . . . . . . . . . . . . . . . . . . . . . . . . . . . . . . . . . . . . . . . . . . . . . . . . . . . . . . . . . . . . . . . . . . . . . . . . . . . . . . . . . . . . 0 0 0 3,973,874 33,852 0 0
0860 Waste diversion . . . . . . . . . . . . . . . . . . . . . . . . . . . . . . . . . . . . . . . . . . . . . . . . . . . . . . . . . . . . . . . . . . . . . . . . . . . . . . . . . . . . . . . . . . . . . . . . . . 880,459 0 0 0 0 0 0
0898 Other . . . . . . . . . . . . . . . . . . . . . . . . . . . . . . . . . . . . . . . . . . . . . . . . . . . . . . . . . . . . . . . . . . . . . . . . . . . . . . 0 0 0 0 0 0 0
0899 Subtotal 885,459 0 506,515 41,938,142 33,852 0 0
Health services
1010 Public health services . . . . . . . . . . . . . . . . . . . . . . . . . . . . . . . . . . . . . . . . . . . . . . . . . . . . . . . . . . . . . . . . . . . . . . . . . . . . . . . . . . . . . . . . . . . . . . . . . . 0 0 0 0 0 0 0
1020 Hospitals . . . . . . . . . . . . . . . . . . . . . . . . . . . . . . . . . . . . . . . . . . . . . . . . . . . . . . . . . . . . . . . . . . . . . . . . . . . . . . . . . . . . . . . . . . . . . . . . . . 0 0 0 0 0 0 0
1030 Ambulance services . . . . . . . . . . . . . . . . . . . . . . . . . . . . . . . . . . . . . . . . . . . . . . . . . . . . . . . . . . . . . . . . . . . . . . . . . . . . . . . . . . . . . . . . . . . . . . . . . . 0 0 0 0 0 0 0
1035 Ambulance dispatch . . . . . . . . . . . . . . . . . . . . . . . . . . . . . . . . . . . . . . . . . . . . . . . . . . . . . . . . . . . . . . . . . . . . . . . . . . . . . . . . . . . . . . . . . . . . . . . . . . 0 0 0 0 0 0 0
1040 Cemeteries . . . . . . . . . . . . . . . . . . . . . . . . . . . . . . . . . . . . . . . . . . . . . . . . . . . . . . . . . . . . . . . . . . . . . . . . . . . . . . . . . . . . . . . . . . . . . . . . . . 0 0 0 349,577 0 0 0
1098 Other . . . . . . . . . . . . . . . . . . . . . . . . . . . . . . . . . . . . . . . . . . . . . . . . . . . . . . . . . . . . . . . . . . . . . . . . . . . . . . 0 0 0 0 0 0 0
1099 Subtotal 0 0 0 349,577 0 0 0
Social and family services
1210 General assistance . . . . . . . . . . . . . . . . . . . . . . . . . . . . . . . . . . . . . . . . . . . . . . . . . . . . . . . . . . . . . . . . . . . . . . . . . . . . . . . . . . . . . . . . . . . . . . . . . . 24,275,761 164,254 415,672 0 0 0 0
1220 Assistance to aged persons . . . . . . . . . . . . . . . . . . . . . . . . . . . . . . . . . . . . . . . . . . . . . . . . . . . . . . . . . . . . . . . . . . . . . . . . . . . . . . . . . . . . . . . . . . . . . . . . . . 10,033,805 0 980,884 271,124 0 0 0
1230 Child care . . . . . . . . . . . . . . . . . . . . . . . . . . . . . . . . . . . . . . . . . . . . . . . . . . . . . . . . . . . . . . . . . . . . . . . . . . . . . . . . . . . . . . . . . . . . . . . . . . 9,279,446 990 189,239 197,437 0 0 0
1298 Other Social & Family Support Pgms . . . . . . . . . . . . . . . . . . . . . . . . . . . . . . . . . . . . . . . . . . . . . . . . . . . . . . . . . . . . . . . . . . . . . . . . . . . . . . 44,901 0 11,418 0 0 0 0
1299 Subtotal 43,633,913 165,244 1,597,213 468,561 0 0 0
Social Housing
1410 Public Housing . . . . . . . . . . . . . . . . . . . . . . . . . . . . . . . . . . . . . . . . . . . . . . . . . . . . . . . . . . . . . . . . . . . . . . . . . . . . . . . . . . . . . . . . . . . . . . . . . . 0 -433,700 307,153 106,875 0 0 0
1420 Non - Profit/Cooperative Housing . . . . . . . . . . . . . . . . . . . . . . . . . . . . . . . . . . . . . . . . . . . . . . . . . . . . . . . . . . . . . . . . . . . . . . . . . . . . . . . . . . . . . . . . . . . . . . . . . . 15,175 1,674,390 1,297,188 14,899 0 0 0
1430 Rent Supplement Programs . . . . . . . . . . . . . . . . . . . . . . . . . . . . . . . . . . . . . . . . . . . . . . . . . . . . . . . . . . . . . . . . . . . . . . . . . . . . . . . . . . . . . . . . . . . . . . . . . . 1,168,818 206,376 70,786 0 0 0 0
1497 Other Affordable Housing . . . . . . . . . . . . . . . . . . . . . . . . . . . . . . . . . . . . . . . . . . . . . . . . . . . . . . . . . . . . . . . . . . . . . . . . . . . . . . 508,043 2,000 72,929 1,598 76,810 0 0
1498 Other . . . . . . . . . . . . . . . . . . . . . . . . . . . . . . . . . . . . . . . . . . . . . . . . . . . . . . . . . . . . . . . . . . . . . . . . . . . . . . 0 0 0 0 0 0 0
1499 Subtotal 1,692,036 1,449,066 1,748,056 123,372 76,810 0 0
Recreation and cultural services
1610 Parks . . . . . . . . . . . . . . . . . . . . . . . . . . . . . . . . . . . . . . . . . . . . . . . . . . . . . . . . . . . . . . . . . . . . . . . . . . . . . . . . . . . . . . . . . . . . . . . . . . -8,205 0 0 205,831 0 50,000 0
1620 Recreation programs . . . . . . . . . . . . . . . . . . . . . . . . . . . . . . . . . . . . . . . . . . . . . . . . . . . . . . . . . . . . . . . . . . . . . . . . . . . . . . . . . . . . . . . . . . . . . . . . . . 137,564 2,684 0 4,205,953 0 0 0
1631 Recreation facilities - Golf Course, Marina, Ski Hill . . . . . . . . . . . . . . . . . . . . . . . . . . . . . . . . . . . . . . . . . . . . . . . . . . . . . . . . . . . . . . . . . . . . . . . . . . . . . . . . . . . . . . . . . . . . . . . . . . 0 0 0 911,273 0 0 0
1634 Recreation facilities - All Other . . . . . . . . . . . . . . . . . . . . . . . . . . . . . . . . . . . . . . . . . . . . . . . . . . . . . . . . . . . . . . . . . . . . . . . . . . . . . . . . . . . . . . . . . . . . . . . . . . 12,445 0 0 331,882 0 0 0
1640 Libraries . . . . . . . . . . . . . . . . . . . . . . . . . . . . . . . . . . . . . . . . . . . . . . . . . . . . . . . . . . . . . . . . . . . . . . . . . . . . . . . . . . . . . . . . . . . . . . . . . . 171,016 12,499 0 257,613 0 0 0
1645 Museums . . . . . . . . . . . . . . . . . . . . . . . . . . . . . . . . . . . . . . . . . . . . . . . . . . . . . . . . . . . . . . . . . . . . . . . . . . . . . . . . . . . . . . . . . . . . . . . . . . 24,124 0 5,088 31,097 0 0 0
1650 Cultural services . . . . . . . . . . . . . . . . . . . . . . . . . . . . . . . . . . . . . . . . . . . . . . . . . . . . . . . . . . . . . . . . . . . . . . . . . . . . . . . . . . . . . . . . . . . . . . . . . . 0 70,525 0 1,035,751 0 0 0
1698 Other . . . . . . . . . . . . . . . . . . . . . . . . . . . . . . . . . . . . . . . . . . . . . . . . . . . . . . . . . . . . . . . . . . . . . . . . . . . . . . 0 0 0 0 0 0 0
1699 Subtotal 336,944 85,708 5,088 6,979,400 0 50,000 0
Planning and development
1810 Planning and zoning . . . . . . . . . . . . . . . . . . . . . . . . . . . . . . . . . . . . . . . . . . . . . . . . . . . . . . . . . . . . . . . . . . . . . . . . . . . . . . . . . . . . . . . . . . . . . . . . . . 0 0 0 472,411 0 0 0
1820 Commercial and industrial . . . . . . . . . . . . . . . . . . . . . . . . . . . . . . . . . . . . . . . . . . . . . . . . . . . . . . . . . . . . . . . . . . . . . . . . . . . . . . . . . . . . . . . . . . . . . . . . . . 161,550 1,350 25,710 11,208 0 0 0
1830 Residential development . . . . . . . . . . . . . . . . . . . . . . . . . . . . . . . . . . . . . . . . . . . . . . . . . . . . . . . . . . . . . . . . . . . . . . . . . . . . . . . . . . . . . . . . . . . . . . . . . . 0 0 0 95,709 0 0 0
1840 Agriculture and reforestation . . . . . . . . . . . . . . . . . . . . . . . . . . . . . . . . . . . . . . . . . . . . . . . . . . . . . . . . . . . . . . . . . . . . . . . . . . . . . . . . . . . . . . . . . . . . . . . . . . 0 0 0 0 0 0 0
1850 Tile drainage/shoreline assistance . . . . . . . . . . . . . . . . . . . . . . . . . . . . . . . . . . . . . . . . . . . . . . . . . . . . . . . . . . . . . . . . . . . . . . . . . . . . . . . . . . . . . . . . . . . . . . . . . . 0
1898 Other . . . . . . . . . . . . . . . . . . . . . . . . . . . . . . . . . . . . . . . . . . . . . . . . . . . . . . . . . . . . . . . . . . . . . . . . . . . . . . 0 0 0 0 0 0 0
1899 Subtotal 161,550 1,350 25,710 579,328 0 0 0
1910 Other . . . . . . . . . . . . . . . . . . . . . . . . . . . . . . . . . . . . . . . . . . . . . . . . . . . . . . . . . . . . . . . . . . . . . . . . . . . . . .
9910 TOTAL 48,606,529 1,701,368 3,896,435 55,624,247 1,999,932 50,000 0
Page 152

2015 Financial Information Return - Schedule 20 - Taxation InformationProvince of Ontario - Ministry of Municipal Affairs and Housing 16.06.2016 15:10
2015-V01
FIR2015: Brantford C Schedule 20Asmt Code: 2906 TAXATION INFORMATIONMAH Code: 40101 for the year ended December 31, 2015
General Information
1. Optional Property Classes in Effect 2
Y or N
0202 N New Multi-Residential . . . . . . . . . . . . . . . . . . . . . . . . . . . . . . . . . . . . . . . . . . . . . . . . . . . . . . . . . . Y
0205 G Parking Lot (Includes CJ, CR, CX, CY, CZ) . . . . . . . . . . . . . . . . . . . . . . . . . . . . . . . . . . . . . . . . . . . . . . . . . . . . . . . . . . N
0210 D Office Building . . . . . . . . . . . . . . . . . . . . . . . . . . . . . . . . . . . . . . . . . . . . . . . . . N
0215 S Shopping Centre . . . . . . . . . . . . . . . . . . . . . . . . . . . . . . . . . . . . . . . . . . . . . . . . . . N
0220 L Large Industrial . . . . . . . . . . . . . . . . . . . . . . . . . . . . . . . . . . . . . . . . . . . . . . . . . . . N
0225 Other . . . . . . . . . . . N
2. Capping Parameters and ResultsDecrease -
Percentage
Retained
Tax Adjustment -
IncreasersNet Class Impact
Annualized Tax
LimitCVA Tax Limit
CVA Threshold
Value for
Protected
Properties
CVA Threshold
Value for Clawed
Back Properties
Exclude
Properties
Previously at
CVA Tax
Exclude
Properties that go
from Capped to
Clawed Back
Exclude
Properties that go
from Clawed
Back to Capped
2 3 4 5 6 7 8 9 10 11
% $ $ % % $ $ Y or N Y or N Y or N
0320 M Multi-Residential . . . . . . . . . . . . . . . . . . . . . . . . . . . . . . . . . . . . . . . . . . . . . . . 86.0% 13,212 0 10.0% 5.0% 250 N N N
0330 C Commercial . . . . . . . . . . . . . . . . . . . . . . . . . . . . . . . . . . . . . . . . . . . . . . . 70.9% 204,812 0 10.0% 5.0% 250 N N N
0340 I Industrial . . . . . . . . . . . . . . . . . . . . . . . . . . . . . . . . . . . . . . . . . . . . . . . 96.2% 10,253 0 10.0% 5.0% 250 N N N
Low Band Middle Band
Grad. Tax Rates
in Effect?
Number of Tax
BandsCVA Boundary
% of Highest
Band RateCVA Boundary
% of Highest
Band Rate
3. Graduated Taxation (Tax Bands) 2 3 4 5 6 7
Y or N # $ % $ %
0610 C Commercial . . . . . . . . . . . . . . . . . . . . . . . . . . . . . . . . . . . . . . . . . . . . . . . . . N
0611 G Parking Lot . . . . . . . . . . . . . . . . . . . . . . . . . . . . . . . . . . . . . . . . . . . . . N
0612 D Office Building . . . . . . . . . . . . . . . . . . . . . . . . . . . . . . . . . . . . . . . . . . . . . N
0613 S Shopping Centre . . . . . . . . . . . . . . . . . . . . . . . . . . . . . . . . . . . . . . . . . . . . . N
0620 I Industrial . . . . . . . . . . . . . . . . . . . . . . . . . . . . . . . . . . . . . . . N
0621 L Large Industrial . . . . . . . . . . . . . . . . . . . . . . . . . . . . . . . . . . . . . . . . . . . . . N
Phase-In
Program in
Effect?
Year Current Phase-
In Initiated
Term of Current
Phase-In
4. Phase-In Program in Effect (Most recent Phase-In only) 2 3 4
Y or N Year # of Yrs
0805 R Residential . . . . . . . . . . . . . . . . . . . . . . . . . . . . . . . . . . . . . . . . . . . . . . . . . . . . . . . N
0810 M Multi-Residential . . . . . . . . . . . . . . . . . . . . . . . . . . . . . . . . . . . . . . . . . . . . . . . . . . . . . . N
0815 N New Multi-Residential . . . . . . . . . . . . . . . . . . . . . . . . . . . . . . . . . . . . . . . . . . . . . . . . . . . N
0820 C Commercial (Includes G, D, S) . . . . . . . . . . . . . . . . . . . . . . . . . . . . . . . . . . . . . . . . . . . . . . . . . . . . . . . . . . . . . . N
0840 I Industrial (Includes L) . . . . . . . . . . . . . . . . . . . . . . . . . . . . . . . . . . . . . . . . . . . . . . . . . . . . . . . . N
0850 F Farmland . . . . . . . . . . . . . . . . . . . . . . . . . . . . . . . . . . . . . . . . . . . . . . . . . . . . . . . . N
0855 T Managed Forest . . . . . . . . . . . . . . . . . . . . . . . . . . . . . . . . . . . . . . . . . . . . . . . . . . . . . N
0860 P Pipeline . . . . . . . . . . . . . . . . . . . . . . . . . . . . . . . . . . . . . . . . . . . . . . . . . . . . . . . . N
5. Rebates for Eligible Charities 2
%
1010 Rebate Percentage for Eligible Charities (SLC 72 2099 xx) . . . . . . . . . . . . . . . . . . . . . . . . . . . . . . . . . . . . . . . . . 40.0%
INTERIM Billing Installments FINAL Billing Installments
6. Property Tax Due Dates for Current Year Installments First Due Date Last Due Date Installments First Due Date Last Due Date
To be completed by Single/Lower-tier Municipalities Only 2 3 4 5 6 7
# YYYYMMDD YYYYMMDD # YYYYMMDD YYYYMMDD
1210 R Residential . . . . . . . . . . . . . . . . . . . . . . . . . . . . . . . . . . . . . . . . . . . . . . . . . . . . . . . . . . 2 20150227 20150429 2 20150626 20150909
1220 M Multi-Residential . . . . . . . . . . . . . . . . . . . . . . . . . . . . . . . . . . . . . . . . . . . . . . . . . . . . . . . . . . 2 20150227 20150429 2 20150626 20150909
1230 F Farmland . . . . . . . . . . . . . . . . . . . . . . . . . . . . . . . . . . . . . . . . . . . . . . . . . . . . . . . . 2 20150227 20150429 2 20150626 20150909
1240 T Managed Forest . . . . . . . . . . . . . . . . . . . . . . . . . . . . . . . . . . . . . . . . . . . . . . . . . . . . . . 2 20150227 20150429 2 20150626 20150909
1250 C Commercial . . . . . . . . . . . . . . . . . . . . . . . . . . . . . . . . . . . . . . . . . . . . . . . . . . . . . . . . . . . . . 2 20150227 20150429 2 20150626 20150909
1260 I Industrial . . . . . . . . . . . . . . . . . . . . . . . . . . . . . . . . . . . . . . . . . . . . . . . . . . . . . . . . . . . . . 2 20150227 20150429 2 20150626 20150909
1270 P Pipeline . . . . . . . . . . . . . . . . . . . . . . . . . . . . . . . . . . . . . . . . . . . . . . . . . . . . . . . . . . . . . . 2 20150227 20150429 2 20150626 20150909
1298 Other New Multi-Residential . . . . . . . . . . . . . . . . . . . . . . . . . . . . . . . . . . . . . . . . . . . . . . . . . . . . . . . . . . . . . . . . . . 2 20150227 20150429 2 20150626 20150909
Page 153

2015 Financial Information Return - Schedule 22 - Municipal and School Board Taxation - General PurposeProvince of Ontario - Ministry of Municipal Affairs and Housing 16.06.2016 15:102015-V01
FIR2015: Brantford C Schedule 22Asmt Code: 2906 MUNICIPAL and SCHOOL BOARD TAXATION
MAH Code: 40101 for the year ended December 31, 2015
1. GENERAL PURPOSE LEVY INFORMATION
Phase-In Taxable
AssessmentLT/ST Taxes UT Taxes Education Taxes TOTAL
9299 TOTAL . . . . . . . . . . . . . . . . . . . . . . . . . . . . . . . . . . . . . . . . . . . . . . . . . . .8,786,555,582 . . . . . . . . . . . . . . . . . . . . . . . . . . . . . . . . . . . . . . . . . . . . . . . . . . . 128,471,894 0 35,863,445 164,335,339
RTC
RTQ
Tax
BandProperty Class Tax Rate Description Tax Ratio
Percent
of Full
Rate
CVA
Assessment
Phase-In Taxable
AssessmentTax Rates Municipal Taxes Education Taxes TOTAL
LT / ST UT EDUC TOTAL LT / ST UT
1 2 3 4 5 6 7 16 8 9 10 11 12 13 14 15
LIST LIST % $ $ 0.xxxxxx% 0.xxxxxx% 0.xxxxxx% 0.xxxxxx% $ $ $ $
2001 0 Brantford C
0010 RT 0 Residential Full Occupied 1.000000 100% 6,937,092,781 6,805,854,861 1.199749% 0.195000% 1.394749% 81,653,176 0 13,271,417 94,924,593
0027 RD 0 Residential Education Only 1.000000 100% 459,000 451,500 0.000000% 0.195000% 0.195000% 0 0 880 880
0050 MT 0 Multi-Residential Full Occupied 2.047200 100% 382,806,600 373,598,015 2.456126% 0.195000% 2.651126% 9,176,038 0 728,516 9,904,554
0080 NT 0 New Multi-Residential Full Occupied 1.500000 100% 22,081,810 21,111,488 1.799624% 0.195000% 1.994624% 379,927 0 41,167 421,094
0110 FT 0 Farmland Full Occupied 0.250000 100% 7,084,610 6,465,588 0.299937% 0.048750% 0.348687% 19,393 0 3,152 22,545
0140 TT 0 Managed Forest Full Occupied 0.250000 100% 609,300 556,433 0.299937% 0.048750% 0.348687% 1,669 0 271 1,940
0210 CT 0 Commercial Full Occupied 1.875500 100% 807,289,551 792,740,338 2.250129% 1.430000% 3.680129% 17,837,680 0 11,336,187 29,173,867
0215 CH 0 Commercial Full Occupied, Shared PIL 1.875500 100% 374,000 351,750 2.250129% 1.430000% 3.680129% 7,915 0 5,030 12,945
0231 C1 0 Commercial Farm. Awaiting Devel. - Ph I 0.750000 100% 4,464,000 4,080,000 0.899812% 0.146250% 1.046062% 36,712 0 5,967 42,679
0240 CU 0 Commercial Excess Land 1.875500 70% 13,812,736 13,437,815 1.575090% 1.001000% 2.576090% 211,658 0 134,513 346,171
0270 CX 0 Commercial Vacant Land 1.875500 70% 27,521,600 26,519,355 1.575090% 1.001000% 2.576090% 417,704 0 265,459 683,163
0310 GT 0 Parking Lot Full Occupied 1.875500 100% 1,796,000 1,722,852 2.250129% 1.430000% 3.680129% 38,766 0 24,637 63,403
0320 DT 0 Office Building Full Occupied 1.875500 100% 5,005,630 4,919,852 2.250129% 1.430000% 3.680129% 110,703 0 70,354 181,057
0330 DU 0 Office Building Excess Land 1.875500 70% 35,500 35,143 1.575090% 1.001000% 2.576090% 554 0 352 906
0340 ST 0 Shopping Centre Full Occupied 1.875500 100% 188,181,090 186,713,746 2.250129% 1.430000% 3.680129% 4,201,300 0 2,670,007 6,871,307
0350 SU 0 Shopping Centre Excess Land 1.875500 70% 3,711,000 3,666,653 1.575090% 1.001000% 2.576090% 57,753 0 36,703 94,456
0510 IT 0 Industrial Full Occupied 2.473000 100% 153,479,105 152,935,141 2.966979% 1.530000% 4.496979% 4,537,554 0 2,339,908 6,877,462
0515 IH 0 Industrial Full Occupied, Shared PIL 2.473000 100% 138,500 128,625 2.966979% 1.530000% 4.496979% 3,816 0 1,968 5,784
0531 I1 0 Industrial Farm. Awaiting Devel. - Ph I 0.750000 100% 2,321,000 2,209,500 0.899812% 0.146250% 1.046062% 19,881 0 3,231 23,112
0540 IU 0 Industrial Excess Land 2.473000 70% 5,059,519 4,952,843 2.076885% 1.071000% 3.147885% 102,865 0 53,045 155,910
0570 IX 0 Industrial Vacant Land 2.473000 70% 18,916,900 18,264,315 2.076885% 1.071000% 3.147885% 379,329 0 195,611 574,940
0575 IJ 0 Industrial Vacant Land, Shared PIL 2.473000 70% 23,200 22,725 2.076885% 1.071000% 3.147885% 472 0 243 715
0610 LT 0 Large Industrial Full Occupied 2.473000 100% 95,880,770 95,880,770 2.966979% 1.530000% 4.496979% 2,844,762 0 1,466,976 4,311,738
0620 LU 0 Large Industrial Excess Land 2.473000 70% 1,411,700 1,401,953 2.076885% 1.071000% 3.147885% 29,117 0 15,015 44,132
0710 PT 0 Pipeline Full Occupied 1.740400 100% 22,378,000 22,015,461 2.088043% 1.369548% 3.457591% 459,692 0 301,512 761,204
2140 JT 0 Industrial, NConstr. Full Occupied 2.473000 100% 14,422,000 14,353,255 2.966979% 1.190000% 4.156979% 425,858 0 170,804 596,662
2145 JU 0 Industrial, NConstr. Excess Land 2.473000 70% 130,700 130,169 2.076885% 0.833000% 2.909885% 2,703 0 1,084 3,787
2235 KT 0 Large Ind., NConstr. Full Occupied 2.473000 100% 49,670,392 49,670,392 2.966979% 1.190000% 4.156979% 1,473,710 0 591,078 2,064,788
2240 KU 0 Large Ind., NConstr. Excess Land 2.473000 70% 3,564,715 3,338,036 2.076885% 0.833000% 2.909885% 69,327 0 27,806 97,133
2440 XT 0 Commercial, NConstr. Full Occupied 1.875500 100% 88,600,013 87,904,525 2.250129% 1.190000% 3.440129% 1,977,965 0 1,046,064 3,024,029
2445 XU 0 Commercial, NConstr. Excess Land 1.875500 70% 3,663,640 3,582,756 1.575090% 0.833000% 2.408090% 56,432 0 29,844 86,276
2635 YT 0 Office Build., NConstr. Full Occupied 1.875500 100% 2,777,000 2,707,648 2.250129% 1.190000% 3.440129% 60,926 0 32,221 93,147
2835 ZT 0 Shopp. Centre, NConstr. Full Occupied 1.875500 100% 81,123,140 80,048,046 2.250129% 1.190000% 3.440129% 1,801,184 0 952,572 2,753,756
2840 ZU 0 Shopp. Centre, NConstr. Excess Land 1.875500 70% 4,827,570 4,784,033 1.575090% 0.833000% 2.408090% 75,353 0 39,851 115,204
0.000000 0 0 0 0
0.000000 0 0 0 0
0.000000 0 0 0 0
0.000000 0 0 0 0
0.000000 0 0 0 0
0.000000 0 0 0 0
0.000000 0 0 0 0
0.000000 0 0 0 0
0.000000 0 0 0 0
0.000000 0 0 0 0
0.000000 0 0 0 0
0.000000 0 0 0 0
0 0 0 0
0 0 0 0
9201 Subtotal 8,950,713,072 8,786,555,582 128,471,894 0 35,863,445 164,335,339
Page 154

2015 Financial Information Return - Schedule 22 - Municipal and School Board Taxation - Adjustments and Other Taxation AmountsProvince of Ontario - Ministry of Municipal Affairs and Housing 16.06.2016 15:102015-V01
FIR2015: Brantford C Schedule 22Asmt Code: 2906 MUNICIPAL and SCHOOL BOARD TAXATIONMAH Code: 40101 for the year ended December 31, 2015
Municipal Taxes Education Taxes TOTAL
LT / ST UT
4. ADJUSTMENTS TO TAXATION 12 13 14 15
$ $ $ $
7010 Adjustments for properties, shared as if Payment-In-Lieu (Hydro properties RTQ = H, J, K) . . . . . . . . . . . . . . . . . . . . . . . . . . . . . . . . . . . . . . . . . . . . . . . . . . . . . . . . . . . . . . . . . . . . . . . . . . . . . . . . . . . . . . . . . . . . . . . . . . 7,241 -7,241 0
5. SUPPLEMENTARY TAXES
9799 Total of all supplementary taxes (Supps, Omits, Section 359) . . . . . . . . . . . . . . . . . . . . . . . . . . . . . . . . . . . . . . . . . . . . . . . . . . . . . . . . . . . . . . . . . . . . . . . . . . . . . . . . . . . . . . . . . . . . . . . . . . 850,673 239,006 1,089,679
6. AMOUNT LEVIED BY TAX RATE
9910 TOTAL Levied by Tax Rate 129,329,808 0 36,095,210 165,425,018
7. AMOUNTS ADDED TO TAX BILL
8005 Local improvements . . . . . . . . . . . . . . . . . . . . . . . . . . . . . . . . . . . . . . . . . . . . . . . . . . . . . . . . . . . . . . . . . . . . . . . . . . . . . . . . . . . . . . . . . . . . . . . . . . 221,392 221,392
8010 Sewer and water service charges . . . . . . . . . . . . . . . . . . . . . . . . . . . . . . . . . . . . . . . . . . . . . . . . . . . . . . . . . . . . . . . . . . . . . . . . . . . . . . . . . . . . . . . . . . . . . . . . . . 0
8015 Sewer and water connection charges . . . . . . . . . . . . . . . . . . . . . . . . . . . . . . . . . . . . . . . . . . . . . . . . . . . . . . . . . . . . . . . . . . . . . . . . . . . . . . . . . . . . . . . . . . . . . . . . . . 0
8020 Fire service charges . . . . . . . . . . . . . . . . . . . . . . . . . . . . . . . . . . . . . . . . . . . . . . . . . . . . . . . . . . . . . . . . . . . . . . . . . . . . . . . . . . . . . . . . . . . . . . . . . . 0
8025 Minimum tax (differential only) . . . . . . . . . . . . . . . . . . . . . . . . . . . . . . . . . . . . . . . . . . . . . . . . . . . . . . . . . . . . . . . . . . . . . . . . . . . . . . . . . . . . . . . . . . . . . . . . . . 0
8030 Municipal drainage charges . . . . . . . . . . . . . . . . . . . . . . . . . . . . . . . . . . . . . . . . . . . . . . . . . . . . . . . . . . . . . . . . . . . . . . . . . . . . . . . . . . . . . . . . . . . . . . . . . . 0
8035 Waste management collection charges . . . . . . . . . . . . . . . . . . . . . . . . . . . . . . . . . . . . . . . . . . . . . . . . . . . . . . . . . . . . . . . . . . . . . . . . . . . . . . . . . . . . . . . . . . . . . . . . . . 0
8040 Business improvement area . . . . . . . . . . . . . . . . . . . . . . . . . . . . . . . . . . . . . . . . . . . . . . . . . . . . . . . . . . . . . . . . . . . . . . . . . . . . . . . . . . . . . . . . . . . . . . . . . . 180,562 180,562
8097 Other . . . . . . . . . . . . . . . . . . . . . . . . . . . . . . . . . . . . . . . . . . . . . . . . . . . . . . . . . . . . . . . . . . . . . . . . . . . . . . . . . . . . . . . . . . . . . . . . . . 0
9890 Subtotal 401,954 0 0 401,954
8. OTHER TAXATION AMOUNTS
8045 Railway rights-of-way (RTC = W) . . . . . . . . . . . . . . . . . . . . . . . . . . . . . . . . . . . . . . . . . . . . . . . . . . . . . . . . . . . . . . . . . . . . . . . . . . . . . . . . . . . . . . . . . . . . . . . . . . 13,585 18,252 31,837
8050 Utility transmission and utility corridors (RTC = U) . . . . . . . . . . . . . . . . . . . . . . . . . . . . . . . . . . . . . . . . . . . . . . . . . . . . . . . . . . . . . . . . . . . . . . . . . . . . . . . . . . . . . . . . . . . . . . . . . . 1,449 1,449
8098 Other . . . . . . . . . . . . . . . . . . . . . . . . . . . . . . . . . . . . . . . . . . . . . . . . . . . . . . . . . . . . . . . . . . . . . . . . . . . . . . . . . . . . . . . . . . . . . . . . . . 0
9892 Subtotal 15,034 0 18,252 33,286
9. TOTAL AMOUNT LEVIED
9990 TOTAL Levies 129,746,796 0 36,113,462 165,860,258
Page 155

2015 Financial Information Return - Schedule 24 - Payment-in-lieu of Taxation - General PurposeProvince of Ontario - Ministry of Municipal Affairs and Housing 16.06.2016 15:10
2015-V01
FIR2015: Brantford C Schedule 24Asmt Code: 2906 PAYMENTS-IN-LIEU of TAXATION
MAH Code: 40101 for the year ended December 31, 2015
1. GENERAL PURPOSE PAYMENTS-IN-LIEU
PIL Phased-In
AssessmentLT/ST PILS UT PILS Education PILS TOTAL
9299 TOTAL . . . . . . . . . . . . . . . . . . . . . . . . . . . . . . . . . . . . . . . . . . . . . . . . . . .160,560,124 . . . . . . . . . . . . . . . . . . . . . . . . . . . . . . . . . . . . . . . . . . . . . . . . . . . 3,611,995 0 454,810 4,066,805
RTC
RTQ
Tax
BandProperty Class Tax Rate Description Tax Ratio
Percent of
Full RatePIL CVA Assessment
PIL Phased-In
AssessmentTax Rates Municipal PILS Education PILS TOTAL
LT / ST UT EDUC TOTAL LT / ST UT
1 2 3 4 5 6 7 16 8 9 10 11 12 13 14 15
LIST LIST % $ $ 0.xxxxxx% 0.xxxxxx% 0.xxxxxx% 0.xxxxxx% $ $ $ $
2001 0 Brantford C
1028 RG 0 Residential PIL: 'General' Only (No Educ.) 1.000000 100% 106,500 97,750 1.199749% 0.000000% 1.199749% 1,173 0 0 1,173
1210 CF 0 Commercial PIL: Full Occupied 1.875500 100% 28,104,000 27,942,574 2.250129% 1.430000% 3.680129% 628,744 0 399,579 1,028,323
1220 CG 0 Commercial PIL: 'General' Only (No Educ.) 1.875500 100% 147,283,000 128,659,500 2.250129% 0.000000% 2.250129% 2,895,005 0 0 2,895,005
1310 GF 0 Parking Lot PIL: Full Occupied 1.875500 100% 3,883,350 3,830,800 2.250129% 1.430000% 3.680129% 86,198 0 54,780 140,978
1510 IF 0 Industrial PIL: Full Occupied 2.473000 100% 29,500 29,500 2.966979% 1.530000% 4.496979% 875 0 451 1,326
0.000000 0 0 0 0
0.000000 0 0 0 0
0.000000 0 0 0 0
0.000000 0 0 0 0
0.000000 0 0 0 0
0.000000 0 0 0 0
0.000000 0 0 0 0
0.000000 0 0 0 0
0.000000 0 0 0 0
0.000000 0 0 0 0
0.000000 0 0 0 0
0.000000 0 0 0 0
0.000000 0 0 0 0
0.000000 0 0 0 0
0.000000 0 0 0 0
0.000000 0 0 0 0
0.000000 0 0 0 0
0.000000 0 0 0 0
0.000000 0 0 0 0
0.000000 0 0 0 0
0.000000 0 0 0 0
0.000000 0 0 0 0
0 0 0 0
0 0 0 0
0 0 0 0
0 0 0 0
0 0 0 0
9201 Subtotal 179,406,350 160,560,124 3,611,995 0 454,810 4,066,805
Page 156
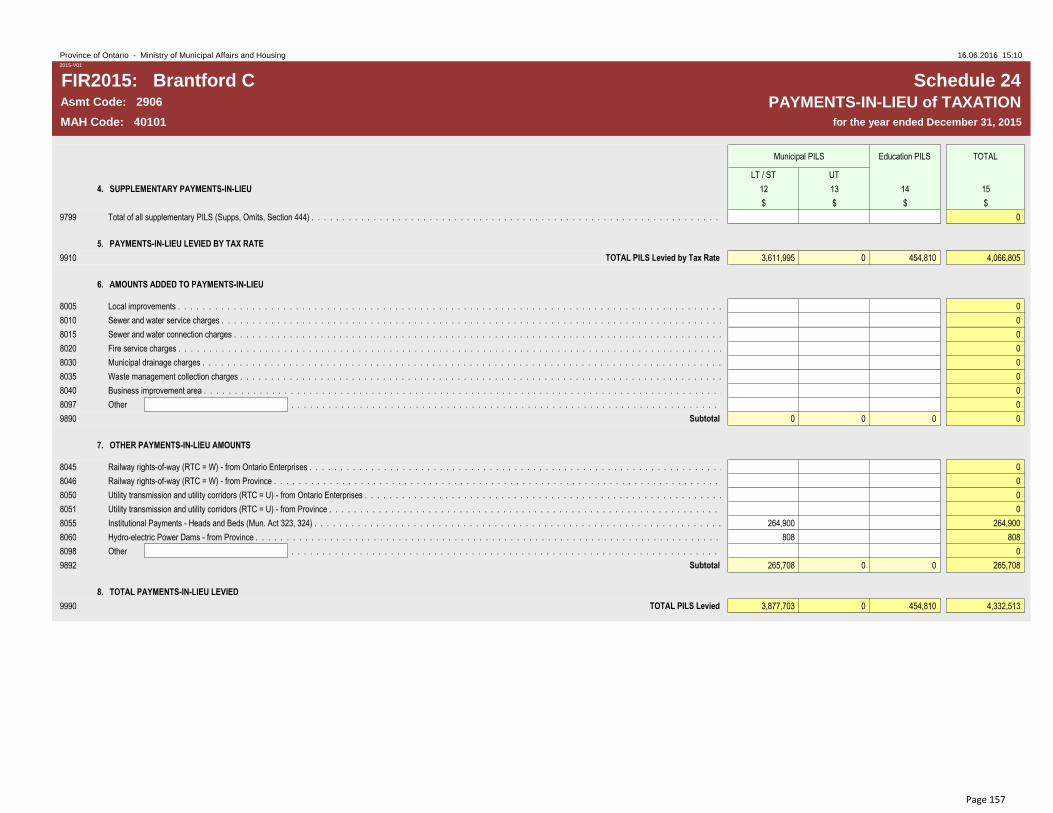
2015 Financial Information Return - Schedule 24 - Payments-in-Lieu of Taxation - Adjustments and Other Payment-in-lieu AmountsProvince of Ontario - Ministry of Municipal Affairs and Housing 16.06.2016 15:102015-V01
FIR2015: Brantford C Schedule 24Asmt Code: 2906 PAYMENTS-IN-LIEU of TAXATIONMAH Code: 40101 for the year ended December 31, 2015
Municipal PILS Education PILS TOTAL
LT / ST UT
4. SUPPLEMENTARY PAYMENTS-IN-LIEU 12 13 14 15
$ $ $ $
9799 Total of all supplementary PILS (Supps, Omits, Section 444) . . . . . . . . . . . . . . . . . . . . . . . . . . . . . . . . . . . . . . . . . . . . . . . . . . . . . . . . . . . . . . . . . . . . . . . . . . . . . . . . . . . . . . . . . . . . . . . . . . 0
5. PAYMENTS-IN-LIEU LEVIED BY TAX RATE
9910 TOTAL PILS Levied by Tax Rate 3,611,995 0 454,810 4,066,805
6. AMOUNTS ADDED TO PAYMENTS-IN-LIEU
8005 Local improvements . . . . . . . . . . . . . . . . . . . . . . . . . . . . . . . . . . . . . . . . . . . . . . . . . . . . . . . . . . . . . . . . . . . . . . . . . . . . . . . . . . . . . . . . . . . . . . . . . . 0
8010 Sewer and water service charges . . . . . . . . . . . . . . . . . . . . . . . . . . . . . . . . . . . . . . . . . . . . . . . . . . . . . . . . . . . . . . . . . . . . . . . . . . . . . . . . . . . . . . . . . . . . . . . . . . 0
8015 Sewer and water connection charges . . . . . . . . . . . . . . . . . . . . . . . . . . . . . . . . . . . . . . . . . . . . . . . . . . . . . . . . . . . . . . . . . . . . . . . . . . . . . . . . . . . . . . . . . . . . . . . . . . 0
8020 Fire service charges . . . . . . . . . . . . . . . . . . . . . . . . . . . . . . . . . . . . . . . . . . . . . . . . . . . . . . . . . . . . . . . . . . . . . . . . . . . . . . . . . . . . . . . . . . . . . . . . . . 0
8030 Municipal drainage charges . . . . . . . . . . . . . . . . . . . . . . . . . . . . . . . . . . . . . . . . . . . . . . . . . . . . . . . . . . . . . . . . . . . . . . . . . . . . . . . . . . . . . . . . . . . . . . . . . . 0
8035 Waste management collection charges . . . . . . . . . . . . . . . . . . . . . . . . . . . . . . . . . . . . . . . . . . . . . . . . . . . . . . . . . . . . . . . . . . . . . . . . . . . . . . . . . . . . . . . . . . . . . . . . . . 0
8040 Business improvement area . . . . . . . . . . . . . . . . . . . . . . . . . . . . . . . . . . . . . . . . . . . . . . . . . . . . . . . . . . . . . . . . . . . . . . . . . . . . . . . . . . . . . . . . . . . . . . . . . . 0
8097 Other . . . . . . . . . . . . . . . . . . . . . . . . . . . . . . . . . . . . . . . . . . . . . . . . . . . . . . . . . . . . . . . . . . . . . . . . . . . . . . . . . . . . . . . . . . . . . . . . . . 0
9890 Subtotal 0 0 0 0
7. OTHER PAYMENTS-IN-LIEU AMOUNTS
8045 Railway rights-of-way (RTC = W) - from Ontario Enterprises . . . . . . . . . . . . . . . . . . . . . . . . . . . . . . . . . . . . . . . . . . . . . . . . . . . . . . . . . . . . . . . . . . . . . . . . . . . . . . . . . . . . . . . . . . . . . . . . . . 0
8046 Railway rights-of-way (RTC = W) - from Province . . . . . . . . . . . . . . . . . . . . . . . . . . . . . . . . . . . . . . . . . . . . . . . . . . . . . . . . . . . . . . . . . . . . . . . . . . . . . . . . . . . . . . . . . . . . . . . . . . 0
8050 Utility transmission and utility corridors (RTC = U) - from Ontario Enterprises . . . . . . . . . . . . . . . . . . . . . . . . . . . . . . . . . . . . . . . . . . . . . . . . . . . . . . . . . . . . . . . . . . . . . . . . . . . . . . . . . . . . . . . . . . . . . . . . . . 0
8051 Utility transmission and utility corridors (RTC = U) - from Province . . . . . . . . . . . . . . . . . . . . . . . . . . . . . . . . . . . . . . . . . . . . . . . . . . . . . . . . . . . . . . . . . . . . . . . . . . . . . . . . . . . . . . . . . . . . . . . . . . 0
8055 Institutional Payments - Heads and Beds (Mun. Act 323, 324) . . . . . . . . . . . . . . . . . . . . . . . . . . . . . . . . . . . . . . . . . . . . . . . . . . . . . . . . . . . . . . . . . . . . . . . . . . . . . . . . . . . . . . . . . . . . . . . . . . 264,900 264,900
8060 Hydro-electric Power Dams - from Province . . . . . . . . . . . . . . . . . . . . . . . . . . . . . . . . . . . . . . . . . . . . . . . . . . . . . . . . . . . . . . . . . . . . . . . . . . . . . . . . . . . . . . . . . . . . . . . . . . 808 808
8098 Other . . . . . . . . . . . . . . . . . . . . . . . . . . . . . . . . . . . . . . . . . . . . . . . . . . . . . . . . . . . . . . . . . . . . . . . . . . . . . . . . . . . . . . . . . . . . . . . . . . 0
9892 Subtotal 265,708 0 0 265,708
8. TOTAL PAYMENTS-IN-LIEU LEVIED
9990 TOTAL PILS Levied 3,877,703 0 454,810 4,332,513
Page 157

2015 Financial Information Return - Schedule 26 - Taxation and Payment-in-lieu SummaryProvince of Ontario - Ministry of Municipal Affairs and Housing 16.06.2016 15:102015-V01
FIR2015: Brantford C Schedule 26Asmt Code: 2906 TAXATION and PAYMENTS-IN-LIEU SUMMARY
MAH Code: 40101 for the year ended December 31, 2015
1. Municipal and School Board TaxationTOTAL ENG - Public FRE - Public ENG - Separate FRE - Separate Other
9010 Legislated Percentage of Education Taxes distributed to each School Board (Applic. to Com, Ind, Pipelines) . . . . . . . . . . . . . . . . . . . . . . . . . . . . . . . . . . . . . . . . . . . . . . 100.000% 72.154% 0.184% 26.956% 0.706% 0.000%
Taxable Asmt.
(CVA)
Taxable Asmt.
(Wtd & Disc CVA)
Phase-In
Taxable Asmt.
(CVA)
Phase-In
Taxable Asmt.
(Wtd & Disc CVA)
TOTAL Taxes Municipal Taxes Education Taxes Distribution of Education Taxes in column 6 by School Board
LT / ST UT ENG - Public FRE - Public ENG - Separate FRE - Separate Other
Property Class Group 16 2 18 17 3 4 5 6 7 8 9 10 11
$ $ $ $ $ $ $ $ $ $ $ $ $
0010 Residential . . . . . . . . . . . . . . . . . . . . . . . . . . . . . . . . . . . . . . . . . . . . . . 6,937,551,781 6,937,551,781 6,806,306,361 6,806,306,361 94,925,473 81,653,176 0 13,272,297 10,647,702 14,054 2,552,414 58,127
0050 Multi-residential . . . . . . . . . . . . . . . . . . . . . . . . . . . . . . . . . . . . . . . . . . . . . . 404,888,410 816,804,387 394,709,503 796,497,088 10,325,648 9,555,965 0 769,683 728,935 850 38,706 1,192
0110 Farmland . . . . . . . . . . . . . . . . . . . . . . . . . . . . . . . . . . . . . . . . . . . . . . 7,084,610 1,771,153 6,465,588 1,616,397 22,545 19,393 0 3,152 3,018 0 134 0
0140 Managed Forests . . . . . . . . . . . . . . . . . . . . . . . . . . . . . . . . . . . . . . . . . . . . . . 609,300 152,325 556,433 139,108 1,940 1,669 0 271 96 74 36 65
9110 Subtotal 7,350,134,101 7,756,279,645 7,208,037,885 7,604,558,955 105,275,606 91,230,203 0 14,045,403 11,379,751 14,978 2,591,290 59,384 0
0210 Commercial . . . . . . . . . . . . . . . . . . . . . . . . . . . . . . . . . . . . . . . . . . . . . . 853,461,887 1,572,386,773 837,129,258 1,542,961,982 30,258,825 18,511,669 0 11,747,156 8,476,043 21,615 3,166,563 82,935 0
0215 Commercial New Construction. . . . . . . . . . . . . . . . . . . . . . . . . . . . . . . . . . . . . . . . . . . . . . 92,263,653 170,979,134 91,487,281 169,568,558 3,110,305 2,034,397 0 1,075,908 776,311 1,980 290,022 7,596 0
0310 Parking Lot . . . . . . . . . . . . . . . . . . . . . . . . . . . . . . . . . . . . . . . . . . . . . . 1,796,000 3,368,398 1,722,852 3,231,209 63,403 38,766 0 24,637 17,777 45 6,641 174 0
0320 Office Building . . . . . . . . . . . . . . . . . . . . . . . . . . . . . . . . . . . . . . . . . . . . . . 5,041,130 9,434,665 4,954,995 9,273,320 181,963 111,257 0 70,706 51,017 130 19,060 499 0
0325 Office Building New Construction. . . . . . . . . . . . . . . . . . . . . . . . . . . . . . . . . . . . . . . . . . . . . . 2,777,000 5,208,264 2,707,648 5,078,194 93,147 60,926 0 32,221 23,249 59 8,685 227 0
0340 Shopping Centre . . . . . . . . . . . . . . . . . . . . . . . . . . . . . . . . . . . . . . . . . . . . . . 191,892,090 357,805,621 190,380,399 354,995,396 6,965,763 4,259,053 0 2,706,710 1,953,000 4,980 729,621 19,109 0
0345 Shopping Centre New Construction. . . . . . . . . . . . . . . . . . . . . . . . . . . . . . . . . . . . . . . . . . . . . . 85,950,710 158,484,324 84,832,079 156,410,828 2,868,960 1,876,537 0 992,423 716,073 1,826 267,518 7,007 0
9120 Subtotal 1,233,182,470 2,277,667,179 1,213,214,512 2,241,519,486 43,542,366 26,892,605 0 16,649,761 12,013,469 30,636 4,488,110 117,547 0
0510 Industrial . . . . . . . . . . . . . . . . . . . . . . . . . . . . . . . . . . . . . . . . . . . . . . 179,938,224 423,182,828 178,513,149 420,414,380 7,637,923 5,043,917 0 2,594,006 1,871,679 4,773 699,240 18,314 0
0515 Industrial New Construction. . . . . . . . . . . . . . . . . . . . . . . . . . . . . . . . . . . . . . . . . . . . . . 14,552,700 35,891,861 14,483,424 35,720,935 600,449 428,561 0 171,888 124,024 316 46,334 1,214 0
0610 Large Industrial . . . . . . . . . . . . . . . . . . . . . . . . . . . . . . . . . . . . . . . . . . . . . . 97,292,470 239,556,938 97,282,723 239,540,065 4,355,870 2,873,879 0 1,481,991 1,069,316 2,727 399,485 10,463 0
0615 Large Industrial New Construction. . . . . . . . . . . . . . . . . . . . . . . . . . . . . . . . . . . . . . . . . . . . . . 53,235,107 129,005,758 53,008,428 128,613,354 2,161,921 1,543,037 0 618,884 446,550 1,139 166,826 4,369 0
9130 Subtotal 345,018,501 827,637,384 343,287,724 824,288,734 14,756,163 9,889,394 0 4,866,769 3,511,569 8,955 1,311,886 34,359 0
0710 Pipelines . . . . . . . . . . . . . . . . . . . . . . . . . . . . . . . . . . . . . . . . . . . . . . 22,378,000 38,946,671 22,015,461 38,315,708 761,204 459,692 0 301,512 217,553 555 81,276 2,129 0
0810 Other Property Classes . . . . . . . . . . . . . . . . . . . . . . . . . . . . . . . . . . . . . . . . . . . . . . 0 0 0 0 0 0 0 0
9160 Adj. for shared PIL properties . . . . . . . . . . . . . . . . . . . . . . . . . . . . . . . . . . . . . . . . . . . . . . 0 7,241 0 -7,241 -5,225 -13 -1,952 -51
9170 Supplementary Taxes . . . . . . . . . . . . . . . . . . . . . . . . . . . . . . . . . . . . . . . . . . . . . . 1,089,679 850,673 0 239,006 193,298 272 44,348 1,088
9180 Total Levied by Rate 165,425,018 129,329,808 0 36,095,210 27,310,414 55,382 8,514,957 214,456 0
9190 Amts Added to Tax Bill . . . . . . . . . . . . . . . . . . . . . . . . . . . . . . . . . . . . . . . . . . . . . . 401,954 401,954 0 0
9192 Other Taxation Amounts . . . . . . . . . . . . . . . . . . . . . . . . . . . . . . . . . . . . . . . . . . . . . . 33,286 15,034 0 18,252 13,169 34 129 4,920
9199 TOTAL before Adj. 8,950,713,072 10,900,530,879 8,786,555,582 10,708,682,883 165,860,258 129,746,796 0 36,113,462 27,323,583 55,416 8,515,086 219,376 0
2. Payments-In-Lieu of Taxation
PIL Asmt.
(CVA)
PIL Asmt.
(Wtd & Disc CVA)
Phase-In
PIL Asmt.
(CVA)
Phase-In
PIL Asmt.
(Wtd & Disc CVA)
Total PILS Levied Municipal PILS Education PILS
LT / ST UT
Property Class Group 16 2 18 17 3 4 5 6
$ $ $ $ $ $ $ $
1010 Residential . . . . . . . . . . . . . . . . . . . . . . . . . . . . . . . . . . . . . . . . . . . . . . 106,500 106,500 97,750 97,750 1,173 1,173 0 0
1050 Multi-residential . . . . . . . . . . . . . . . . . . . . . . . . . . . . . . . . . . . . . . . . . . . . . . 0 0 0 0 0 0 0 0
1110 Farmland . . . . . . . . . . . . . . . . . . . . . . . . . . . . . . . . . . . . . . . . . . . . . . 0 0 0 0 0 0 0 0
1140 Managed Forests . . . . . . . . . . . . . . . . . . . . . . . . . . . . . . . . . . . . . . . . . . . . . . 0 0 0 0 0 0 0 0
9210 Subtotal 106,500 106,500 97,750 97,750 1,173 1,173 0 0
1210 Commercial . . . . . . . . . . . . . . . . . . . . . . . . . . . . . . . . . . . . . . . . . . . . . . 175,387,000 328,938,319 156,602,074 293,707,190 3,923,328 3,523,749 0 399,579
1215 Commercial New Construction . . . . . . . . . . . . . . . . . . . . . . . . . . . . . . . . . . . . . . . . . . . . . . 0 0 0 0 0 0 0 0
1310 Parking Lot . . . . . . . . . . . . . . . . . . . . . . . . . . . . . . . . . . . . . . . . . . . . . . 3,883,350 7,283,223 3,830,800 7,184,665 140,978 86,198 0 54,780
1320 Office Building . . . . . . . . . . . . . . . . . . . . . . . . . . . . . . . . . . . . . . . . . . . . . . 0 0 0 0 0 0 0 0
1325 Office Building New Construction. . . . . . . . . . . . . . . . . . . . . . . . . . . . . . . . . . . . . . . . . . . . . . 0 0 0 0 0 0 0 0
1340 Shopping Centre . . . . . . . . . . . . . . . . . . . . . . . . . . . . . . . . . . . . . . . . . . . . . . 0 0 0 0 0 0 0 0 Part 3 contains Distribution of PILS by School Boards
1345 Shopping Centre New Construction. . . . . . . . . . . . . . . . . . . . . . . . . . . . . . . . . . . . . . . . . . . . . . 0 0 0 0 0 0 0 0
9220 Subtotal 179,270,350 336,221,541 160,432,874 300,891,855 4,064,306 3,609,947 0 454,359
1510 Industrial . . . . . . . . . . . . . . . . . . . . . . . . . . . . . . . . . . . . . . . . . . . . . . 29,500 72,954 29,500 72,954 1,326 875 0 451
1515 Industrial New Construction. . . . . . . . . . . . . . . . . . . . . . . . . . . . . . . . . . . . . . . . . . . . . . 0 0 0 0 0 0 0 0
1610 Large Industrial . . . . . . . . . . . . . . . . . . . . . . . . . . . . . . . . . . . . . . . . . . . . . . 0 0 0 0 0 0 0 0
1615 Large Industrial New Construction. . . . . . . . . . . . . . . . . . . . . . . . . . . . . . . . . . . . . . . . . . . . . . 0 0 0 0 0 0 0 0
9230 Subtotal 29,500 72,954 29,500 72,954 1,326 875 0 451
1718 Pipelines . . . . . . . . . . . . . . . . . . . . . . . . . . . . . . . . . . . . . . . . . . . . . . 0 0 0 0 0 0 0 0
1810 Other Property Classes . . . . . . . . . . . . . . . . . . . . . . . . . . . . . . . . . . . . . . . . . . . . . . 0 0 0 0 0 0 0 0
9270 Supplementary PILS . . . . . . . . . . . . . . . . . . . . . . . . . . . . . . . . . . . . . . . . . . . . . . 0 0 0 0
9280 Total Levied by Rate 4,066,805 3,611,995 0 454,810
9290 Amts Added to PILs . . . . . . . . . . . . . . . . . . . . . . . . . . . . . . . . . . . . . . . . . . . . . . 0 0 0 0
9292 Other PIL Amounts . . . . . . . . . . . . . . . . . . . . . . . . . . . . . . . . . . . . . . . . . . . . . . 265,708 265,708 0 0
9299 TOTAL before Adj. 179,406,350 336,400,995 160,560,124 301,062,559 4,332,513 3,877,703 0 454,810
Page 158

2015 Financial Information Return - Schedule 26 - Taxation and Payment-in-lieu SummaryProvince of Ontario - Ministry of Municipal Affairs and Housing 16.06.2016 15:10
2015-V01
FIR2015: Brantford C Schedule 26Asmt Code: 2906 TAXATION and PAYMENTS-IN-LIEU SUMMARY
MAH Code: 40101 for the year ended December 31, 2015
3. Payments-In-Lieu of Taxation: Distribution of Entitlements
PILS LeviedTOTAL PILS
Levied
Adjustment to
PILS Levied
TOTAL PIL
EntitlementDistrib. of PIL Entitlement in Col. 7 Distribution of Education PILS in column 10 by School Board
Source of PILS LT / ST UT Education LT / ST UT EducationEnglish -
PublicFrench - Public
English -
Separate
French -
SeparateOther
3 4 5 2 6 7 8 9 10 11 12 13 14 15
$ $ $ $ $ $ $ $ $ $ $ $ $ $
5010 Canada . . . . . . . . . . . . . . . . . . . . . . . . . . . . . . . . . . . . . . . . . . . . . . 105,081 66,781 171,862 171,862 171,862
5020 Canada Enterprises . . . . . . . . . . . . . . . . . . . . . . . . . . . . . . . . . . . . . . . . . . . . . . 0 0
Ontario
Municipal Tax Assist. Act
5210 Prev. Exempt Properties . . . . . . . . . . . . . . . . . . . . . . . . . . . . . . . . . . . . . . . . . . . . . . 0 0
5220 Other Mun. Tax Asst. Act . . . . . . . . . . . . . . . . . . . . . . . . . . . . . . . . . . . . . . . . . . . . . . 65,813 65,813 65,813 65,813
5230 Inst. Payments - Heads and Beds . . . . . . . . . . . . . . . . . . . . . . . . . . . . . . . . . . . . . . . . . . . . . . 264,900 0 0 264,900 264,900 264,900
5232 Railway Rights-of-way . . . . . . . . . . . . . . . . . . . . . . . . . . . . . . . . . . . . . . . . . . . . . . 0 0 0 0 0
5234 Utility Corridors/Transmission . . . . . . . . . . . . . . . . . . . . . . . . . . . . . . . . . . . . . . . . . . . . . . 0 0 0 0 0
5236 Hydro-Electric Power Dams . . . . . . . . . . . . . . . . . . . . . . . . . . . . . . . . . . . . . . . . . . . . . . 808 0 0 808 808 808
5240 Other . . . . . . . . . . . . . . . . . . . . . . . . . . . . . . . . . . . . . . . . . . . . . . 0 0
Ontario Enterprises
5410 Ontario Mortgage and Housing Corporation. . . . . . . . . . . . . . . . . . . . . . . . . . . . . . . . . . . . . . . . . . . . . . . 0 0
5430 Liquor Control Board of Ont. . . . . . . . . . . . . . . . . . . . . . . . . . . . . . . . . . . . . . . . . . . . . . . 0 0
5432 Railway Rights-of-way . . . . . . . . . . . . . . . . . . . . . . . . . . . . . . . . . . . . . . . . . . . . . . 0 0 0 0 0
5434 Utility Corridors/Transmission . . . . . . . . . . . . . . . . . . . . . . . . . . . . . . . . . . . . . . . . . . . . . . 0 0 0 0 0
5437 Ontario Lottery and Gaming Corp. . . . . . . . . . . . . . . . . . . . . . . . . . . . . . . . . . . . . . . . . . . . . . . 2,830,364 2,830,364 2,830,364 2,830,364
5460 Other . . . . . . . . . . . . . . . . . . . . . . . . . . . . . . . . . . . . . . . . . . . . . . 0 0
5610 Municipal Enterprises . . . . . . . . . . . . . . . . . . . . . . . . . . . . . . . . . . . . . . . . . . . . . . 610,737 388,029 998,766 998,766 998,766
5910 Other Muns and Enterprises . . . . . . . . . . . . . . . . . . . . . . . . . . . . . . . . . . . . . . . . . . . . . . 0 0
5950 Amounts Added to PIL . . . . . . . . . . . . . . . . . . . . . . . . . . . . . . . . . . . . . . . . . . . . . . 0 0 0 0 0
9599 TOTAL 3,877,703 0 454,810 4,332,513 0 4,332,513 4,332,513 0 0 0 0 0 0 0
Page 159

2015 Financial Information Return - Schedule 40 - Consolidated Statement of Operations: ExpensesProvince of Ontario - Ministry of Municipal Affairs and Housing 16.06.2016 15:102015-V01
FIR2015: Brantford C Schedule 40Asmt Code: 2906 CONSOLIDATED STATEMENT OF OPERATIONS: EXPENSESMAH Code: 40101 for the year ended December 31, 2015
Salaries, Wages and
Employee Benefits
Interest on
Long Term Debt Materials
Contracted
Services
Rents and Financial
Expenses
External
TransfersAmortization
Total Expenses
Before Adjustments
Inter-Functional
Adjustments
Allocation of
Program Support *
Total Expenses
After Adjustments
1 2 3 4 5 6 16 7 12 13 11
$ $ $ $ $ $ $ $ $ $ $
General government
0240 Governance . . . . . . . . . . . . . . . . . . . . . . . . . . . . . . . . . . . . . . . . . . . . . . . . . . . . . . . . . . . . . . . . . . . . . . . . . . . . . . . . . . . . . . . . . . . . . . . . . . 617,090 0 146,544 1,791 6,606 75,310 0 847,341 -153,593 55,660 749,408
0250 Corporate Management . . . . . . . . . . . . . . . . . . . . . . . . . . . . . . . . . . . . . . . . . . . . . . . . . . . . . . . . . . . . . . . . . . . . . . . . . . . . . . . . . . . . . . . . . . . . . . . . . . 6,155,797 0 867,603 1,623,168 10,970 1,300,876 1,547,583 11,505,997 -2,138,612 586,712 9,954,097
0260 Program Support . . . . . . . . . . . . . . . . . . . . . . . . . . . . . . . . . . . . . . . . . . . . . . . . . . . . . . . . . . . . . . . . . . . . . . . . . . . . . . . . . . . . . . . . . . . . . . . . . . 8,199,971 0 5,975,809 244,674 1,190,834 0 0 15,611,288 -3,635,364 -11,975,924 0
0299 Subtotal 14,972,858 0 6,989,956 1,869,633 1,208,410 1,376,186 1,547,583 27,964,626 -5,927,569 -11,333,552 10,703,505
Protection services
0410 Fire . . . . . . . . . . . . . . . . . . . . . . . . . . . . . . . . . . . . . . . . . . . . . . . . . . . . . . . . . . . . . . . . . . . . . . . . . . . . . . . . . . . . . . . . . . . . . . . . . . 15,984,112 0 669,285 1,561 16,744 0 685,334 17,357,036 212,213 1,519,573 19,088,822
0420 Police . . . . . . . . . . . . . . . . . . . . . . . . . . . . . . . . . . . . . . . . . . . . . . . . . . . . . . . . . . . . . . . . . . . . . . . . . . . . . . . . . . . . . . . . . . . . . . . . . . 26,754,587 0 1,873,427 727,602 304,661 19,666 607,525 30,287,468 179,034 2,685,572 33,152,074
0421 Court Security . . . . . . . . . . . . . . . . . . . . . . . . . . . . . . . . . . . . . . . . . . . . . . . . . . . . . . . . . . . . . . . . . . . . . . . . . . . . . . . . . . . . . . . . . . . . . . . . . . 1,496,282 0 145,549 0 13,066 0 0 1,654,897 -50,578 144,391 1,748,710
0422 Prisoner Transportation . . . . . . . . . . . . . . . . . . . . . . . . . . . . . . . . . . . . . . . . . . . . . . . . . . . . . . . . . . . . . . . . . . . . . . . . . . . . . . . . . . . . . . . . . . . . . . . . . . 149,282 0 12,371 0 0 0 14,204 175,857 4,056 14,914 194,827
0430 Conservation authority . . . . . . . . . . . . . . . . . . . . . . . . . . . . . . . . . . . . . . . . . . . . . . . . . . . . . . . . . . . . . . . . . . . . . . . . . . . . . . . . . . . . . . . . . . . . . . . . . . 0 0 0 0 0 0 0 0 0 0 0
0440 Protective inspection and control . . . . . . . . . . . . . . . . . . . . . . . . . . . . . . . . . . . . . . . . . . . . . . . . . . . . . . . . . . . . . . . . . . . . . . . . . . . . . . . . . . . . . . . . . . . . . . . . . . 703,507 0 144,893 447,460 416 0 14,299 1,310,575 37,499 120,041 1,468,115
0445 Building permit and inspection services . . . . . . . . . . . . . . . . . . . . . . . . . . . . . . . . . . . . . . . . . . . . . . . . . . . . . . . . . . . . . . . . . . . . . . . . . . . . . . . . . . . . . . . . . . . . . . . . . . 1,192,782 0 60,337 929 1,567 0 0 1,255,615 157,572 0 1,413,187
0450 Emergency measures . . . . . . . . . . . . . . . . . . . . . . . . . . . . . . . . . . . . . . . . . . . . . . . . . . . . . . . . . . . . . . . . . . . . . . . . . . . . . . . . . . . . . . . . . . . . . . . . . . 68,038 0 13,876 0 0 39,752 0 121,666 4,062 7,738 133,466
0460 Provincial Offences Act (POA) . . . . . . . . . . . . . . . . . . . . . . . . . . . . . . . . . . . . . . . . . . . . . . . . . . . . . . . . . . . . . . . . . . . . . . . . . . . . . . . . . . . . . . . . . . . . . . . . . . 522,204 0 164,906 0 24,684 240,139 0 951,933 276,731 0 1,228,664
0498 Other 0 0 0 0 0 0 0 0 0 0 0
0499 Subtotal 46,870,794 0 3,084,644 1,177,552 361,138 299,557 1,321,362 53,115,047 820,589 4,492,229 58,427,865
Transportation services
0611 Roads - Paved . . . . . . . . . . . . . . . . . . . . . . . . . . . . . . . . . . . . . . . . . . . . . . . . . . . . . . . . . . . . . . . . . . . . . . . . . . . . . . . . . . . . . . . . . . . . . . . . . . 3,537,317 0 465,429 333,982 9,207 0 4,028,341 8,374,276 -965,794 304,217 7,712,699
0612 Roads - Unpaved . . . . . . . . . . . . . . . . . . . . . . . . . . . . . . . . . . . . . . . . . . . . . . . . . . . . . . . . . . . . . . . . . . . . . . . . . . . . . . . . . . . . . . . . . . . . . . . . . . 0 0 0 0 0 0 0 0 0 0 0
0613 Roads - Bridges and Culverts . . . . . . . . . . . . . . . . . . . . . . . . . . . . . . . . . . . . . . . . . . . . . . . . . . . . . . . . . . . . . . . . . . . . . . . . . . . . . . . . . . . . . . . . . . . . . . . . . . 549 0 1,002 114,028 0 0 457,741 573,320 1,403 10,529 585,252
0614 Roads - Traffic Operations & Roadside . . . . . . . . . . . . . . . . . . . . . . . . . . . . . . . . . . . . . . . . . . . . . . . . . . . . . . . . . . . . . . . . . . . . . . . . . . . . . . . . . . . . . . . . . . . . . . . . . . 2,874,984 3,935 1,186,988 85,823 8,020 0 1,476,613 5,636,363 353,274 405,824 6,395,461
0621 Winter Control - Except sidewalks, Parking Lots . . . . . . . . . . . . . . . . . . . . . . . . . . . . . . . . . . . . . . . . . . . . . . . . . . . . . . . . . . . . . . . . . . . . . . . . . . . . . . . . . . . . . . . . . . . . . . . . . . 862,403 0 771,486 257,952 1,013 0 29,907 1,922,761 698,259 233,203 2,854,223
0622 Winter Control - Sidewalks, Parking Lots Only . . . . . . . . . . . . . . . . . . . . . . . . . . . . . . . . . . . . . . . . . . . . . . . . . . . . . . . . . . . . . . . . . . . . . . . . . . . . . . . . . . . . . . . . . . . . . . . . . . 141,335 0 32,885 1,526 108 0 55,327 231,181 163,512 30,543 425,236
0631 Transit - Conventional . . . . . . . . . . . . . . . . . . . . . . . . . . . . . . . . . . . . . . . . . . . . . . . . . . . . . . . . . . . . . . . . . . . . . . . . . . . . . . . . . . . . . . . . . . . . . . . . . . 6,547,150 0 4,786,297 50,064 211,323 0 1,561,536 13,156,370 -2,574,214 186,008 10,768,164
0632 Transit - Disabled & special needs . . . . . . . . . . . . . . . . . . . . . . . . . . . . . . . . . . . . . . . . . . . . . . . . . . . . . . . . . . . . . . . . . . . . . . . . . . . . . . . . . . . . . . . . . . . . . . . . . . 1,201,670 0 29,649 145 1,984 0 137,754 1,371,202 590,991 164,202 2,126,395
0640 Parking . . . . . . . . . . . . . . . . . . . . . . . . . . . . . . . . . . . . . . . . . . . . . . . . . . . . . . . . . . . . . . . . . . . . . . . . . . . . . . . . . . . . . . . . . . . . . . . . . . 177,582 0 956,913 1,608 1,233 0 374,967 1,512,303 -135,973 90,124 1,466,454
0650 Street lighting . . . . . . . . . . . . . . . . . . . . . . . . . . . . . . . . . . . . . . . . . . . . . . . . . . . . . . . . . . . . . . . . . . . . . . . . . . . . . . . . . . . . . . . . . . . . . . . . . . 52,850 0 1,245,267 96,952 0 0 757,394 2,152,463 163 125,573 2,278,199
0660 Air transportation . . . . . . . . . . . . . . . . . . . . . . . . . . . . . . . . . . . . . . . . . . . . . . . . . . . . . . . . . . . . . . . . . . . . . . . . . . . . . . . . . . . . . . . . . . . . . . . . . . 0 12,633 488,447 34,229 2,168 0 231,600 769,077 -23,532 45,119 790,664
0698 Other 0 0 0 0 0 0 0 0 0 0 0
0699 Subtotal 15,395,840 16,568 9,964,363 976,309 235,056 0 9,111,180 35,699,316 -1,891,911 1,595,342 35,402,747
Environmental services
0811 Wastewater collection/conveyance. . . . . . . . . . . . . . . . . . . . . . . . . . . . . . . . . . . . . . . . . . . . . . . . . . . . . . . . . . . . . . . . . . . . . . . . . . . . . . . . . . . . . . . . . . . . . . . . . . 723,686 0 745,997 441,750 0 0 2,322,328 4,233,761 366,371 0 4,600,132
0812 Wastewater treatment & disposal . . . . . . . . . . . . . . . . . . . . . . . . . . . . . . . . . . . . . . . . . . . . . . . . . . . . . . . . . . . . . . . . . . . . . . . . . . . . . . . . . . . . . . . . . . . . . . . . . . 857,356 0 524,976 3,622,615 33,959 0 1,832,658 6,871,564 586,708 0 7,458,272
0821 Urban storm sewer system . . . . . . . . . . . . . . . . . . . . . . . . . . . . . . . . . . . . . . . . . . . . . . . . . . . . . . . . . . . . . . . . . . . . . . . . . . . . . . . . . . . . . . . . . . . . . . . . . . 223,631 3,591 268,802 56,513 5,850 0 2,784,762 3,343,149 246,680 72,134 3,661,963
0822 Rural storm sewer system . . . . . . . . . . . . . . . . . . . . . . . . . . . . . . . . . . . . . . . . . . . . . . . . . . . . . . . . . . . . . . . . . . . . . . . . . . . . . . . . . . . . . . . . . . . . . . . . . . 0 0 0 0 0 0 0 0 0 0 0
0831 Water treatment . . . . . . . . . . . . . . . . . . . . . . . . . . . . . . . . . . . . . . . . . . . . . . . . . . . . . . . . . . . . . . . . . . . . . . . . . . . . . . . . . . . . . . . . . . . . . . . . . . 2,306,699 1,171,755 3,220,639 448,708 43,091 681,003 2,850,287 10,722,182 2,590,258 0 13,312,440
0832 Water distribution/transmission . . . . . . . . . . . . . . . . . . . . . . . . . . . . . . . . . . . . . . . . . . . . . . . . . . . . . . . . . . . . . . . . . . . . . . . . . . . . . . . . . . . . . . . . . . . . . . . . . . 2,389,760 0 509,725 90,495 5,633 407,144 2,438,642 5,841,399 334,719 0 6,176,118
0840 Solid waste collection . . . . . . . . . . . . . . . . . . . . . . . . . . . . . . . . . . . . . . . . . . . . . . . . . . . . . . . . . . . . . . . . . . . . . . . . . . . . . . . . . . . . . . . . . . . . . . . . . . 0 0 0 1,545,148 0 0 0 1,545,148 0 139,065 1,684,213
0850 Solid waste disposal . . . . . . . . . . . . . . . . . . . . . . . . . . . . . . . . . . . . . . . . . . . . . . . . . . . . . . . . . . . . . . . . . . . . . . . . . . . . . . . . . . . . . . . . . . . . . . . . . . 493,644 0 4,244,145 1,646,543 15,081 0 1,088,628 7,488,041 406,047 612,500 8,506,588
0860 Waste diversion . . . . . . . . . . . . . . . . . . . . . . . . . . . . . . . . . . . . . . . . . . . . . . . . . . . . . . . . . . . . . . . . . . . . . . . . . . . . . . . . . . . . . . . . . . . . . . . . . . 115,378 0 246,864 2,746,555 0 0 0 3,108,797 3,023 280,068 3,391,888
0898 Other 0 0 0 0 0 0 0 0 0 0 0
0899 Subtotal 7,110,154 1,175,346 9,761,148 10,598,327 103,614 1,088,147 13,317,305 43,154,041 4,533,806 1,103,767 48,791,614
Health services
1010 Public health services . . . . . . . . . . . . . . . . . . . . . . . . . . . . . . . . . . . . . . . . . . . . . . . . . . . . . . . . . . . . . . . . . . . . . . . . . . . . . . . . . . . . . . . . . . . . . . . . . . 0 0 0 0 0 2,622,168 0 2,622,168 0 0 2,622,168
1020 Hospitals . . . . . . . . . . . . . . . . . . . . . . . . . . . . . . . . . . . . . . . . . . . . . . . . . . . . . . . . . . . . . . . . . . . . . . . . . . . . . . . . . . . . . . . . . . . . . . . . . . 0 0 0 0 0 0 0 0 0 0 0
1030 Ambulance services . . . . . . . . . . . . . . . . . . . . . . . . . . . . . . . . . . . . . . . . . . . . . . . . . . . . . . . . . . . . . . . . . . . . . . . . . . . . . . . . . . . . . . . . . . . . . . . . . . 0 0 0 3,249,078 0 0 0 3,249,078 0 292,421 3,541,499
1035 Ambulance dispatch . . . . . . . . . . . . . . . . . . . . . . . . . . . . . . . . . . . . . . . . . . . . . . . . . . . . . . . . . . . . . . . . . . . . . . . . . . . . . . . . . . . . . . . . . . . . . . . . . . 0 0 0 0 0 0 0 0 0 0 0
1040 Cemeteries . . . . . . . . . . . . . . . . . . . . . . . . . . . . . . . . . . . . . . . . . . . . . . . . . . . . . . . . . . . . . . . . . . . . . . . . . . . . . . . . . . . . . . . . . . . . . . . . . . 398,746 0 79,283 0 6,064 0 36,473 520,566 106,971 53,197 680,734
1098 Other 0 0 0 0 0 0 0 0 0 0 0
1099 Subtotal 398,746 0 79,283 3,249,078 6,064 2,622,168 36,473 6,391,812 106,971 345,618 6,844,401
Social and family services
1210 General assistance . . . . . . . . . . . . . . . . . . . . . . . . . . . . . . . . . . . . . . . . . . . . . . . . . . . . . . . . . . . . . . . . . . . . . . . . . . . . . . . . . . . . . . . . . . . . . . . . . . 7,879,249 0 458,210 1,809,683 36,616 19,786,482 44,238 30,014,478 981,462 1,004,884 32,000,824
1220 Assistance to aged persons . . . . . . . . . . . . . . . . . . . . . . . . . . . . . . . . . . . . . . . . . . . . . . . . . . . . . . . . . . . . . . . . . . . . . . . . . . . . . . . . . . . . . . . . . . . . . . . . . . 11,149,873 40,494 2,081,289 271,170 -851 313,151 1,514,402 15,369,528 0 229 15,369,757
1230 Child care . . . . . . . . . . . . . . . . . . . . . . . . . . . . . . . . . . . . . . . . . . . . . . . . . . . . . . . . . . . . . . . . . . . . . . . . . . . . . . . . . . . . . . . . . . . . . . . . . . 1,127,178 0 162,126 4,343,359 3,167 4,910,349 12,992 10,559,171 33,543 510,251 11,102,965
1298 Other Social & Family Support Programs 82,719 0 27,568 7,920 0 51,054 0 169,261 39,754 14,217 223,232
1299 Subtotal 20,239,019 40,494 2,729,193 6,432,132 38,932 25,061,036 1,571,632 56,112,438 1,054,759 1,529,581 58,696,778
Page 160

2015 Financial Information Return - Schedule 40 - Consolidated Statement of Operations: ExpensesProvince of Ontario - Ministry of Municipal Affairs and Housing 16.06.2016 15:102015-V01
FIR2015: Brantford C Schedule 40Asmt Code: 2906 CONSOLIDATED STATEMENT OF OPERATIONS: EXPENSESMAH Code: 40101 for the year ended December 31, 2015
Salaries, Wages and
Employee Benefits
Interest on
Long Term Debt Materials
Contracted
Services
Rents and Financial
Expenses
External
TransfersAmortization
Total Expenses
Before Adjustments
Inter-Functional
Adjustments
Allocation of
Program Support *
Total Expenses
After Adjustments
1 2 3 4 5 6 16 7 12 13 11
$ $ $ $ $ $ $ $ $ $ $
Social Housing
1410 Public Housing . . . . . . . . . . . . . . . . . . . . . . . . . . . . . . . . . . . . . . . . . . . . . . . . . . . . . . . . . . . . . . . . . . . . . . . . . . . . . . . . . . . . . . . . . . . . . . . . . . 983,260 0 5,352,120 23,782 98,402 0 1,516,432 7,973,996 72,249 0 8,046,245
1420 Non-Profit/Cooperative Housing . . . . . . . . . . . . . . . . . . . . . . . . . . . . . . . . . . . . . . . . . . . . . . . . . . . . . . . . . . . . . . . . . . . . . . . . . . . . . . . . . . . . . . . . . . . . . . . . . . 279,167 59,130 483,312 4,608 6,786 6,844,046 225,975 7,903,024 245,948 0 8,148,972
1430 Rent Supplement Programs . . . . . . . . . . . . . . . . . . . . . . . . . . . . . . . . . . . . . . . . . . . . . . . . . . . . . . . . . . . . . . . . . . . . . . . . . . . . . . . . . . . . . . . . . . . . . . . . . . 58,317 0 3,507 32 84 2,011,151 0 2,073,091 86,464 0 2,159,555
1497 Other Affordable Housing 255,136 101,136 314,230 141 35,430 667,065 52,374 1,425,512 293,915 0 1,719,427
1498 Other 0 0 0 0 0 0 0 0 0 0 0
1499 Subtotal 1,575,880 160,266 6,153,169 28,563 140,702 9,522,262 1,794,781 19,375,623 698,576 0 20,074,199
Recreation and cultural services
1610 Parks . . . . . . . . . . . . . . . . . . . . . . . . . . . . . . . . . . . . . . . . . . . . . . . . . . . . . . . . . . . . . . . . . . . . . . . . . . . . . . . . . . . . . . . . . . . . . . . . . . 3,454,883 0 1,467,825 398,509 56,525 87,568 765,881 6,231,191 329,807 513,687 7,074,685
1620 Recreation programs . . . . . . . . . . . . . . . . . . . . . . . . . . . . . . . . . . . . . . . . . . . . . . . . . . . . . . . . . . . . . . . . . . . . . . . . . . . . . . . . . . . . . . . . . . . . . . . . . . 4,757,937 0 841,765 63,468 104,463 111,226 0 5,878,859 37,573 522,476 6,438,908
1631 Rec. Fac. - Golf Crs, Marina, Ski Hill . . . . . . . . . . . . . . . . . . . . . . . . . . . . . . . . . . . . . . . . . . . . . . . . . . . . . . . . . . . . . . . . . . . . . . . . . . . . . . . . . . . . . . . . . . . . . . . . . . 818,621 0 600,669 32,601 125,008 1,000 173,542 1,751,441 125,939 153,258 2,030,638
1634 Rec. Fac. - All Other . . . . . . . . . . . . . . . . . . . . . . . . . . . . . . . . . . . . . . . . . . . . . . . . . . . . . . . . . . . . . . . . . . . . . . . . . . . . . . . . . . . . . . . . . . . . . . . . . . 1,656,851 63,874 2,994,981 16,990 49,264 43,785 3,160,511 7,986,256 73,107 431,214 8,490,577
1640 Libraries . . . . . . . . . . . . . . . . . . . . . . . . . . . . . . . . . . . . . . . . . . . . . . . . . . . . . . . . . . . . . . . . . . . . . . . . . . . . . . . . . . . . . . . . . . . . . . . . . . 3,045,047 0 609,273 0 0 -5,081 1,037,983 4,687,222 0 0 4,687,222
1645 Museums . . . . . . . . . . . . . . . . . . . . . . . . . . . . . . . . . . . . . . . . . . . . . . . . . . . . . . . . . . . . . . . . . . . . . . . . . . . . . . . . . . . . . . . . . . . . . . . . . . 238,796 0 58,027 0 1,334 0 32,484 330,641 -863 26,757 356,535
1650 Cultural services . . . . . . . . . . . . . . . . . . . . . . . . . . . . . . . . . . . . . . . . . . . . . . . . . . . . . . . . . . . . . . . . . . . . . . . . . . . . . . . . . . . . . . . . . . . . . . . . . . 1,285,890 0 929,988 36,340 49,869 170,248 251,361 2,723,696 -5,651 206,682 2,924,727
1698 Other 0 0 0 0 0 0 0 0 0 0 0
1699 Subtotal 15,258,025 63,874 7,502,528 547,908 386,463 408,746 5,421,762 29,589,306 559,912 1,854,074 32,003,292
Planning and development
1810 Planning and zoning . . . . . . . . . . . . . . . . . . . . . . . . . . . . . . . . . . . . . . . . . . . . . . . . . . . . . . . . . . . . . . . . . . . . . . . . . . . . . . . . . . . . . . . . . . . . . . . . . . 1,698,867 0 51,726 19,641 6,114 197,853 0 1,974,201 14,966 161,221 2,150,388
1820 Commercial and Industrial . . . . . . . . . . . . . . . . . . . . . . . . . . . . . . . . . . . . . . . . . . . . . . . . . . . . . . . . . . . . . . . . . . . . . . . . . . . . . . . . . . . . . . . . . . . . . . . . . . 1,420,390 78,597 480,557 130,207 15,282 35,688 126,749 2,287,470 30,410 171,440 2,489,320
1830 Residential development . . . . . . . . . . . . . . . . . . . . . . . . . . . . . . . . . . . . . . . . . . . . . . . . . . . . . . . . . . . . . . . . . . . . . . . . . . . . . . . . . . . . . . . . . . . . . . . . . . 332,612 0 542,365 6,167 11,351 0 0 892,495 -509 80,280 972,266
1840 Agriculture and reforestation . . . . . . . . . . . . . . . . . . . . . . . . . . . . . . . . . . . . . . . . . . . . . . . . . . . . . . . . . . . . . . . . . . . . . . . . . . . . . . . . . . . . . . . . . . . . . . . . . . 0 0 0 0 0 0 0 0 0 0 0
1850 Tile drainage/shoreline assistance . . . . . . . . . . . . . . . . . . . . . . . . . . . . . . . . . . . . . . . . . . . . . . . . . . . . . . . . . . . . . . . . . . . . . . . . . . . . . . . . . . . . . . . . . . . . . . . . . . 0 0 0
1898 Other 0 0 0 0 0 0 0 0 0 0 0
1899 Subtotal 3,451,869 78,597 1,074,648 156,015 32,747 233,541 126,749 5,154,166 44,867 412,941 5,611,974
1910 Other 0 0
9910 TOTAL 125,273,185 1,535,145 47,338,932 25,035,517 2,513,126 40,611,643 34,248,827 276,556,375 0 0 276,556,375
Page 161
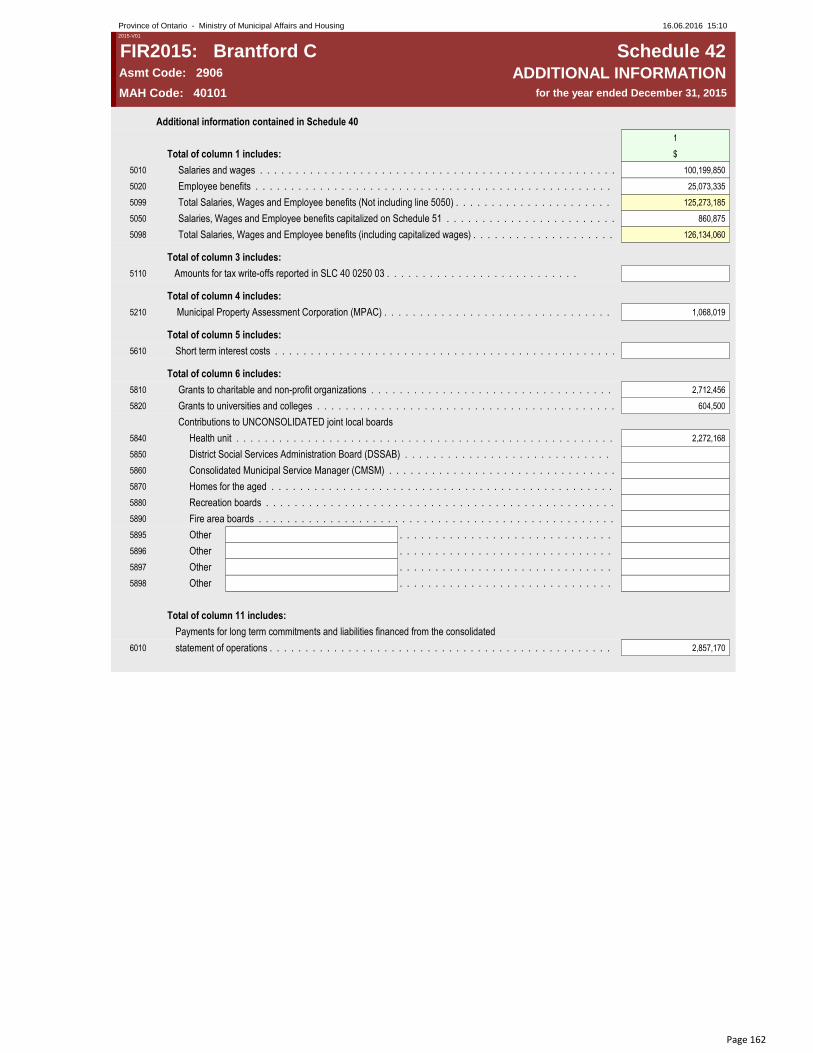
2015 Financial Information Return - Schedule 42 - Additional Information Contained in Schedule 40Province of Ontario - Ministry of Municipal Affairs and Housing 16.06.2016 15:102015-V01
FIR2015: Brantford C Schedule 42Asmt Code: 2906 ADDITIONAL INFORMATIONMAH Code: 40101 for the year ended December 31, 2015
Additional information contained in Schedule 40
1
Total of column 1 includes: $
5010 Salaries and wages . . . . . . . . . . . . . . . . . . . . . . . . . . . . . . . . . . . . . . . . . . . . . . . . . . . . . . . . . . . . . . . . . . . . . . . . . . . . . . . . . . . . . . . . . . . . . . . . . . . . . . . . . . . . . . . . .100,199,850
5020 Employee benefits . . . . . . . . . . . . . . . . . . . . . . . . . . . . . . . . . . . . . . . . . . . . . . . . . . . . . . . . . . . . . . . . . . . . . . . . . . . . . . . . . . . . . . . . . . . . . . . . . . . . . . . . . . . . . . . . . . . . . . . . . . . . . . . . . . . . . . . . . . . . . . . . . . . . . . . . . . . . . . . . . . . . . . . . . . . . . . . . . . .25,073,335
5099 Total Salaries, Wages and Employee benefits (Not including line 5050) . . . . . . . . . . . . . . . . . . . . . . . . . . . . . . . . . . . . . . . . . . . . . . . . . . . . . . . . . . . . . . . . . . . . . . . . . . . . . . . . . . . . . . . . . . . . . . . . . . . . . . . . . . . . . . . . . . . . . . . . . . . . . . . . . . . . . . . . . . . . . . . . . . . . . . . . . . . . . . . . . . . . . . . . . . . . . . . . . . .125,273,185
5050 Salaries, Wages and Employee benefits capitalized on Schedule 51 . . . . . . . . . . . . . . . . . . . . . . . . . . . . . . . . . . . . . . . . . . . . . . . . . . . . . . . . . . . . . . . . . . . . . . . . . . . . . . . . . . . . . . . . . . . . . . . . . . . . . . . . . . . . . . . . . . . . . . . . . . . . . . . . . . . . . . . . . . . . . . . . . . . . . . . . . . . . . . . . . . . . . . . . . . . . . . . . . . .860,875
5098 Total Salaries, Wages and Employee benefits (including capitalized wages) . . . . . . . . . . . . . . . . . . . . . . . . . . . . . . . . . . . . . . . . . . . . . . . . . . . . . . . . . . . . . . . . . . . . . . . . . . . . . . . . . . . . . . . . . . . . . . . . . . . . . . . . . . . . . . . . . . . . . . . . . . . . . . . . . . . . . . . . . . . . . . . . . . . . . . . . . . . . . . . . . . . . . . . . . . . . . . . . . . .126,134,060
Total of column 3 includes:
5110 Amounts for tax write-offs reported in SLC 40 0250 03 . . . . . . . . . . . . . . . . . . . . . . . . . . .
Total of column 4 includes:
5210 Municipal Property Assessment Corporation (MPAC) . . . . . . . . . . . . . . . . . . . . . . . . . . . . . . . . . . . . . . . . . . . . . . . . . . . . . . . . . . . . . . . . . . . . . . . . . . . . . . . . . . . . . . . . . . . . . . . . . . . . . . . . . . . . . . . . . . . . . . . . . . . . . . . . . . . . . . . . . . . . . . . . . . . . . . . . . . . . . . . . . . . . . . . . . . . . . . . . . . . 1,068,019
Total of column 5 includes:
5610 Short term interest costs . . . . . . . . . . . . . . . . . . . . . . . . . . . . . . . . . . . . . . . . . . . . . . . . . . . . . . . . . . . . . . . . . . . . . . . . . . . . . . . . . . . . . . . . . . . . . . . . . . . . . . . . . . . . . . . . . . . . . . . . . . . . . . . . . . . . . . . . . . . . . . . . . . . . . . . . . . . . . . . . . . . . . . . . . . . . . . . . . . .
Total of column 6 includes:
5810 Grants to charitable and non-profit organizations . . . . . . . . . . . . . . . . . . . . . . . . . . . . . . . . . . . . . . . . . . . . . . . . . . . . . . . . . . . . . . . . . . . . . . . . . . . . . . . . . . . . . . . . . . . . . . . . . . . . . . . . . . . . . . . . . . . . . . . . . . . . . . . . . . . . . . . . . . . . . . . . . . . . . . . . . . . . . . . . . . . . . . . . . . . . . . . . . . . 2,712,456
5820 Grants to universities and colleges . . . . . . . . . . . . . . . . . . . . . . . . . . . . . . . . . . . . . . . . . . . . . . . . . . . . . . . . . . . . . . . . . . . . . . . . . . . . . . . . . . . . . . . . . . . . . . . . . . . . . . . . . . . . . . . . . . . . . . . . . . . . . . . . . . . . . . . . . . . . . . . . . . . . . . . . . . . . . . . . . . . . . . . . . . . . . . . . . . . 604,500
Contributions to UNCONSOLIDATED joint local boards
5840 Health unit . . . . . . . . . . . . . . . . . . . . . . . . . . . . . . . . . . . . . . . . . . . . . . . . . . . . . . . . . . . . . . . . . . . . . . . . . . . . . . . . . . . . . . . . . . . . . . . . . . . . . . . . . . . . . . . . . . . . . . . . . . . . . . . . . . . . . . . . . . . . . . . . . . . . . . . . . . . . . . . . . . . . . . . . . . . . . . . . . . . 2,272,168
5850 District Social Services Administration Board (DSSAB) . . . . . . . . . . . . . . . . . . . . . . . . . . . . . . . . . . . . . . . . . . . . . . . . . . . . . . . . . . . . . . . . . . . . . . . . . . . . . . . . . . . . . . . . . . . . . . . . . . . . . . . . . . . . . . . . . . . . . . . . . . . . . . . . . . . . . . . . . . . . . . . . . . . . . . . . . . . . . . . . . . . . . . . . . . . . . . . . . . .
5860 Consolidated Municipal Service Manager (CMSM) . . . . . . . . . . . . . . . . . . . . . . . . . . . . . . . . . . . . . . . . . . . . . . . . . . . . . . . . . . . . . . . . . . . . . . . . . . . . . . . . . . . . . . . . . . . . . . . . . . . . . . . . . . . . . . . . . . . . . . . . . . . . . . . . . . . . . . . . . . . . . . . . . . . . . . . . . . . . . . . . . . . . . . . . . . . . . . . . . . .
5870 Homes for the aged . . . . . . . . . . . . . . . . . . . . . . . . . . . . . . . . . . . . . . . . . . . . . . . . . . . . . . . . . . . . . . . . . . . . . . . . . . . . . . . . . . . . . . . . . . . . . . . . . . . . . . . . . . . . . . . . . . . . . . . . . . . . . . . . . . . . . . . . . . . . . . . . . . . . . . . . . . . . . . . . . . . . . . . . . . . . . . . . . . .
5880 Recreation boards . . . . . . . . . . . . . . . . . . . . . . . . . . . . . . . . . . . . . . . . . . . . . . . . . . . . . . . . . . . . . . . . . . . . . . . . . . . . . . . . . . . . . . . . . . . . . . . . . . . . . . . . . . . . . . . . . . . . . . . . . . . . . . . . . . . . . . . . . . . . . . . . . . . . . . . . . . . . . . . . . . . . . . . . . . . . . . . . . . .
5890 Fire area boards . . . . . . . . . . . . . . . . . . . . . . . . . . . . . . . . . . . . . . . . . . . . . . . . . . . . . . . . . . . . . . . . . . . . . . . . . . . . . . . . . . . . . . . . . . . . . . . . . . . . . . . . . . . . . . . . . . . . . . . . . . . . . . . . . . . . . . . . . . . . . . . . . . . . . . . . . . . . . . . . . . . . . . . . . . . . . . . . . . .
5895 Other . . . . . . . . . . . . . . . . . . . . . . . . . . . . . . . . . . . . . . . . . . . . . . . . . . . . . . . . . . . . . . . . . . . . . . . . . . . . . .
5896 Other . . . . . . . . . . . . . . . . . . . . . . . . . . . . . . . . . . . . . . . . . . . . . . . . . . . . . . . . . . . . . . . . . . . . . . . . . . . . . .
5897 Other . . . . . . . . . . . . . . . . . . . . . . . . . . . . . . . . . . . . . . . . . . . . . . . . . . . . . . . . . . . . . . . . . . . . . . . . . . . . . .
5898 Other . . . . . . . . . . . . . . . . . . . . . . . . . . . . . . . . . . . . . . . . . . . . . . . . . . . . . . . . . . . . . . . . . . . . . . . . . . . . . .
Total of column 11 includes:
Payments for long term commitments and liabilities financed from the consolidated
6010 statement of operations . . . . . . . . . . . . . . . . . . . . . . . . . . . . . . . . . . . . . . . . . . . . . . . . . . . . . . . . . . . . . . . . . . 2,857,170
Page 162

2015 Financial Information Return - Schedule 51 - Schedule of Tangible Capital Assets - Analysis by Functional ClassificationProvince of Ontario - Ministry of Municipal Affairs and Housing 16.06.2016 15:10
2015-V01
FIR2015: Brantford C Schedule 51Asmt Code: 2906 SCHEDULE OF TANGIBLE CAPITAL ASSETSMAH Code: 40101 for the year ended December 31, 2015
ANALYSIS BY FUNCTIONAL CLASSIFICATION COST AMORTIZATION
2015 Opening
Net Book Value
2015 Opening
Cost Balance
Additions and
BettermentsDisposals Write Downs
2015 Closing
Cost Balance
2015 Opening
Amortization
Balance
Annual
Amortization
Amortization
Disposal
2015 Closing
Amortization
Balance
2015 Closing
Net Book Value
1 2 3 4 5 6 7 8 9 10 11
$ $ $ $ $ $ $ $ $ $ $
0299 General government. . . . . . . . . . . . . . . . . . . . . . . . . . . . . . . . . . . . . . . . . . . . . . . . . . . . . . . . . . . . . . . . . . . . . . . . . . . . . . . . . . . . . . . . . . . . . . . 6,783,560 23,449,999 2,735,515 1,644,072 0 24,541,442 16,666,439 1,547,588 1,595,935 16,618,092 7,923,350
Protection services
0410 Fire . . . . . . . . . . . . . . . . . . . . . . . . . . . . . . . . . . . . . . . . . . . . . . . . . . . . . . . . . . . . . . . . . . . . . . . . . . . . . . . . . . . . . . . . . . . . . . . . . . 8,454,605 15,636,824 325,542 425,130 15,537,236 7,182,219 685,333 377,219 7,490,333 8,046,903
0420 Police . . . . . . . . . . . . . . . . . . . . . . . . . . . . . . . . . . . . . . . . . . . . . . . . . . . . . . . . . . . . . . . . . . . . . . . . . . . . . . . . . . . . . . . . . . . . . . . . . . 9,076,867 15,987,038 635,620 75,081 16,547,577 6,910,171 607,524 64,128 7,453,567 9,094,010
0421 Court Security . . . . . . . . . . . . . . . . . . . . . . . . . . . . . . . . . . . . . . . . . . . . . . . . . . . . . . . . . . . . . . . . . . . . . . . . . . . . . . . . . . . . . . . . . . . . . . . . . . 0 0 0 0 0 0 0 0 0
0422 Prisoner Transportation . . . . . . . . . . . . . . . . . . . . . . . . . . . . . . . . . . . . . . . . . . . . . . . . . . . . . . . . . . . . . . . . . . . . . . . . . . . . . . . . . . . . . . . . . . . . . . . . . . 108,600 142,040 0 142,040 33,440 14,204 0 47,644 94,396
0430 Conservation authority . . . . . . . . . . . . . . . . . . . . . . . . . . . . . . . . . . . . . . . . . . . . . . . . . . . . . . . . . . . . . . . . . . . . . . . . . . . . . . . . . . . . . . . . . . . . . . . . . . 0 0 0 0 0 0 0 0 0
0440 Protective inspection and control . . . . . . . . . . . . . . . . . . . . . . . . . . . . . . . . . . . . . . . . . . . . . . . . . . . . . . . . . . . . . . . . . . . . . . . . . . . . . . . . . . . . . . . . . . . . . . . . . . 40,020 40,996 62,366 0 103,362 976 32,108 0 33,084 70,278
0445 Building permit and inspection services . . . . . . . . . . . . . . . . . . . . . . . . . . . . . . . . . . . . . . . . . . . . . . . . . . . . . . . . . . . . . . . . . . . . . . . . . . . . . . . . . . . . . . . . . . . . . . . . . .0 0 0 0 0 0 0 0 0
0450 Emergency measures . . . . . . . . . . . . . . . . . . . . . . . . . . . . . . . . . . . . . . . . . . . . . . . . . . . . . . . . . . . . . . . . . . . . . . . . . . . . . . . . . . . . . . . . . . . . . . . . . . 0 0 0 0 0 0 0 0 0
0460 Provincial Offences Act (POA) . . . . . . . . . . . . . . . . . . . . . . . . . . . . . . . . . . . . . . . . . . . . . . . . . . . . . . . . . . . . . . . . . . . . . . . . . . . . . . . . . . . . . . . . . . . . . . . . . . 0 0 0 0 0 0 0 0 0
0498 Other . . . . . . . . . . . . . . . . . . . 0 0 0 0 0 0 0 0 0
0499 Subtotal 17,680,092 31,806,898 1,023,528 500,211 0 32,330,215 14,126,806 1,339,169 441,347 15,024,628 17,305,587
Transportation services
0611 Roads - Paved . . . . . . . . . . . . . . . . . . . . . . . . . . . . . . . . . . . . . . . . . . . . . . . . . . . . . . . . . . . . . . . . . . . . . . . . . . . . . . . . . . . . . . . . . . . . . . . . . . 69,343,033 161,019,275 7,285,646 628,711 167,676,210 91,676,242 4,285,381 565,701 95,395,922 72,280,288
0612 Roads - Unpaved . . . . . . . . . . . . . . . . . . . . . . . . . . . . . . . . . . . . . . . . . . . . . . . . . . . . . . . . . . . . . . . . . . . . . . . . . . . . . . . . . . . . . . . . . . . . . . . . . . 0 0 0 0 0 0 0 0 0 0
0613 Roads - Bridges and Culverts . . . . . . . . . . . . . . . . . . . . . . . . . . . . . . . . . . . . . . . . . . . . . . . . . . . . . . . . . . . . . . . . . . . . . . . . . . . . . . . . . . . . . . . . . . . . . . . . . . 8,506,148 24,039,061 0 0 24,039,061 15,532,913 457,742 0 15,990,655 8,048,406
0614 Roads - Traffic Operations & Roadside . . . . . . . . . . . . . . . . . . . . . . . . . . . . . . . . . . . . . . . . . . . . . . . . . . . . . . . . . . . . . . . . . . . . . . . . . . . . . . . . . . . . . . . . . . . . . . . . . . 16,445,162 39,165,911 1,838,430 297,971 40,706,370 22,720,749 1,504,811 275,249 23,950,311 16,756,059
0621 Winter Control - Except sidewalks, Parking Lots . . . . . . . . . . . . . . . . . . . . . . . . . . . . . . . . . . . . . . . . . . . . . . . . . . . . . . . . . . . . . . . . . . . . . . . . . . . . . . . . . . . . . . . . . . . . . . . . . . 115,517 1,461,083 -296,541 0 1,164,542 1,345,566 -266,634 0 1,078,932 85,610
0622 Winter Control - Sidewalks, Parking Lots Only . . . . . . . . . . . . . . . . . . . . . . . . . . . . . . . . . . . . . . . . . . . . . . . . . . . . . . . . . . . . . . . . . . . . . . . . . . . . . . . . . . . . . . . . . . . . . . . . . . 268,708 553,264 0 0 553,264 284,556 55,326 0 339,882 213,382
0631 Transit - Conventional . . . . . . . . . . . . . . . . . . . . . . . . . . . . . . . . . . . . . . . . . . . . . . . . . . . . . . . . . . . . . . . . . . . . . . . . . . . . . . . . . . . . . . . . . . . . . . . . . . 10,866,445 22,706,493 151,203 0 22,857,696 11,840,048 1,543,728 0 13,383,776 9,473,920
0632 Transit - Disabled & special needs . . . . . . . . . . . . . . . . . . . . . . . . . . . . . . . . . . . . . . . . . . . . . . . . . . . . . . . . . . . . . . . . . . . . . . . . . . . . . . . . . . . . . . . . . . . . . . . . . . 878,879 994,710 374,442 4,786 1,364,366 115,831 137,753 668 252,916 1,111,450
0640 Parking . . . . . . . . . . . . . . . . . . . . . . . . . . . . . . . . . . . . . . . . . . . . . . . . . . . . . . . . . . . . . . . . . . . . . . . . . . . . . . . . . . . . . . . . . . . . . . . . . . 4,990,996 12,576,097 21,830 0 12,597,927 7,585,101 374,967 0 7,960,068 4,637,859
0650 Street lighting . . . . . . . . . . . . . . . . . . . . . . . . . . . . . . . . . . . . . . . . . . . . . . . . . . . . . . . . . . . . . . . . . . . . . . . . . . . . . . . . . . . . . . . . . . . . . . . . . . 5,435,415 13,897,713 277,267 71,269 14,103,711 8,462,298 757,394 71,269 9,148,423 4,955,288
0660 Air transportation . . . . . . . . . . . . . . . . . . . . . . . . . . . . . . . . . . . . . . . . . . . . . . . . . . . . . . . . . . . . . . . . . . . . . . . . . . . . . . . . . . . . . . . . . . . . . . . . . . 6,285,225 9,371,538 550,837 0 9,922,375 3,086,313 225,274 0 3,311,587 6,610,788
0698 Other . . . . . . . . . . . . . . . . . . . 0 0 0 0 0 0 0 0
0699 Subtotal 123,135,528 285,785,145 10,203,114 1,002,737 0 294,985,522 162,649,617 9,075,742 912,887 170,812,472 124,173,050
Environmental services
0811 Wastewater collection/conveyance. . . . . . . . . . . . . . . . . . . . . . . . . . . . . . . . . . . . . . . . . . . . . . . . . . . . . . . . . . . . . . . . . . . . . . . . . . . . . . . . . . . . . . . . . . . . . . . . . . 69,013,035 127,529,911 3,075,465 59,530 130,545,846 58,516,876 2,407,330 59,530 60,864,676 69,681,170
0812 Wastewater treatment & disposal . . . . . . . . . . . . . . . . . . . . . . . . . . . . . . . . . . . . . . . . . . . . . . . . . . . . . . . . . . . . . . . . . . . . . . . . . . . . . . . . . . . . . . . . . . . . . . . . . . 49,614,002 81,974,224 3,010,386 0 84,984,610 32,360,222 1,832,659 0 34,192,881 50,791,729
0821 Urban storm sewer system . . . . . . . . . . . . . . . . . . . . . . . . . . . . . . . . . . . . . . . . . . . . . . . . . . . . . . . . . . . . . . . . . . . . . . . . . . . . . . . . . . . . . . . . . . . . . . . . . . 89,721,594 160,666,946 2,629,347 96,309 163,199,984 70,945,352 2,784,764 75,848 73,654,268 89,545,716
0822 Rural storm sewer system . . . . . . . . . . . . . . . . . . . . . . . . . . . . . . . . . . . . . . . . . . . . . . . . . . . . . . . . . . . . . . . . . . . . . . . . . . . . . . . . . . . . . . . . . . . . . . . . . . 0 0 0 0 0 0 0 0 0 0
0831 Water treatment . . . . . . . . . . . . . . . . . . . . . . . . . . . . . . . . . . . . . . . . . . . . . . . . . . . . . . . . . . . . . . . . . . . . . . . . . . . . . . . . . . . . . . . . . . . . . . . . . . 87,176,858 110,705,301 4,307,119 0 115,012,420 23,528,443 2,919,928 0 26,448,371 88,564,049
0832 Water distribution/transmission . . . . . . . . . . . . . . . . . . . . . . . . . . . . . . . . . . . . . . . . . . . . . . . . . . . . . . . . . . . . . . . . . . . . . . . . . . . . . . . . . . . . . . . . . . . . . . . . . . 74,805,582 119,885,661 3,214,442 353,555 122,746,548 45,080,079 2,339,711 324,523 47,095,267 75,651,281
0840 Solid waste collection . . . . . . . . . . . . . . . . . . . . . . . . . . . . . . . . . . . . . . . . . . . . . . . . . . . . . . . . . . . . . . . . . . . . . . . . . . . . . . . . . . . . . . . . . . . . . . . . . . 0 0 0 0 0 0 0 0 0
0850 Solid waste disposal . . . . . . . . . . . . . . . . . . . . . . . . . . . . . . . . . . . . . . . . . . . . . . . . . . . . . . . . . . . . . . . . . . . . . . . . . . . . . . . . . . . . . . . . . . . . . . . . . . 12,204,959 23,684,092 67,028 232,097 23,519,023 11,479,133 1,092,187 219,019 12,352,301 11,166,722
0860 Waste diversion . . . . . . . . . . . . . . . . . . . . . . . . . . . . . . . . . . . . . . . . . . . . . . . . . . . . . . . . . . . . . . . . . . . . . . . . . . . . . . . . . . . . . . . . . . . . . . . . . . 0 0 0 0 0 0 0 0 0
0898 Other . . . . . . . . . . . . . . . . . . . 0 0 0 0 0 0 0 0 0
0899 Subtotal 382,536,030 624,446,135 16,303,787 741,491 0 640,008,431 241,910,105 13,376,579 678,920 254,607,764 385,400,667
Health services
1010 Public health services . . . . . . . . . . . . . . . . . . . . . . . . . . . . . . . . . . . . . . . . . . . . . . . . . . . . . . . . . . . . . . . . . . . . . . . . . . . . . . . . . . . . . . . . . . . . . . . . . . 0 0 0 0 0 0 0 0 0 0
1020 Hospitals . . . . . . . . . . . . . . . . . . . . . . . . . . . . . . . . . . . . . . . . . . . . . . . . . . . . . . . . . . . . . . . . . . . . . . . . . . . . . . . . . . . . . . . . . . . . . . . . . . 0 0 0 0 0 0 0 0 0 0
1030 Ambulance services . . . . . . . . . . . . . . . . . . . . . . . . . . . . . . . . . . . . . . . . . . . . . . . . . . . . . . . . . . . . . . . . . . . . . . . . . . . . . . . . . . . . . . . . . . . . . . . . . . 0 0 0 0 0 0 0 0 0 0
1035 Ambulance dispatch . . . . . . . . . . . . . . . . . . . . . . . . . . . . . . . . . . . . . . . . . . . . . . . . . . . . . . . . . . . . . . . . . . . . . . . . . . . . . . . . . . . . . . . . . . . . . . . . . . 0 0 0 0 0 0 0 0 0 0
1040 Cemeteries . . . . . . . . . . . . . . . . . . . . . . . . . . . . . . . . . . . . . . . . . . . . . . . . . . . . . . . . . . . . . . . . . . . . . . . . . . . . . . . . . . . . . . . . . . . . . . . . . . 373,920 1,276,509 36,623 16,280 1,296,852 902,589 -22,874 9,954 869,761 427,091
1098 Other . . . . . . . . . . . . . . . . . . . 0 0 0 0 0 0 0 0 0
1099 Subtotal 373,920 1,276,509 36,623 16,280 0 1,296,852 902,589 -22,874 9,954 869,761 427,091
Social and family services
1210 General assistance . . . . . . . . . . . . . . . . . . . . . . . . . . . . . . . . . . . . . . . . . . . . . . . . . . . . . . . . . . . . . . . . . . . . . . . . . . . . . . . . . . . . . . . . . . . . . . . . . . 207,407 902,959 1 52,254 850,706 695,552 44,239 51,325 688,466 162,240
1220 Assistance to aged persons . . . . . . . . . . . . . . . . . . . . . . . . . . . . . . . . . . . . . . . . . . . . . . . . . . . . . . . . . . . . . . . . . . . . . . . . . . . . . . . . . . . . . . . . . . . . . . . . . . 26,935,138 39,148,770 497,725 0 39,646,495 12,213,632 1,514,401 0 13,728,033 25,918,462
1230 Child care . . . . . . . . . . . . . . . . . . . . . . . . . . . . . . . . . . . . . . . . . . . . . . . . . . . . . . . . . . . . . . . . . . . . . . . . . . . . . . . . . . . . . . . . . . . . . . . . . . 42,109 398,821 0 17,947 380,874 356,712 12,992 17,947 351,757 29,117
1298 Other . . . . . . . . . . . . . . . . . . . 0 0 0 0 0 0 0 0 0 0
1299 Subtotal 27,184,654 40,450,550 497,726 70,201 0 40,878,075 13,265,896 1,571,632 69,272 14,768,256 26,109,819
Page 163

2015 Financial Information Return - Schedule 51 - Schedule of Tangible Capital Assets - Analysis by Functional ClassificationProvince of Ontario - Ministry of Municipal Affairs and Housing 16.06.2016 15:10
2015-V01
FIR2015: Brantford C Schedule 51Asmt Code: 2906 SCHEDULE OF TANGIBLE CAPITAL ASSETSMAH Code: 40101 for the year ended December 31, 2015
ANALYSIS BY FUNCTIONAL CLASSIFICATION COST AMORTIZATION
2015 Opening
Net Book Value
2015 Opening
Cost Balance
Additions and
BettermentsDisposals Write Downs
2015 Closing
Cost Balance
2015 Opening
Amortization
Balance
Annual
Amortization
Amortization
Disposal
2015 Closing
Amortization
Balance
2015 Closing
Net Book Value
1 2 3 4 5 6 7 8 9 10 11
$ $ $ $ $ $ $ $ $ $ $
Social Housing
1410 Public Housing . . . . . . . . . . . . . . . . . . . . . . . . . . . . . . . . . . . . . . . . . . . . . . . . . . . . . . . . . . . . . . . . . . . . . . . . . . . . . . . . . . . . . . . . . . . . . . . . . . 19,479,258 86,374,606 174,404 0 86,549,010 66,895,348 1,516,433 0 68,411,781 18,137,229
1420 Non-Profit/Cooperative Housing . . . . . . . . . . . . . . . . . . . . . . . . . . . . . . . . . . . . . . . . . . . . . . . . . . . . . . . . . . . . . . . . . . . . . . . . . . . . . . . . . . . . . . . . . . . . . . . . . . 4,061,934 12,504,601 0 0 12,504,601 8,442,667 280,974 0 8,723,641 3,780,960
1430 Rent Supplement Programs . . . . . . . . . . . . . . . . . . . . . . . . . . . . . . . . . . . . . . . . . . . . . . . . . . . . . . . . . . . . . . . . . . . . . . . . . . . . . . . . . . . . . . . . . . . . . . . . . . 0 0 0 0 0 0 0 0 0 0
1497 Other (Afford. Hou. 40 Queen) . . . . . . . . . . . . . . . . . . . 1,928,685 2,120,932 1,107,180 0 3,228,112 192,247 52,374 0 244,621 2,983,491
1498 Other . . . . . . . . . . . . . . . . . . . 0 0 0 0 0 0 0 0 0
1499 Subtotal 25,469,877 101,000,139 1,281,584 0 0 102,281,723 75,530,262 1,849,781 0 77,380,043 24,901,680
Recreation and cultural services
1610 Parks . . . . . . . . . . . . . . . . . . . . . . . . . . . . . . . . . . . . . . . . . . . . . . . . . . . . . . . . . . . . . . . . . . . . . . . . . . . . . . . . . . . . . . . . . . . . . . . . . . 21,895,814 33,265,018 1,330,485 86,623 34,508,880 11,369,204 780,061 64,681 12,084,584 22,424,296
1620 Recreation programs . . . . . . . . . . . . . . . . . . . . . . . . . . . . . . . . . . . . . . . . . . . . . . . . . . . . . . . . . . . . . . . . . . . . . . . . . . . . . . . . . . . . . . . . . . . . . . . . . . 0 0 0 0 0 0 0 0 0
1631 Rec. Fac. - Golf Crs, Marina, Ski Hill . . . . . . . . . . . . . . . . . . . . . . . . . . . . . . . . . . . . . . . . . . . . . . . . . . . . . . . . . . . . . . . . . . . . . . . . . . . . . . . . . . . . . . . . . . . . . . . . . . 1,586,303 3,072,823 191,964 6,503 3,258,284 1,486,520 177,063 6,503 1,657,080 1,601,204
1634 Rec. Fac. - All Other . . . . . . . . . . . . . . . . . . . . . . . . . . . . . . . . . . . . . . . . . . . . . . . . . . . . . . . . . . . . . . . . . . . . . . . . . . . . . . . . . . . . . . . . . . . . . . . . . . 74,316,298 95,216,955 922,028 170,854 95,968,129 20,900,657 3,105,510 167,611 23,838,556 72,129,573
1640 Libraries . . . . . . . . . . . . . . . . . . . . . . . . . . . . . . . . . . . . . . . . . . . . . . . . . . . . . . . . . . . . . . . . . . . . . . . . . . . . . . . . . . . . . . . . . . . . . . . . . . 6,642,376 17,242,525 710,536 652,346 17,300,715 10,600,149 1,037,983 652,346 10,985,786 6,314,929
1645 Museums . . . . . . . . . . . . . . . . . . . . . . . . . . . . . . . . . . . . . . . . . . . . . . . . . . . . . . . . . . . . . . . . . . . . . . . . . . . . . . . . . . . . . . . . . . . . . . . . . . 205,251 940,006 0 0 940,006 734,755 32,484 0 767,239 172,767
1650 Cultural services . . . . . . . . . . . . . . . . . . . . . . . . . . . . . . . . . . . . . . . . . . . . . . . . . . . . . . . . . . . . . . . . . . . . . . . . . . . . . . . . . . . . . . . . . . . . . . . . . . 3,606,132 8,812,677 0 0 8,812,677 5,206,545 251,360 0 5,457,905 3,354,772
1698 Other . . . . . . . . . . . . . . . . . . . 0 0 0 0 0 0 0 0 0 0
1699 Subtotal 108,252,174 158,550,004 3,155,013 916,326 0 160,788,691 50,297,830 5,384,461 891,141 54,791,150 105,997,541
Planning and development
1810 Planning and zoning . . . . . . . . . . . . . . . . . . . . . . . . . . . . . . . . . . . . . . . . . . . . . . . . . . . . . . . . . . . . . . . . . . . . . . . . . . . . . . . . . . . . . . . . . . . . . . . . . . 0 0 0 0 0 0 0 0 0 0
1820 Commercial and Industrial . . . . . . . . . . . . . . . . . . . . . . . . . . . . . . . . . . . . . . . . . . . . . . . . . . . . . . . . . . . . . . . . . . . . . . . . . . . . . . . . . . . . . . . . . . . . . . . . . . 2,416,941 4,057,797 0 4,057,797 1,640,856 126,749 0 1,767,605 2,290,192
1830 Residential development . . . . . . . . . . . . . . . . . . . . . . . . . . . . . . . . . . . . . . . . . . . . . . . . . . . . . . . . . . . . . . . . . . . . . . . . . . . . . . . . . . . . . . . . . . . . . . . . . . 0 0 0 0 0 0 0 0 0 0
1840 Agriculture and reforestation . . . . . . . . . . . . . . . . . . . . . . . . . . . . . . . . . . . . . . . . . . . . . . . . . . . . . . . . . . . . . . . . . . . . . . . . . . . . . . . . . . . . . . . . . . . . . . . . . . 0 0 0 0 0 0 0 0 0 0
1850 Tile drainage/shoreline assistance . . . . . . . . . . . . . . . . . . . . . . . . . . . . . . . . . . . . . . . . . . . . . . . . . . . . . . . . . . . . . . . . . . . . . . . . . . . . . . . . . . . . . . . . . . . . . . . . . . 0 0 0 0 0 0
1898 Other . . . . . . . . . . . . . . . . . . . 0 0 0 0 0 0 0 0 0 0
1899 Subtotal 2,416,941 4,057,797 0 0 0 4,057,797 1,640,856 126,749 0 1,767,605 2,290,192
1910 Other . . . . . . . . . . . . . . . . . . . 0 0 0 0 0 0
9910 Total Tangible Capital Assets 693,832,776 1,270,823,176 35,236,890 4,891,318 0 1,301,168,748 576,990,400 34,248,827 4,599,456 606,639,771 694,528,977
Page 164

2015 Financial Information Return - Schedule 51 - Schedule of Tangible Capital Assets - Segmented by Asset ClassProvince of Ontario - Ministry of Municipal Affairs and Housing 16.06.2016 15:102015-V01
FIR2015: Brantford C Schedule 51Asmt Code: 2906 SCHEDULE OF TANGIBLE CAPITAL ASSETS MAH Code: 40101 for the year ended December 31, 2015
SEGMENTED BY ASSET CLASS
2015 Opening
Net Book Value
(NBV)
2015 Closing
Net Book Value
(NBV)
1 11
General Capital Assets $ $
2005 Land . . . . . . . . . . . . . . . . . . . . . . . . . . . . . . . . . . . . . . . . . . . . . . . . . . . . . . . . . . . . . . . . . . . . . . . . . . . . . . . . . . . . . . . . . . . . . . . . . . 34,407,741 34,538,338
2010 Land Improvements . . . . . . . . . . . . . . . . . . . . . . . . . . . . . . . . . . . . . . . . . . . . . . . . . . . . . . . . . . . . . . . . . . . . . . . . . . . . . . . . . . . . . . . . . . . . . . . . . . 26,904,493 25,966,459
2020 Buildings . . . . . . . . . . . . . . . . . . . . . . . . . . . . . . . . . . . . . . . . . . . . . . . . . . . . . . . . . . . . . . . . . . . . . . . . . . . . . . . . . . . . . . . . . . . . . . . . . . 136,064,302 131,144,872
2030 Machinery & Equipment . . . . . . . . . . . . . . . . . . . . . . . . . . . . . . . . . . . . . . . . . . . . . . . . . . . . . . . . . . . . . . . . . . . . . . . . . . . . . . . . . . . . . . . . . . . . . . . . . . 30,820,079 31,280,312
2040 Vehicles . . . . . . . . . . . . . . . . . . . . . . . . . . . . . . . . . . . . . . . . . . . . . . . . . . . . . . . . . . . . . . . . . . . . . . . . . . . . . . . . . . . . . . . . . . . . . . . . . . 0
2097 Other . . . . . . . . . . . . . . . . . . . . . . . . . . . . . . . . . . . . . . . . . . . . . . . . . . . . . . . . . . . . . . . . . . . . . . . . . . . . . . 0
2098 Other . . . . . . . . . . . . . . . . . . . . . . . . . . . . . . . . . . . . . . . . . . . . . . . . . . . . . . . . . . . . . . . . . . . . . . . . . . . . . . 0
2099 Total General Capital Assets 228,196,615 222,929,981
2015 Opening
Net Book Value
(NBV)
2015 Closing
Net Book Value
(NBV)
1 11
Infrastructure Assets $ $
2205 Land . . . . . . . . . . . . . . . . . . . . . . . . . . . . . . . . . . . . . . . . . . . . . . . . . . . . . . . . . . . . . . . . . . . . . . . . . . . . . . . . . . . . . . . . . . . . . . . . . .0
2210 Land Improvements . . . . . . . . . . . . . . . . . . . . . . . . . . . . . . . . . . . . . . . . . . . . . . . . . . . . . . . . . . . . . . . . . . . . . . . . . . . . . . . . . . . . . . . . . . . . . . . . . .51,703,056 51,308,290
2220 Buildings . . . . . . . . . . . . . . . . . . . . . . . . . . . . . . . . . . . . . . . . . . . . . . . . . . . . . . . . . . . . . . . . . . . . . . . . . . . . . . . . . . . . . . . . . . . . . . . . . . 88,712,200 91,554,146
2230 Machinery & Equipment . . . . . . . . . . . . . . . . . . . . . . . . . . . . . . . . . . . . . . . . . . . . . . . . . . . . . . . . . . . . . . . . . . . . . . . . . . . . . . . . . . . . . . . . . . . . . . . . . . 0
2240 Vehicles . . . . . . . . . . . . . . . . . . . . . . . . . . . . . . . . . . . . . . . . . . . . . . . . . . . . . . . . . . . . . . . . . . . . . . . . . . . . . . . . . . . . . . . . . . . . . . . . . . 0
2250 Linear Assets . . . . . . . . . . . . . . . . . . . . . . . . . . . . . . . . . . . . . . . . . . . . . . . . . . . . . . . . . . . . . . . . . . . . . . . . . . . . . . . . . . . . . . . . . . . . . . . . . . 325,220,905 328,736,560
2297 Other . . . . . . . . . . . . . . . . . . . . . . . . . . . . . . . . . . . . . . . . . . . . . . . . . . . . . . . . . . . . . . . . . . . . . . . . . . . . . . 0
2298 Other . . . . . . . . . . . . . . . . . . . . . . . . . . . . . . . . . . . . . . . . . . . . . . . . . . . . . . . . . . . . . . . . . . . . . . . . . . . . . . 0
2299 Total Infrastructure Assets 465,636,161 471,598,996
9920 Total Tangible Capital Assets 693,832,776 694,528,977
2405 Construction-in-progress 10,497,068 10,954,571
9921 Total Tangible Capital Assets and Construction-in-progress 704,329,844 705,483,548
Page 165

2015 Financial Information Return - Schedule 51 - Schedule of Tangible Capital Assets: Contruction-in-Progress - Analysis by Functional ClassificationProvince of Ontario - Ministry of Municipal Affairs and Housing 16.06.2016 15:102015-V01
FIR2015: Brantford C Schedule 51Asmt Code: 2906 SCHEDULE OF TANGIBLE CAPITAL ASSET: CONSTRUCTION-IN-PROGRESS
MAH Code: 40101 for the year ended December 31, 2015
ANALYSIS BY FUNCTIONAL CLASSIFICATION COST
2015 Opening Balance Expenditures in 2015 Less Assets Capitalized 2015 Closing Balance
1 2 3 4
$ $ $ $
0299 General government. . . . . . . . . . . . . . . . . . . . . . . . . . . . . . . . . . . . . . . . . . . . . . . . . . . . . . . . . . . . . . . . . . . . . . . . . . . . . . . . . . . . . . . . . . . . . . . 740,375 -59,013 673,218 8,144Protection services
0410 Fire . . . . . . . . . . . . . . . . . . . . . . . . . . . . . . . . . . . . . . . . . . . . . . . . . . . . . . . . . . . . . . . . . . . . . . . . . . . . . . . . . . . . . . . . . . . . . . . . . . 0 619,451 619,4510420 Police . . . . . . . . . . . . . . . . . . . . . . . . . . . . . . . . . . . . . . . . . . . . . . . . . . . . . . . . . . . . . . . . . . . . . . . . . . . . . . . . . . . . . . . . . . . . . . . . . . 0 97,575 97,5750421 Court Security . . . . . . . . . . . . . . . . . . . . . . . . . . . . . . . . . . . . . . . . . . . . . . . . . . . . . . . . . . . . . . . . . . . . . . . . . . . . . . . . . . . . . . . . . . . . . . . . . . 0 00422 Prisoner Transportation . . . . . . . . . . . . . . . . . . . . . . . . . . . . . . . . . . . . . . . . . . . . . . . . . . . . . . . . . . . . . . . . . . . . . . . . . . . . . . . . . . . . . . . . . . . . . . . . . . 0 00430 Conservation authority . . . . . . . . . . . . . . . . . . . . . . . . . . . . . . . . . . . . . . . . . . . . . . . . . . . . . . . . . . . . . . . . . . . . . . . . . . . . . . . . . . . . . . . . . . . . . . . . . . 0 00440 Protective inspection and control . . . . . . . . . . . . . . . . . . . . . . . . . . . . . . . . . . . . . . . . . . . . . . . . . . . . . . . . . . . . . . . . . . . . . . . . . . . . . . . . . . . . . . . . . . . . . . . . . . 0 00445 Building permit and inspection services . . . . . . . . . . . . . . . . . . . . . . . . . . . . . . . . . . . . . . . . . . . . . . . . . . . . . . . . . . . . . . . . . . . . . . . . . . . . . . . . . . . . . . . . . . . . . . . . . .0 00450 Emergency measures . . . . . . . . . . . . . . . . . . . . . . . . . . . . . . . . . . . . . . . . . . . . . . . . . . . . . . . . . . . . . . . . . . . . . . . . . . . . . . . . . . . . . . . . . . . . . . . . . . 0 00460 Provincial Offences Act (POA) . . . . . . . . . . . . . . . . . . . . . . . . . . . . . . . . . . . . . . . . . . . . . . . . . . . . . . . . . . . . . . . . . . . . . . . . . . . . . . . . . . . . . . . . . . . . . . . . . . 0 00498 Other 0 00499 Subtotal 0 717,026 0 717,026
Transportation services0611 Roads - Paved . . . . . . . . . . . . . . . . . . . . . . . . . . . . . . . . . . . . . . . . . . . . . . . . . . . . . . . . . . . . . . . . . . . . . . . . . . . . . . . . . . . . . . . . . . . . . . . . . . 1,157,863 1,588,764 1,180,527 1,566,1000612 Roads - Unpaved . . . . . . . . . . . . . . . . . . . . . . . . . . . . . . . . . . . . . . . . . . . . . . . . . . . . . . . . . . . . . . . . . . . . . . . . . . . . . . . . . . . . . . . . . . . . . . . . . . 0 00613 Roads - Bridges and Culverts . . . . . . . . . . . . . . . . . . . . . . . . . . . . . . . . . . . . . . . . . . . . . . . . . . . . . . . . . . . . . . . . . . . . . . . . . . . . . . . . . . . . . . . . . . . . . . . . . . 103,233 -103,233 00614 Roadways - Traffic Operations & Roadside . . . . . . . . . . . . . . . . . . . . . . . . . . . . . . . . . . . . . . . . . . . . . . . . . . . . . . . . . . . . . . . . . . . . . . . . . . . . . . . . . . . . . . . . . . . . . . . . . . 27,020 -27,020 00621 Winter Control - Except sidewalks, Parking Lots . . . . . . . . . . . . . . . . . . . . . . . . . . . . . . . . . . . . . . . . . . . . . . . . . . . . . . . . . . . . . . . . . . . . . . . . . . . . . . . . . . . . . . . . . . . . . . . . . . 0 00622 Winter Control - Sidewalks, Parking Lots Only . . . . . . . . . . . . . . . . . . . . . . . . . . . . . . . . . . . . . . . . . . . . . . . . . . . . . . . . . . . . . . . . . . . . . . . . . . . . . . . . . . . . . . . . . . . . . . . . . . 0 00631 Transit - Conventional . . . . . . . . . . . . . . . . . . . . . . . . . . . . . . . . . . . . . . . . . . . . . . . . . . . . . . . . . . . . . . . . . . . . . . . . . . . . . . . . . . . . . . . . . . . . . . . . . . 0 1,543,830 1,543,8300632 Transit - Disabled & special needs . . . . . . . . . . . . . . . . . . . . . . . . . . . . . . . . . . . . . . . . . . . . . . . . . . . . . . . . . . . . . . . . . . . . . . . . . . . . . . . . . . . . . . . . . . . . . . . . . . 0 00640 Parking . . . . . . . . . . . . . . . . . . . . . . . . . . . . . . . . . . . . . . . . . . . . . . . . . . . . . . . . . . . . . . . . . . . . . . . . . . . . . . . . . . . . . . . . . . . . . . . . . . 0 00650 Street lighting . . . . . . . . . . . . . . . . . . . . . . . . . . . . . . . . . . . . . . . . . . . . . . . . . . . . . . . . . . . . . . . . . . . . . . . . . . . . . . . . . . . . . . . . . . . . . . . . . . 0 00660 Air transportation . . . . . . . . . . . . . . . . . . . . . . . . . . . . . . . . . . . . . . . . . . . . . . . . . . . . . . . . . . . . . . . . . . . . . . . . . . . . . . . . . . . . . . . . . . . . . . . . . . 12,845 12,845 00698 Other 0 00699 Subtotal 1,300,961 3,002,341 1,193,372 3,109,930
Environmental services0811 Wastewater collection/conveyance. . . . . . . . . . . . . . . . . . . . . . . . . . . . . . . . . . . . . . . . . . . . . . . . . . . . . . . . . . . . . . . . . . . . . . . . . . . . . . . . . . . . . . . . . . . . . . . . . . 2,183,070 871,294 2,176,783 877,5810812 Wastewater treatment & disposal . . . . . . . . . . . . . . . . . . . . . . . . . . . . . . . . . . . . . . . . . . . . . . . . . . . . . . . . . . . . . . . . . . . . . . . . . . . . . . . . . . . . . . . . . . . . . . . . . . 248,004 -159,894 88,110 00821 Urban storm sewer system . . . . . . . . . . . . . . . . . . . . . . . . . . . . . . . . . . . . . . . . . . . . . . . . . . . . . . . . . . . . . . . . . . . . . . . . . . . . . . . . . . . . . . . . . . . . . . . . . . 0 00822 Rural storm sewer system . . . . . . . . . . . . . . . . . . . . . . . . . . . . . . . . . . . . . . . . . . . . . . . . . . . . . . . . . . . . . . . . . . . . . . . . . . . . . . . . . . . . . . . . . . . . . . . . . . 0 00831 Water treatment . . . . . . . . . . . . . . . . . . . . . . . . . . . . . . . . . . . . . . . . . . . . . . . . . . . . . . . . . . . . . . . . . . . . . . . . . . . . . . . . . . . . . . . . . . . . . . . . . . 3,877,496 180,787 3,728,539 329,7440832 Water distribution/transmission . . . . . . . . . . . . . . . . . . . . . . . . . . . . . . . . . . . . . . . . . . . . . . . . . . . . . . . . . . . . . . . . . . . . . . . . . . . . . . . . . . . . . . . . . . . . . . . . . . 1,430,723 2,179,198 1,168,660 2,441,2610840 Solid waste collection . . . . . . . . . . . . . . . . . . . . . . . . . . . . . . . . . . . . . . . . . . . . . . . . . . . . . . . . . . . . . . . . . . . . . . . . . . . . . . . . . . . . . . . . . . . . . . . . . . 0 00850 Solid waste disposal . . . . . . . . . . . . . . . . . . . . . . . . . . . . . . . . . . . . . . . . . . . . . . . . . . . . . . . . . . . . . . . . . . . . . . . . . . . . . . . . . . . . . . . . . . . . . . . . . . 0 00860 Waste diversion . . . . . . . . . . . . . . . . . . . . . . . . . . . . . . . . . . . . . . . . . . . . . . . . . . . . . . . . . . . . . . . . . . . . . . . . . . . . . . . . . . . . . . . . . . . . . . . . . . 0 00898 Other 0 00899 Subtotal 7,739,293 3,071,385 7,162,092 3,648,586
Health services1010 Public health services . . . . . . . . . . . . . . . . . . . . . . . . . . . . . . . . . . . . . . . . . . . . . . . . . . . . . . . . . . . . . . . . . . . . . . . . . . . . . . . . . . . . . . . . . . . . . . . . . . 0 01020 Hospitals . . . . . . . . . . . . . . . . . . . . . . . . . . . . . . . . . . . . . . . . . . . . . . . . . . . . . . . . . . . . . . . . . . . . . . . . . . . . . . . . . . . . . . . . . . . . . . . . . . 0 01030 Ambulance services . . . . . . . . . . . . . . . . . . . . . . . . . . . . . . . . . . . . . . . . . . . . . . . . . . . . . . . . . . . . . . . . . . . . . . . . . . . . . . . . . . . . . . . . . . . . . . . . . . 0 01035 Ambulance dispatch . . . . . . . . . . . . . . . . . . . . . . . . . . . . . . . . . . . . . . . . . . . . . . . . . . . . . . . . . . . . . . . . . . . . . . . . . . . . . . . . . . . . . . . . . . . . . . . . . . 0 01040 Cemeteries . . . . . . . . . . . . . . . . . . . . . . . . . . . . . . . . . . . . . . . . . . . . . . . . . . . . . . . . . . . . . . . . . . . . . . . . . . . . . . . . . . . . . . . . . . . . . . . . . . 3,400 3,400 01098 Other 0 01099 Subtotal 3,400 0 3,400 0
Social and family services1210 General assistance . . . . . . . . . . . . . . . . . . . . . . . . . . . . . . . . . . . . . . . . . . . . . . . . . . . . . . . . . . . . . . . . . . . . . . . . . . . . . . . . . . . . . . . . . . . . . . . . . . 0 01220 Assistance to aged persons . . . . . . . . . . . . . . . . . . . . . . . . . . . . . . . . . . . . . . . . . . . . . . . . . . . . . . . . . . . . . . . . . . . . . . . . . . . . . . . . . . . . . . . . . . . . . . . . . . 0 01230 Child care . . . . . . . . . . . . . . . . . . . . . . . . . . . . . . . . . . . . . . . . . . . . . . . . . . . . . . . . . . . . . . . . . . . . . . . . . . . . . . . . . . . . . . . . . . . . . . . . . . 0 01298 Other 0 01299 Subtotal 0 0 0 0
Social Housing1410 Public Housing . . . . . . . . . . . . . . . . . . . . . . . . . . . . . . . . . . . . . . . . . . . . . . . . . . . . . . . . . . . . . . . . . . . . . . . . . . . . . . . . . . . . . . . . . . . . . . . . . . 0 321 3211420 Non-Profit/Cooperative Housing . . . . . . . . . . . . . . . . . . . . . . . . . . . . . . . . . . . . . . . . . . . . . . . . . . . . . . . . . . . . . . . . . . . . . . . . . . . . . . . . . . . . . . . . . . . . . . . . . . 0 01430 Rent Supplement Programs . . . . . . . . . . . . . . . . . . . . . . . . . . . . . . . . . . . . . . . . . . . . . . . . . . . . . . . . . . . . . . . . . . . . . . . . . . . . . . . . . . . . . . . . . . . . . . . . . . 0 01497 Other Affordable Housing 607,504 9,187 607,504 9,1871498 Other 0 01499 Subtotal 607,504 9,508 607,504 9,508
Recreation and cultural services1610 Parks . . . . . . . . . . . . . . . . . . . . . . . . . . . . . . . . . . . . . . . . . . . . . . . . . . . . . . . . . . . . . . . . . . . . . . . . . . . . . . . . . . . . . . . . . . . . . . . . . . 97,262 3,113,845 43,036 3,168,0711620 Recreation programs . . . . . . . . . . . . . . . . . . . . . . . . . . . . . . . . . . . . . . . . . . . . . . . . . . . . . . . . . . . . . . . . . . . . . . . . . . . . . . . . . . . . . . . . . . . . . . . . . . 0 01631 Rec. Fac. - Golf Crs, Marina, Ski Hill . . . . . . . . . . . . . . . . . . . . . . . . . . . . . . . . . . . . . . . . . . . . . . . . . . . . . . . . . . . . . . . . . . . . . . . . . . . . . . . . . . . . . . . . . . . . . . . . . . 8,275 219,398 227,6731634 Rec. Fac. - All Other . . . . . . . . . . . . . . . . . . . . . . . . . . . . . . . . . . . . . . . . . . . . . . . . . . . . . . . . . . . . . . . . . . . . . . . . . . . . . . . . . . . . . . . . . . . . . . . . . . -2 57,631 57,6291640 Libraries . . . . . . . . . . . . . . . . . . . . . . . . . . . . . . . . . . . . . . . . . . . . . . . . . . . . . . . . . . . . . . . . . . . . . . . . . . . . . . . . . . . . . . . . . . . . . . . . . . 0 01645 Museums . . . . . . . . . . . . . . . . . . . . . . . . . . . . . . . . . . . . . . . . . . . . . . . . . . . . . . . . . . . . . . . . . . . . . . . . . . . . . . . . . . . . . . . . . . . . . . . . . . 0 4,104 4,1041650 Cultural services . . . . . . . . . . . . . . . . . . . . . . . . . . . . . . . . . . . . . . . . . . . . . . . . . . . . . . . . . . . . . . . . . . . . . . . . . . . . . . . . . . . . . . . . . . . . . . . . . . 0 3,900 3,9001698 Other 0 01699 Subtotal 105,535 3,398,878 43,036 3,461,377
Planning and development1810 Planning and zoning . . . . . . . . . . . . . . . . . . . . . . . . . . . . . . . . . . . . . . . . . . . . . . . . . . . . . . . . . . . . . . . . . . . . . . . . . . . . . . . . . . . . . . . . . . . . . . . . . . 0 01820 Commercial and Industrial . . . . . . . . . . . . . . . . . . . . . . . . . . . . . . . . . . . . . . . . . . . . . . . . . . . . . . . . . . . . . . . . . . . . . . . . . . . . . . . . . . . . . . . . . . . . . . . . . . 0 01830 Residential development . . . . . . . . . . . . . . . . . . . . . . . . . . . . . . . . . . . . . . . . . . . . . . . . . . . . . . . . . . . . . . . . . . . . . . . . . . . . . . . . . . . . . . . . . . . . . . . . . . 0 01840 Agriculture and reforestation . . . . . . . . . . . . . . . . . . . . . . . . . . . . . . . . . . . . . . . . . . . . . . . . . . . . . . . . . . . . . . . . . . . . . . . . . . . . . . . . . . . . . . . . . . . . . . . . . . 0 01850 Tile drainage/shoreline assistance . . . . . . . . . . . . . . . . . . . . . . . . . . . . . . . . . . . . . . . . . . . . . . . . . . . . . . . . . . . . . . . . . . . . . . . . . . . . . . . . . . . . . . . . . . . . . . . . . . 0 01898 Other 0 01899 Subtotal 0 0 0 0
1910 Other 0 0
9910 Total Construction-In-Progress 10,497,068 10,140,125 9,682,622 10,954,571
Page 166

2015 Financial Information Return - Schedule 53 - Consolidated Statement of Change in Net Financial Assets (Net Debt) and Tangible Capital Asset Acquisition Financing / DonationsProvince of Ontario - Ministry of Municipal Affairs and Housing 16.06.2016 15:102015-V01
FIR2015: Brantford C Schedule 53Asmt Code: 2906 CONSOLIDATED STATEMENT OF CHANGE IN NET FINANCIAL ASSETS
MAH Code: 40101 (NET DEBT) AND TANGIBLE CAPITAL ASSET ACQUISITION FINANCING/DONATIONS
for the year ended December 31, 2015
CONSOLIDATED STATEMENT OF CHANGE IN NET FINANCIAL ASSETS (NET DEBT)
1
$
1010 Annual Surplus/(Deficit) (SLC 10 2099 01) . . . . . . . . . . . . . . . . . . . . . . . . . . . . . . . . . . . . . . . . . . . . . . . . . . . . . . . . . . . . . . . . . . . . . . . . . . . . . . . . . . . . . . . . . . . . . . . . . . 12,609,468
1020 Acquisition of tangible capital assets . . . . . . . . . . . . . . . . . . . . . . . . . . . . . . . . . . . . . . . . . . . . . . . . . . . . . . . . . . . . . . . . . . . . . . . . . . . . . . . . . . . . . . . . . . . . . . . . . . -33,919,938
1030 Amortization of tangible capital assets (SLC 51 9910 08) . . . . . . . . . . . . . . . . . . . . . . . . . . . . . . . . . . . . . . . . . . . . . . . . . . . . . . . . . . . . . . . . . . . . . . . . . . . . . . . . . . . . . . . . . . . . . . . . . . 34,248,827
1031 Contributed (Donated) tangible capital assets . . . . . . . . . . . . . . . . . . . . . . . . . . . . . . . . . . . . . . . . . . . . . . . . . . . . . . . . . . . . . . . . . . . . . . . . . . . . . . . . . . . . . . . . . . . . . . . . . .-1,316,950
1032 Change in construction-in-progress . . . . . . . . . . . . . . . . . . . . . . . . . . . . . . . . . . . . . . . . . . . . . . . . . . . . . . . . . . . . . . . . . . . . . . . . . . . . . . . . . . . . . . . . . . . . . . . . . .-457,505
1040 (Gain)/Loss on sale of tangible capital assets . . . . . . . . . . . . . . . . . . . . . . . . . . . . . . . . . . . . . . . . . . . . . . . . . . . . . . . . . . . . . . . . . . . . . . . . . . . . . . . . . . . . . . . . . . . . . . . . . . 112,520
1050 Proceeds on sale of tangible capital assets . . . . . . . . . . . . . . . . . . . . . . . . . . . . . . . . . . . . . . . . . . . . . . . . . . . . . . . . . . . . . . . . . . . . . . . . . . . . . . . . . . . . . . . . . . . . . . . . . . 179,342
1060 Write-downs of tangible capital assets . . . . . . . . . . . . . . . . . . . . . . . . . . . . . . . . . . . . . . . . . . . . . . . . . . . . . . . . . . . . . . . . . . . . . . . . . . . . . . . . . . . . . . . . . . . . . . . . . . 0
1070 Other . . . . . . . . . . . . . . . . . . . . . . . . . . . . . . . . . . . . . . . . . . . . . . . . . . . . . . . . . . . . . . . . . . . . . . . . . . . . . . 0
1071 Other . . . . . . . . . . . . . . . . . . . . . . . . . . . . . . . . . . . . . . . . . . . . . . . . . . . . . . . . . . . . . . . . . . . . . . . . . . . . . . 0
1099 Subtotal -1,153,704
1210 Change in supplies inventories . . . . . . . . . . . . . . . . . . . . . . . . . . . . . . . . . . . . . . . . . . . . . . . . . . . . . . . . . . . . . . . . . . . . . . . . . . . . . . . . . . . . . . . . . . . . . . . . . . 1,430,368
1220 Change in prepaid expenses . . . . . . . . . . . . . . . . . . . . . . . . . . . . . . . . . . . . . . . . . . . . . . . . . . . . . . . . . . . . . . . . . . . . . . . . . . . . . . . . . . . . . . . . . . . . . . . . . . 857,073
1230 Other . . . . . . . . . . . . . . . . . . . . . . . . . . . . . . . . . . . . . . . . . . . . . . . . . . . . . . . . . . . . . . . . . . . . . . . . . . . . . .
1299 Subtotal 2,287,441
1410 (Increase)/decrease in net financial assets/net debt . . . . . . . . . . . . . . . . . . . . . . . . . . . . . . . . . . . . . . . . . . . . . . . . . . . . . . . . . . . . . . . . . . . . . . . . . . . . . . . . . . . . . . . . . . . . . . . . . . 13,743,205
1420 Net financial assets (net debt), beginning of year . . . . . . . . . . . . . . . . . . . . . . . . . . . . . . . . . . . . . . . . . . . . . . . . . . . . . . . . . . . . . . . . . . . . . . . . . . . . . . . . . . . . . . . . . . . . . . . . . . 68,381,607
9910 Net financial assets (net debt), end of year . . . . . . . . . . . . . . . . . . . . . . . . . . . . . . . . . . . . . . . . . . . . . . . . . . . . . . . . . . . . . . . . . . . . . . . . . . . . . . . . . . . . . . . . . . . . . . . . . . 82,124,812
SOURCES OF FINANCING FOR TCA ACQUISITIONS / DONATIONS
1
Long Term Liabilities Incurred $
0205 Canada Mortgage and Housing Corporation (CMHC) . . . . . . . . . . . . . . . . . . . . . . . . . . . . . . . . . . . . . . . . . . . . . . . . . . . . . . . . . . . . . . . . . . . . . . . . . . . . . . . . . . . . . . . . . . . . . . . . . .
0210 Ontario Financing Authority . . . . . . . . . . . . . . . . . . . . . . . . . . . . . . . . . . . . . . . . . . . . . . . . . . . . . . . . . . . . . . . . . . . . . . . . . . . . . . . . . . . . . . . . . . . . . . . . . .
0215 Commercial Area Improvement Program . . . . . . . . . . . . . . . . . . . . . . . . . . . . . . . . . . . . . . . . . . . . . . . . . . . . . . . . . . . . . . . . . . . . . . . . . . . . . . . . . . . . . . . . . . . . . . . . . .
0220 Other Ontario housing programs . . . . . . . . . . . . . . . . . . . . . . . . . . . . . . . . . . . . . . . . . . . . . . . . . . . . . . . . . . . . . . . . . . . . . . . . . . . . . . . . . . . . . . . . . . . . . . . . . .
0235 Serial debentures . . . . . . . . . . . . . . . . . . . . . . . . . . . . . . . . . . . . . . . . . . . . . . . . . . . . . . . . . . . . . . . . . . . . . . . . . . . . . . . . . . . . . . . . . . . . . . . . . .
0240 Sinking fund debentures . . . . . . . . . . . . . . . . . . . . . . . . . . . . . . . . . . . . . . . . . . . . . . . . . . . . . . . . . . . . . . . . . . . . . . . . . . . . . . . . . . . . . . . . . . . . . . . . . .
0245 Long term bank loans . . . . . . . . . . . . . . . . . . . . . . . . . . . . . . . . . . . . . . . . . . . . . . . . . . . . . . . . . . . . . . . . . . . . . . . . . . . . . . . . . . . . . . . . . . . . . . . . . .
0250 Long term reserve fund loans . . . . . . . . . . . . . . . . . . . . . . . . . . . . . . . . . . . . . . . . . . . . . . . . . . . . . . . . . . . . . . . . . . . . . . . . . . . . . . . . . . . . . . . . . . . . . . . . . .
0255 Lease purchase agreements (Tangible capital leases) . . . . . . . . . . . . . . . . . . . . . . . . . . . . . . . . . . . . . . . . . . . . . . . . . . . . . . . . . . . . . . . . . . . . . . . . . . . . . . . . . . . . . . . . . . . . . . . . . .
0260 Construction Financing Debentures . . . . . . . . . . . . . . . . . . . . . . . . . . . . . . . . . . . . . . . . . . . . . . . . . . . . . . . . . . . . . . . . . . . . . . . . . . . . . . . . . . . . . . . . . . . . . . . . . .
0265 Infrastructure Ontario . . . . . . . . . . . . . . . . . . . . . . . . . . . . . . . . . . . . . . . . . . . . . . . . . . . . . . . . . . . . . . . . . . . . . . . . . . . . . . . . . . . . . . . . . . . . . . . . . .
0297 Other . . . . . . . . . . . . . . . . . . . . . . . . . . . . . . . . . . . . . . . . . . . . . . . . . . . . . . . . . . . . . . . . . . . . . . . . . . . . . .
0298 Other . . . . . . . . . . . . . . . . . . . . . . . . . . . . . . . . . . . . . . . . . . . . . . . . . . . . . . . . . . . . . . . . . . . . . . . . . . . . . .
0299 Subtotal 0
Financing from Dedicated Revenue
0405 Municipal Property Tax by Levy . . . . . . . . . . . . . . . . . . . . . . . . . . . . . . . . . . . . . . . . . . . . . . . . . . . . . . . . . . . . . . . . . . . . . . . . . . . . . . . . . . . . . . . . . . . . . . . . . .
0406 Reserves and Reserve funds (SLC 60 1012 01 + SLC 60 1012 02 + SLC 60 1012 03) . . . . . . . . . . . . . . . . . . . . . . . . . . . . . . . . . . . . . . . . . . . . . . . . . . . . . . . . . . . . . . . . . . . . . . . . . . . . . . . . . . . . . . . . . . . . . . . . . .25,405,817
0410 Municipal User Fees & Service Charges . . . . . . . . . . . . . . . . . . . . . . . . . . . . . . . . . . . . . . . . . . . . . . . . . . . . . . . . . . . . . . . . . . . . . . . . . . . . . . . . . . . . . . . . . . . . . . . . . .
0415 Development Charges (SLC 61 0299 08). . . . . . . . . . . . . . . . . . . . . . . . . . . . . . . . . . . . . . . . . . . . . . . . . . . . . . . . . . . . . . . . . . . . . . . . . . . . . . . . . . . . . . . . . . . . . . . . . . 1,411,187
0416 Recreation land (The Planning Act) (SLC 60 1032 01). . . . . . . . . . . . . . . . . . . . . . . . . . . . . . . . . . . . . . . . . . . . . . . . . . . . . . . . . . . . . . . . . . . . . . . . . . . . . . . . . . . . . . . . . . . . . . . . . .23,820
0419 Donations . . . . . . . . . . . . . . . . . . . . . . . . . . . . . . . . . . . . . . . . . . . . . . . . . . . . . . . . . . . . . . . . . . . . . . . . . . . . . . . . . . . . . . . . . . . . . . . . . .
0420 Other . . . . . . . . . . . . . . . . . . . . . . . . . . . . . . . . . . . . . . . . . . . . . . . . . . . . . . . . . . . . . . . . . . . . . . . . . . . . . .
0446 Proceeds from the sale of Tangible Capital Assets, etc . . . . . . . . . . . . . . . . . . . . . . . . . . . . . . . . . . . . . . . . . . . . . . . . . . . . . . . . . . . . . . . . . . . . . . . . . . . . . . . . . . . . . . . . . . . . . . . . . .
0447 Investment income . . . . . . . . . . . . . . . . . . . . . . . . . . . . . . . . . . . . . . . . . . . . . . . . . . . . . . . . . . . . . . . . . . . . . . . . . . . . . . . . . . . . . . . . . . . . . . . . . .
0448 Prepaid special charges . . . . . . . . . . . . . . . . . . . . . . . . . . . . . . . . . . . . . . . . . . . . . . . . . . . . . . . . . . . . . . . . . . . . . . . . . . . . . . . . . . . . . . . . . . . . . . . . . .
0495 Other . . . . . . . . . . . . . . . . . . . . . . . . . . . . . . . . . . . . . . . . . . . . . . . . . . . . . . . . . . . . . . . . . . . . . . . . . . . . . .
0496 Other . . . . . . . . . . . . . . . . . . . . . . . . . . . . . . . . . . . . . . . . . . . . . . . . . . . . . . . . . . . . . . . . . . . . . . . . . . . . . .
0497 Other . . . . . . . . . . . . . . . . . . . . . . . . . . . . . . . . . . . . . . . . . . . . . . . . . . . . . . . . . . . . . . . . . . . . . . . . . . . . . .
0498 Other . . . . . . . . . . . . . . . . . . . . . . . . . . . . . . . . . . . . . . . . . . . . . . . . . . . . . . . . . . . . . . . . . . . . . . . . . . . . . .
0501 Subtotal 26,840,824
Government Transfers
0425 Capital Grants: Federal (SLC 12 9910 06 - (SLC 10 4099 01 - SLC 60 1047 01) . . . . . . . . . . . . . . . . . . . . . . . . . . . . . . . . . . . . . . . . . . . . . . . . . . . . . . . . . . . . . . . . . . . . . . . . . . . . . . . . . . . . . . . . . . . . . . . . . . 50,000
0430 Capital Grants: Provincial (SLC 12 9910 05 - (SLC 10 4019 01 - SLC 60 1045 01). . . . . . . . . . . . . . . . . . . . . . . . . . . . . . . . . . . . . . . . . . . . . . . . . . . . . . . . . . . . . . . . . . . . . . . . . . . . . . . . . . . . . . . . . . . . . . . . . . 1,999,932
0435 Capital Grants: Other Municipalities (SLC 12 9910 07) . . . . . . . . . . . . . . . . . . . . . . . . . . . . . . . . . . . . . . . . . . . . . . . . . . . . . . . . . . . . . . . . . . . . . . . . . . . . . . . . . . . . . . . . . . . . . . . . . . 0
0440 Canada Gas Tax (SLC 10 4099 01). . . . . . . . . . . . . . . . . . . . . . . . . . . . . . . . . . . . . . . . . . . . . . . . . . . . . . . . . . . . . . . . . . . . . . . . . . . . . . . . . . . . . . . . . . . . . . . . . . 5,100,697
0445 Provincial Gas Tax (SLC 10 4019 01). . . . . . . . . . . . . . . . . . . . . . . . . . . . . . . . . . . . . . . . . . . . . . . . . . . . . . . . . . . . . . . . . . . . . . . . . . . . . . . . . . . . . . . . . . . . . . . . . . 0
0502 Subtotal 7,150,629
0499 Subtotal 33,991,453
0610 Contributed (Donated) tangible capital assets . . . . . . . . . . . . . . . . . . . . . . . . . . . . . . . . . . . . . . . . . . . . . . . . . . . . . . . . . . . . . . . . . . . . . . . . . . . . . . . . . . . . . . . . . . . . . . . . . . 1,316,950
9920 Total Capital Financing 35,308,403
0810 Unexpended Capital Financing or (Unfinanced Capital Outlay) . . . . . . . . . . . . . . . . . . . . . . . . . . . . . . . . . . . . . . . . . . . . . . . . . . . . . . . . . . . . . . . . . . . . . . . . . . . . . . . . . . . . . . . . . . . . . . . . . .-385,990
Page 167

2015 Financial Information Return - Schedule 54 - Consolidated Statement of Cash Flow - Direct MethodProvince of Ontario - Ministry of Municipal Affairs and Housing 16.06.2016 15:102015-V01
FIR2015: Brantford C Schedule 54Asmt Code: 2906 CONSOLIDATED STATEMENT OF CASH FLOW - DIRECT METHOD
MAH Code: 40101 for the year ended December 31, 2015
* Municipalities must choose either the direct or indirect method. If indirect method is chosen, please use Schedule 54B.
CONSOLIDATED STATEMENT OF CASH FLOW - DIRECT METHOD
Operating Transactions
2015
Actual
1
Cash received from $
0210 Taxes . . . . . . . . . . . . . . . . . . . . . . . . . . . . . . . . . . . . . . . . . . . . . . . . . . . . . . . . . . . . . . . . . . . . . . . . . . . . . . . . . . . . . . . . . . . . . . . . . .
0220 Transfers . . . . . . . . . . . . . . . . . . . . . . . . . . . . . . . . . . . . . . . . . . . . . . . . . . . . . . . . . . . . . . . . . . . . . . . . . . . . . . . . . . . . . . . . . . . . . . . . . .
0230 User Fees . . . . . . . . . . . . . . . . . . . . . . . . . . . . . . . . . . . . . . . . . . . . . . . . . . . . . . . . . . . . . . . . . . . . . . . . . . . . . . . . . . . . . . . . . . . . . . . . . .
0240 Fees, Permits, Licenses and Fines . . . . . . . . . . . . . . . . . . . . . . . . . . . . . . . . . . . . . . . . . . . . . . . . . . . . . . . . . . . . . . . . . . . . . . . . . . . . . . . . . . . . . . . . . . . . . . . . . .
0250 Enterprises. . . . . . . . . . . . . . . . . . . . . . . . . . . . . . . . . . . . . . . . . . . . . . . . . . . . . . . . . . . . . . . . . . . . . . . . . . . . . . . . . . . . . . . . . . . . . . . . . .
0260 Investments . . . . . . . . . . . . . . . . . . . . . . . . . . . . . . . . . . . . . . . . . . . . . . . . . . . . . . . . . . . . . . . . . . . . . . . . . . . . . . . . . . . . . . . . . . . . . . . . . .
0298 Other . . . . . . . . . . . . . . . . . . . . . . . . . . . . . . . . . . . . . . . . . . . . . . . . . . . . . . . . . . . . . . . . . . . . . . . . . . . . . .
0299 Subtotal 0
Cash paid for
0410 Salaries, Wages and Employment Contracts and Benefits . . . . . . . . . . . . . . . . . . . . . . . . . . . . . . . . . . . . . . . . . . . . . . . . . . . . . . . . . . . . . . . . . . . . . . . . . . . . . . . . . . . . . . . . . . . . . . . . . .
0420 Material and Supplies . . . . . . . . . . . . . . . . . . . . . . . . . . . . . . . . . . . . . . . . . . . . . . . . . . . . . . . . . . . . . . . . . . . . . . . . . . . . . . . . . . . . . . . . . . . . . . . . . .
0430 Contracted Services . . . . . . . . . . . . . . . . . . . . . . . . . . . . . . . . . . . . . . . . . . . . . . . . . . . . . . . . . . . . . . . . . . . . . . . . . . . . . . . . . . . . . . . . . . . . . . . . . .
0440 Financing Charges . . . . . . . . . . . . . . . . . . . . . . . . . . . . . . . . . . . . . . . . . . . . . . . . . . . . . . . . . . . . . . . . . . . . . . . . . . . . . . . . . . . . . . . . . . . . . . . . . .
0450 External Transfers . . . . . . . . . . . . . . . . . . . . . . . . . . . . . . . . . . . . . . . . . . . . . . . . . . . . . . . . . . . . . . . . . . . . . . . . . . . . . . . . . . . . . . . . . . . . . . . . . .
0498 Other . . . . . . . . . . . . . . . . . . . . . . . . . . . . . . . . . . . . . . . . . . . . . . . . . . . . . . . . . . . . . . . . . . . . . . . . . . . . . .
0499 Subtotal 0
2099 Cash provided by operating transactions 0
Capital Transactions
0610 Proceeds on sale of tangible capital assets . . . . . . . . . . . . . . . . . . . . . . . . . . . . . . . . . . . . . . . . . . . . . . . . . . . . . . . . . . . . . . . . . . . . . . . . . . . . . . . . . . . . . . . . . . . . . . . . . .
0620 Cash used to acquire tangible capital assets . . . . . . . . . . . . . . . . . . . . . . . . . . . . . . . . . . . . . . . . . . . . . . . . . . . . . . . . . . . . . . . . . . . . . . . . . . . . . . . . . . . . . . . . . . . . . . . . . .
0630 Change in construction-in-progress . . . . . . . . . . . . . . . . . . . . . . . . . . . . . . . . . . . . . . . . . . . . . . . . . . . . . . . . . . . . . . . . . . . . . . . . . . . . . . . . . . . . . . . . . . . . . . . . . .
0698 Other . . . . . . . . . . . . . . . . . . . . . . . . . . . . . . . . . . . . . . . . . . . . . . . . . . . . . . . . . . . . . . . . . . . . . . . . . . . . . .
0699 Cash applied to capital transactions 0
Investing Transactions
0810 Proceeds from portfolio investments . . . . . . . . . . . . . . . . . . . . . . . . . . . . . . . . . . . . . . . . . . . . . . . . . . . . . . . . . . . . . . . . . . . . . . . . . . . . . . . . . . . . . . . . . . . . . . . . . .
0820 Portfolio investments . . . . . . . . . . . . . . . . . . . . . . . . . . . . . . . . . . . . . . . . . . . . . . . . . . . . . . . . . . . . . . . . . . . . . . . . . . . . . . . . . . . . . . . . . . . . . . . . . .
0898 Other . . . . . . . . . . . . . . . . . . . . . . . . . . . . . . . . . . . . . . . . . . . . . . . . . . . . . . . . . . . . . . . . . . . . . . . . . . . . . .
0899 Cash provided by / (applied to) investing transactions 0
Financing Transactions
1010 Proceeds from long term debt issues . . . . . . . . . . . . . . . . . . . . . . . . . . . . . . . . . . . . . . . . . . . . . . . . . . . . . . . . . . . . . . . . . . . . . . . . . . . . . . . . . . . . . . . . . . . . . . . . . .
1020 Principal long term debt repayment . . . . . . . . . . . . . . . . . . . . . . . . . . . . . . . . . . . . . . . . . . . . . . . . . . . . . . . . . . . . . . . . . . . . . . . . . . . . . . . . . . . . . . . . . . . . . . . . . .
1030 Temporary loans . . . . . . . . . . . . . . . . . . . . . . . . . . . . . . . . . . . . . . . . . . . . . . . . . . . . . . . . . . . . . . . . . . . . . . . . . . . . . . . . . . . . . . . . . . . . . . . . . .
1031 Repayment of temporary loans . . . . . . . . . . . . . . . . . . . . . . . . . . . . . . . . . . . . . . . . . . . . . . . . . . . . . . . . . . . . . . . . . . . . . . . . . . . . . . . . . . . . . . . . . . . . . . . . . .
1096 Other . . . . . . . . . . . . . . . . . . . . . . . . . . . . . . . . . . . . . . . . . . . . . . . . . . . . . . . . . . . . . . . . . . . . . . . . . . . . . .
1097 Other . . . . . . . . . . . . . . . . . . . . . . . . . . . . . . . . . . . . . . . . . . . . . . . . . . . . . . . . . . . . . . . . . . . . . . . . . . . . . .
1098 Other . . . . . . . . . . . . . . . . . . . . . . . . . . . . . . . . . . . . . . . . . . . . . . . . . . . . . . . . . . . . . . . . . . . . . . . . . . . . . .
1099 Cash applied to financing transactions 0
1210 Increase in cash and cash equivalents . . . . . . . . . . . . . . . . . . . . . . . . . . . . . . . . . . . . . . . . . . . . . . . . . . . . . . . . . . . . . . . . . . . . . . . . . . . . . . . . . . . . . . . . . . . . . . . . . . 0
1220 Cash and cash equivalents, beginning of year . . . . . . . . . . . . . . . . . . . . . . . . . . . . . . . . . . . . . . . . . . . . . . . . . . . . . . . . . . . . . . . . . . . . . . . . . . . . . . . . . . . . . . . . . . . . . . . . . . 52,030,701
9920 Cash and cash equivalents, end of year . . . . . . . . . . . . . . . . . . . . . . . . . . . . . . . . . . . . . . . . . . . . . . . . . . . . . . . . . . . . . . . . . . . . . . . . . . . . . . . . . . . . . . . . . . . . . . . . . . 52,030,701
2015
Actual
1
Cash and cash equivalents represented by: $
1401 Cash . . . . . . . . . . . . . . . . . . . . . . . . . . . . . . . . . . . . . . . . . . . . . . . . . . . . . . . . . . . . . . . . . . . . . . . . . . . . . . . . . . . . . . . . . . . . . . . . . .
1402 Temporary borrowings . . . . . . . . . . . . . . . . . . . . . . . . . . . . . . . . . . . . . . . . . . . . . . . . . . . . . . . . . . . . . . . . . . . . . . . . . . . . . . . . . . . . . . . . . . . . . . . . . .
1403 Short term investments . . . . . . . . . . . . . . . . . . . . . . . . . . . . . . . . . . . . . . . . . . . . . . . . . . . . . . . . . . . . . . . . . . . . . . . . . . . . . . . . . . . . . . . . . . . . . . . . . .
1404 Other . . . . . . . . . . . . . . . . . . . . . . . . . . . . . . . . . . . . . . . . . . . . . . . . . . . . . . . . . . . . . . . . . . . . . . . . . . . . . .
9940 Cash and cash equivalents, end of year . . . . . . . . . . . . . . . . . . . . . . . . . . . . . . . . . . . . . . . . . . . . . . . . . . . . . . . . . . . . . . . . . . . . . . . . . . . . . . . . . . . . . . . . . . . . . . . . . .0
1
Cash: $
1501 Unrestricted . . . . . . . . . . . . . . . . . . . . . . . . . . . . . . . . . . . . . . . . . . . . . . . . . . . . . . . . . . . . . . . . . . . . . . . . . . . . . . . . . . . . . . . . . . . . . . . . . .
1502 Restricted . . . . . . . . . . . . . . . . . . . . . . . . . . . . . . . . . . . . . . . . . . . . . . . . . . . . . . . . . . . . . . . . . . . . . . . . . . . . . . . . . . . . . . . . . . . . . . . . . .
1503 Unallocated . . . . . . . . . . . . . . . . . . . . . . . . . . . . . . . . . . . . . . . . . . . . . . . . . . . . . . . . . . . . . . . . . . . . . . . . . . . . . . . . . . . . . . . . . . . . . . . . . .
9950 Cash and cash equivalents, end of year . . . . . . . . . . . . . . . . . . . . . . . . . . . . . . . . . . . . . . . . . . . . . . . . . . . . . . . . . . . . . . . . . . . . . . . . . . . . . . . . . . . . . . . . . . . . . . . . . .0
Page 168

2015 Financial Information Return - Schedule 54 - Consolidated Statement of Cash Flow - InDirect MethodProvince of Ontario - Ministry of Municipal Affairs and Housing 16.06.2016 15:102015-V01
FIR2015: Brantford C Schedule 54Asmt Code: 2906 CONSOLIDATED STATEMENT OF CASH FLOW - INDIRECT METHOD
MAH Code: 40101 for the year ended December 31, 2015
* Municipalities must choose either the direct or indirect method. If direct method is chosen, please use Schedule 54A.
CONSOLIDATED STATEMENT OF CASH FLOW - INDIRECT METHOD
2015
Actual
1
Operating Transactions $
2010 Annual Surplus/(Deficit) (SLC 10 2099 01). . . . . . . . . . . . . . . . . . . . . . . . . . . . . . . . . . . . . . . . . . . . . . . . . . . . . . . . . . . . . . . . . . . . . . . . . . . . . . . . . . . . . . . . . . . . . . . . . . 12,609,468
2020 Non-cash items including amortization . . . . . . . . . . . . . . . . . . . . . . . . . . . . . . . . . . . . . . . . . . . . . . . . . . . . . . . . . . . . . . . . . . . . . . . . . . . . . . . . . . . . . . . . . . . . . . . . . . 34,361,347
2021 Contributed (Donated) tangible capital assets . . . . . . . . . . . . . . . . . . . . . . . . . . . . . . . . . . . . . . . . . . . . . . . . . . . . . . . . . . . . . . . . . . . . . . . . . . . . . . . . . . . . . . . . . . . . . . . . . .-1,316,950
2022 Change in non-cash assets and liabilities . . . . . . . . . . . . . . . . . . . . . . . . . . . . . . . . . . . . . . . . . . . . . . . . . . . . . . . . . . . . . . . . . . . . . . . . . . . . . . . . . . . . . . . . . . . . . . . . . .-12,472,345
2030 Prepaid expenses . . . . . . . . . . . . . . . . . . . . . . . . . . . . . . . . . . . . . . . . . . . . . . . . . . . . . . . . . . . . . . . . . . . . . . . . . . . . . . . . . . . . . . . . . . . . . . . . . . 857,073
2040 Change in deferred revenue . . . . . . . . . . . . . . . . . . . . . . . . . . . . . . . . . . . . . . . . . . . . . . . . . . . . . . . . . . . . . . . . . . . . . . . . . . . . . . . . . . . . . . . . . . . . . . . . . . 9,617,478
2096 Other Change in receivables . . . . . . . . . . . . . . . . . . . . . . . . . . . . . . . . . . . . . . . . . . . . . . . . . . . . . . . . . . . . . . . . . . . . . . . . . . . . . . -2,102,335
2097 Other Change in payables . . . . . . . . . . . . . . . . . . . . . . . . . . . . . . . . . . . . . . . . . . . . . . . . . . . . . . . . . . . . . . . . . . . . . . . . . . . . . . 5,201,350
2098 Other Change in inventory . . . . . . . . . . . . . . . . . . . . . . . . . . . . . . . . . . . . . . . . . . . . . . . . . . . . . . . . . . . . . . . . . . . . . . . . . . . . . . 1,430,368
2099 Cash provided by operating transactions 48,185,454
Capital Transactions
0610 Proceeds on sale of tangible capital assets . . . . . . . . . . . . . . . . . . . . . . . . . . . . . . . . . . . . . . . . . . . . . . . . . . . . . . . . . . . . . . . . . . . . . . . . . . . . . . . . . . . . . . . . . . . . . . . . . . 179,342
0620 Cash used to acquire tangible capital assets . . . . . . . . . . . . . . . . . . . . . . . . . . . . . . . . . . . . . . . . . . . . . . . . . . . . . . . . . . . . . . . . . . . . . . . . . . . . . . . . . . . . . . . . . . . . . . . . . . -33,919,938
0630 Change in construction-in-progress . . . . . . . . . . . . . . . . . . . . . . . . . . . . . . . . . . . . . . . . . . . . . . . . . . . . . . . . . . . . . . . . . . . . . . . . . . . . . . . . . . . . . . . . . . . . . . . . . .-457,505
0698 Other . . . . . . . . . . . . . . . . . . . . . . . . . . . . . . . . . . . . . . . . . . . . . . . . . . . . . . . . . . . . . . . . . . . . . . . . . . . . . . 0
0699 Cash applied to capital transactions -34,198,101
Investing Transactions
0810 Proceeds from portfolio investments . . . . . . . . . . . . . . . . . . . . . . . . . . . . . . . . . . . . . . . . . . . . . . . . . . . . . . . . . . . . . . . . . . . . . . . . . . . . . . . . . . . . . . . . . . . . . . . . . . -13,058,110
0820 Portfolio investments . . . . . . . . . . . . . . . . . . . . . . . . . . . . . . . . . . . . . . . . . . . . . . . . . . . . . . . . . . . . . . . . . . . . . . . . . . . . . . . . . . . . . . . . . . . . . . . . . . 0
0898 Other Investment in GBE . . . . . . . . . . . . . . . . . . . . . . . . . . . . . . . . . . . . . . . . . . . . . . . . . . . . . . . . . . . . . . . . . . . . . . . . . . . . . . -2,040,492
0899 Cash provided by / (applied to) investing transactions -15,098,602
Financing Transactions
1010 Proceeds from long term debt issues . . . . . . . . . . . . . . . . . . . . . . . . . . . . . . . . . . . . . . . . . . . . . . . . . . . . . . . . . . . . . . . . . . . . . . . . . . . . . . . . . . . . . . . . . . . . . . . . . . 9,332,000
1020 Principal long term debt repayment . . . . . . . . . . . . . . . . . . . . . . . . . . . . . . . . . . . . . . . . . . . . . . . . . . . . . . . . . . . . . . . . . . . . . . . . . . . . . . . . . . . . . . . . . . . . . . . . . . -3,413,331
1030 Temporary loans . . . . . . . . . . . . . . . . . . . . . . . . . . . . . . . . . . . . . . . . . . . . . . . . . . . . . . . . . . . . . . . . . . . . . . . . . . . . . . . . . . . . . . . . . . . . . . . . . .0
1031 Repayment of temporary loans . . . . . . . . . . . . . . . . . . . . . . . . . . . . . . . . . . . . . . . . . . . . . . . . . . . . . . . . . . . . . . . . . . . . . . . . . . . . . . . . . . . . . . . . . . . . . . . . . .0
1096 Other Inventories held for resale . . . . . . . . . . . . . . . . . . . . . . . . . . . . . . . . . . . . . . . . . . . . . . . . . . . . . . . . . . . . . . . . . . . . . . . . . . . . . . -1,137,067
1097 Other . . . . . . . . . . . . . . . . . . . . . . . . . . . . . . . . . . . . . . . . . . . . . . . . . . . . . . . . . . . . . . . . . . . . . . . . . . . . . . 0
1098 Other . . . . . . . . . . . . . . . . . . . . . . . . . . . . . . . . . . . . . . . . . . . . . . . . . . . . . . . . . . . . . . . . . . . . . . . . . . . . . . 0
1099 Cash applied to financing transactions 4,781,602
1210 Increase in cash and cash equivalents . . . . . . . . . . . . . . . . . . . . . . . . . . . . . . . . . . . . . . . . . . . . . . . . . . . . . . . . . . . . . . . . . . . . . . . . . . . . . . . . . . . . . . . . . . . . . . . . . . 3,670,353
1220 Cash and cash equivalents, beginning of year . . . . . . . . . . . . . . . . . . . . . . . . . . . . . . . . . . . . . . . . . . . . . . . . . . . . . . . . . . . . . . . . . . . . . . . . . . . . . . . . . . . . . . . . . . . . . . . . . . 26,731,519
9920 Cash and cash equivalents, end of year . . . . . . . . . . . . . . . . . . . . . . . . . . . . . . . . . . . . . . . . . . . . . . . . . . . . . . . . . . . . . . . . . . . . . . . . . . . . . . . . . . . . . . . . . . . . . . . . . . 30,401,872
2015
Actual
1
Cash and cash equivalents represented by: $
1401 Cash . . . . . . . . . . . . . . . . . . . . . . . . . . . . . . . . . . . . . . . . . . . . . . . . . . . . . . . . . . . . . . . . . . . . . . . . . . . . . . . . . . . . . . . . . . . . . . . . . .30,401,872
1402 Temporary borrowings . . . . . . . . . . . . . . . . . . . . . . . . . . . . . . . . . . . . . . . . . . . . . . . . . . . . . . . . . . . . . . . . . . . . . . . . . . . . . . . . . . . . . . . . . . . . . . . . . .0
1403 Short term investments . . . . . . . . . . . . . . . . . . . . . . . . . . . . . . . . . . . . . . . . . . . . . . . . . . . . . . . . . . . . . . . . . . . . . . . . . . . . . . . . . . . . . . . . . . . . . . . . . .0
1404 Other . . . . . . . . . . . . . . . . . . . . . . . . . . . . . . . . . . . . . . . . . . . . . . . . . . . . . . . . . . . . . . . . . . . . . . . . . . . . . .0
9940 Cash and cash equivalents, end of year . . . . . . . . . . . . . . . . . . . . . . . . . . . . . . . . . . . . . . . . . . . . . . . . . . . . . . . . . . . . . . . . . . . . . . . . . . . . . . . . . . . . . . . . . . . . . . . . . .30,401,872
1
Cash: $
1501 Unrestricted . . . . . . . . . . . . . . . . . . . . . . . . . . . . . . . . . . . . . . . . . . . . . . . . . . . . . . . . . . . . . . . . . . . . . . . . . . . . . . . . . . . . . . . . . . . . . . . . . .30,401,872
1502 Restricted . . . . . . . . . . . . . . . . . . . . . . . . . . . . . . . . . . . . . . . . . . . . . . . . . . . . . . . . . . . . . . . . . . . . . . . . . . . . . . . . . . . . . . . . . . . . . . . . . .
1503 Unallocated . . . . . . . . . . . . . . . . . . . . . . . . . . . . . . . . . . . . . . . . . . . . . . . . . . . . . . . . . . . . . . . . . . . . . . . . . . . . . . . . . . . . . . . . . . . . . . . . . .
9950 Cash and cash equivalents, end of year . . . . . . . . . . . . . . . . . . . . . . . . . . . . . . . . . . . . . . . . . . . . . . . . . . . . . . . . . . . . . . . . . . . . . . . . . . . . . . . . . . . . . . . . . . . . . . . . . .30,401,872
Page 169
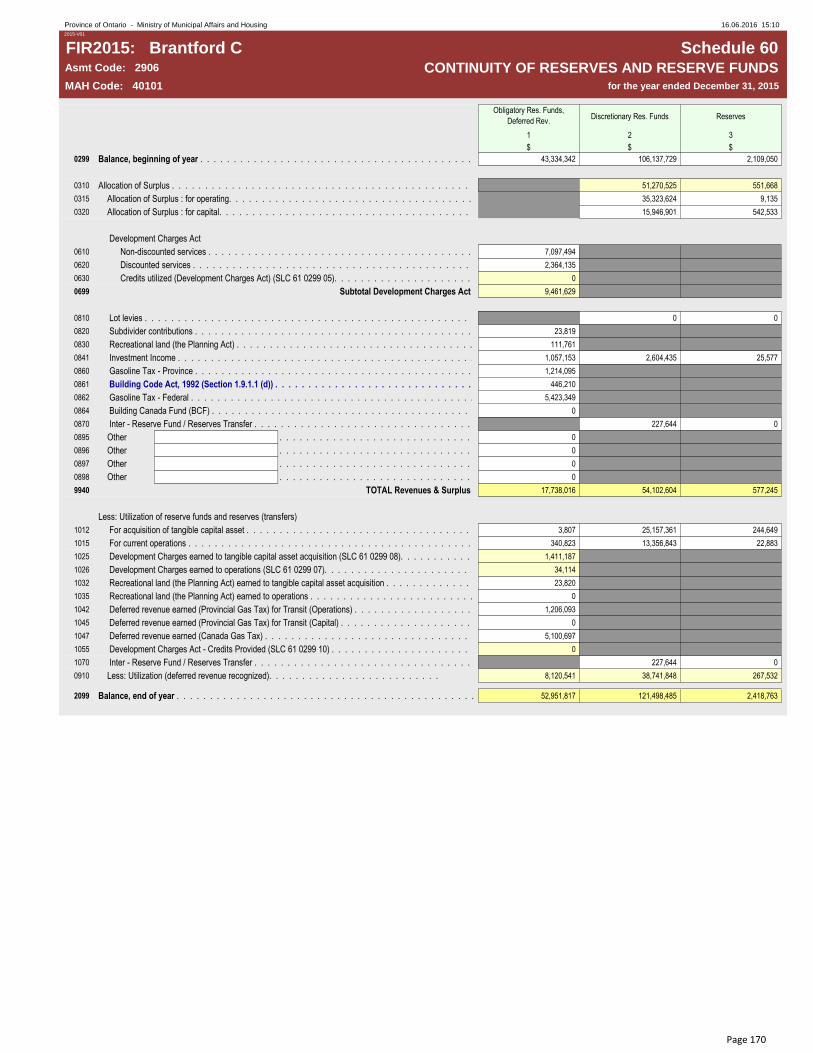
2015 Financial Information Return - Schedule 60 - Continuity of Reserves and Reserve FundsProvince of Ontario - Ministry of Municipal Affairs and Housing 16.06.2016 15:10
2015-V01
FIR2015: Brantford C Schedule 60Asmt Code: 2906 CONTINUITY OF RESERVES AND RESERVE FUNDS
MAH Code: 40101 for the year ended December 31, 2015
Obligatory Res. Funds,
Deferred Rev.Discretionary Res. Funds Reserves
1 2 3
$ $ $
0299 Balance, beginning of year . . . . . . . . . . . . . . . . . . . . . . . . . . . . . . . . . . . . . . . . . . . . . . . . . . . . . . . . . . . . . . . . . . . . . . . . . . . . . . . . . . . . . . . . . . . . . . . . . . 43,334,342 106,137,729 2,109,050
0310 Allocation of Surplus . . . . . . . . . . . . . . . . . . . . . . . . . . . . . . . . . . . . . . . . . . . . . . . . . . . . . . . . . . . . . . . . . . . . . . . . . . . . . . . . . . . . . . . . . . . . . . . . . . 51,270,525 551,668
0315 Allocation of Surplus : for operating. . . . . . . . . . . . . . . . . . . . . . . . . . . . . . . . . . . . . . . . . . . . . . . . . . . . . . . . . . . . . . . . . . . . . . . . . . . . . . . . . . . . . . . . . . . . . . . . . . 35,323,624 9,135
0320 Allocation of Surplus : for capital. . . . . . . . . . . . . . . . . . . . . . . . . . . . . . . . . . . . . . . . . . . . . . . . . . . . . . . . . . . . . . . . . . . . . . . . . . . . . . . . . . . . . . . . . . . . . . . . . . 15,946,901 542,533
Development Charges Act
0610 Non-discounted services . . . . . . . . . . . . . . . . . . . . . . . . . . . . . . . . . . . . . . . . . . . . . . . . . . . . . . . . . . . . . . . . . . . . . . . . . . . . . . . . . . . . . . . . . . . . . . . . . . 7,097,494
0620 Discounted services . . . . . . . . . . . . . . . . . . . . . . . . . . . . . . . . . . . . . . . . . . . . . . . . . . . . . . . . . . . . . . . . . . . . . . . . . . . . . . . . . . . . . . . . . . . . . . . . . . 2,364,135
0630 Credits utilized (Development Charges Act) (SLC 61 0299 05). . . . . . . . . . . . . . . . . . . . . . . . . . . . . . . . . . . . . . . . . . . . . . . . . . . . . . . . . . . . . . . . . . . . . . . . . . . . . . . . . . . . . . . . . . . . . . . . . . 0
0699 Subtotal Development Charges Act 9,461,629
0810 Lot levies . . . . . . . . . . . . . . . . . . . . . . . . . . . . . . . . . . . . . . . . . . . . . . . . . . . . . . . . . . . . . . . . . . . . . . . . . . . . . . . . . . . . . . . . . . . . . . . . . . 0 0
0820 Subdivider contributions . . . . . . . . . . . . . . . . . . . . . . . . . . . . . . . . . . . . . . . . . . . . . . . . . . . . . . . . . . . . . . . . . . . . . . . . . . . . . . . . . . . . . . . . . . . . . . . . . . 23,819
0830 Recreational land (the Planning Act) . . . . . . . . . . . . . . . . . . . . . . . . . . . . . . . . . . . . . . . . . . . . . . . . . . . . . . . . . . . . . . . . . . . . . . . . . . . . . . . . . . . . . . . . . . . . . . . . . . 111,761
0841 Investment Income . . . . . . . . . . . . . . . . . . . . . . . . . . . . . . . . . . . . . . . . . . . . . . . . . . . . . . . . . . . . . . . . . . . . . . . . . . . . . . . . . . . . . . . . . . . . . . . . . . 1,057,153 2,604,435 25,577
0860 Gasoline Tax - Province . . . . . . . . . . . . . . . . . . . . . . . . . . . . . . . . . . . . . . . . . . . . 1,214,095
0861 Building Code Act, 1992 (Section 1.9.1.1 (d)) . . . . . . . . . . . . . . . . . . . . . . . . . . . . . . . . . . . . . . . . . . . . . . . . . . . . . . . . . . . . . . . . . . . . . . . . . . . . . . . . . . . . . . . . . . . . . . . . . . 446,210
0862 Gasoline Tax - Federal . . . . . . . . . . . . . . . . . . . . . . . . . . . . . . . . . . . . . . . . . . . . . . . . . . . . . . . . . . . . . . . . . . . . . . . . . . . . . . . . . . . . . . . . . . . . . . . . . . 5,423,349
0864 Building Canada Fund (BCF) . . . . . . . . . . . . . . . . . . . . . . . . . . . . . . . . . . . . . . . . . . . . . . . . . . . . . . . . . . . . . . . . . . . . . . . . . . . . . . . . . . . . . . . . . . . . . . . . . . 0
0870 Inter - Reserve Fund / Reserves Transfer . . . . . . . . . . . . . . . . . . . . . . . . . . . . . . . . . . . . . . . . . . . . . . . . . . . . . . . . . . . . . . . . . . . . . . . . . . . . . . . . . . . . . . . . . . . . . . . . . . 227,644 0
0895 Other . . . . . . . . . . . . . . . . . . . . . . . . . . . . . . . . . . . . . . . . . . . . . . . . . . . . . . . . . . . . . . . . . . . . . . . . . . . . . . 0
0896 Other . . . . . . . . . . . . . . . . . . . . . . . . . . . . . . . . . . . . . . . . . . . . . . . . . . . . . . . . . . . . . . . . . . . . . . . . . . . . . . 0
0897 Other . . . . . . . . . . . . . . . . . . . . . . . . . . . . . . . . . . . . . . . . . . . . . . . . . . . . . . . . . . . . . . . . . . . . . . . . . . . . . . 0
0898 Other . . . . . . . . . . . . . . . . . . . . . . . . . . . . . . . . . . . . . . . . . . . . . . . . . . . . . . . . . . . . . . . . . . . . . . . . . . . . . . 0
9940 TOTAL Revenues & Surplus 17,738,016 54,102,604 577,245
Less: Transfers (Utilization of reserve funds and reserves)Less: Utilization of reserve funds and reserves (transfers)
1012 For acquisition of tangible capital asset . . . . . . . . . . . . . . . . . . . . . . . . . . . . . . . . . . . . . . . . . . . . . . . . . . . . . . . . . . . . . . . . . . . . . . . . . . . . . . . . . . . . . . . . . . . . . . . . . .3,807 25,157,361 244,649
1015 For current operations . . . . . . . . . . . . . . . . . . . . . . . . . . . . . . . . . . . . . . . . . . . . . . . . . . . . . . . . . . . . . . . . . . . . . . . . . . . . . . . . . . . . . . . . . . . . . . . . . .340,823 13,356,843 22,883
1025 Development Charges earned to tangible capital asset acquisition (SLC 61 0299 08). . . . . . . . . . . . . . . . . . . . . . . . . . . . . . . . . . . . . . . . . . . . . . . . . . . . . . . . . . . . . . . . . . . . . . . . . . . . . . . . . . . . . . . . . . . . . . . . . .1,411,187
1026 Development Charges earned to operations (SLC 61 0299 07). . . . . . . . . . . . . . . . . . . . . . . . . . . . . . . . . . . . . . . . . . . . . . . . . . . . . . . . . . . . . . . . . . . . . . . . . . . . . . . . . . . . . . . . . . . . . . . . . .34,114
1032 Recreational land (the Planning Act) earned to tangible capital asset acquisition . . . . . . . . . . . . . . . . . . . . . . . . . . . . . . . . . . . . . . . . . . . . . . . . . . . . . . . . . . . . . . . . . . . . . . . . . . . . . . . . . . . . . . . . . . . . . . . . . .23,820
1035 Recreational land (the Planning Act) earned to operations . . . . . . . . . . . . . . . . . . . . . . . . . . . . . . . . . . . . . . . . . . . . . . . . . . . . . . . . . . . . . . . . . . . . . . . . . . . . . . . . . . . . . . . . . . . . . . . . . .0
1042 Deferred revenue earned (Provincial Gas Tax) for Transit (Operations) . . . . . . . . . . . . . . . . . . . . . . . . . . . . . . . . . . . . . . . . . . . . . . . . . . . . . . . . . . . . . . . . . . . . . . . . . . . . . . . . . . . . . . . . . . . . . . . . . .1,206,093
1045 Deferred revenue earned (Provincial Gas Tax) for Transit (Capital) . . . . . . . . . . . . . . . . . . . . . . . . . . . . . . . . . . . . . . . . . . . . . . . . . . . . . . . . . . . . . . . . . . . . . . . . . . . . . . . . . . . . . . . . . . . . . . . . . .0
1047 Deferred revenue earned (Canada Gas Tax) . . . . . . . . . . . . . . . . . . . . . . . . . . . . . . . . . . . . . . . . . . . . . . . . . . . . . . . . . . . . . . . . . . . . . . . . . . . . . . . . . . . . . . . . . . . . . . . . . .5,100,697
1055 Development Charges Act - Credits Provided (SLC 61 0299 10) . . . . . . . . . . . . . . . . . . . . . . . . . . . . . . . . . . . . . . . . . . . . . . . . . . . . . . . . . . . . . . . . . . . . . . . . . . . . . . . . . . . . . . . . . . . . . . . . . .0
1070 Inter - Reserve Fund / Reserves Transfer . . . . . . . . . . . . . . . . . . . . . . . . . . . . . . . . . . . . . . . . . . . . . . . . . . . . . . . . . . . . . . . . . . . . . . . . . . . . . . . . . . . . . . . . . . . . . . . . . .227,644 0
0910 Less: Utilization (deferred revenue recognized). . . . . . . . . . . . . . . . . . . . . . . . . . 8,120,541 38,741,848 267,532
2099 Balance, end of year . . . . . . . . . . . . . . . . . . . . . . . . . . . . . . . . . . . . . . . . . . . . . . . . . . . . . . . . . . . . . . . . . . . . . . . . . . . . . . . . . . . . . . . . . . . . . . . . . .52,951,817 121,498,485 2,418,763
Page 170

2015 Financial Information Return - Schedule 60 - Continuity of Reserves and Reserve FundsProvince of Ontario - Ministry of Municipal Affairs and Housing 16.06.2016 15:10
2015-V01
FIR2015: Brantford C Schedule 60Asmt Code: 2906 CONTINUITY OF RESERVES AND RESERVE FUNDS
MAH Code: 40101 for the year ended December 31, 2015
Obligatory Res. Funds,
Deferred Rev.Discretionary Res. Funds Reserves
Totals in line 2099 are analysed as follows: 1 2 3
$ $ $
5010 Working funds . . . . . . . . . . . . . . . . . . . . . . . . . . . . . . . . . . . . . . . . . . . . . . . . . . . . . . . . . . . . . . . . . . . . . . . . . . . . . . . . . . . . . . . . . . . . . . . . . 0 0
5020 Contingencies . . . . . . . . . . . . . . . . . . . . . . . . . . . . . . . . . . . . . . . . . . . . . . . . . . . . . . . . . . . . . . . . . . . . . . . . . . . . . . . . . . . . . . . . . . . . . . . . . .2,395,150 0
Asset Replacement funds for: Sewer & Water
5030 Sewer . . . . . . . . . . . . . . . . . . . . . . . . . . . . . . . . . . . . . . . . . . . . . . . . . . . . . . . . . . . . . . . . . . . . . . . . . . . . . . . . . . . . . . . . . . . . . . . . . .0 0
5040 Water . . . . . . . . . . . . . . . . . . . . . . . . . . . . . . . . . . . . . . . . . . . . . . . . . . . . . . . . . . . . . . . . . . . . . . . . . . . . . . . . . . . . . . . . . . . . . . . . . .0 0
5050 Replacement of equipment . . . . . . . . . . . . . . . . . . . . . . . . . . . . . . . . . . . . . . . . . . . . . . . . . . . . . . . . . . . . . . . . . . . . . . . . . . . . . . . . . . . . . . . . . . . . . . . . . .1,477,201 0
5060 Sick leave . . . . . . . . . . . . . . . . . . . . . . . . . . . . . . . . . . . . . . . . . . . . . . . . . . . . . . . . . . . . . . . . . . . . . . . . . . . . . . . . . . . . . . . . . . . . . . . . . .3,619,111 180,449
5070 Insurance . . . . . . . . . . . . . . . . . . . . . . . . . . . . . . . . . . . . . . . . . . . . . . . . . . . . . . . . . . . . . . . . . . . . . . . . . . . . . . . . . . . . . . . . . . . . . . . . . .2,933,092 0
5080 Workplace Safety and Insurance Board (WSIB) . . . . . . . . . . . . . . . . . . . . . . . . . . . . . . . . . . . . . . . . . . . . . . . . . . . . . . . . . . . . . . . . . . . . . . . . . . . . . . . . . . . . . . . . . . . . . . . . . .0 0
5090 Post-employment benefits . . . . . . . . . . . . . . . . . . . . . . . . . . . . . . . . . . . . . . . . . . . . . . . . . . . . . . . . . . . . . . . . . . . . . . . . . . . . . . . . . . . . . . . . . . . . . . . . . .0 0
5091 Tax rate stabilization . . . . . . . . . . . . . . . . . . . . . . . . . . . . . . . . . . . . . . . . . . . . . . . . . . . . . . . . . . . . . . . . . . . . . . . . . . . . . . . . . . . . . . . . . . . . . . . . . .0 0
5630 Lot levies . . . . . . . . . . . . . . . . . . . . . . . . . . . . . . . . . . . . . . . . . . . . . . . . . . . . . . . . . . . . . . . . . . . . . . . . . . . . . . . . . . . . . . . . . . . . . . . . . .0 0
5660 Parking revenues . . . . . . . . . . . . . . . . . . . . . . . . . . . . . . . . . . . . . . . . . . . . . . . . . . . . . . . . . . . . . . . . . . . . . . . . . . . . . . . . . . . . . . . . . . . . . . . . . .42,877 0
5670 Debenture repayment . . . . . . . . . . . . . . . . . . . . . . . . . . . . . . . . . . . . . . . . . . . . . . . . . . . . . . . . . . . . . . . . . . . . . . . . . . . . . . . . . . . . . . . . . . . . . . . . . .0 0
5680 Exchange rate stabilization . . . . . . . . . . . . . . . . . . . . . . . . . . . . . . . . . . . . . . . . . . . . . . . . . . . . . . . . . . . . . . . . . . . . . . . . . . . . . . . . . . . . . . . . . . . . . . . . . .0 0
Per Service Purpose:
5205 General government . . . . . . . . . . . . . . . . . . . . . . . . . . . . . . . . . . . . . . . . . . . . . . . . . . . . . . . . . . . . . . . . . . . . . . . . . . . . . . . . . . . . . . . . . . . . . . . . . . . . . . . . . . . . . . . . . . . . . . . . . . . . . . . . . . . . . . . .1,829,671 0
5210 Protection services . . . . . . . . . . . . . . . . . . . . . . . . . . . . . . . . . . . . . . . . . . . . . . . . . . . . . . . . . . . . . . . . . . . . . . . . . . . . . . . . . . . . . . . . . . . . . . . . . . . . . . . . . . . . . . . . . . . . . . . . . . . . . . . . . . . . . . . .2,420,067 0
Transportation services:
5215 Roadways . . . . . . . . . . . . . . . . . . . . . . . . . . . . . . . . . . . . . . . . . . . . . . . . . . . . . . . . . . . . . . . . . . . . . . . . . . . . . . . . . . . . . . . . . . . . . . . . . . . . . . . . . . . . . . . . . . . . . . . . . . . . . . . . . . . . . . . .5,324,977 0
5216 Winter Control . . . . . . . . . . . . . . . . . . . . . . . . . . . . . . . . . . . . . . . . . . . . . . . . . . . . . . . . . . . . . . . . . . . . . . . . . . . . . . . . . . . . . . . . . . . . . . . . . . . . . . . . . . . . . . . . . . . . . . . . . . . . . . . . . . . . . . . .0 0
5220 Transit . . . . . . . . . . . . . . . . . . . . . . . . . . . . . . . . . . . . . . . . . . . . . . . . . . . . . . . . . . . . . . . . . . . . . . . . . . . . . . . . . . . . . . . . . . . . . . . . . . . . . . . . . . . . . . . . . . . . . . . . . . . . . . . . . . . . . . . .766,041 0
5221 Parking . . . . . . . . . . . . . . . . . . . . . . . . . . . . . . . . . . . . . . . . . . . . . . . . . . . . . . . . . . . . . . . . . . . . . . . . . . . . . . . . . . . . . . . . . . . . . . . . . . . . . . . . . . . . . . . . . . . . . . . . . . . . . . . . . . . . . . . .0 0
5222 Street lighting . . . . . . . . . . . . . . . . . . . . . . . . . . . . . . . . . . . . . . . . . . . . . . . . . . . . . . . . . . . . . . . . . . . . . . . . . . . . . . . . . . . . . . . . . . . . . . . . . . . . . . . . . . . . . . . . . . . . . . . . . . . . . . . . . . . . . . . .0 0
5223 Air transportation . . . . . . . . . . . . . . . . . . . . . . . . . . . . . . . . . . . . . . . . . . . . . . . . . . . . . . . . . . . . . . . . . . . . . . . . . . . . . . . . . . . . . . . . . . . . . . . . . . . . . . . . . . . . . . . . . . . . . . . . . . . . . . . . . . . . . . . .825,773 0
Environmental services:
5225 Wastewater system . . . . . . . . . . . . . . . . . . . . . . . . . . . . . . . . . . . . . . . . . . . . . . . . . . . . . . . . . . . . . . . . . . . . . . . . . . . . . . . . . . . . . . . . . . . . . . . . . . . . . . . . . . . . . . . . . . . . . . . . . . . . . . . . . . . . . . . .33,732,003 0
5230 Storm water system . . . . . . . . . . . . . . . . . . . . . . . . . . . . . . . . . . . . . . . . . . . . . . . . . . . . . . . . . . . . . . . . . . . . . . . . . . . . . . . . . . . . . . . . . . . . . . . . . . . . . . . . . . . . . . . . . . . . . . . . . . . . . . . . . . . . . . . .89,726 0
5235 Waterworks system . . . . . . . . . . . . . . . . . . . . . . . . . . . . . . . . . . . . . . . . . . . . . . . . . . . . . . . . . . . . . . . . . . . . . . . . . . . . . . . . . . . . . . . . . . . . . . . . . . . . . . . . . . . . . . . . . . . . . . . . . . . . . . . . . . . . . . . .35,828,680 0
5240 Solid waste collection . . . . . . . . . . . . . . . . . . . . . . . . . . . . . . . . . . . . . . . . . . . . . . . . . . . . . . . . . . . . . . . . . . . . . . . . . . . . . . . . . . . . . . . . . . . . . . . . . . . . . . . . . . . . . . . . . . . . . . . . . . . . . . . . . . . . . . . .0 0
5245 Solid waste disposal . . . . . . . . . . . . . . . . . . . . . . . . . . . . . . . . . . . . . . . . . . . . . . . . . . . . . . . . . . . . . . . . . . . . . . . . . . . . . . . . . . . . . . . . . . . . . . . . . . . . . . . . . . . . . . . . . . . . . . . . . . . . . . . . . . . . . . . .2,140,157 0
5246 Waste diversion . . . . . . . . . . . . . . . . . . . . . . . . . . . . . . . . . . . . . . . . . . . . . . . . . . . . . . . . . . . . . . . . . . . . . . . . . . . . . . . . . . . . . . . . . . . . . . . . . . . . . . . . . . . . . . . . . . . . . . . . . . . . . . . . . . . . . . . .0 0
5250 Health services . . . . . . . . . . . . . . . . . . . . . . . . . . . . . . . . . . . . . . . . . . . . . . . . . . . . . . . . . . . . . . . . . . . . . . . . . . . . . . . . . . . . . . . . . . . . . . . . . . . . . . . . . . . . . . . . . . . . . . . . . . . . . . . . . . . . . . . .0 0
5255 Social and family services . . . . . . . . . . . . . . . . . . . . . . . . . . . . . . . . . . . . . . . . . . . . . . . . . . . . . . . . . . . . . . . . . . . . . . . . . . . . . . . . . . . . . . . . . . . . . . . . . . . . . . . . . . . . . . . . . . . . . . . . . . . . . . . . . . . . . . . .330,988 0
5260 Social housing . . . . . . . . . . . . . . . . . . . . . . . . . . . . . . . . . . . . . . . . . . . . . . . . . . . . . . . . . . . . . . . . . . . . . . . . . . . . 6,772,178 0
Recreation and cultural services:
5265 Parks . . . . . . . . . . . . . . . . . . . . . . . . . . . . . . . . . . . . . . . . . . . . . . . . . . . . . . . . . . . . . . . . . . . . . . . . . . . . . . . . . . . . . . . . . . . . . . . . . . . . . . . . . . . . . . . . . . . . . . . . . . . . . . . . . . . . . . . .0 0
5266 Recreation programs . . . . . . . . . . . . . . . . . . . . . . . . . . . . . . . . . . . . . . . . . . . . . . . . . . . . . . . . . . . . . . . . . . . . . . . . . . . . . . . . . . . . . . . . . . . . . . . . . . . . . . . . . . . . . . . . . . . . . . . . . . . . . . . . . . . . . . . .0 0
5271 Recreation facilities - Golf Course, Marina, Ski Hill . . . . . . . . . . . . . . . . . . . . . . . . . . . . . . . . . . . . . . . . . . . . . . . . . . . . . . . . . . . . . . . . . . . . . . . . . . . . . . . . . . . . . . . . . . . . . . . . . .109 0
5274 Recreation facilities - All Other . . . . . . . . . . . . . . . . . . . . . . . . . . . . . . . . . . . . . . . . . . . . . . . . . . . . . . . . . . . . . . . . . . . . . . . . . . . . . . . . . . . . . . . . . . . . . . . . . .367,168 0
5275 Libraries . . . . . . . . . . . . . . . . . . . . . . . . . . . . . . . . . . . . . . . . . . . . . . . . . . . . . . . . . . . . . . . . . . . . . . . . . . . . . . . . . . . . . . . . . . . . . . . . . . . . . . . . . . . . . . . . . . . . . . . . . . . . . . . . . . . . . . . .0 2,238,314
5276 Museums . . . . . . . . . . . . . . . . . . . . . . . . . . . . . . . . . . . . . . . . . . . . . . . . . . . . . . . . . . . . . . . . . . . . . . . . . . . . . . . . . . . . . . . . . . . . . . . . . . . . . . . . . . . . . . . . . . . . . . . . . . . . . . . . . . . . . . . .0 0
5277 Cultural services . . . . . . . . . . . . . . . . . . . . . . . . . . . . . . . . . . . . . . . . . . . . . . . . . . . . . . . . . . . . . . . . . . . . . . . . . . . . . . . . . . . . . . . . . . . . . . . . . . . . . . . . . . . . . . . . . . . . . . . . . . . . . . . . . . . . . . . .297,090 0
5280 Planning and development . . . . . . . . . . . . . . . . . . . . . . . . . . . . . . . . . . . . . . . . . . . . . . . . . . . . . . . . . . . . . . . . . . . . . . . . . . . . 7,873,728 0
5290 Other Other Corporate Financing . . . . . . . . . . . . . . . . . . . . . . . . . . . . . . . . . . . . . . . . . . . . . . . . . . . . . . . . . . . . . . . . . . . . . . . . . . . . . .12,432,698 0
Obligatory Deferred Revenue:
5610 Development Charges Act - Non-discounted services . . . . . . . . . . . . . . . . . . . . . . . . . . . . . . . . . . . . . . . . . . . . . . . . . . . . . . . . . . . . . . . . . . . . . . . . . . . . . . . . . . . . . . . . . . . . . . . . . . 25,068,763
5620 Development Charges Act - Discounted services . . . . . . . . . . . . . . . . . . . . . . . . . . . . . . . . . . . . . . . . . . . . . . . . . . . . . . . . . . . . . . . . . . . . . . . . . . . . . . . . . . . . . . . . . . . . . . . . . . 11,138,982
5640 Subdivider contributions . . . . . . . . . . . . . . . . . . . . . . . . . . . . . . . . . . . . . . . . . . . . . . . . . . . . . . . . . . . . . . . . . . . . . . . . . . . . . . . . . . . . . . . . . . . . . . . . . . 2,161,212
5650 Recreational land (the Planning Act) . . . . . . . . . . . . . . . . . . . . . . . . . . . . . . . . . . . . . . . . . . . . . . . . . . . . . . . . . . . . . . . . . . . . . . . . . . . . . . . . . . . . . . . . . . . . . . . . . . 536,710
5661 Building Code Act, 1992 (Section 1.9.1.1 (d)) . . . . . . . . . . . . . . . . . . . . . . . . . . . . . . . . . . . . . . . . . . . . . . . . . . . . . . . . . . . . . . . . . . . . . . . . . . . . . . . . . . . . . . . . . . . . . . . . . . . . . . . 3,305,684
5690 Gasoline Tax - Province . . . . . . . . . . . . . . . . . . . . . . . . . . . . . . . . . . . . . . . . . . . . . . . . . . . . . . . . . . . . . . . . . . . . . . . . . . . . . . . . . . . . . . . . . . . . . . . . . . 2,933,151
5691 Gasoline Tax - Federal . . . . . . . . . . . . . . . . . . . . . . . . . . . . . . . . . . . . . . . . . . . . . . . . . . . . . . . . . . . . . . . . . . . . . . . . . . . . . . . . . . . . . . . . . . . . . . . . . . 7,754,933
5692 Canada Transit Funding (Bill C-48) . . . . . . . . . . . . . . . . . . . . . . . . . . . . . . . . . . . . . . . . . . . . . . . . . . . . . . . . . . . . . . . . . . . . . . . . . . . . . . . . . . . . . . . . . . . . . . . . . . 0
5693 Building Canada Fund (BCF) . . . . . . . . . . . . . . . . . . . . . . . . . . . . . . . . . . . . . . . . . . . . . . . . . . . . . . . . . . . . . . . . . . . . . . . . . . . . . . . . . . . . . . . . . . . . . . . . . . 0
5695 Other . . . . . . . . . . . . . . . . . . . . . . . . . . . . . . . . . . . . . . . . . . . . . . . . . . . . . . . . . . . . . . . . . . . . . . . . . . . . . . 0
5696 Other . . . . . . . . . . . . . . . . . . . . . . . . . . . . . . . . . . . . . . . . . . . . . . . . . . . . . . . . . . . . . . . . . . . . . . . . . . . . . . 0
5697 Other Roads, Bridges, & Bus Prgms . . . . . . . . . . . . . . . . . . . . . . . . . . . . . . . . . . . . . . . . . . . . . . . . . . . . . . . . . . . . . . . . . . . . . . . . . . . . . . 31,208
5698 Other B-Home Program . . . . . . . . . . . . . . . . . . . . . . . . . . . . . . . . . . . . . . . . . . . . . . . . . . . . . . . . . . . . . . . . . . . . . . . . . . . . . . 21,174
5699 Other . . . . . . . . . . . . . . . . . . . . . . . . . . . . . . . . . . . . . . . . . . . . . . . . . . . . . . . . . . . . . . . . . . . . . . . . . . . . . . 0
9930 TOTAL 52,951,817 121,498,485 2,418,763
Page 171
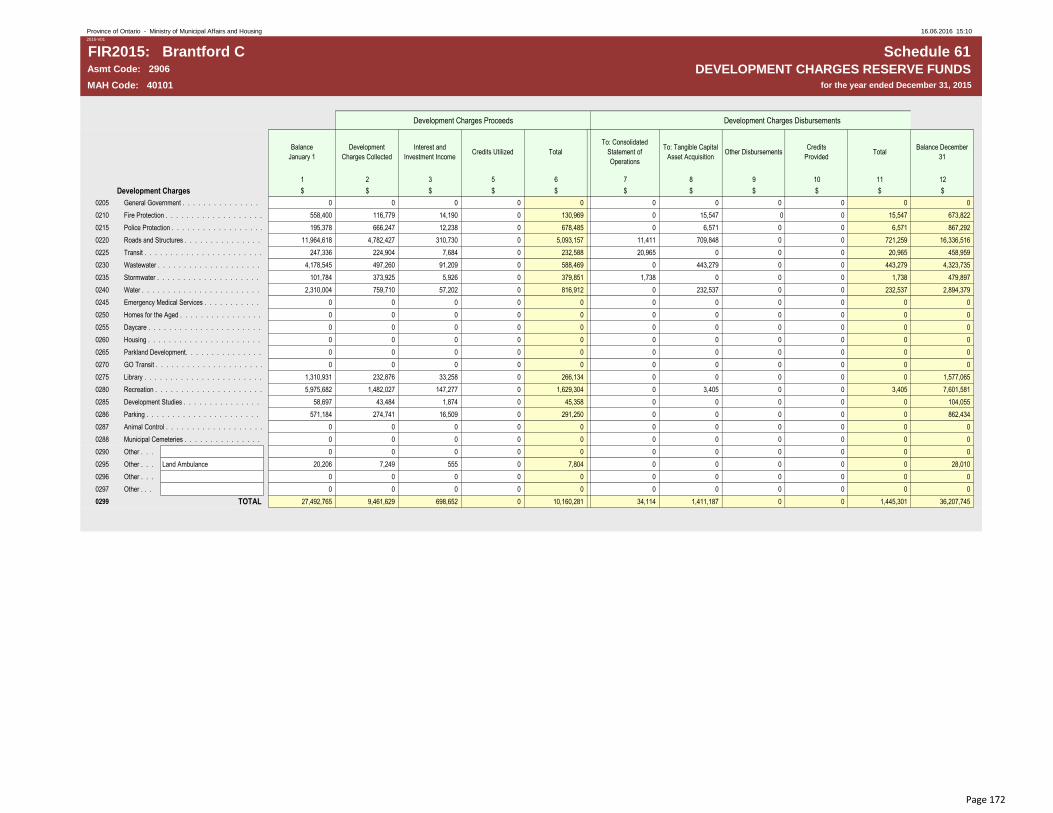
2015 Financial Information Return - Schedule 61 - Development Charges Reserve FundsProvince of Ontario - Ministry of Municipal Affairs and Housing 16.06.2016 15:10
2015-V01
FIR2015: Brantford C Schedule 61Asmt Code: 2906 DEVELOPMENT CHARGES RESERVE FUNDS
MAH Code: 40101 for the year ended December 31, 2015
Development Charges Proceeds Development Charges Disbursements
Balance
January 1
Development
Charges Collected
Interest and
Investment IncomeCredits Utilized Total
To: Consolidated
Statement of
Operations
To: Tangible Capital
Asset AcquisitionOther Disbursements
Credits
ProvidedTotal
Balance December
31
1 2 3 5 6 7 8 9 10 11 12
Development Charges $ $ $ $ $ $ $ $ $ $ $
0205 General Government . . . . . . . . . . . . . . . . . . . . . . . . . . . . . . . . . . . . . . . . . . . . . . . . . . . . . . . . . . . . . . . . . . . . . . . . . . . . . . . . . . . . . . . . . . . . . . . . . . 0 0 0 0 0 0 0 0 0 0 0
0210 Fire Protection . . . . . . . . . . . . . . . . . . . . . . . . . . . . . . . . . . . . . . . . . . . . . . . . . . . . . . . . . . . . . . . . . . . . . . . . . . . . . . . . . . . . . . . . . . . . . . . . . . 558,400 116,779 14,190 0 130,969 0 15,547 0 0 15,547 673,822
0215 Police Protection . . . . . . . . . . . . . . . . . . . . . . . . . . . . . . . . . . . . . . . . . . . . . . . . . . . . . . . . . . . . . . . . . . . . . . . . . . . . . . . . . . . . . . . . . . . . . . . . . . 195,378 666,247 12,238 0 678,485 0 6,571 0 0 6,571 867,292
0220 Roads and Structures . . . . . . . . . . . . . . . . . . . . . . . . . . . . . . . . . . . . . . . . . . . . . . . . . . . . . . . . . . . . . . . . . . . . . . . . . . . . . . . . . . . . . . . . . . . . . . . . . . 11,964,618 4,782,427 310,730 0 5,093,157 11,411 709,848 0 0 721,259 16,336,516
0225 Transit . . . . . . . . . . . . . . . . . . . . . . . . . . . . . . . . . . . . . . . . . . . . . . . . . . . . . . . . . . . . . . . . . . . . . . . . . . . . . . . . . . . . . . . . . . . . . . . . . . 247,336 224,904 7,684 0 232,588 20,965 0 0 0 20,965 458,959
0230 Wastewater . . . . . . . . . . . . . . . . . . . . . . . . . . . . . . . . . . . . . . . . . . . . . . . . . . . . . . . . . . . . . . . . . . . . . . . . . . . . . . . . . . . . . . . . . . . . . . . . . . 4,178,545 497,260 91,209 0 588,469 0 443,279 0 0 443,279 4,323,735
0235 Stormwater . . . . . . . . . . . . . . . . . . . . . . . . . . . . . . . . . . . . . . . . . . . . . . . . . . . . . . . . . . . . . . . . . . . . . . . . . . . . . . . . . . . . . . . . . . . . . . . . . . 101,784 373,925 5,926 0 379,851 1,738 0 0 0 1,738 479,897
0240 Water . . . . . . . . . . . . . . . . . . . . . . . . . . . . . . . . . . . . . . . . . . . . . . . . . . . . . . . . . . . . . . . . . . . . . . . . . . . . . . . . . . . . . . . . . . . . . . . . . . 2,310,004 759,710 57,202 0 816,912 0 232,537 0 0 232,537 2,894,379
0245 Emergency Medical Services . . . . . . . . . . . . . . . . . . . . . . . . . . . . . . . . . . . . . . . . . . . . . . . . . . . . . . . . . . . . . . . . . . . . . . . . . . . . . . . . . . . . . . . . . . . . . . . . . . 0 0 0 0 0 0 0 0 0 0 0
0250 Homes for the Aged . . . . . . . . . . . . . . . . . . . . . . . . . . . . . . . . . . . . . . . . . . . . . . . . . . . . . . . . . . . . . . . . . . . . . . . . . . . . . . . . . . . . . . . . . . . . . . . . . . 0 0 0 0 0 0 0 0 0 0 0
0255 Daycare . . . . . . . . . . . . . . . . . . . . . . . . . . . . . . . . . . . . . . . . . . . . . . . . . . . . . . . . . . . . . . . . . . . . . . . . . . . . . . . . . . . . . . . . . . . . . . . . . . 0 0 0 0 0 0 0 0 0 0 0
0260 Housing . . . . . . . . . . . . . . . . . . . . . . . . . . . . . . . . . . . . . . . . . . . . . . . . . . . . . . . . . . . . . . . . . . . . . . . . . . . . . . . . . . . . . . . . . . . . . . . . . . 0 0 0 0 0 0 0 0 0 0 0
0265 Parkland Development. . . . . . . . . . . . . . . . . . . . . . . . . . . . . . . . . . . . . . . . . . . . . . . . . . . . . . . . . . . . . . . . . . . . . . . . . . . . . . . . . . . . . . . . . . . . . . . 0 0 0 0 0 0 0 0 0 0 0
0270 GO Transit . . . . . . . . . . . . . . . . . . . . . . . . . . . . . . . . . . . . . . . . . . . . . . . . . . . . . . . . . . . . . . . . . . . . . . . . . . . . . . . . . . . . . . . . . . . . . . . . . . 0 0 0 0 0 0 0 0 0 0 0
0275 Library . . . . . . . . . . . . . . . . . . . . . . . . . . . . . . . . . . . . . . . . . . . . . . . . . . . . . . . . . . . . . . . . . . . . . . . . . . . . . . . . . . . . . . . . . . . . . . . . . . 1,310,931 232,876 33,258 0 266,134 0 0 0 0 0 1,577,065
0280 Recreation . . . . . . . . . . . . . . . . . . . . . . . . . . . . . . . . . . . . . . . . . . . . . . . . . . . . . . . . . . . . . . . . . . . . . . . . . . . . . . . . . . . . . . . . . . . . . . . . . . 5,975,682 1,482,027 147,277 0 1,629,304 0 3,405 0 0 3,405 7,601,581
0285 Development Studies . . . . . . . . . . . . . . . . . . . . . . . . . . . . . . . . . . . . . . . . . . . . . . . . . . . . . . . . . . . . . . . . . . . . . . . . . . . . . . . . . . . . . . . . . . . . . . . . . . 58,697 43,484 1,874 0 45,358 0 0 0 0 0 104,055
0286 Parking . . . . . . . . . . . . . . . . . . . . . . . . . . . . . . . . . . . . . . . . . . . . . . . . . . . . . . . . . . . . . . . . . . . . . . . . . . . . . . . . . . . . . . . . . . . . . . . . . .571,184 274,741 16,509 0 291,250 0 0 0 0 0 862,434
0287 Animal Control . . . . . . . . . . . . . . . . . . . . . . . . . . . . . . . . . . . . . . . . . . . . . . . . . . . . . . . . . . . . . . . . . . . . . . . . . . . . . . . . . . . . . . . . . . . . . . . . . .0 0 0 0 0 0 0 0 0 0 0
0288 Municipal Cemeteries . . . . . . . . . . . . . . . . . . . . . . . . . . . . . . . . . . . . . . . . . . . . . . . . . . . . . . . . . . . . . . . . . . . . . . . . . . . . . . . . . . . . . . . . . . . . . . . . . .0 0 0 0 0 0 0 0 0 0 0
0290 Other . . . 0 0 0 0 0 0 0 0 0 0 0
0295 Other . . . Land Ambulance 20,206 7,249 555 0 7,804 0 0 0 0 0 28,010
0296 Other . . . 0 0 0 0 0 0 0 0 0 0 0
0297 Other . . . 0 0 0 0 0 0 0 0 0 0 0
0299 TOTAL 27,492,765 9,461,629 698,652 0 10,160,281 34,114 1,411,187 0 0 1,445,301 36,207,745
Page 172

2015 Financial Information Return - Schedule 62 - Development Charges Rates - Municipal Wide ChargesProvince of Ontario - Ministry of Municipal Affairs and Housing 16.06.2016 15:10
2012-V01
FIR2015: Brantford C Schedule 62Asmt Code: 2906 DEVELOPMENT CHARGES RATES
MAH Code: 40101 for the year ended December 31, 2015
Sq. Foot / Sq. Metre / Per Hectare / Per Other
RESIDENTIAL CHARGES ($) NON - RESIDENTIAL CHARGES ($) (Please specify) Sq. Metre
Apartments NON Res. Industrial Commercial Institutional
Service
Single
Detached
1
Semi-
Detached
2
Other
Multiples
3
< =
1 Bedroom
4
> =
2 Bedroom
5
Other
6
Other
7
Other
8
Other
9
Per Sq. Metre
10
Per Sq. Metre
11
Per Sq. Metre
12
Per Sq. Metre
13
Other
14
Other
15
Other
16
0 Municipal Wide Charges If Other, Please Specify > If Other, Please Specify >
210 Fire 216.00 216.00 176.00 103.00 124.00 1.03 1.03 1.03 1.03
450 Police 493.00 493.00 400.00 234.00 282.00 2.13 2.13 2.13 2.13
550 Roads Related 9,669.00 9,669.00 7,830.00 4,588.00 5,536.00 46.48 46.48 46.48 46.48
650 Transit 440.00 440.00 356.00 209.00 252.00 2.03 2.03 2.03 2.03
690 Wastewater 977.00 977.00 792.00 464.00 559.00 4.71 4.71 4.71 4.71
670 Water 1,532.00 1,532.00 1,240.00 727.00 877.00 7.32 7.32 7.32 7.32
310 Library 705.00 705.00 571.00 334.00 403.00 0.00 0.00 0.00 0.00
510 Recreation 4,532.00 4,532.00 3,670.00 2,151.00 2,595.00 0.00 0.00 0.00 0.00
230 General Government 80.00 80.00 65.00 38.00 46.00 0.39 0.39 0.39 0.39
350 Municipal Parking 560.00 560.00 454.00 266.00 321.00 2.30 2.30 2.30 2.30
130 Ambulance 14.00 14.00 12.00 7.00 8.00 0.07 0.07 0.07 0.07
630 Stormwater 318.00 318.00 257.00 151.00 182.00 1.52 1.52 1.52 1.52
9910 TOTAL MUNICIPAL WIDE CHARGES 19,536.00 19,536.00 15,823.00 9,272.00 11,185.00 0.00 0.00 0.00 0.00 67.98 67.98 67.98 67.98 0.00 0.00 0.00
1250 Are the rates being reported based on a new development charge by-law that was approved by council within the reporting year? N
If yes(Y), please attach an electronic version of the new by-law.
Page 173

2015 Financial Information Return - Schedule 62 - Development Charges Rates - Special Area ChargesProvince of Ontario - Ministry of Municipal Affairs and Housing 16.06.2016 15:10
2012-V01
FIR2015: Brantford C Schedule 62Asmt Code: 2906 DEVELOPMENT CHARGES RATES - SPECIAL AREAS
MAH Code: 40101 for the year ended December 31, 2015
Sq. Foot / Sq. Metre/ Per Hectare/ Per Other (Please specify) Sq. Metre
RESIDENTIAL CHARGES ($) NON - RESIDENTIAL CHARGES ($)
Apartments NON Res. Industrial Commercial Institutional
Service
Single
Detached
1
Semi-
Detached
2
Other
Multiples
3
< =
1 Bedroom
4
> =
2 Bedroom
5
Other
6
Other
7
Other
8
Other
9
Per Sq. Metre
10
Per Sq. Metre
11
Per Sq. Metre
12
Per Sq. Metre
13
Other
14
Other
15
Other
16
1 Intensification Area Charges If Other, Please Specify > If Other, Please Specify >
210 Fire 216.00 216.00 176.00 103.00 124.00 1.03 1.03 1.03 1.03
450 Police 493.00 493.00 400.00 234.00 282.00 2.13 2.13 2.13 2.13
550 Roads Related 9,669.00 9,669.00 7,830.00 4,588.00 5,536.00 46.48 46.48 46.48 46.48
650 Transit 440.00 440.00 356.00 209.00 252.00 2.03 2.03 2.03 2.03
690 Wastewater 977.00 977.00 792.00 464.00 559.00 4.71 4.71 4.71 4.71
670 Water 1,532.00 1,532.00 1,240.00 727.00 877.00 7.32 7.32 7.32 7.32
310 Library 705.00 705.00 571.00 334.00 403.00 0.00 0.00 0.00 0.00
510 Recreation 4,532.00 4,532.00 3,670.00 2,151.00 2,595.00 0.00 0.00 0.00 0.00
230 General Government 80.00 80.00 65.00 38.00 46.00 0.39 0.39 0.39 0.39
350 Municipal Parking 560.00 560.00 454.00 266.00 321.00 2.30 2.30 2.30 2.30
130 Ambulance 14.00 14.00 12.00 7.00 8.00 0.07 0.07 0.07 0.07
630 Stormwater 2,235.00 2,235.00 1,810.00 1,061.00 1,280.00 18.91 18.91 18.91 18.91
9910 TOTAL FOR INTENSIFICATION AREA CHARGES 21,453.00 21,453.00 17,376.00 10,182.00 12,283.00 0.00 0.00 0.00 0.00 85.37 85.37 85.37 85.37 0.00 0.00 0.00
31 of 51
Page 174

2015 Financial Information Return - Schedule 62 - Development Charges Rates - Special Area ChargesProvince of Ontario - Ministry of Municipal Affairs and Housing 16.06.2016 15:10
2012-V01
FIR2015: Brantford C Schedule 62Asmt Code: 2906 DEVELOPMENT CHARGES RATES - SPECIAL AREAS
MAH Code: 40101 for the year ended December 31, 2015
Sq. Foot / Sq. Metre/ Per Hectare/ Per Other (Please specify) Sq. Metre
RESIDENTIAL CHARGES ($) NON - RESIDENTIAL CHARGES ($)
Apartments NON Res. Industrial Commercial Institutional
Service
Single
Detached
1
Semi-
Detached
2
Other
Multiples
3
< =
1 Bedroom
4
> =
2 Bedroom
5
Other
6
Other
7
Other
8
Other
9
Per Sq. Metre
10
Per Sq. Metre
11
Per Sq. Metre
12
Per Sq. Metre
13
Other
14
Other
15
Other
16
2 Infill Charges (Residential Owner) If Other, Please Specify > If Other, Please Specify >
210 Fire 216.00 216.00 176.00 103.00 124.00
450 Police 493.00 493.00 400.00 234.00 282.00
550 Roads Related 4,930.00 4,930.00 3,992.00 2,339.00 2,822.00
650 Transit 440.00 440.00 356.00 209.00 252.00
690 Wastewater 542.00 542.00 438.00 257.00 311.00
670 Water 930.00 930.00 753.00 442.00 532.00
310 Library 705.00 705.00 571.00 334.00 403.00
510 Recreation 4,532.00 4,532.00 3,670.00 2,151.00 2,595.00
230 General Government 80.00 80.00 65.00 38.00 46.00
350 Municipal Parking 560.00 560.00 454.00 266.00 321.00
130 Ambulance 14.00 14.00 12.00 7.00 8.00
630 Stormwater 318.00 318.00 257.00 151.00 182.00
9910 TOTAL FOR INFILL CHARGES (RESIDENTIAL OWNER) 13,760.00 13,760.00 11,144.00 6,531.00 7,878.00 0.00 0.00 0.00 0.00 0.00 0.00 0.00 0.00 0.00 0.00 0.00
32 of 51
Page 175

2015 Financial Information Return - Schedule 62 - Development Charges Rates - Special Area ChargesProvince of Ontario - Ministry of Municipal Affairs and Housing 16.06.2016 15:10
2012-V01
FIR2015: Brantford C Schedule 62Asmt Code: 2906 DEVELOPMENT CHARGES RATES - SPECIAL AREAS
MAH Code: 40101 for the year ended December 31, 2015
Sq. Foot / Sq. Metre/ Per Hectare/ Per Other (Please specify) Sq. Metre
RESIDENTIAL CHARGES ($) NON - RESIDENTIAL CHARGES ($)
Apartments NON Res. Industrial Commercial Institutional
Service
Single
Detached
1
Semi-
Detached
2
Other
Multiples
3
< =
1 Bedroom
4
> =
2 Bedroom
5
Other
6
Other
7
Other
8
Other
9
Per Sq. Metre
10
Per Sq. Metre
11
Per Sq. Metre
12
Per Sq. Metre
13
Other
14
Other
15
Other
16
3 Intensification Infill Charges (Residential Only) If Other, Please Specify > If Other, Please Specify >
210 Fire 216.00 216.00 176.00 103.00 124.00
450 Police 493.00 493.00 400.00 234.00 282.00
550 Roads Related 4,930.00 4,930.00 3,992.00 2,339.00 2,822.00
650 Transit 440.00 440.00 356.00 209.00 252.00
690 Wastewater 542.00 542.00 438.00 257.00 311.00
670 Water 930.00 930.00 753.00 442.00 532.00
310 Library 705.00 705.00 571.00 334.00 403.00
510 Recreation 4,532.00 4,532.00 3,670.00 2,151.00 2,595.00
230 General Government 80.00 80.00 65.00 38.00 46.00
350 Municipal Parking 560.00 560.00 454.00 266.00 321.00
130 Ambulance 14.00 14.00 12.00 7.00 8.00
630 Stormwater 2,235.00 2,235.00 1,810.00 1,061.00 1,280.00
9910TOTAL FOR INTENSIFICATION INFILL CHARGES (RESIDENTIAL ONLY) 15,677.00 15,677.00 12,697.00 7,441.00 8,976.00 0.00 0.00 0.00 0.00 0.00 0.00 0.00 0.00 0.00 0.00 0.00
33 of 51
Page 176
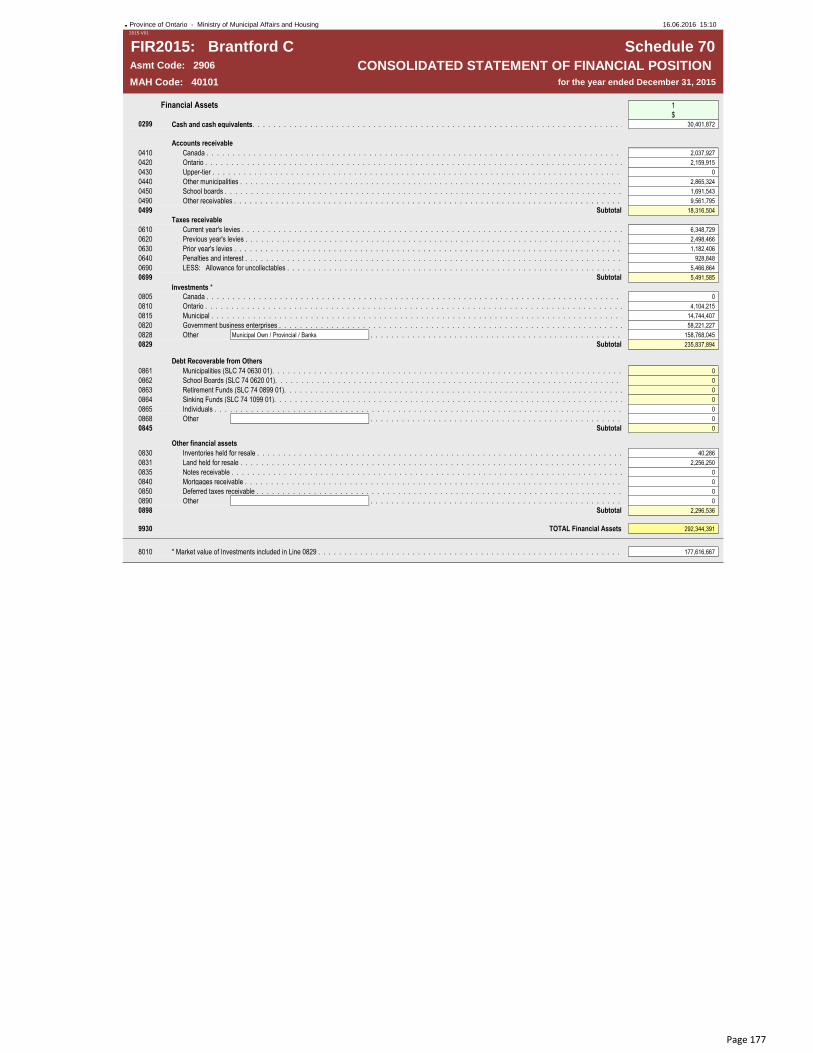
2015 Financial Information Return - Schedule 70 - Consolidated Statement of Financial PositionProvince of Ontario - Ministry of Municipal Affairs and Housing 16.06.2016 15:102015-V01
FIR2015: Brantford C Schedule 70Asmt Code: 2906 CONSOLIDATED STATEMENT OF FINANCIAL POSITION MAH Code: 40101 for the year ended December 31, 2015
Financial Assets 1
$
0299 Cash and cash equivalents. . . . . . . . . . . . . . . . . . . . . . . . . . . . . . . . . . . . . . . . . . . . . . . . . . . . . . . . . . . . . . . . . . . . . . . . . . . . . . . . . . . . . . . . . . . . . . . . . . . . . . . . . . . . . . . . . . . . . . . . . . . . . . . . . . . . . . . . . . . . . . . . . . . . . 30,401,872
Accounts receivable
0410 Canada . . . . . . . . . . . . . . . . . . . . . . . . . . . . . . . . . . . . . . . . . . . . . . . . . . . . . . . . . . . . . . . . . . . . . . . . . . . . . . . . . . . . . . . . . . . . . . . . . . . . . . . . . . . . . . . . . . . . . . . . . . . . . . . . . . . . . . . . . . . . . . . . . . . . . 2,037,927
0420 Ontario . . . . . . . . . . . . . . . . . . . . . . . . . . . . . . . . . . . . . . . . . . . . . . . . . . . . . . . . . . . . . . . . . . . . . . . . . . . . . . . . . . . . . . . . . . . . . . . . . . . . . . . . . . . . . . . . . . . . . . . . . . . . . . . . . . . . . . . . . . . . . . . . . . . . . 2,159,915
0430 Upper-tier . . . . . . . . . . . . . . . . . . . . . . . . . . . . . . . . . . . . . . . . . . . . . . . . . . . . . . . . . . . . . . . . . . . . . . . . . . . . . . . . . . . . . . . . . . . . . . . . . . . . . . . . . . . . . . . . . . . . . . . . . . . . . . . . . . . . . . . . . . . . . . . . . . . . . 0
0440 Other municipalities . . . . . . . . . . . . . . . . . . . . . . . . . . . . . . . . . . . . . . . . . . . . . . . . . . . . . . . . . . . . . . . . . . . . . . . . . . . . . . . . . . . . . . . . . . . . . . . . . . . . . . . . . . . . . . . . . . . . . . . . . . . . . . . . . . . . . . . . . . . . . . . . . . . . . 2,865,324
0450 School boards . . . . . . . . . . . . . . . . . . . . . . . . . . . . . . . . . . . . . . . . . . . . . . . . . . . . . . . . . . . . . . . . . . . . . . . . . . . . . . . . . . . . . . . . . . . . . . . . . . . . . . . . . . . . . . . . . . . . . . . . . . . . . . . . . . . . . . . . . . . . . . . . . . . . . 1,691,543
0490 Other receivables . . . . . . . . . . . . . . . . . . . . . . . . . . . . . . . . . . . . . . . . . . . . . . . . . . . . . . . . . . . . . . . . . . . . . . . . . . . . . . . . . . . . . . . . . . . . . . . . . . . . . . . . . . . . . . . . . . . . . . . . . . . . . . . . . . . . . . . . . . . . . . . . . . . . . 9,561,795
0499 Subtotal 18,316,504
Taxes receivable
0610 Current year's levies . . . . . . . . . . . . . . . . . . . . . . . . . . . . . . . . . . . . . . . . . . . . . . . . . . . . . . . . . . . . . . . . . . . . . . . . . . . . . . . . . . . . . . . . . . . . . . . . . . . . . . . . . . . . . . . . . . . . . . . . . . . . . . . . . . . . . . . . . . . . . . . . . . . . . 6,348,729
0620 Previous year's levies . . . . . . . . . . . . . . . . . . . . . . . . . . . . . . . . . . . . . . . . . . . . . . . . . . . . . . . . . . . . . . . . . . . . . . . . . . . . . . . . . . . . . . . . . . . . . . . . . . . . . . . . . . . . . . . . . . . . . . . . . . . . . . . . . . . . . . . . . . . . . . . . . . . . . 2,498,466
0630 Prior year's levies . . . . . . . . . . . . . . . . . . . . . . . . . . . . . . . . . . . . . . . . . . . . . . . . . . . . . . . . . . . . . . . . . . . . . . . . . . . . . . . . . . . . . . . . . . . . . . . . . . . . . . . . . . . . . . . . . . . . . . . . . . . . . . . . . . . . . . . . . . . . . . . . . . . . . 1,182,406
0640 Penalties and interest . . . . . . . . . . . . . . . . . . . . . . . . . . . . . . . . . . . . . . . . . . . . . . . . . . . . . . . . . . . . . . . . . . . . . . . . . . . . . . . . . . . . . . . . . . . . . . . . . . . . . . . . . . . . . . . . . . . . . . . . . . . . . . . . . . . . . . . . . . . . . . . . . . . . . 928,848
0690 LESS: Allowance for uncollectables . . . . . . . . . . . . . . . . . . . . . . . . . . . . . . . . . . . . . . . . . . . . . . . . . . . . . . . . . . . . . . . . . . . . . . . . . . . . . . . . . . . . . . . . . . . . . . . . . . . . . . . . . . . . . . . . . . . . . . . . . . . . . . . . . . . . . . . . . . . . . . . . . . . . . 5,466,864
0699 Subtotal 5,491,585
Investments *
0805 Canada . . . . . . . . . . . . . . . . . . . . . . . . . . . . . . . . . . . . . . . . . . . . . . . . . . . . . . . . . . . . . . . . . . . . . . . . . . . . . . . . . . . . . . . . . . . . . . . . . . . . . . . . . . . . . . . . . . . . . . . . . . . . . . . . . . . . . . . . . . . . . . . . . . . . . 0
0810 Ontario . . . . . . . . . . . . . . . . . . . . . . . . . . . . . . . . . . . . . . . . . . . . . . . . . . . . . . . . . . . . . . . . . . . . . . . . . . . . . . . . . . . . . . . . . . . . . . . . . . . . . . . . . . . . . . . . . . . . . . . . . . . . . . . . . . . . . . . . . . . . . . . . . . . . . 4,104,215
0815 Municipal . . . . . . . . . . . . . . . . . . . . . . . . . . . . . . . . . . . . . . . . . . . . . . . . . . . . . . . . . . . . . . . . . . . . . . . . . . . . . . . . . . . . . . . . . . . . . . . . . . . . . . . . . . . . . . . . . . . . . . . . . . . . . . . . . . . . . . . . . . . . . . . . . . . . . 14,744,407
0820 Government business enterprises . . . . . . . . . . . . . . . . . . . . . . . . . . . . . . . . . . . . . . . . . . . . . . . . . . . . . . . . . . . . . . . . . . . . . . . . . . . . . . . . . . . . . . . . . . . . . . . . . . . . . . . . . . . . . . . . . . . . . . . . . . . . . . . . . . . . . . . . . . . . . . . . . . . . . 58,221,227
0828 Other Municipal Own / Provincial / Banks . . . . . . . . . . . . . . . . . . . . . . . . . . . . . . . . . . . . . . . . . . . . . . . . . . . . . . . . . . . . . . . . . . . . . . . . . . . . . . 158,768,045
0829 Subtotal 235,837,894
Debt Recoverable from Others
0861 Municipalities (SLC 74 0630 01). . . . . . . . . . . . . . . . . . . . . . . . . . . . . . . . . . . . . . . . . . . . . . . . . . . . . . . . . . . . . . . . . . . . . . . . . . . . . . . . . . . . . . . . . . . . . . . . . . . . . . . . . . . . . . . . . . . . . . . . . . . . . . . . . . . . . . . . . . . . . . . . . . . . . 0
0862 School Boards (SLC 74 0620 01). . . . . . . . . . . . . . . . . . . . . . . . . . . . . . . . . . . . . . . . . . . . . . . . . . . . . . . . . . . . . . . . . . . . . . . . . . . . . . . . . . . . . . . . . . . . . . . . . . . . . . . . . . . . . . . . . . . . . . . . . . . . . . . . . . . . . . . . . . . . . . . . . . . . . 0
0863 Retirement Funds (SLC 74 0899 01). . . . . . . . . . . . . . . . . . . . . . . . . . . . . . . . . . . . . . . . . . . . . . . . . . . . . . . . . . . . . . . . . . . . . . . . . . . . . . . . . . . . . . . . . . . . . . . . . . . . . . . . . . . . . . . . . . . . . . . . . . . . . . . . . . . . . . . . . . . . . . . . . . . . . 0
0864 Sinking Funds (SLC 74 1099 01). . . . . . . . . . . . . . . . . . . . . . . . . . . . . . . . . . . . . . . . . . . . . . . . . . . . . . . . . . . . . . . . . . . . . . . . . . . . . . . . . . . . . . . . . . . . . . . . . . . . . . . . . . . . . . . . . . . . . . . . . . . . . . . . . . . . . . . . . . . . . . . . . . . . . 0
0865 Individuals . . . . . . . . . . . . . . . . . . . . . . . . . . . . . . . . . . . . . . . . . . . . . . . . . . . . . . . . . . . . . . . . . . . . . . . . . . . . . . . . . . . . . . . . . . . . . . . . . . . . . . . . . . . . . . . . . . . . . . . . . . . . . . . . . . . . . . . . . . . . . . . . . . . . . 0
0868 Other . . . . . . . . . . . . . . . . . . . . . . . . . . . . . . . . . . . . . . . . . . . . . . . . . . . . . . . . . . . . . . . . . . . . . . . . . . . . . . 0
0845 Subtotal 0
Other financial assets
0830 Inventories held for resale . . . . . . . . . . . . . . . . . . . . . . . . . . . . . . . . . . . . . . . . . . . . . . . . . . . . . . . . . . . . . . . . . . . . . . . . . . . . . . . . . . . . . . . . . . . . . . . . . . . . . . . . . . . . . . . . . . . . . . . . . . . . . . . . . . . . . . . . . . . . . . . . . . . . . 40,286
0831 Land held for resale . . . . . . . . . . . . . . . . . . . . . . . . . . . . . . . . . . . . . . . . . . . . . . . . . . . . . . . . . . . . . . . . . . . . . . . . . . . . . . . . . . . . . . . . . . . . . . . . . . . . . . . . . . . . . . . . . . . . . . . . . . . . . . . . . . . . . . . . . . . . . . . . . . . . . 2,256,250
0835 Notes receivable . . . . . . . . . . . . . . . . . . . . . . . . . . . . . . . . . . . . . . . . . . . . . . . . . . . . . . . . . . . . . . . . . . . . . . . . . . . . . . . . . . . . . . . . . . . . . . . . . . . . . . . . . . . . . . . . . . . . . . . . . . . . . . . . . . . . . . . . . . . . . . . . . . . . . 0
0840 Mortgages receivable . . . . . . . . . . . . . . . . . . . . . . . . . . . . . . . . . . . . . . . . . . . . . . . . . . . . . . . . . . . . . . . . . . . . . . . . . . . . . . . . . . . . . . . . . . . . . . . . . . . . . . . . . . . . . . . . . . . . . . . . . . . . . . . . . . . . . . . . . . . . . . . . . . . . . 0
0850 Deferred taxes receivable . . . . . . . . . . . . . . . . . . . . . . . . . . . . . . . . . . . . . . . . . . . . . . . . . . . . . . . . . . . . . . . . . . . . . . . . . . . . . . . . . . . . . . . . . . . . . . . . . . . . . . . . . . . . . . . . . . . . . . . . . . . . . . . . . . . . . . . . . . . . . . . . . . . . . 0
0890 Other . . . . . . . . . . . . . . . . . . . . . . . . . . . . . . . . . . . . . . . . . . . . . . . . . . . . . . . . . . . . . . . . . . . . . . . . . . . . . . 0
0898 Subtotal 2,296,536
9930 TOTAL Financial Assets 292,344,391
8010 * Market value of Investments included in Line 0829 . . . . . . . . . . . . . . . . . . . . . . . . . . . . . . . . . . . . . . . . . . . . . . . . . . . . . . . . . . . . . . . . . . . . . . . . . . . . . . . . . . . . . . . . . . . . . . . . . . . . . . . . . . . . . . . . . . . . . . . . . . . . . . . . . . . . . . . . . . . . . . . . . . . . . 177,616,667
Page 177
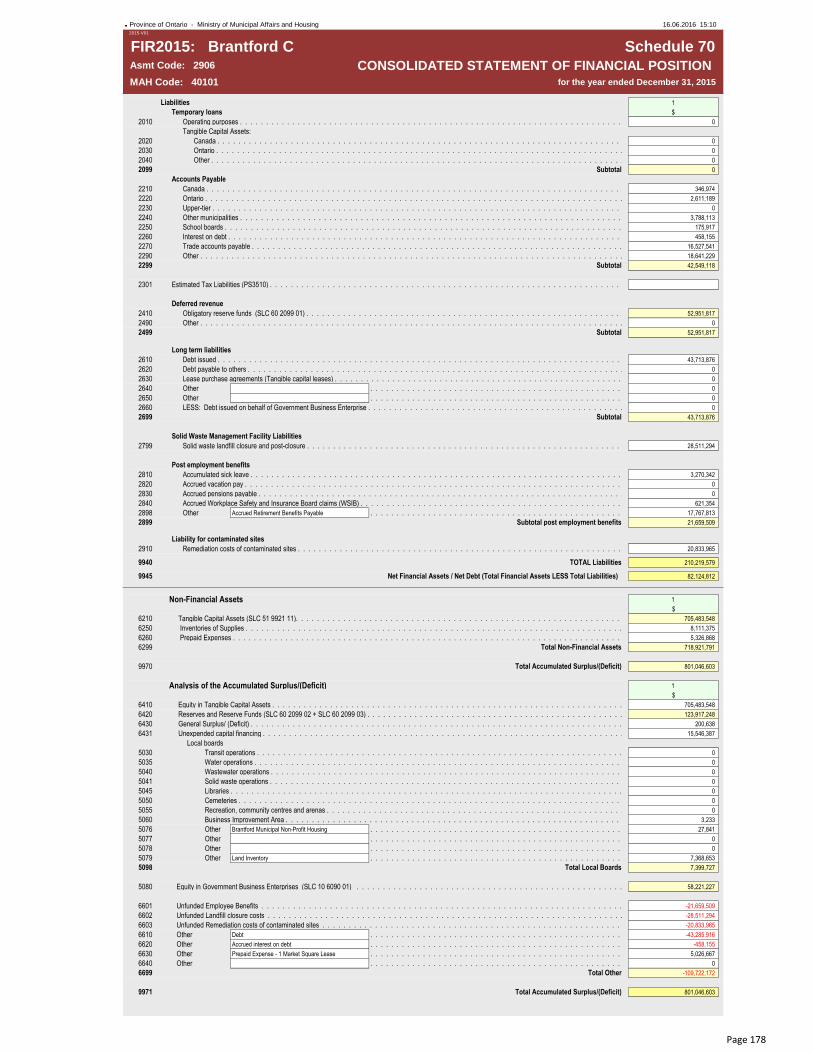
2015 Financial Information Return - Schedule 70 - Consolidated Statement of Financial PositionProvince of Ontario - Ministry of Municipal Affairs and Housing 16.06.2016 15:102015-V01
FIR2015: Brantford C Schedule 70Asmt Code: 2906 CONSOLIDATED STATEMENT OF FINANCIAL POSITION MAH Code: 40101 for the year ended December 31, 2015
Liabilities 1
Temporary loans $
2010 Operating purposes . . . . . . . . . . . . . . . . . . . . . . . . . . . . . . . . . . . . . . . . . . . . . . . . . . . . . . . . . . . . . . . . . . . . . . . . . . . . . . . . . . . . . . . . . . . . . . . . . . . . . . . . . . . . . . . . . . . . . . . . . . . . . . . . . . . . . . . . . . . . . . . . . . . . . 0
Tangible Capital Assets:
2020 Canada . . . . . . . . . . . . . . . . . . . . . . . . . . . . . . . . . . . . . . . . . . . . . . . . . . . . . . . . . . . . . . . . . . . . . . . . . . . . . . . . . . . . . . . . . . . . . . . . . . . . . . . . . . . . . . . . . . . . . . . . . . . . . . . . . . . . . . . . . . . . . . . . . . . . . 0
2030 Ontario . . . . . . . . . . . . . . . . . . . . . . . . . . . . . . . . . . . . . . . . . . . . . . . . . . . . . . . . . . . . . . . . . . . . . . . . . . . . . . . . . . . . . . . . . . . . . . . . . . . . . . . . . . . . . . . . . . . . . . . . . . . . . . . . . . . . . . . . . . . . . . . . . . . . . 0
2040 Other . . . . . . . . . . . . . . . . . . . . . . . . . . . . . . . . . . . . . . . . . . . . . . . . . . . . . . . . . . . . . . . . . . . . . . . . . . . . . . . . . . . . . . . . . . . . . . . . . . . . . . . . . . . . . . . . . . . . . . . . . . . . . . . . . . . . . . . . . . . . . . . . . . . . . 0
2099 Subtotal 0
Accounts Payable
2210 Canada . . . . . . . . . . . . . . . . . . . . . . . . . . . . . . . . . . . . . . . . . . . . . . . . . . . . . . . . . . . . . . . . . . . . . . . . . . . . . . . . . . . . . . . . . . . . . . . . . . . . . . . . . . . . . . . . . . . . . . . . . . . . . . . . . . . . . . . . . . . . . . . . . . . . . 346,974
2220 Ontario . . . . . . . . . . . . . . . . . . . . . . . . . . . . . . . . . . . . . . . . . . . . . . . . . . . . . . . . . . . . . . . . . . . . . . . . . . . . . . . . . . . . . . . . . . . . . . . . . . . . . . . . . . . . . . . . . . . . . . . . . . . . . . . . . . . . . . . . . . . . . . . . . . . . . 2,611,189
2230 Upper-tier . . . . . . . . . . . . . . . . . . . . . . . . . . . . . . . . . . . . . . . . . . . . . . . . . . . . . . . . . . . . . . . . . . . . . . . . . . . . . . . . . . . . . . . . . . . . . . . . . . . . . . . . . . . . . . . . . . . . . . . . . . . . . . . . . . . . . . . . . . . . . . . . . . . . . 0
2240 Other municipalities . . . . . . . . . . . . . . . . . . . . . . . . . . . . . . . . . . . . . . . . . . . . . . . . . . . . . . . . . . . . . . . . . . . . . . . . . . . . . . . . . . . . . . . . . . . . . . . . . . . . . . . . . . . . . . . . . . . . . . . . . . . . . . . . . . . . . . . . . . . . . . . . . . . . . 3,788,113
2250 School boards . . . . . . . . . . . . . . . . . . . . . . . . . . . . . . . . . . . . . . . . . . . . . . . . . . . . . . . . . . . . . . . . . . . . . . . . . . . . . . . . . . . . . . . . . . . . . . . . . . . . . . . . . . . . . . . . . . . . . . . . . . . . . . . . . . . . . . . . . . . . . . . . . . . . . 175,917
2260 Interest on debt . . . . . . . . . . . . . . . . . . . . . . . . . . . . . . . . . . . . . . . . . . . . . . . . . . . . . . . . . . . . . . . . . . . . . . . . . . . . . . . . . . . . . . . . . . . . . . . . . . . . . . . . . . . . . . . . . . . . . . . . . . . . . . . . . . . . . . . . . . . . . . . . . . . . . 458,155
2270 Trade accounts payable . . . . . . . . . . . . . . . . . . . . . . . . . . . . . . . . . . . . . . . . . . . . . . . . . . . . . . . . . . . . . . . . . . . . . . . . . . . . . . . . . . . . . . . . . . . . . . . . . . . . . . . . . . . . . . . . . . . . . . . . . . . . . . . . . . . . . . . . . . . . . . . . . . . . . 16,527,541
2290 Other . . . . . . . . . . . . . . . . . . . . . . . . . . . . . . . . . . . . . . . . . . . . . . . . . . . . . . . . . . . . . . . . . . . . . . . . . . . . . . . . . . . . . . . . . . . . . . . . . . . . . . . . . . . . . . . . . . . . . . . . . . . . . . . . . . . . . . . . . . . . . . . . . . . . . 18,641,229
2299 Subtotal 42,549,118
2301 Estimated Tax Liabilities (PS3510) . . . . . . . . . . . . . . . . . . . . . . . . . . . . . . . . . . . . . . . . . . . . . . . . . . . . . . . . . . . . . . . . . . . . . . . . . . . . . . . . . . . . . . . . . . . . . . . . . . . . . . . . . . . . . . . . . . . . . . . . . . . . . . . . . . . . . . . . . . . . . . . . . . . . .
Deferred revenue
2410 Obligatory reserve funds (SLC 60 2099 01) . . . . . . . . . . . . . . . . . . . . . . . . . . . . . . . . . . . . . . . . . . . . . . . . . . . . . . . . . . . . . . . . . . . . . . . . . . . . . . . . . . . . . . . . . . . . . . . . . . . . . . . . . . . . . . . . . . . . . . . . . . . . . . . . . . . . . . . . . . . . . . . . . . . . . 52,951,817
2490 Other . . . . . . . . . . . . . . . . . . . . . . . . . . . . . . . . . . . . . . . . . . . . . . . . . . . . . . . . . . . . . . . . . . . . . . . . . . . . . . . . . . . . . . . . . . . . . . . . . . . . . . . . . . . . . . . . . . . . . . . . . . . . . . . . . . . . . . . . . . . . . . . . . . . . . 0
2499 Subtotal 52,951,817
Long term liabilities
2610 Debt issued . . . . . . . . . . . . . . . . . . . . . . . . . . . . . . . . . . . . . . . . . . . . . . . . . . . . . . . . . . . . . . . . . . . . . . . . . . . . . . . . . . . . . . . . . . . . . . . . . . . . . . . . . . . . . . . . . . . . . . . . . . . . . . . . . . . . . . . . . . . . . . . . . . . . . 43,713,876
2620 Debt payable to others . . . . . . . . . . . . . . . . . . . . . . . . . . . . . . . . . . . . . . . . . . . . . . . . . . . . . . . . . . . . . . . . . . . . . . . . . . . . . . . . . . . . . . . . . . . . . . . . . . . . . . . . . . . . . . . . . . . . . . . . . . . . . . . . . . . . . . . . . . . . . . . . . . . . . 0
2630 Lease purchase agreements (Tangible capital leases) . . . . . . . . . . . . . . . . . . . . . . . . . . . . . . . . . . . . . . . . . . . . . . . . . . . . . . . . . . . . . . . . . . . . . . . . . . . . . . . . . . . . . . . . . . . . . . . . . . . . . . . . . . . . . . . . . . . . . . . . . . . . . . . . . . . . . . . . . . . . . . . . . . . . . 0
2640 Other . . . . . . . . . . . . . . . . . . . . . . . . . . . . . . . . . . . . . . . . . . . . . . . . . . . . . . . . . . . . . . . . . . . . . . . . . . . . . . 0
2650 Other . . . . . . . . . . . . . . . . . . . . . . . . . . . . . . . . . . . . . . . . . . . . . . . . . . . . . . . . . . . . . . . . . . . . . . . . . . . . . . 0
2660 LESS: Debt issued on behalf of Government Business Enterprise . . . . . . . . . . . . . . . . . . . . . . . . . . . . . . . . . . . . . . . . . . . . . . . . . . . . . . . . . . . . . . . . . . . . . . . . . . . . . . . . . . . . . . . . . . . . . . . . . . . . . . . . . . . . . . . . . . . . . . . . . . . . . . . . . . . . . . . . . . . . . . . . . . . . . 0
2699 Subtotal 43,713,876
Solid Waste Management Facility Liabilities
2799 Solid waste landfill closure and post-closure . . . . . . . . . . . . . . . . . . . . . . . . . . . . . . . . . . . . . . . . . . . . . . . . . . . . . . . . . . . . . . . . . . . . . . . . . . . . . . . . . . . . . . . . . . . . . . . . . . . . . . . . . . . . . . . . . . . . . . . . . . . . . . . . . . . . . . . . . . . . . . . . . . . . . 28,511,294
Post employment benefits
2810 Accumulated sick leave . . . . . . . . . . . . . . . . . . . . . . . . . . . . . . . . . . . . . . . . . . . . . . . . . . . . . . . . . . . . . . . . . . . . . . . . . . . . . . . . . . . . . . . . . . . . . . . . . . . . . . . . . . . . . . . . . . . . . . . . . . . . . . . . . . . . . . . . . . . . . . . . . . . . . 3,270,342
2820 Accrued vacation pay . . . . . . . . . . . . . . . . . . . . . . . . . . . . . . . . . . . . . . . . . . . . . . . . . . . . . . . . . . . . . . . . . . . . . . . . . . . . . . . . . . . . . . . . . . . . . . . . . . . . . . . . . . . . . . . . . . . . . . . . . . . . . . . . . . . . . . . . . . . . . . . . . . . . . 0
2830 Accrued pensions payable . . . . . . . . . . . . . . . . . . . . . . . . . . . . . . . . . . . . . . . . . . . . . . . . . . . . . . . . . . . . . . . . . . . . . . . . . . . . . . . . . . . . . . . . . . . . . . . . . . . . . . . . . . . . . . . . . . . . . . . . . . . . . . . . . . . . . . . . . . . . . . . . . . . . . 0
2840 Accrued Workplace Safety and Insurance Board claims (WSIB) . . . . . . . . . . . . . . . . . . . . . . . . . . . . . . . . . . . . . . . . . . . . . . . . . . . . . . . . . . . . . . . . . . . . . . . . . . . . . . . . . . . . . . . . . . . . . . . . . . . . . . . . . . . . . . . . . . . . . . . . . . . . . . . . . . . . . . . . . . . . . . . . . . . . . 621,354
2898 Other Accrued Retirement Benefits Payable . . . . . . . . . . . . . . . . . . . . . . . . . . . . . . . . . . . . . . . . . . . . . . . . . . . . . . . . . . . . . . . . . . . . . . . . . . . . . . 17,767,813
2899 Subtotal post employment benefits 21,659,509
Liability for contaminated sites
2910 Remediation costs of contaminated sites . . . . . . . . . . . . . . . . . . . . . . . . . . . . . . . . . . . . . . . . . . . . . . . . . . . . . . . . . . . . . . . . . . . . . . . . . . . . . . . . . . . . . . . . . . . . . . . . . . . . . . . . . . . . . . . . . . . . . . . . . . . . . . . . . . . . . . . . . . . . . . . . . . . . . 20,833,965
9940 TOTAL Liabilities 210,219,579
9945 Net Financial Assets / Net Debt (Total Financial Assets LESS Total Liabilities) 82,124,812
Non-Financial Assets 1
$
6210 Tangible Capital Assets (SLC 51 9921 11). . . . . . . . . . . . . . . . . . . . . . . . . . . . . . . . . . . . . . . . . . . . . . . . . . . . . . . . . . . . . . . . . . . . . . . . . . . . . . . . . . . . . . . . . . . . . . . . . . . . . . . . . . . . . . . . . . . . . . . . . . . . . . . . . . . . . . . . . . . . . . . . . . . . .705,483,548
6250 Inventories of Supplies . . . . . . . . . . . . . . . . . . . . . . . . . . . . . . . . . . . . . . . . . . . . . . . . . . . . . . . . . . . . . . . . . . . . . . . . . . . . . . . . . . . . . . . . . . . . . . . . . . . . . . . . . . . . . . . . . . . . . . . . . . . . . . . . . . . . . . . . . . . . . . . . . . . . .8,111,375
6260 Prepaid Expenses . . . . . . . . . . . . . . . . . . . . . . . . . . . . . . . . . . . . . . . . . . . . . . . . . . . . . . . . . . . . . . . . . . . . . . . . . . . . . . . . . . . . . . . . . . . . . . . . . . . . . . . . . . . . . . . . . . . . . . . . . . . . . . . . . . . . . . . . . . . . . . . . . . . . .5,326,868
6299 Total Non-Financial Assets 718,921,791
9970 Total Accumulated Surplus/(Deficit) 801,046,603
Analysis of the Accumulated Surplus/(Deficit) 1
$
6410 Equity in Tangible Capital Assets . . . . . . . . . . . . . . . . . . . . . . . . . . . . . . . . . . . . . . . . . . . . . . . . . . . . . . . . . . . . . . . . . . . . . . . . . . . . . . . . . . . . . . . . . . . . . . . . . . . . . . . . . . . . . . . . . . . . . . . . . . . . . . . . . . . . . . . . . . . . . . . . . . . . . 705,483,548
6420 Reserves and Reserve Funds (SLC 60 2099 02 + SLC 60 2099 03) . . . . . . . . . . . . . . . . . . . . . . . . . . . . . . . . . . . . . . . . . . . . . . . . . . . . . . . . . . . . . . . . . . . . . . . . . . . . . . . . . . . . . . . . . . . . . . . . . . . . . . . . . . . . . . . . . . . . . . . . . . . . . . . . . . . . . . . . . . . . . . . . . . . . . 123,917,248
6430 General Surplus/ (Deficit) . . . . . . . . . . . . . . . . . . . . . . . . . . . . . . . . . . . . . . . . . . . . . . . . . . . . . . . . . . . . . . . . . . . . . . . . . . . . . . . . . . . . . . . . . . . . . . . . . . . . . . . . . . . . . . . . . . . . . . . . . . . . . . . . . . . . . . . . . . . . . . . . . . . . . 200,638
6431 Unexpended capital financing . . . . . . . . . . . . . . . . . . . . . . . . . . . . . . . . . . . . . . . . . . . . . . . . . . . . . . . . . . . . . . . . . . . . . . . . . . . . . . . . . . . . . . . . . . . . . . . . . . . . . . . . . . . . . . . . . . . . . . . . . . . . . . . . . . . . . . . . . . . . . . . . . . . . . 15,546,387
Local boards
5030 Transit operations . . . . . . . . . . . . . . . . . . . . . . . . . . . . . . . . . . . . . . . . . . . . . . . . . . . . . . . . . . . . . . . . . . . . . . . . . . . . . . . . . . . . . . . . . . . . . . . . . . . . . . . . . . . . . . . . . . . . . . . . . . . . . . . . . . . . . . . . . . . . . . . . . . . . . 0
5035 Water operations . . . . . . . . . . . . . . . . . . . . . . . . . . . . . . . . . . . . . . . . . . . . . . . . . . . . . . . . . . . . . . . . . . . . . . . . . . . . . . . . . . . . . . . . . . . . . . . . . . . . . . . . . . . . . . . . . . . . . . . . . . . . . . . . . . . . . . . . . . . . . . . . . . . . . 0
5040 Wastewater operations . . . . . . . . . . . . . . . . . . . . . . . . . . . . . . . . . . . . . . . . . . . . . . . . . . . . . . . . . . . . . . . . . . . . . . . . . . . . . . . . . . . . . . . . . . . . . . . . . . . . . . . . . . . . . . . . . . . . . . . . . . . . . . . . . . . . . . . . . . . . . . . . . . . . . 0
5041 Solid waste operations . . . . . . . . . . . . . . . . . . . . . . . . . . . . . . . . . . . . . . . . . . . . . . . . . . . . . . . . . . . . . . . . . . . . . . . . . . . . . . . . . . . . . . . . . . . . . . . . . . . . . . . . . . . . . . . . . . . . . . . . . . . . . . . . . . . . . . . . . . . . . . . . . . . . . 0
5045 Libraries . . . . . . . . . . . . . . . . . . . . . . . . . . . . . . . . . . . . . . . . . . . . . . . . . . . . . . . . . . . . . . . . . . . . . . . . . . . . . . . . . . . . . . . . . . . . . . . . . . . . . . . . . . . . . . . . . . . . . . . . . . . . . . . . . . . . . . . . . . . . . . . . . . . . . 0
5050 Cemeteries . . . . . . . . . . . . . . . . . . . . . . . . . . . . . . . . . . . . . . . . . . . . . . . . . . . . . . . . . . . . . . . . . . . . . . . . . . . . . . . . . . . . . . . . . . . . . . . . . . . . . . . . . . . . . . . . . . . . . . . . . . . . . . . . . . . . . . . . . . . . . . . . . . . . . 0
5055 Recreation, community centres and arenas . . . . . . . . . . . . . . . . . . . . . . . . . . . . . . . . . . . . . . . . . . . . . . . . . . . . . . . . . . . . . . . . . . . . . . . . . . . . . . . . . . . . . . . . . . . . . . . . . . . . . . . . . . . . . . . . . . . . . . . . . . . . . . . . . . . . . . . . . . . . . . . . . . . . . 0
5060 Business Improvement Area . . . . . . . . . . . . . . . . . . . . . . . . . . . . . . . . . . . . . . . . . . . . . . . . . . . . . . . . . . . . . . . . . . . . . . . . . . . . . . . . . . . . . . . . . . . . . . . . . . . . . . . . . . . . . . . . . . . . . . . . . . . . . . . . . . . . . . . . . . . . . . . . . . . . . 3,233
5076 Other Brantford Municipal Non-Profit Housing . . . . . . . . . . . . . . . . . . . . . . . . . . . . . . . . . . . . . . . . . . . . . . . . . . . . . . . . . . . . . . . . . . . . . . . . . . . . . . 27,841
5077 Other . . . . . . . . . . . . . . . . . . . . . . . . . . . . . . . . . . . . . . . . . . . . . . . . . . . . . . . . . . . . . . . . . . . . . . . . . . . . . . 0
5078 Other . . . . . . . . . . . . . . . . . . . . . . . . . . . . . . . . . . . . . . . . . . . . . . . . . . . . . . . . . . . . . . . . . . . . . . . . . . . . . . 0
5079 Other Land Inventory . . . . . . . . . . . . . . . . . . . . . . . . . . . . . . . . . . . . . . . . . . . . . . . . . . . . . . . . . . . . . . . . . . . . . . . . . . . . . . 7,368,653
5098 Total Local Boards 7,399,727
5080 Equity in Government Business Enterprises (SLC 10 6090 01) . . . . . . . . . . . . . . . . . . . . . . . . . . . . . . . . . . . . . . . . . . . . . . . . . . . . . . . . . . . . . . . . . . . . . . . . . . . . . . . . . . . . . . . . . . . . . . . . . . . . . . . . . . . . . . . . . . . . . . . . . . . . . . . . . . . . . . . . . . . . . . . . . . . . 58,221,227
6601 Unfunded Employee Benefits . . . . . . . . . . . . . . . . . . . . . . . . . . . . . . . . . . . . . . . . . . . . . . . . . . . . . . . . . . . . . . . . . . . . . . . . . . . . . . . . . . . . . . . . . . . . . . . . . . . . . . . . . . . . . . . . . . . . . . . . . . . . . . . . . . . . . . . . . . . . . . . . . . . .-21,659,509
6602 Unfunded Landfill closure costs . . . . . . . . . . . . . . . . . . . . . . . . . . . . . . . . . . . . . . . . . . . . . . . . . . . . . . . . . . . . . . . . . . . . . . . . . . . . . . . . . . . . . . . . . . . . . . . . . . . . . . . . . . . . . . . . . . . . . . . . . . . . . . . . . . . . . . . . . . . . . . . . . . . .-28,511,294
6603 Unfunded Remediation costs of contaminated sites . . . . . . . . . . . . . . . . . . . . . . . . . . . . . . . . . . . . . . . . . . . . . . . . . . . . . . . . . . . . . . . . . . . . . . . . . . . . . . . . . . . . . . . . . . . . . . . . . . . . . . . . . . . . . . . . . . . . . . . . . . . . . . . . . . . . . . . . . . . . . . . . . -20,833,965
6610 Other Debt . . . . . . . . . . . . . . . . . . . . . . . . . . . . . . . . . . . . . . . . . . . . . . . . . . . . . . . . . . . . . . . . . . . . . . . . . . . . . .-43,285,916
6620 Other Accrued interest on debt . . . . . . . . . . . . . . . . . . . . . . . . . . . . . . . . . . . . . . . . . . . . . . . . . . . . . . . . . . . . . . . . . . . . . . . . . . . . . . -458,155
6630 Other Prepaid Expense - 1 Market Square Lease . . . . . . . . . . . . . . . . . . . . . . . . . . . . . . . . . . . . . . . . . . . . . . . . . . . . . . . . . . . . . . . . . . . . . . . . . . . . . . 5,026,667
6640 Other . . . . . . . . . . . . . . . . . . . . . . . . . . . . . . . . . . . . . . . . . . . . . . . . . . . . . . . . . . . . . . . . . . . . . . . . . . . . . . 0
6699 Total Other -109,722,172
9971 Total Accumulated Surplus/(Deficit) 801,046,603
Page 178

2015 Financial Information Return - Schedule 72 - Continuity of Taxes ReceivableProvince of Ontario - Ministry of Municipal Affairs and Housing 16.06.2016 15:102015-V01
FIR2015: Brantford C Single/Lower-Tier ONLY Schedule 72Asmt Code: 2906 CONTINUITY OF TAXES RECEIVABLEMAH Code: 40101 for the year ended December 31, 2015
Continuity of Taxes Receivable 9
$
0210 Taxes receivable, beginning of year . . . . . . . . . . . . . . . . . . . . . . . . . . . . . . . . . . . . . . . . . . . . . . . . . . . . . . . . . . . . . . . . . . . . . . . . . . . . . . . . . . . . . . . . . . . . . . . . . . 4,865,004
0215 PLUS: Amounts added to tax bills for collection purposes only . . . . . . . . . . . . . . . . . . . . . . . . . . . . . . . . . . . . . . . . . . . . . . . . . . . . . . . . . . . . . . . . . . . . . . . . . . . . . . . . . . . . . . . . . . . . . . . . . . 345,200
0220 PLUS: Tax amounts levied in the year (SLC 26 9199 03) . . . . . . . . . . . . . . . . . . . . . . . . . . . . . . . . . . . . . . . . . . . . . . . . . . . . . . . . . . . . . . . . . . . . . . . . . . . . . . . . . . . . . . . . . . . . . . . . . . 165,860,258
0225 PLUS: Current Year Penalties and Interest . . . . . . . . . . . . . . . . . . . . . . . . . . . . . . . . . . . . . . . . . . . . . . . . . . . . . . . . . . . . . . . . . . . . . . . . . . . . . . . . . . . . . . . . . . . . . . . . . . 1,643,994
0240 LESS: Total cash collections (SLC 72 0699 09) . . . . . . . . . . . . . . . . . . . . . . . . . . . . . . . . . . . . . . . . . . . . . . . . . . . . . . . . . . . . . . . . . . . . . . . . . . . . . . . . . . . . . . . . . . . . . . . . . . 164,058,073
0250 LESS: Tax adjustments before allowances (SLC 72 2899 09) . . . . . . . . . . . . . . . . . . . . . . . . . . . . . . . . . . . . . . . . . . . . . . . . . . . . . . . . . . . . . . . . . . . . . . . . . . . . . . . . . . . . . . . . . . . . . . . . . . 3,958,818
0260 LESS: Tax adjustments not applied to taxation (SLC 72 4999 09) . . . . . . . . . . . . . . . . . . . . . . . . . . . . . . . . . . . . . . . . . . . . . . . . . . . . . . . . . . . . . . . . . . . . . . . . . . . . . . . . . . . . . . . . . . . . . . . . . . 0
0280 PLUS: Allowance Adjustment . . . . . . . . . . . . . . . . . . . . . . . . . . . . . . . . . . . . . . . . . . . . . . . . . . . . . . . . . . . . . . . . . . . . . . . . . . . . . . . . . . . . . . . . . . . . . . . . . . 794,020
0290 Taxes receivable, end of year . . . . . . . . . . . . . . . . . . . . . . . . . . . . . . . . . . . . . . . . . . . . . . . . . . . . . . . . . . . . . . . . . . . . . . . . . . . . . . . . . . . . . . . . . . . . . . . . . . 5,491,585
Cash Collections 9
$
0610 Current year's tax . . . . . . . . . . . . . . . . . . . . . . . . . . . . . . . . . . . . . . . . . . . . . . . . . . . . . . . . . . . . . . . . . . . . . . . . . . . . . . . . . . . . . . . . . . . . . . . . . . 159,293,738
0620 Previous year's tax . . . . . . . . . . . . . . . . . . . . . . . . . . . . . . . . . . . . . . . . . . . . . . . . . . . . . . . . . . . . . . . . . . . . . . . . . . . . . . . . . . . . . . . . . . . . . . . . . . 2,772,215
0630 Penalties and interest . . . . . . . . . . . . . . . . . . . . . . . . . . . . . . . . . . . . . . . . . . . . . . . . . . . . . . . . . . . . . . . . . . . . . . . . . . . . . . . . . . . . . . . . . . . . . . . . . . 1,646,920
0640 Amounts added to tax bills for collection purposes only . . . . . . . . . . . . . . . . . . . . . . . . . . . . . . . . . . . . . . . . . . . . . . . . . . . . . . . . . . . . . . . . . . . . . . . . . . . . . . . . . . . . . . . . . . . . . . . . . . 345,200
0690 Other . . . . . . . . . . . . . . . . . . . . . . . . . . . . . . . . . . . . . . . . . . . . . . . . . . . . . . . . . . . . . . . . . . . . . . . . . . . . . . . . . . . . . . . . . . . . . . . . . .
0699 TOTAL Cash Collections 164,058,073
Page 179

2015 Financial Information Return - Schedule 72 - Continuity of Taxes ReceivableProvince of Ontario - Ministry of Municipal Affairs and Housing 16.06.2016 15:102015-V01
FIR2015: Brantford C Single/Lower-Tier ONLY Schedule 72Asmt Code: 2906 CONTINUITY OF TAXES RECEIVABLEMAH Code: 40101 for the year ended December 31, 2015
SCHOOL BOARDS
English - Public French - Public English - Separate French - Separate Other TOTAL EducationLower-Tier (Single-
Tier)Upper-Tier
TOTAL Tax
Adjustment
Tax Adjustments Applied to Taxation 1 2 3 4 5 6 7 8 9
$ $ $ $ $ $ $ $ $
1099 Municipal Act (353, 354, 357, 358, RfR) . . . . . . . . . . . . . . . . . . . . . . . . . . . . . . . . . . . . . . . . 1,099,156 3,588 417,988 8,647 1,529,379 1,455,744 2,985,123
1299 Discounts for Advance Payments (Mun. Act 345(10)) . . . . . . . . . . . . . . . . . . . . . . . . . . . . . . . . . . . . . . . . . . . . . . . 0
1499 Tax Credit (Mun. Act 474.3) . . . . . . . . . . . . . . . . . . . . . . . . . . . . . . . . . . . . . . . . . . . . 0
1699 Tax Cancellation - Low income seniors and Disabled persons (Mun. Act 319) . . . . . . . . . . . . . . . . . . . . . . . . . . . . . . . . 0 0
1810 Rebates to Commercial properties (Mun. Act 362) . . . . . . . . . . . . . . . . . . . . . . . . . . . . . . . . . . . . . . . . . 0 0
1820 Rebates to Industrial properties (Mun. Act 362) . . . . . . . . . . . . . . . . . . . . . . . . . . . . . . . . . . . . . . . . . . . 0 0
1899 Subtotal 0 0 0 0 0 0 0 0 0
2099 Rebates for Charities (Mun. Act 361) . . . . . . . . . . . . . . . . . . . . . . . . . . . . . . . . . . . . . . . . . . . 46,406 112 17,842 431 64,791 153,436 218,227
2299 Vacant Unit Rebates (Mun. Act 364) . . . . . . . . . . . . . . . . . . . . . . . . . . . . . . . . . . . . . . . . . . . . . . 208,917 502 80,229 1,954 291,602 463,866 755,468
2399 Reduction for Heritage Property (Mun. Act 365.2) . . . . . . . . . . . . . . . . . . . . . . . . . . . . . . . . . . . . . . . . . . . . . . . . . . . . . . 0 0
2890 Other . . . . . . . . . . . . . . . . . . . . . . . . . . . . . . . . . . . . . . . . . . . . . . . . . . . . . . . . . . . . . . . . . . . . . . . . . . . . . . . . . . . . . . . . . . . . . . . . . . 0 0
2891 Other . . . . . . . . . . . . . . . . . . . . . . . . . . . . . . . . . . . . . . . . . . . . . . . . . . . . . . . . . . . . . . . . . . . . . . . . . . . . . . . . . . . . . . . . . . . . . . . . . . 0 0
2892 Other . . . . . . . . . . . . . . . . . . . . . . . . . . . . . . . . . . . . . . . . . . . . . . . . . . . . . . . . . . . . . . . . . . . . . . . . . . . . . . . . . . . . . . . . . . . . . . . . . . 0 0
2893 Other . . . . . . . . . . . . . . . . . . . . . . . . . . . . . . . . . . . . . . . . . . . . . . . . . . . . . . . . . . . . . . . . . . . . . . . . . . . . . . . . . . . . . . . . . . . . . . . . . . 0 0
2899 Tax adjustments before allowances 1,354,479 4,202 516,059 11,032 0 1,885,772 2,073,046 0 3,958,818
SCHOOL BOARDS
English - Public French - Public English - Separate French - Separate Other TOTAL EducationLower-Tier (Single-
Tier)Upper-Tier
TOTAL Tax
Adjustment
Tax Adjustments Not Applied to Taxation 1 2 3 4 5 6 7 8 9
$ $ $ $ $ $ $ $ $
4010 Tax sale, Tax registration accounts . . . . . . . . . . . . . . . . . . . . . . . . . . . . . . . . . . . . . . . . . . . . . . . . . . 0
4210 Tax Deferral - Low income seniors and Disabled persons (Mun. Act 319) . . . . . . . . . . . . . . . . . . . . . . . . . . . . . . . . . . . . . . . . . . . 0 0
4420 Net Impact of 5% Capping Limit Program . . . . . . . . . . . . . . . . . . . . . . . . . . . . . . . . . . . . . . . . . . . . . . . 0 0
4890 Other . . . . . . . . . . . . . . . . . . . . . . . . . . . . . . . . . . . . . . . . . . . . . . . . . . . . . . . . . . . . . . . . . . . . . . . . . . . . . . . . . . . . . . . . . . . . . . . . . . 0 0
4891 Other . . . . . . . . . . . . . . . . . . . . . . . . . . . . . . . . . . . . . . . . . . . . . . . . . . . . . . . . . . . . . . . . . . . . . . . . . . . . . . . . . . . . . . . . . . . . . . . . . . 0 0
4999 Tax Adjustments Not Applied to Taxation 0 0 0 0 0 0 0 0 0
Additional Information
6010 Recovery of Tax Deferrals . . . . . . . . . . . . . . . . . . . . . . . . . . . . . . . . . . . . . . . . . . . . . . . . . . . . . . . . . . . . 0 0
7010 Entitlement of School Boards . . . . . . . . . . . . . . . . . . . . . . . . . . . . . . . . . . . . . . . . . . . . . . . . . . . . . . . . . . . . . 25,969,104 51,214 7,999,027 208,344 0 34,227,690
Page 180
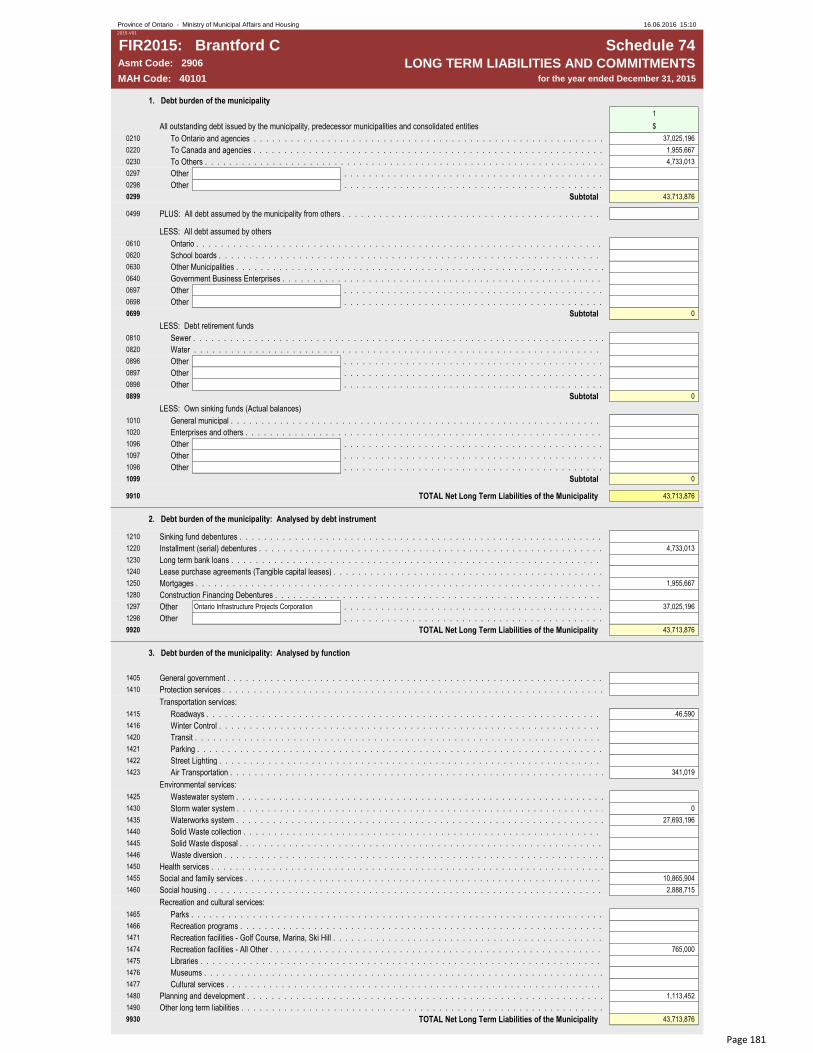
2015 Financial Information Return - Schedule 74 - Long Term Liabilities and CommitmentsProvince of Ontario - Ministry of Municipal Affairs and Housing 16.06.2016 15:102015-V01
FIR2015: Brantford C Schedule 74Asmt Code: 2906 LONG TERM LIABILITIES AND COMMITMENTSMAH Code: 40101 for the year ended December 31, 2015
1. Debt burden of the municipality
1
All outstanding debt issued by the municipality, predecessor municipalities and consolidated entities $
0210 To Ontario and agencies . . . . . . . . . . . . . . . . . . . . . . . . . . . . . . . . . . . . . . . . . . . . . . . . . . . . . . . . . . . . . . . . . . . . . . . . . . . . . . . . . . . . . . . . . . . . . . . . . . 37,025,196
0220 To Canada and agencies . . . . . . . . . . . . . . . . . . . . . . . . . . . . . . . . . . . . . . . . . . . . . . . . . . . . . . . . . . . . . . . . . . . . . . . . . . . . . . . . . . . . . . . . . . . . . . . . . . 1,955,667
0230 To Others . . . . . . . . . . . . . . . . . . . . . . . . . . . . . . . . . . . . . . . . . . . . . . . . . . . . . . . . . . . . . . . . . . . . . . . . . . . . . . . . . . . . . . . . . . . . . . . . . . 4,733,013
0297 Other . . . . . . . . . . . . . . . . . . . . . . . . . . . . . . . . . . . . . . . . . . . . . . . . . . . . . . . . . . . . . . . . . . . . . . . . . . . . . . . . . . . . . . . . . . . . . . . . . . . . . . . . . . . . . . . . . . . . . . . .
0298 Other . . . . . . . . . . . . . . . . . . . . . . . . . . . . . . . . . . . . . . . . . . . . . . . . . . . . . . . . . . . . . . . . . . . . . . . . . . . . . . . . . . . . . . . . . . . . . . . . . . . . . . . . . . . . . . . . . . . . . . . .
0299 Subtotal 43,713,876
0499 PLUS: All debt assumed by the municipality from others . . . . . . . . . . . . . . . . . . . . . . . . . . . . . . . . . . . . . . . . . . . . . . . . . . . . . . . . . . . . . . . . . . . . . . . . . . . . . . . . . . . . . . . . . . . . . . . . . .
LESS: All debt assumed by others
0610 Ontario . . . . . . . . . . . . . . . . . . . . . . . . . . . . . . . . . . . . . . . . . . . . . . . . . . . . . . . . . . . . . . . . . . . . . . . . . . . . . . . . . . . . . . . . . . . . . . . . . .
0620 School boards . . . . . . . . . . . . . . . . . . . . . . . . . . . . . . . . . . . . . . . . . . . . . . . . . . . . . . . . . . . . . . . . . . . . . . . . . . . . . . . . . . . . . . . . . . . . . . . . . .
0630 Other Municipalities . . . . . . . . . . . . . . . . . . . . . . . . . . . . . . . . . . . . . . . . . . . . . . . . . . . . . . . . . . . . . . . . . . . . . . . . . . . . . . . . . . . . . . . . . . . . . . . . . .
0640 Government Business Enterprises . . . . . . . . . . . . . . . . . . . . . . . . . . . . . . . . . . . . . . . . . . . . . . . . . . . . . . . . . . . . . . . . . . . . . . . . . . . . . . . . . . . . . . . . . . . . . . . . . .
0697 Other . . . . . . . . . . . . . . . . . . . . . . . . . . . . . . . . . . . . . . . . . . . . . . . . . . . . . . . . . . . . . . . . . . . . . . . . . . . . . . . . . . . . . . . . . . . . . . . . . . . . . . . . . . . . . . . . . . . . . . . .
0698 Other . . . . . . . . . . . . . . . . . . . . . . . . . . . . . . . . . . . . . . . . . . . . . . . . . . . . . . . . . . . . . . . . . . . . . . . . . . . . . . . . . . . . . . . . . . . . . . . . . . . . . . . . . . . . . . . . . . . . . . . .
0699 Subtotal 0
LESS: Debt retirement funds
0810 Sewer . . . . . . . . . . . . . . . . . . . . . . . . . . . . . . . . . . . . . . . . . . . . . . . . . . . . . . . . . . . . . . . . . . . . . . . . . . . . . . . . . . . . . . . . . . . . . . . . . .
0820 Water . . . . . . . . . . . . . . . . . . . . . . . . . . . . . . . . . . . . . . . . . . . . . . . . . . . . . . . . . . . . . . . . . . . . . . . . . . . . . . . . . . . . . . . . . . . . . . . . . .
0896 Other . . . . . . . . . . . . . . . . . . . . . . . . . . . . . . . . . . . . . . . . . . . . . . . . . . . . . . . . . . . . . . . . . . . . . . . . . . . . . . . . . . . . . . . . . . . . . . . . . . . . . . . . . . . . . . . . . . . . . . . .
0897 Other . . . . . . . . . . . . . . . . . . . . . . . . . . . . . . . . . . . . . . . . . . . . . . . . . . . . . . . . . . . . . . . . . . . . . . . . . . . . . . . . . . . . . . . . . . . . . . . . . . . . . . . . . . . . . . . . . . . . . . . .
0898 Other . . . . . . . . . . . . . . . . . . . . . . . . . . . . . . . . . . . . . . . . . . . . . . . . . . . . . . . . . . . . . . . . . . . . . . . . . . . . . . . . . . . . . . . . . . . . . . . . . . . . . . . . . . . . . . . . . . . . . . . .
0899 Subtotal 0
LESS: Own sinking funds (Actual balances)
1010 General municipal . . . . . . . . . . . . . . . . . . . . . . . . . . . . . . . . . . . . . . . . . . . . . . . . . . . . . . . . . . . . . . . . . . . . . . . . . . . . . . . . . . . . . . . . . . . . .
1020 Enterprises and others . . . . . . . . . . . . . . . . . . . . . . . . . . . . . . . . . . . . . . . . . . . . . . . . . . . . . . . . . . . . . . . . . . . . . . . . . . . . . . . . . . . . . . . . . . . . . . . . . . . .
1096 Other . . . . . . . . . . . . . . . . . . . . . . . . . . . . . . . . . . . . . . . . . . . . . . . . . . . . . . . . . . . . . . . . . . . . . . . . . . . . . . . . . . . . . . . . . . . . . . . . . . . . . . . . . . . . . . . . . . . . . . . .
1097 Other . . . . . . . . . . . . . . . . . . . . . . . . . . . . . . . . . . . . . . . . . . . . . . . . . . . . . . . . . . . . . . . . . . . . . . . . . . . . . . . . . . . . . . . . . . . . . . . . . . . . . . . . . . . . . . . . . . . . . . . .
1098 Other . . . . . . . . . . . . . . . . . . . . . . . . . . . . . . . . . . . . . . . . . . . . . . . . . . . . . . . . . . . . . . . . . . . . . . . . . . . . . . . . . . . . . . . . . . . . . . . . . . . . . . . . . . . . . . . . . . . . . . . .
1099 Subtotal 0
9910 TOTAL Net Long Term Liabilities of the Municipality 43,713,876
2. Debt burden of the municipality: Analysed by debt instrument
1210 Sinking fund debentures . . . . . . . . . . . . . . . . . . . . . . . . . . . . . . . . . . . . . . . . . . . . . . . . . . . . . . . . . . . . . . . . . . . . . . . . . . . . . . . . . . . . . . . . . . . . . . . . . . . . . . . .
1220 Installment (serial) debentures . . . . . . . . . . . . . . . . . . . . . . . . . . . . . . . . . . . . . . . . . . . . . . . . . . . . . . . . . . . . . . . . . . . . . . . . . . . . . . . . . . . . . . . . . . . . . . . . . . . 4,733,013
1230 Long term bank loans . . . . . . . . . . . . . . . . . . . . . . . . . . . . . . . . . . . . . . . . . . . . . . . . . . . . . . . . . . . . . . . . . . . . . . . . . . . . . . . . . . . . . . . . . . . . . . . . . . . . . . . .
1240 Lease purchase agreements (Tangible capital leases) . . . . . . . . . . . . . . . . . . . . . . . . . . . . . . . . . . . . . . . . . . . . . . . . . . . . . . . . . . . . . . . . . . . . . . . . . . . . . . . . . . . . . . . . . . . . .
1250 Mortgages . . . . . . . . . . . . . . . . . . . . . . . . . . . . . . . . . . . . . . . . . . . . . . . . . . . . . . . . . . . . . . . . . . . . . . . . . . . . . . . . . . . . . . . . . . . . . . . . . . . . . . . . . . . . . . . . . . . . . . . . . . 1,955,667
1280 Construction Financing Debentures . . . . . . . . . . . . . . . . . . . . . . . . . . . . . . . . . . . . . . . . . . . . . . . . . . . . . . . . . . . . . . . . . . . . . . . . . . . . . . . . . . . . . . . . . . . . . . . . . . . . . . . . . .
1297 Other Ontario Infrastructure Projects Corporation . . . . . . . . . . . . . . . . . . . . . . . . . . . . . . . . . . . . . . . . . . . . . . . . . . . . . . . . . . . . . . . . . . . . . . . . . . . . . . . . . . . . . . . . . . . . . . . . . . . . . . . . . . . . . . . . . . . . . . . . 37,025,196
1298 Other . . . . . . . . . . . . . . . . . . . . . . . . . . . . . . . . . . . . . . . . . . . . . . . . . . . . . . . . . . . . . . . . . . . . . . . . . . . . . . . . . . . . . . . . . . . . . . . . . . . . . . . . . . . . . . . . . . . . . . . .
9920 TOTAL Net Long Term Liabilities of the Municipality 43,713,876
3. Debt burden of the municipality: Analysed by function
1405 General government . . . . . . . . . . . . . . . . . . . . . . . . . . . . . . . . . . . . . . . . . . . . . . . . . . . . . . . . . . . . . . . . . . . . . . . . . . . . . . . . . . . . . . . . . . . . . . . . . . . . . . . . . . . . . . . . .
1410 Protection services . . . . . . . . . . . . . . . . . . . . . . . . . . . . . . . . . . . . . . . . . . . . . . . . . . . . . . . . . . . . . . . . . . . . . . . . . . . . . . . . . . . . . . . . . . . . . . . . . . . . . . . . . . . . .
Transportation services:
1415 Roadways . . . . . . . . . . . . . . . . . . . . . . . . . . . . . . . . . . . . . . . . . . . . . . . . . . . . . . . . . . . . . . . . . . . . . . . . . . . . . . . . . . . . . . . . . . . . . . . . . . . . . . . . . . . . . . . . 46,590
1416 Winter Control . . . . . . . . . . . . . . . . . . . . . . . . . . . . . . . . . . . . . . . . . . . . . . . . . . . . . . . . . . . . . . . . . . . . . . . . . . . . . . . . . . . . . . . . . . . . . . . . . . . . . . . . . . . . . . . .
1420 Transit . . . . . . . . . . . . . . . . . . . . . . . . . . . . . . . . . . . . . . . . . . . . . . . . . . . . . . . . . . . . . . . . . . . . . . . . . . . . . . . . . . . . . . . . . . . . . . . . . . . . . . . . . . . . . . . . . . . . . . .
1421 Parking . . . . . . . . . . . . . . . . . . . . . . . . . . . . . . . . . . . . . . . . . . . . . . . . . . . . . . . . . . . . . . . . . . . . . . . . . . . . . . . . . . . . . . . . . . . . . . . . . . . . . . . . . . . . . . . . . . . . . . .
1422 Street Lighting . . . . . . . . . . . . . . . . . . . . . . . . . . . . . . . . . . . . . . . . . . . . . . . . . . . . . . . . . . . . . . . . . . . . . . . . . . . . . . . . . . . . . . . . . . . . . . . . . . . . . . . . . . . . . . . . . . . . . . .
1423 Air Transportation . . . . . . . . . . . . . . . . . . . . . . . . . . . . . . . . . . . . . . . . . . . . . . . . . . . . . . . . . . . . . . . . . . . . . . . . . . . . . . . . . . . . . . . . . . . . . . . . . . . . . . . . . . . . . . . . . . . . . . . 341,019
Environmental services:
1425 Wastewater system . . . . . . . . . . . . . . . . . . . . . . . . . . . . . . . . . . . . . . . . . . . . . . . . . . . . . . . . . . . . . . . . . . . . . . . . . . . . . . . . . . . . . . . . . . . . . . . . . . . . .
1430 Storm water system . . . . . . . . . . . . . . . . . . . . . . . . . . . . . . . . . . . . . . . . . . . . . . . . . . . . . . . . . . . . . . . . . . . . . . . . . . . . . . . . . . . . . . . . . . . . . . . . . . . . . . . . . 0
1435 Waterworks system . . . . . . . . . . . . . . . . . . . . . . . . . . . . . . . . . . . . . . . . . . . . . . . . . . . . . . . . . . . . . . . . . . . . . . . . . . . . . . . . . . . . . . . . . . . . . . . . . . . . . . . . . 27,693,196
1440 Solid Waste collection . . . . . . . . . . . . . . . . . . . . . . . . . . . . . . . . . . . . . . . . . . . . . . . . . . . . . . . . . . . . . . . . . . . . . . . . . . . . . . . . . . . . . . . . . . . . . . . . . . . . . . . . .
1445 Solid Waste disposal . . . . . . . . . . . . . . . . . . . . . . . . . . . . . . . . . . . . . . . . . . . . . . . . . . . . . . . . . . . . . . . . . . . . . . . . . . . . . . . . . . . . . . . . . . . . . . . . . . . . . . . . .
1446 Waste diversion . . . . . . . . . . . . . . . . . . . . . . . . . . . . . . . . . . . . . . . . . . . . . . . . . . . . . . . . . . . . . . . . . . . . . . . . . . . . . . . . . . . . . . . . . . . . . . . . . . . . . . . . .
1450 Health services . . . . . . . . . . . . . . . . . . . . . . . . . . . . . . . . . . . . . . . . . . . . . . . . . . . . . . . . . . . . . . . . . . . . . . . . . . . . . . . . . . . . . . . . . . . . . . . . . . . . . . . . . . .
1455 Social and family services . . . . . . . . . . . . . . . . . . . . . . . . . . . . . . . . . . . . . . . . . . . . . . . . . . . . . . . . . . . . . . . . . . . . . . . . . . . . . . . . . . . . . . . . . . . . . . . . . . . . 10,865,904
1460 Social housing . . . . . . . . . . . . . . . . . . . . . . . . . . . . . . . . . . . . . . . . . . . . . . . . . . . . . . . . . . . . . . . . . . . . . . . . . . . . . . . . . . . . . . . . . . . . . . . . . . . . . . . 2,888,715
Recreation and cultural services:
1465 Parks . . . . . . . . . . . . . . . . . . . . . . . . . . . . . . . . . . . . . . . . . . . . . . . . . . . . . . . . . . . . . . . . . . . . . . . . . . . . . . . . . . . . . . . . . . . . . . . . . . . . . . . . . . . .
1466 Recreation programs . . . . . . . . . . . . . . . . . . . . . . . . . . . . . . . . . . . . . . . . . . . . . . . . . . . . . . . . . . . . . . . . . . . . . . . . . . . . . . . . . . . . . . . . . . . . . . . . . . . . . . . . . . . .
1471 Recreation facilities - Golf Course, Marina, Ski Hill . . . . . . . . . . . . . . . . . . . . . . . . . . . . . . . . . . . . . . . . . . . . . . . . . . . . . . . . . . . . . . . . . . . . . . . . . . . . . . . . . . . . . . . . . . . . . . . . . .
1474 Recreation facilities - All Other . . . . . . . . . . . . . . . . . . . . . . . . . . . . . . . . . . . . . . . . . . . . . . . . . . . . . . . . . . . . . . . . . . . . . . . . . . . . . . . . . . . . . . . . . . . . . . . . . . 765,000
1475 Libraries . . . . . . . . . . . . . . . . . . . . . . . . . . . . . . . . . . . . . . . . . . . . . . . . . . . . . . . . . . . . . . . . . . . . . . . . . . . . . . . . . . . . . . . . . . . . . . . . . . . . . . . . . . . . . . . . .
1476 Museums . . . . . . . . . . . . . . . . . . . . . . . . . . . . . . . . . . . . . . . . . . . . . . . . . . . . . . . . . . . . . . . . . . . . . . . . . . . . . . . . . . . . . . . . . . . . . . . . . . . . . . . . . . . . . . . . .
1477 Cultural services . . . . . . . . . . . . . . . . . . . . . . . . . . . . . . . . . . . . . . . . . . . . . . . . . . . . . . . . . . . . . . . . . . . . . . . . . . . . . . . . . . . . . . . . . . . . . . . . . . . . . . . . . . . . . . . . .
1480 Planning and development . . . . . . . . . . . . . . . . . . . . . . . . . . . . . . . . . . . . . . . . . . . . . . . . . . . . . . . . . . . . . . . . . . . . . . . . . . . . . . . . . . . . . . . . . . . . . . . . . . . . . . . . . . . 1,113,452
1490 Other long term liabilities . . . . . . . . . . . . . . . . . . . . . . . . . . . . . . . . . . . . . . . . . . . . . . . . . . . . . . . . . . . . . . . . . . . . . . . . . . . . . . . . . . . . . . . . . . . . . . . . . . . . . . . . . . . . .
9930 TOTAL Net Long Term Liabilities of the Municipality 43,713,876
Page 181

2015 Financial Information Return - Schedule 74 - Long Term Liabilities and CommitmentsProvince of Ontario - Ministry of Municipal Affairs and Housing 16.06.2016 15:102015-V01
FIR2015: Brantford C Schedule 74Asmt Code: 2906 LONG TERM LIABILITIES AND COMMITMENTSMAH Code: 40101 for the year ended December 31, 2015
4. Debt payable in foreign currencies (net of sinking fund holdings)
1
US Dollars: $
1610 Canadian dollar equivalent included in SLC 74 9910 01 . . . . . . . . . . . . . . . . . . . . . . . . . . . . . . . . . . . . . . . . . . . . . . . . . . . . . . . . . . . . . . . . . . . . . . . . . . . . . . . . . . . . . . . . . . . . . . . . . .
1620 Par value in 'U.S. Dollars' . . . . . . . . . . . . . . . . . . . . . . . . . . . . . . . . . . . . . . . . . . . . . . . . . . . . . . . . . . . . . . . . . . . . . . . . . . . . . . . . . . . . . . . . . . . . . . . . . .
Other currency:
1630 Canadian dollar equivalent included in SLC 74 9910 01 . . . . . . . . . . . . . . . . . . . . . . . . . . . . . . . . . . . . . . . . . . . . . . . . . . . . . . . . . . . . . . . . . . . . . . . . . . . . . . . . . . . . . . . . . . . . . . . . . .
1640 Par value in . . . . . . . . . . . . . . . . . . . . . . . . . . . . . . . . . . . . . . . . . . . . . . . . . . . . . . . . . . . . . . . . . . . . . . . . . . . . . . . . . . . . . . . . . . . . . . . . . .
1650 Canadian dollar equivalent included in SLC 74 9910 01 . . . . . . . . . . . . . . . . . . . . . . . . . . . . . . . . . . . . . . . . . . . . . . . . . . . . . . . . . . . . . . . . . . . . . . . . . . . . . . . . . . . . . . . . . . . . . . . . . .
1660 Par value in . . . . . . . . . . . . . . . . . . . . . . . . . . . . . . . . . . . . . . . . . . . . . . . . . . . . . . . . . . . . . . . . . . . . . . . . . . . . . . . . . . . . . . . . . . . . . . . . . .
5. Interest earned on sinking funds and on debt retirement funds during the year
1810 Own funds . . . . . . . . . . . . . . . . . . . . . . . . . . . . . . . . . . . . . . . . . . . . . . . . . . . . . . . . . . . . . . . . . . . . . . . . . . . . . . . . . . . . . . . . . . . . . . . . . .
6. Details of sinking fund balance
2010 Value of own sinking fund debentures issued and outstanding at year end . . . . . . . . . . . . . . . . . . . . . . . . . . . . . . . . . . . . . . . . . . . . . . . . . . . . . . . . . . . . . . . . . . . . . . . . . . . . . . . . . . . . . . . . . . . . . . . . . . . . . . . . . . . . . . . . . . . . . . . . . . . . . . . . . . . . . . . . . . . . . . . . . . . . . . . . . . . . . . . . . . . . . .
Balance of own sinking funds at year end
2110 Total contributions to own sinking funds . . . . . . . . . . . . . . . . . . . . . . . . . . . . . . . . . . . . . . . . . . . . . . . . . . . . . . . . . . . . . . . . . . . . . . . . . . . . . . . . . . . . . . . . . . . . . . . . . . . . . . . . . . . . . . . . . . . . . . . . . . . . . . . . . . . . . . . . . . . . . . . . . . . . . . . . . . . . . . . . . . . . . .
2120 Total income earned from investments of sinking funds' monies . . . . . . . . . . . . . . . . . . . . . . . . . . . . . . . . . . . . . . . . . . . . . . . . . . . . . . . . . . . . . . . . . . . . . . . . . . . . . . . . . . . . . . . . . . . . . . . . . . . . . . . . . . . . . . . . . . . . . . . . . . . . . . . . . . . . . . . . . . . . . . . . . . . . . . . . . . . . . . . . . . . . . .
2199 Subtotal 0
2210 Estimated total future contributions from this municipality required to meet obligations in line 2010 above . . . . . . . . . . . . . . . . . . . . . . . . . . . . . . . . . . . . . . . . . . . . . . . . . . . . . . . . . . . . . . . . . . . . . . . . . . . . . . . . . . . . . . . . . . . . . . . . . . . . . . . . . . . . . . . . . . . . . . . . . . . . . . . . . . . . . . . . . . . . . . . . . . . . . . . . . . . . . . . . . . . . . .
2220 Estimated total future income earned from investments in lines 2199 and 2210 above . . . . . . . . . . . . . . . . . . . . . . . . . . . . . . . . . . . . . . . . . . . . . . . . . . . . . . . . . . . . . . . . . . . . . . . . . . . . . . . . . . . . . . . . . . . . . . . . . . . . . . . . . . . . . . . . . . . . . . . . . . . . . . . . . . . . . . . . . . . . . . . . . . . . . . . . . . . . . . . . . . . . . .
7. Long term commitments at year end
2410 Hospital support . . . . . . . . . . . . . . . . . . . . . . . . . . . . . . . . . . . . . . . . . . . . . . . . . . . . . . . . . . . . . . . . . . . . . . . . . . . . . . . . . . . . . . . . . . . . . . . . . . . . . . . . . . . . . . . . . . . . . . . . . . . . . . . . . . . . . . . . . . . . . . . . . . . . . . . . . . . . . . . . . . . . . .
2420 University support . . . . . . . . . . . . . . . . . . . . . . . . . . . . . . . . . . . . . . . . . . . . . . . . . . . . . . . . . . . . . . . . . . . . . . . . . . . . . . . . . . . . . . . . . . . . . . . . . . . . . . . . . . . . . . . . . . . . . . . . . . . . . . . . . . . . . . . . . . . . . . . . . . . . . . . . . . . . . . . . . . . . . . 500,000
2430 Leases and other agreements . . . . . . . . . . . . . . . . . . . . . . . . . . . . . . . . . . . . . . . . . . . . . . . . . . . . . . . . . . . . . . . . . . . . . . . . . . . . . . . . . . . . . . . . . . . . . . . . . . . . . . . . . . . . . . . . . . . . . . . . . . . . . . . . . . . . . . . . . . . . . . . . . . . . . . . . . . . . . . . . . . . . . . 17,637,972
2440 Capital equipment, land acquisition . . . . . . . . . . . . . . . . . . . . . . . . . . . . . . . . . . . . . . . . . . . . . . . . . . . . . . . . . . . . . . . . . . . . . . . . . . . . . . . . . . . . . . . . . . . . . . . . . . . . . . . . . . . . . . . . . . . . . . . . . . . . . . . . . . . . . . . . . . . . . . . . . . . . . . . . . . . . . . . . . . . . . .
2496 Other . . . . . . . . . . . . . . . . . . . . . . . . . . . . . . . . . . . . . . . . . . . . . . . . . . . . . . . . . . . . . . . . . . . . . . . . . . . . . .
2497 Other . . . . . . . . . . . . . . . . . . . . . . . . . . . . . . . . . . . . . . . . . . . . . . . . . . . . . . . . . . . . . . . . . . . . . . . . . . . . . .
2498 Other . . . . . . . . . . . . . . . . . . . . . . . . . . . . . . . . . . . . . . . . . . . . . . . . . . . . . . . . . . . . . . . . . . . . . . . . . . . . . .
2499 TOTAL 18,137,972
Page 182

2015 Financial Information Return - Schedule 74 - Long Term Liabilities and CommitmentsProvince of Ontario - Ministry of Municipal Affairs and Housing 16.06.2016 15:10
2015-V01
FIR2015: Brantford C Schedule 74Asmt Code: 2906 LONG TERM LIABILITIES AND COMMITMENTS
MAH Code: 40101 for the year ended December 31, 2015
Contingent LiabilitiesIs Value in Column 2
Estimated?Value
Number of Years
Payable Over
8. Contingent liabilities 4 1 2 3
Y or N Y or N $ Years
2610 Pending or threatened litigation . . . . . . . . . . . . . . . . . . . . . . . . . . . . . . . . . . . . . . . . . . . . . . . . . . . . . . . . . . . . . . . . . . . .
2620 Retroactive wage settlements . . . . . . . . . . . . . . . . . . . . . . . . . . . . . . . . . . . . . . . . . . . . . . . . . . . . . . . . . . . . . . . . . . . .
2630 Guarantees of long term indebtedness in the name of the municipality but assumed by others . . . . . . . . . . . . . . . . . . . . . . . . . . . . . . . . . . . . . . . . . . . . . . . . . . . . . . . . . . . . . . . . . . . .
2640 Outstanding loans guaranteed . . . . . . . . . . . . . . . . . . . . . . . . . . . . . . . . . . . . . . . . . . . . . . . . . . . . . . . . . . . . . . . . . . . . . . . . . . . . . .
2698 Other . . . . . . . . . . . . . . . . . . . . . . . . . . . . . . . . . . . . . . . . . . . . . . . . . . . . . . . . . . . . . . . . . . . . . . . . . . . . . .
2699 TOTAL 0
Principal Interest Total
10. Debt Charges for the current year 1 2 3
Recovered from the Consolidated Statement of Operations $ $ $
3012 General Tax Rates . . . . . . . . . . . . . . . . . . . . . . . . . . . . . . . . . . . . . . . . . . . . . . . . . . . . . . . . . . . . . . . . . . . . . . . . . . . . . . . . . . . . . . . . . . . . . . . . . . 1,687,591 191,174
3014 Other . . . . . . . . . . . . . . . . . . . . . . . . . . . . . . . . . . . . . . . . . . . . . . . . . . . . . . . . . . . . . . . . . . . . . . . . . . . . . . . . . . . . . . . . . . . . . . . . . . 1,717,429 1,343,971
3015 Tile Drainage/Shoreline Assistance . . . . . . . . . . . . . . . . . . . . . . . . . . . . . . . . . . . . . . . . . . . . . . . . . . . . . . . . . . . . . . . . . . . . . . . . . . . . . . . . . . . . . . . . . . . . . . . . . .
3020 Recovered from reserve funds . . . . . . . . . . . . . . . . . . . . . . . . . . . . . . . . . . . . . . . . . . . . . . . . . . . . . . . . . . . . . . . . . . . . . . . . . . . . . . . . . . . . . . . . . . . . . . . . . .
Recovered from unconsolidated entities:
3030 Electricity . . . . . . . . . . . . . . . . . . . . . . . . . . . . . . . . . . . . . . . . . . . . . . . . . . . . . . . . . . . . . . . . . . . . . . . . . . . . . . . . . . . . . . . . . . . . . . . . . .
3040 Gas . . . . . . . . . . . . . . . . . . . . . . . . . . . . . . . . . . . . . . . . . . . . . . . . . . . . . . . . . . . . . . . . . . . . . . . . . . . . . . . . . . . . . . . . . . . . . . . . . .
3050 Telephone . . . . . . . . . . . . . . . . . . . . . . . . . . . . . . . . . . . . . . . . . . . . . . . . . . . . . . . . . . . . . . . . . . . . . . . . . . . . . . . . . . . . . . . . . . . . . . . . . .
3097 Other County of Brant (JNH) . . . . . . . . . . . . . . . . . . . . . . . . . . . . . . . . . . . . . . . . . . . . . . . . . . . . . . . . . . . . . . . . . . . . . . . . . . . . . . 8,311
3098 Other . . . . . . . . . . . . . . . . . . . . . . . . . . . . . . . . . . . . . . . . . . . . . . . . . . . . . . . . . . . . . . . . . . . . . . . . . . . . . .
3099 TOTAL 3,413,331 1,535,145
Line 3099 includes:
3110 Lump sum (balloon) repayments of long term debt . . . . . . . . . . . . . . . . . . . . . . . . . . . . . . . . . . . . . . . . . . . . . . . . . . . . . . . . . . . . . . . . . . . . . . . . . . . . . . . . . . . . . . . . . . . . . . . . . .
3120 Provincial Grant funding for repayment of long term debt . . . . . . . . . . . . . . . . . . . . . . . . . . . . . . . . . . . . . . . . . . . . . . . . . . . . . . . . . . . . . . . . . . . . . . . . . . . . . . . . . . . . . . . . . . . . . . . . . .
Analysis of Lease Purchase Agreements (Tangible Capital Leases)
3140 Debt charges for Lease purchase agreements (Tangible capital leases) . . . . . . . . . . . . . . . . . . . . . . . . . . . . . . . . . . . . . . . . . . . . . . . . . . . . . . . . . . . . . . . . . . . . . . . . . . . . . . . . . . . . . . . . . . . . . . . . . . 0
Principal Interest
11. Long term debt refinanced 1 2
$ $
3410 Repayment of Provincial Special Assistance . . . . . . . . . . . . . . . . . . . . . . . . . . . . . . . . . . . . . . . . . . . . . . . . . . . . . . . . . . . . . . . . . . . . . . . . . . . . . . . . . . . . . . . . . . . . . . . . . .
3420 Other long term debt refinanced . . . . . . . . . . . . . . . . . . . . . . . . . . . . . . . . . . . . . . . . . . . . . . . . . . . . . . . . . . . . . . . . . . . . . . . . . . . . . . . . . . . . . . . . . . . . . . . . . .
Page 183
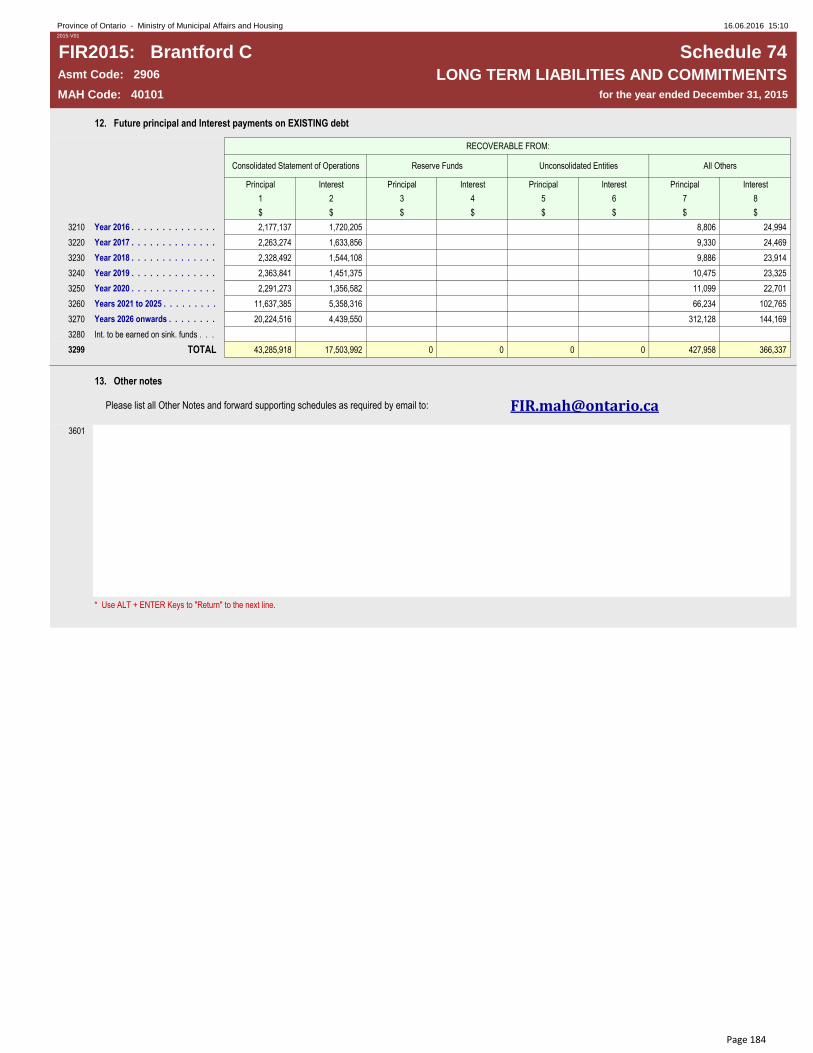
2015 Financial Information Return - Schedule 74 - Long Term Liabilities and CommitmentsProvince of Ontario - Ministry of Municipal Affairs and Housing 16.06.2016 15:102015-V01
FIR2015: Brantford C Schedule 74Asmt Code: 2906 LONG TERM LIABILITIES AND COMMITMENTSMAH Code: 40101 for the year ended December 31, 2015
12. Future principal and Interest payments on EXISTING debt
RECOVERABLE FROM:
Consolidated Statement of Operations Reserve Funds Unconsolidated Entities All Others
Principal Interest Principal Interest Principal Interest Principal Interest
1 2 3 4 5 6 7 8
$ $ $ $ $ $ $ $
3210 Year 2016 . . . . . . . . . . . . . . . . . . . . . . . . . . . . . . . . . . . . . . . . . . . . . . . . . . . . . . . . . . . . . . . . . . . . . . . . . . . . . . . . . . . . . . . . . . . . . . . . . . 2,177,137 1,720,205 8,806 24,994
3220 Year 2017 . . . . . . . . . . . . . . . . . . . . . . . . . . . . . . . . . . . . . . . . . . . . . . . . . . . . . . . . . . . . . . . . . . . . . . . . . . . . . . . . . . . . . . . . . . . . . . . . . . 2,263,274 1,633,856 9,330 24,469
3230 Year 2018 . . . . . . . . . . . . . . . . . . . . . . . . . . . . . . . . . . . . . . . . . . . . . . . . . . . . . . . . . . . . . . . . . . . . . . . . . . . . . . . . . . . . . . . . . . . . . . . . . . 2,328,492 1,544,108 9,886 23,914
3240 Year 2019 . . . . . . . . . . . . . . . . . . . . . . . . . . . . . . . . . . . . . . . . . . . . . . . . . . . . . . . . . . . . . . . . . . . . . . . . . . . . . . . . . . . . . . . . . . . . . . . . . . 2,363,841 1,451,375 10,475 23,325
3250 Year 2020 . . . . . . . . . . . . . . . . . . . . . . . . . . . . . . . . . . . . . . . . . . . . . . . . . . . . . . . . . . . . . . . . . . . . . . . . . . . . . . . . . . . . . . . . . . . . . . . . . . 2,291,273 1,356,582 11,099 22,701
3260 Years 2021 to 2025 . . . . . . . . . . . . . . . . . . . . . . . . . . . . . . . . . . . . . . . . . . . . . . . . . . . . . . . . . . . . . . . . . . . . . . . . . . . . . . . . . . . . . . . . . . . . . . . . . . 11,637,385 5,358,316 66,234 102,765
3270 Years 2026 onwards . . . . . . . . . . . . . . . . . . . . . . . . . . . . . . . . . . . . . . . . . . . . . . . . . . . . . . . . . . . . . . . . . . . . . . . . . . . . . . . . . . . . . . . . . . . . . . . . . . 20,224,516 4,439,550 312,128 144,169
3280 Int. to be earned on sink. funds . . . . . . . . . . . . . . . . . . . . . . . . . . . . . . . . . . . . . . . . . . . . . . . . . . . . . . . . . . . . . . . . . . . . . . . . . . . . . . . . . . . . . . . . . . . . . . . . . .
3299 TOTAL 43,285,918 17,503,992 0 0 0 0 427,958 366,337
13. Other notes
Please list all Other Notes and forward supporting schedules as required by email to: [email protected]
3601
* Use ALT + ENTER Keys to "Return" to the next line.
Page 184
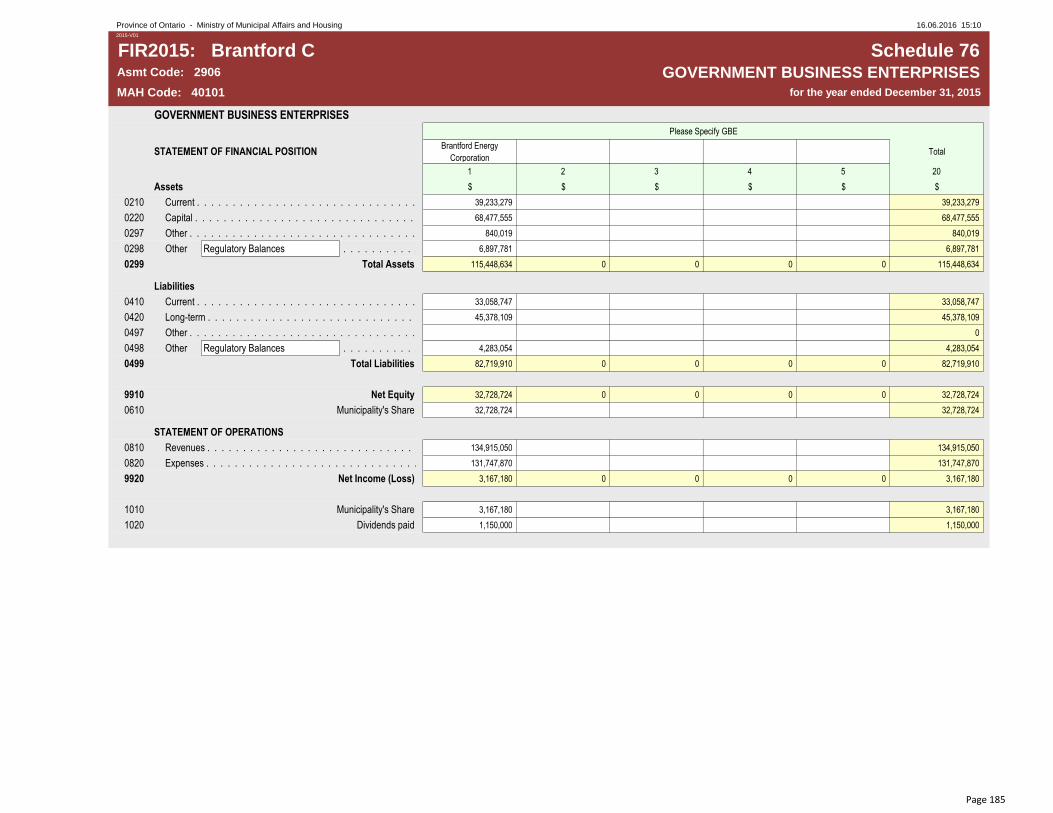
2015 Financial Information Return - Schedule 76 - Government Business EnterprisesProvince of Ontario - Ministry of Municipal Affairs and Housing 16.06.2016 15:102015-V01
FIR2015: Brantford C Schedule 76Asmt Code: 2906 GOVERNMENT BUSINESS ENTERPRISESMAH Code: 40101 for the year ended December 31, 2015
GOVERNMENT BUSINESS ENTERPRISES
Please Specify GBE
STATEMENT OF FINANCIAL POSITIONBrantford Energy
CorporationTotal
1 2 3 4 5 20
Assets $ $ $ $ $ $
0210 Current . . . . . . . . . . . . . . . . . . . . . . . . . . . . . . . . . . . . . . . . 39,233,279 39,233,279
0220 Capital . . . . . . . . . . . . . . . . . . . . . . . . . . . . . . . . . . . . . . . . 68,477,555 68,477,555
0297 Other . . . . . . . . . . . . . . . . . . . . . . . . . . . . . . . . . . . . . . . . 840,019 840,019
0298 Other Regulatory Balances . . . . . . . . . . . . . . . . . . . . . . . . . . . . . . . . . . . . . . . . . . . . . . . . . . . . . . . . . . . . . . . . . . . . . . . . . . . . . . . . . . . . . . . . . . . . . . . . . . 6,897,781 6,897,781
0299 Total Assets 115,448,634 0 0 0 0 115,448,634
Liabilities
0410 Current . . . . . . . . . . . . . . . . . . . . . . . . . . . . . . . . . . . . . . . . 33,058,747 33,058,747
0420 Long-term . . . . . . . . . . . . . . . . . . . . . . . . . . . . . . . . . . . . . . . . 45,378,109 45,378,109
0497 Other . . . . . . . . . . . . . . . . . . . . . . . . . . . . . . . . . . . . . . . . 0
0498 Other Regulatory Balances . . . . . . . . . . . . . . . . . . . . . . . . . . . . . . . . . . . . . . . . . . . . . . . . . . . . . . . . . . . . . . . . . . . . . . . . . . . . . . . . . . . . . . . . . . . . . . . . . . 4,283,054 4,283,054
0499 Total Liabilities 82,719,910 0 0 0 0 82,719,910
9910 Net Equity 32,728,724 0 0 0 0 32,728,724
0610 Municipality's Share 32,728,724 32,728,724
STATEMENT OF OPERATIONS
0810 Revenues . . . . . . . . . . . . . . . . . . . . . . . . . . . . . . . . . . . . . . . . . . . 134,915,050 134,915,050
0820 Expenses . . . . . . . . . . . . . . . . . . . . . . . . . . . . . . . . . . . . . . . . . . . . . . . 131,747,870 131,747,870
9920 Net Income (Loss) 3,167,180 0 0 0 0 3,167,180
1010 Municipality's Share 3,167,180 3,167,180
1020 Dividends paid 1,150,000 1,150,000
Page 185

2015 Financial Information Return - Schedule 79 - Community Improvement PlansProvince of Ontario - Ministry of Municipal Affairs and Housing 16.06.2016 15:102015-V01
FIR2015: Brantford C Schedule 79Asmt Code: 2906 COMMUNITY IMPROVEMENT PLANSMAH Code: 40101 for the year ended December 31, 2015
Community Improvement Plans (Section 28 of the Planning Act)
Total Value of all approved
Grants, Loans & Tax
Assistance
Number of Approved
Grants/Loans/Tax
Assistance Applications
1 2
Grants $ #
2010 Environment Site Assessment/Remediation . . . . . . . . . . . . . . . . . . . . . . . . . . . . . . . . . . . . . . . . . . . . . . . . . . . . . . . . . . . . . . . . . . . . . . . . . . . . . . . . . . . . . . . . . . . . . . . . . .
2020 Development/Redevelopment of Land/Buildings . . . . . . . . . . . . . . . . . . . . . . . . . . . . . . . . . . . . . . . . . . . . . . . . . . . . . . . . . . . . . . . . . . . . . . . . . . . . . . . . . . . . . . . . . . . . . . . . . .41,500
Loans
2210 Loans issued in current year (2015) . . . . . . . . . . . . . . . . . . . . . . . . . . . . . . . . . . . . . . . . . . . . . . . . . . . . . . . . . . . . . . . . . . . . . . . . . . . . . . . . . . . . . . . . . . . . . . . . . .
2220 Outstanding Loans as of 2015 . . . . . . . . . . . . . . . . . . . . . . . . . . . . . . . . . . . . . . . . . . . . . . . . . . . . . . . . . . . . . . . . . . . . . . . . . . . . . . . . . . . . . . . . . . . . . . . . . .
Tax Assistance (per Municipal Act 365.1 ss21)
2410 Cancellation . . . . . . . . . . . . . . . . . . . . . . . . . . . . . . . . . . . . . . . . . . . . . . . . . . . . . . . . . . . . . . . . . . . . . . . . . . . . . . . . . . . . . . . . . . . . . . . . . .
2420 Deferral . . . . . . . . . . . . . . . . . . . . . . . . . . . . . . . . . . . . . . . . . . . . . . . . . . . . . . . . . . . . . . . . . . . . . . . . . . . . . . . . . . . . . . . . . . . . . . . . . .
Long Term Commitments for Grants, Loans or Tax Assistance beyond 2015
2610 Year: 2016 . . . . . . . . . . . . . . . . . . . . . . . . . . . . . . . . . . . . . . . . . . . . . . . . . . . . . . . . . . . . . . . . . . . . . . . . . . . . . . . . . . . . . . . . . . . . . . . . . . 302,148
2620 Year: 2017 . . . . . . . . . . . . . . . . . . . . . . . . . . . . . . . . . . . . . . . . . . . . . . . . . . . . . . . . . . . . . . . . . . . . . . . . . . . . . . . . . . . . . . . . . . . . . . . . . .
2630 Year: 2018 . . . . . . . . . . . . . . . . . . . . . . . . . . . . . . . . . . . . . . . . . . . . . . . . . . . . . . . . . . . . . . . . . . . . . . . . . . . . . . . . . . . . . . . . . . . . . . . . . .
2640 Year: 2019 . . . . . . . . . . . . . . . . . . . . . . . . . . . . . . . . . . . . . . . . . . . . . . . . . . . . . . . . . . . . . . . . . . . . . . . . . . . . . . . . . . . . . . . . . . . . . . . . . .
2650 Year: 2020 . . . . . . . . . . . . . . . . . . . . . . . . . . . . . . . . . . . . . . . . . . . . . . . . . . . . . . . . . . . . . . . . . . . . . . . . . . . . . . . . . . . . . . . . . . . . . . . . . .
2660 Years beyond 2020 . . . . . . . . . . . . . . . . . . . . . . . . . . . . . . . . . . . . . . . . . . . . . . . . . . . . . . . . . . . . . . . . . . . . . . . . . . . . . . . . . . . . . . . . . . . . . . . . . .
Page 186

2015 Financial Information Return - Schedule 80 - Statistical InformationProvince of Ontario - Ministry of Municipal Affairs and Housing 16.06.2016 15:102015-V01
FIR2015: Brantford C Schedule 80Asmt Code: 2906 STATISTICAL INFORMATIONMAH Code: 40101 for the year ended December 31, 2015
Full-Time Funded
Positions
Part-Time Funded
PositionsSeasonal Employees
1. Municipal workforce profile 1 2 3
Employees of the Municipality # # #
0205 Administration . . . . . . . . . . . . . . . . . . . . . . . . . . . . . . . . . . . . . . . . . . . . . . . . . . . . . . . . . . . . . . . . . . . . . . . . . . . . . . . . . 93.00
0210 Fire . . . . . . . . . . . . . . . . . . . . . . . . . . . . . . . . . . . . . . . . . . . . . . . . . . . . . . . . . . . . . . . . . . . . . . . . . . . . . . . . . . . . . . . 131.00 0.00 0.00
0211 Uniform . . . . . . . . . . . . . . . . . . . . . . . . . . . . . . . . . . . . . . . . . . . . . . . . . . . . . . . . . . . . . . . . . . . . . . . . . . . . . . . . . 106.00
0212 Civilian . . . . . . . . . . . . . . . . . . . . . . . . . . . . . . . . . . . . . . . . . . . . . . . . . . . . . . . . . . . . . . . . . . . . . . . . . . . . . . . . . . . . . 25.00
0215 Police . . . . . . . . . . . . . . . . . . . . . . . . . . . . . . . . . . . . . . . . . . . . . . . . . . . . . . . . . . . . . . . . . . . . . . . . . . . . . . . 220.00 70.00 8.00
0216 Uniform . . . . . . . . . . . . . . . . . . . . . . . . . . . . . . . . . . . . . . . . . . . . . . . . . . . . . . . . . . . . . . . . . . . . . . . . . . . . . . . . . 162.00 8.00
0217 Civilian . . . . . . . . . . . . . . . . . . . . . . . . . . . . . . . . . . . . . . . . . . . . . . . . . . . . . . . . . . . . . . . . . . . . . . . . . . . . . . . . . . 58.00 70.00
0260 Court Security . . . . . . . . . . . . . . . . . . . . . . . . . . . . . . . . . . . . . . . . . . . . . . . . . . . . . . . . . . . . . . . . . . . . . . . . . . . . . . . 15.00 0.00 0.00
0261 Uniform . . . . . . . . . . . . . . . . . . . . . . . . . . . . . . . . . . . . . . . . . . . . . . . . . . . . . . . . . . . . . . . . . . . . . . . . . . . . . . . 1.00
0262 Civilian . . . . . . . . . . . . . . . . . . . . . . . . . . . . . . . . . . . . . . . . . . . . . . . . . . . . . . . . . . . . . . . . . . . . . . . . . . . . . . . . . . . . . . . . . 14.00
0263 Prisoner Transportation . . . . . . . . . . . . . . . . . . . . . . . . . . . . . . . . . . . . . . . . . . . . . . . . . . . . . . . . . . . . . . . . . . . . . . 0.00 0.00 0.00
0264 Uniform . . . . . . . . . . . . . . . . . . . . . . . . . . . . . . . . . . . . . . . . . . . . . . . . . . . . . . . . . . . . . . . . . . . . . . . . . . . . . . . . . .
0265 Civilian . . . . . . . . . . . . . . . . . . . . . . . . . . . . . . . . . . . . . . . . . . . . . . . . . . . . . . . . . . . . . . . . . . . . . . . . . . . . . . . . . . . . . . . . . . .
0220 Transit . . . . . . . . . . . . . . . . . . . . . . . . . . . . . . . . . . . . . . . . . . . . . . . . . . . . . . . . . . . . . . . . . . . . . . . . . . . . . . . . . . . . . . . . . . . . . . . . . . 81.00 21.00 5.00
0225 Public Works . . . . . . . . . . . . . . . . . . . . . . . . . . . . . . . . . . . . . . . . . . . . . . . . . . . . . . . . . . . . . . . . . . . . . . . . . . . . . . . . . . . . . . 165.00 1.00 40.00
0227 Ambulance . . . . . . . . . . . . . . . . . . . . . . . . . . . . . . . . . . . . . . . . . . . . . . . . . . . . . . . . . . . . . . . . . . . . . . . . . . . . 0.00 0.00 0.00
0228 Uniform . . . . . . . . . . . . . . . . . . . . . . . . . . . . . . . . . . . . . . . . . . . . . . . . . . . . . . . . . . . . . . . . . . . . . . . . . . . . . . . . . . .
0229 Civilian . . . . . . . . . . . . . . . . . . . . . . . . . . . . . . . . . . . . . . . . . . . . . . . . . . . . . . . . . . . . . . . . . . . . . . . . . . . . . . . . . . .
0230 Health Services . . . . . . . . . . . . . . . . . . . . . . . . . . . . . . . . . . . . . . . . . . . . . . . . . . . . . . . . . . . . . . . . . . . . . . . . . . . . . . . . . . . . . 1.00
0235 Homes for the Aged . . . . . . . . . . . . . . . . . . . . . . . . . . . . . . . . . . . . . . . . . . . . . . . . . . . . . . . . . . . . . . . . . . . . . . . . . . . .
0240 Other Social Services . . . . . . . . . . . . . . . . . . . . . . . . . . . . . . . . . . . . . . . . . . . . . . . . . . . . . . . . . . . . . . . . . . . . . . . . . . . . . 137.00 10.00 9.00
0245 Parks and Recreation . . . . . . . . . . . . . . . . . . . . . . . . . . . . . . . . . . . . . . . . . . . . . . . . . . . . . . . . . . . . . . . . . . . . . . . . . . . . . . . . . . . . . . 97.00 231.00 194.00
0250 Libraries . . . . . . . . . . . . . . . . . . . . . . . . . . . . . . . . . . . . . . . . . . . . . . . . . . . . . . . . . . . . . . . . . . . . . . . . . . . . . . . . . . . . . . . . . .
0255 Planning . . . . . . . . . . . . . . . . . . . . . . . . . . . . . . . . . . . . . . . . . . . . . . . . . . . . . . . . . . . . . . . . . . . . . . . . . . . . . . . . . . . . . . . . . . 17.00
0290 Other . . . . . . . . . . . . . . . . . . . . . . . . . . . . . . . . . . . . . . . . . . . . . . . . . . . . . . . . . . . . . . . . . . . . . . . . . . . . . . . . . . . . . . . . . . . . . 115.00 15.00 9.00
0298 Subtotal 1,071.00 349.00 265.00
0300 Proportion of Munic. Empl. covered by 'Collective Agreements' (%) . . . . . . . . . . . . . . . . . . . . . . . . . . . . . . . . . . . . . . . . . . .
Employees of Joint Local Boards
0305 Administration . . . . . . . . . . . . . . . . . . . . . . . . . . . . . . . . . . . . . . . . . . . . . . . . . . . . . . . . . . . . . . . . . . . . . . . . . . . . . . . . . . .
0310 Fire . . . . . . . . . . . . . . . . . . . . . . . . . . . . . . . . . . . . . . . . . . . . . . . . . . . . . . . . . . . . . . . . . . . . . . . . . . . . . . . . . . . 0.00 0.00 0.00
0311 Uniform . . . . . . . . . . . . . . . . . . . . . . . . . . . . . . . . . . . . . . . . . . . . . . . . . . . . . . . . . . . . . . . . . . . . . . . . . . . . . . . . . . . . . . . . . . .
0312 Civilian . . . . . . . . . . . . . . . . . . . . . . . . . . . . . . . . . . . . . . . . . . . . . . . . . . . . . . . . . . . . . . . . . . . . . . . . . . . . . . . . . . .
0315 Police . . . . . . . . . . . . . . . . . . . . . . . . . . . . . . . . . . . . . . . . . . . . . . . . . . . . . . . . . . . . . . . . . . . . . . . . . . . . . . . . . . . . . . . 0.00 0.00 0.00
0316 Uniform . . . . . . . . . . . . . . . . . . . . . . . . . . . . . . . . . . . . . . . . . . . . . . . . . . . . . . . . . . . . . . . . . . . . . . . . . . . . . . . . . . . . . . .
0317 Civilian . . . . . . . . . . . . . . . . . . . . . . . . . . . . . . . . . . . . . . . . . . . . . . . . . . . . . . . . . . . . . . . . . . . . . . . . . . . . . . . . . . . . . . . .
0360 Court Security . . . . . . . . . . . . . . . . . . . . . . . . . . . . . . . . . . . . . . . . . . . . . . . . . . . . . . . . . . . . . . . . . . . . . . . . . . . . . . . . . . . . 0.00 0.00 0.00
0361 Uniform . . . . . . . . . . . . . . . . . . . . . . . . . . . . . . . . . . . . . . . . . . . . . . . . . . . . . . . . . . . . . . . . . . . . . . . . . . . . . . . . . . . . . . . . . . . .
0362 Civilian . . . . . . . . . . . . . . . . . . . . . . . . . . . . . . . . . . . . . . . . . . . . . . . . . . . . . . . . . . . . . . . . . . . . . . . . . . . . . . . . . . . . . . . .
0363 Prisoner Transportation . . . . . . . . . . . . . . . . . . . . . . . . . . . . . . . . . . . . . . . . . . . . . . . . . . . . . . . . . . . . . . . . . . . . . . . . . . . . . . . . . 0.00 0.00 0.00
0364 Uniform . . . . . . . . . . . . . . . . . . . . . . . . . . . . . . . . . . . . . . . . . . . . . . . . . . . . . . . . . . . . . . . . . . . . . . . . . . . . . . . . . . . . . . . . . . . . . . . . . . . . .
0365 Civilian . . . . . . . . . . . . . . . . . . . . . . . . . . . . . . . . . . . . . . . . . . . . . . . . . . . . . . . . . . . . . . . . . . . . . . . . . . . . . . . . . . . . . . . . . . . . . . . . . . .
0320 Transit . . . . . . . . . . . . . . . . . . . . . . . . . . . . . . . . . . . . . . . . . . . . . . . . . . . . . . . . . . . . . . . . . . . . . . . . . . . . . . . . . . . . . . . . . . . . . . . . . . .
0325 Public Works . . . . . . . . . . . . . . . . . . . . . . . . . . . . . . . . . . . . . . . . . . . . . . . . . . . . . . . . . . . . . . . . . . . . . . . . . . . . . . . . . . . . . . . . . . . . . . . . . . . . . . . . . . . . . . . .
0327 Ambulance . . . . . . . . . . . . . . . . . . . . . . . . . . . . . . . . . . . . . . . . . . . . . . . . . . . . . . . . . . . . . . . . . . . . . . . . . . . . . . . . . . . . . . . . . . . . . . . . . . . 0.00 0.00 0.00
0328 Uniform . . . . . . . . . . . . . . . . . . . . . . . . . . . . . . . . . . . . . . . . . . . . . . . . . . . . . . . . . . . . . . . . . . . . . . . . . . . . . . . . . . . . . . . . . . .
0329 Civilian . . . . . . . . . . . . . . . . . . . . . . . . . . . . . . . . . . . . . . . . . . . . . . . . . . . . . . . . . . . . . . . . . . . . . . . . . . . . . . . . . . . . . . . .
0330 Health Services . . . . . . . . . . . . . . . . . . . . . . . . . . . . . . . . . . . . . . . . . . . . . . . . . . . . . . . . . . . . . . . . . . . . . . . . . . . . . . . . . . . . . . . . . . . .
0335 Homes for the Aged . . . . . . . . . . . . . . . . . . . . . . . . . . . . . . . . . . . . . . . . . . . . . . . . . . . . . . . . . . . . . . . . . . . . . . . . . . . . . . . . . . . . . . . . . . . . . . . . . . . . . . . . 105.00 225.00
0340 Other Social Services . . . . . . . . . . . . . . . . . . . . . . . . . . . . . . . . . . . . . . . . . . . . . . . . . . . . . . . . . . . . . . . . . . . . . . . . . . . . . . . . . . . . . . . . . . . . . . . . . . . . .
0345 Parks and Recreation . . . . . . . . . . . . . . . . . . . . . . . . . . . . . . . . . . . . . . . . . . . . . . . . . . . . . . . . . . . . . . . . . . . . . . . . . . . . . . . . . . . . . . . . . . . . . . . . . . . . . .
0350 Libraries . . . . . . . . . . . . . . . . . . . . . . . . . . . . . . . . . . . . . . . . . . . . . . . . . . . . . . . . . . . . . . . . . . . . . . . . . . . . . . . . . . . . . . . . 29.00 29.00 11.00
0355 Planning . . . . . . . . . . . . . . . . . . . . . . . . . . . . . . . . . . . . . . . . . . . . . . . . . . . . . . . . . . . . . . . . . . . . . . . . . . . . . . . . . . . . . . . . . . . . 1.00
0390 Other . . . . . . . . . . . . . . . . . . . . . . . . . . . . . . . . . . . . . . . . . . . . . . . . . . . . . . . . . . . . . . . . . . . . . . . . . . . . . . . . . . . . . . . . . . . .
0398 Subtotal 135.00 254.00 11.00
0399 TOTAL 1,206.00 603.00 276.00
Page 187

2015 Financial Information Return - Schedule 80 - Statistical InformationProvince of Ontario - Ministry of Municipal Affairs and Housing 16.06.2016 15:102015-V01
FIR2015: Brantford C Schedule 80Asmt Code: 2906 STATISTICAL INFORMATIONMAH Code: 40101 for the year ended December 31, 2015
Own MunicipalityOther Munic., School
BoardsProvincial Federal
2. Selected investments of own sinking funds as at Dec. 31 1 2 3 4
$ $ $ $
0610 Own sinking funds . . . . . . . . . . . . . . . . . . . . . . . . . . . . . . . . . . . . . . . . . . . . . . . . . . . . . . . . . . . . . . . . . . . .
Number of Contracts Value of Contracts
3. Municipal procurement this year 1 2
# $
1010 Total construction contracts awarded . . . . . . . . . . . . . . . . . . . . . . . . . . . . . . . . . . . . . . . . . . . . . . . . . . . . . . . . . . . . . . . . . 43 23,782,774
1020 Construction contracts awarded at $100,000 or greater . . . . . . . . . . . . . . . . . . . . . . . . . . . . . . . . . . . . . . . . . . . . . . . . . . . 29 22,916,265
Number of Building
Permits
Total Value of Building
Permits
4. Building permit information 1 2
# $
1210 Residential properties . . . . . . . . . . . . . . . . . . . . . . . . . . . . . . . . . . . . . . . . . . . . . . . . . . . . . . . . . . . . . . . . . . . . . . . . . . 699 60,308,000
1220 Multi-Residential properties . . . . . . . . . . . . . . . . . . . . . . . . . . . . . . . . . . . . . . . . . . . . . . . . . . . . . . . . . . . . . . . . . . . 21 62,646,000
1230 All other property classes . . . . . . . . . . . . . . . . . . . . . . . . . . . . . . . . . . . . . . . . . . . . . . . . . . . . . . . . . . . . . . . . . . . . . . . . . . 246 41,039,000
1299 Subtotal 966 163,993,000
5. Insured value of physical assets 1
$
1410 Buildings . . . . . . . . . . . . . . . . . . . . . . . . . . . . . . . . . . . . . . . . . . . . . . . . . . . . . . . . . . . . . . . . . . . . . . . . . . . . . . 713,769,600
1420 Machinery and equipment . . . . . . . . . . . . . . . . . . . . . . . . . . . . . . . . . . . . . . . . . . . . . . . . . . . . . . . . . . . . . . . . . . . . . .
1430 Vehicles . . . . . . . . . . . . . . . . . . . . . . . . . . . . . . . . . . . . . . . . . . . . . . . . . . . . . . . . . . . . . . . . . . . . . . . . . . . . . . . . . . 34,232,256
1497 Other Unlicensed Machinery & Equipment . . . . . . . . . . . . . . . . . . . . . . . . . . . . . . . . . . . . . . . . . . . . . . . . . . . . . . . . . . . . . . . . . . . . . . . . . . . . . . 15,375,850
1498 Other Contents . . . . . . . . . . . . . . . . . . . . . . . . . . . . . . . . . . . . . . . . . . . . . . . . . . . . . . . . . . . . . . . . . . . . . . . . . . . . . . 36,918,840
1499 Subtotal 800,296,546
6. Total Dollar Losses due to Structural Fires 1
$
1510 Losses due to structural fires, averaged over 3 yrs (2013 - 2015) . . . . . . . . . . . . . . . . . . . . . . . . . . . . . . . . . . . . . . . . . . . . 4,553,402
Page 188

2015 Financial Information Return - Schedule 80 - Statistical InformationProvince of Ontario - Ministry of Municipal Affairs and Housing 16.06.2016 15:102015-V01
FIR2015: Brantford C Schedule 80Asmt Code: 2906 STATISTICAL INFORMATIONMAH Code: 40101 for the year ended December 31, 2015
7. Alternate service delivery arrangements
Municipal services which the municipality currently provides through some form of alternate service delivery: (Top 10 by Operating Expenses)
Municipal service S40 Functional HeadingS40 Line
Number
Statement of Operations:
ExpensesComments
1 3 2 4 5
LIST $
1601 Child Care Purchase of Service Child care 1230 3,313,829
1602 Waste Water Treastment Wastewater treatment & disposal 0812 3,311,506
1603 Land Ambulance Ambulance services 1030 3,249,078
1604 Waste Diversion Waste diversion 0860 1,851,566
1605 Waste Curbside Collection Solid waste collection 0840 1,545,148
1606 Landfill Site Operations Solid waste disposal 0850 1,521,101
1607 Hostels General assistance 1210 1,379,289
1608 Assessment Services Corporate Management 0250 1,068,019
1609 Special Needs Resourcing Child care 1230 1,028,375
1610 Yard Waste Collection Waste diversion 0860 831,779
Page 189
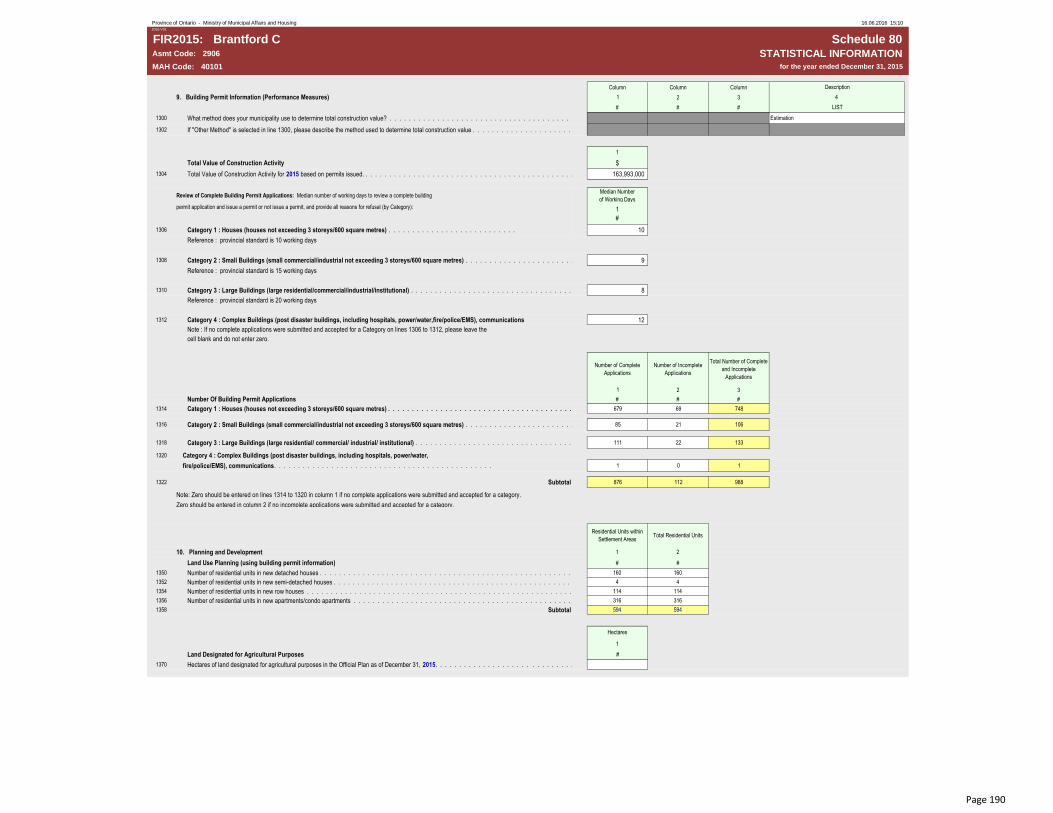
2015 Financial Information Return - Schedule 80 - Statistical InformationProvince of Ontario - Ministry of Municipal Affairs and Housing 16.06.2016 15:102015-V01
FIR2015: Brantford C Schedule 80Asmt Code: 2906 STATISTICAL INFORMATION
MAH Code: 40101 for the year ended December 31, 2015
Column Column Column Description
9. Building Permit Information (Performance Measures) 1 2 3 4
# # # LIST
1300 What method does your municipality use to determine total construction value? . . . . . . . . . . . . . . . . . . . . . . . . . . . . . . . . . . . . . . . . . . . . . . . . . . . . . . . . . . . . . . . . . . . . . . . . . . . . . . Estimation
1302 If "Other Method" is selected in line 1300, please describe the method used to determine total construction value . . . . . . . . . . . . . . . . . . . . . . . . . . . . . . . . . . . . . . . . . . . . . . . . . . . . . . . . . . . . . . . . . . . . . . . . . . . . . .
1
Total Value of Construction Activity $
1304 Total Value of Construction Activity for 2015 based on permits issued. . . . . . . . . . . . . . . . . . . . . . . . . . . . . . . . . . . . . . . . . . . . . . . . . . . . . . . . . . . . . . . . . . . . . . . . . . . . . . . . . . . . . . . . . . . . . . . . . . . . . . . . . . . . . . . . . . . .163,993,000
Review of Complete Building Permit Applications: Median number of working days to review a complete building Median Number
of Working Days
permit application and issue a permit or not issue a permit, and provide all reasons for refusal (by Category): 1
#
1306 Category 1 : Houses (houses not exceeding 3 storeys/600 square metres) . . . . . . . . . . . . . . . . . . . . . . . . . . . 10
Reference : provincial standard is 10 working days
1308 Category 2 : Small Buildings (small commercial/industrial not exceeding 3 storeys/600 square metres) . . . . . . . . . . . . . . . . . . . . . . . . . . . . . . . . . . . . . . . . . . . . . . . . . . . . . . . . . . . . . . . . . . . . . . . . . . . . . . . . . . . . . . . . . . . . . . . . . . . . . . . . . . . . . . . . .9
Reference : provincial standard is 15 working days
1310 Category 3 : Large Buildings (large residential/commercial/industrial/institutional) . . . . . . . . . . . . . . . . . . . . . . . . . . . . . . . . . . . . . . . . . . . . . . . . . . . . . . . . . . . . . . . . . . . . . . . . . . . . . . . . . . . . . . . . . . . . . . . . . . . . . . . . . . . . . . . . .8
Reference : provincial standard is 20 working days
1312 Category 4 : Complex Buildings (post disaster buildings, including hospitals, power/water,fire/police/EMS), communications 12
Note : If no complete applications were submitted and accepted for a Category on lines 1306 to 1312, please leave the
cell blank and do not enter zero.
Number of Complete
Applications
Number of Incomplete
Applications
Total Number of Complete
and Incomplete
Applications
1 2 3
Number Of Building Permit Applications # # #
1314 Category 1 : Houses (houses not exceeding 3 storeys/600 square metres) . . . . . . . . . . . . . . . . . . . . . . . . . . . . . . . . . . . . . . . . . . . . . . . . . . . . . . . . . . . . . . . . . . . . . . . . . . . . . . . . . . . . . . . . . . . . . . . 679 69 748
1316 Category 2 : Small Buildings (small commercial/industrial not exceeding 3 storeys/600 square metres) . . . . . . . . . . . . . . . . . . . . . . . . . . . . . . . . . . . . . . . . . . . . . . . . . . . . . . . . . . . . . . . . . . . . . . . . . . . . . . . . . . . . . . . . . . . . . . . . . . . . . . . . . . . . . . . . .85 21 106
1318 Category 3 : Large Buildings (large residential/ commercial/ industrial/ institutional) . . . . . . . . . . . . . . . . . . . . . . . . . . . . . . . . . . . . . . . . . . . . . . . . . . . . . . . . . . . . . . . . . . . . . . . . . . . . . . . . . . . . . . . . . . . . . . . . . . . . . . . . . . . . . . . . .111 22 133
1320 Category 4 : Complex Buildings (post disaster buildings, including hospitals, power/water,
fire/police/EMS), communications. . . . . . . . . . . . . . . . . . . . . . . . . . . . . . . . . . . . . . . . . . . . . . 1 0 1
1322 Subtotal 876 112 988
Note: Zero should be entered on lines 1314 to 1320 in column 1 if no complete applications were submitted and accepted for a category.
Zero should be entered in column 2 if no incomplete applications were submitted and accepted for a category.
Residential Units within
Settlement AreasTotal Residential Units
10. Planning and Development 1 2
Land Use Planning (using building permit information) # #
1350 Number of residential units in new detached houses . . . . . . . . . . . . . . . . . . . . . . . . . . . . . . . . . . . . . . . . . . . . . . . . . . . . . . . . . . . . . . . . . . . . . . . . . . . . . . . . . . . . . . . . . . . . . . . . . . . . . . . . . . . . . . . . . .160 160
1352 Number of residential units in new semi-detached houses . . . . . . . . . . . . . . . . . . . . . . . . . . . . . . . . . . . . . . . . . . . . . . . . . . . . . . . . . . . . . . . . . . . . . . . . . . . . . . . . . . . . . . . . . . . . . . . . . . . . . . . . . . . . . . . . . .4 4
1354 Number of residential units in new row houses . . . . . . . . . . . . . . . . . . . . . . . . . . . . . . . . . . . . . . . . . . . . . . . . . . . . . . . . . . . . . . . . . . . . . . . . . . . . . . . . . . . . . . . . . . . . . . . . . . . . . . . . . . . . . . . . . . .114 114
1356 Number of residential units in new apartments/condo apartments . . . . . . . . . . . . . . . . . . . . . . . . . . . . . . . . . . . . . . . . . . . . . . . . . . . . . . . . . . . . . . . . . . . . . . . . . . . . . . . . . . . . . . . . . . . . . . . . . . . . . . . . . . . . . . . . . .316 316
1358 Subtotal 594 594
Hectares
1
Land Designated for Agricultural Purposes #
1370 Hectares of land designated for agricultural purposes in the Official Plan as of December 31, 2015. . . . . . . . . . . . . . . . . . . . . . . . . . . . . . . . . . . . . . . . . . . . . . . . . . . . . . . . . . . . . . . .
Page 190

2015 Financial Information Return - Schedule 80 - Statistical InformationProvince of Ontario - Ministry of Municipal Affairs and Housing 16.06.2016 15:102015-V01
FIR2015: Brantford C Schedule 80Asmt Code: 2906 STATISTICAL INFORMATION
MAH Code: 40101 for the year ended December 31, 2015
11. Transportation Services 1
#
1710 Roads : Total Paved Lane Km . . . . . . . . . . . . . . . . . . . . . . . . . . . . . . . . . . . . . . . . . . . . . . . . . . . . . . . . . . . . . . . . . . . . . . . . . . . . . . . .1,052
1720 Condition of Roads : Number of paved lane kilometres where the condition is rated as good to very good. . . . . . . . . . . . . . . . . . . . . . . . . . . . . . . . . . . . . . . . . . . . . . . .904
Column Column Column Description
1 2 3 4
# # # LIST
1722 Has the entire municipal road system been rated?. . . . . . . . . . . . . . . . . . . . . . . . . . . . . . . . . . . . . . . . . . . . . . . . . . . . . . . . . . . . . . . . . . . . . . . . . . . . . . . . . . . . . . . Y
1725 Indicate the rating system used and the year the rating was conducted . . . . . . . . . . . . . . . . . . . . . . . . . . . . . . . . . . . . . . . . . . . . . . . . . . . . . . . 2014 IMS INFRASTRUCTURE ROADWAY DRIVEABILITY
SURVEY
1730 Roads : Total UnPaved Lane Km . . . . . . . . . . . . . . . . . . . . . . . . . . . . . . . . . . . . . . . . . . . . . . . . . . . . . . . . . . . . . . . . . . . . . . . . . . . . . . . . . . . . . . . . . . . . . . . . . . . .0
1740 Winter Control : Total Lane Km maintained in winter . . . . . . . . . . . . . . . . . . . . . . . . . . . . . . . . . . . . . . . . . . . . . . . . . . . . . . . . . . . . . . . . . . . . . . . . . . . . .1,052
1750 Transit : Total Number of Regular Service Passenger Trips on Conventional Transit in Service Area. . . . . . . . . . . . . . . . . . . . . . . . . . . . . . . . . . . . . . . . . . . . . . . . . . . . . . . . .1,521,531
1755 Transit : Population of Service Area. . . . . . . . . . . . . . . . . . . . . . . . . . . . . . . . . . . . . . . . . . . . . . . . . . . . . . . . . . . . . . . . . . . . . . . . . . . . . . . . . . . . . .97,862
1760 Bridges and Culverts : Total Square Metres of Surface Area on Bridges and Culverts . . . . . . . . . . . . . . . . . . . . . . . . . . . . . . . . . . . . . . . . . . . . . . . . . . . . . . . . . . . . . . .25,485
Number of structures
where the condition
of primary
components is rated
as good to very
good, requiring only
repair
Total Number
1 2
Rating Of Bridges And Culverts # #
1765 Bridges . . . . . . . . . . . . . . . . . . . . . . . . . . . . . . . . . . . . . . . . . . . . . . . . . . . . . . . . . . . . . . . . . . . . . . . . . . . . . . . . . . 21 39
1766 Culverts . . . . . . . . . . . . . . . . . . . . . . . . . . . . . . . . . . . . . . . . . . . . . . . . . . . . . . . . . . . . . . . . . . . . . . . . . . . . . . . . . . . 16 29
1767 Subtotal 37 68
Column Column Column Description
1 2 3 4
# # # LIST
1768 Have all bridges and culverts in the municipal system been rated? . . . . . . . . . . . . . . . . . . . . . . . . . . . . . . . . . . . . . . . . . . . . . . . . . . . . . . . . . . . . Y
1769 Indicate the rating system used and the year the rating was conducted. . . . . . . . . . . . . . . . . . . . . . . . . . . . . . . . . . . . . . . . . . . . . . . . . . . . . . . . . . . 2013 MTO BRIDGE CONDITION INDEX
12. Environmental Services 1
#
1810 Wastewater Main Backups : Total number of backed up wastewater mains . . . . . . . . . . . . . . . . . . . . . . . . . . . . . . . . . . . . . . . . . . . . . . . . . . . . . . . . . . .14
1815 Wastewater Collection/Conveyance : Total KM of Wastewater Mains. . . . . . . . . . . . . . . . . . . . . . . . . . . . . . . . . . . . . . . . . . . . . . . . . . . . . . . . . . .429
1820 Wastewater Treatment and Disposal : Total Megalitres of Wastewater Treated. . . . . . . . . . . . . . . . . . . . . . . . . . . . . . . . . . . . . . . . . . . . . . . . . . . . . . . . . . . . . . . . . . . . . . . . .10,680.000
1825 Wastewater Bypasses Treatment : Estimated megalitres of untreated wastewater. . . . . . . . . . . . . . . . . . . . . . . . . . . . . . . . . . . . . . . . . . . . 0.000
1835 Urban Storm Water Management : Total KM of Urban Drainage System plus (0.005 KM times No. of Catch basins) . . . . . . . . . . . . . . . . . . . . . . . . . 401
1840 Rural Storm Water Management : Total KM of Rural Drainage System plus (0.005 KM times No. of Catch basins). . . . . . . . . . . . . . . . . . . . . . . . . . . . . . . .70
1845 Water Treatment : Total Megalitres of Drinking Water Treated. . . . . . . . . . . . . . . . . . . . . . . . . . . . . . . . . . . . . . . . . . . . . . . . . . . . . . . . . . . . . . . . . 11,888.000
1850 Water Main Breaks : Number of water main breaks in a year. . . . . . . . . . . . . . . . . . . . . . . . . . . . . . . . . . . . . . . . . . . . . . . . . . . . . . . . . . . . . . . . . . . . . . . . . .35
1855 Water Distribution/Transmission : Total kilometres of Water Distribution / Transmission Pipe. . . . . . . . . . . . . . . . . . . . . . . . . . . . . . . . . . . . . . . . . . . . . . . . . . . . . . . . . . . . . . . . . 489
1860 Solid Waste Collection : Total tonnes collected from all property classes. . . . . . . . . . . . . . . . . . . . . . . . . . . . . . . . . . . . . . . . . . . . . . . . . . . . . . . . . . .24,001
1865 Solid Waste Disposal : Total tonnes disposed off from all property classes. . . . . . . . . . . . . . . . . . . . . . . . . . . . . . . . . . . . . . . . . . . . . . . . . . . . . . . . . 29,581
1870 Waste Diversion : Total tonnes diverted from all property classes. . . . . . . . . . . . . . . . . . . . . . . . . . . . . . . . . . . . . . . . . . . . . . . . . . . . . . . . . 13,097
13. Recreation Services 1
#
1910 Trails : Total kilometres of trails (owned by municipality and third parties). . . . . . . . . . . . . . . . . . . . . . . . . . . . . . . . . . . . . . . . . . . . . . . . . . . . . . . . . . .93
1920 Indoor recreation facility space : Square metres of indoor recreation facilities (municipally owned). . . . . . . . . . . . . . . . . . . . . . . . . . . . . . . . . . . . . . . .46,081
1930 Outdoor recreation facility space : Square metres of outdoor recreation facility space (municipally owned). . . . . . . . . . . . . . . . . . . . . . . . . . . . . . . . . . . . . . . . . . . . . . . . . . . . . . . . . .25,748
1
14. Other Revenue (Used for the calculation of Operating Cost) $
2310 Fire Services: Other revenue. . . . . . . . . . . . . . . . . . . . . . . . . . . . . . . . . . . . . . . . . . . . . . . . . . . . . . . . . . . . . . . . . . . . . . . . . . . . . . .
2320 Paved Roads : Other revenue. . . . . . . . . . . . . . . . . . . . . . . . . . . . . . . . . . . . . . . . . . . . . . . . . . . . . . . . . . . . . . . . . . . . . . . . . . . . . . . . .
2330 Solid Waste Disposal : Other revenue. . . . . . . . . . . . . . . . . . . . . . . . . . . . . . . . . . . . . . . . . . . . . . . . . . . . . . . . . . . . . . . . . . . . . .
2340 Waste Diversion : Other Revenue. . . . . . . . . . . . . . . . . . . . . . . . . . . . . . . . . . . . . . . . . . . . . . . . . . . . . . . . . . . . . . . . . . . . . . . . . . . . . . . .
2370 Assessment on Exempt Properties (Enter data from returned roll) . . . . . . . . . . . . . . . . . . . . . . . . . . . . . . . . . . . . . . . . . . . . . . . . . . . . . . . . . . . . . . . . . . . . . . . . . . . . . . . . . . . . . . . . . . . . . . . . . 525,144,555
Page 191

2015 Financial Information Return - Schedule 81 - Annual Debt Repayment LimitProvince of Ontario - Ministry of Municipal Affairs and Housing 16.06.2016 15:102015-V01
FIR2015: Brantford C Schedule 81Asmt Code: 2906 ANNUAL DEBT REPAYMENT LIMITMAH Code: 40101 based on the information reported for the year ended December 31, 2015
NOTE: THE ESTIMATED ANNUAL REPAYMENT LIMIT IS EFFECTIVE JANUARY 01, 2017
Please note that fees and revenues for Homes for the Aged are not reflected in this estimate.
DETERMINATION OF ANNUAL DEBT REPAYMENT LIMIT 1
Debt Charges for the Current Year $
0210 Principal (SLC 74 3099 01). . . . . . . . . . . . . . . . . . . . . . . . . . . . . . . . . . . . . . . . . . . . . . . . . . . . . . . . . . . . . . . . . . . . . . . . . . . . . . . . . . . . . . . . . . . . . . . . . . . . . . . . . . . . . . . . . . . . . . . . . . . . . . . . . . . . . . . . . . . . . . . . . . . . .3,413,331
0220 Interest (SLC 74 3099 02). . . . . . . . . . . . . . . . . . . . . . . . . . . . . . . . . . . . . . . . . . . . . . . . . . . . . . . . . . . . . . . . . . . . . . . . . . . . . . . . . . . . . . . . . . . . . . . . . . . . . . . . . . . . . . . . . . . . . . . . . . . . . . . . . . . . . . . . . . . . . . . . . . . . .1,535,145
0299 Subtotal 4,948,476
0610 Payments for Long Term Commitments and Liabilities financed from the consolidated statement of
operations (SLC 42 6010 01) . . . . . . . . . . . . . . . . . . . . . . . . . . . . . . . . . . . . . . . . . . . . . . . . . . . . . . . . . . . . . . . . . . . . . . . . . . . . . . . . . 2,857,170
9910 Total Debt Charges 7,805,646
1
Excluded Debt Charges $
1010 Electricity - Principal (SLC 74 3030 01) . . . . . . . . . . . . . . . . . . . . . . . . . . . . . . . . . . . . . . . . . . . . . . . . . . . . . . . . . . . . . . . . . . . . . . . . . . . . . . . . . . . . . . . . . . . . . . . . . . . . . . . . . . . . . . . . . . . . . . . . . . . . . . . . . . . . . . . . . . . . . . . . . . . . . 0
1020 Electricity - Interest (SLC 74 3030 02) . . . . . . . . . . . . . . . . . . . . . . . . . . . . . . . . . . . . . . . . . . . . . . . . . . . . . . . . . . . . . . . . . . . . . . . . . . . . . . . . . . . . . . . . . . . . . . . . . . . . . . . . . . . . . . . . . . . . . . . . . . . . . . . . . . . . . . . . . . . . . . . . . . . . . 0
1030 Gas - Principal (SLC 74 3040 01) . . . . . . . . . . . . . . . . . . . . . . . . . . . . . . . . . . . . . . . . . . . . . . . . . . . . . . . . . . . . . . . . . . . . . . . . . . . . . . . . . . . . . . . . . . . . . . . . . . . . . . . . . . . . . . . . . . . . . . . . . . . . . . . . . . . . . . . . . . . . . . . . . . . . . 0
1040 Gas - Interest (SLC 74 3040 02) . . . . . . . . . . . . . . . . . . . . . . . . . . . . . . . . . . . . . . . . . . . . . . . . . . . . . . . . . . . . . . . . . . . . . . . . . . . . . . . . . . . . . . . . . . . . . . . . . . . . . . . . . . . . . . . . . . . . . . . . . . . . . . . . . . . . . . . . . . . . . . . . . . . . . 0
1050 Telephone - Principal (SLC 74 3050 01) . . . . . . . . . . . . . . . . . . . . . . . . . . . . . . . . . . . . . . . . . . . . . . . . . . . . . . . . . . . . . . . . . . . . . . . . . . . . . . . . . . . . . . . . . . . . . . . . . . . . . . . . . . . . . . . . . . . . . . . . . . . . . . . . . . . . . . . . . . . . . . . . . . . . .0
1060 Telephone - Interest (SLC 74 3050 02) . . . . . . . . . . . . . . . . . . . . . . . . . . . . . . . . . . . . . . . . . . . . . . . . . . . . . . . . . . . . . . . . . . . . . . . . . . . . . . . . . . . . . . . . . . . . . . . . . . . . . . . . . . . . . . . . . . . . . . . . . . . . . . . . . . . . . . . . . . . . . . . . . . . . .0
1099 Subtotal 0
1410 Debt Charges for Tile Drainage/Shoreline Assistance (SLC 74 3015 01 + SLC 74 3015 02) . . . . . . . . . . . . . . . . . . . . . . . . . . . . . . . . . . . . . . . . . . . . . . . . . . . . . . . . . . . . . . . . . . . . . . . . . . . . . . . . . . . . . . . . . . . . . . . . . . . . . . . . . . . . . . . . . . . . . . . . . . . . . . . . . . . . . . . . . . . . . . . . . . . . .0
1411 Provincial Grant funding for repayment of long term debt (SLC 74 3120 01 + SLC 74 3120 02) . . . . . . . . . . . . . . . . . . . . . . . . . . . . . . . . . . . . . . . . . . . . . . . . . . . . . . . . . . . . . . . . . . . . . . . . . . . . . . . . . . . . . . . . . . . . . . . . . . . . . . . . . . . . . . . . . . . . . . . . . . . . . . . . . . . . . . . . . . . . . . . . . . . . .0
1412 Lump sum (balloon) repayments of long term debt (SLC 74 3110 01 + SLC 74 3110 02) . . . . . . . . . . . . . . . . . . . . . . . . . . . . . . . . . . . . . . . . . . . . . . . . . . . . . . . . . . . . . . . . . . . . . . . . . . . . . . . . . . . . . . . . . . . . . . . . . . . . . . . . . . . . . . . . . . . . . . . . . . . . . . . . . . . . . . . . . . . . . . . . . . . . .0
1420 Total Debt Charges to be Excluded 0
9920 Net Debt Charges 7,805,646
1
$
1610 Total Revenues (* Sale of Hydro Utilities Removed) (SLC 10 9910 01) . . . . . . . . . . . . . . . . . . . . . . . . . . . . . . . . . . . . . . . . . . . . . . . . . . . . . . . . . . . . . . . . . . . . . . . . . . . . . . . . . . . . . . . . . . . . . . . . . . . . . . . . . . . . . . . . . . . . . . . . . . . . . . . . . . . . . . . . . . . . . . . . . . . . . 289,165,843
Excluded Revenue Amounts
2010 Fees for Tile Drainage / Shoreline Assistance (SLC 12 1850 04) . . . . . . . . . . . . . . . . . . . . . . . . . . . . . . . . . . . . . . . . . . . . . . . . . . . . . . . . . . . . . . . . . . . . . . . . . . . . . . . . . . . . . . . . . . . . . . . . . . . . . . . . . . . . . . . . . . . . . . . . . . . . . . . . . . . . . . . . . . . . . . . . . . . . . 0
2210 Ontario Grants, including Grants for Tangible Capital Assets (SLC 10 0699 01 + SLC 10 0810 01 + SLC10 0815 01) . . . . . . . . . . . . . . . . . . . . . . . . . . . . . . . . . . . . . . . . . . . . . . . . . . . . . . . . . . . . . . . . . . . . . . . . . . . . . . . . . . . . . . . . . . . . . . . . . . . . . . . . . . . . . . . . . . . . . . . . . . . . . . . . . . . . . . . . . . . . . . . . . . . . . 50,606,461
2220 Canada Grants, including Grants for Tangible Capital Assets (SLC 10 0820 01 + SLC 10 0825 01) . . . . . . . . . . . . . . . . . . . . . . . . . . . . . . . . . . . . . . . . . . . . . . . . . . . . . . . . . . . . . . . . . . . . . . . . . . . . . . . . . . . . . . . . . . . . . . . . . . . . . . . . . . . . . . . . . . . . . . . . . . . . . . . . . . . . . . . . . . . . . . . . . . . . . 1,751,368
2225 Deferred revenue earned (Provincial Gas Tax) (SLC 10 0830 01) . . . . . . . . . . . . . . . . . . . . . . . . . . . . . . . . . . . . . . . . . . . . . . . . . . . . . . . . . . . . . . . . . . . . . . . . . . . . . . . . . . . . . . . . . . . . . . . . . . . . . . . . . . . . . . . . . . . . . . . . . . . . . . . . . . . . . . . . . . . . . . . . . . . . .1,206,093
2226 Deferred revenue earned (Canada Gas Tax) (SLC 10 0831 01) . . . . . . . . . . . . . . . . . . . . . . . . . . . . . . . . . . . . . . . . . . . . . . . . . . . . . . . . . . . . . . . . . . . . . . . . . . . . . . . . . . . . . . . . . . . . . . . . . . . . . . . . . . . . . . . . . . . . . . . . . . . . . . . . . . . . . . . . . . . . . . . . . . . . .5,100,697
2230 Revenue from other municipalities, including Revenue for Tangible Capital Assets (SLC 10 1099 01 + SLC 10 1098 01) . . . . . . . . . . . . . . . . . . . . . . . . . . . . . . . . . . . . . . . . . . . . . . . . . . . . . . . . . . . . . . . . . . . . . . . . . . . . . . . . . . . . . . . . . . . . . . . . . . . . . . . . . . . . . . . . . . . . . . . . . . . . . . . . . . . . . . . . . . . . . . . . . . . . . 3,896,435
2240 Gain/Loss on sale of land & capital assets (SLC 10 1811 01) . . . . . . . . . . . . . . . . . . . . . . . . . . . . . . . . . . . . . . . . . . . . . . . . . . . . . . . . . . . . . . . . . . . . . . . . . . . . . . . . . . . . . . . . . . . . . . . . . . . . . . . . . . . . . . . . . . . . . . . . . . . . . . . . . . . . . . . . . . . . . . . . . . . . . -112,520
2250 Deferred revenue earned (Development Charges) (SLC 10 1812 01) . . . . . . . . . . . . . . . . . . . . . . . . . . . . . . . . . . . . . . . . . . . . . . . . . . . . . . . . . . . . . . . . . . . . . . . . . . . . . . . . . . . . . . . . . . . . . . . . . . . . . . . . . . . . . . . . . . . . . . . . . . . . . . . . . . . . . . . . . . . . . . . . . . . . . 1,445,301
2251 Deferred revenue earned (Recreation Land (The Planning Act)) (SLC 10 1813 01) . . . . . . . . . . . . . . . . . . . . . . . . . . . . . . . . . . . . . . . . . . . . . . . . . . . . . . . . . . . . . . . . . . . . . . . . . . . . . . . . . . . . . . . . . . . . . . . . . . . . . . . . . . . . . . . . . . . . . . . . . . . . . . . . . . . . . . . . . . . . . . . . . . . . . 23,820
2253 Other Deferred revenue earned (SLC 10 1814 01) . . . . . . . . . . . . . . . . . . . . . . . . . . . . . . . . . . . . . . . . . . . . . . . . . . . . . . . . . . . . . . . . . . . . . . . . . . . . . . . . . . . . . . . . . . . . . . . . . . . . . . . . . . . . . . . . . . . . . . . . . . . . . . . . . . . . . . . . . . . . . . . . . . . . .344,630
2252 Donated Tangible Capital Assets (SLC 53 0610 01) . . . . . . . . . . . . . . . . . . . . . . . . . . . . . . . . . . . . . . . . . . . . . . . . . . . . . . . . . . . . . . . . . . . . . . . . . . . . . . . . . . . . . . . . . . . . . . . . . . . . . . . . . . . . . . . . . . . . . . . . . . . . . . . . . . . . . . . . . . . . . . . . . . . . . 1,316,950
2254 Increase / Decrease in Government Business Enterprise equity (SLC 10 1905 01) . . . . . . . . . . . . . . . . . . . . . . . . . . . . . . . . . . . . . . . . . . . . . . . . . . . . . . . . . . . . . . . . . . . . . . . . . . . . . . . . . . . . . . . . . . . . . . . . . . . . . . . . . . . . . . . . . . . . . . . . . . . . . . . . . . . . . . . . . . . . . . . . . . . . .2,040,492
2299 Subtotal 67,619,727
2410 Fees and Revenue for Joint Local Boards for Homes for the Aged . . . . . . . . . . . . . . . . . . . . . . . . . . . . . . . . . . . . . . . . . . . . . . . . . . . . . . . . . . . . . . . . . . . . . . . . . . . . . . . . . . . . . . . . . . . . . . . . . . . . . . . . . . . . . . . . . . . . . . . . . . . . . . . . . . . . . . . . . . . . . . . . . . . . .0
2610 Net Revenues 221,546,116
2620 25% of Net Revenues 55,386,529
9930 ESTIMATED ANNUAL REPAYMENT LIMIT 47,580,883
For Illustration Purposes Only
Annual Interest Rate Term
7.00% @ 5 years = 195,091,014
Page 192