Embed Size (px)
Citation preview

Financial Planning Tool

Sample ForecastsHere are a couple of sample forecasts for a particular dossier. All growth assumptions are shown inthe data. The image is zoomed out to highlight the three primary sections, which can roughly bethought similar to Balance Sheet (Balance Sheet Items), Statement Of Cash Flow (Annual Details),and Income Statement (Cash Flows). With any forecast there are a tremendous number ofcalculations, assumptions and details and this view contains some of that data important tounderstanding the forecast. This view is not intended to be the primary dashboard since there istoo much information. But it is the place to see visually what is going on each year in the forecast.For this introduction it is not necessary to drill down into the details much, but if the viewingapplication supports zoom, zooming in can be useful.
Figure 1. Screenshot of Sample Forecast (Run out of Money)
The Balance Sheet Section
1

Figure 2. Screenshot of Balance Sheet
The balance sheet contains the non-financial assets, which are called worths in the system, and thefinancial assets which are called holdings.
This display includes:
• One row for each worth (i.e. non-financial asset) and each holding (i.e. financial asset).
• A display of the growth used for each balance sheet item - (See Growth Assumptions column)
• The realized log-return for the balance sheet items. For a variable forecast this number is usefulfor understanding how typical or atypical the forecast is, with respect to the balance sheet item.For example, an equity holding modeled with a mean of 8% and standard deviation of 30%might have a realized return of -5% over the entire forecast. Or it might have a realized log-return of 25% over the entire forecast. That variability is inherent to investing in the real worldand in forecasting (when modeled with non-zero standard deviations).
• Present value of any holdings with value remaining at the end of the forecast (i.e. those thatwere not sold to cover costs).
• The annual end balance for each balance sheet item
• The annual Net Worth
The Cash Flows Section
Figure 3. Screenshot of Cash Flows
The Cash Flows section shows all modeled cash flow streams from start of forecast to the end. Theseinclude modeled expense items like cost of living, college costs, and health care costs as well asmodeled income items like earned income, pension income, Social Security Income, etc.
2

Growth Of Flows
Growth of modeled flows is independent from whether the flow applies in a given year. Forexample, a couple might model current college costs, (i.e. what they are willing/intend to pay) at$30,000 per year with a growth rate of 4%, which is above inflation. Growth of the expense occursas modeled even though the payments may only span a four year period some time in the future.
Sample Model for College Expenses (Growth assumed by system)
- id: Son growing_flow_spec: growth: growth_item: college_expense year_range: start: 2022 end: 2026 initial_value: year: 2018 value: 30000
Total Present Value of Incomes/Expenses
For a better understanding of where the money is going over the life of the forecast, the presentvalue of the sum of each flow category is provided.
Who’s Growth Assumptions
A fundamental goal of the system is to make swapping out assumption sets simple. Planners canstore their own growth assumptions for all worth, holding and flow categories, which can bereferenced by the forecast. For example, one can use the system settings (i.e. plusauri) or another’ssettings (e.g. Planning expert).
The Annual Details Section
3

Figure 4. Screenshot of Cash Flows
Of course, not all details can be provided in a single view, but this section highlights some of themost important details. The following describes the general approach of the system:
• Each year the worths, holdings and flows are grown based on their corresponding assumptions.
• Distributions (capital gains, interest, dividends) associated with the holdings are determinedand bucketed for tax purposes.
• Expenses linked to specific accounts, eg college fund expenses linked to 529 accounts, are soldwhen required.
• A federal and state tax bill is calculated and carried forward as an expense for the followingyear.
• When capital losses occur in any year those losses can be carried forward to offset future gains.Additionally some of those losses may offset ordinary income. See rows: Prior Losses Available,Losses Offsetting Gains, Losses Offsetting Ordinary Income, and Remaining Losses.
Sample Monte Carlo ResultsBelow is a sample result for a Monte Carlo Simulation. If you squint while looking at the numberson the left (i.e. number of entries in each bucket) you might notice this is really an ASCII display of alog-normal distribution.
4
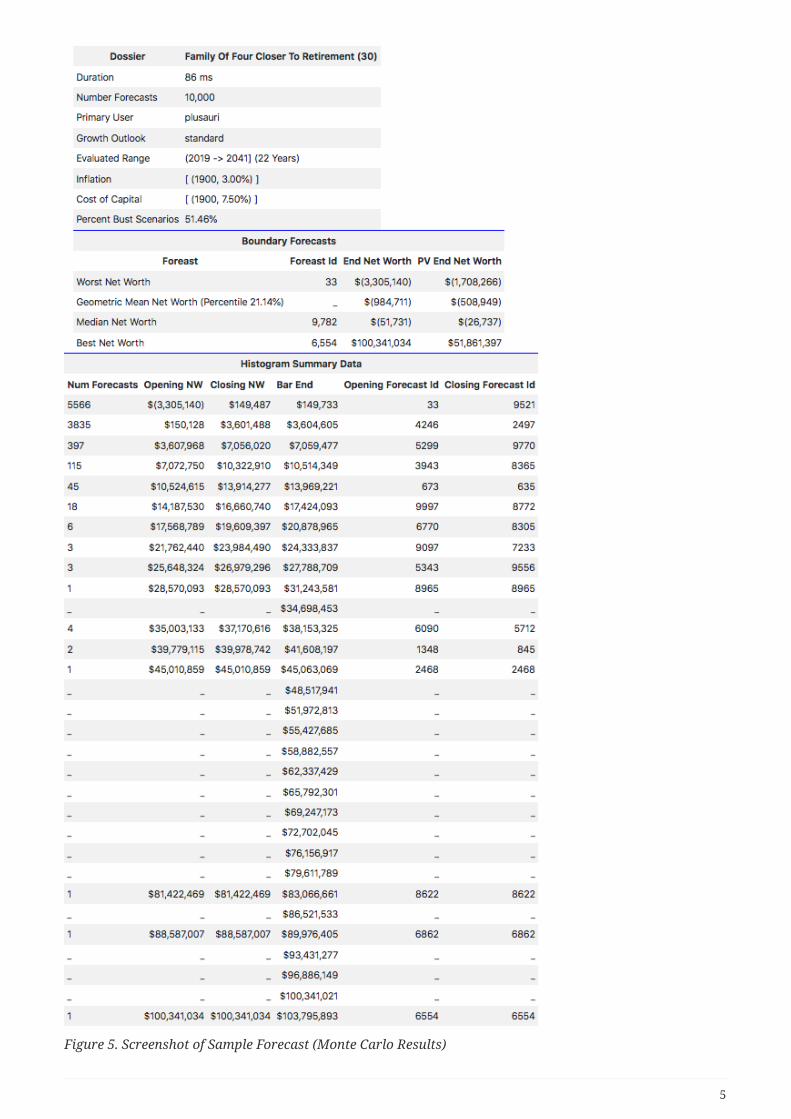
Figure 5. Screenshot of Sample Forecast (Monte Carlo Results)
5

The purpose of Monte Carlo Simulation is to provide information on the likelihood of success orfailure - where failure is typically defined as running out of money before the end of the forecast.The output shows the following forecasts from the simulation with 10,000 forecasts:
• Worst: Worst forecast in terms of smallest net worth at end of forecast. Other metrics forforecast comparison/sorting are available.
• Geometric Mean Forecast: The forecast without any volatility, where all growth assumptions areassumed to be the geometric mean of growth modeled.
• Median Forecast: Forecast in the middle of the distribution.
• Best Forecast: Best forecast in terms of largest net worth at end of forecast. Other metrics forforecast comparison/sorting are available.
Providing these specific forecasts is arbitrary and it is a simple change to provide otherbreakdowns - like quintiles. In addition to the distribution, the number of bust scenarios is provided.This is typically viewed as a proxy for probability of failure.
A good way to think about the distribution is to take the typical picture results from a Monte CarloSimulation and rather than focus on all the crazy paths that the scenarios of the portfolio has taken,focus only on where the final values end up (i.e. the utmost right hand side).
Figure 6. Screenshot of Typical View of Monte Carlo Results
6