Embed Size (px)
Citation preview

Financial Planning for Natural Disasters: A Workbook for Local Governments and Regions
1
TableofContentsAcknowledgments ......................................................................................................................................... 2
Guide to Using this Workbook ...................................................................................................................... 3
Module 1: Identifying Natural Disasters with Potential Financial Implications for Your Community ......... 5
Module 2: Measuring Local Government Financial Vulnerability to Natural Disasters ................................ 9
Module 3: Measuring the Financial Capacity of Local Governments to Address Natural Disasters .......... 16
Module 4: Identifying Strategies to Reduce the Gap between Financial Vulnerability and Capacity ........ 21
Module 5: Identifying Regional Financial Vulnerabilities ........................................................................... 29
Image Credits: ............................................................................................................................................. 35
Appendix: Module Worksheets ................................................................................................................. 36
Worksheet 1. Identifying Natural Disasters with Potential Financial Implications
for Your Community ....................................................................................................................... 37
Worksheet 2. Local Government Financial Vulnerability to Natural Disasters ....................................... 39
Worksheet 3. Measuring the Financial Capacity of Local Governments to Address Natural Disasters 42
Worksheet 4. Identifying Strategies to Reduce the Gap Between Financial Vulnerability and Capacity
................................................................................................................................................................ 43
Worksheet 5. Identifying Regional Financial Vulnerabilities .................................................................. 46

2
AcknowledgmentsThis workbook was researched and written by RUPRI, through a subcontract agreement with the NADO
Research Foundation. The work that provided the basis for this publication was supported by funding
under an award with the U.S. Department of Housing and Urban Development. The substance and
findings of the work are dedicated to the public. The author and publisher are solely responsible for the
accuracy of the statements and interpretations contained in this publication. Such interpretations do not
necessarily reflect the views of the Government.
The authors would like to thank several individuals and organizations that made this project a success.
First, we would like to thank Chuck Fluharty, President and CEO of RUPRI, for making resilience a priority
within the analytic and academic portfolio of RUPRI. Second, the authors would like to thank the
Mississippi Alabama Sea Grant Consortium who provided financial support for the City of Foley, Alabama
case study highlighted in this workbook (through Grant NA10OAR4170078, project no R/MG/CSP‐21).
The authors would like to thank Jody Thompson, Auburn University; Carol Franze and Kayla Brown, LSU
AgCenter; and Sam Wagle, LSU Public Administration Institute, with their assistance in the Foley case
study project. Finally, the authors would like to thank Brett Schwartz and Megan McConville at NADO
for their quality input into the final version of this workbook.

3
GuidetoUsingthisWorkbookAfter a natural disaster strikes a region, its physical consequences are very evident—wrecked homes and
businesses, flooded streets, damaged vehicles, destroyed crops, and other visible impacts. However,
natural disasters can have other effects that aren’t as obvious to the naked eye, but have equally serious
implications for communities. The strain that natural disasters place on local governments’ financial
capacity is one of the most serious of these impacts. While cities and counties may receive some federal
aid after disasters, they are still responsible for many of the costs related to response and recovery, and
if they are not prepared, these costs can have long‐term impacts on local financial health.
A local government’s financial resilience is defined as its ability to understand its potential future
financial burdens and to cover those costs. This workbook helps municipalities, counties, and regions
improve their financial resilience to natural disasters.
This workbook is designed to help local governments and regions understand their financial
vulnerabilities to natural disasters, evaluate their financial capacity to cover the costs of those disasters,
identify strategies to close the gap between financial vulnerability and capacity, and identify and address
the spillover effects of neighboring local governments’ financial vulnerabilities to disasters.
Workbook Organization
This workbook is organized into five modules:
Module 1: Identifying Natural Disasters with Potential Financial Implications for Your Community
Module 2: Measuring Local Government Financial Vulnerability to Natural Disasters
Module 3: Measuring the Financial Capacity of Local Governments to Address Natural Disasters
Module 4: Identifying Strategies to Reduce the Gap between Financial Vulnerability and Capacity
Module 5: Identifying Regional Financial Vulnerabilities
Each module contains a narrative introducing the topic, financial resilience strategies, and examples of
solutions used by communities across the country. At the end of each module, there are worksheets
with step‐by‐step instructions. In addition, all of the worksheets are compiled in an appendix at the end
of the workbook for easy printing.
Audience
This workbook is targeted primarily at local government staff and leadership, including emergency
managers, finance staff, and elected officials. We suggest that emergency managers and finance staff
work together to complete all modules in the workbook.

4
This workbook will also be useful to regional planning and economic development organizations as they
help their partner local governments prepare for natural disasters and promote regional approaches to
mitigation and recovery. Regional planning organizations may find Modules 1 and 5 particularly valuable
as they relate to inter‐governmental relations within a larger region. Regional economic development
organizations may find the measurement modules (2 and 3) valuable as they relate not only to financial
planning for disasters, but also to general local government finances and how those impact the delivery
of public services necessary for development over the long term.
Universities and their outreach organizations may also be interested in this workbook. University
courses on disaster management could use Modules 2 and 3 for a lecture focused on financial issues
related to disasters. Courses on community and economic development could use all five modules for a
one‐ or two‐week section on financial disaster resilience. University extension organizations may find
Modules 2 and 3 useful for helping local governments think more strategically about disaster planning.
Disclaimer
This workbook is a general guide to local government financial planning for natural disasters. The
suggestions in this document should not be considered a comprehensive set of financial planning tools
that will guarantee resilience, but rather one decision support tool to be considered along with guidance
from accountants, attorneys, and other professionals.
We hope you find this workbook valuable as you work to make your community financially strong and
resilient to future natural disasters.
J. Matthew Fannin, Ph.D.
Associate Director and Associate Professor
Analytic and Academic Programs
Rural Policy Research Institute
Department of Agricultural Economics and Agribusiness
Louisiana State University
Kathleen Miller
Program Director
Rural Policy Research Institute
University of Missouri
December 2013

5
Module1:IdentifyingNaturalDisasterswithPotentialFinancialImplicationsforYourCommunityOverview
Just as local governments plan financially for other
major events (e.g. planned reduction of tax revenue
from a manufacturing plant closing that occurs within
your region), it is possible to plan for the financial
impacts of natural disasters. For example, many local
governments in the Great Lakes region budget annually
for snow removal. Snowstorms are one type of natural
disaster that local governments can plan for–very
frequent, predictable events. On the other end of the
spectrum are very infrequent and less predictable
events, such as earthquakes in non‐earthquake prone
regions. Most natural disasters fall within this
continuum from high‐frequency, predictable events to
low‐frequency and less predictable events.
In most cases, a community or region can’t plan
financially for extreme low‐frequency, highly
unpredictable natural disasters, but financial planning
can be undertaken for most other disasters.
Which types of disasters should you consider planning for financially? In the worksheet that follows this
module, we ask you to rank the natural disaster types that you may consider for financial preparation.
These could include:
Hurricanes
Tornadoes
Floods
Earthquakes
Droughts
Wildfires
Snow and ice storms
Other types of natural disasters that may impact your region
Assessing and quantifying the risk of natural disaster is outside the scope of this workbook. However,
that information is available from many other sources. Many natural disasters have sufficient historical

6
frequency that researchers have developed estimates of regional probabilities of future natural disaster
events. For example, probabilities of a small tropical storm as well as a major hurricane passing through
coastal counties in the Gulf Coast and Atlantic regions have been estimated at Colorado State
University.1 This website also provides likelihood of occurrence based on the planning horizon that can
be as short‐term as a single year or as long‐term as 50 years. Local emergency managers are also good
sources of information about natural disaster risks. They may have assessed these risks for the local
hazard mitigation plan required by the Federal Emergency Management Agency (FEMA). State hazard
mitigation plans may also contain useful information. Local government staff can also consult with
regional planning councils, university researchers, and the regional offices of federal agencies such as
FEMA and the National Oceanic and
Atmospheric Administration. Both FEMA and
NOAA offer helpful data tools that can help
local governments assess risks, such as
HAZUS, Digital Coast, and the National
Climactic Data Center.2,3,4
Local governments must also identify the
time horizon they will use for financial
planning. There is no single optimal time
horizon for disaster planning. One strategy
local governments can use to choose a time
horizon is to build a time horizon around the
frequency of the disaster’s occurrence in your
region. For example, if a local government
knows a Category 1 hurricane will pass
through its region once every 25 years, then
25 years may be a maximum time horizon to
consider for financial planning for that disaster event.
Conclusion
In this module, we asked you to identify the types of natural disasters that could have financial
implications for your community. In the next module, we will help you identify specific ways to quantify
the costs to individual local governments of natural disasters.
1 Klotzbach, P, and W. Gray. 2013. “United States Landfalling Hurricane Probability Project.” Accessed October 1. Online: http://www.e‐transit.org/hurricane/welcome.html 2 Federal Emergency Management Agency. 2013. “Hazard Mitigation Planning Risk Assessment.” Accessed October 15. Online: http://www.fema.gov/hazard‐mitigation‐planning‐risk‐assessment 3 National Oceanic and Atmospheric Administration. 2013. “Digital Coasts: NOAA Coastal Services Center.” Accessed October 15. Online: http://www.csc.noaa.gov/digitalcoast/ 4 National Oceanic and Atmospheric Administration. 2013. “National Climatic Data Center.” Accessed October 15. Online: http://www.ncdc.noaa.gov/

7
Worksheet1.IdentifyingNaturalDisasterswithPotentialFinancialImplicationsforYourCommunity
Step1.Rank the top three natural disasters in your individual community /region based on cost to the
community to recover from the disaster, from most to least costly.
1.
2.
3.
Step2.Rank the top three natural disasters in your individual community /region based on likelihood of
occurrence from most frequent to least frequent.
1.
2.
3.

8
Step3.Rank the top three natural disasters that could impact neighboring communities and create a financial
burden for your community. For examples of how this might occur, see Module 5.
1.
2.
3.

9
Module2:MeasuringLocalGovernmentFinancialVulnerabilitytoNaturalDisastersBackground
Just after midnight on September 16, 2004, Hurricane Ivan made
landfall near Gulf Shores in Baldwin County, Alabama as a Category
3 storm with sustained winds of 130 miles per hour.5 This major
hurricane had a sizeable impact on the entire region surrounding
Baldwin County as well as points east reaching towards Pensacola,
Florida.
As was expected, the storm’s surge and strong winds devastated
coastal communities. Communities farther north also experienced
major wind damage and became littered with debris.
While many of the losses sustained by private businesses and
households due to natural disasters are insured, local governments
also bear significant disaster‐related costs, none of which are
insured. However, local governments can reduce their financial
vulnerability by measuring and understanding it before a disaster
occurs. This module begins with the case of the city of Foley,
located in Baldwin County, which illustrates how a local government
might assess its vulnerability to a future natural disaster.
Foley is a city of 14,618 residents6 and is situated less than 10 miles
from the beachside community of Gulf Shores. Given its proximity
to the beach, much of Foley’s economy is driven by tourism
including restaurants, recreational services, and retail activities.
Foley is a good example of a small to medium‐sized municipality
that is highly vulnerable to major natural disasters (hurricanes) and
must work with other political jurisdictions when preparing for
disasters and during the short‐ and long‐term response.
5 National Weather Service Weather Forecast Office Mobile/Pensacola. 2005. “Powerful Hurricane Ivan Slams the US Central Gulf Coast as an Upper‐Category 3 Storm.” Accessed September 7, 2013. Online: http://www.srh.noaa.gov/mob/?n=ivan 6 United States Census Bureau American Factfinder. 2013. “2010 Population – Foley, Alabama.” Accessed September 7. Online: http://factfinder2.census.gov/faces/nav/jsf/pages/index.xhtml
This module
presents a step‐
by‐step process
local
governments
can use to
calculate their
financial
vulnerability to
future natural
disasters.

10
How Many Disaster Events to Consider?
In Module 1, you ranked natural disasters based on different attributes. In determining the financial
vulnerability of your community to natural disasters, you must determine how many disaster scenarios
you want to prepare. There is no right answer to this question. The city of Foley chose to use one large
natural disaster event, Hurricane Ivan, as their primary disaster event for future financial disaster
planning.
Categorizing Natural Disasters for Measuring Vulnerability Costs
In Module 1, we discussed the frequency of natural disasters. Frequency matters for financial planning
because it may be difficult for local governments to find historical data on disasters that occur very
infrequently. As a result, it may be hard to predict future financial burdens. Natural disasters that occur
more frequently may have impacted the finances of a local government more recently and can provide
useful information for future planning.
Low Frequency Disasters with Local History
The New Madrid earthquakes of 1811 and 1812 had
measurable impacts on a region near the Mississippi
River between Memphis, Tennessee and St. Louis,
Missouri. Three main earthquakes ranging from 7.5 to
7.7 on the Richter scale occurred during this period—
highly unusual events for this area.7 While historical
data can be used to predict the physical damage a
future earthquake might cause (e.g. sand blows, river
bank failures, landslides, sunken land), changes in
development patterns, infrastructure, and public policy
over time can influence the financial consequences of a
future earthquake in this region. For low frequency
events with no recent history such as the New Madrid
earthquakes, local governments should work with
experts who develop simulation models that account
for current conditions and simulate the financial losses
of these events.
7 It should be noted that earthquakes 7.0 or greater are a very infrequent occurrence in the continental United States. According to the Earthquake Hazards Program website, there have been only 36 earthquakes of magnitude 7.0 or greater (measured or estimated) on the Richter scale in the continental U.S. since the early 1800s. Source: United States Geological Survey. 2013. “Earthquake Hazards Program.” Accessed October 15. Online: http://earthquake.usgs.gov/earthquakes/states/large_usa_7.php

11
Higher Frequency Disasters with Local History
When the disaster event a community or region wants to plan for is more frequent, additional questions
should be asked. Has the community received federal assistance from FEMA for that type of disaster in
recent years? If so, then historical financial data is typically available from FEMA or the state
government. Current procedures that govern federal financial support for local governments impacted
by disasters often involve a cost‐sharing arrangement between the local government and the federal
government. Depending on the financial severity of the disaster, the U.S. government has typically
reimbursed 75 to 90 percent of local government expenses based on expense category eligibility
through its Public Assistance (PA) Program.8
Some of these categories include expenses that may be covered in part by private sector insurance such
as roads, bridges, water control facilities, public buildings and their contents, public utilities, and parks
(Categories C‐G of the PA Program). In these cases, public assistance is adjusted based on additional out‐
of‐pocket expenses beyond what is covered by insurance. In other cases, there are disaster expenses
that have no private sector insurance market such as emergency protective measures (e.g. evacuation
expenses, fuel, water, ice, meals ready to eat, etc), and debris removal expenses (Categories A and B of
the PA Program). Depending on the disaster type, these uninsurable expenses can often be the greatest
burden on local governments and one for which they have not planned.
The chart below demonstrates the city of Foley’s financial vulnerability.
Public Assistance Category Costs for the city of Foley for Hurricane Ivan (in 2004/2005 dollars) Category A: Debris Removal $4,636,409.41Category B: Emergency Protective Measures $95,727.58Category E: Public Buildings and Contents $10,405.00Administrative Costs $58,425.42 Total $4,800,967.41Source: City of Foley Note: Details of Public Assistance categories can be found at http://www.fema.gov/pdf/government/grant/pa/fema323_app_handbk.pdf
If Foley were doing these calculations in 2014 dollars, these costs adjusted for inflation would exceed $6
million. Depending on the severity of the natural disaster, a local government may be responsible for as
little as 10 percent of these costs, or in extreme cases, 100 percent if the disaster does not receive a
federal declaration for reimbursement. If your local government has experienced a previous natural
disaster that did not receive a federal declaration, you should consider organizing your historical cost
records into the federal expenditure categories highlighted. By doing so, you can evaluate how your
8 An evolution of these cost shares is highlighted by McCarthy, F.X. (2010). “FEMA Disaster Cost‐Shares: Evolution
and Analysis.” Accessed August 15, 2013. Online: http://assets.opencrs.com/rpts/R41101_20100309.pdf.

12
financial vulnerabilities might change if the historical disaster came again and the federal government
declared it eligible for reimbursement.
High Frequency Disasters with No Local History
What happens if a community wants to prepare for a high frequency disaster that has not yet impacted
the local community? For example, many regions along the Atlantic seaboard that did not take a direct
hit from Hurricane Sandy have similar vulnerabilities to the regions that were affected. In these
instances, it is helpful to ask peer local governments that have experienced that type of disaster for
guidance. Selected peer local governments should have similar characteristics, especially those that
could be impacted by a disaster. For example, you may want to choose a peer local government with
similar population density, topography (elevation level and percent of land in floodplain), and a
comparable percentage of forested acres, agricultural land, and percent urban and rural.
Once you have identified a peer local government, you should work with that local government to
obtain information about the disaster. If the peer government’s disaster was eligible for Public
Assistance through the Stafford Act9, what were its expenses by category? What level of insurance did it
have on insurable items that were covered in the
disaster? What were the deductibles or co‐payments
of these policies? Were there other expenses not
covered by the federal government or insurance
related to the disaster event?
Once calculated, these values should be converted into
a common value that can be used for your own
financial planning. For example, these costs could be
converted to a per dollar of local government assessed
value or a per capita basis. Once converted, these
values can then be applied to the assessed value or
population of your local government jurisdiction to
generate an estimate for planning.
Conclusion
In this module, we presented a step‐by‐step process of
calculating financial vulnerability for one or more
natural disaster events for a local government. In the
next module, we focus on calculating the financial
capacity a local government has to address these
financial vulnerabilities.
9 The Stafford Act provides statutory authority for most federal disaster response activities as they relate to FEMA, http://www.fema.gov/robert‐t‐stafford‐disaster‐relief‐and‐emergency‐assistance‐act‐public‐law‐93‐288‐amended.

13
Worksheet2.LocalGovernmentFinancialVulnerabilitytoNaturalDisasters
Step1.Is the frequency of your disaster event High or Low? If Low, go to Step 2. If High, go to Step 3.
Step2.Contact a regional university, nonprofit organization, or state or federal partner about modeling capacity
in your area to simulate the financial costs of a disaster event on your local government geography.
Step3.Has your local government experienced a disaster event of this type in recent history? If Yes, go to Step
4. If No, go to Step 5.

14
Step4.Calculate financial vulnerability from historical data. Please complete the blanks in the table below to
estimate financial vulnerability.
Federally‐Declared Disaster Example
Line 1: Category A Costs: Debris Removal $______________
Line 2: Category B Costs: Emergency Protective Measures $______________
Line 3: Category C – Category G Costs1: $______________
Line 4: Local Cost Share Rate (10%, 25%, 100%) ______________%
Line 5: Local Reimbursable Burden ((Line 1 + Line 2+ Line 3)* Line 4) $______________
Line 6: Total Deductibles and Co‐Pays for insured losses $______________
Line 7: Uninsured and other federal ineligible expenses $______________
Line 8: Total Financial Vulnerability (Line 5+ Line 6 + Line 7) $______________
Line 9: Inflation Factor to Current Dollars ______________%
Line 10: Total Financial Vulnerability in Today’s Dollars
(Line 8 times Line 9) $______________
1Categories C‐G represent infrastructure‐related expenses. Details can be found at
http://www.fema.gov/pdf/government/grant/pa/fema323_app_handbk.pdf.
Note: Vulnerability can be influenced by state support for disasters as well as ad hoc changes in
reimbursement policy for a given disaster policy, among other things.

15
Step5.Identify a peer local government that has experienced the disaster event from which you want to
prepare financially and follow Step 4 with that jurisdiction. Once finished, complete blanks in the box
below.
Peer Local Government Example
Line 1: Line 8 from Step 4 of Peer Government $_______________
Line 2: Assessed Valuation of Peer Government Jurisdiction $_______________
Line 3: Peer Costs per dollar of Assessed Valuation (Line 1 divided by Line 2) $_______________
Line 4. Local Government’s Current Assessed Valuation $_______________
Line 5: Local Government’s Financial Vulnerability (Line 3 times Line 4) $_______________
Line 6: Inflation Factor to Today’s Dollars _______________%
Line 7: Total Financial Vulnerability in Today’s Dollars
(Line 5 times Line 6) $_______________
Note: One can also calculate local government burden from peer government by using population as an
alternative to assessed value. If population is preferred, replace peer government population in Line 2
and local government population in Line 4 and recalculate.
Step6.If your local government wants to prepare for more than one natural disaster event (e.g. multiple
disaster types or multiple disaster events of the same type), go back to Step 1. Sum total financial
vulnerability from each disaster event calculated to identify total financial vulnerability.

16
Module3:MeasuringtheFinancialCapacityofLocalGovernmentstoAddressNaturalDisastersBackground
In Module 2, we presented a detailed strategy for assessing the
financial vulnerability of a local government to one or more natural
disasters. In this module, we will discuss an approach local
governments can use to identify the financial resources they could
draw on to cover the costs of future disasters.
What Financial Resources are Available to Local Governments for
Disaster‐Related Costs?
Local governments receive revenues for delivering the public
services they have been commissioned to provide to their residents.
However, there are often restrictions on how these revenues can be
spent. For example, local governments may receive revenues in the
form of intergovernmental transfers to be used for specific
purposes, such as funding from a state government for maintaining
or building roads. Local governments may also receive revenues in
the form of taxes created through ballot propositions that restrict
the spending of those revenues to specific services such as solid
waste or parks projects.
At the same time, many governments collect taxes and receive
revenues from fees that are unrestricted. These funds can be used
to pay for any classification of local government expenses, including
emergency expenses after natural disasters. There are a variety of
ways to identify the financial resources that a local government may
use for disaster planning.
Using Audited Financial Statements
Many local governments generate publicly‐available financial
statements on a regular basis (typically annually or bi‐annually).
These statements may be called financial statements, audit statements, audited financial statements, or
comprehensive annual financial reports. While recording requirements may vary by state and the size of
the local government, many states require local governments to have external auditors review these
In this module,
we will highlight
a strategy local
governments
can use to
identify the
financial
resources they
could draw on to
cover the costs
of future
disaster events.
17
statements and submit them to a central repository where they will be available for the general public
to view, in person or online.
When external auditors are involved, they typically follow a set of generally accepted accounting
principles. For public sector organizations, these principles follow the guidance of the Governmental
Accounting Standards Board (GASB).10 Recent changes to this guidance have promoted more
comparable statements across local government jurisdictions. Further, the recent adoption of GASB
Statement 54 provides clarity on funds that can be applied to expenses related to natural disasters.
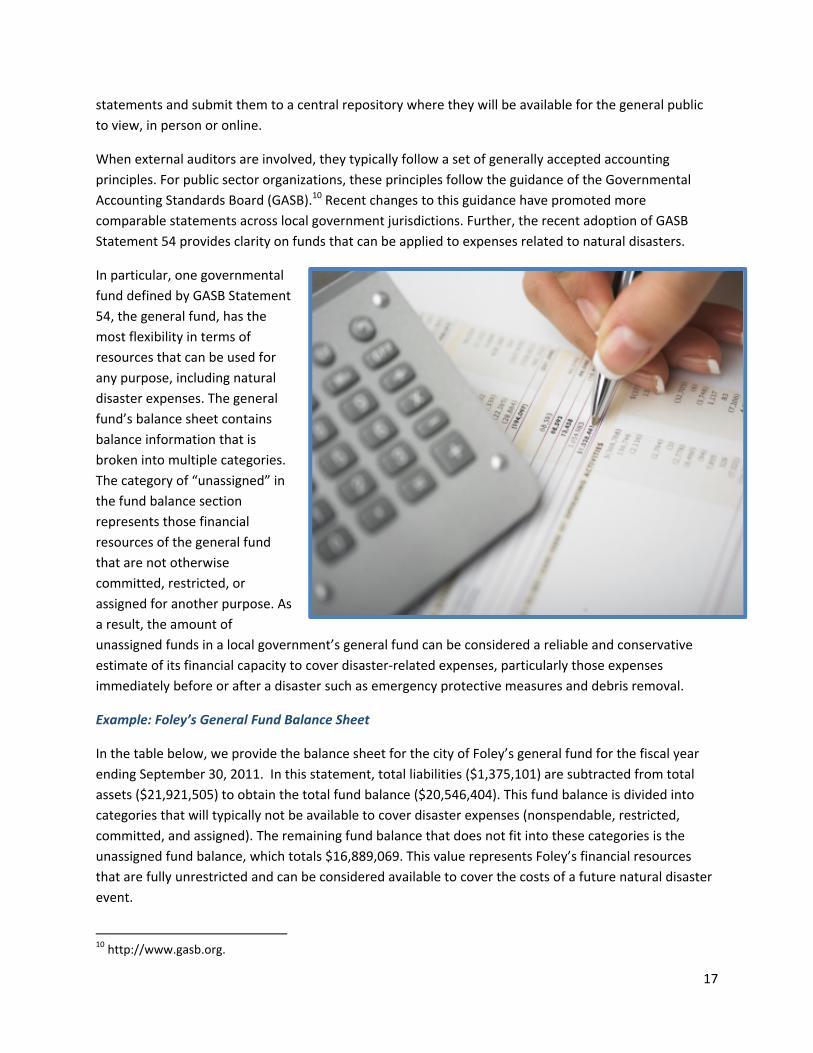
In particular, one governmental
fund defined by GASB Statement
54, the general fund, has the
most flexibility in terms of
resources that can be used for
any purpose, including natural
disaster expenses. The general
fund’s balance sheet contains
balance information that is
broken into multiple categories.
The category of “unassigned” in
the fund balance section
represents those financial
resources of the general fund
that are not otherwise
committed, restricted, or
assigned for another purpose. As
a result, the amount of
unassigned funds in a local government’s general fund can be considered a reliable and conservative
estimate of its financial capacity to cover disaster‐related expenses, particularly those expenses
immediately before or after a disaster such as emergency protective measures and debris removal.
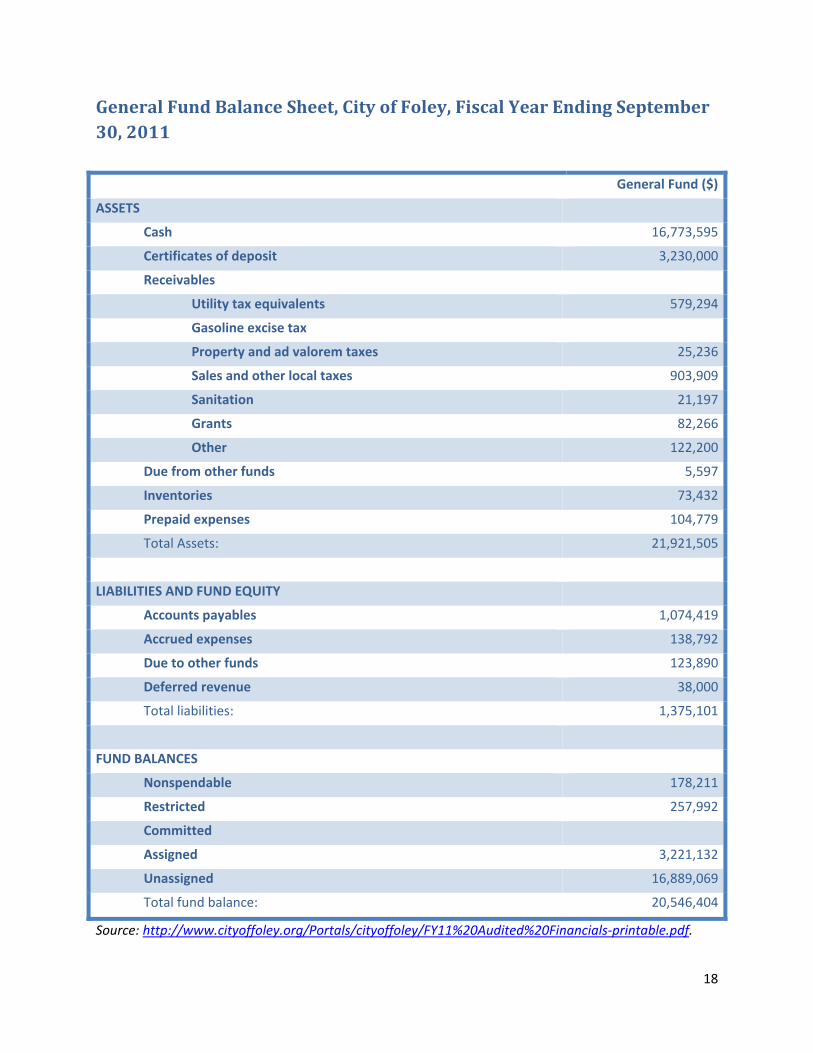
Example: Foley’s General Fund Balance Sheet
In the table below, we provide the balance sheet for the city of Foley’s general fund for the fiscal year
ending September 30, 2011. In this statement, total liabilities ($1,375,101) are subtracted from total
assets ($21,921,505) to obtain the total fund balance ($20,546,404). This fund balance is divided into
categories that will typically not be available to cover disaster expenses (nonspendable, restricted,
committed, and assigned). The remaining fund balance that does not fit into these categories is the
unassigned fund balance, which totals $16,889,069. This value represents Foley’s financial resources
that are fully unrestricted and can be considered available to cover the costs of a future natural disaster
event.
10 http://www.gasb.org.
18
GeneralFundBalanceSheet,CityofFoley,FiscalYearEndingSeptember30,2011 General Fund ($)
ASSETS
Cash 16,773,595
Certificates of deposit 3,230,000
Receivables
Utility tax equivalents 579,294
Gasoline excise tax
Property and ad valorem taxes 25,236
Sales and other local taxes 903,909
Sanitation 21,197
Grants 82,266
Other 122,200
Due from other funds 5,597
Inventories 73,432
Prepaid expenses 104,779
Total Assets: 21,921,505
LIABILITIES AND FUND EQUITY
Accounts payables 1,074,419
Accrued expenses 138,792
Due to other funds 123,890
Deferred revenue 38,000
Total liabilities: 1,375,101
FUND BALANCES
Nonspendable 178,211
Restricted 257,992
Committed
Assigned 3,221,132
Unassigned 16,889,069
Total fund balance: 20,546,404
Source: http://www.cityoffoley.org/Portals/cityoffoley/FY11%20Audited%20Financials‐printable.pdf.

19
Restricted Funds for Disaster Expenses
While the previous discussion highlighted the most unrestricted funds, restricted funds may also be
available to cover future disaster expenses. For example, a municipality’s voters may have approved a
tax to support solid waste disposal. The legal language developed for the tax proposition may be
sufficiently flexible for the local government to use some of these revenues to cover debris removal
expenses. A dedicated tax for roads may also be available to cover cost share expenses for repairing a
road damaged by a disaster. Finally, a local government may have a legally restricted emergency or
contingency fund that could be tapped to cover expenses arising from disasters. These funds should also
be considered when measuring financial capacity.
In these cases, it is important to know the legal standing a local government has for using these
restricted funds for non‐traditional expenses. Local officials should consult their staff attorney or
external auditor for advice on the use of these restricted funds before considering them to be available
for spending.
Conclusion
In this module, we highlighted financial resources available to local governments to address the financial
vulnerabilities discussed in Module 2. We focused on identifying flexible funds that could be used, and
also suggested how restricted funds might be made available to cover the costs of natural disasters. In
the next module, we help you identify strategies to address any gaps between vulnerabilities and the
financial resources that are available.

20
Worksheet3.MeasuringtheFinancialCapacityofLocalGovernmentstoAddressNaturalDisasters
Line 1. Unassigned Fund Balance from General Fund Balance Sheet $_____________
Line 2. Restricted Funds Available for Natural Disaster Expenses* $_____________
Line 3. Total Financial Capacity of Local Government (Line 1 + Line 2) $_____________
*Please consult with a staff attorney or external auditor on availability of restricted funds for natural
disaster expenses.

21
Module4:IdentifyingStrategiestoReducetheGapbetweenFinancialVulnerabilityandCapacityBackground
In the previous two modules, we discussed local government
financial vulnerability to natural disasters and the financial
resources that might be available to cover those costs. Some local
governments may find that there is a gap between their financial
vulnerability and capacity, with vulnerability exceeding capacity. In
this module, we will identify strategies that can help to close that
gap.
A local government’s general level of financial preparedness or
resilience can be evaluated using a basic formula:
If financial capacity > financial vulnerability,
the local government is financially prepared for the disaster(s) identified.
If financial capacity < financial vulnerability,
critical decisions need to be made.
As long as financial capacity exceeds expected financial
vulnerability, then a local government is as prepared as can be
reasonably expected for the future disaster event it identified. Of
course, it is impossible to predict the number and severity of natural
disasters, so costs may exceed expectations. For example, a local
government may prepare for a Category 3 hurricane but experience
a Category 4 storm.
As long as
financial
capacity exceeds
expected
financial
vulnerability,
then a local
government is as
financially
prepared as can
be reasonably
expected for the
future disaster
event it defined.

22
Example: Foley
In Module 2, we evaluated the financial vulnerability of the city of Foley to a future major hurricane, and
in Module 3, we calculated the city’s financial capacity that could be used to cover the costs of that
future disaster. Let’s see how well the city is prepared:
Financial Vulnerability: $6,000,000 (2013 dollars) (from Module 2) Financial Capacity: $16,889,069 (Unassigned Fund Balance) (from Module 3)
On initial inspection, it appears that Foley is more than adequately prepared for the costs of a future
hurricane of the size and expense of Hurricane Ivan (as of 2011). However, it should be noted that
Foley’s financial vulnerability does not include any deductibles or co‐pays for insurable property
damages. On the other hand, the $6 million does not include the federal government cost share
(typically 75 to 90 percent depending on disaster severity). If the local government expects a federal
disaster declaration and federal aid, it would reduce its financial vulnerability costs on federally‐
reimbursable expenses to between 10 percent and 25 percent of this $6 million total.
Foley represents an unusual example where financial capacity is measurably higher than financial
vulnerability. Many local governments are at a much lower level of financial preparedness. In the next
section, we explore strategies for mitigating this gap. First, we discuss approaches to reduce financial
vulnerability. We then propose methods of increasing financial capacity to cover disaster expenses.
Reducing the Gap – Reducing Vulnerability
A key strategy that local governments can use
to decrease financial vulnerability is to invest
in public infrastructure that reduces the
impacts and costs of natural disasters. For
example, if a local government is trying to
reduce the costs of a potential future
hurricane where damage is typically driven by
storm surge, flooding, and wind, then building
new infrastructure above the average storm
surge level and outside the flood zone could
reduce infrastructure costs. Purchasing storm
windows with higher wind speed ratings for
public buildings would also reduce costs.
Financial vulnerability may also be reduced through policies that lower the vulnerability of the private
sector and simultaneously reduce local government expenses. Improved building codes to make
residential properties more resistant to wind and flooding potentially lessen debris removal costs for the
local government. Zoning ordinances that encourage the planting of trees that are resilient to high wind
speeds and create less vegetative debris can further reduce public sector disaster expenses.

23
In each of the cases presented, a return on investment should be considered relative to the specific
disaster events you want to consider, the timeline for that return on investment, and the financial
resources available to invest. For example, high wind speed rating storm windows installed in public
buildings may provide a quicker return on investment than improving storm surge protection by building
or strengthening levees. The windows could pay for themselves by not shattering during one storm,
whereas the high costs of levee construction may take multiple disaster events spread over several
decades to generate a return on the initial investment. At the same time, building a levee may provide
the safety and security that attracts development that would not otherwise occur, bringing new tax
revenue. Each community should evaluate the costs and benefits of these approaches in the context of
their financial constraints, natural hazards, and long‐term goals.
Reducing the Gap – Increasing Financial Capacity
A local government has many options for increasing its financial capacity for covering disaster expenses,
including generating new revenue, re‐prioritizing existing revenue and spending, and borrowing. Each
option is discussed further below.
1) Generating New Revenue
The first approach to reducing the capacity‐vulnerability gap is to increase revenue through traditional
levers such as general taxes, fees, and income through government‐run business activities. Increases in
revenue can sometimes be a difficult sell to communities that have not experienced recent natural
disasters. Further, communities that have experienced major natural disasters may have vulnerable
private sector economies for which tax increases may be problematic. If that is the case, other strategies
may be more desirable as first steps.
2) Reprioritize Existing Revenue/Spending
A. Creation of Dedicated Fund or Fund Balance Thresholds
This approach can take several forms. For example, a local government could reprioritize its annual
budget to create a disaster emergency fund, depositing a given percentage of the total annual budget
into this fund up to a given threshold. A similar option would be to dedicate existing funds or fund
balances for disaster event expenses only.
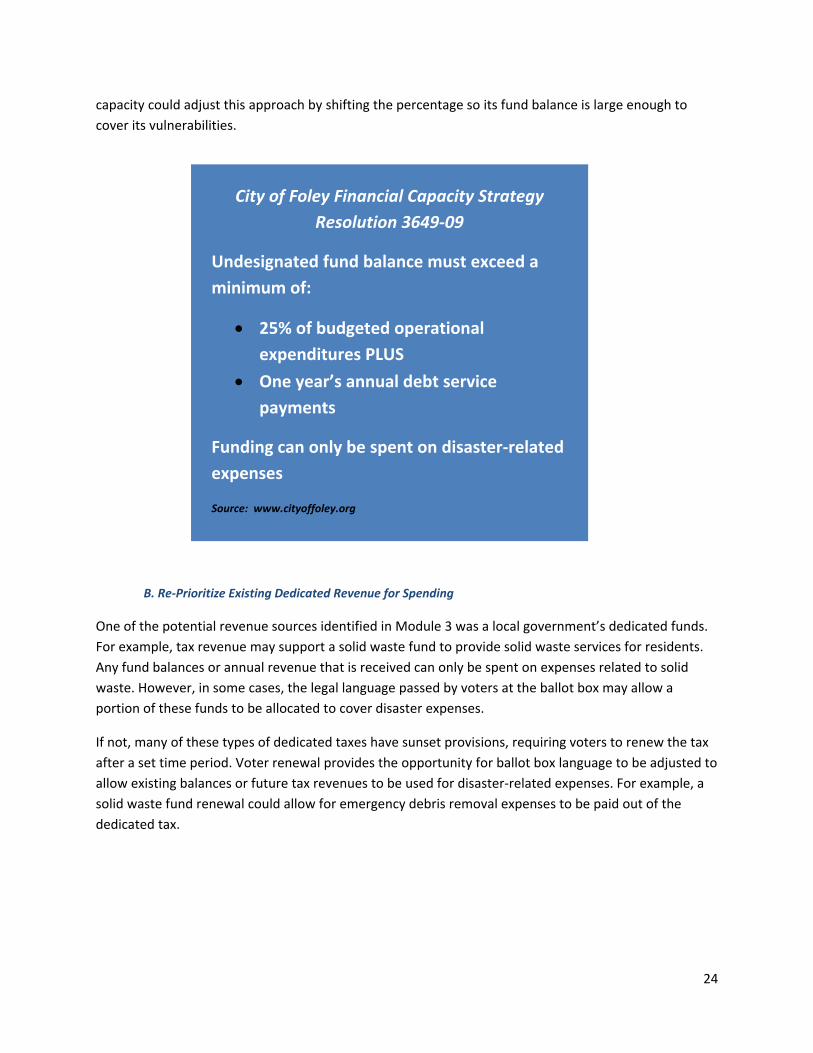
For example, in an effort to increase its financial preparedness for a future natural disaster on the scale
of Hurricane Ivan, the City of Foley passed a resolution that requires an undesignated fund balance to
meet or exceed 25 percent of budgeted operational expenditures annually plus one year’s annual debt
service payments of the city. This portion of the total undesignated fund balance can only be used to
cover disaster‐related expenses. This resolution is one of the reasons Foley showed such sizeable
unassigned general funds in the earlier example.
One of the benefits of this approach is that as the city grows its budget, the size of the undesignated
fund balance grows as well. Another community whose financial vulnerability exceeds its financial
24
capacity could adjust this approach by shifting the percentage so its fund balance is large enough to
cover its vulnerabilities.
B. Re‐Prioritize Existing Dedicated Revenue for Spending
One of the potential revenue sources identified in Module 3 was a local government’s dedicated funds.
For example, tax revenue may support a solid waste fund to provide solid waste services for residents.
Any fund balances or annual revenue that is received can only be spent on expenses related to solid
waste. However, in some cases, the legal language passed by voters at the ballot box may allow a
portion of these funds to be allocated to cover disaster expenses.
If not, many of these types of dedicated taxes have sunset provisions, requiring voters to renew the tax
after a set time period. Voter renewal provides the opportunity for ballot box language to be adjusted to
allow existing balances or future tax revenues to be used for disaster‐related expenses. For example, a
solid waste fund renewal could allow for emergency debris removal expenses to be paid out of the
dedicated tax.
City of Foley Financial Capacity Strategy
Resolution 3649‐09
Undesignated fund balance must exceed a
minimum of:
25% of budgeted operational
expenditures PLUS
One year’s annual debt service
payments
Funding can only be spent on disaster‐related
expenses
Source: www.cityoffoley.org

25
3) Borrowing
In the current fiscal environment where there have been several high‐profile municipal bankruptcy
cases, borrowing may not be considered a desirable option for many local governments. However for
some local governments in poor financial health, borrowing may be the only option if they have zero
savings and need time to sell assets or generate savings to pay off disaster expenses.
Financially healthy local governments may also consider borrowing as an effective tool for managing
disaster expenses. For example, the federal government typically requires local governments to
maintain pre‐approved plans and contracts for common activities related to certain disasters, such as
debris removal, in order to receive reimbursement. If a local government chooses to execute this plan
by approving a bid with an external debris removal contractor, then it may borrow to obtain cost
savings.
One of the elements in debris removal contract negotiation is the terms of payment. Many debris
removal contractors may provide favorable terms that allow the local government to pay for the debris
removal expenses several months after the service has been provided. These expanded payment terms
are often incorporated into the price quoted per unit of debris removed. Local governments may be
willing to accept these longer terms knowing that the federal government may pick up 75 percent of the
cost and these longer terms will allow them sufficient time to receive the federal government
reimbursement. However, if total debris costs are sizeable, the 25 percent cost share the local
government must pay may still be substantial.
If a local government has sufficient cash on hand to pay debris removal contractors on shorter terms, it
may be able to extract lower debris removal bids. If the local government does not have the cash on
hand but has a good credit rating, obtaining a line of credit from a financial institution may provide
similar cost savings. As long as the interest costs on the line of credit are less than the local cost share
savings from lower bid prices, then borrowing can make financial sense.
Conclusion
In this module, we described strategies to mitigate the gap between a local government’s financial
vulnerabilities and its financial capacity. Generating new revenue, creating dedicated funds, creating
flexibility in existing restricted funds, and borrowing were discussed as possible ways to add financial
capacity. Approaches to reducing financial vulnerability by decreasing costs associated with public and
private infrastructure were also presented.
In the final module, we will evaluate how local governments can create financial vulnerabilities for
neighboring jurisdictions. We will present strategies for measuring and addressing these additional
vulnerabilities.

26
Worksheet4.IdentifyingStrategiestoReducetheGapBetweenFinancialVulnerabilityandCapacityThis worksheet is a step‐by‐step guide for helping a local government close the gap between its financial
vulnerability and capacity.
Step1.Measure the gap between financial capacity and vulnerability using the form below.
Line 1 Financial Capacity (Module 3) $___________ +
Line 2 (Step 4) $__ ______ +
Line 3 (Step 5) $___ ____ +
Line 4 (Step 6) $_____ ___+
Line 5 (Step 7) $______ ____ =
Line 6 Total Financial Capacity $_____________
MINUS
Line 7 Financial Vulnerability (Module 2) $_______ (Line 1 ‐ Line 7) = $_________________
If financial capacity (Line 1) minus vulnerability (Line 7) >0, then stop. Local government is financially
prepared for chosen disaster event. You have completed the worksheet.
If financial capacity (Line 1) – financial vulnerability (Line 7) <0, go to Step 2.

27
Step2.Rank the following strategies from what is most preferred to least preferred in your community. The
most preferred strategy should receive a rank of 1. The least preferred should receive a rank of 4.
____A. Generating new revenue
____B. Reprioritize existing revenue/spending – Creation of dedicated fund / fund thresholds
____C. Reprioritize existing revenue/spending – Reprioritize existing revenue dedications
____D. Borrowing
Step3.If Strategy A is ranked #1, then proceed to Step 4. If Strategy B is ranked #1, go to Step 5. If Strategy C is
ranked #1, go to Step 6. If Strategy D is ranked #1, go to Step 7. If all strategies have been considered,
go to Step 8.
Step4. If your local government does not believe it can accomplish Strategy A in the next 12 months, then go
back to Step 3 and move to the step affiliated with your next most preferred strategy. If you can
accomplish this step in the next 12 months, complete the form below.
New Revenue Source: __ ___________
Anticipated Revenue Generated: $______________________
Apply anticipated revenue generated to box in Step 1.
Step5.If your local government does not believe it can accomplish Strategy B in the next 12 months, then go
back to Step 3 and move to the step affiliated with your next most preferred strategy. If you can
accomplish this step in the next 12 months, complete the form below.
New Dedicated Fund / Fund Threshold Created: ___________________
Additional Financial Capacity Identified: $__________________
Add additional financial capacity to box in Step 1.
28
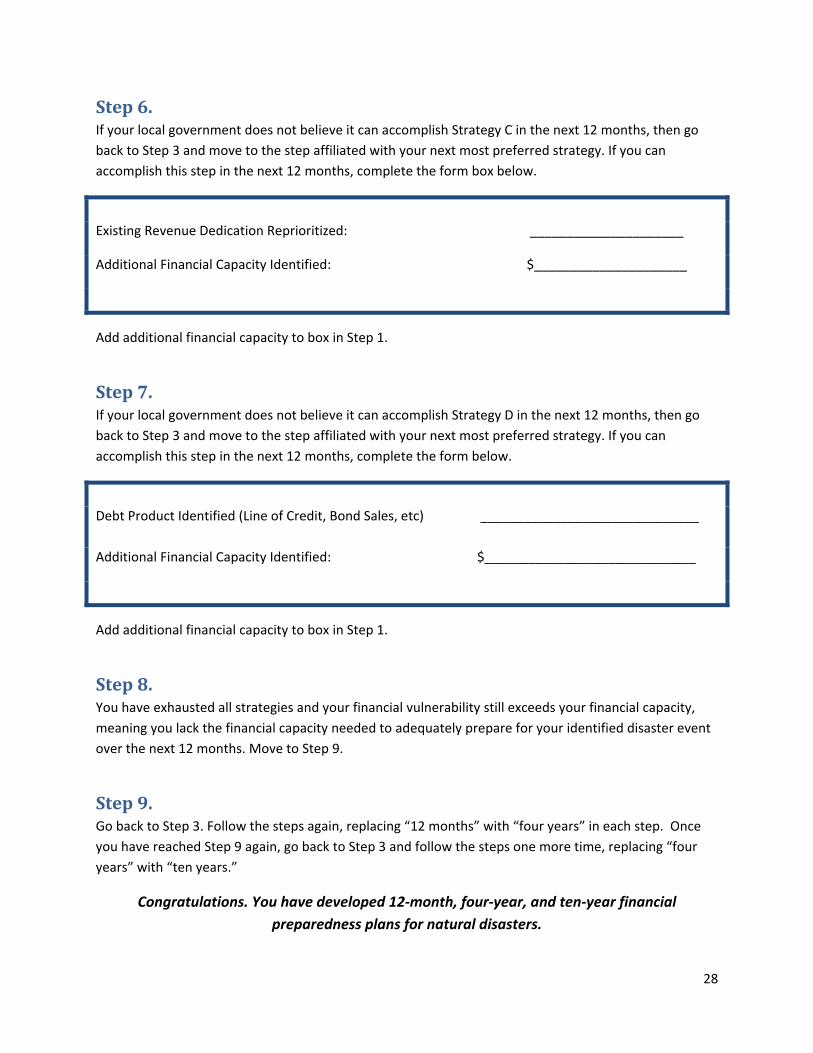
Step6.If your local government does not believe it can accomplish Strategy C in the next 12 months, then go
back to Step 3 and move to the step affiliated with your next most preferred strategy. If you can
accomplish this step in the next 12 months, complete the form box below.
Existing Revenue Dedication Reprioritized: _______ __________
Additional Financial Capacity Identified: $_____________________
Add additional financial capacity to box in Step 1.
Step7.If your local government does not believe it can accomplish Strategy D in the next 12 months, then go
back to Step 3 and move to the step affiliated with your next most preferred strategy. If you can
accomplish this step in the next 12 months, complete the form below.
Debt Product Identified (Line of Credit, Bond Sales, etc) ______________________________
Additional Financial Capacity Identified: $_____________________________
Add additional financial capacity to box in Step 1.
Step8.You have exhausted all strategies and your financial vulnerability still exceeds your financial capacity,
meaning you lack the financial capacity needed to adequately prepare for your identified disaster event
over the next 12 months. Move to Step 9.
Step9.Go back to Step 3. Follow the steps again, replacing “12 months” with “four years” in each step. Once
you have reached Step 9 again, go back to Step 3 and follow the steps one more time, replacing “four
years” with “ten years.”
Congratulations. You have developed 12‐month, four‐year, and ten‐year financial
preparedness plans for natural disasters.

29
Module5:IdentifyingRegionalFinancialVulnerabilitiesBackground
On August 29, 2012, Hurricane Isaac, a mild Category 1 hurricane, made landfall near Port Fourchon,
Louisiana, with sustained wind speeds of 80 miles per hour.11 For the residents of southeast Louisiana
who experienced Hurricanes Katrina and Gustav, Isaac seemed mild by comparison. Communities along
the shoreline made the usual preparations, including the evacuation of people and movable property,
and those farther inland prepared for the short‐term power losses usually caused by storms of that size.
As Isaac moved north, it dumped many inches of rain in southern Mississippi, filling tributaries and
causing rivers and lakes to swell. The dam at Lake Tangipahoa, a lake created from the damming of the
Tangipahoa River in southwest Mississippi, showed signs of failing. Residents living in the Tangipahoa
River floodplain in Tangipahoa Parish, Louisiana were ordered to evacuate, leaving property of 40,000
residents vulnerable in the Louisiana parish if the dam did not hold.
A full failure of the dam fortunately did not occur, preventing the worst of the flooding scenarios from
becoming a reality. However, Tangipahoa Parish spent an estimated $6 million to cover emergency
operations and expenses related to evacuation.12 A large percentage of these expenses would not have
been necessary if the dam was improved before the storm or more efforts were made earlier to reduce
the vulnerability of the residential property along the Tangipahoa River. The expenses for the
reinforcement of the dam would have been incurred by county and state taxpayers in one state (Pike
County and Mississippi), with most of the benefit being received by residents in the neighboring parish
and state (Tangipahoa Parish and Louisiana).
The Tangipahoa Parish evacuation during Hurricane Isaac reveals the all‐too‐common reality of the
financial implications of natural disasters. The resilience of a community to disasters is not entirely
dependent on the community’s own preparation for such events. In the public sector, a local
government’s resilience to natural disasters may be dependent in part on the resilience of infrastructure
owned or operated by larger units of government, such as levees owned and maintained by the federal
government or highways maintained by a state government. An individual community’s resilience to
disasters may also be impacted by the infrastructure and financial resources of neighboring
communities. Further, the financial benefits of disaster mitigation may not always accrue to those
paying the costs.
11 Berg, Ronnie. 2013. Tropical Cyclone Report: Hurricane Isaac. Accessed January 21. Online: http://www.nhc.noaa.gov/data/tcr/AL092012_Isaac.pdf 12 Legeer, Donna Leinwant. 2013. “Near‐disaster in Louisiana raises questions about evacuations.” USA Today. Accessed September 13. Online: http://usatoday30.usatoday.com/news/nation/story/2012‐09‐09/hurricane‐isaac‐louisiana‐evacuation/57702792/1

30
Many examples like this one arise after disasters. For example, a county that needs to evacuate its
population due to rising flood waters can be prevented from doing so (or has to detour a measurable
distance) due to a neighboring county’s bridge failing from poor maintenance. Or a municipality may
outsource its waste disposal services to its county government and the county government’s equipment
is destroyed by a tornado. In these and many other cases, an individual municipality’s or county’s
resilience to a disaster event is intertwined with the resilience of other communities in the larger region.
We investigate these interdependencies and ways to address them in this module.
Example: School District and County Government
In this hypothetical example, a hurricane passes through a county, washing away a bridge over a river.
The county does not have sufficient funds to replace the bridge so the river crossing is cut indefinitely.
The school district within the county had used that bridge for a school bus, which carries children on
both sides of the river to a given school. What might the school district’s financial burden be, due to the
county’s lack of financial capacity to replace the bridge?
If we assume that detouring the bridge causes an individual school bus to travel an additional 30 miles
one way for two trips a day over 180 days in a school year, an additional 1,080 miles is added to the
school bus mileage. If bus mileage costs the district $1.00 per mile traveled, then the total costs per
school year for the bridge being out of service is $10,800.
While this is a very specific example, your local government could easily create its own formulas to
identify the potential costs of its interdependencies with neighboring jurisdictions. For example, if a
municipality is a tourism destination dependent on sales tax revenue, a road closure preventing tourists
from entering the area might reduce sales tax dollars and cripple the local economy.
Categorizing Regional Interdependencies for Financial Vulnerability Reduction
When evaluating interdependencies within a region, it is helpful to categorize the structure of the
financial interdependency. First, you must define the additional jurisdiction(s) to which you are
interdependent. For public sector entities, this may include one or more combinations of a county
commission, municipality, school district, fire district, or other special purpose district. Second, you must
identify the financial vulnerability created. The financial vulnerability is usually made up of the costs
associated with a physical vulnerability from a disaster event. Physical vulnerabilities that could cause
regional financial impacts may be infrastructure‐related such as roads, bridges, and utilities or
communications‐related such as incompatible communication infrastructure between local
governments.
Next, you need to identify the jurisdiction responsible for mitigating the physical vulnerability that
creates the financial vulnerability. What are the costs to the jurisdiction responsible for reducing the
physical vulnerability?
When these questions are answered, several potential solutions arise. When local government A and
local government B are financially vulnerable, and the cost to local government A of mitigating the

31
physical vulnerability is less than local government A’s financial vulnerability, then local government B
may want to petition local government A to make physical mitigation investments.
When local government A and local government B are financially vulnerable, but the cost of physical
mitigation by local government A is greater than its financial vulnerability, then local government B may
consider helping finance mitigation costs through direct payments or loans to local government A to
make the physical investments required before the next natural disaster occurs.
One way of doing this is through revised contractual arrangements. For example, if a county purchases
water for its residents from the municipality’s water system, the county may re‐negotiate a contract
that requires it to have emergency backup generators and fuel so water service can be maintained for
county residents for a sustained period of time while electricity is off‐line. The county can help to pay for
this service through a revised payment rate in the contract for water.
In other situations, an existing contractual arrangement from which physical vulnerabilities can be
mitigated may not exist. For example, if the financial losses from a damaged county‐owned road are
greater for a municipal government than the county government, what can the municipality do?
In some instances, the municipality can reduce its financial vulnerability by working with the county over
time to lessen its dependence on the single highway. A second highway could be constructed. If this is
not an option, the municipality may consider working with higher levels of government to address its
vulnerability. If the state has a measurable financial stake in the economic consequences of the
vulnerability, another solution may be for the state to take control of the road including maintenance
and disaster responsibility. The role of ownership can be important in mitigating financial vulnerability. If
a municipal government is more financially vulnerable to the temporary closure of a county‐owned
physical asset than the county, then it may be in the interest of the municipality to negotiate with the
county to purchase the asset. While this may cost much more than working out a contractual
arrangement to minimize the vulnerability of the physical asset, it may be worth it if the financial
vulnerability to the political jurisdiction that does not have decision making authority over the asset is
high.
In some cases, ownership may not be the optimal approach for mitigating financial vulnerability and
other tools from larger political jurisdictions may be preferable. Building codes at the state level may
reduce financial interdependencies between counties and county zoning rules may minimize financial
vulnerabilities between municipalities. For example, statewide building codes may increase the physical
resilience of residential structures over time, reducing the potential for damage and debris and the
resulting delays in evacuated residents returning to their homes. Without uniform statewide codes, a
county could choose not to adopt resilient building codes, creating future debris challenges that may
impact transportation arteries used by neighboring counties. When regions cross state boundaries, the
role of the federal government in mitigating these financial vulnerabilities should also be considered.
32
Conclusion
Physical and financial interdependencies exist among political jurisdictions in a region. While many of
these interdependencies, and the resulting financial vulnerabilities, can be identified before a natural
disaster, others are often not discovered until after they have occurred. Increased collaboration
between jurisdictions on physical mitigation may address those physical vulnerabilities, reducing
financial burdens for multiple communities within a region. Jurisdictions should think creatively and use
contractual arrangements, ownership structures, and larger jurisdiction policies and regulations as tools
to mitigate these intra‐regional financial vulnerabilities. Regional planning and economic development
organizations are also key partners that can help to understand risks that cross jurisdictional lines,
identify mitigation measures with mutually beneficial outcomes, and facilitate collaboration between
local governments.

33
Worksheet5.IdentifyingRegionalFinancialVulnerabilitiesThis worksheet is meant to help you identify joint vulnerabilities between your community and others
and think about general strategies that might help to lower the overall region’s financial vulnerability.
This example assumes two local government entities and their interdependent financial vulnerability.
One can easily generalize this approach to three or more local governments.
Step1.Identify political jurisdictions impacted financially by a joint physical vulnerability related to the disaster
you identified for Modules 2‐4, or in Step 3 of Module 1.
Local Government #1 ______ _____________
Local Government #2 _ ___________________
Step2.Identify what level of financial vulnerability each local government would incur by the physical
vulnerability for the given disaster identified in Step 1.
Local Government #1 $______ ___________
Local Government #2 $_ ___________________
Step3.Identify which local government (if either) has control over the physical asset that is creating the
potential financial vulnerability. (Place an X next to the local government)
Local Government #1
Local Government #2 _
Other (List) _ _______________

34
Step4.Rank which of the following strategies best mitigates the physical vulnerability that creates the joint
financial vulnerability:
____ Creation of new or modification of existing contractual arrangements to mitigate joint financial
vulnerabilities.
____ Evaluation of alternative ownership arrangements of the physical assets between local
governments.
____ Use higher level governmental units to create/modify laws, codes, rules and other regulations to
generate local government behavior that mitigates joint financial vulnerabilities between
jurisdictions.
Congratulations. You’ve taken your first steps towards a strategy of mitigating
financial vulnerabilities between jurisdictions in your region.
35
ImageCredits:
Module1:Freedigitalphotos.net: Palms in the Storm, by Vlado, image id 100156365
Freedigitalphotos.net: Snowfall Stock Photo, by Arvind Balaraman, image ID: 10025808
Module2:Freedigitalphotos.net: Cracked Asphalt Road Stock Photo, By Naypong, image ID: 100152569
Freedigitalphotos.net: Driving In Flood Stock Photo, by jiggoja, image ID: 10066768
Module3:Freedigitalphotos.net: Bookkeeping With Calculator Stock Photo,by adamr, image ID: 10088953
Module4:Freedigitalphotos.net: Percentage Dice Stock Image, by jscreationzs, image ID: 10019807

36
Appendix:ModuleWorksheets

37
Worksheet1.IdentifyingNaturalDisasterswithPotentialFinancialImplicationsforYourCommunity
Step1.Rank the top three natural disasters in your individual community /region based on cost to the
community to recover from the disaster, from most to least costly.
1.
2.
3.
Step2.Rank the top three natural disasters in your individual community /region based on likelihood of
occurrence from most frequent to least frequent.
1.
2.
3.
38
Step3.Rank the top three natural disasters that could impact neighboring communities and create a financial
burden for your community. For examples of how this might occur, see Module 5.
1.
2.
3.

39
Worksheet2.LocalGovernmentFinancialVulnerabilitytoNaturalDisasters
Step1.Is the frequency of your disaster event High or Low? If Low, go to Step 2. If High, go to Step 3.
Step2.Contact a regional university, nonprofit organization, or state or federal partner about modeling capacity
in your area to simulate the financial costs of a disaster event on your local government geography.
Step3.Has your local government experienced a disaster event of this type in recent history? If Yes, go to Step
4. If No, go to Step 5.
40
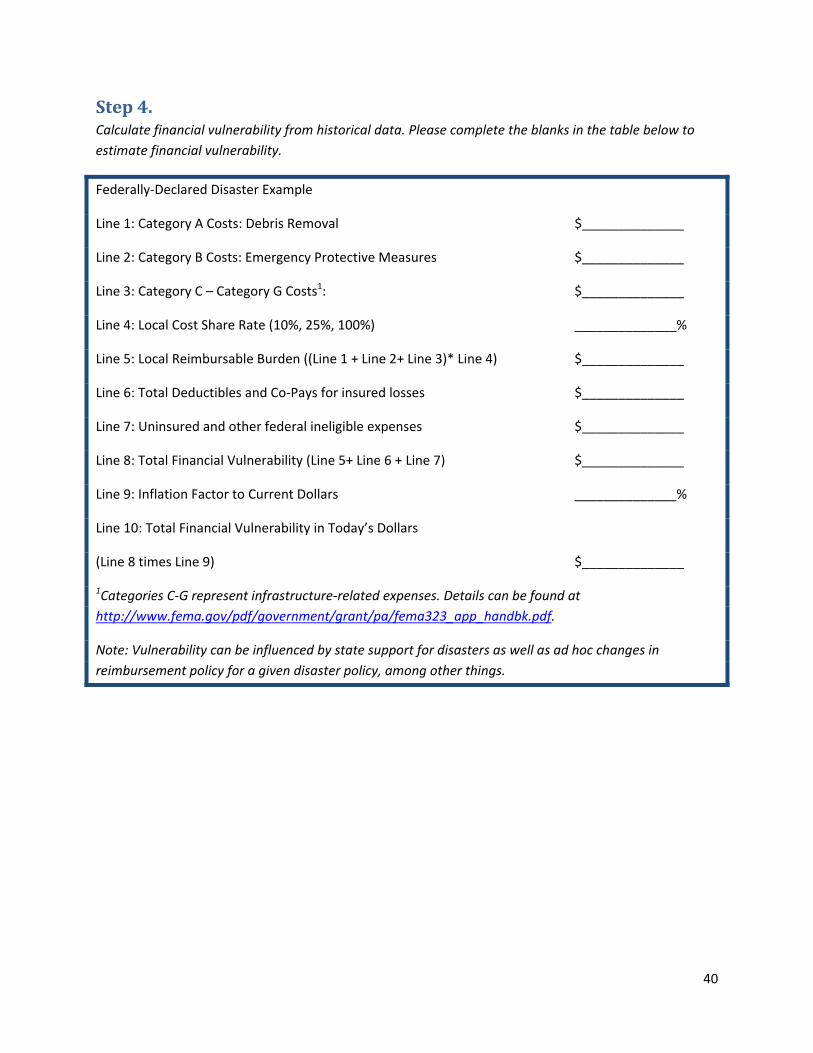
Step4.Calculate financial vulnerability from historical data. Please complete the blanks in the table below to
estimate financial vulnerability.
Federally‐Declared Disaster Example
Line 1: Category A Costs: Debris Removal $______________
Line 2: Category B Costs: Emergency Protective Measures $______________
Line 3: Category C – Category G Costs1: $______________
Line 4: Local Cost Share Rate (10%, 25%, 100%) ______________%
Line 5: Local Reimbursable Burden ((Line 1 + Line 2+ Line 3)* Line 4) $______________
Line 6: Total Deductibles and Co‐Pays for insured losses $______________
Line 7: Uninsured and other federal ineligible expenses $______________
Line 8: Total Financial Vulnerability (Line 5+ Line 6 + Line 7) $______________
Line 9: Inflation Factor to Current Dollars ______________%
Line 10: Total Financial Vulnerability in Today’s Dollars
(Line 8 times Line 9) $______________
1Categories C‐G represent infrastructure‐related expenses. Details can be found at
http://www.fema.gov/pdf/government/grant/pa/fema323_app_handbk.pdf.
Note: Vulnerability can be influenced by state support for disasters as well as ad hoc changes in
reimbursement policy for a given disaster policy, among other things.

41
Step5.Identify a peer local government that has experienced the disaster event from which you want to
prepare financially and follow Step 4 with that jurisdiction. Once finished, complete blanks in the box
below.
Peer Local Government Example
Line 1: Line 8 from Step 4 of Peer Government $_______________
Line 2: Assessed Valuation of Peer Government Jurisdiction $_______________
Line 3: Peer Costs per dollar of Assessed Valuation (Line 1 divided by Line 2) $_______________
Line 4. Local Government’s Current Assessed Valuation $_______________
Line 5: Local Government’s Financial Vulnerability (Line 3 times Line 4) $_______________
Line 6: Inflation Factor to Today’s Dollars _______________%
Line 7: Total Financial Vulnerability in Today’s Dollars
(Line 5 times Line 6) $_______________
Note: One can also calculate local government burden from peer government by using population as an
alternative to assessed value. If population is preferred, replace peer government population in Line 2
and local government population in Line 4 and recalculate.
Step6.If your local government wants to prepare for more than one natural disaster event (e.g. multiple
disaster types or multiple disaster events of the same type), go back to Step 1. Sum total financial
vulnerability from each disaster event calculated to identify total financial vulnerability.
42
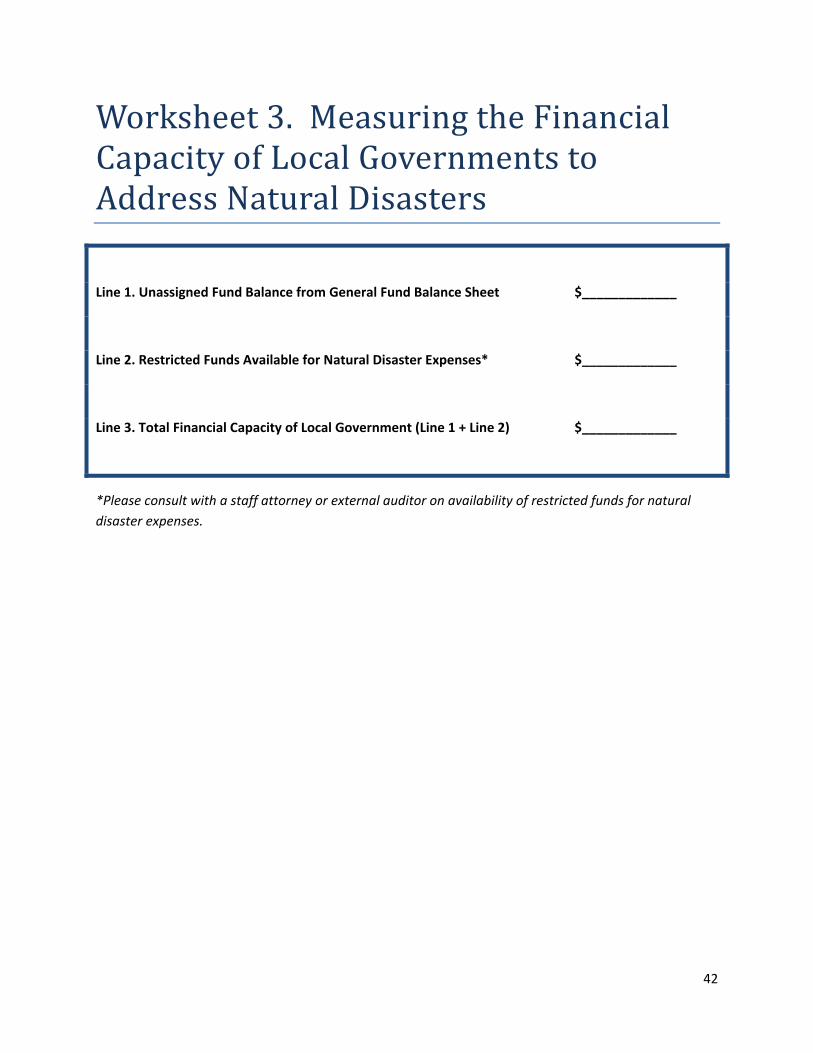
Worksheet3.MeasuringtheFinancialCapacityofLocalGovernmentstoAddressNaturalDisasters
Line 1. Unassigned Fund Balance from General Fund Balance Sheet $_____________
Line 2. Restricted Funds Available for Natural Disaster Expenses* $_____________
Line 3. Total Financial Capacity of Local Government (Line 1 + Line 2) $_____________
*Please consult with a staff attorney or external auditor on availability of restricted funds for natural
disaster expenses.

43
Worksheet4.IdentifyingStrategiestoReducetheGapBetweenFinancialVulnerabilityandCapacityThis worksheet is a step‐by‐step guide for helping a local government close the gap between its financial
vulnerability and capacity.
Step1.Measure the gap between financial capacity and vulnerability using the form below.
Line 1 Financial Capacity (Module 3) $___________ +
Line 2 (Step 4) $__ ______ +
Line 3 (Step 5) $___ ____ +
Line 4 (Step 6) $_____ ___+
Line 5 (Step 7) $______ ____ =
Line 6 Total Financial Capacity $_____________
MINUS
Line 7 Financial Vulnerability (Module 2) $_______ (Line 1 ‐ Line 7) = $_________________
If financial capacity (Line 1) minus vulnerability (Line 7) >0, then stop. Local government is financially
prepared for chosen disaster event. You have completed the worksheet.
If financial capacity (Line 1) – financial vulnerability (Line 7) <0, go to Step 2.
44
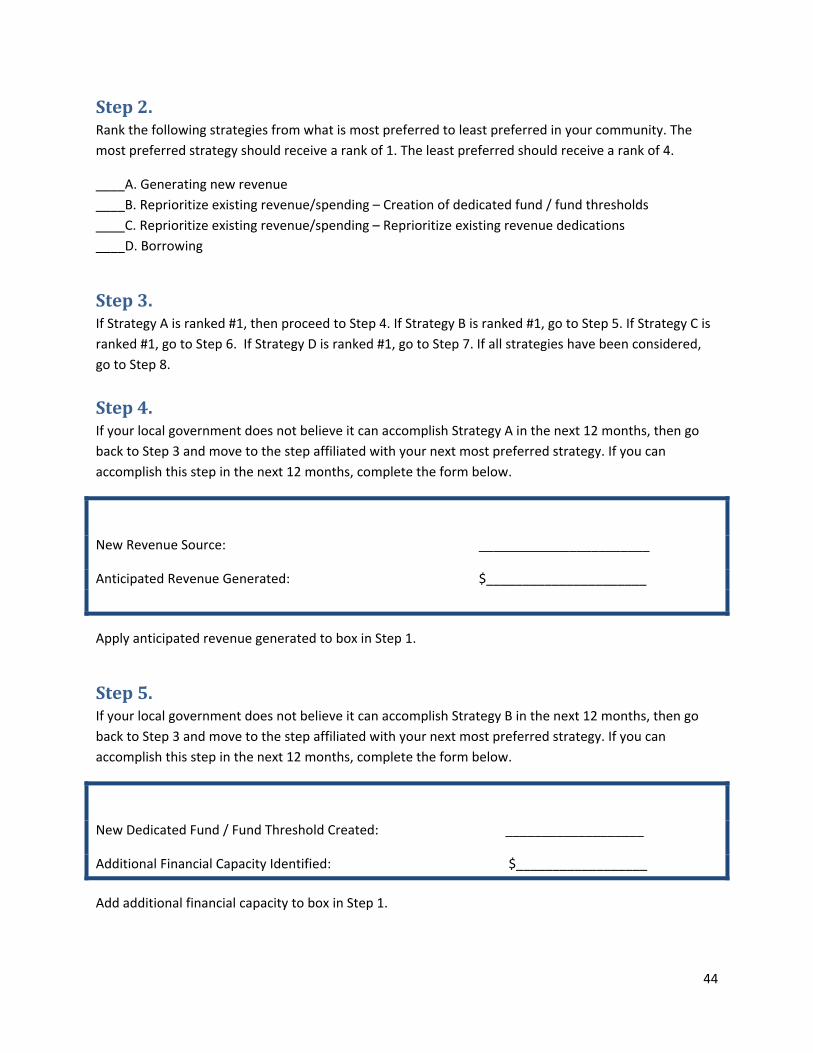
Step2.Rank the following strategies from what is most preferred to least preferred in your community. The
most preferred strategy should receive a rank of 1. The least preferred should receive a rank of 4.
____A. Generating new revenue
____B. Reprioritize existing revenue/spending – Creation of dedicated fund / fund thresholds
____C. Reprioritize existing revenue/spending – Reprioritize existing revenue dedications
____D. Borrowing
Step3.If Strategy A is ranked #1, then proceed to Step 4. If Strategy B is ranked #1, go to Step 5. If Strategy C is
ranked #1, go to Step 6. If Strategy D is ranked #1, go to Step 7. If all strategies have been considered,
go to Step 8.
Step4. If your local government does not believe it can accomplish Strategy A in the next 12 months, then go
back to Step 3 and move to the step affiliated with your next most preferred strategy. If you can
accomplish this step in the next 12 months, complete the form below.
New Revenue Source: __ ___________
Anticipated Revenue Generated: $______________________
Apply anticipated revenue generated to box in Step 1.
Step5.If your local government does not believe it can accomplish Strategy B in the next 12 months, then go
back to Step 3 and move to the step affiliated with your next most preferred strategy. If you can
accomplish this step in the next 12 months, complete the form below.
New Dedicated Fund / Fund Threshold Created: ___________________
Additional Financial Capacity Identified: $__________________
Add additional financial capacity to box in Step 1.

45
Step6.If your local government does not believe it can accomplish Strategy C in the next 12 months, then go
back to Step 3 and move to the step affiliated with your next most preferred strategy. If you can
accomplish this step in the next 12 months, complete the form box below.
Existing Revenue Dedication Reprioritized: _______ __________
Additional Financial Capacity Identified: $_____________________
Add additional financial capacity to box in Step 1.
Step7.If your local government does not believe it can accomplish Strategy D in the next 12 months, then go
back to Step 3 and move to the step affiliated with your next most preferred strategy. If you can
accomplish this step in the next 12 months, complete the form below.
Debt Product Identified (Line of Credit, Bond Sales, etc) ______________________________
Additional Financial Capacity Identified: $_____________________________
Add additional financial capacity to box in Step 1.
Step8.You have exhausted all strategies and your financial vulnerability still exceeds your financial capacity,
meaning you lack the financial capacity needed to adequately prepare for your identified disaster event
over the next 12 months. Move to Step 9.
Step9.Go back to Step 3. Follow the steps again, replacing “12 months” with “four years” in each step. Once
you have reached Step 9 again, go back to Step 3 and follow the steps one more time, replacing “four
years” with “ten years.”
Congratulations. You have developed 12‐month, four‐year, and ten‐year financial
preparedness plans for natural disasters.

46
Worksheet5.IdentifyingRegionalFinancialVulnerabilitiesThis worksheet is meant to help you identify joint vulnerabilities between your community and others
and think about general strategies that might help to lower the overall region’s financial vulnerability.
This example assumes two local government entities and their interdependent financial vulnerability.
One can easily generalize this approach to three or more local governments.
Step1.Identify political jurisdictions impacted financially by a joint physical vulnerability related to the disaster
you identified for Modules 2‐4, or in Step 3 of Module 1.
Local Government #1 ______ _____________
Local Government #2 _ ___________________
Step2.Identify what level of financial vulnerability each local government would incur by the physical
vulnerability for the given disaster identified in Step 1.
Local Government #1 $______ ___________
Local Government #2 $_ ___________________
Step3.Identify which local government (if either) has control over the physical asset that is creating the
potential financial vulnerability. (Place an X next to the local government)
Local Government #1
Local Government #2 _
Other (List) _ _______________

47
Step4.Rank which of the following strategies best mitigates the physical vulnerability that creates the joint
financial vulnerability:
____ Creation of new or modification of existing contractual arrangements to mitigate joint financial
vulnerabilities.
____ Evaluation of alternative ownership arrangements of the physical assets between local
governments.
____ Use higher level governmental units to create/modify laws, codes, rules and other regulations to
generate local government behavior that mitigates joint financial vulnerabilities between
jurisdictions.
Congratulations. You’ve taken your first steps towards a strategy of mitigating
financial vulnerabilities between jurisdictions in your region.