Embed Size (px)
Citation preview
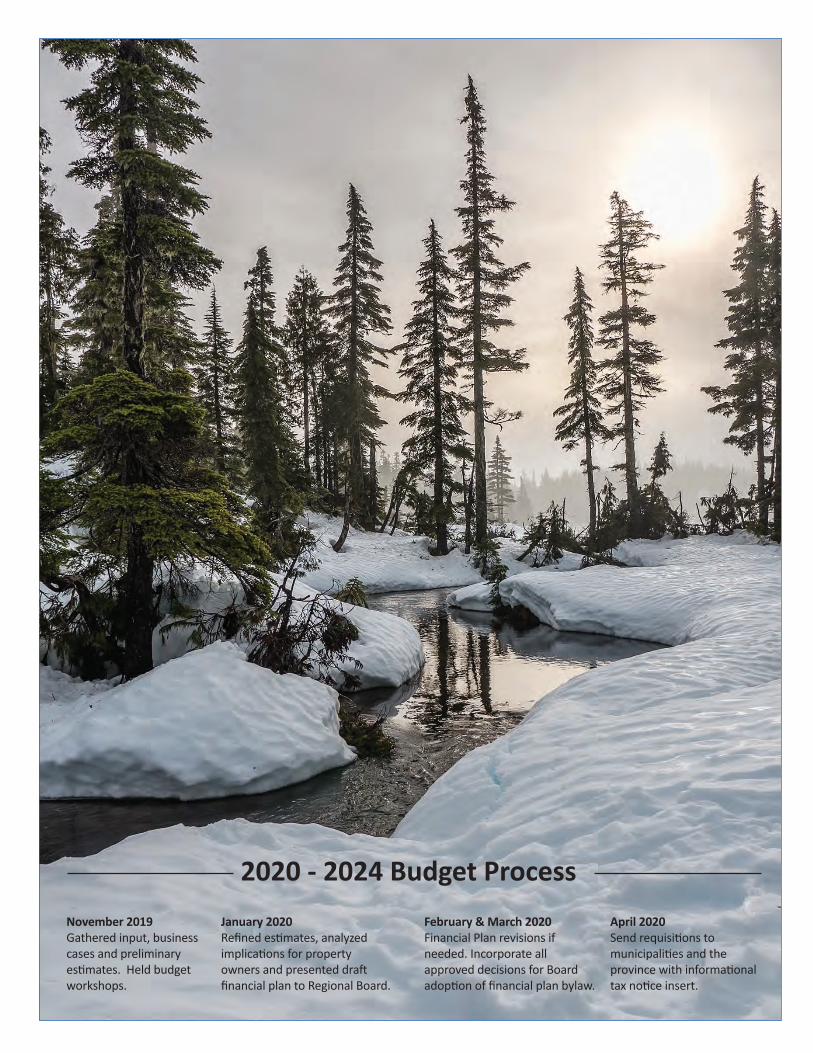
Gathered input, business cases and preliminary
workshops.
Financial Plan revisions if needed. Incorporate all approved decisions for Board
1
3
9
10
1329516585111135167201
219
243
249
Table of Contents
er ew
Assessments
Budget Details Member Municipalities Corporate Services Regional Services Electoral Area Services Electoral Area A Services Electoral Area B Services Electoral Area C Services Electoral Area D Services Strathcona Gar
Appendix A - Detailed General Ledger


On behalf of the Strathcona Regional District, I am pleased to present the 2020-2024 Financial Plan. Good governance requires strong processes and
for good governance and service delivery to the community by providing a framework to manage
Financial Plan will provide the Strathcona Regional
Regional District services. It includes municipal
comparisons for each service.
began in November 2019 with a review of
workshops, strategic planning sessions, and
the Board’s vision of the Strathcona Regional District.
Dave Leitch
following pages which will form the basis of a new budget bylaw, to be approved and adopted by the Board prior to the legislated due date of March 31, 2020.
The 2020-2024 Financial Plan includes funding for
The budget is developed based upon the strategic
required to sustain the delivery of Regional District services.
1
Pho
Pho
Pho
Pho
Pho
Phooo
Phoo
PhohoPho
PPPto
to
to
to
to
tootooo
Cre
Cre
Cre
Cre
Cre
Cre
Cre
Cre
Cre
Cree
CrerrrrCCCC
dit
dit
dit
dit
dit
ditt
dit
ditt
diddddd: D: D D: D: D: D: DDDDDDDDDD:
est
eststststststtttttsttstssssesesssess
naina
ina
ina
ina
inanaaina
inaan
tiotiotiotiotiotiooooiooioittn
Cn
Cn
Cn
Cn
Cn
Cn
Cn
CCCn
Cn
Cn
Cn
Cn n
amp
amp
amp
amp
amp
amp
amp
amp
amaabe
lbe
lbe
lbe
lbe
lbe
lbebeebeebebee
l Rl Rl Rl Rl RRl Rl Rl RRl RlRiv
eiv
eiv
eiv
eiv
eiv
eeiv
eiv
eiv
eiv
eiv
eiv
eiv
eeeveive
ivevvvviii
r /r /r /r /r /r /r ///r /r ///rrrBlBlBlBlBlBlBlBlBlBlBB
uet
uet
uet
uet
uet
uet
uet
ueeeuuuure
ere
ere
ere
ere
ere
eerrPhPhPhPhPhPhhPhP
oto
oto
oto
otoo
oto
oto
ototoot
graaaaaaa
gra
graa
gra
grggggghyyhyhyph
yph
yyph
yyyh
22
2020‐2024 APPROVED FINANCIAL PLAN
Overview
FINANCIAL PLAN
2020 – 2024
Rebecca Spit, Quadra Island
3
History and Purpose
2020‐2024 APPROVED FINANCIAL PLAN
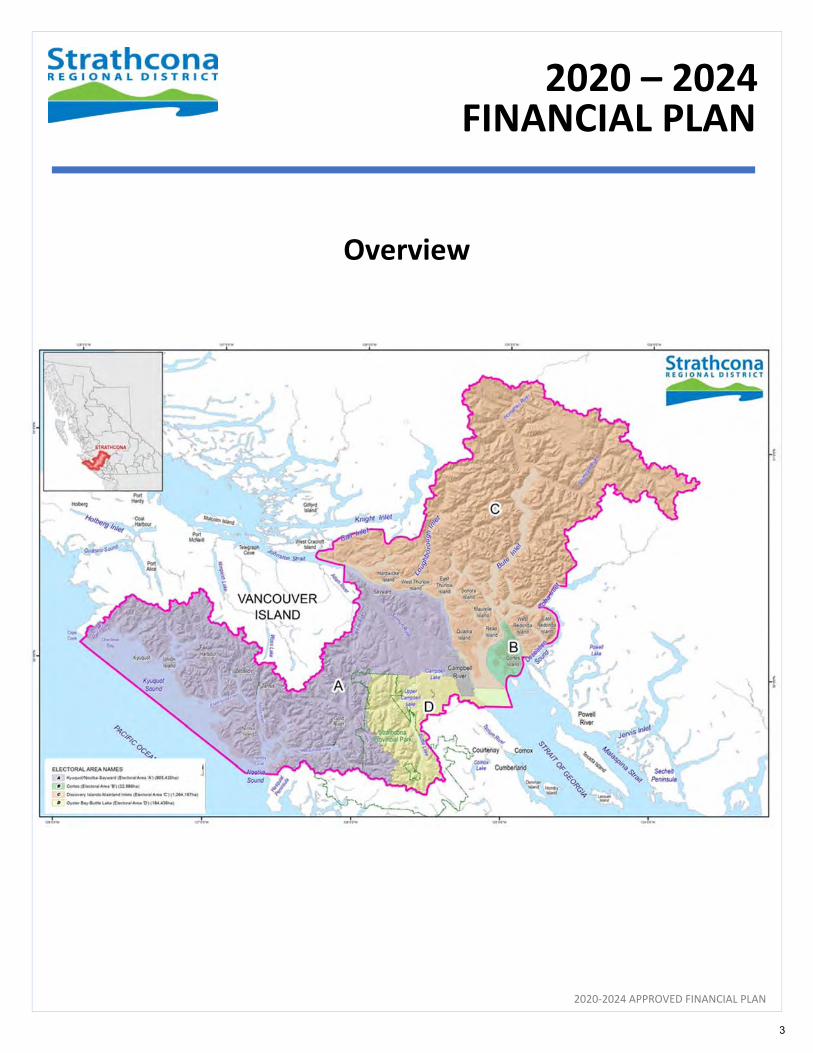
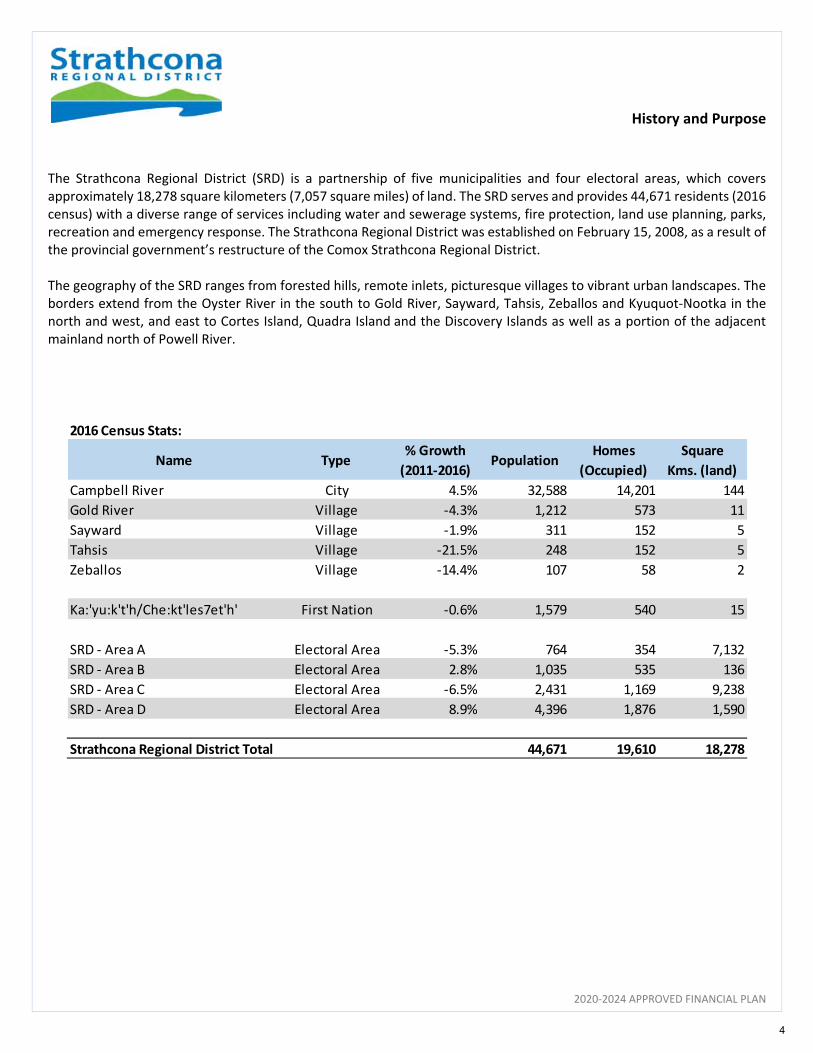
The Strathcona Regional District (SRD) is a partnership of five municipalities and four electoral areas, which covers approximately 18,278 square kilometers (7,057 square miles) of land. The SRD serves and provides 44,671 residents (2016 census) with a diverse range of services including water and sewerage systems, fire protection, land use planning, parks, recreation and emergency response. The Strathcona Regional District was established on February 15, 2008, as a result of the provincial government’s restructure of the Comox Strathcona Regional District. The geography of the SRD ranges from forested hills, remote inlets, picturesque villages to vibrant urban landscapes. The borders extend from the Oyster River in the south to Gold River, Sayward, Tahsis, Zeballos and Kyuquot‐Nootka in the north and west, and east to Cortes Island, Quadra Island and the Discovery Islands as well as a portion of the adjacent mainland north of Powell River.
Name Type% Growth
(2011‐2016)Population
Homes
(Occupied)
Square
Kms. (land)
Campbell River City 4.5% 32,588 14,201 144
Gold River Village ‐4.3% 1,212 573 11
Sayward Village ‐1.9% 311 152 5
Tahsis Village ‐21.5% 248 152 5
Zeballos Village ‐14.4% 107 58 2
Ka:'yu:k't'h/Che:kt'les7et'h' First Nation ‐0.6% 1,579 540 15
SRD ‐ Area A Electoral Area ‐5.3% 764 354 7,132
SRD ‐ Area B Electoral Area 2.8% 1,035 535 136
SRD ‐ Area C Electoral Area ‐6.5% 2,431 1,169 9,238
SRD ‐ Area D Electoral Area 8.9% 4,396 1,876 1,590
Strathcona Regional District Total 44,671 19,610 18,278
2016 Census Stats:
4
Mission, Core Values & Vision
2020‐2024 APPROVED FINANCIAL PLAN
Mission
To provide the citizens with a healthy environment and social well being that leads to a vibrant quality of life through
responsible economic development and effective delivery of services.
Core Values
In fulfilling our Mission, we are guided at all levels by the Core Values of Teamwork, Respect, Integrity,
Effectiveness and Accountability as defined by these principles:
We work as a committed team in a spirit of collaboration and community.
We are caring and respectful in all our interactions and relationships.
We are open and honest. We adhere to the highest standards of ethical conduct.
We deliver effective public service through professionalism and creativity.
We are accountable to our constituents and to the region as a whole.
Vision
People, fish and wildlife thrive in a healthy environment.
Residents and businesses are supported by a diverse and resilient economy.
High quality health and social care is available regionally.
The region is a world‐class tourism destination, leveraging our unique ecological, historical and cultural assets.
Affordable quality services are delivered in a fiscally responsible way.
The District is a leader in regional governance, with diverse jurisdictions including First Nations, working together
cohesively and collaboratively.
5

2020 Elected Officials and Appointed Officers
2020‐2024 APPROVED FINANCIAL PLAN
Elected Officials
City of Campbell River Andy Adams City of Campbell River Charlie Cornfield City of Campbell River Claire Moglove City of Campbell River Michele Babchuk (Chair) City of Campbell River Ron Kerr Village of Gold River Brad Unger (Vice Chair) Village of Sayward John MacDonald Village of Tahsis Martin Davis Village of Zeballos Julie Colborne Electoral Area A – Kyuquot‐Nootka/Sayward Gerald Whalley Electoral Area B – Cortes Island Noba Anderson Electoral Area C – Discovery Islands‐Mainland Inlets Jim Abram Electoral Area D – Oyster Bay‐Buttle Lake Brenda Leigh SRD Associate Member
Ka:’yu:’k’t’h’/ Che:k’tles7et’h (Kyuquot/Checlesaht) First Nations Kevin Jules
Appointed Officers & Senior Management
Chief Administrative Officer David Leitch Chief Financial Officer Mike Harmston Senior Manager, Corporate Services Tom Yates Senior Manager, Community Services Aniko Nelson Senior Manager, Strathcona Gardens Koreen Gurak Senior Manager, Human Resources Laurie Gage
6

Board Strategic Priorities
2020‐2024 APPROVED FINANCIAL PLAN
Connectivity: to develop, advocate and promote the extension of cellular and broadband connectivity across the Regional District. This will be achieved by advancing the Connected Coast Project to provide new backbone broadband infrastructure, supporting the development of last mile solutions and working with partners to facilitate digital uptake and maximize the end‐use benefits of improved internet and cellular connectivity. First Nations Relationship Building: to build strong relationships with regional First Nation communities through a graduated approach that includes internal development and education on First Nations governance, protocols and culture; increased outreach and engagement informally and formally to build better government‐to‐government relations; and identifying a specific understanding of shared opportunities and challenges where First Nations and the Regional District may work together. Community Health Network: to improve the community wellness of the region by addressing the social determinants of health through collaboration among a variety of partners that includes public, private and non‐profit organizations. BC Ferries: to advocate on behalf of Regional District communities about BC ferries activities, fares and services. Senior Government Advocacy: to advance, on political and administrative levels, issues that require advocacy to lessen conflict, improve transparency and increase operational efficiency. Flooding/Sea Level Rise: to maintain awareness of sea level rise as a concern and to continue to advocate to senior levels of government in support of local solutions to identified risks. Asset Management: to continue advancing the asset management strategy for implementing and improving regional district asset management practices. Records Management: to determine, and then implement a cost effective and viable method to implement and operate a corporate records management system.
7
Pho
Pho
Pho
Phoo
Pho
Pho
Pho
Pho
Pho
Pho
Pho
Phoo
PhPto
tooooooooooo
Cre
Cre
Cre
Cre
CrereCre
CrereCre
CrCdi
tdi
tdi
tdi
tdi
ttdi
tdi
tttdi
tdi
tttdi
t: D: D: D: D: DDDDDDDD: DD: DD
est
est
est
est
estsesein
ain
ain
ain
ain
ain
anaaanananaananainan
tiotiotiotiotiotiotiotiotioooiotiotion
Cn
Cn
Cn
Cn
Cn
Cn
CCam
pam
pam
pam
pam
pam
pam
pam
ppamamamamamamamma
bel
bel
bel
belellbel
bel
bel
bel
beeeeeeebl RRl Rl Rl Rl RRRl Rl Rl RRRRR
iveveive
ive
ive
iveveveive
ive
ive
ive
ivee
iveee
iveeveev
/r //r /r/r /r /r /r /r /r /r /r /r /r //r ///r /r /r rJeJeJeJeJeJeJeJeeJeJeJeJeJeJeJeJeJeJeJeeJJ
n D
n D
n D
n D
n D Dn D
n DD
n DD
n D
n D
n D
n D
n DD
nD
nnyk
syk
syk
syk
syk
syk
syyk
syk
syk
syk
syk
syk
syk
skkykkykytr
atr
atr
atr
atr
atr
atr
atr
aaaatr
atr
aPhPhPhPhPhPhPhhPh
oto
oto
oto
oto
ogr
agr
agr
agggr
agrgrg
phy
phy
phyyy
phy
phyhyhyypyhyphy
phy
phy
phy
phy
phy
pp
88
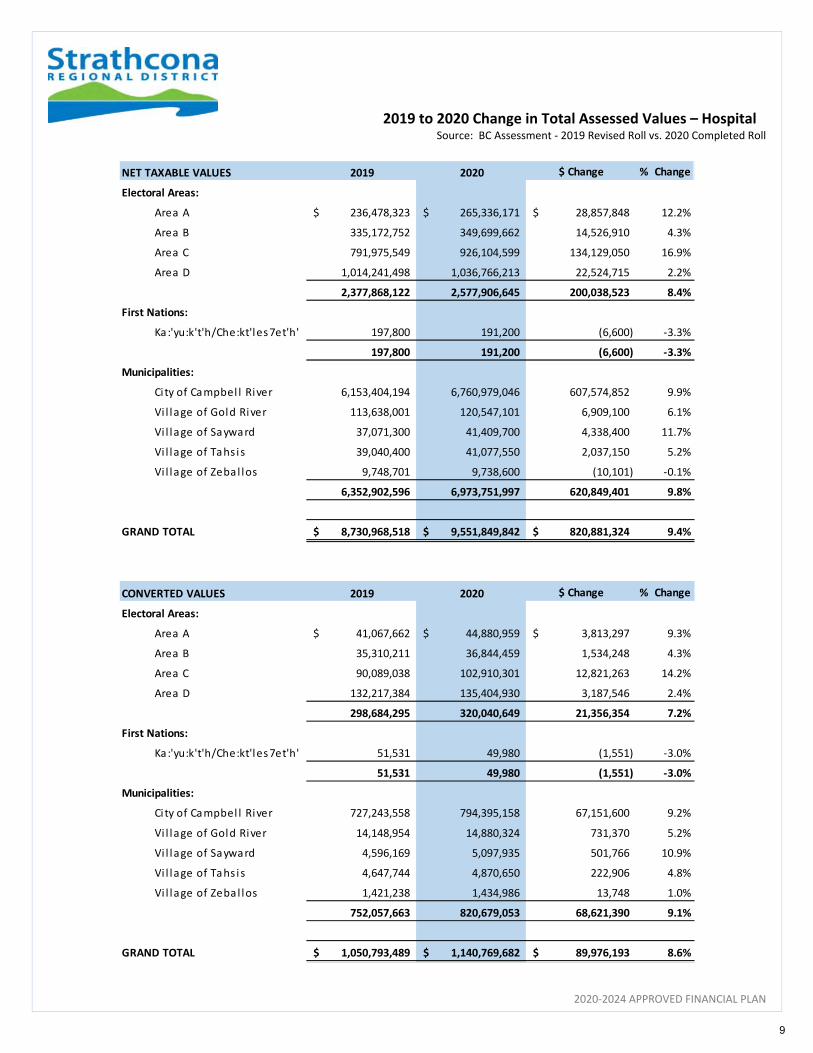
2019 to 2020 Change in Total Assessed Values – Hospital Source: BC Assessment ‐ 2019 Revised Roll vs. 2020 Completed Roll
2020‐2024 APPROVED FINANCIAL PLAN
NET TAXABLE VALUES 2019 2020 $ Change % Change
Electoral Areas:
Area A 236,478,323$ 265,336,171$ 28,857,848$ 12.2%
Area B 335,172,752 349,699,662 14,526,910 4.3%
Area C 791,975,549 926,104,599 134,129,050 16.9%
Area D 1,014,241,498 1,036,766,213 22,524,715 2.2%
2,377,868,122 2,577,906,645 200,038,523 8.4%
First Nations:
Ka:'yu:k't'h/Che:kt'les7et'h' 197,800 191,200 (6,600) ‐3.3%
197,800 191,200 (6,600) ‐3.3%
Municipalities:
City of Campbel l River 6,153,404,194 6,760,979,046 607,574,852 9.9%
Vi l lage of Gold River 113,638,001 120,547,101 6,909,100 6.1%
Vi l lage of Sayward 37,071,300 41,409,700 4,338,400 11.7%
Vi l lage of Tahs i s 39,040,400 41,077,550 2,037,150 5.2%
Vi l lage of Zeba l los 9,748,701 9,738,600 (10,101) ‐0.1%
6,352,902,596 6,973,751,997 620,849,401 9.8%
GRAND TOTAL 8,730,968,518$ 9,551,849,842$ 820,881,324$ 9.4%
CONVERTED VALUES 2019 2020 $ Change % Change
Electoral Areas:
Area A 41,067,662$ 44,880,959$ 3,813,297$ 9.3%
Area B 35,310,211 36,844,459 1,534,248 4.3%
Area C 90,089,038 102,910,301 12,821,263 14.2%
Area D 132,217,384 135,404,930 3,187,546 2.4%
298,684,295 320,040,649 21,356,354 7.2%
First Nations:
Ka:'yu:k't'h/Che:kt'les7et'h' 51,531 49,980 (1,551) ‐3.0%
51,531 49,980 (1,551) ‐3.0%
Municipalities:
City of Campbel l River 727,243,558 794,395,158 67,151,600 9.2%
Vi l lage of Gold River 14,148,954 14,880,324 731,370 5.2%
Vi l lage of Sayward 4,596,169 5,097,935 501,766 10.9%
Vi l lage of Tahs i s 4,647,744 4,870,650 222,906 4.8%
Vi l lage of Zeba l los 1,421,238 1,434,986 13,748 1.0%
752,057,663 820,679,053 68,621,390 9.1%
GRAND TOTAL 1,050,793,489$ 1,140,769,682$ 89,976,193$ 8.6%
9

Summary of Service Participants
2020‐2024 APPROVED FINANCIAL PLAN
FunctionCampbell
River
Gold
RiverSayward Tahsis Zeballos
Area
A
Area
B
Area
C
Area
D2019 2020
100 ‐ Member Municipality Administration X X X X X 299,595$ 376,933$
110 ‐ Administration ‐ General Government X X X X X X X X X 918,896 1,002,551
120 ‐ Grant in Aid Area A X ‐ 452
123 ‐ Grant In Aid Area D X 64,462 62,030
126 ‐ Grant In Aid Area B X 25,666 25,709
127 ‐ Grant In Aid Area C X 19,893 24,815
130 ‐ Electoral Area Administration X X X X 475,260 676,835
149 ‐ Regional Broadband X X X X X X X X X 312,839 312,839
150 ‐ Feasibil ity Studies ‐ Regional X X X X X X X X X 14,364 ‐
151 ‐ Feasibil ity Studies ‐ Electoral Area A X ‐ 874
154 ‐ Feasibil ity Studies ‐ Electoral Area D X ‐ ‐
157 ‐ Feasibil ity Studies ‐ Electoral Area B X ‐ ‐
158 ‐ Feasibil ity Studies ‐ Electoral Area C X ‐ 1,305
210 ‐ Campbell River Fire Protection O 443,815 475,000
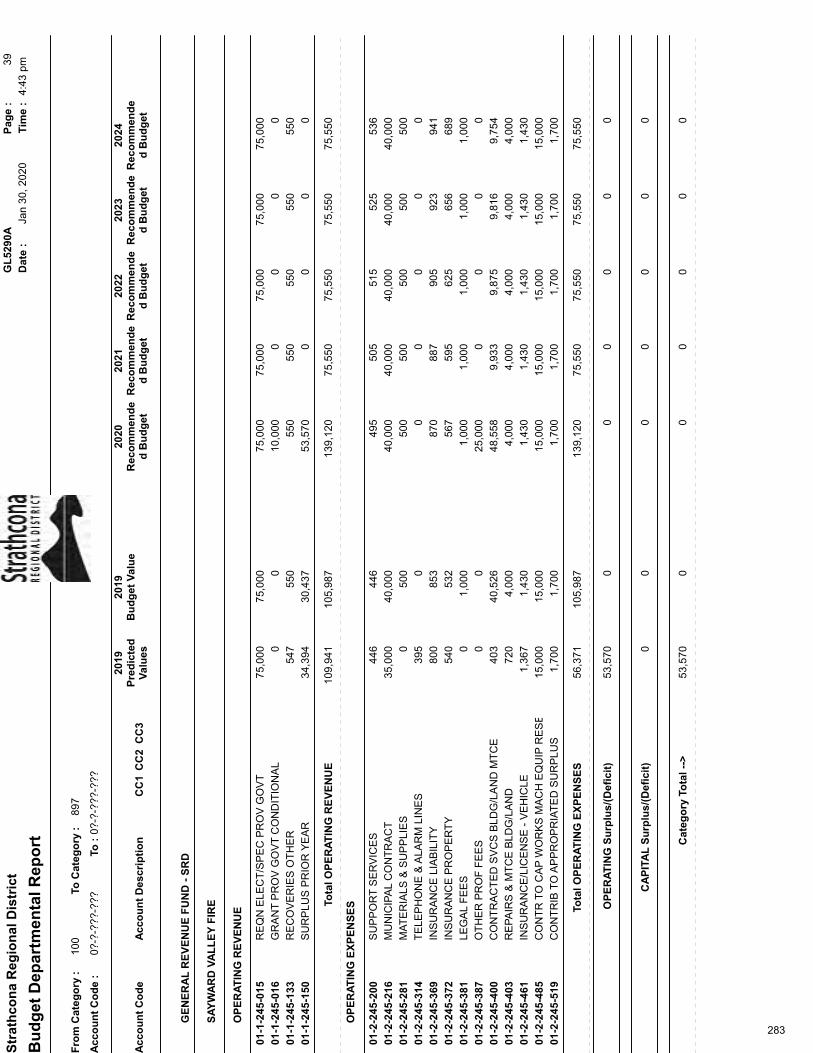
245 ‐ Sayward Valley Fire Protection O 75,000 75,000
250 ‐ South Cortes Fire Protection O 227,868 225,500
251 ‐ Cortes Island First Responder X ‐ 44,061
255 ‐ North Quadra Assistance Response O 250 253
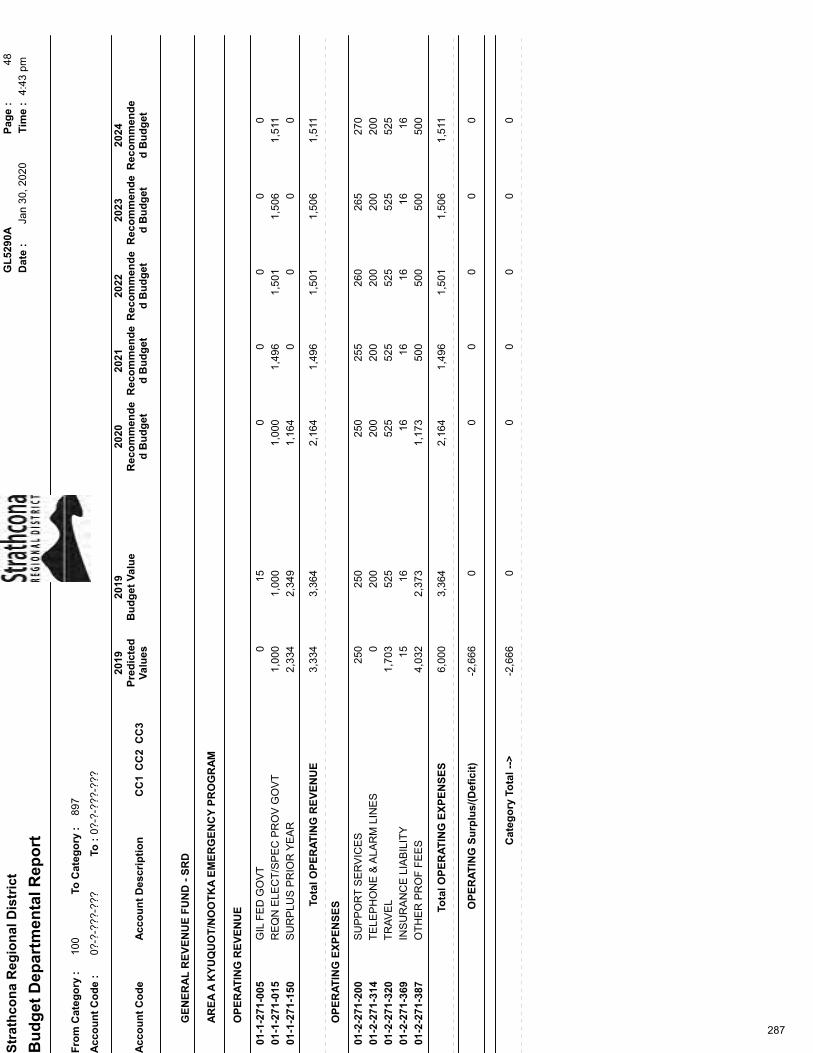
271 ‐ Kyuquot Nootka Emergency Program O 1,000 1,000
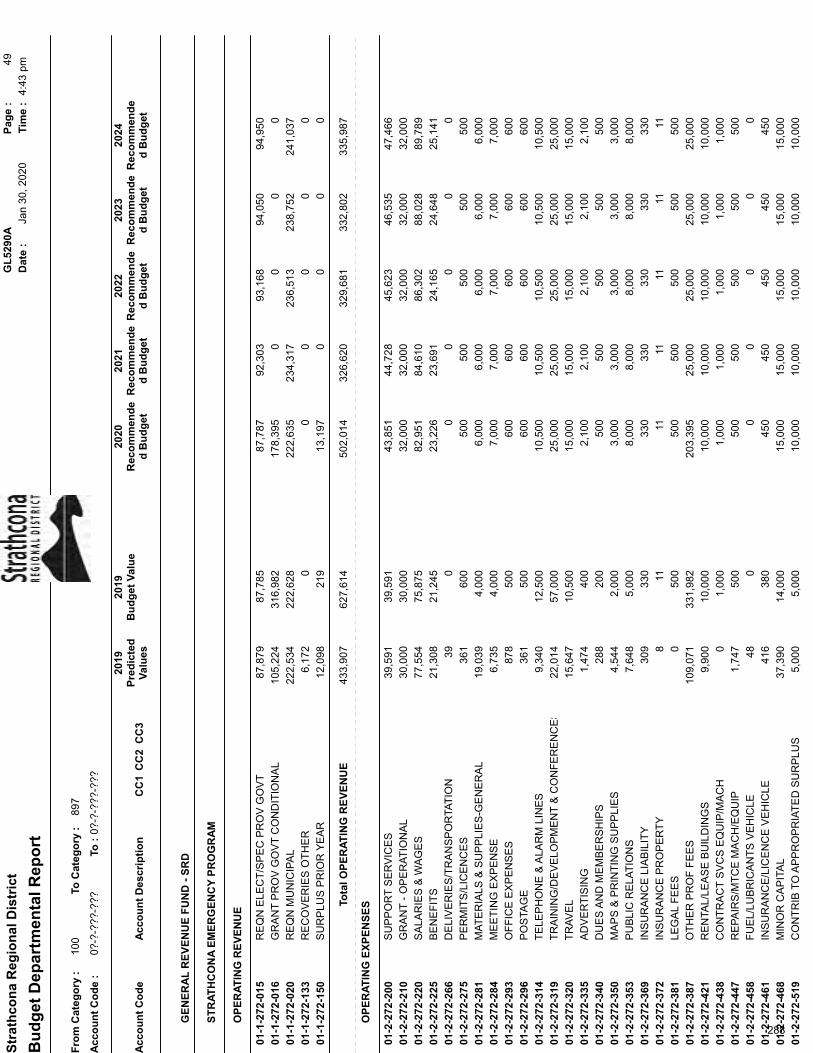
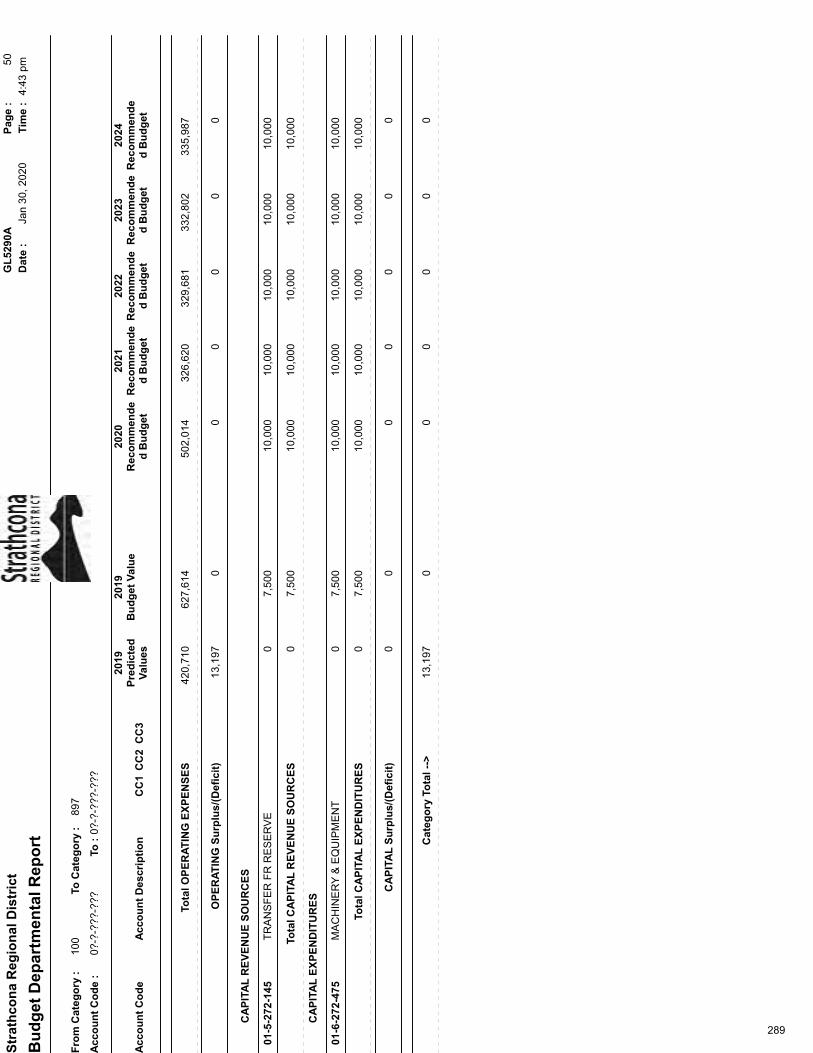
272 ‐ Strathcona Emergency Program X X X X X X X X X 310,413 310,422
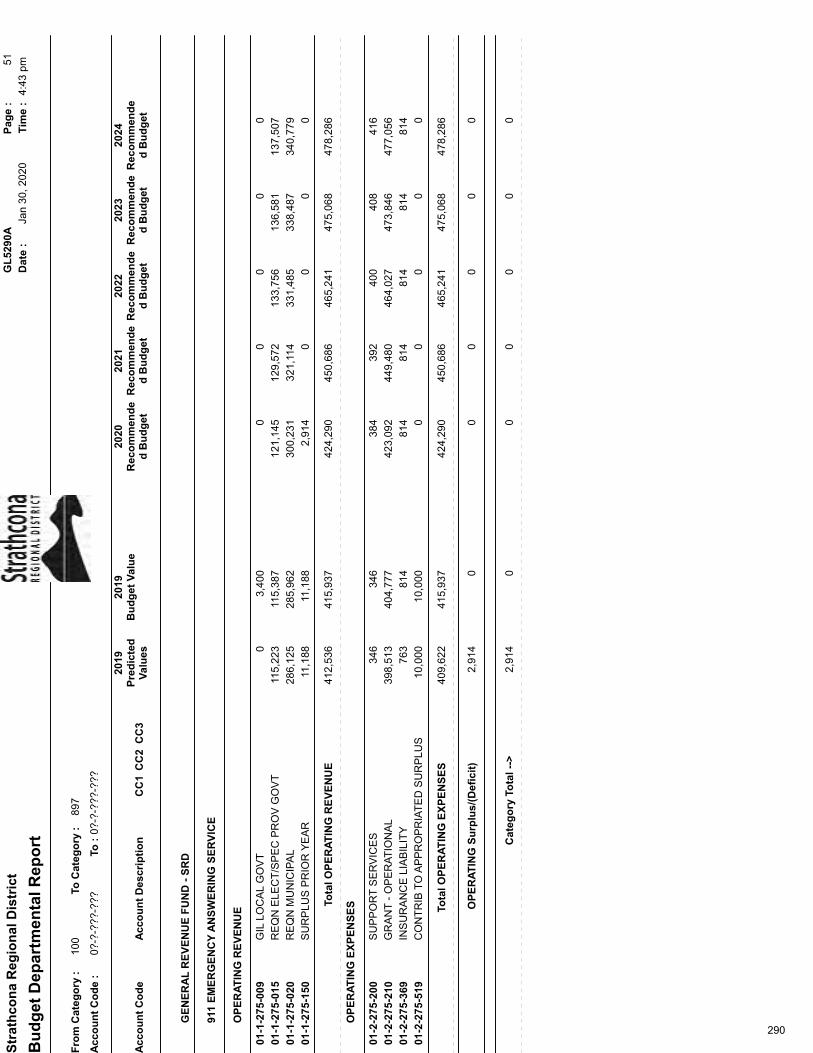
275 ‐ 911 Answering Service X X X X X X X X X 401,348 421,376
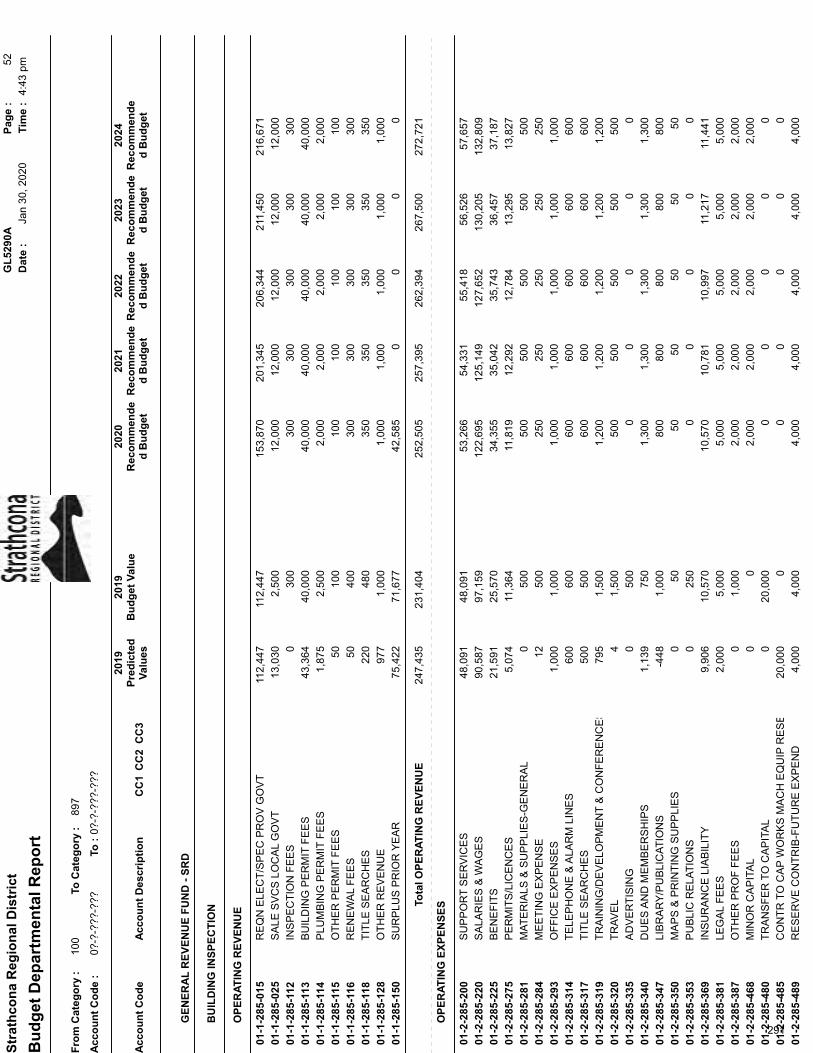
285 ‐ Building Inspection X 112,447 153,870
290 ‐ Electoral Area D Animal Control X 36,253 42,451
295 ‐ Noise Control X ‐ 57
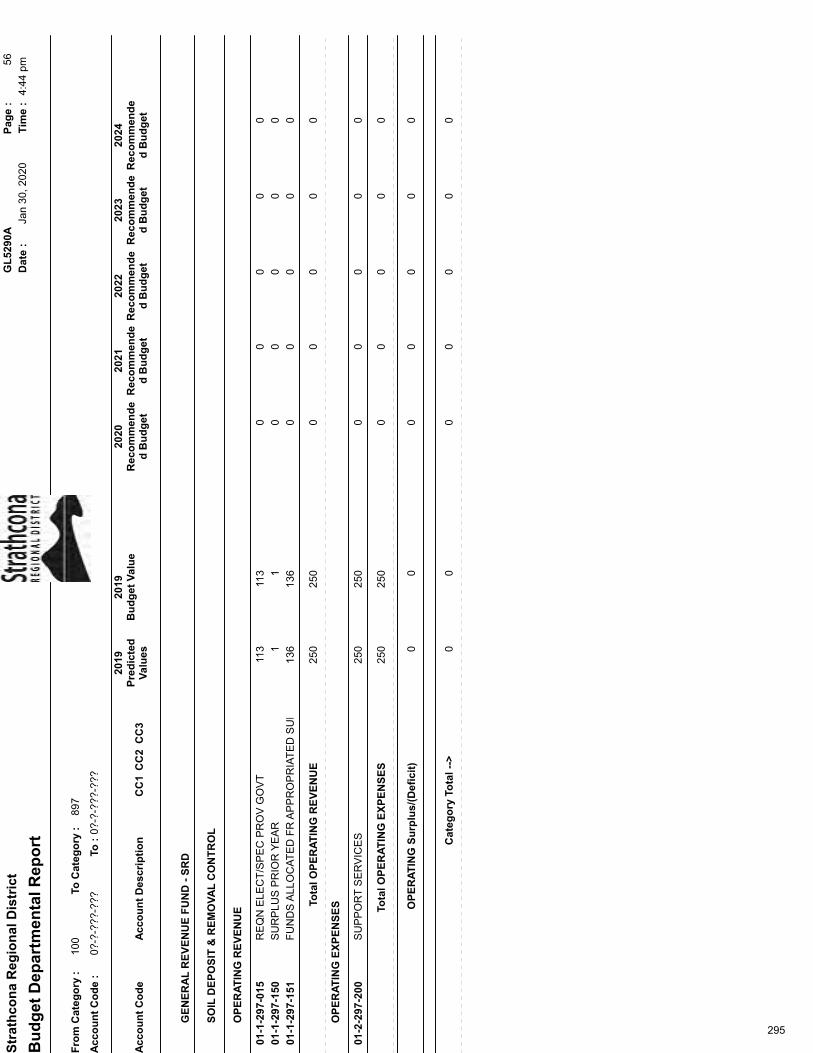
297 ‐ Soil Deposit & Removal Control X 113 ‐
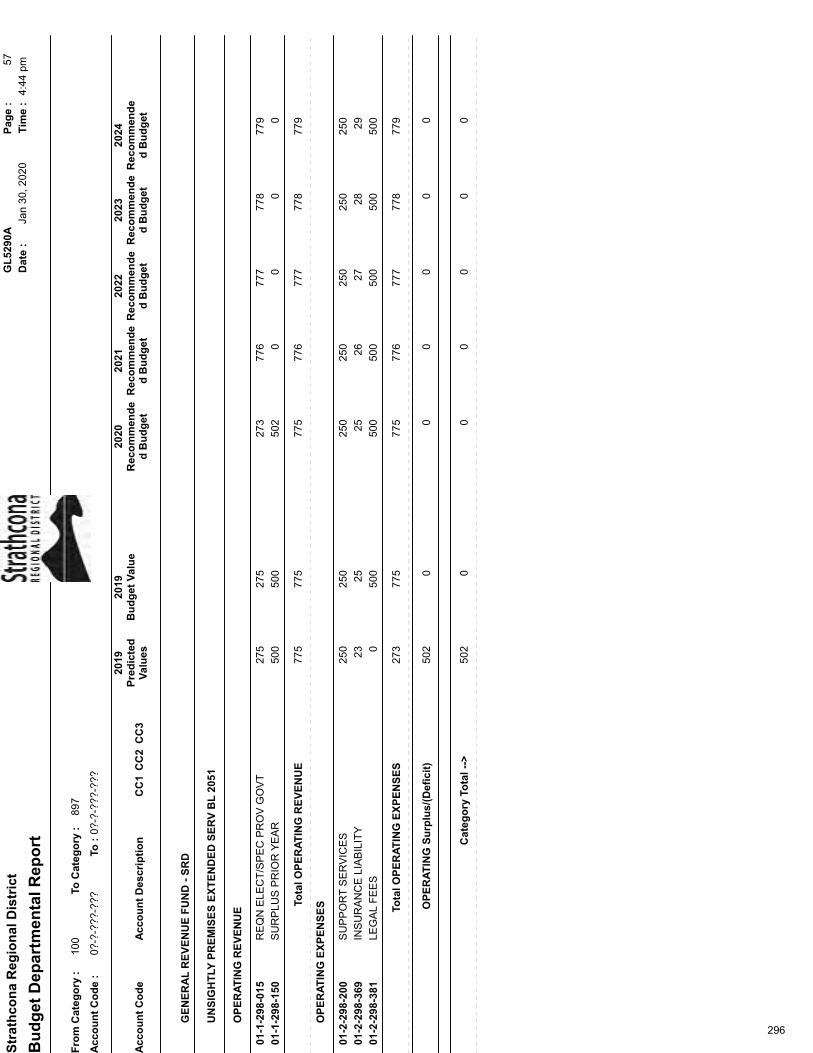
298 ‐ Unsightly Premises X 275 273
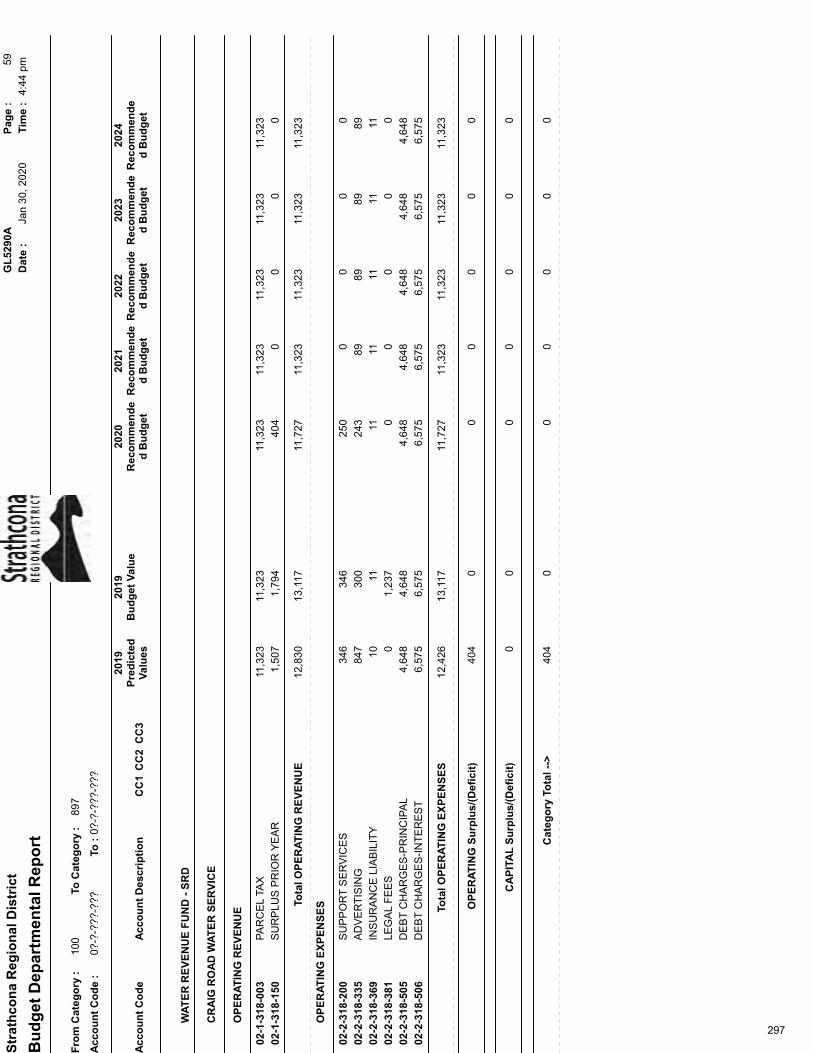
318 ‐ Craig Road Water X 11,323 11,323
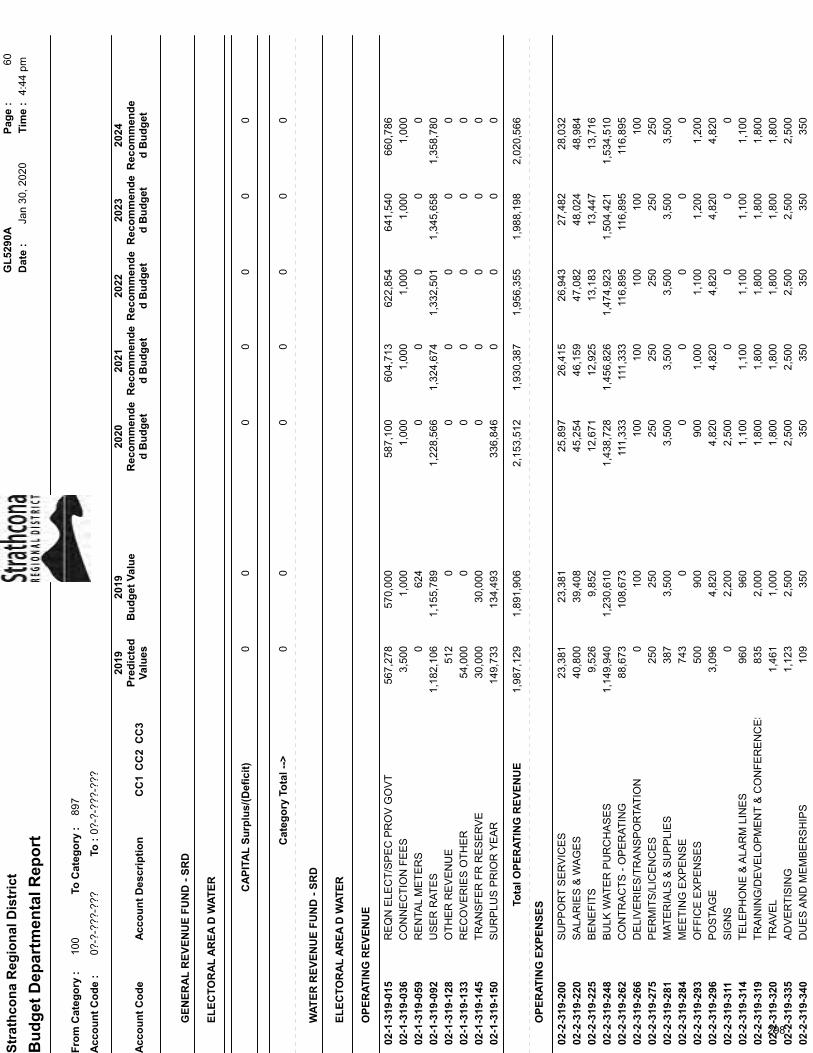
319 ‐ Electoral Area D Water O 567,278 587,100
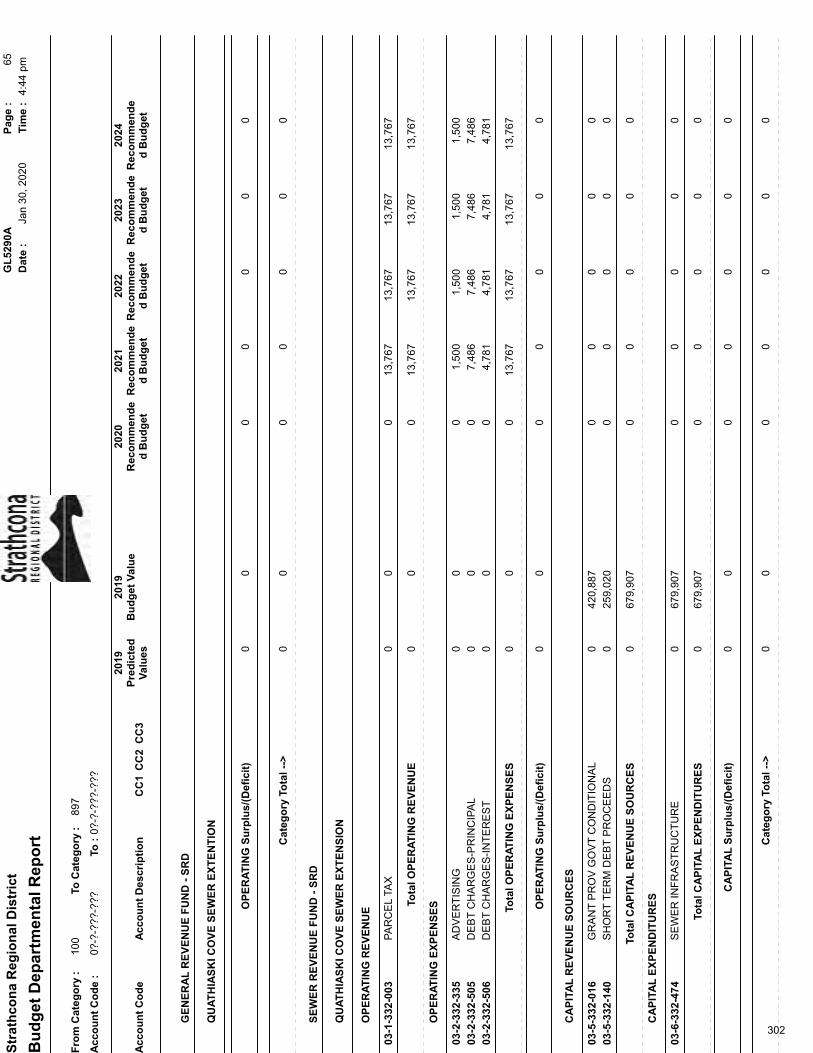
332 ‐ Quathiaski Cove Sewer Ext #1 O ‐ ‐
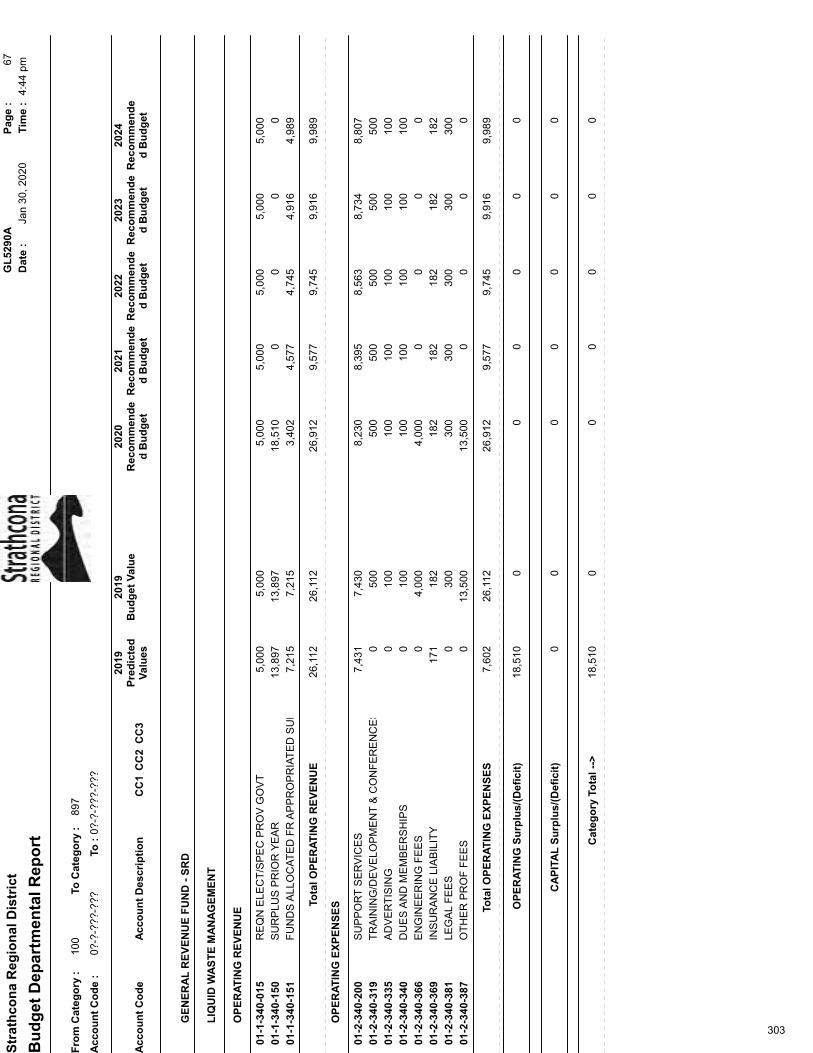
340 ‐ Liquid Waste X X 5,000 5,000
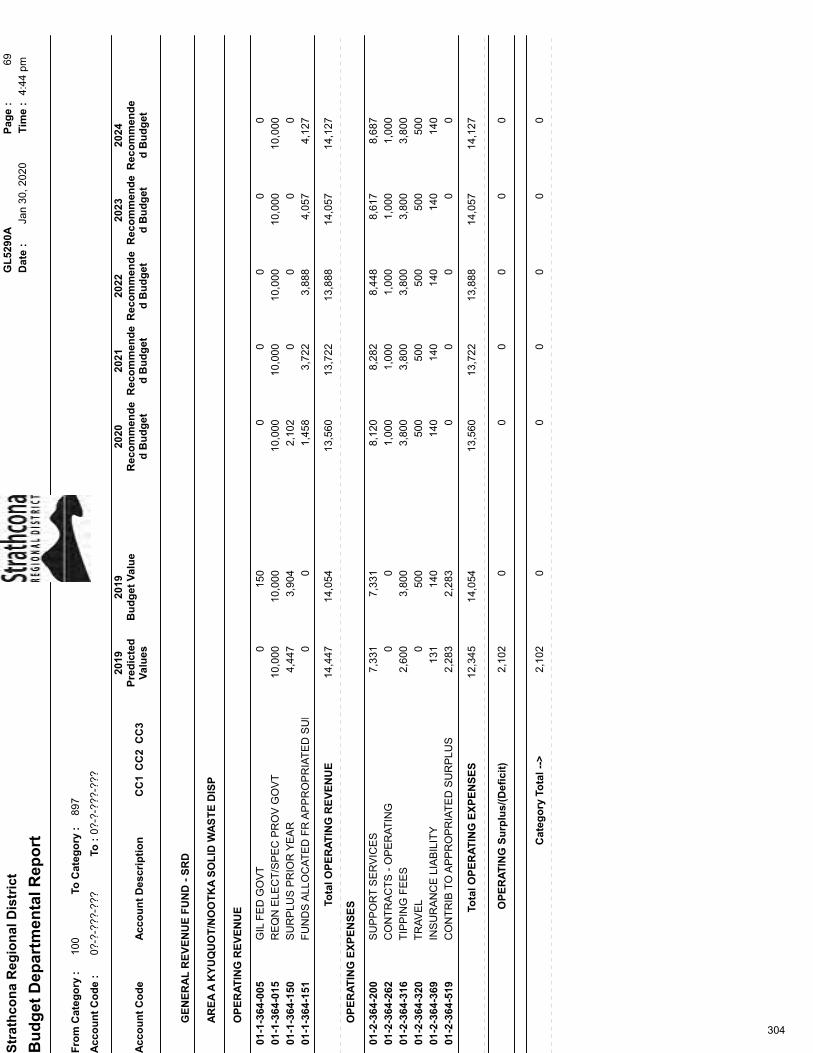
364 ‐ Area A Kyuquot Nootka Solid Waste O 10,000 10,000
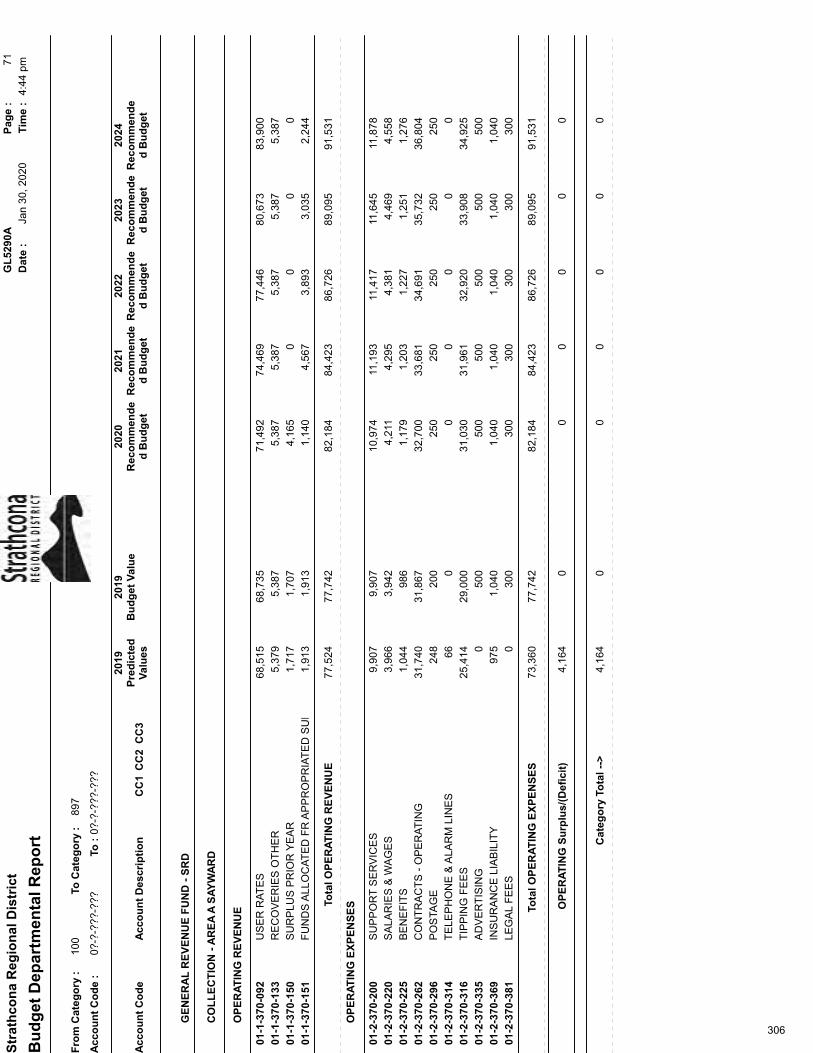
368 ‐ Sayward and Area A Sayward Refuse X O 23,196 11,311
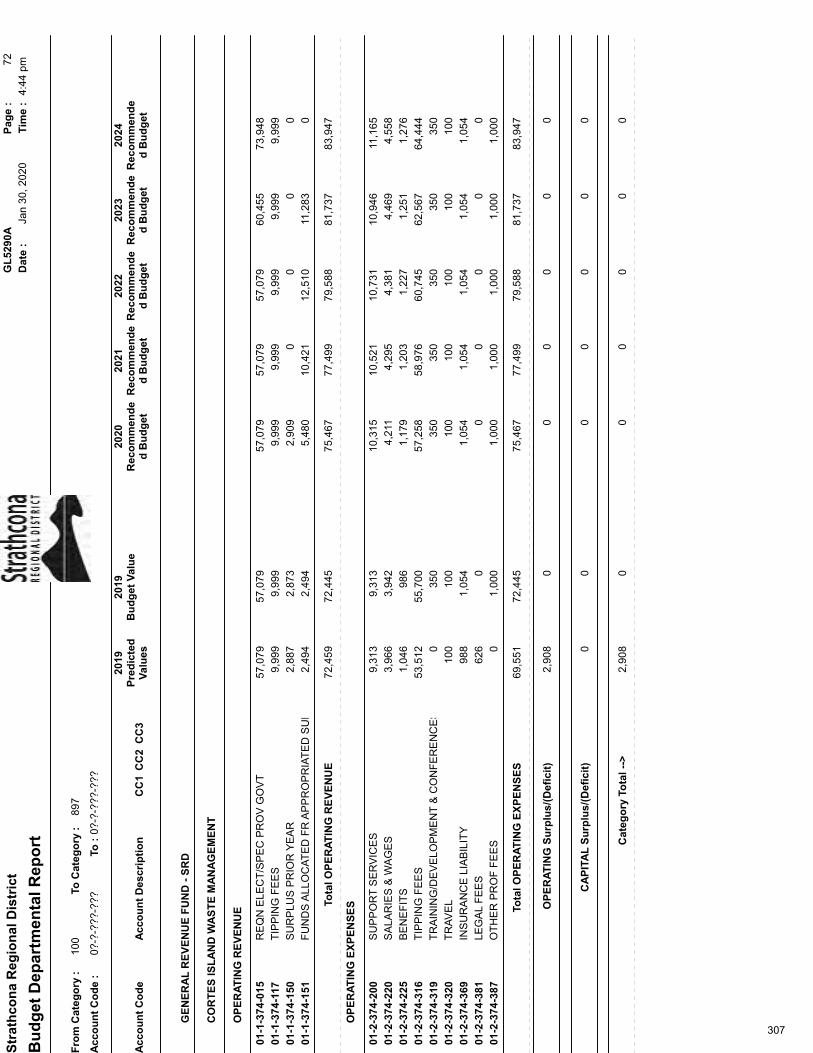
374 ‐ Area B Refuse Disposal O 57,079 57,079
500 ‐ Planning X X X X 635,057 639,493
510 ‐ Planning (Non Part 26) X X X X X X X X X ‐ ‐
533 ‐ House Numbering Area D X 515 533
534 ‐ House Numbering Area A Sayward O 286 305
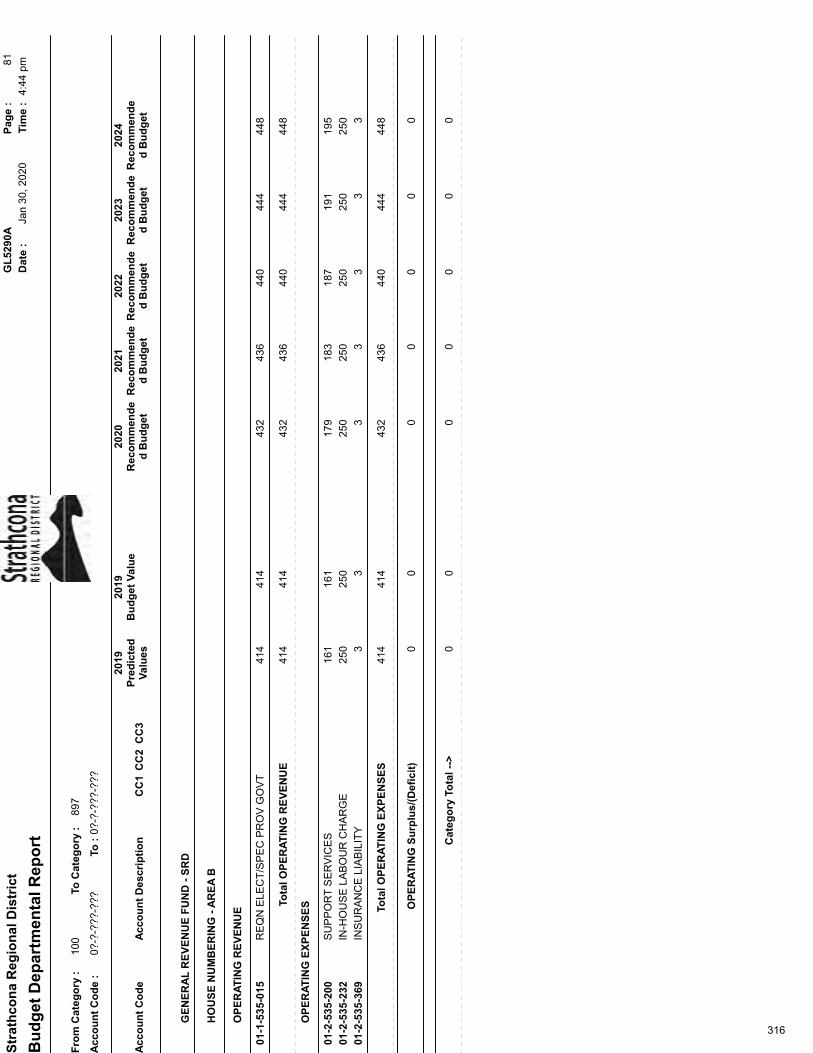
535 ‐ House Numbering Area B X 414 432
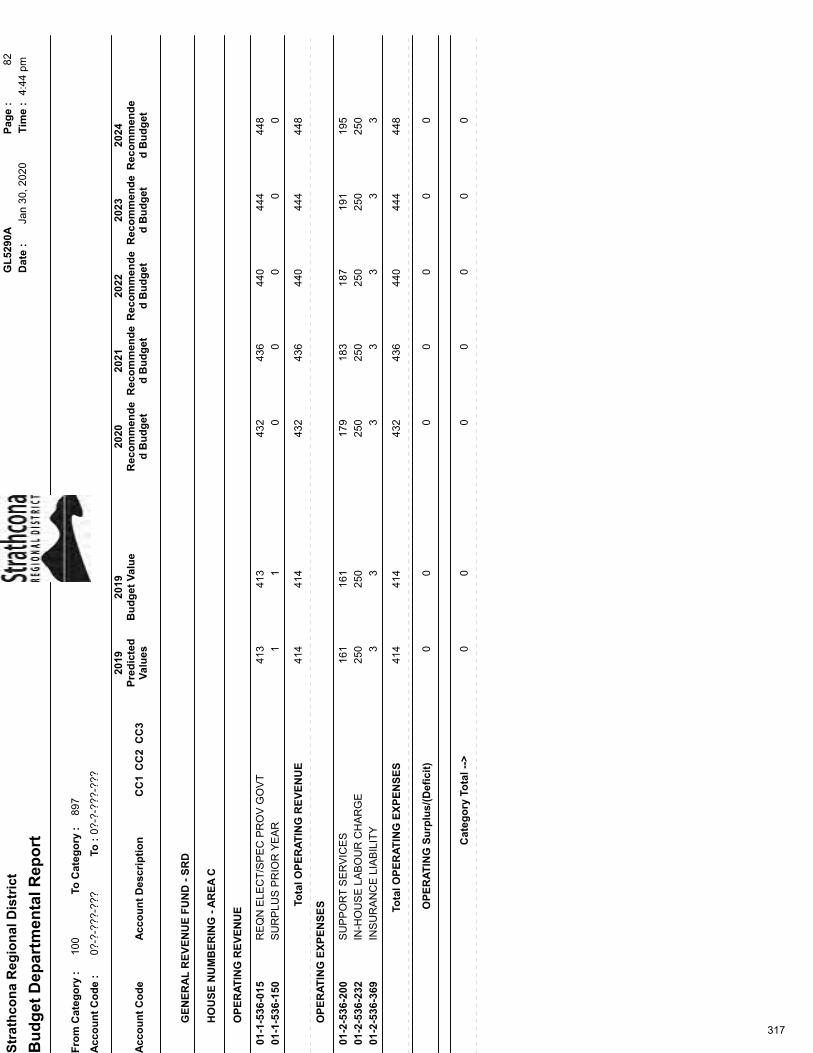
536 ‐ House Numbering Area C X 413 432
Municipalities Electoral Areas Total Taxation*
10

Summary of Service Participants
2020‐2024 APPROVED FINANCIAL PLAN
FunctionCampbell
River
Gold
RiverSayward Tahsis Zeballos
Area
A
Area
B
Area
C
Area
D2019 2020
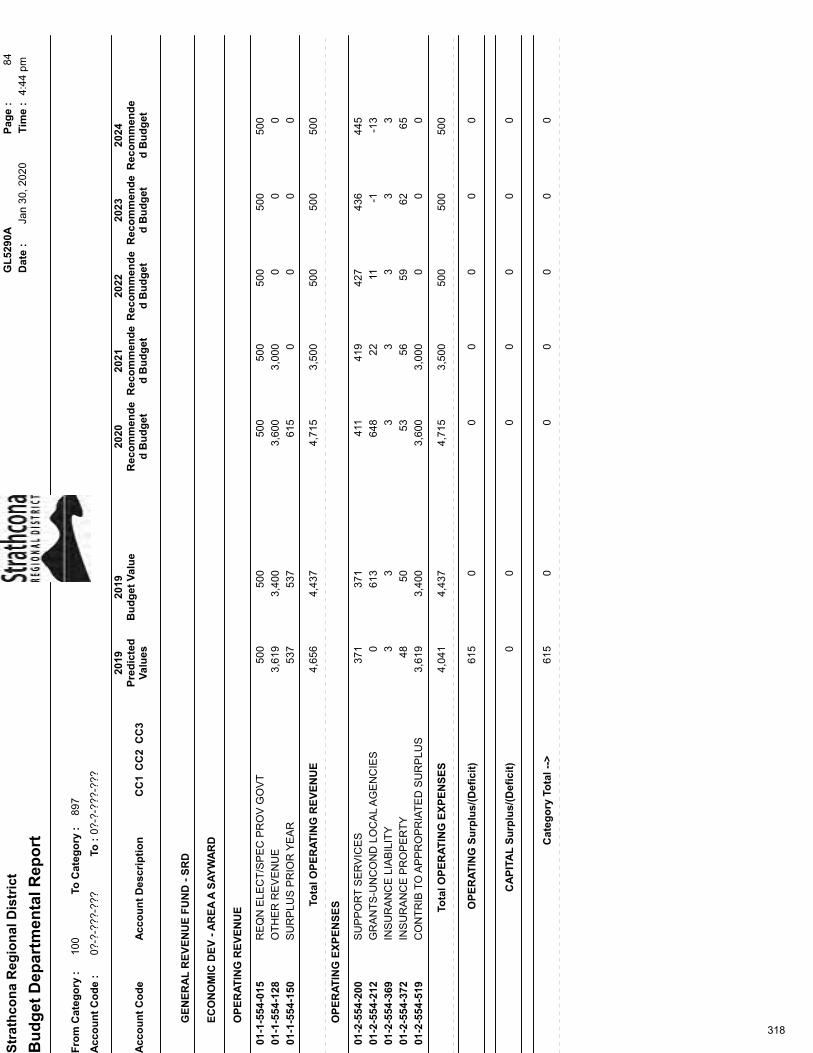
554 ‐ Economic Development ‐ Area A Sayward O 500$ 500$
555 ‐ Economic Development ‐ Area C X 20,000 20,000
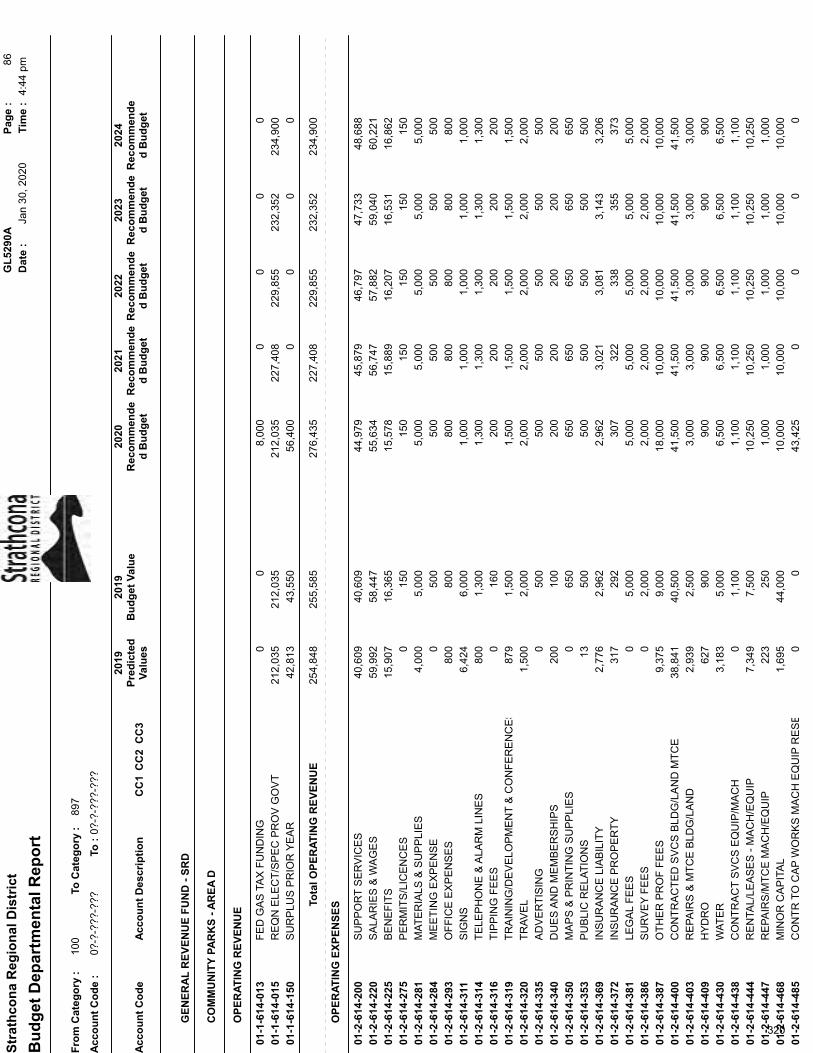
614 ‐ Community Parks Area D X 212,035 212,035
617 ‐ Community Parks Area B X 163,537 174,352
618 ‐ Community Parks Area C X 179,690 188,664
630 ‐ Vancouver Island Regional Library X X X X 519,069 529,864
640 ‐ Strathcona Gardens X X 5,440,358 5,791,517
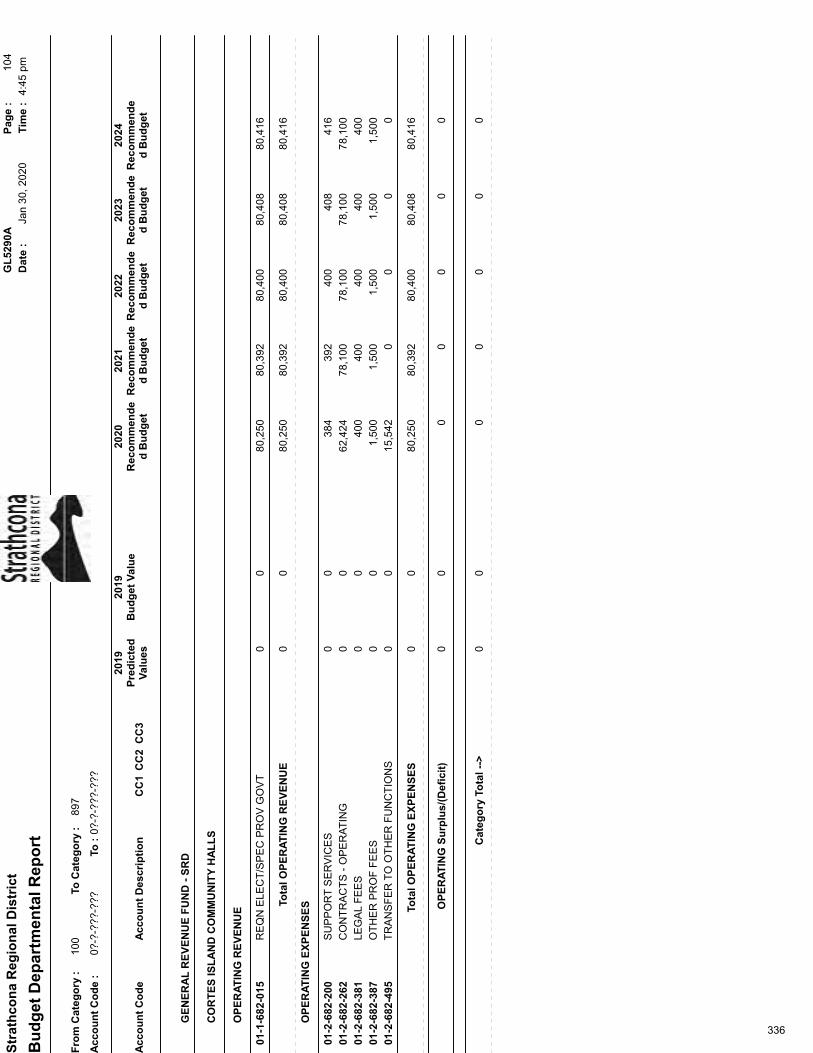
682 ‐ Cortes Island Community Halls X ‐ 80,250
677 ‐ Kyuquot Community Hall O 1,833 495
680 ‐ Sayward Valley Heritage Hall O 24,143 24,275
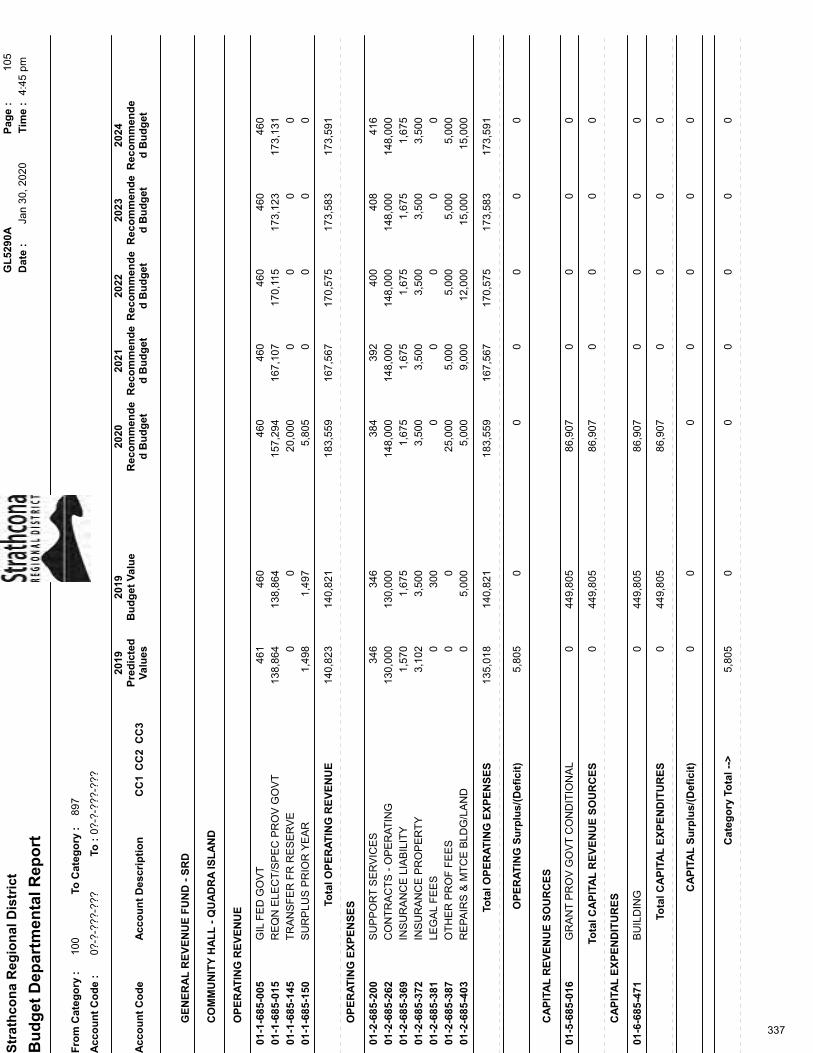
685 ‐ Quadra Island Community Hall Subsidy O 138,864 157,294
697 ‐ Heritage Conservation ‐ Area B X ‐ ‐
698 ‐ Heritage Conservation ‐ Area C X 1,270 1,270
750 ‐ Electoral Area D Street Lighting Service O 33,840 35,030
770 ‐ Electoral Area C Street Lighting Service X 7,185 7,333
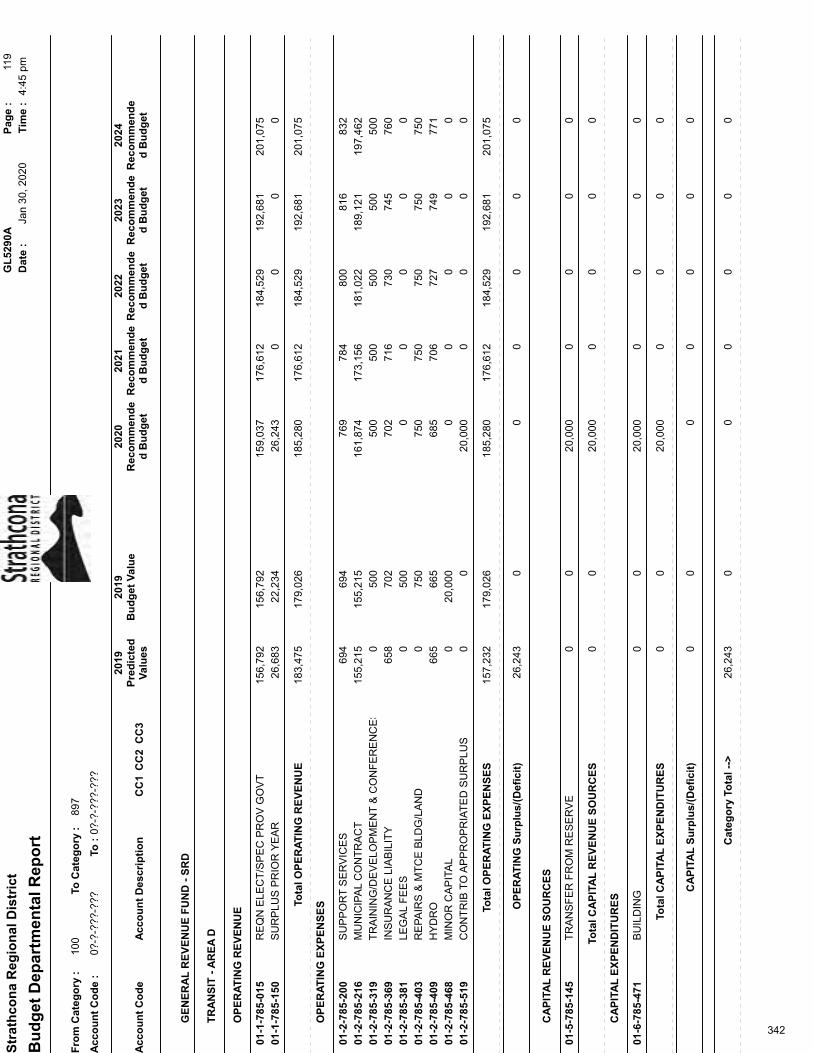
785 ‐ Transit ‐ Area D X 156,792 159,037
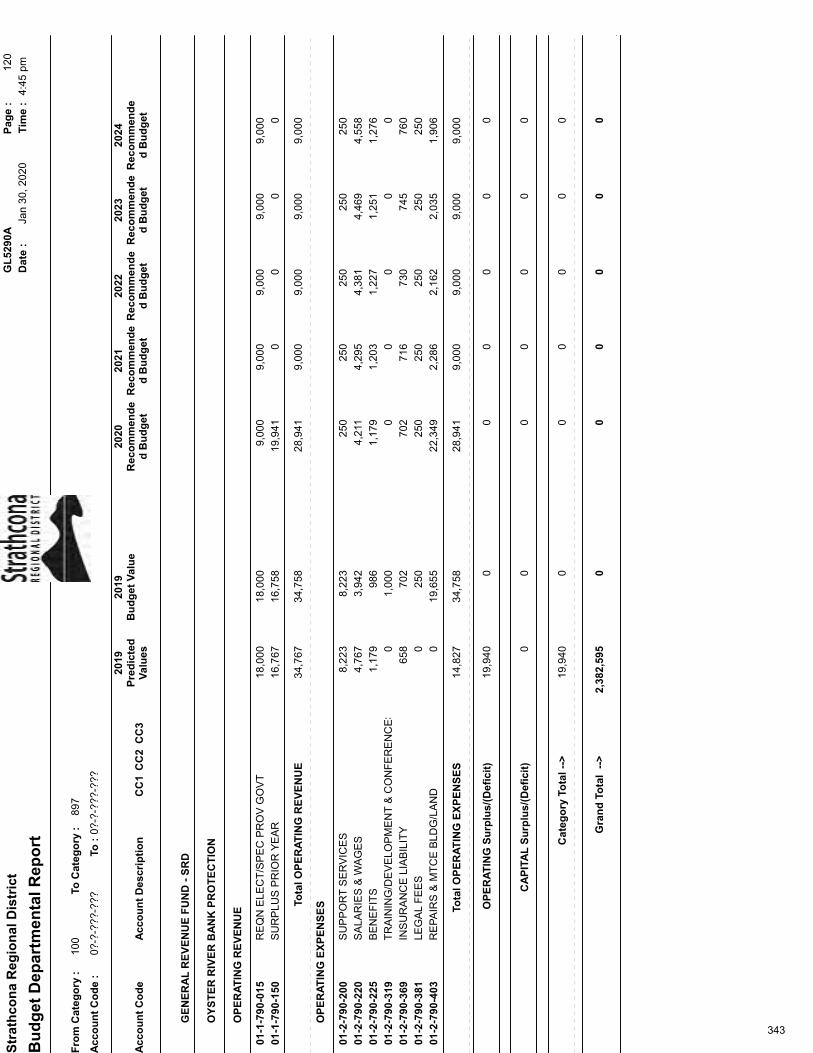
790 ‐ Oyster River Bank Protection O 18,000 9,000
Note: 11,967,434$ 12,947,530$
Key:
X Entire area pays for service
O Part of an area pays for service
Municipalities Electoral Areas Total Taxation*
* Approximate rates based on current property tax assessments ; rates may di ffer from
actua l rates shown on tax notices .
Note: Li s ting only includes functions with requis i tion funding.
* Surveyor of taxes charges a 5.25% fee to col lect electora l area taxes . The amounts
shown do not include this fee.
11
Overview
2020‐2024 APPROVED FINANCIAL PLAN
12
2020‐2024 APPROVED FINANCIAL PLAN
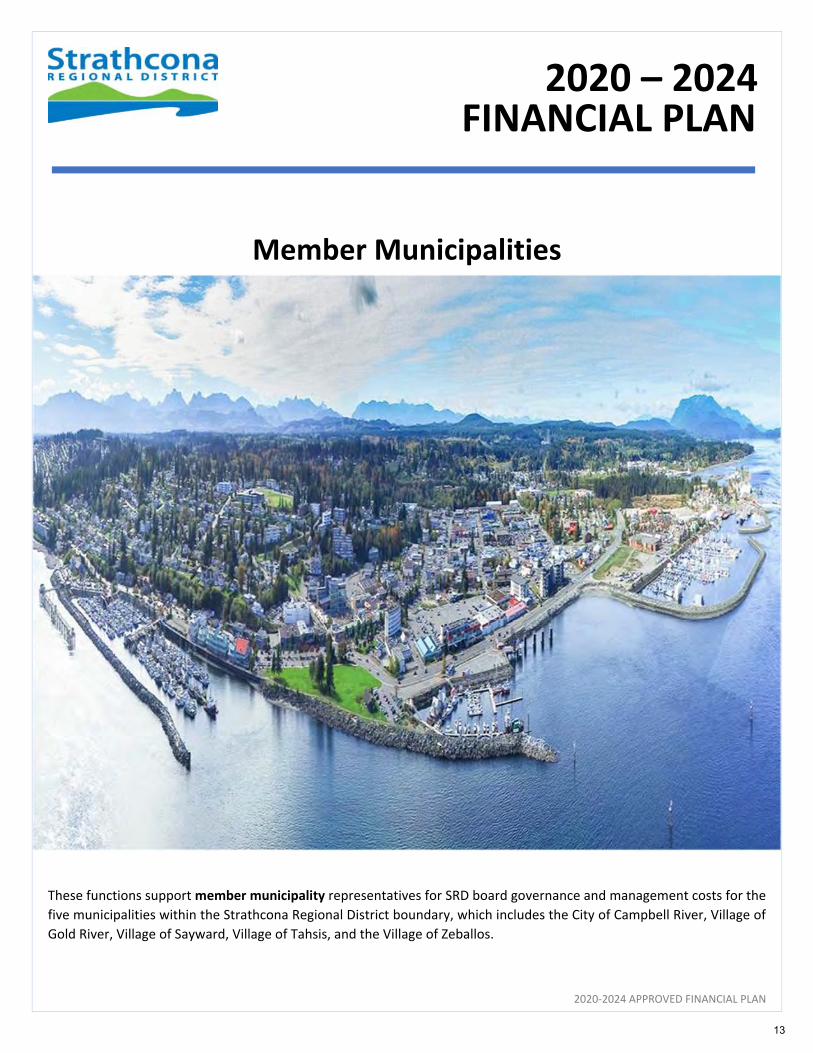
Member Municipalities
These functions support member municipality representatives for SRD board governance and management costs for the
five municipalities within the Strathcona Regional District boundary, which includes the City of Campbell River, Village of
Gold River, Village of Sayward, Village of Tahsis, and the Village of Zeballos.
FINANCIAL PLAN
2020 – 2024
13
Member Municipalities Summary
2020‐2024 APPROVED FINANCIAL PLAN
Member Municipalities includes the following functions:
Function # ‐ Function Description
100 ‐ Member Municipality Administration
190 ‐ Member Municipality Debt
192 ‐ Member Municipality Debt ‐ Campbell River
196 ‐ Member Municipality Debt ‐ Sayward
14
1515
City of Campbell River
2020‐2024 APPROVED FINANCIAL PLAN
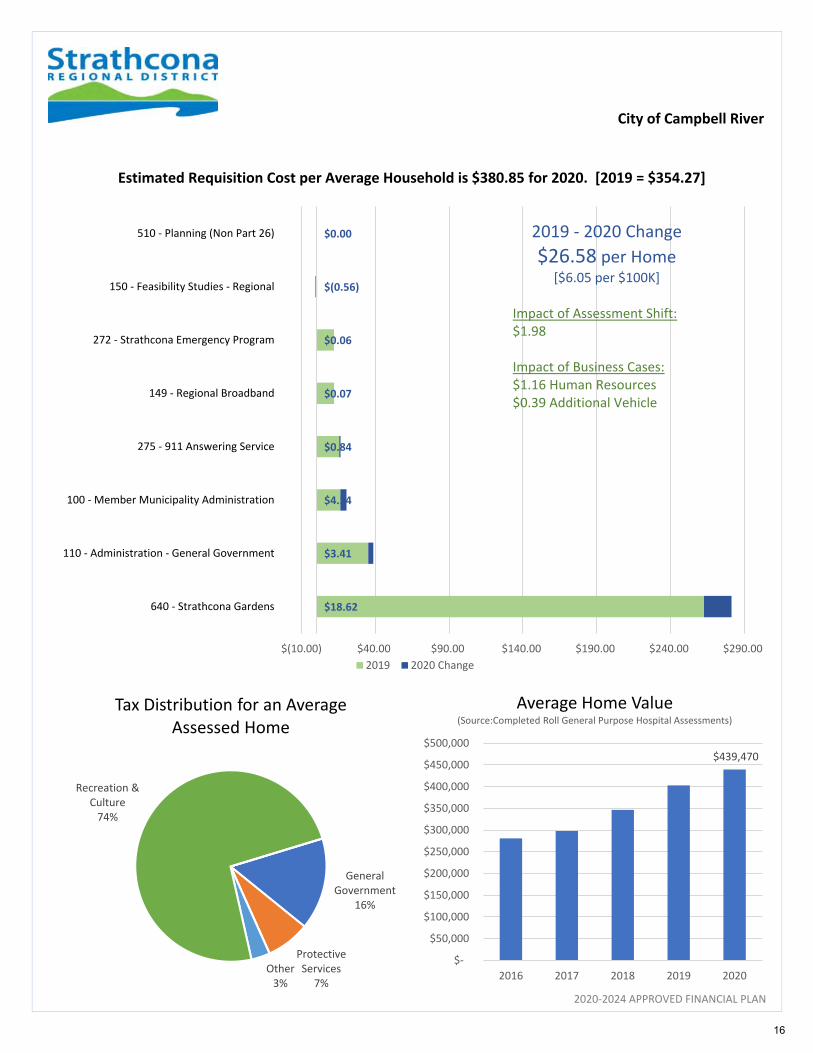
$18.62
$3.41
$4.14
$0.84
$0.07
$0.06
$(0.56)
$0.00
$(10.00) $40.00 $90.00 $140.00 $190.00 $240.00 $290.00
640 ‐ Strathcona Gardens
110 ‐ Administration ‐ General Government
100 ‐ Member Municipality Administration
275 ‐ 911 Answering Service
149 ‐ Regional Broadband
272 ‐ Strathcona Emergency Program
150 ‐ Feasibility Studies ‐ Regional
510 ‐ Planning (Non Part 26)
2019 2020 Change
Estimated Requisition Cost per Average Household is $380.85 for 2020. [2019 = $354.27]
2019 ‐ 2020 Change
$26.58 per Home[$6.05 per $100K]
Impact of Assessment Shift:$1.98
Impact of Business Cases:$1.16 Human Resources$0.39 Additional Vehicle
General Government
16%
Protective Services
7%Other3%
Recreation & Culture74%
Tax Distribution for an Average Assessed Home
$439,470
$‐
$50,000
$100,000
$150,000
$200,000
$250,000
$300,000
$350,000
$400,000
$450,000
$500,000
2016 2017 2018 2019 2020
Average Home Value(Source:Completed Roll General Purpose Hospital Assessments)
16

City of Campbell River
2020‐2024 APPROVED FINANCIAL PLAN
Property Tax Requisition Summary
Estimated 2019 to 2020 Tax Rate Change
Service Function2019
Actual
2020
Budget % Change
2019
Actual
2020
Budget $ Change
Member Municipalities:
100 ‐ Member Municipality Administration 289,659$ 364,872$ 26.0 % 4.06$ 4.65$ 0.59$
Corporate Services:
110 ‐ Administration and General Government 635,990 698,175 9.8 % 8.75 8.79 0.04
Regional Services:
149 ‐ Regional Broadband 216,523 217,861 0.6 % 2.98 2.74 (0.23)
150 ‐ Regional Feasibility Studies 9,888 ‐ (100.0)% 0.14 ‐ (0.14)
272 ‐ Strathcona Emergency Program 214,442 215,752 0.6 % 2.95 2.72 (0.23)
275 ‐ 911 Emergency Answering Service 276,289 292,507 5.9 % 3.87 3.72 (0.15)
510 ‐ Planning Non Part 26 ‐ ‐ 0.0 % ‐ ‐ ‐
Strathcona Gardens:
640 ‐ Strathcona Gardens 4,665,365 5,019,508 7.6 % 65.34 63.91 (1.43)
Total 6,308,157$ 6,808,674$ 7.9 % 88.08$ 86.53$ (1.55) $
Average Residential Property Value: 402,616 $ 439,470 $
Estimated Tax Per Average Residential Property 354 $ 381 $
Requisition Estimated Tax (per $100K)
Property Tax Requisition
Estimated 5‐Year Forecast
Service Function 2019
Actual
2020
Budget
2021
Budget
2022
Budget
2023
Budget
2024
Budget
Member Municipalities:
100 ‐ Member Municipality Administration 289,659$ 364,872$ 396,020$ 402,752$ 409,618$ 416,621$
Corporate Services:
110 ‐ Administration and General Government 635,990 698,175 808,158 832,866 844,098 862,767
Regional Services:
149 ‐ Regional Broadband 216,523 217,861 217,861 56,881 ‐ (133,584)
150 ‐ Regional Feasibility Studies 9,888 ‐ ‐ 192 192 192
272 ‐ Strathcona Emergency Program 214,442 215,752 227,047 229,181 231,357 233,578
275 ‐ 911 Emergency Answering Service 276,289 292,507 312,853 322,957 329,778 332,012
510 ‐ Planning Non Part 26 ‐ ‐ 181 181 181 181
Strathcona Gardens:
640 ‐ Strathcona Gardens 4,665,365 5,019,508 5,195,704 5,275,763 5,370,936 5,468,381
Total Requisition 6,308,157$ 6,808,674$ 7,157,823$ 7,120,773$ 7,186,160$ 7,180,149$
Estimated Tax per $100,000 Assessed Value 88.08 $ 86.53 $ 90.96 $ 90.51 $ 91.35 $ 91.29 $
Increase/(Decrease) per $100,000 Assessed Value (1.55) $ 4.43 $ (0.45) $ 0.84 $ (0.06) $
17

Village of Gold River
2020‐2024 APPROVED FINANCIAL PLAN
$0.91
$1.25
$0.16
$(0.05)
$(0.05)
$(0.19)
$0.00
$(2.00) $0.00 $2.00 $4.00 $6.00 $8.00 $10.00 $12.00 $14.00
110 ‐ Administration ‐ General Government
100 ‐ Member Municipality Administration
275 ‐ 911 Answering Service
149 ‐ Regional Broadband
272 ‐ Strathcona Emergency Program
150 ‐ Feasibility Studies ‐ Regional
510 ‐ Planning (Non Part 26)
2009 2020 Change
Estimated Requisition Cost per Average Household is $32.91 for 2020. [2019 = $30.87]
2019 ‐ 2020 Change
$2.04 per Home[$1.40 per $100K]
Impact of Assessment Shift:($0.54)
Impact of Business Cases:$0.38 Human Resources$0.13 Additional Vehicle
General Government
60%
Protective Services28%
Other12%
Tax Distribution for an Average Assessed Home
$145,510
$‐
$20,000
$40,000
$60,000
$80,000
$100,000
$120,000
$140,000
$160,000
2016 2017 2018 2019 2020
Average Home Value(Source:Completed Roll General Purpose Hospital Assessments)
18
Village of Gold River
2020‐2024 APPROVED FINANCIAL PLAN
Property Tax Requisition Summary
Estimated 2019 to 2020 Tax Rate Change
Service Function2019
Actual
2020
Budget % Change
2019
Actual
2020
Budget $ Change
Member Municipalities:
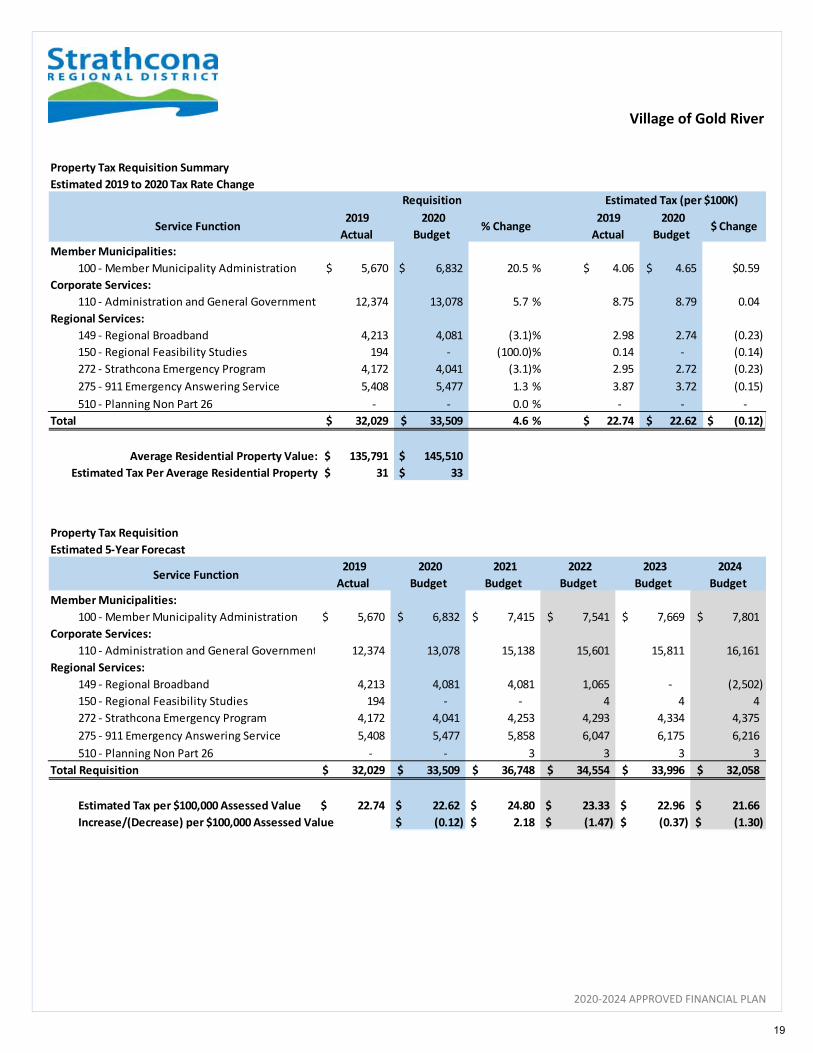
100 ‐ Member Municipality Administration 5,670$ 6,832 $ 20.5 % 4.06$ 4.65$ $0.59
Corporate Services:
110 ‐ Administration and General Government 12,374 13,078 5.7 % 8.75 8.79 0.04
Regional Services:
149 ‐ Regional Broadband 4,213 4,081 (3.1)% 2.98 2.74 (0.23)
150 ‐ Regional Feasibility Studies 194 ‐ (100.0)% 0.14 ‐ (0.14)
272 ‐ Strathcona Emergency Program 4,172 4,041 (3.1)% 2.95 2.72 (0.23)
275 ‐ 911 Emergency Answering Service 5,408 5,477 1.3 % 3.87 3.72 (0.15)
510 ‐ Planning Non Part 26 ‐ ‐ 0.0 % ‐ ‐ ‐
Total 32,029$ 33,509$ 4.6 % 22.74$ 22.62$ (0.12) $
Average Residential Property Value: 135,791 $ 145,510 $
Estimated Tax Per Average Residential Property 31 $ 33 $
Requisition Estimated Tax (per $100K)
Property Tax Requisition
Estimated 5‐Year Forecast
Service Function 2019
Actual
2020
Budget
2021
Budget
2022
Budget
2023
Budget
2024
Budget
Member Municipalities:
100 ‐ Member Municipality Administration 5,670$ 6,832$ 7,415$ 7,541$ 7,669$ 7,801$
Corporate Services:
110 ‐ Administration and General Government 12,374 13,078 15,138 15,601 15,811 16,161
Regional Services:
149 ‐ Regional Broadband 4,213 4,081 4,081 1,065 ‐ (2,502)
150 ‐ Regional Feasibility Studies 194 ‐ ‐ 4 4 4
272 ‐ Strathcona Emergency Program 4,172 4,041 4,253 4,293 4,334 4,375
275 ‐ 911 Emergency Answering Service 5,408 5,477 5,858 6,047 6,175 6,216
510 ‐ Planning Non Part 26 ‐ ‐ 3 3 3 3
Total Requisition 32,029$ 33,509$ 36,748$ 34,554$ 33,996$ 32,058$
Estimated Tax per $100,000 Assessed Value 22.74 $ 22.62 $ 24.80 $ 23.33 $ 22.96 $ 21.66 $
Increase/(Decrease) per $100,000 Assessed Value (0.12) $ 2.18 $ (1.47) $ (0.37) $ (1.30) $
19
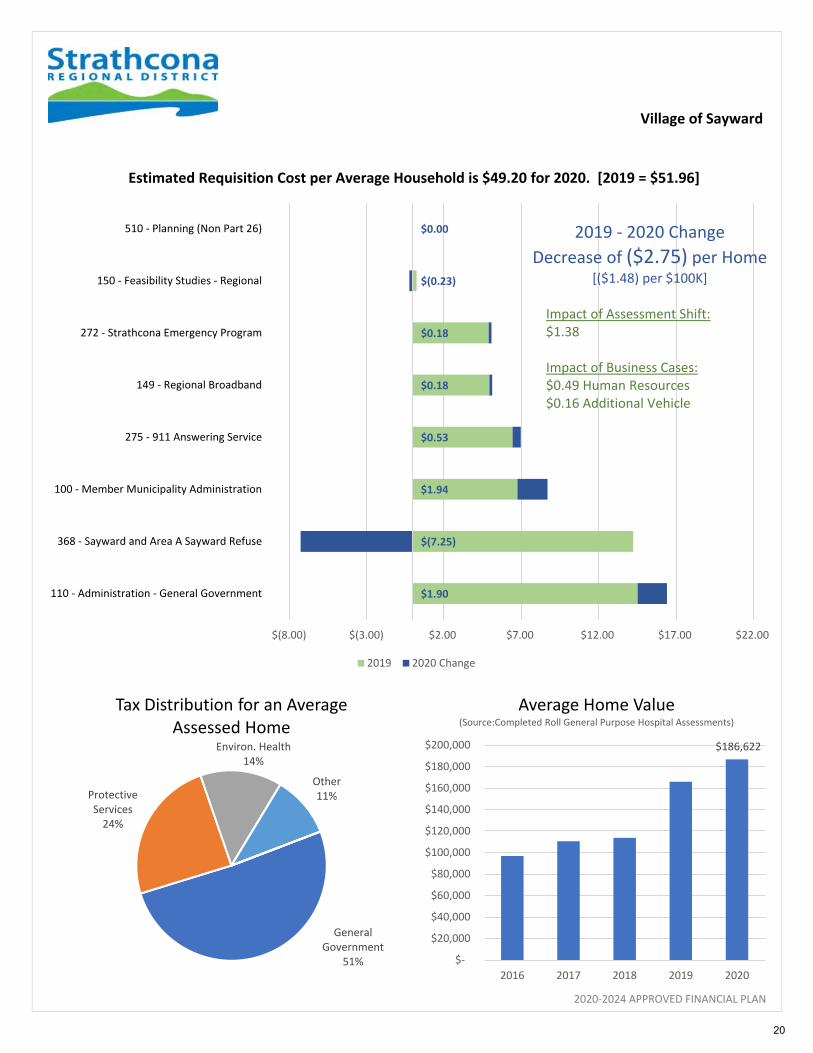
Village of Sayward
2020‐2024 APPROVED FINANCIAL PLAN
$1.90
$(7.25)
$1.94
$0.53
$0.18
$0.18
$(0.23)
$0.00
$(8.00) $(3.00) $2.00 $7.00 $12.00 $17.00 $22.00
110 ‐ Administration ‐ General Government
368 ‐ Sayward and Area A Sayward Refuse
100 ‐ Member Municipality Administration
275 ‐ 911 Answering Service
149 ‐ Regional Broadband
272 ‐ Strathcona Emergency Program
150 ‐ Feasibility Studies ‐ Regional
510 ‐ Planning (Non Part 26)
2019 2020 Change
Estimated Requisition Cost per Average Household is $49.20 for 2020. [2019 = $51.96]
2019 ‐ 2020 Change
Decrease of ($2.75) per Home[($1.48) per $100K]
Impact of Assessment Shift:$1.38
Impact of Business Cases:$0.49 Human Resources$0.16 Additional Vehicle
General Government
51%
Protective Services24%
Environ. Health14%
Other11%
Tax Distribution for an Average Assessed Home
$186,622
$‐
$20,000
$40,000
$60,000
$80,000
$100,000
$120,000
$140,000
$160,000
$180,000
$200,000
2016 2017 2018 2019 2020
Average Home Value(Source:Completed Roll General Purpose Hospital Assessments)
20

Village of Sayward
2020‐2024 APPROVED FINANCIAL PLAN
Property Tax Requisition Summary
Estimated 2019 to 2020 Tax Rate Change
Service Function2019
Actual
2020
Budget % Change
2019
Actual
2020
Budget $ Change
Member Municipalities:
100 ‐ Member Municipality Administration 1,841$ 2,342 $ 27.2 % 4.06$ 4.65$ 0.59$
Corporate Services:
110 ‐ Administration and General Government 4,019 4,480 11.5 % 8.75 8.79 0.04
Regional Services:
149 ‐ Regional Broadband 1,368 1,398 2.2 % 2.98 2.74 (0.23)
150 ‐ Regional Feasibility Studies 63 ‐ (100.0)% 0.14 ‐ (0.14)
272 ‐ Strathcona Emergency Program 1,355 1,385 2.2 % 2.95 2.72 (0.23)
275 ‐ 911 Emergency Answering Service 1,756 1,877 6.9 % 3.87 3.72 (0.15)
368 ‐ Sayward Valley Refuse Disposal 3,882 1,878 (51.6)% 8.56 3.73 (4.83)
510 ‐ Planning Non Part 26 ‐ ‐ 0.0 % ‐ ‐ ‐
Total 14,284$ 13,360$ (6.5)% 31.29$ 26.34$ (4.95) $
Average Residential Property Value: 165,865 $ 186,622 $
Estimated Tax Per Average Residential Property 52 $ 49 $
Requisition Estimated Tax (per $100K)
Property Tax Requisition
Estimated 5‐Year Forecast
Service Function 2019
Actual
2020
Budget
2021
Budget
2022
Budget
2023
Budget
2024
Budget
Member Municipalities:
100 ‐ Member Municipality Administration 1,841$ 2,342$ 2,542$ 2,585$ 2,629$ 2,674$
Corporate Services:
110 ‐ Administration and General Government 4,019 4,480 5,186 5,345 5,417 5,537
Regional Services:
149 ‐ Regional Broadband 1,368 1,398 1,398 365 ‐ (857)
150 ‐ Regional Feasibility Studies 63 ‐ ‐ 1 1 1
272 ‐ Strathcona Emergency Program 1,355 1,385 1,457 1,471 1,485 1,499
275 ‐ 911 Emergency Answering Service 1,756 1,877 2,008 2,073 2,117 2,131
368 ‐ Sayward Valley Refuse Disposal 3,882 1,878 2,789 2,911 3,036 3,163
510 ‐ Planning Non Part 26 ‐ ‐ 1 1 1 1
Total Requisition 14,284$ 13,360$ 15,381$ 14,752$ 14,685$ 14,149$
Estimated Tax per $100,000 Assessed Value 31.29 $ 26.34 $ 30.34 $ 29.11 $ 28.98 $ 27.93 $
Increase/(Decrease) per $100,000 Assessed Value (4.95) $ 3.99 $ (1.23) $ (0.13) $ (1.05) $
21
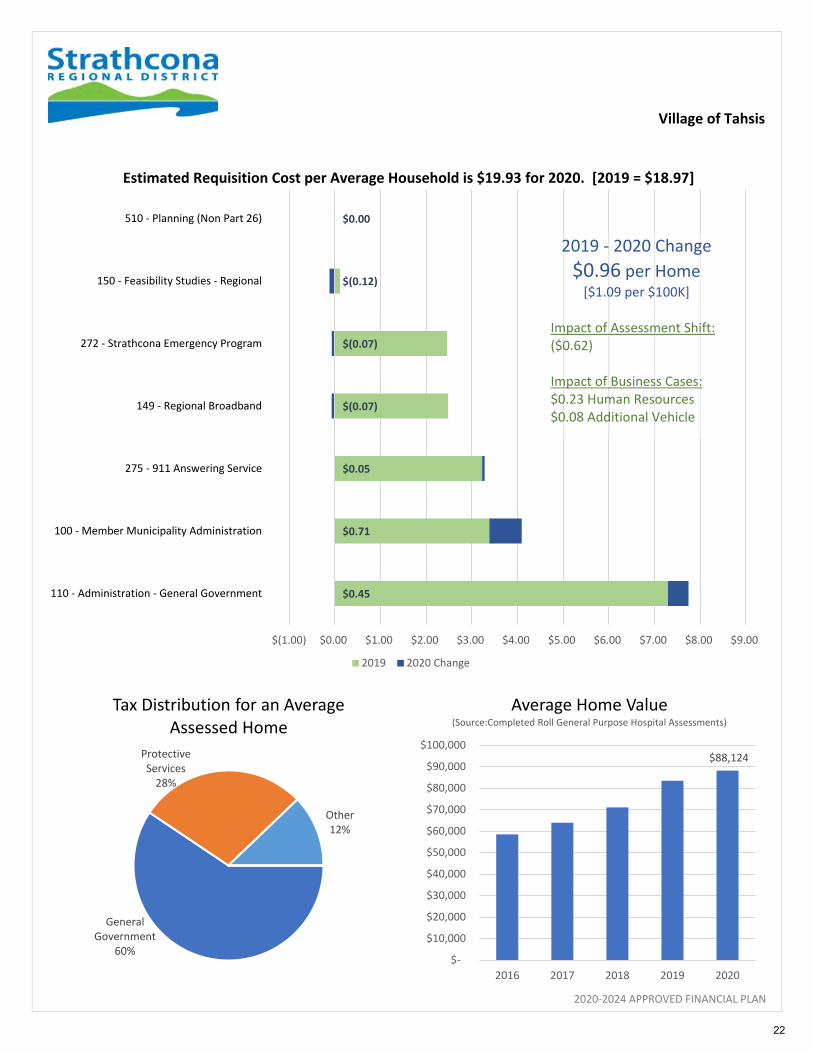
Village of Tahsis
2020‐2024 APPROVED FINANCIAL PLAN
$0.45
$0.71
$0.05
$(0.07)
$(0.07)
$(0.12)
$0.00
$(1.00) $0.00 $1.00 $2.00 $3.00 $4.00 $5.00 $6.00 $7.00 $8.00 $9.00
110 ‐ Administration ‐ General Government
100 ‐ Member Municipality Administration
275 ‐ 911 Answering Service
149 ‐ Regional Broadband
272 ‐ Strathcona Emergency Program
150 ‐ Feasibility Studies ‐ Regional
510 ‐ Planning (Non Part 26)
2019 2020 Change
Estimated Requisition Cost per Average Household is $19.93 for 2020. [2019 = $18.97]
General Government
60%
Protective Services28%
Other12%
Tax Distribution for an Average Assessed Home
$88,124
$‐
$10,000
$20,000
$30,000
$40,000
$50,000
$60,000
$70,000
$80,000
$90,000
$100,000
2016 2017 2018 2019 2020
Average Home Value(Source:Completed Roll General Purpose Hospital Assessments)
2019 ‐ 2020 Change
$0.96 per Home [$1.09 per $100K]
Impact of Assessment Shift: ($0.62) Impact of Business Cases: $0.23 Human Resources $0.08 Additional Vehicle
22
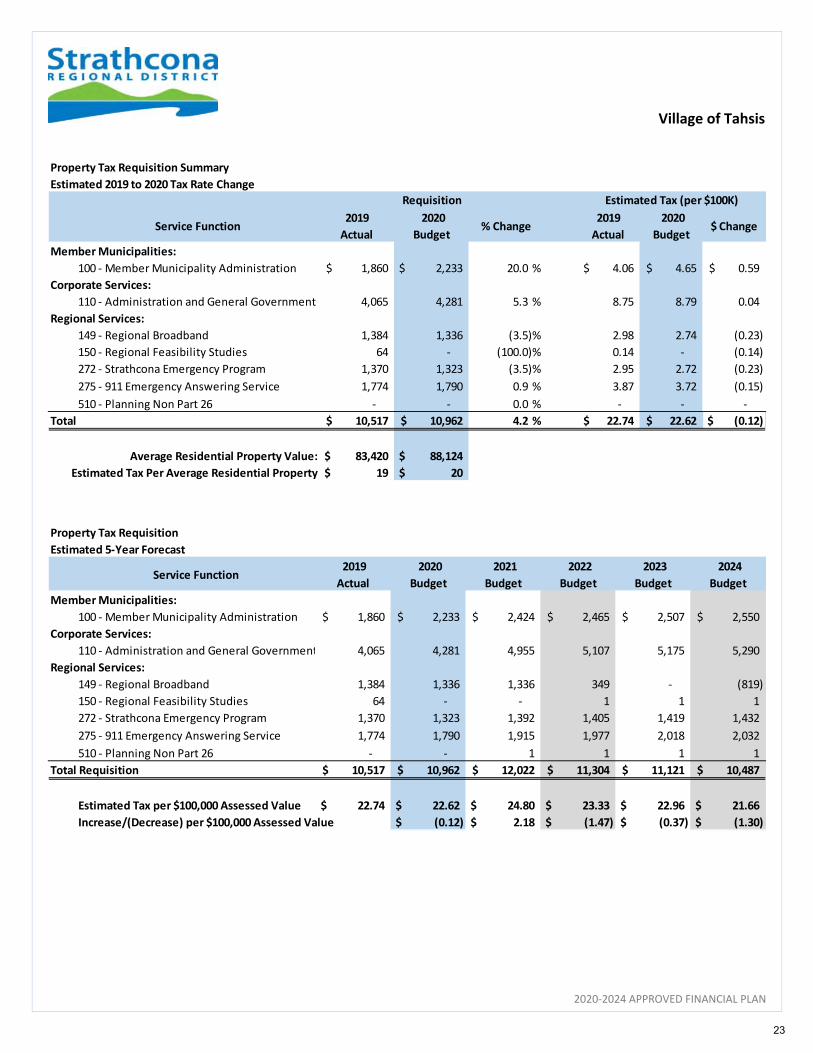
Village of Tahsis
2020‐2024 APPROVED FINANCIAL PLAN
Property Tax Requisition Summary
Estimated 2019 to 2020 Tax Rate Change
Service Function2019
Actual
2020
Budget % Change
2019
Actual
2020
Budget $ Change
Member Municipalities:
100 ‐ Member Municipality Administration 1,860$ 2,233 $ 20.0 % 4.06$ 4.65$ 0.59$
Corporate Services:
110 ‐ Administration and General Government 4,065 4,281 5.3 % 8.75 8.79 0.04
Regional Services:
149 ‐ Regional Broadband 1,384 1,336 (3.5)% 2.98 2.74 (0.23)
150 ‐ Regional Feasibility Studies 64 ‐ (100.0)% 0.14 ‐ (0.14)
272 ‐ Strathcona Emergency Program 1,370 1,323 (3.5)% 2.95 2.72 (0.23)
275 ‐ 911 Emergency Answering Service 1,774 1,790 0.9 % 3.87 3.72 (0.15)
510 ‐ Planning Non Part 26 ‐ ‐ 0.0 % ‐ ‐ ‐
Total 10,517$ 10,962$ 4.2 % 22.74$ 22.62$ (0.12) $
Average Residential Property Value: 83,420 $ 88,124 $
Estimated Tax Per Average Residential Property 19 $ 20 $
Requisition Estimated Tax (per $100K)
Property Tax Requisition
Estimated 5‐Year Forecast
Service Function 2019
Actual
2020
Budget
2021
Budget
2022
Budget
2023
Budget
2024
Budget
Member Municipalities:
100 ‐ Member Municipality Administration 1,860$ 2,233$ 2,424$ 2,465$ 2,507$ 2,550$
Corporate Services:
110 ‐ Administration and General Government 4,065 4,281 4,955 5,107 5,175 5,290
Regional Services:
149 ‐ Regional Broadband 1,384 1,336 1,336 349 ‐ (819)
150 ‐ Regional Feasibility Studies 64 ‐ ‐ 1 1 1
272 ‐ Strathcona Emergency Program 1,370 1,323 1,392 1,405 1,419 1,432
275 ‐ 911 Emergency Answering Service 1,774 1,790 1,915 1,977 2,018 2,032
510 ‐ Planning Non Part 26 ‐ ‐ 1 1 1 1
Total Requisition 10,517$ 10,962$ 12,022$ 11,304$ 11,121$ 10,487$
Estimated Tax per $100,000 Assessed Value 22.74 $ 22.62 $ 24.80 $ 23.33 $ 22.96 $ 21.66 $
Increase/(Decrease) per $100,000 Assessed Value (0.12) $ 2.18 $ (1.47) $ (0.37) $ (1.30) $
23
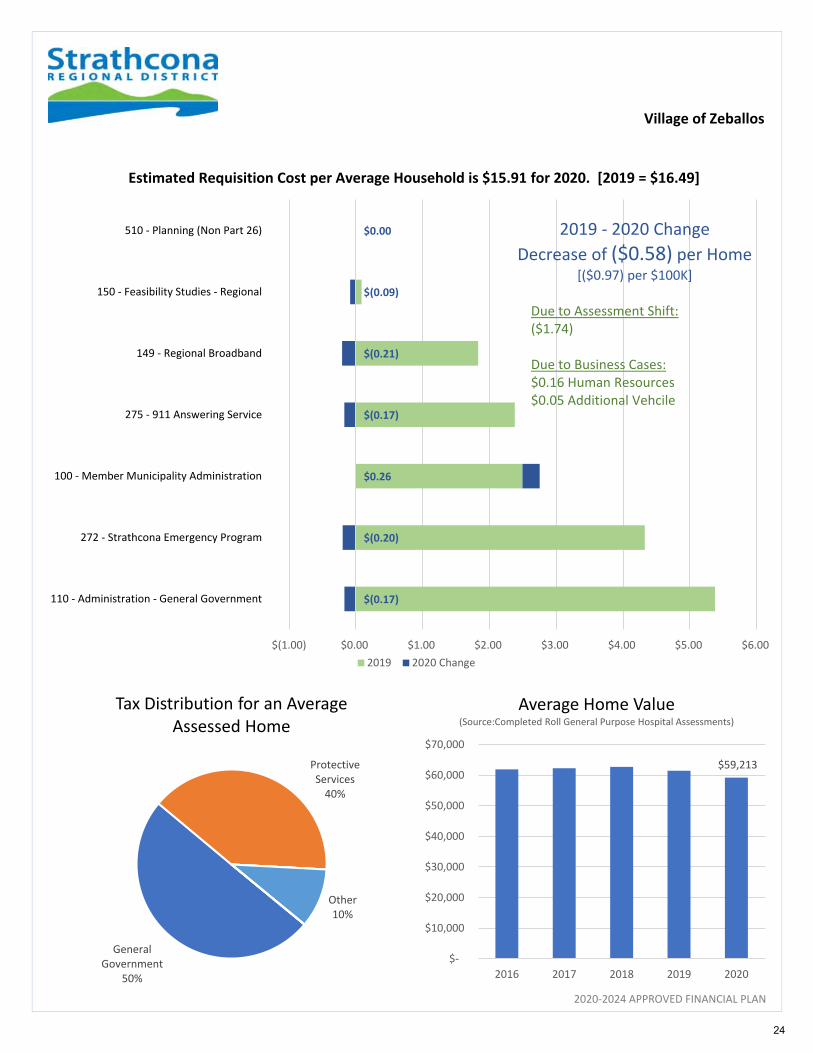
Village of Zeballos
2020‐2024 APPROVED FINANCIAL PLAN
$(0.17)
$(0.20)
$0.26
$(0.17)
$(0.21)
$(0.09)
$0.00
$(1.00) $0.00 $1.00 $2.00 $3.00 $4.00 $5.00 $6.00
110 ‐ Administration ‐ General Government
272 ‐ Strathcona Emergency Program
100 ‐ Member Municipality Administration
275 ‐ 911 Answering Service
149 ‐ Regional Broadband
150 ‐ Feasibility Studies ‐ Regional
510 ‐ Planning (Non Part 26)
2019 2020 Change
Estimated Requisition Cost per Average Household is $15.91 for 2020. [2019 = $16.49]
2019 ‐ 2020 Change
Decrease of ($0.58) per Home[($0.97) per $100K]
Due to Assessment Shift:($1.74)
Due to Business Cases:$0.16 Human Resources$0.05 Additional Vehcile
General Government
50%
Protective Services40%
Other10%
Tax Distribution for an Average Assessed Home
$59,213
$‐
$10,000
$20,000
$30,000
$40,000
$50,000
$60,000
$70,000
2016 2017 2018 2019 2020
Average Home Value(Source:Completed Roll General Purpose Hospital Assessments)
24
Village of Zeballos
2020‐2024 APPROVED FINANCIAL PLAN
Property Tax Requisition Summary
Estimated 2019 to 2020 Tax Rate Change
Service Function2019
Actual
2020
Budget % Change
2019
Actual
2020
Budget $ Change
Member Municipalities:
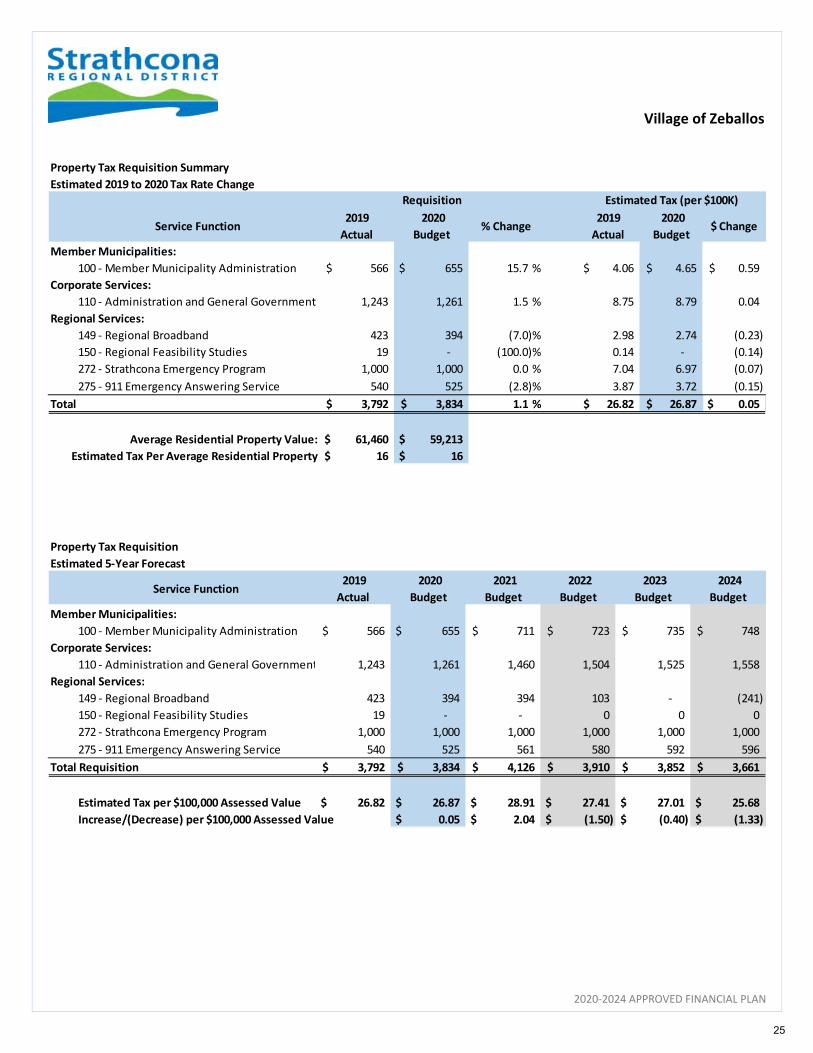
100 ‐ Member Municipality Administration 566$ 655 $ 15.7 % 4.06$ 4.65$ 0.59$
Corporate Services:
110 ‐ Administration and General Government 1,243 1,261 1.5 % 8.75 8.79 0.04
Regional Services:
149 ‐ Regional Broadband 423 394 (7.0)% 2.98 2.74 (0.23)
150 ‐ Regional Feasibility Studies 19 ‐ (100.0)% 0.14 ‐ (0.14)
272 ‐ Strathcona Emergency Program 1,000 1,000 0.0 % 7.04 6.97 (0.07)
275 ‐ 911 Emergency Answering Service 540 525 (2.8)% 3.87 3.72 (0.15)
Total 3,792$ 3,834$ 1.1 % 26.82$ 26.87$ 0.05 $
Average Residential Property Value: 61,460 $ 59,213 $
Estimated Tax Per Average Residential Property 16 $ 16 $
Requisition Estimated Tax (per $100K)
Property Tax Requisition
Estimated 5‐Year Forecast
Service Function 2019
Actual
2020
Budget
2021
Budget
2022
Budget
2023
Budget
2024
Budget
Member Municipalities:
100 ‐ Member Municipality Administration 566$ 655 $ 711$ 723$ 735$ 748$
Corporate Services:
110 ‐ Administration and General Government 1,243 1,261 1,460 1,504 1,525 1,558
Regional Services:
149 ‐ Regional Broadband 423 394 394 103 ‐ (241)
150 ‐ Regional Feasibility Studies 19 ‐ ‐ 0 0 0
272 ‐ Strathcona Emergency Program 1,000 1,000 1,000 1,000 1,000 1,000
275 ‐ 911 Emergency Answering Service 540 525 561 580 592 596
Total Requisition 3,792$ 3,834$ 4,126$ 3,910$ 3,852$ 3,661$
Estimated Tax per $100,000 Assessed Value 26.82 $ 26.87 $ 28.91 $ 27.41 $ 27.01 $ 25.68 $
Increase/(Decrease) per $100,000 Assessed Value 0.05 $ 2.04 $ (1.50) $ (0.40) $ (1.33) $
25
Function 100 – Member Municipality Administration
2020‐2024 APPROVED FINANCIAL PLAN
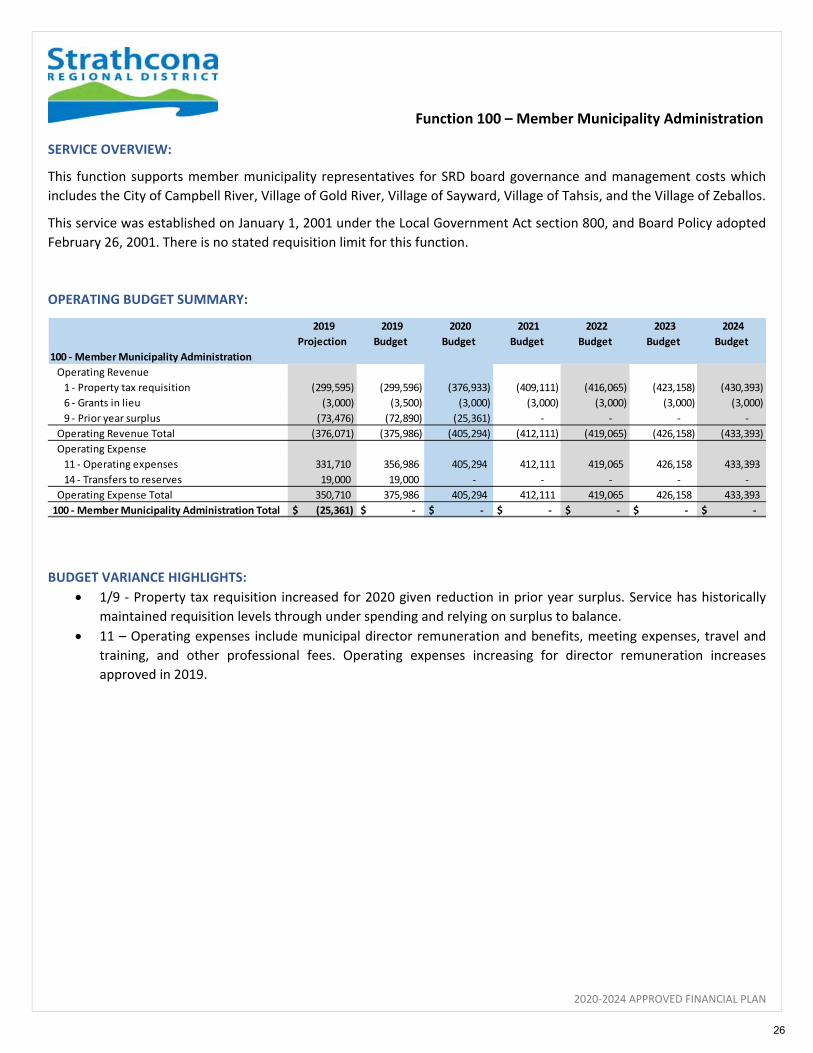
SERVICE OVERVIEW:
This function supports member municipality representatives for SRD board governance and management costs which
includes the City of Campbell River, Village of Gold River, Village of Sayward, Village of Tahsis, and the Village of Zeballos.
This service was established on January 1, 2001 under the Local Government Act section 800, and Board Policy adopted
February 26, 2001. There is no stated requisition limit for this function.
OPERATING BUDGET SUMMARY:
BUDGET VARIANCE HIGHLIGHTS:
1/9 ‐ Property tax requisition increased for 2020 given reduction in prior year surplus. Service has historically
maintained requisition levels through under spending and relying on surplus to balance.
11 – Operating expenses include municipal director remuneration and benefits, meeting expenses, travel and
training, and other professional fees. Operating expenses increasing for director remuneration increases
approved in 2019.
2019
Projection
2019
Budget
2020
Budget
2021
Budget
2022
Budget
2023
Budget
2024
Budget
100 ‐ Member Municipality Administration
Operating Revenue
1 ‐ Property tax requisition (299,595) (299,596) (376,933) (409,111) (416,065) (423,158) (430,393)
6 ‐ Grants in lieu (3,000) (3,500) (3,000) (3,000) (3,000) (3,000) (3,000)
9 ‐ Prior year surplus (73,476) (72,890) (25,361) ‐ ‐ ‐ ‐
Operating Revenue Total (376,071) (375,986) (405,294) (412,111) (419,065) (426,158) (433,393)
Operating Expense
11 ‐ Operating expenses 331,710 356,986 405,294 412,111 419,065 426,158 433,393
14 ‐ Transfers to reserves 19,000 19,000 ‐ ‐ ‐ ‐ ‐
Operating Expense Total 350,710 375,986 405,294 412,111 419,065 426,158 433,393
100 ‐ Member Municipality Administration Total $ (25,361) $ ‐ $ ‐ $ ‐ $ ‐ $ ‐ $ ‐
26
Function 100 – Member Municipality Administration
2020‐2024 APPROVED FINANCIAL PLAN
TAX REQUISITION SUMMARY:
RESERVE SUMMARY:
SERVICE GOALS IN 2020/2021
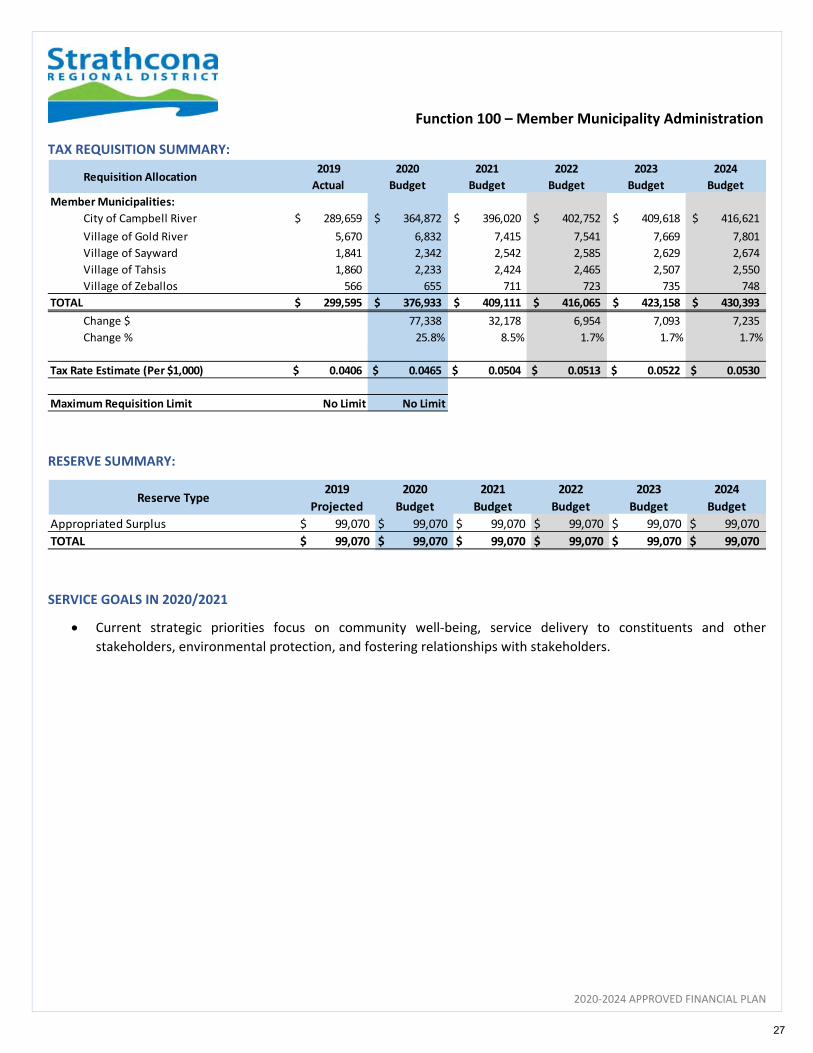
Current strategic priorities focus on community well‐being, service delivery to constituents and other
stakeholders, environmental protection, and fostering relationships with stakeholders.
Requisition Allocation2019
Actual
2020
Budget
2021
Budget
2022
Budget
2023
Budget
2024
Budget
Member Municipalities:
City of Campbell River 289,659$ 364,872$ 396,020$ 402,752$ 409,618$ 416,621$
Village of Gold River 5,670 6,832 7,415 7,541 7,669 7,801
Village of Sayward 1,841 2,342 2,542 2,585 2,629 2,674
Village of Tahsis 1,860 2,233 2,424 2,465 2,507 2,550
Village of Zeballos 566 655 711 723 735 748
TOTAL 299,595$ 376,933$ 409,111$ 416,065$ 423,158$ 430,393$
Change $ 77,338 32,178 6,954 7,093 7,235
Change % 25.8% 8.5% 1.7% 1.7% 1.7%
Tax Rate Estimate (Per $1,000) 0.0406 $ 0.0465 $ 0.0504 $ 0.0513 $ 0.0522 $ 0.0530 $
Maximum Requisition Limit No Limit No Limit
Reserve Type2019
Projected
2020
Budget
2021
Budget
2022
Budget
2023
Budget
2024
Budget
Appropriated Surplus 99,070$ 99,070$ 99,070$ 99,070$ 99,070$ 99,070$
TOTAL 99,070$ 99,070$ 99,070$ 99,070$ 99,070$ 99,070$
27
Function 190‐196 – Member Municipality Debt Payments
2020‐2024 APPROVED FINANCIAL PLAN
SERVICE OVERVIEW:
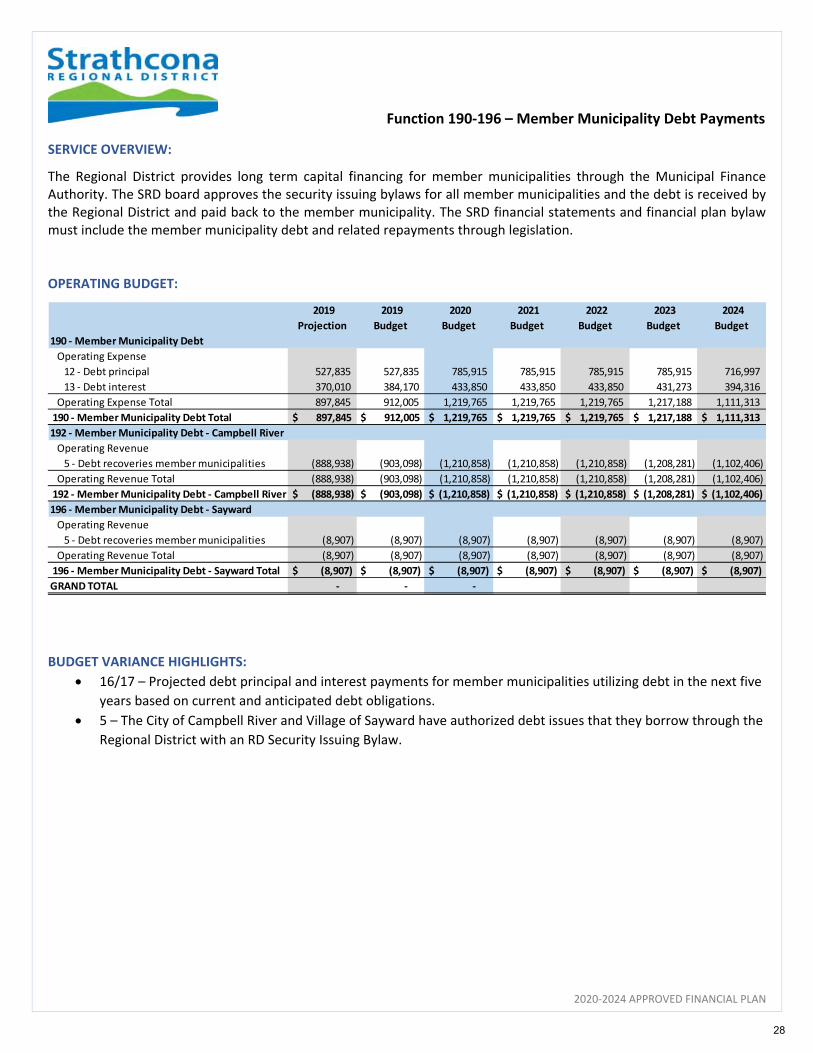
The Regional District provides long term capital financing for member municipalities through the Municipal Finance Authority. The SRD board approves the security issuing bylaws for all member municipalities and the debt is received by the Regional District and paid back to the member municipality. The SRD financial statements and financial plan bylaw must include the member municipality debt and related repayments through legislation. OPERATING BUDGET:
BUDGET VARIANCE HIGHLIGHTS:
16/17 – Projected debt principal and interest payments for member municipalities utilizing debt in the next five
years based on current and anticipated debt obligations.
5 – The City of Campbell River and Village of Sayward have authorized debt issues that they borrow through the
Regional District with an RD Security Issuing Bylaw.
2019
Projection
2019
Budget
2020
Budget
2021
Budget
2022
Budget
2023
Budget
2024
Budget
190 ‐ Member Municipality Debt
Operating Expense
12 ‐ Debt principal 527,835 527,835 785,915 785,915 785,915 785,915 716,997
13 ‐ Debt interest 370,010 384,170 433,850 433,850 433,850 431,273 394,316
Operating Expense Total 897,845 912,005 1,219,765 1,219,765 1,219,765 1,217,188 1,111,313
190 ‐ Member Municipality Debt Total $ 897,845 $ 912,005 $ 1,219,765 $ 1,219,765 $ 1,219,765 $ 1,217,188 $ 1,111,313
192 ‐ Member Municipality Debt ‐ Campbell River
Operating Revenue
5 ‐ Debt recoveries member municipalities (888,938) (903,098) (1,210,858) (1,210,858) (1,210,858) (1,208,281) (1,102,406)
Operating Revenue Total (888,938) (903,098) (1,210,858) (1,210,858) (1,210,858) (1,208,281) (1,102,406)
192 ‐ Member Municipality Debt ‐ Campbell River $ (888,938) $ (903,098) $ (1,210,858) $ (1,210,858) $ (1,210,858) $ (1,208,281) $ (1,102,406)
196 ‐ Member Municipality Debt ‐ Sayward
Operating Revenue
5 ‐ Debt recoveries member municipalities (8,907) (8,907) (8,907) (8,907) (8,907) (8,907) (8,907)
Operating Revenue Total (8,907) (8,907) (8,907) (8,907) (8,907) (8,907) (8,907)
196 ‐ Member Municipality Debt ‐ Sayward Total $ (8,907) $ (8,907) $ (8,907) $ (8,907) $ (8,907) $ (8,907) $ (8,907)
GRAND TOTAL ‐ ‐ ‐
28
2020‐2024 APPROVED FINANCIAL PLAN
Corporate Services
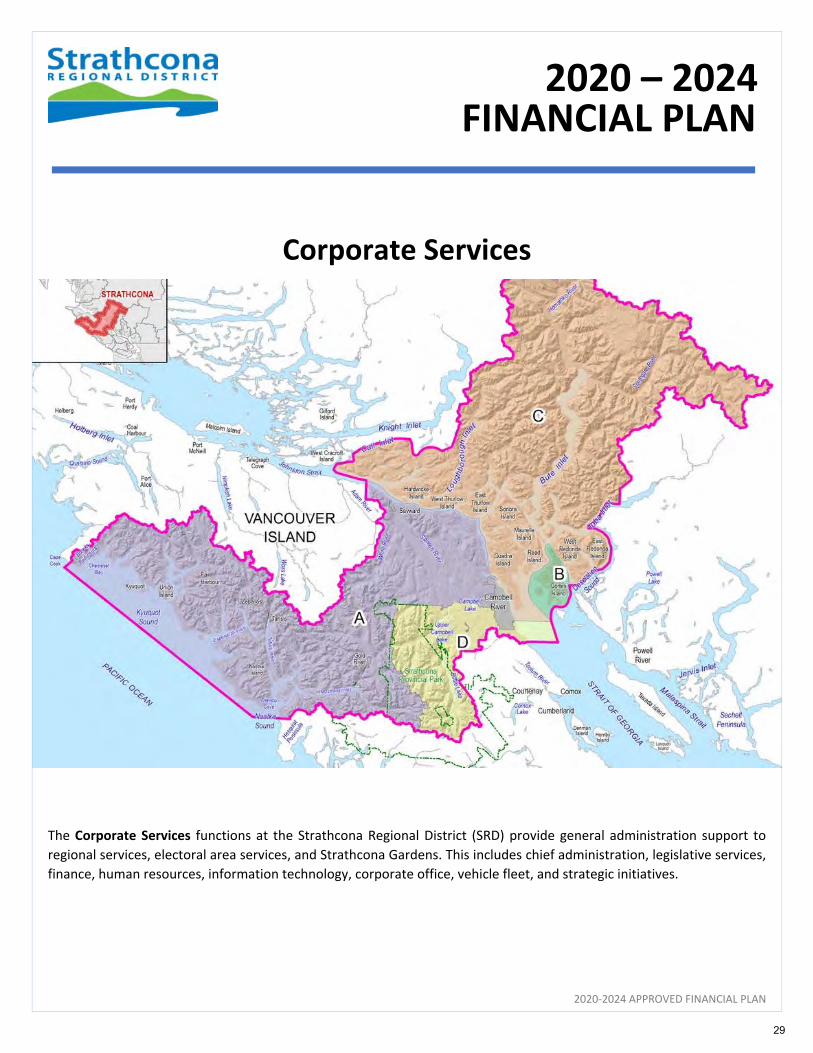
The Corporate Services functions at the Strathcona Regional District (SRD) provide general administration support to
regional services, electoral area services, and Strathcona Gardens. This includes chief administration, legislative services,
finance, human resources, information technology, corporate office, vehicle fleet, and strategic initiatives.
FINANCIAL PLAN
2020 – 2024
Rebecca Spit, Quadra Island
29
Corporate Services Summary
2020‐2024 APPROVED FINANCIAL PLAN
Corporate Services includes the following functions:
Function # ‐ Function Description
110 ‐ Administration ‐ General Government
111 ‐ Administration ‐ Management Services
113 ‐ Administration ‐ Financial Services
114 ‐ Administration ‐ Corporate Office Space
115 ‐ Administration ‐ Human Resources
116 ‐ Administration ‐ Corporate Office Space
117 ‐ Administration ‐ Vehicle Pool
118 ‐ Administration ‐ Strategic Initiatives
119 ‐ Administration ‐ Fiscal Services & Capital
30

Corporate Services Summary
2020‐2024 APPROVED FINANCIAL PLAN
OPERATING BUDGET SUMMARY:
CAPITAL BUDGET SUMMARY:
2019
Projection
2019
Budget
2020
Budget
2021
Budget
2022
Budget
2023
Budget
2024
Budget
110 ‐ Administration ‐ General Government (3,345,693)$ (3,251,446) (3,145,415) (2,866,100) (2,926,542) (2,968,133) (3,020,912)
111 ‐ Administration ‐ Management Services 1,197,840 1,344,272 1,146,701 1,135,778 1,154,431 1,173,457 1,192,864
113 ‐ Administration ‐ Financial Services 616,618 619,849 648,067 662,705 677,709 693,088 708,851
114 ‐ Administration ‐ Corporate Office Space 150,526 96,385 117,101 103,976 106,472 109,092 111,844
115 ‐ Administration ‐ Human Resources ‐ ‐ 227,622 211,533 224,501 217,529 220,618
116 ‐ Administration ‐ Information Services 468,433 469,604 483,683 493,440 503,482 513,710 524,134
117 ‐ Administration ‐ Vehicle Pool 8,072 10,200 ‐ ‐ ‐ ‐ ‐
118 ‐ Administration ‐ Strategic Initiatives 243,632 461,136 372,241 208,668 209,947 211,257 212,601
119 ‐ Administration ‐ Fiscal Services & 250,000 250,000 150,000 50,000 50,000 50,000 50,000
Grand Total (410,573)$ ‐$ ‐$ ‐$ ‐$ ‐$ ‐$
Function
Project Title2020
CFWD
2020
Budget
2021
Budget
2022
Budget
2023
Budget
2024
BudgetFunding
Records Management System $ 105,000 $ ‐ $ ‐ $ ‐ $ ‐ $ ‐ Reserves
Speaker Queue System / Clocks 10,000 ‐ ‐ ‐ ‐ ‐ Reserves
Multi‐Device Replacement 30,000 ‐ ‐ ‐ ‐ ‐ Reserves
Director Information Portal 12,606 ‐ ‐ ‐ ‐ ‐ Reserves
990 Cedar St Building Renovations 45,824 ‐ ‐ ‐ ‐ ‐ Reserves
New Corporate Vehicle ‐ 35,000 ‐ ‐ ‐ ‐ Reserves
2012 Ford Escape SUV Replacement ‐ ‐ 35,000 ‐ ‐ ‐ Reserves
IT Infrastructure Replacements ‐ 15,000 15,000 15,000 50,000 30,000 Reserves
Workstation Replacements ‐ 15,000 15,000 15,000 15,000 15,000 Reserves
Asset Management Software 50,000 ‐ ‐ ‐ ‐ ‐ Reserves
External Website Development ‐ ‐ ‐ ‐ 20,000 ‐ Reserves
TOTAL 253,430$ 65,000$ 65,000$ 30,000$ 85,000$ 45,000$
2020 ‐ 2024 FUNDED PROJECTS
31
Function 110 – Administration ‐ General Government
2020‐2024 APPROVED FINANCIAL PLAN
SERVICE OVERVIEW:
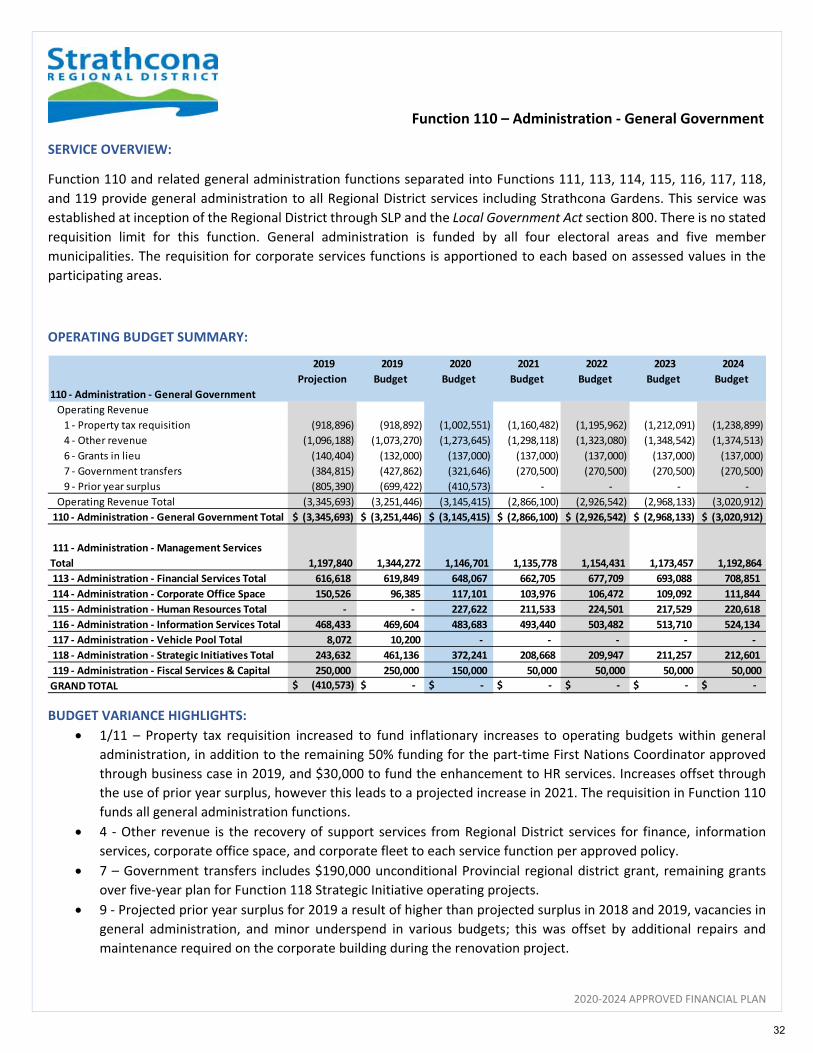
Function 110 and related general administration functions separated into Functions 111, 113, 114, 115, 116, 117, 118,
and 119 provide general administration to all Regional District services including Strathcona Gardens. This service was
established at inception of the Regional District through SLP and the Local Government Act section 800. There is no stated
requisition limit for this function. General administration is funded by all four electoral areas and five member
municipalities. The requisition for corporate services functions is apportioned to each based on assessed values in the
participating areas.
OPERATING BUDGET SUMMARY:
BUDGET VARIANCE HIGHLIGHTS:
1/11 – Property tax requisition increased to fund inflationary increases to operating budgets within general
administration, in addition to the remaining 50% funding for the part‐time First Nations Coordinator approved
through business case in 2019, and $30,000 to fund the enhancement to HR services. Increases offset through
the use of prior year surplus, however this leads to a projected increase in 2021. The requisition in Function 110
funds all general administration functions.
4 ‐ Other revenue is the recovery of support services from Regional District services for finance, information
services, corporate office space, and corporate fleet to each service function per approved policy.
7 – Government transfers includes $190,000 unconditional Provincial regional district grant, remaining grants
over five‐year plan for Function 118 Strategic Initiative operating projects.
9 ‐ Projected prior year surplus for 2019 a result of higher than projected surplus in 2018 and 2019, vacancies in
general administration, and minor underspend in various budgets; this was offset by additional repairs and
maintenance required on the corporate building during the renovation project.
2019
Projection
2019
Budget
2020
Budget
2021
Budget
2022
Budget
2023
Budget
2024
Budget
110 ‐ Administration ‐ General Government
Operating Revenue
1 ‐ Property tax requisition (918,896) (918,892) (1,002,551) (1,160,482) (1,195,962) (1,212,091) (1,238,899)
4 ‐ Other revenue (1,096,188) (1,073,270) (1,273,645) (1,298,118) (1,323,080) (1,348,542) (1,374,513)
6 ‐ Grants in lieu (140,404) (132,000) (137,000) (137,000) (137,000) (137,000) (137,000)
7 ‐ Government transfers (384,815) (427,862) (321,646) (270,500) (270,500) (270,500) (270,500)
9 ‐ Prior year surplus (805,390) (699,422) (410,573) ‐ ‐ ‐ ‐
Operating Revenue Total (3,345,693) (3,251,446) (3,145,415) (2,866,100) (2,926,542) (2,968,133) (3,020,912)
110 ‐ Administration ‐ General Government Total $ (3,345,693) $ (3,251,446) $ (3,145,415) $ (2,866,100) $ (2,926,542) $ (2,968,133) $ (3,020,912)
111 ‐ Administration ‐ Management Services
Total 1,197,840 1,344,272 1,146,701 1,135,778 1,154,431 1,173,457 1,192,864
113 ‐ Administration ‐ Financial Services Total 616,618 619,849 648,067 662,705 677,709 693,088 708,851
114 ‐ Administration ‐ Corporate Office Space 150,526 96,385 117,101 103,976 106,472 109,092 111,844
115 ‐ Administration ‐ Human Resources Total ‐ ‐ 227,622 211,533 224,501 217,529 220,618
116 ‐ Administration ‐ Information Services Total 468,433 469,604 483,683 493,440 503,482 513,710 524,134
117 ‐ Administration ‐ Vehicle Pool Total 8,072 10,200 ‐ ‐ ‐ ‐ ‐
118 ‐ Administration ‐ Strategic Initiatives Total 243,632 461,136 372,241 208,668 209,947 211,257 212,601
119 ‐ Administration ‐ Fiscal Services & Capital 250,000 250,000 150,000 50,000 50,000 50,000 50,000
GRAND TOTAL $ (410,573) $ ‐ $ ‐ $ ‐ $ ‐ $ ‐ $ ‐
32
Function 110 – Administration ‐ General Government
2020‐2024 APPROVED FINANCIAL PLAN
TAX REQUISITION SUMMARY:
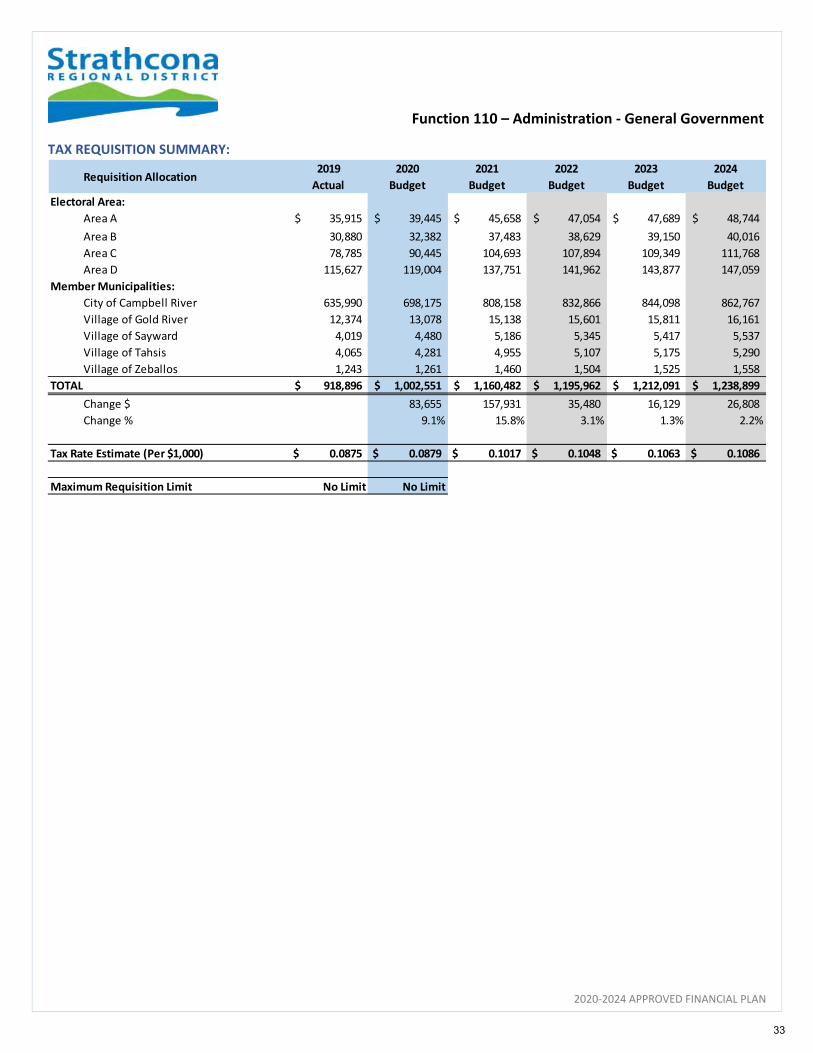
Requisition Allocation2019
Actual
2020
Budget
2021
Budget
2022
Budget
2023
Budget
2024
Budget
Electoral Area:
Area A 35,915$ 39,445$ 45,658$ 47,054$ 47,689$ 48,744$
Area B 30,880 32,382 37,483 38,629 39,150 40,016
Area C 78,785 90,445 104,693 107,894 109,349 111,768
Area D 115,627 119,004 137,751 141,962 143,877 147,059
Member Municipalities:
City of Campbell River 635,990 698,175 808,158 832,866 844,098 862,767
Village of Gold River 12,374 13,078 15,138 15,601 15,811 16,161
Village of Sayward 4,019 4,480 5,186 5,345 5,417 5,537
Village of Tahsis 4,065 4,281 4,955 5,107 5,175 5,290
Village of Zeballos 1,243 1,261 1,460 1,504 1,525 1,558
TOTAL 918,896$ 1,002,551$ 1,160,482$ 1,195,962$ 1,212,091$ 1,238,899$
Change $ 83,655 157,931 35,480 16,129 26,808
Change % 9.1% 15.8% 3.1% 1.3% 2.2%
Tax Rate Estimate (Per $1,000) 0.0875 $ 0.0879 $ 0.1017 $ 0.1048 $ 0.1063 $ 0.1086 $
Maximum Requisition Limit No Limit No Limit
33
Function 110 – Administration ‐ General Government
2020‐2024 APPROVED FINANCIAL PLAN
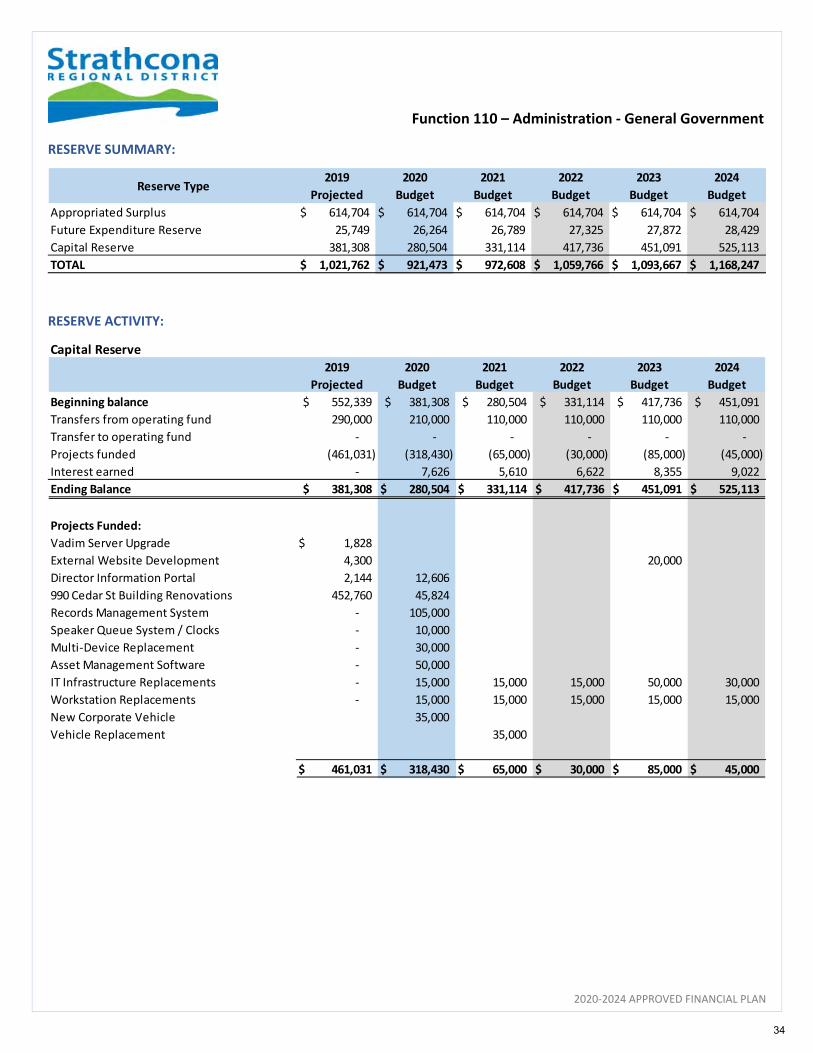
RESERVE SUMMARY:
RESERVE ACTIVITY:
Reserve Type2019
Projected2020
Budget2021
Budget2022
Budget2023
Budget2024
BudgetAppropriated Surplus 614,704$ 614,704$ 614,704$ 614,704$ 614,704$ 614,704$
Future Expenditure Reserve 25,749 26,264 26,789 27,325 27,872 28,429
Capital Reserve 381,308 280,504 331,114 417,736 451,091 525,113
TOTAL 1,021,762$ 921,473$ 972,608$ 1,059,766$ 1,093,667$ 1,168,247$
Capital Reserve2019
Projected2020
Budget2021
Budget2022
Budget2023
Budget2024
BudgetBeginning balance 552,339$ 381,308$ 280,504$ 331,114$ 417,736$ 451,091$ Transfers from operating fund 290,000 210,000 110,000 110,000 110,000 110,000
Transfer to operating fund ‐ ‐ ‐ ‐ ‐ ‐
Projects funded (461,031) (318,430) (65,000) (30,000) (85,000) (45,000)
Interest earned ‐ 7,626 5,610 6,622 8,355 9,022
Ending Balance 381,308$ 280,504$ 331,114$ 417,736$ 451,091$ 525,113$
Projects Funded:Vadim Server Upgrade 1,828$
External Website Development 4,300 20,000
Director Information Portal 2,144 12,606
990 Cedar St Building Renovations 452,760 45,824
Records Management System ‐ 105,000
Speaker Queue System / Clocks ‐ 10,000
Multi‐Device Replacement ‐ 30,000
Asset Management Software ‐ 50,000
IT Infrastructure Replacements ‐ 15,000 15,000 15,000 50,000 30,000
Workstation Replacements ‐ 15,000 15,000 15,000 15,000 15,000
New Corporate Vehicle 35,000
Vehicle Replacement 35,000
461,031$ 318,430$ 65,000$ 30,000$ 85,000$ 45,000$
34

Function 110 – Administration ‐ General Government
2020‐2024 APPROVED FINANCIAL PLAN
DEBT BALANCE SUMMARY:
DEBT ACTIVITY:
SERVICE GOALS IN 2020/2021:
Continue to support the Regional District board and related staff to achieve the strategic priorities of the board
and continue ongoing enhancement to services and work to sustainable service delivery through best practices.
Debt Type2019
Actual
2020
Budget
2021
Budget
2022
Budget
2023
Budget
2024
Budget
Long Term Debt Balance 1,999,235$ 1,955,023$ 1,909,484$ 1,862,579$ 1,814,267$ 1,764,506$
TOTAL 1,999,235$ 1,955,023$ 1,909,484$ 1,862,579$ 1,814,267$ 1,764,506$
Long‐Term Debt 2019
Actual
2020
Budget
2021
Budget
2022
Budget
2023
Budget
2024
Budget
Beginning balance 2,042,160$ 1,999,235$ 1,955,023$ 1,909,484$ 1,862,579$ 1,814,267$
Debt draws ‐ ‐ ‐ ‐ ‐ ‐
Actuarial adjustments ‐ (1,288) (2,614) (3,980) (5,387) (6,837)
Debt principal payments (42,925) (42,925) (42,925) (42,925) (42,925) (42,925)
Ending Balance 1,999,235$ 1,955,023$ 1,909,484$ 1,862,579$ 1,814,267$ 1,764,506$
Debt principal payments 42,925 42,925 42,925 42,925 42,925 42,925
Debt interest payments 65,349 65,349 65,349 65,349 65,349 65,349
Annual Debt Payments 108,274$ 108,274$ 108,274$ 108,274$ 108,274$ 108,274$
35
Function 111 – Administration ‐ Management Services
2020‐2024 APPROVED FINANCIAL PLAN
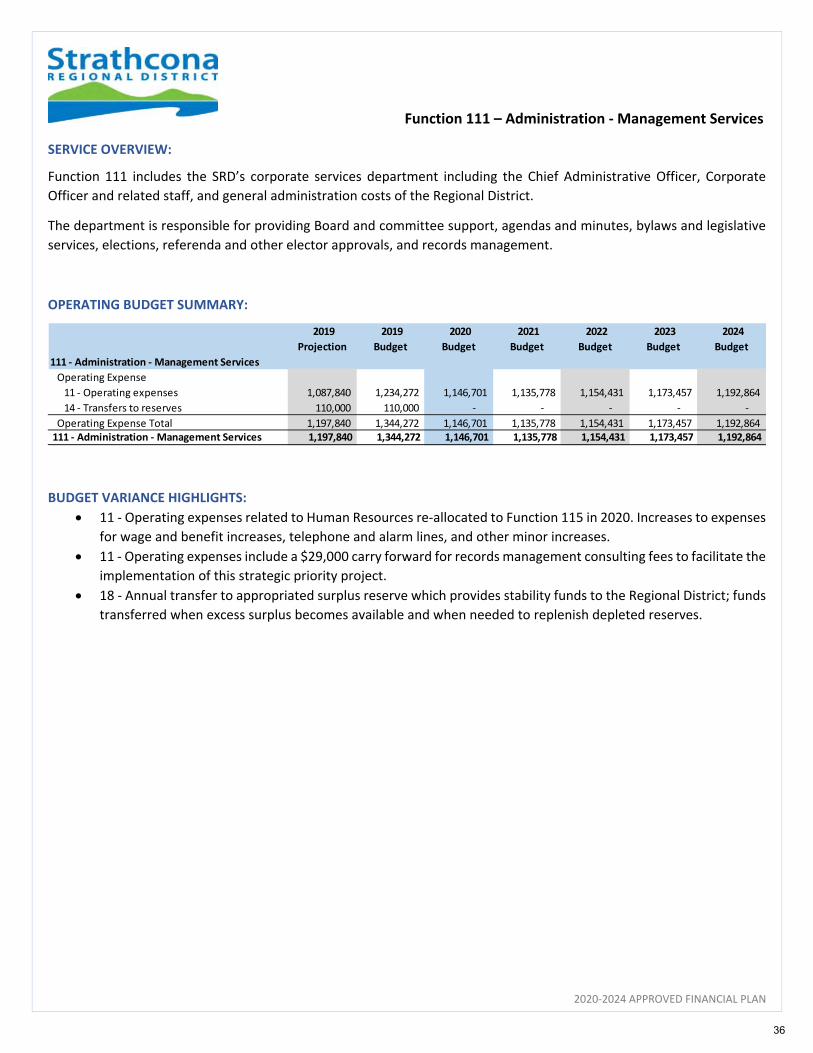
SERVICE OVERVIEW:
Function 111 includes the SRD’s corporate services department including the Chief Administrative Officer, Corporate
Officer and related staff, and general administration costs of the Regional District.
The department is responsible for providing Board and committee support, agendas and minutes, bylaws and legislative
services, elections, referenda and other elector approvals, and records management.
OPERATING BUDGET SUMMARY:
BUDGET VARIANCE HIGHLIGHTS:
11 ‐ Operating expenses related to Human Resources re‐allocated to Function 115 in 2020. Increases to expenses
for wage and benefit increases, telephone and alarm lines, and other minor increases.
11 ‐ Operating expenses include a $29,000 carry forward for records management consulting fees to facilitate the
implementation of this strategic priority project.
18 ‐ Annual transfer to appropriated surplus reserve which provides stability funds to the Regional District; funds
transferred when excess surplus becomes available and when needed to replenish depleted reserves.
2019
Projection
2019
Budget
2020
Budget
2021
Budget
2022
Budget
2023
Budget
2024
Budget
111 ‐ Administration ‐ Management Services
Operating Expense
11 ‐ Operating expenses 1,087,840 1,234,272 1,146,701 1,135,778 1,154,431 1,173,457 1,192,864
14 ‐ Transfers to reserves 110,000 110,000 ‐ ‐ ‐ ‐ ‐
Operating Expense Total 1,197,840 1,344,272 1,146,701 1,135,778 1,154,431 1,173,457 1,192,864 111 ‐ Administration ‐ Management Services 1,197,840 1,344,272 1,146,701 1,135,778 1,154,431 1,173,457 1,192,864
36

Function 111 – Administration ‐ Management Services
2020‐2024 APPROVED FINANCIAL PLAN
CAPITAL BUDGET:
SERVICE GOALS IN 2020/2021:
Complete the projects on the capital plan including implementation of a records management system, speaker
queue system/clocks, printer and peripheral replacement for the 3rd floor, director information portal.
Complete the bylaw audit process to determine status of bylaws inherited from Comox‐Strathcona Regional
District.
Continue negotiations with CVRD to obtain records withheld when the SRD was created.
Development of director resource guide and improved Board meeting tracking system.
Project Title2020
CFWD
2020
Budget
2021
Budget
2022
Budget
2023
Budget
2024
BudgetFunding
Records Management System $ 105,000 $ ‐ $ ‐ $ ‐ $ ‐ $ ‐ Reserves
Speaker Queue System / Clocks 10,000 ‐ ‐ ‐ ‐ ‐ Reserves
Multi‐Device Replacement 30,000 ‐ ‐ ‐ ‐ ‐ Reserves
Director Information Portal 12,606 ‐ ‐ ‐ ‐ ‐ Reserves
TOTAL 157,606$ ‐$ ‐$ ‐$ ‐$ ‐$
2020 ‐ 2024 FUNDED PROJECTS
Will relieve Chair of managing speaker priorities via paper and to synchronize clocks throughout SRD offices to improve
efficiency of Board and committee meetings.
Development of records management system to improve efficiency and productivity, and to facilitate compliance with
FOIPPA legislation.
Replacement of outdated printing and copying equipment at SRD corporate office to minimize downtime caused by
serviceability issues.
One‐stop portal for Director access to agendas, minutes, media releases, convention information, etc. Improved efficiency
for directors and staff.
37

Function 113 – Administration ‐ Financial Services
2020‐2024 APPROVED FINANCIAL PLAN
SERVICE OVERVIEW:
Function 113 is responsible for all financial matters at the Regional District including financial planning, reporting, grant
management, asset management reporting, purchasing and procurement policy, utility billings, accounts receivable,
accounts payable, payroll, and all required senior government financial filings.
OPERATING BUDGET SUMMARY:
BUDGET VARIANCE HIGHLIGHTS:
11 – The operational budget includes increases for wages and benefits.
CAPITAL BUDGET:
SERVICE GOALS IN 2020/2021:
Continue to streamline and enhance financial planning and reporting processes.
Review asset management software options and best practices.
Continue to focus on cross‐training between staff to provide redundancy and ongoing service delivery, as well as
provide enhancement opportunities for staff.
2019
Projection
2019
Budget
2020
Budget
2021
Budget
2022
Budget
2023
Budget
2024
Budget
113 ‐ Administration ‐ Financial Services
Operating Expense
11 ‐ Operating expenses 616,618 619,849 648,067 662,705 677,709 693,088 708,851
Operating Expense Total 616,618 619,849 648,067 662,705 677,709 693,088 708,851
113 ‐ Administration ‐ Financial Services Total $ 616,618 $ 619,849 $ 648,067 $ 662,705 $ 677,709 $ 693,088 $ 708,851
Project Title2020
CFWD
2020
Budget
2021
Budget
2022
Budget
2023
Budget
2024
BudgetFunding
Asset Management Software $ 50,000 $ ‐ $ ‐ $ ‐ $ ‐ $ ‐ Reserves
TOTAL 50,000$ ‐$ ‐$ ‐$ ‐$ ‐$
Database software to better facilitate corporate wide asset management efforts .
2020 ‐ 2024 FUNDED PROJECTS
Project Title2020
Budget
2021
Budget
2022
Budget
2023
Budget
2024
BudgetFunding
Budget Software $ ‐ $ ‐ $ ‐ $ 50,000 $ ‐ Reserves
TOTAL ‐$ ‐$ ‐$ 50,000$ ‐$
Future consideration to streamline the budget process for finance and budget managers is to purchase and install budgeting
software. Questica or other option.
2020 ‐ 2024 UNFUNDED FUTURE PROJECTS
38
Function 114 – Administration ‐ Corporate Office Space
2020‐2024 APPROVED FINANCIAL PLAN
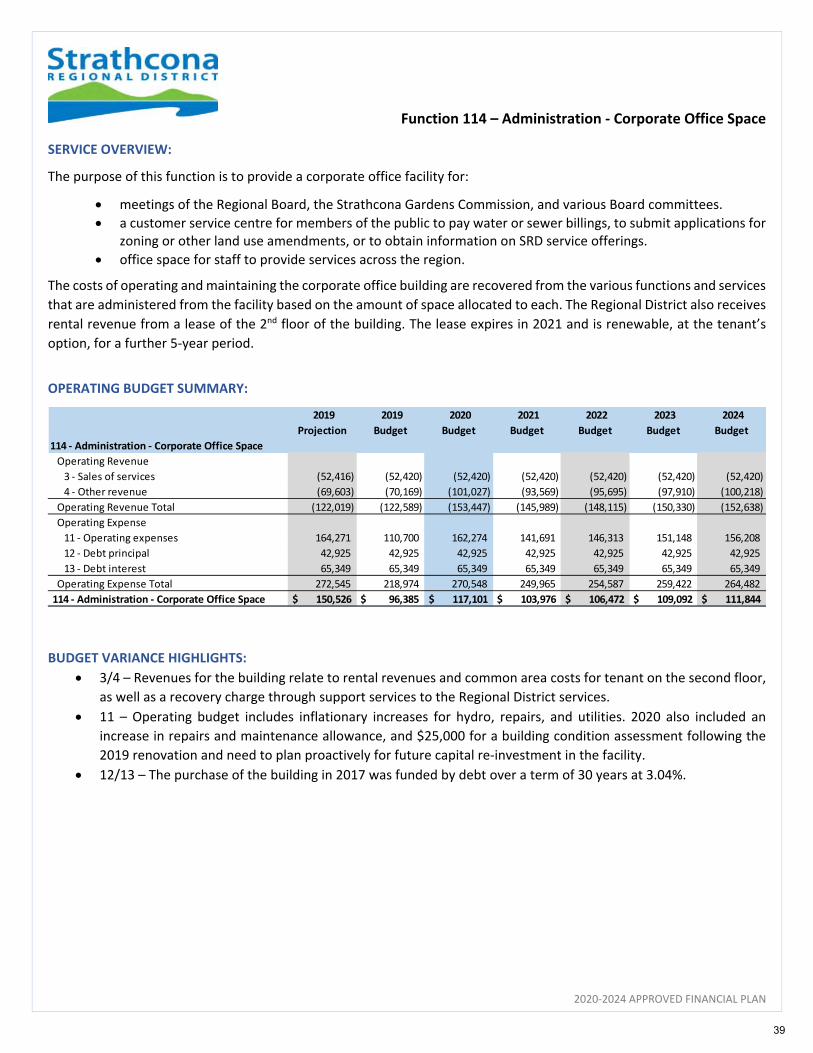
SERVICE OVERVIEW:
The purpose of this function is to provide a corporate office facility for:
meetings of the Regional Board, the Strathcona Gardens Commission, and various Board committees.
a customer service centre for members of the public to pay water or sewer billings, to submit applications for zoning or other land use amendments, or to obtain information on SRD service offerings.
office space for staff to provide services across the region.
The costs of operating and maintaining the corporate office building are recovered from the various functions and services
that are administered from the facility based on the amount of space allocated to each. The Regional District also receives
rental revenue from a lease of the 2nd floor of the building. The lease expires in 2021 and is renewable, at the tenant’s
option, for a further 5‐year period.
OPERATING BUDGET SUMMARY:
BUDGET VARIANCE HIGHLIGHTS:
3/4 – Revenues for the building relate to rental revenues and common area costs for tenant on the second floor,
as well as a recovery charge through support services to the Regional District services.
11 – Operating budget includes inflationary increases for hydro, repairs, and utilities. 2020 also included an
increase in repairs and maintenance allowance, and $25,000 for a building condition assessment following the
2019 renovation and need to plan proactively for future capital re‐investment in the facility.
12/13 – The purchase of the building in 2017 was funded by debt over a term of 30 years at 3.04%.
2019
Projection
2019
Budget
2020
Budget
2021
Budget
2022
Budget
2023
Budget
2024
Budget
114 ‐ Administration ‐ Corporate Office Space
Operating Revenue
3 ‐ Sales of services (52,416) (52,420) (52,420) (52,420) (52,420) (52,420) (52,420)
4 ‐ Other revenue (69,603) (70,169) (101,027) (93,569) (95,695) (97,910) (100,218)
Operating Revenue Total (122,019) (122,589) (153,447) (145,989) (148,115) (150,330) (152,638)
Operating Expense
11 ‐ Operating expenses 164,271 110,700 162,274 141,691 146,313 151,148 156,208
12 ‐ Debt principal 42,925 42,925 42,925 42,925 42,925 42,925 42,925
13 ‐ Debt interest 65,349 65,349 65,349 65,349 65,349 65,349 65,349
Operating Expense Total 272,545 218,974 270,548 249,965 254,587 259,422 264,482
114 ‐ Administration ‐ Corporate Office Space $ 150,526 $ 96,385 $ 117,101 $ 103,976 $ 106,472 $ 109,092 $ 111,844
39
Function 114 – Administration ‐ Corporate Office Space
2020‐2024 APPROVED FINANCIAL PLAN
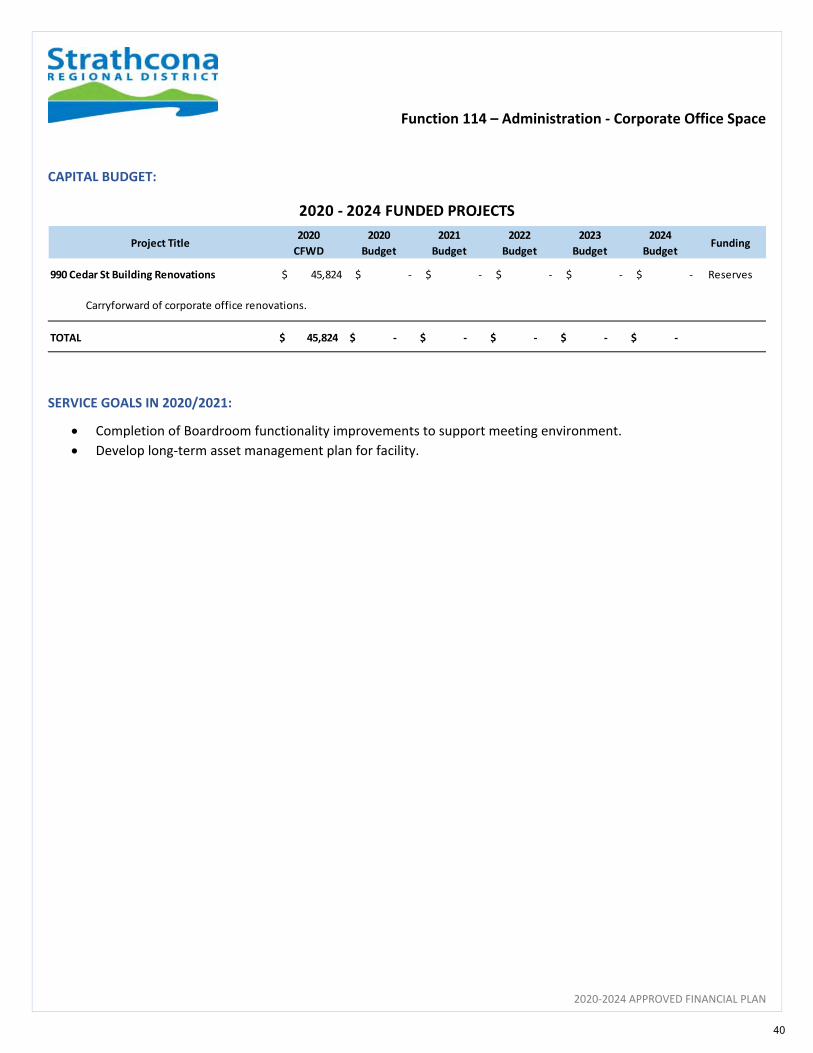
CAPITAL BUDGET:
SERVICE GOALS IN 2020/2021:
Completion of Boardroom functionality improvements to support meeting environment.
Develop long‐term asset management plan for facility.
Project Title2020
CFWD
2020
Budget
2021
Budget
2022
Budget
2023
Budget
2024
BudgetFunding
990 Cedar St Building Renovations $ 45,824 $ ‐ $ ‐ $ ‐ $ ‐ $ ‐ Reserves
TOTAL 45,824$ ‐$ ‐$ ‐$ ‐$ ‐$
Carryforward of corporate office renovations.
2020 ‐ 2024 FUNDED PROJECTS
40

Function 115 – Administration ‐ Human Resources
2020‐2024 APPROVED FINANCIAL PLAN
SERVICE OVERVIEW:
Function 115 is responsible for all human resource matters at the Regional District including labour and employee relations; recruiting and onboarding; compensation and benefits; performance management; training and development; and health, safety and wellness. This function is not new, rather is being separated from Function 111 ‐ Administration ‐ Management Services for 2020 and beyond to allow for more detailed budgeting and planning activities. OPERATING BUDGET SUMMARY:
BUDGET VARIANCE HIGHLIGHTS:
11 ‐ Budget established separately from Function 111 ‐ Administration services starting in 2020. $30,000 increase
as approved through business case for HR service enhancement as well as a $17,000 carryforward from 2019 to
complete the safety review.
11 – Business case impact to average home is estimated to be $0.2630 per $100,000 of assessed value.
CAPITAL BUDGET:
SERVICE GOALS FOR 2020/2021:
Streamlining processes and procedures.
Strathcona Gardens union contract negotiations.
Continue public education/information, staff recognition, and wellness programs.
2019
Projection
2019
Budget
2020
Budget
2021
Budget
2022
Budget
2023
Budget
2024
Budget
115 ‐ Administration ‐ Human Resources
Operating Expense
11 ‐ Operating expenses ‐ ‐ 227,622 211,533 224,501 217,529 220,618
Operating Expense Total ‐ ‐ 227,622 211,533 224,501 217,529 220,618
115 ‐ Administration ‐ Human Resources Total $ ‐ $ ‐ $ 227,622 $ 211,533 $ 224,501 $ 217,529 $ 220,618
Project Title2020
Budget
2021
Budget
2022
Budget
2023
Budget
2024
BudgetFunding
Human Resources Information System (HRIS) $ ‐ $ 30,000 $ ‐ $ ‐ $ ‐ TBD
TOTAL ‐$ 30,000$ ‐$ ‐$ ‐$
2020 ‐ 2024 UNFUNDED FUTURE PROJECTS
To provide HR the ability to automate operational tasks and unify employee data in a single electronic system.
41
Function 116 – Administration ‐ Information Services
2020‐2024 APPROVED FINANCIAL PLAN
SERVICE OVERVIEW:
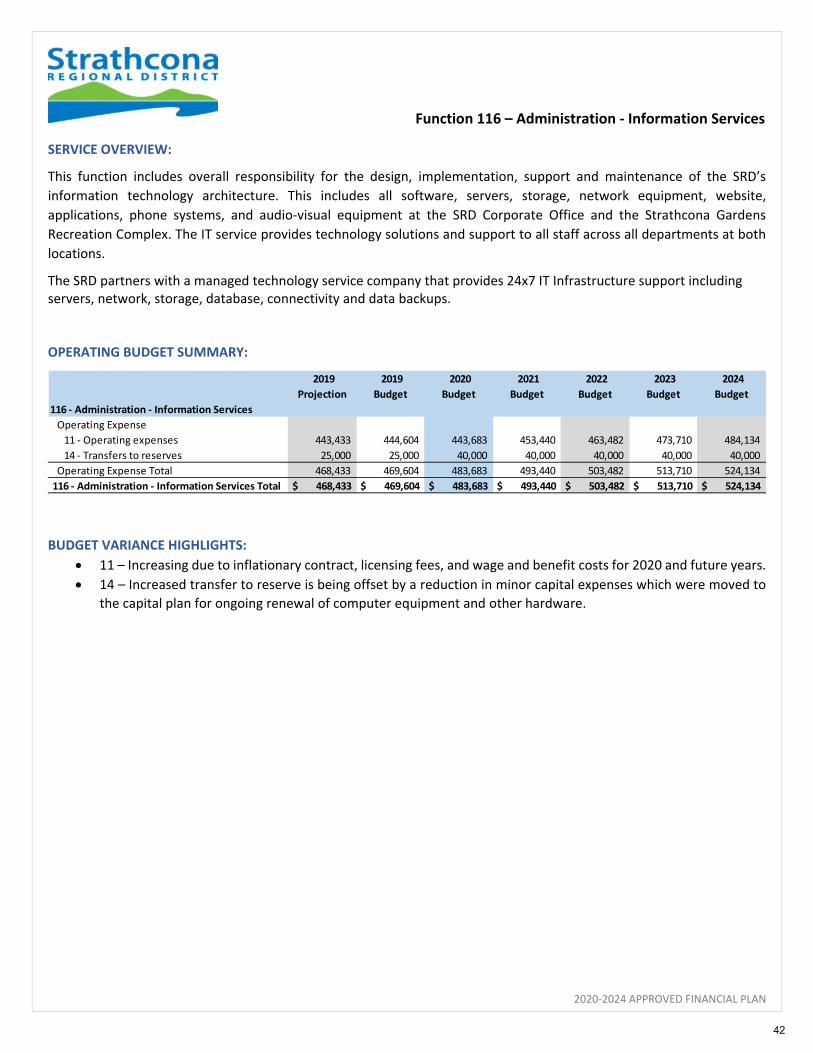
This function includes overall responsibility for the design, implementation, support and maintenance of the SRD’s
information technology architecture. This includes all software, servers, storage, network equipment, website,
applications, phone systems, and audio‐visual equipment at the SRD Corporate Office and the Strathcona Gardens
Recreation Complex. The IT service provides technology solutions and support to all staff across all departments at both
locations.
The SRD partners with a managed technology service company that provides 24x7 IT Infrastructure support including servers, network, storage, database, connectivity and data backups. OPERATING BUDGET SUMMARY:
BUDGET VARIANCE HIGHLIGHTS:
11 – Increasing due to inflationary contract, licensing fees, and wage and benefit costs for 2020 and future years.
14 – Increased transfer to reserve is being offset by a reduction in minor capital expenses which were moved to
the capital plan for ongoing renewal of computer equipment and other hardware.
2019
Projection
2019
Budget
2020
Budget
2021
Budget
2022
Budget
2023
Budget
2024
Budget
116 ‐ Administration ‐ Information Services
Operating Expense
11 ‐ Operating expenses 443,433 444,604 443,683 453,440 463,482 473,710 484,134
14 ‐ Transfers to reserves 25,000 25,000 40,000 40,000 40,000 40,000 40,000
Operating Expense Total 468,433 469,604 483,683 493,440 503,482 513,710 524,134
116 ‐ Administration ‐ Information Services Total $ 468,433 $ 469,604 $ 483,683 $ 493,440 $ 503,482 $ 513,710 $ 524,134
42

Function 116 – Administration ‐ Information Services
2020‐2024 APPROVED FINANCIAL PLAN
CAPITAL BUDGET:
SERVICE GOALS IN 2020/2021:
Project management and project portfolio management over approved technology‐enabled strategic business
initiatives in the SRD’s capital plans for corporate, electoral area, and Strathcona Gardens budget sections.
Improve business processes for staff using technology to increase efficiency and reduce errors and re‐work.
Improve the SRD’s business continuity and disaster recovery plan.
Provide long‐term vision and strategic planning steps to map the SRD throughout its digital transformation.
Project Title2020
CFWD
2020
Budget
2021
Budget
2022
Budget
2023
Budget
2024
BudgetFunding
IT Infrastructure Replacements $ ‐ $ 15,000 $ 15,000 $ 15,000 $ 50,000 $ 30,000 Reserves
Workstation Replacements ‐ 15,000 15,000 15,000 15,000 15,000 Reserves
TOTAL $ ‐ $ 30,000 $ 30,000 $ 30,000 $ 65,000 $ 45,000
Scheduled replacement of server and networking equipment. Ensuring current infrastructure and network security
standards are met.
Annual workstation / laptops for SRD Corporate Office staff as per replacement schedule. Ensures staff have up‐to‐date
computer equipment to conduct RD work.
2020 ‐ 2024 FUNDED PROJECTS
43

Function 117 – Administration ‐ Vehicle Pool
2020‐2024 APPROVED FINANCIAL PLAN
SERVICE OVERVIEW:
Function 117 is responsible for managing the SRD corporate fleet of three vehicles including insurance, fuel, and repairs
and maintenance. The recovery costs charged to Regional District services through the support services allocation includes
an annual transfer to the general capital reserve to allow for vehicle replacement.
OPERATING BUDGET SUMMARY:
BUDGET VARIANCE HIGHLIGHTS:
4 – Other revenue is the recovery charge to Regional District services through the support service allocation,
includes recovery for four vehicles. One new vehicle as approved through business case, one vehicle moved to
support services allocation as used by all departments, therefore 2020 includes four vehicles.
4 – Added $5,000 in expenses for new vehicle operating costs plus additional $5,000 reserve transfer for eventual
replacement. Impact of cost increase is estimated to be approximately $0.10 per $100K of assessed value.
14 – Transfer to the general capital reserve for fleet replacement in the capital plan.
CAPITAL BUDGET:
2019
Projection
2019
Budget
2020
Budget
2021
Budget
2022
Budget
2023
Budget
2024
Budget
117 ‐ Administration ‐ Vehicle Pool
Operating Revenue
4 ‐ Other revenue (20,000) (20,000) (40,200) (40,604) (41,016) (41,436) (41,865)
Operating Revenue Total (20,000) (20,000) (40,200) (40,604) (41,016) (41,436) (41,865)
Operating Expense
11 ‐ Operating expenses 13,072 15,200 20,200 20,604 21,016 21,436 21,865
14 ‐ Transfers to reserves 15,000 15,000 20,000 20,000 20,000 20,000 20,000
Operating Expense Total 28,072 30,200 40,200 40,604 41,016 41,436 41,865
117 ‐ Administration ‐ Vehicle Pool Total $ 8,072 $ 10,200 $ ‐ $ ‐ $ ‐ $ ‐ $ ‐
Project Title2020
CFWD
2020
Budget
2021
Budget
2022
Budget
2023
Budget
2024
BudgetFunding
New Corporate Vehicle $ ‐ $ 35,000 $ ‐ $ ‐ $ ‐ $ ‐ Reserves
2012 Ford Escape SUV Replacement ‐ ‐ 35,000 ‐ ‐ ‐ Reserves
TOTAL ‐$ 35,000$ 35,000$ ‐$ ‐$ ‐$
Replacement of aging equipment.
2020 ‐ 2024 FUNDED PROJECTS
Per business case.
44

Function 118 – Administration ‐ Strategic Initiatives
2020‐2024 APPROVED FINANCIAL PLAN
SERVICE OVERVIEW:
Function 118 is a new function established in 2019 to identify and summarize the Board’s strategic initiative priorities.
This will provide ease in reporting to the Board on the strategic priority project updates and will also provide increased
clarity on allocated budgets for monitoring deliverables and performance of these initiatives.
OPERATING BUDGET SUMMARY:
BUDGET VARIANCE HIGHLIGHTS:
11 – Operating expenses vary year to year depending on the timeline of the related operating projects planned.
These projects are generally funded by grants and general surplus. Expenses also includes base operating budget
for strategic initiatives and corporate communications.
11 – Includes remaining 50% funding for part‐time First Nations Coordinator approved through business case in
2019.
CAPITAL BUDGET:
SERVICE GOALS IN 2020/2021:
Continue work on major strategic capital projects for the Regional District including Connected Coast, Strathcona
Gardens Energy Recovery Project, and Strathcona Gardens REC‐REATE project.
Ensure the continued delivery of the Board’s current strategic priority projects.
2019
Projection
2019
Budget
2020
Budget
2021
Budget
2022
Budget
2023
Budget
2024
Budget
118 ‐ Administration ‐ Strategic Initiatives
Operating Expense
11 ‐ Operating expenses 243,632 461,136 372,241 208,668 209,947 211,257 212,601
Operating Expense Total 243,632 461,136 372,241 208,668 209,947 211,257 212,601
118 ‐ Administration ‐ Strategic Initiatives Total $ 243,632 $ 461,136 $ 372,241 $ 208,668 $ 209,947 $ 211,257 $ 212,601
Project Title2020
CFWD
2020
Budget
2021
Budget
2022
Budget
2023
Budget
2024
BudgetFunding
External Website Development $ ‐ $ ‐ $ ‐ $ ‐ $ 20,000 $ ‐ Reserves
TOTAL ‐$ ‐$ ‐$ ‐$ 20,000$ ‐$
2020 ‐ 2024 FUNDED PROJECTS
The SRD's website was redeveloped in 2018 to enhance corporate communications and engagement with residents in the
region. Periodic future updates are planned to ensure levels of service are maintained and the site is kept current.
45
Function 119 – Administration ‐ Fiscal Services & Capital
2020‐2024 APPROVED FINANCIAL PLAN
SERVICE OVERVIEW:
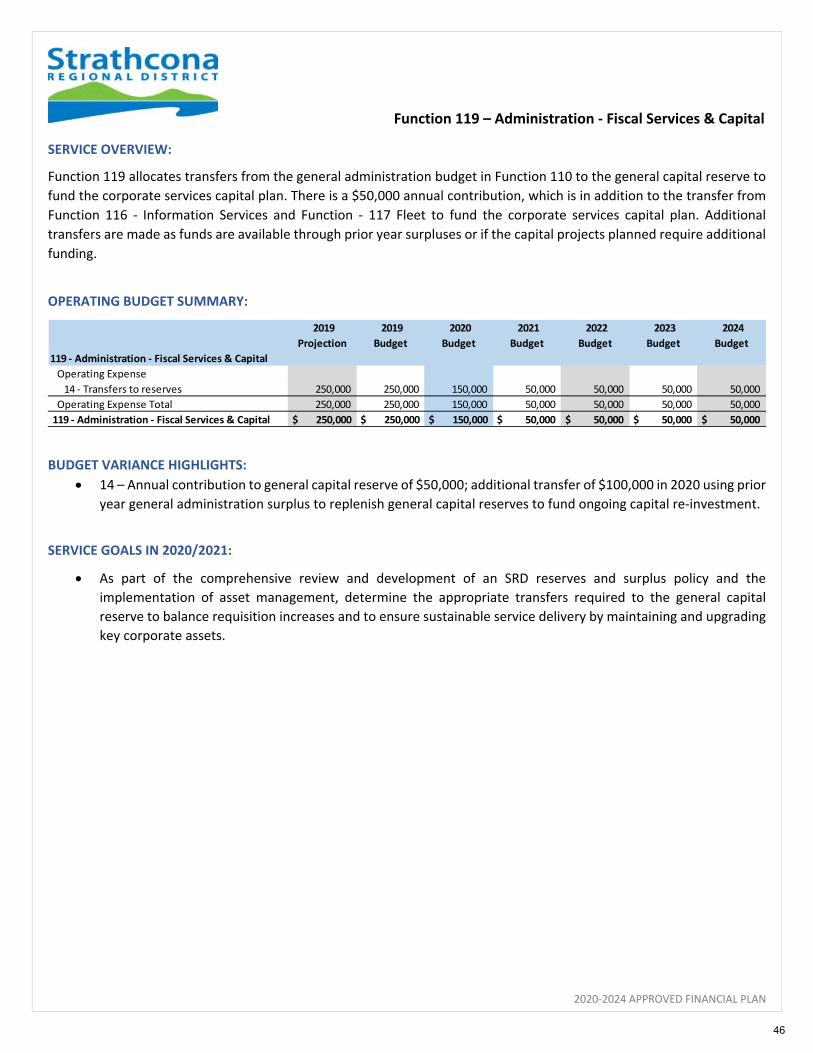
Function 119 allocates transfers from the general administration budget in Function 110 to the general capital reserve to
fund the corporate services capital plan. There is a $50,000 annual contribution, which is in addition to the transfer from
Function 116 ‐ Information Services and Function ‐ 117 Fleet to fund the corporate services capital plan. Additional
transfers are made as funds are available through prior year surpluses or if the capital projects planned require additional
funding.
OPERATING BUDGET SUMMARY:
BUDGET VARIANCE HIGHLIGHTS:
14 – Annual contribution to general capital reserve of $50,000; additional transfer of $100,000 in 2020 using prior
year general administration surplus to replenish general capital reserves to fund ongoing capital re‐investment.
SERVICE GOALS IN 2020/2021:
As part of the comprehensive review and development of an SRD reserves and surplus policy and the
implementation of asset management, determine the appropriate transfers required to the general capital
reserve to balance requisition increases and to ensure sustainable service delivery by maintaining and upgrading
key corporate assets.
2019
Projection
2019
Budget
2020
Budget
2021
Budget
2022
Budget
2023
Budget
2024
Budget
119 ‐ Administration ‐ Fiscal Services & Capital
Operating Expense
14 ‐ Transfers to reserves 250,000 250,000 150,000 50,000 50,000 50,000 50,000
Operating Expense Total 250,000 250,000 150,000 50,000 50,000 50,000 50,000
119 ‐ Administration ‐ Fiscal Services & Capital $ 250,000 $ 250,000 $ 150,000 $ 50,000 $ 50,000 $ 50,000 $ 50,000
46
Corporate Services – Business Cases
2020‐2024 APPROVED FINANCIAL PLAN
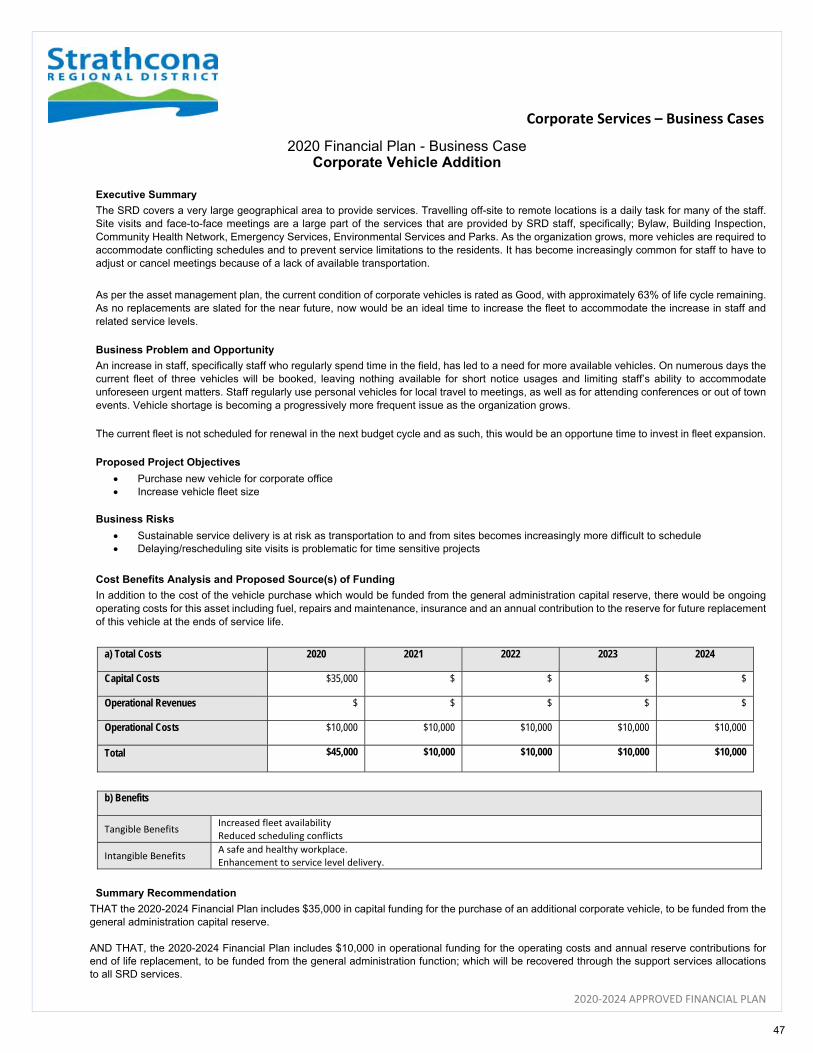
2020 Financial Plan - Business Case Corporate Vehicle Addition
Executive Summary
The SRD covers a very large geographical area to provide services. Travelling off-site to remote locations is a daily task for many of the staff. Site visits and face-to-face meetings are a large part of the services that are provided by SRD staff, specifically; Bylaw, Building Inspection, Community Health Network, Emergency Services, Environmental Services and Parks. As the organization grows, more vehicles are required to accommodate conflicting schedules and to prevent service limitations to the residents. It has become increasingly common for staff to have to adjust or cancel meetings because of a lack of available transportation.
As per the asset management plan, the current condition of corporate vehicles is rated as Good, with approximately 63% of life cycle remaining. As no replacements are slated for the near future, now would be an ideal time to increase the fleet to accommodate the increase in staff and related service levels.
Business Problem and Opportunity
An increase in staff, specifically staff who regularly spend time in the field, has led to a need for more available vehicles. On numerous days the current fleet of three vehicles will be booked, leaving nothing available for short notice usages and limiting staff’s ability to accommodate unforeseen urgent matters. Staff regularly use personal vehicles for local travel to meetings, as well as for attending conferences or out of town events. Vehicle shortage is becoming a progressively more frequent issue as the organization grows.
The current fleet is not scheduled for renewal in the next budget cycle and as such, this would be an opportune time to invest in fleet expansion.
Proposed Project Objectives
Purchase new vehicle for corporate office Increase vehicle fleet size
Business Risks
Sustainable service delivery is at risk as transportation to and from sites becomes increasingly more difficult to schedule Delaying/rescheduling site visits is problematic for time sensitive projects
Cost Benefits Analysis and Proposed Source(s) of Funding
In addition to the cost of the vehicle purchase which would be funded from the general administration capital reserve, there would be ongoing operating costs for this asset including fuel, repairs and maintenance, insurance and an annual contribution to the reserve for future replacement of this vehicle at the ends of service life.
a) Total Costs 2020 2021 2022 2023 2024
Capital Costs $35,000 $ $ $ $
Operational Revenues $ $ $ $ $
Operational Costs $10,000 $10,000 $10,000 $10,000 $10,000
Total $45,000 $10,000 $10,000 $10,000 $10,000
b) Benefits
Tangible Benefits Increased fleet availability Reduced scheduling conflicts
Intangible Benefits A safe and healthy workplace. Enhancement to service level delivery.
Summary Recommendation
THAT the 2020-2024 Financial Plan includes $35,000 in capital funding for the purchase of an additional corporate vehicle, to be funded from the general administration capital reserve. AND THAT, the 2020-2024 Financial Plan includes $10,000 in operational funding for the operating costs and annual reserve contributions for end of life replacement, to be funded from the general administration function; which will be recovered through the support services allocations to all SRD services.
47
Corporate Services – Business Cases
2020‐2024 APPROVED FINANCIAL PLAN
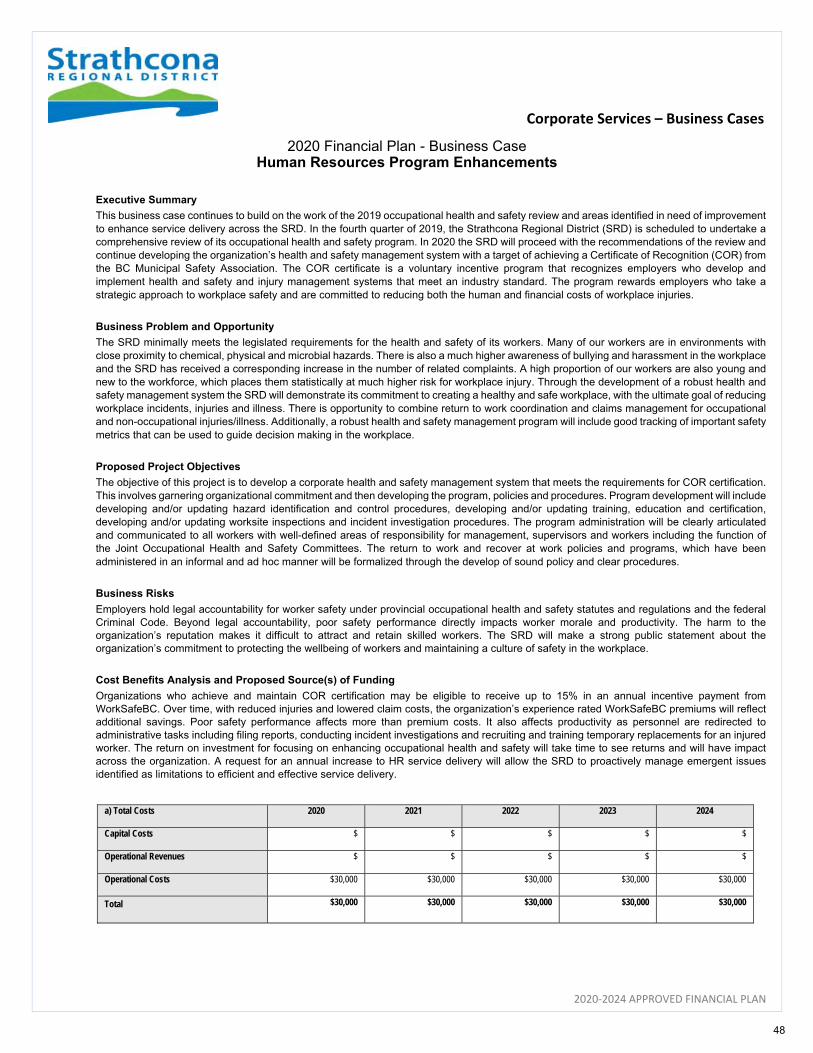
2020 Financial Plan - Business Case Human Resources Program Enhancements
Executive Summary
This business case continues to build on the work of the 2019 occupational health and safety review and areas identified in need of improvement to enhance service delivery across the SRD. In the fourth quarter of 2019, the Strathcona Regional District (SRD) is scheduled to undertake a comprehensive review of its occupational health and safety program. In 2020 the SRD will proceed with the recommendations of the review and continue developing the organization’s health and safety management system with a target of achieving a Certificate of Recognition (COR) from the BC Municipal Safety Association. The COR certificate is a voluntary incentive program that recognizes employers who develop and implement health and safety and injury management systems that meet an industry standard. The program rewards employers who take a strategic approach to workplace safety and are committed to reducing both the human and financial costs of workplace injuries.
Business Problem and Opportunity
The SRD minimally meets the legislated requirements for the health and safety of its workers. Many of our workers are in environments with close proximity to chemical, physical and microbial hazards. There is also a much higher awareness of bullying and harassment in the workplace and the SRD has received a corresponding increase in the number of related complaints. A high proportion of our workers are also young and new to the workforce, which places them statistically at much higher risk for workplace injury. Through the development of a robust health and safety management system the SRD will demonstrate its commitment to creating a healthy and safe workplace, with the ultimate goal of reducing workplace incidents, injuries and illness. There is opportunity to combine return to work coordination and claims management for occupational and non-occupational injuries/illness. Additionally, a robust health and safety management program will include good tracking of important safety metrics that can be used to guide decision making in the workplace.
Proposed Project Objectives
The objective of this project is to develop a corporate health and safety management system that meets the requirements for COR certification. This involves garnering organizational commitment and then developing the program, policies and procedures. Program development will include developing and/or updating hazard identification and control procedures, developing and/or updating training, education and certification, developing and/or updating worksite inspections and incident investigation procedures. The program administration will be clearly articulated and communicated to all workers with well-defined areas of responsibility for management, supervisors and workers including the function of the Joint Occupational Health and Safety Committees. The return to work and recover at work policies and programs, which have been administered in an informal and ad hoc manner will be formalized through the develop of sound policy and clear procedures.
Business Risks
Employers hold legal accountability for worker safety under provincial occupational health and safety statutes and regulations and the federal Criminal Code. Beyond legal accountability, poor safety performance directly impacts worker morale and productivity. The harm to the organization’s reputation makes it difficult to attract and retain skilled workers. The SRD will make a strong public statement about the organization’s commitment to protecting the wellbeing of workers and maintaining a culture of safety in the workplace.
Cost Benefits Analysis and Proposed Source(s) of Funding
Organizations who achieve and maintain COR certification may be eligible to receive up to 15% in an annual incentive payment from WorkSafeBC. Over time, with reduced injuries and lowered claim costs, the organization’s experience rated WorkSafeBC premiums will reflect additional savings. Poor safety performance affects more than premium costs. It also affects productivity as personnel are redirected to administrative tasks including filing reports, conducting incident investigations and recruiting and training temporary replacements for an injured worker. The return on investment for focusing on enhancing occupational health and safety will take time to see returns and will have impact across the organization. A request for an annual increase to HR service delivery will allow the SRD to proactively manage emergent issues identified as limitations to efficient and effective service delivery.
a) Total Costs 2020 2021 2022 2023 2024
Capital Costs $ $ $ $ $
Operational Revenues $ $ $ $ $
Operational Costs $30,000 $30,000 $30,000 $30,000 $30,000
Total $30,000 $30,000 $30,000 $30,000 $30,000
48
Corporate Services – Business Cases
2020‐2024 APPROVED FINANCIAL PLAN
2020 Financial Plan - Business Case Human Resources Program Enhancements
b) Benefits
Tangible Benefits Reduce WorkSafeBC insurance premiums and increase worker safety, wellness and productivity.
Intangible Benefits A safe and healthy workplace.
Summary Recommendation
THAT the 2020-2024 Financial Plan includes an increase to HR service delivery of $30,000 annually to be funded by general taxation in Function 110 – General Government services.
49
Corporate Services
2020‐2024 APPROVED FINANCIAL PLAN
50

2020‐2024 APPROVED FINANCIAL PLAN
Regional Services
The Strathcona Regional District (SRD) is made up of four electoral areas and five member municipalities. The borders extend from the Oyster River south of Campbell River to Gold River, Sayward, Tahsis, Zeballos and Kyuquot‐Nootka in the north and west, and east to Cortes Island, Quadra Island and the Discovery Islands as well as a portion of the adjacent mainland north of Powell River. The regional services of the Regional District are for services that benefit all participants of the Regional District.
FINANCIAL PLAN
2020 – 2024
Rebecca Spit, Quadra Island
51

Regional Services Summary
2020‐2024 APPROVED FINANCIAL PLAN
Regional Services includes the following functions:
Function # ‐ Function Description
149 ‐ Regional Broadband
150 ‐ Feasibility Studies ‐ Regional
272 ‐ Strathcona Emergency Program
275 ‐ 911 Answering Service
510 ‐ Planning (Non‐Part 26)
52
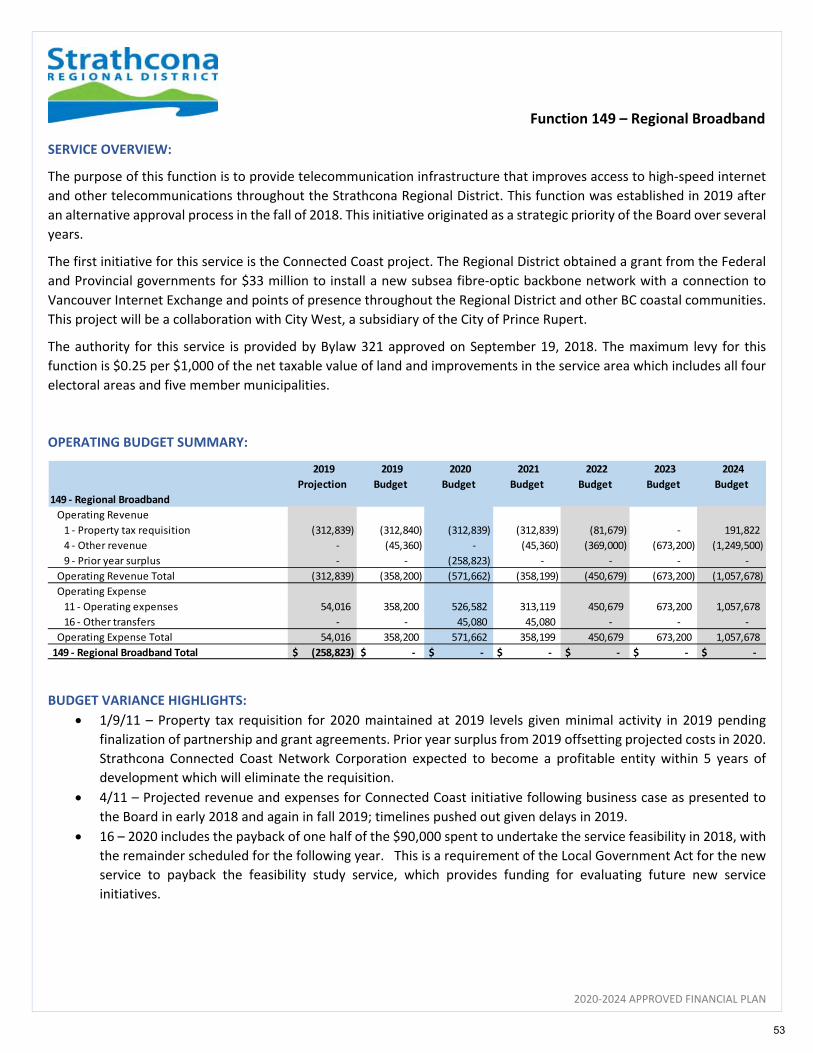
Function 149 – Regional Broadband
2020‐2024 APPROVED FINANCIAL PLAN
SERVICE OVERVIEW:
The purpose of this function is to provide telecommunication infrastructure that improves access to high‐speed internet
and other telecommunications throughout the Strathcona Regional District. This function was established in 2019 after
an alternative approval process in the fall of 2018. This initiative originated as a strategic priority of the Board over several
years.
The first initiative for this service is the Connected Coast project. The Regional District obtained a grant from the Federal
and Provincial governments for $33 million to install a new subsea fibre‐optic backbone network with a connection to
Vancouver Internet Exchange and points of presence throughout the Regional District and other BC coastal communities.
This project will be a collaboration with City West, a subsidiary of the City of Prince Rupert.
The authority for this service is provided by Bylaw 321 approved on September 19, 2018. The maximum levy for this
function is $0.25 per $1,000 of the net taxable value of land and improvements in the service area which includes all four
electoral areas and five member municipalities.
OPERATING BUDGET SUMMARY:
BUDGET VARIANCE HIGHLIGHTS:
1/9/11 – Property tax requisition for 2020 maintained at 2019 levels given minimal activity in 2019 pending
finalization of partnership and grant agreements. Prior year surplus from 2019 offsetting projected costs in 2020.
Strathcona Connected Coast Network Corporation expected to become a profitable entity within 5 years of
development which will eliminate the requisition.
4/11 – Projected revenue and expenses for Connected Coast initiative following business case as presented to
the Board in early 2018 and again in fall 2019; timelines pushed out given delays in 2019.
16 – 2020 includes the payback of one half of the $90,000 spent to undertake the service feasibility in 2018, with
the remainder scheduled for the following year. This is a requirement of the Local Government Act for the new
service to payback the feasibility study service, which provides funding for evaluating future new service
initiatives.
2019
Projection
2019
Budget
2020
Budget
2021
Budget
2022
Budget
2023
Budget
2024
Budget
149 ‐ Regional Broadband
Operating Revenue
1 ‐ Property tax requisition (312,839) (312,840) (312,839) (312,839) (81,679) ‐ 191,822
4 ‐ Other revenue ‐ (45,360) ‐ (45,360) (369,000) (673,200) (1,249,500)
9 ‐ Prior year surplus ‐ ‐ (258,823) ‐ ‐ ‐ ‐
Operating Revenue Total (312,839) (358,200) (571,662) (358,199) (450,679) (673,200) (1,057,678)
Operating Expense
11 ‐ Operating expenses 54,016 358,200 526,582 313,119 450,679 673,200 1,057,678
16 ‐ Other transfers ‐ ‐ 45,080 45,080 ‐ ‐ ‐
Operating Expense Total 54,016 358,200 571,662 358,199 450,679 673,200 1,057,678
149 ‐ Regional Broadband Total $ (258,823) $ ‐ $ ‐ $ ‐ $ ‐ $ ‐ $ ‐
53
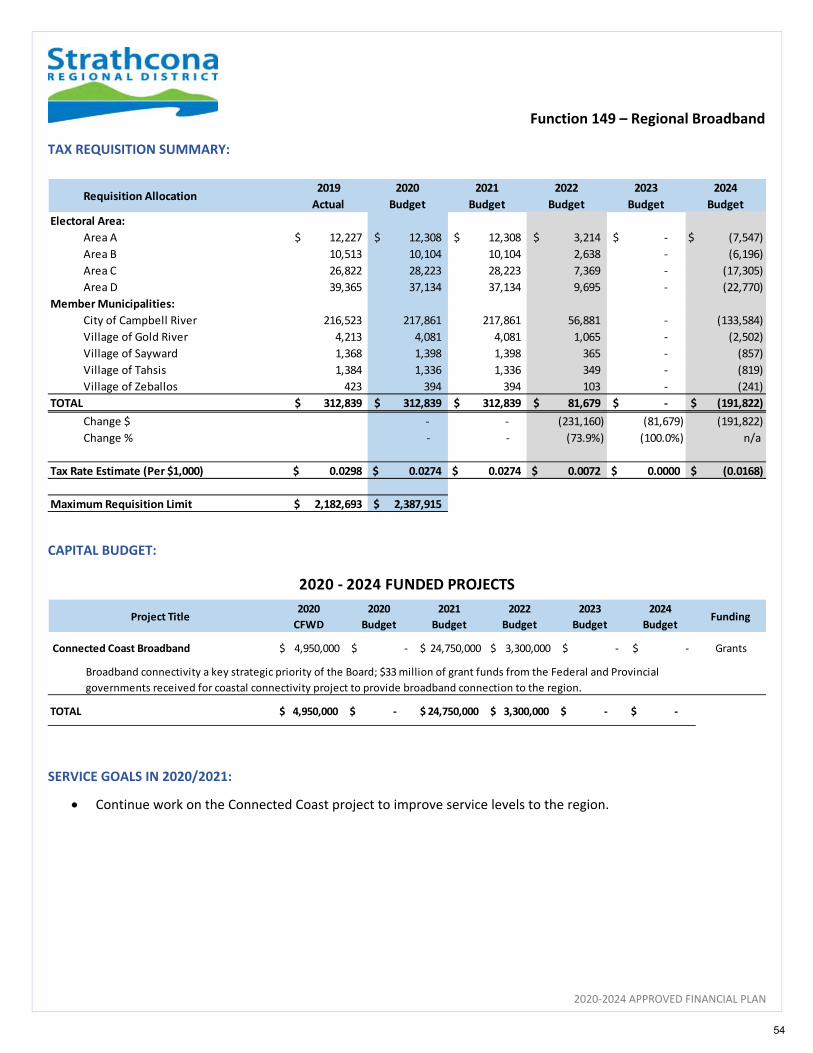
Function 149 – Regional Broadband
2020‐2024 APPROVED FINANCIAL PLAN
TAX REQUISITION SUMMARY:
CAPITAL BUDGET:
SERVICE GOALS IN 2020/2021:
Continue work on the Connected Coast project to improve service levels to the region.
Requisition Allocation2019
Actual
2020
Budget
2021
Budget
2022
Budget
2023
Budget
2024
Budget
Electoral Area:
Area A 12,227$ 12,308$ 12,308$ 3,214$ ‐$ (7,547)$
Area B 10,513 10,104 10,104 2,638 ‐ (6,196)
Area C 26,822 28,223 28,223 7,369 ‐ (17,305)
Area D 39,365 37,134 37,134 9,695 ‐ (22,770)
Member Municipalities:
City of Campbell River 216,523 217,861 217,861 56,881 ‐ (133,584)
Village of Gold River 4,213 4,081 4,081 1,065 ‐ (2,502)
Village of Sayward 1,368 1,398 1,398 365 ‐ (857)
Village of Tahsis 1,384 1,336 1,336 349 ‐ (819)
Village of Zeballos 423 394 394 103 ‐ (241)
TOTAL 312,839$ 312,839$ 312,839$ 81,679$ ‐$ (191,822) $
Change $ ‐ ‐ (231,160) (81,679) (191,822)
Change % ‐ ‐ (73.9%) (100.0%) n/a
Tax Rate Estimate (Per $1,000) 0.0298 $ 0.0274 $ 0.0274 $ 0.0072 $ 0.0000 $ (0.0168) $
Maximum Requisition Limit 2,182,693 $ 2,387,915 $
Project Title2020
CFWD
2020
Budget
2021
Budget
2022
Budget
2023
Budget
2024
BudgetFunding
Connected Coast Broadband $ 4,950,000 $ ‐ $ 24,750,000 $ 3,300,000 $ ‐ $ ‐ Grants
TOTAL 4,950,000$ ‐$ 24,750,000$ 3,300,000$ ‐$ ‐$
Broadband connectivity a key strategic priority of the Board; $33 million of grant funds from the Federal and Provincial
governments received for coastal connectivity project to provide broadband connection to the region.
2020 ‐ 2024 FUNDED PROJECTS
54
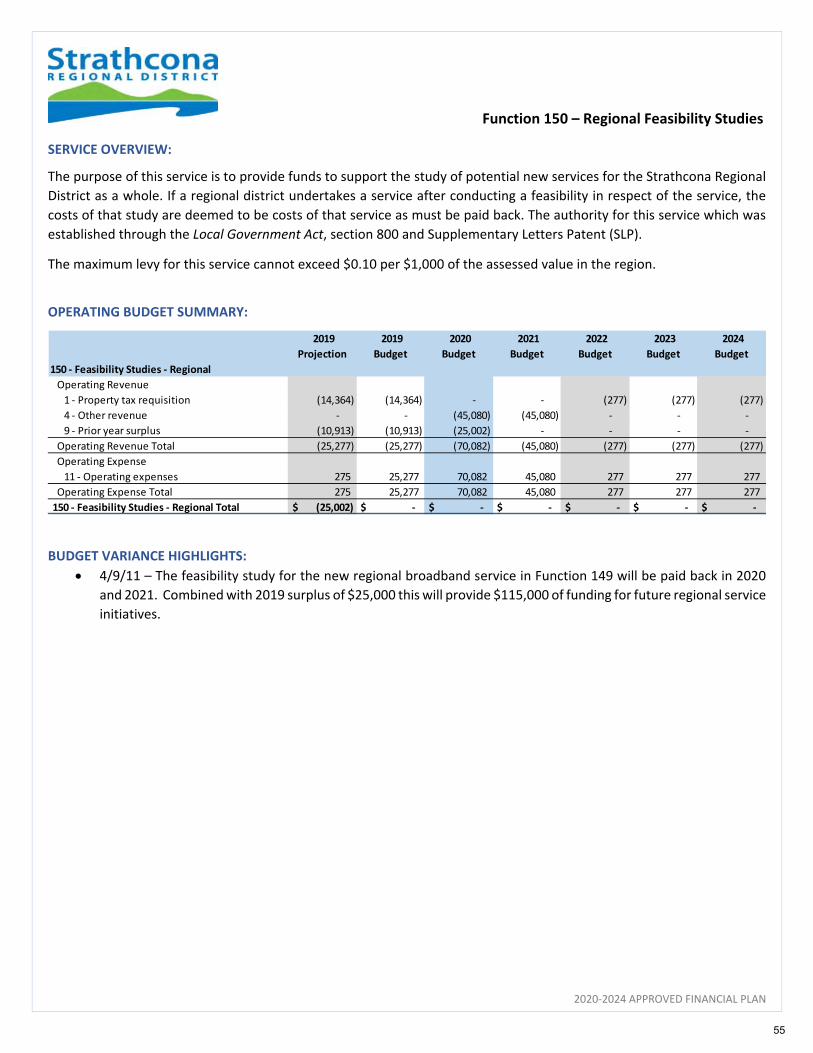
Function 150 – Regional Feasibility Studies
2020‐2024 APPROVED FINANCIAL PLAN
SERVICE OVERVIEW:
The purpose of this service is to provide funds to support the study of potential new services for the Strathcona Regional
District as a whole. If a regional district undertakes a service after conducting a feasibility in respect of the service, the
costs of that study are deemed to be costs of that service as must be paid back. The authority for this service which was
established through the Local Government Act, section 800 and Supplementary Letters Patent (SLP).
The maximum levy for this service cannot exceed $0.10 per $1,000 of the assessed value in the region.
OPERATING BUDGET SUMMARY:
BUDGET VARIANCE HIGHLIGHTS:
4/9/11 – The feasibility study for the new regional broadband service in Function 149 will be paid back in 2020
and 2021. Combined with 2019 surplus of $25,000 this will provide $115,000 of funding for future regional service
initiatives.
2019
Projection
2019
Budget
2020
Budget
2021
Budget
2022
Budget
2023
Budget
2024
Budget
150 ‐ Feasibility Studies ‐ Regional
Operating Revenue
1 ‐ Property tax requisition (14,364) (14,364) ‐ ‐ (277) (277) (277)
4 ‐ Other revenue ‐ ‐ (45,080) (45,080) ‐ ‐ ‐
9 ‐ Prior year surplus (10,913) (10,913) (25,002) ‐ ‐ ‐ ‐
Operating Revenue Total (25,277) (25,277) (70,082) (45,080) (277) (277) (277)
Operating Expense
11 ‐ Operating expenses 275 25,277 70,082 45,080 277 277 277
Operating Expense Total 275 25,277 70,082 45,080 277 277 277
150 ‐ Feasibility Studies ‐ Regional Total $ (25,002) $ ‐ $ ‐ $ ‐ $ ‐ $ ‐ $ ‐
55
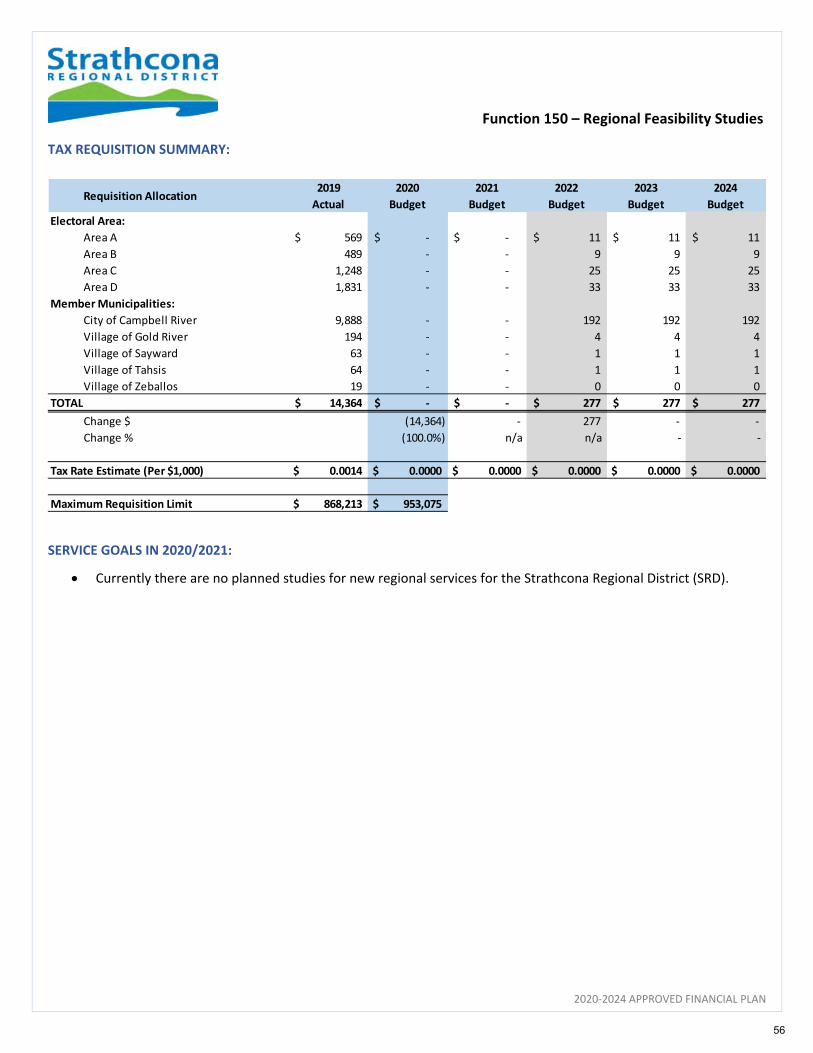
Function 150 – Regional Feasibility Studies
2020‐2024 APPROVED FINANCIAL PLAN
TAX REQUISITION SUMMARY:
SERVICE GOALS IN 2020/2021:
Currently there are no planned studies for new regional services for the Strathcona Regional District (SRD).
Requisition Allocation2019
Actual
2020
Budget
2021
Budget
2022
Budget
2023
Budget
2024
Budget
Electoral Area:
Area A 569$ ‐$ ‐$ 11$ 11$ 11$
Area B 489 ‐ ‐ 9 9 9
Area C 1,248 ‐ ‐ 25 25 25
Area D 1,831 ‐ ‐ 33 33 33
Member Municipalities:
City of Campbell River 9,888 ‐ ‐ 192 192 192
Village of Gold River 194 ‐ ‐ 4 4 4
Village of Sayward 63 ‐ ‐ 1 1 1
Village of Tahsis 64 ‐ ‐ 1 1 1
Village of Zeballos 19 ‐ ‐ 0 0 0
TOTAL 14,364$ ‐$ ‐$ 277$ 277$ 277$
Change $ (14,364) ‐ 277 ‐ ‐
Change % (100.0%) n/a n/a ‐ ‐
Tax Rate Estimate (Per $1,000) 0.0014 $ 0.0000 $ 0.0000 $ 0.0000 $ 0.0000 $ 0.0000 $
Maximum Requisition Limit 868,213 $ 953,075 $
56
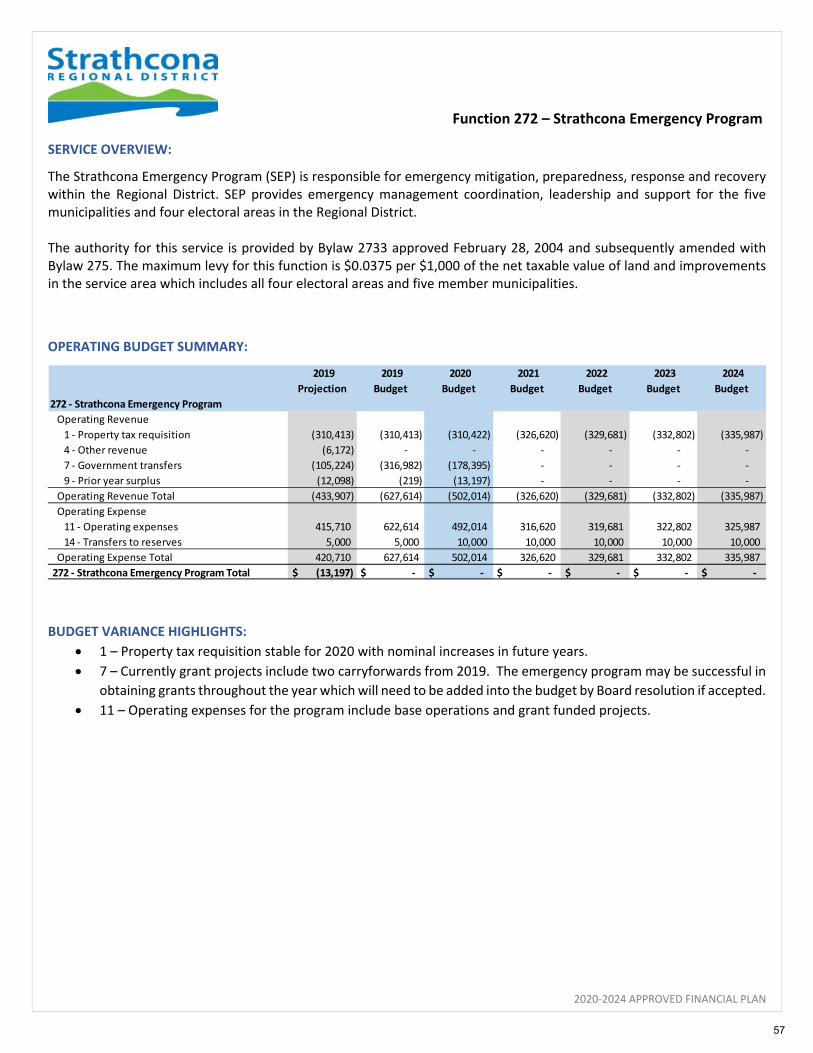
Function 272 – Strathcona Emergency Program
2020‐2024 APPROVED FINANCIAL PLAN
SERVICE OVERVIEW:
The Strathcona Emergency Program (SEP) is responsible for emergency mitigation, preparedness, response and recovery within the Regional District. SEP provides emergency management coordination, leadership and support for the five municipalities and four electoral areas in the Regional District. The authority for this service is provided by Bylaw 2733 approved February 28, 2004 and subsequently amended with Bylaw 275. The maximum levy for this function is $0.0375 per $1,000 of the net taxable value of land and improvements in the service area which includes all four electoral areas and five member municipalities.
OPERATING BUDGET SUMMARY:
BUDGET VARIANCE HIGHLIGHTS:
1 – Property tax requisition stable for 2020 with nominal increases in future years.
7 – Currently grant projects include two carryforwards from 2019. The emergency program may be successful in
obtaining grants throughout the year which will need to be added into the budget by Board resolution if accepted.
11 – Operating expenses for the program include base operations and grant funded projects.
2019
Projection
2019
Budget
2020
Budget
2021
Budget
2022
Budget
2023
Budget
2024
Budget
272 ‐ Strathcona Emergency Program
Operating Revenue
1 ‐ Property tax requisition (310,413) (310,413) (310,422) (326,620) (329,681) (332,802) (335,987)
4 ‐ Other revenue (6,172) ‐ ‐ ‐ ‐ ‐ ‐
7 ‐ Government transfers (105,224) (316,982) (178,395) ‐ ‐ ‐ ‐
9 ‐ Prior year surplus (12,098) (219) (13,197) ‐ ‐ ‐ ‐
Operating Revenue Total (433,907) (627,614) (502,014) (326,620) (329,681) (332,802) (335,987)
Operating Expense
11 ‐ Operating expenses 415,710 622,614 492,014 316,620 319,681 322,802 325,987
14 ‐ Transfers to reserves 5,000 5,000 10,000 10,000 10,000 10,000 10,000
Operating Expense Total 420,710 627,614 502,014 326,620 329,681 332,802 335,987
272 ‐ Strathcona Emergency Program Total $ (13,197) $ ‐ $ ‐ $ ‐ $ ‐ $ ‐ $ ‐
57
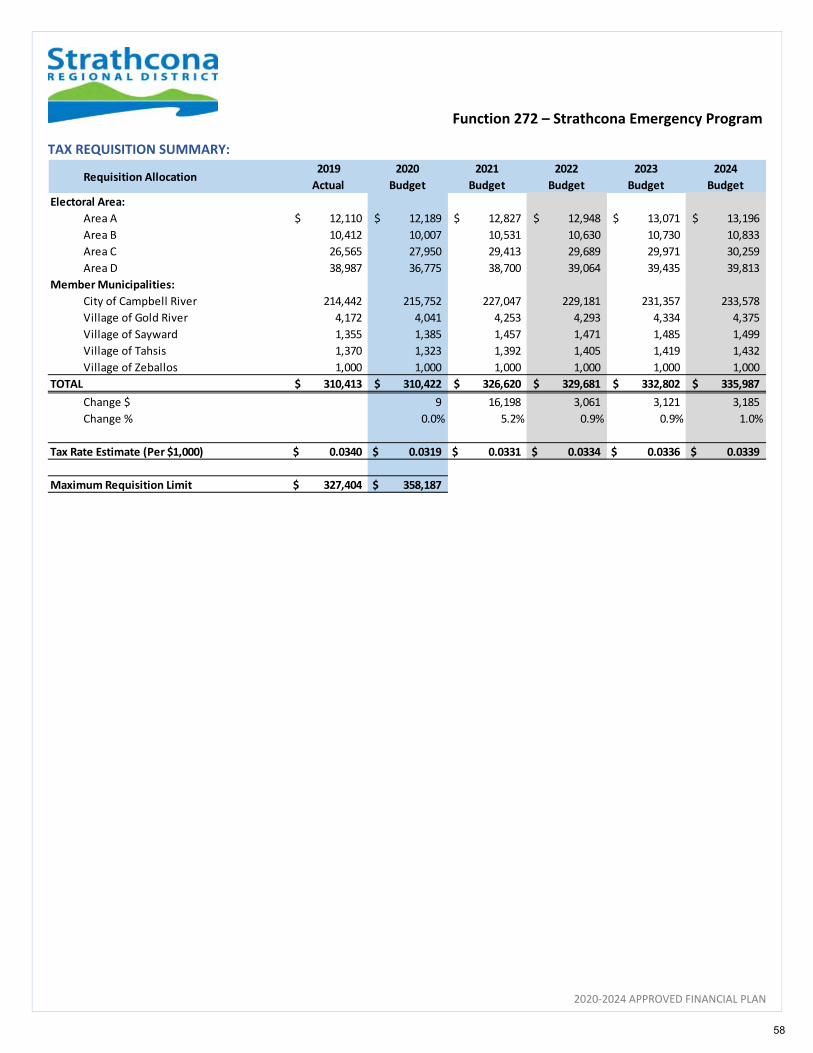
Function 272 – Strathcona Emergency Program
2020‐2024 APPROVED FINANCIAL PLAN
TAX REQUISITION SUMMARY:
Requisition Allocation2019
Actual
2020
Budget
2021
Budget
2022
Budget
2023
Budget
2024
Budget
Electoral Area:
Area A 12,110$ 12,189$ 12,827$ 12,948$ 13,071$ 13,196$
Area B 10,412 10,007 10,531 10,630 10,730 10,833
Area C 26,565 27,950 29,413 29,689 29,971 30,259
Area D 38,987 36,775 38,700 39,064 39,435 39,813
Member Municipalities:
City of Campbell River 214,442 215,752 227,047 229,181 231,357 233,578
Village of Gold River 4,172 4,041 4,253 4,293 4,334 4,375
Village of Sayward 1,355 1,385 1,457 1,471 1,485 1,499
Village of Tahsis 1,370 1,323 1,392 1,405 1,419 1,432
Village of Zeballos 1,000 1,000 1,000 1,000 1,000 1,000
TOTAL 310,413$ 310,422$ 326,620$ 329,681$ 332,802$ 335,987$
Change $ 9 16,198 3,061 3,121 3,185
Change % 0.0% 5.2% 0.9% 0.9% 1.0%
Tax Rate Estimate (Per $1,000) 0.0340 $ 0.0319 $ 0.0331 $ 0.0334 $ 0.0336 $ 0.0339 $
Maximum Requisition Limit 327,404 $ 358,187 $
58

Function 272 – Strathcona Emergency Program
2020‐2024 APPROVED FINANCIAL PLAN
CAPITAL BUDGET:
RESERVE SUMMARY:
ACTIVE RESERVES:
SERVICE GOALS IN 2020/2021:
Volunteer recruitment, training, appreciation and retention;
Pursue additional grant funding through grants such as Community Emergency Preparedness Fund, National
Disaster Mitigation Program, and Community Resiliency Investment Fund;
Conduct multi‐agency exercises; and
Improve communications capacity of SRD communities.
Project Title2020
CFWD
2020
Budget
2021
Budget
2022
Budget
2023
Budget
2024
BudgetFunding
Strathcona Emergency Program Small
Equipment $ ‐ $ 10,000 $ 10,000 $ 10,000 $ 10,000 $ 10,000 Reserves
‐$ 10,000$ 10,000$ 10,000$ 10,000$ 10,000$
Minor equipment purchases to support regional emergency preparedness. 2020 includes a Mt. Washington repeater
installation project.
2020 ‐ 2024 FUNDED PROJECTS
Reserve Type2019
Projected
2020
Budget
2021
Budget
2022
Budget
2023
Budget
2024
Budget
Appropriated Surplus 30,936$ 30,936$ 30,936$ 30,936$ 30,936$ 30,936$
TOTAL 30,936$ 30,936$ 30,936$ 30,936$ 30,936$ 30,936$
Appropriated Surplus Reserve
2019
Projected
2020
Budget
2021
Budget
2022
Budget
2023
Budget
2024
Budget
Beginning balance 33,436$ 30,936$ 30,936$ 30,936$ 30,936$ 30,936$
Transfers from operating fund 5,000 10,000 10,000 10,000 10,000 10,000
Transfer to operating fund ‐ ‐ ‐ ‐ ‐ ‐
Projects funded (7,500) (10,000) (10,000) (10,000) (10,000) (10,000)
Interest earned ‐ ‐ ‐ ‐ ‐ ‐
Ending Balance 30,936$ 30,936$ 30,936$ 30,936$ 30,936$ 30,936$
Projects Funded:
Strathcona Emergency Program Small
Equipment 7,500 10,000 10,000 10,000 10,000 10,000
7,500$ 10,000$ 10,000$ 10,000$ 10,000$ 10,000$
59

Function 275 –911 Answering Service
2020‐2024 APPROVED FINANCIAL PLAN
SERVICE OVERVIEW:
The purpose of this function is to provide funding for annual contributions to the North Island 911 Corporation which
administers the 9‐1‐1 service on behalf of 6 regional districts in central and northern Vancouver Island and on the central
coast of British Columbia. The members of the service include the following regional districts: Comox Valley, Nanaimo,
Alberni‐Clayoquot, Mt. Waddington, Powell River, and the Strathcona Regional District.
The service is delivered via contracts with E‐Comm (Vancouver) for initial call‐taking (aka Primary Safety Answering Point)
and the City of Campbell River for fire dispatch services. Calls for medical emergencies are handed off to the BC Ambulance
Service.
The authority for this service is provided by Bylaw 1579 which was approved November 29, 1993. The costs of providing
the service are shared between the participating regional districts based on real property assessments included within the
service area. The maximum levy for this function is $0.35 per $1,000 of the net taxable value of land and improvements
in the service area.
OPERATING BUDGET SUMMARY:
BUDGET VARIANCE HIGHLIGHTS:
1/11 – Property tax requisition increased in 2020 to provide funding for increase to the North Island 911
Corporation Budget. Future moderate increases planned for service.
2019
Projection
2019
Budget
2020
Budget
2021
Budget
2022
Budget
2023
Budget
2024
Budget
275 ‐ 911 Answering Service
Operating Revenue
1 ‐ Property tax requisition (401,348) (401,349) (421,376) (450,686) (465,241) (475,068) (478,286)
6 ‐ Grants in lieu ‐ (3,400) ‐ ‐ ‐ ‐ ‐
9 ‐ Prior year surplus (11,188) (11,188) (2,914) ‐ ‐ ‐ ‐
Operating Revenue Total (412,536) (415,937) (424,290) (450,686) (465,241) (475,068) (478,286)
Operating Expense
11 ‐ Operating expenses 399,622 405,937 424,290 450,686 465,241 475,068 478,286
14 ‐ Transfers to reserves 10,000 10,000 ‐ ‐ ‐ ‐ ‐
Operating Expense Total 409,622 415,937 424,290 450,686 465,241 475,068 478,286
275 ‐ 911 Answering Service Total $ (2,914) $ ‐ $ ‐ $ ‐ $ ‐ $ ‐ $ ‐
60
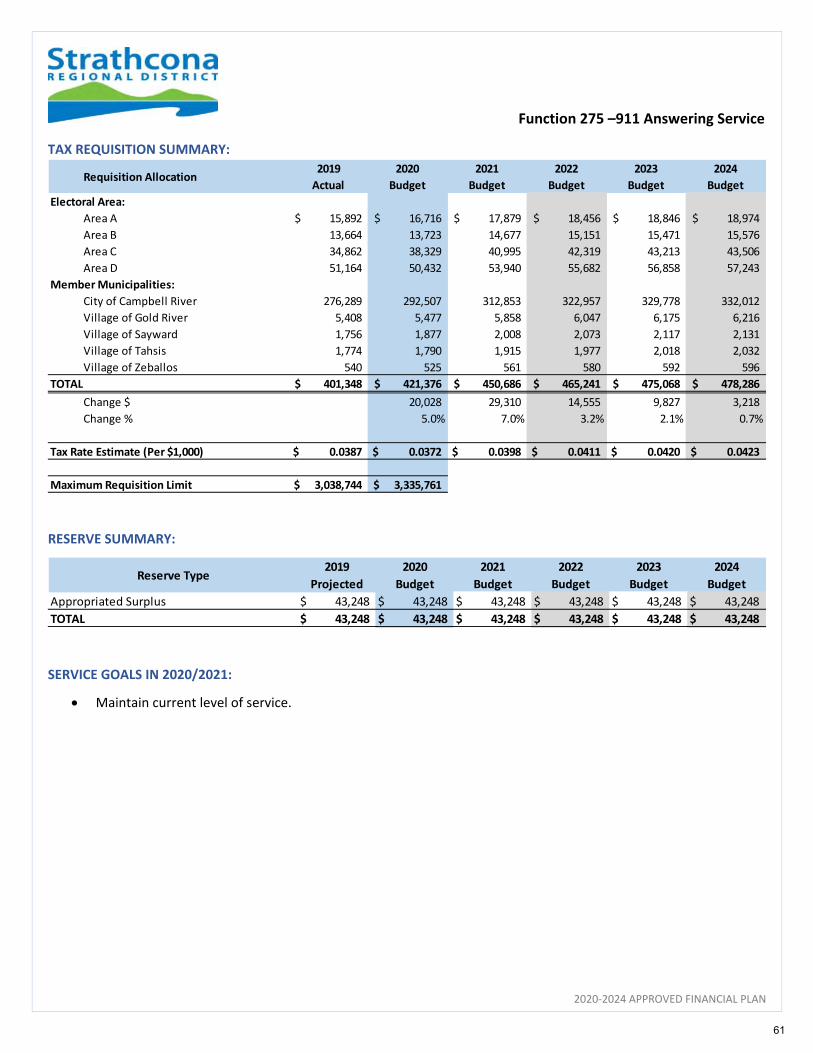
Function 275 –911 Answering Service
2020‐2024 APPROVED FINANCIAL PLAN
TAX REQUISITION SUMMARY:
RESERVE SUMMARY:
SERVICE GOALS IN 2020/2021:
Maintain current level of service.
Requisition Allocation2019
Actual
2020
Budget
2021
Budget
2022
Budget
2023
Budget
2024
Budget
Electoral Area:
Area A 15,892$ 16,716$ 17,879$ 18,456$ 18,846$ 18,974$
Area B 13,664 13,723 14,677 15,151 15,471 15,576
Area C 34,862 38,329 40,995 42,319 43,213 43,506
Area D 51,164 50,432 53,940 55,682 56,858 57,243
Member Municipalities:
City of Campbell River 276,289 292,507 312,853 322,957 329,778 332,012
Village of Gold River 5,408 5,477 5,858 6,047 6,175 6,216
Village of Sayward 1,756 1,877 2,008 2,073 2,117 2,131
Village of Tahsis 1,774 1,790 1,915 1,977 2,018 2,032
Village of Zeballos 540 525 561 580 592 596
TOTAL 401,348$ 421,376$ 450,686$ 465,241$ 475,068$ 478,286$
Change $ 20,028 29,310 14,555 9,827 3,218
Change % 5.0% 7.0% 3.2% 2.1% 0.7%
Tax Rate Estimate (Per $1,000) 0.0387 $ 0.0372 $ 0.0398 $ 0.0411 $ 0.0420 $ 0.0423 $
Maximum Requisition Limit 3,038,744 $ 3,335,761 $
Reserve Type2019
Projected
2020
Budget
2021
Budget
2022
Budget
2023
Budget
2024
Budget
Appropriated Surplus 43,248$ 43,248$ 43,248$ 43,248$ 43,248$ 43,248$
TOTAL 43,248$ 43,248$ 43,248$ 43,248$ 43,248$ 43,248$
61
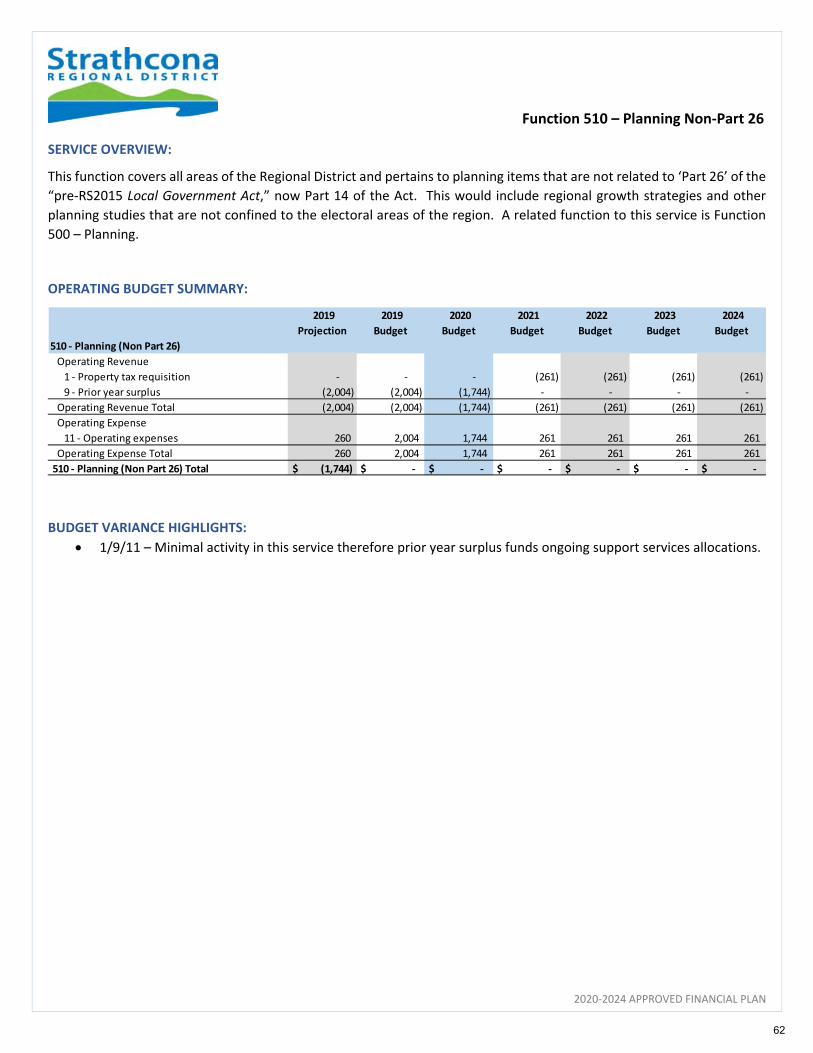
Function 510 – Planning Non‐Part 26
2020‐2024 APPROVED FINANCIAL PLAN
SERVICE OVERVIEW:
This function covers all areas of the Regional District and pertains to planning items that are not related to ‘Part 26’ of the
“pre‐RS2015 Local Government Act,” now Part 14 of the Act. This would include regional growth strategies and other
planning studies that are not confined to the electoral areas of the region. A related function to this service is Function
500 – Planning.
OPERATING BUDGET SUMMARY:
BUDGET VARIANCE HIGHLIGHTS:
1/9/11 – Minimal activity in this service therefore prior year surplus funds ongoing support services allocations.
2019
Projection
2019
Budget
2020
Budget
2021
Budget
2022
Budget
2023
Budget
2024
Budget
510 ‐ Planning (Non Part 26)
Operating Revenue
1 ‐ Property tax requisition ‐ ‐ ‐ (261) (261) (261) (261)
9 ‐ Prior year surplus (2,004) (2,004) (1,744) ‐ ‐ ‐ ‐
Operating Revenue Total (2,004) (2,004) (1,744) (261) (261) (261) (261)
Operating Expense
11 ‐ Operating expenses 260 2,004 1,744 261 261 261 261
Operating Expense Total 260 2,004 1,744 261 261 261 261
510 ‐ Planning (Non Part 26) Total $ (1,744) $ ‐ $ ‐ $ ‐ $ ‐ $ ‐ $ ‐
62

Function 510 – Planning Non‐Part 26
2020‐2024 APPROVED FINANCIAL PLAN
TAX REQUISITION SUMMARY:
SERVICE GOALS IN 2020/2021:
Determine future priorities for this service with the consideration of Board strategic priorities, land use planning for
the region, and the importance of climate change/sea level rise for the Strathcona Regional District and whether
additional funds are required to undertake specified deliverables for this area.
Requisition Allocation2019
Actual
2020
Budget
2021
Budget
2022
Budget
2023
Budget
2024
Budget
Electoral Area:
Area A ‐$ ‐$ 10$ 10$ 10$ 10$
Area B ‐ ‐ 8 8 8 8
Area C ‐ ‐ 24 24 24 24
Area D ‐ ‐ 31 31 31 31
Member Municipalities:
City of Campbell River ‐ ‐ 181 181 181 181
Village of Gold River ‐ ‐ 3 3 3 3
Village of Sayward ‐ ‐ 1 1 1 1
Village of Tahsis ‐ ‐ 1 1 1 1
Village of Zeballos ‐ ‐ 0 0 0 0
TOTAL ‐$ ‐$ 261$ 261$ 261$ 261$
Change $ ‐ 261 ‐ ‐ ‐
Change % n/a n/a ‐ ‐ ‐
Tax Rate Estimate (Per $1,000) 0.0000 $ 0.0000 $ 0.0000 $ 0.0000 $ 0.0000 $ 0.0000 $
Maximum Requisition Limit 240,495 $ 264,002 $
63
Regional Services
2020‐2024 APPROVED FINANCIAL PLAN
64
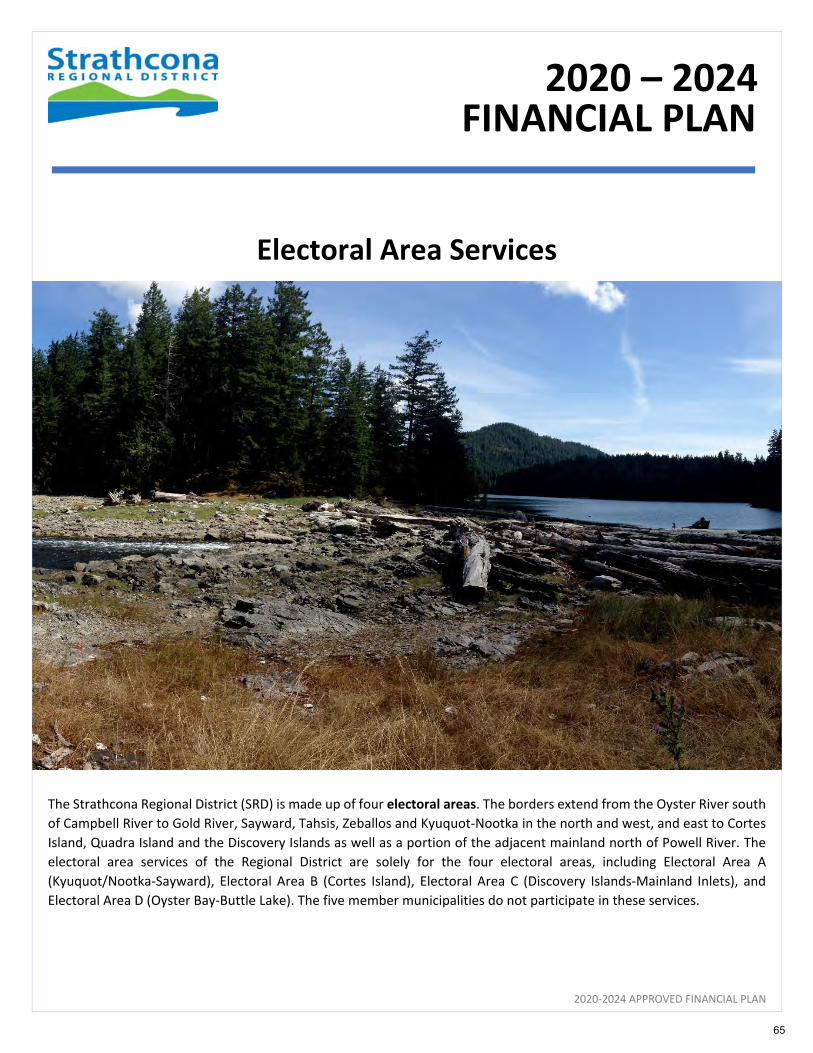
2020‐2024 APPROVED FINANCIAL PLAN
Electoral Area Services
The Strathcona Regional District (SRD) is made up of four electoral areas. The borders extend from the Oyster River south
of Campbell River to Gold River, Sayward, Tahsis, Zeballos and Kyuquot‐Nootka in the north and west, and east to Cortes
Island, Quadra Island and the Discovery Islands as well as a portion of the adjacent mainland north of Powell River. The
electoral area services of the Regional District are solely for the four electoral areas, including Electoral Area A
(Kyuquot/Nootka‐Sayward), Electoral Area B (Cortes Island), Electoral Area C (Discovery Islands‐Mainland Inlets), and
Electoral Area D (Oyster Bay‐Buttle Lake). The five member municipalities do not participate in these services.
FINANCIAL PLAN
2020 – 2024
Rebecca Spit, Quadra Island
65
Electoral Area Services Summary
2020‐2024 APPROVED FINANCIAL PLAN
Electoral Area Services includes the following functions:
Function # ‐ Function Description
130 ‐ Electoral Area Administration
131 ‐ Election Services
135 ‐ Gas Tax (CWF) Projects
340 ‐ Liquid Waste
500 ‐ Planning
501 ‐ Planning ‐ GIS
502 ‐ Planning ‐ Bylaw
630 ‐ Vancouver Island Regional Library
66

Function 130 – Electoral Area Administration
2020‐2024 APPROVED FINANCIAL PLAN
OVERVIEW:
The purpose of this budget is to provide funding for the administration of programs and services that are provided for the
benefit of electoral area constituents only. Those include:
Director compensation and director expense reimbursement, including expenses paid on behalf of a director by the Regional District and costs of electoral area constituency matters;
Participation in the affairs of affiliate organizations (UBCM, AVICC, FCM);
Electoral area administrative costs attributed by resolution of the Regional Board; and
Electoral area activities that are not included in another service establishing bylaw.
This service was established on August 1, 1965 under the Local Government Act section 800, and Board policy adopted
February 26, 2001. The annual net cost of the service is apportioned among all electoral areas based on real property
assessments. There is no stated requisition limit for this function.
OPERATING BUDGET:
BUDGET VARIANCE HIGHLIGHTS:
1/9/11 – Property tax requisition increase in 2020 due to increased costs in 2019 mainly related to director
remuneration; typically, this function expenses have been significantly less than budgeted which has maintained
the requisition year over year for many years.
8 – Transfers from reserves every four years to fund election costs.
2019
Projection
2019
Budget
2020
Budget
2021
Budget
2022
Budget
2023
Budget
2024
Budget
130 ‐ Electoral Area Administration
Operating Revenue
1 ‐ Property tax requisition (475,260) (475,260) (676,835) (710,321) (725,749) (742,862) (759,877)
6 ‐ Grants in lieu ‐ (1,000) ‐ ‐ ‐ ‐ ‐
8 ‐ Transfers from reserves ‐ ‐ ‐ ‐ (39,000) ‐ ‐
9 ‐ Prior year surplus (145,961) (150,857) (17,931) ‐ ‐ ‐ ‐
Operating Revenue Total (621,221) (627,117) (694,766) (710,321) (764,749) (742,862) (759,877)
Operating Expense
11 ‐ Operating expenses 546,583 558,582 660,325 675,693 691,530 707,849 724,666
14 ‐ Transfers to reserves 35,000 35,000 ‐ ‐ ‐ ‐ ‐
Operating Expense Total 581,583 593,582 660,325 675,693 691,530 707,849 724,666
130 ‐ Electoral Area Administration Total $ (39,638) $ (33,535) $ (34,441) $ (34,628) $ (73,219) $ (35,013) $ (35,211)
131 ‐ Election Services Total 13,287 25,114 25,114 25,114 63,514 25,114 25,114
135 ‐ Gas Tax (CWF) Projects Total 8,420 8,421 9,327 9,514 9,705 9,899 10,097
GRAND TOTAL $ (17,931) $ ‐ $ ‐ $ ‐ $ ‐ $ ‐ $ ‐
67
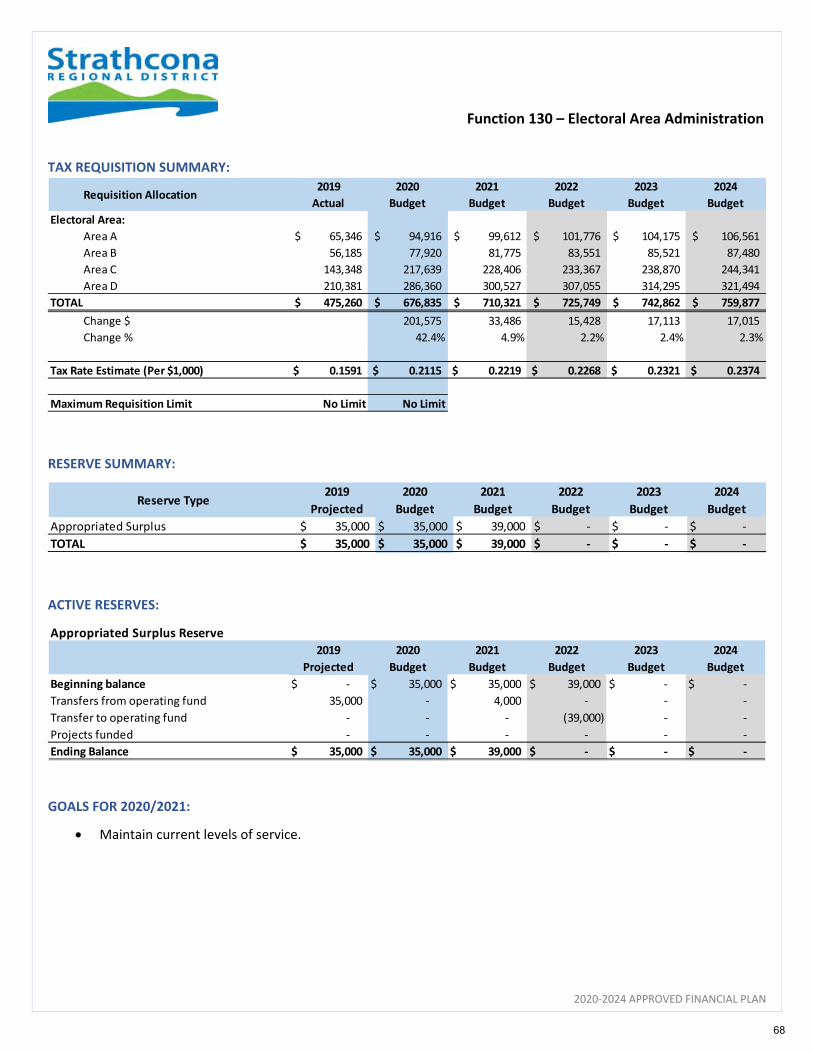
Function 130 – Electoral Area Administration
2020‐2024 APPROVED FINANCIAL PLAN
TAX REQUISITION SUMMARY:
RESERVE SUMMARY:
ACTIVE RESERVES:
GOALS FOR 2020/2021:
Maintain current levels of service.
Requisition Allocation2019
Actual
2020
Budget
2021
Budget
2022
Budget
2023
Budget
2024
Budget
Electoral Area:
Area A 65,346$ 94,916$ 99,612$ 101,776$ 104,175$ 106,561$
Area B 56,185 77,920 81,775 83,551 85,521 87,480
Area C 143,348 217,639 228,406 233,367 238,870 244,341
Area D 210,381 286,360 300,527 307,055 314,295 321,494
TOTAL 475,260$ 676,835$ 710,321$ 725,749$ 742,862$ 759,877$
Change $ 201,575 33,486 15,428 17,113 17,015
Change % 42.4% 4.9% 2.2% 2.4% 2.3%
Tax Rate Estimate (Per $1,000) 0.1591 $ 0.2115 $ 0.2219 $ 0.2268 $ 0.2321 $ 0.2374 $
Maximum Requisition Limit No Limit No Limit
Reserve Type2019
Projected
2020
Budget
2021
Budget
2022
Budget
2023
Budget
2024
Budget
Appropriated Surplus 35,000$ 35,000$ 39,000$ ‐$ ‐$ ‐$
TOTAL 35,000$ 35,000$ 39,000$ ‐$ ‐$ ‐$
Appropriated Surplus Reserve
2019
Projected
2020
Budget
2021
Budget
2022
Budget
2023
Budget
2024
Budget
Beginning balance ‐$ 35,000$ 35,000$ 39,000$ ‐$ ‐$
Transfers from operating fund 35,000 ‐ 4,000 ‐ ‐ ‐
Transfer to operating fund ‐ ‐ ‐ (39,000) ‐ ‐
Projects funded ‐ ‐ ‐ ‐ ‐ ‐
Ending Balance 35,000$ 35,000$ 39,000$ ‐$ ‐$ ‐$
68
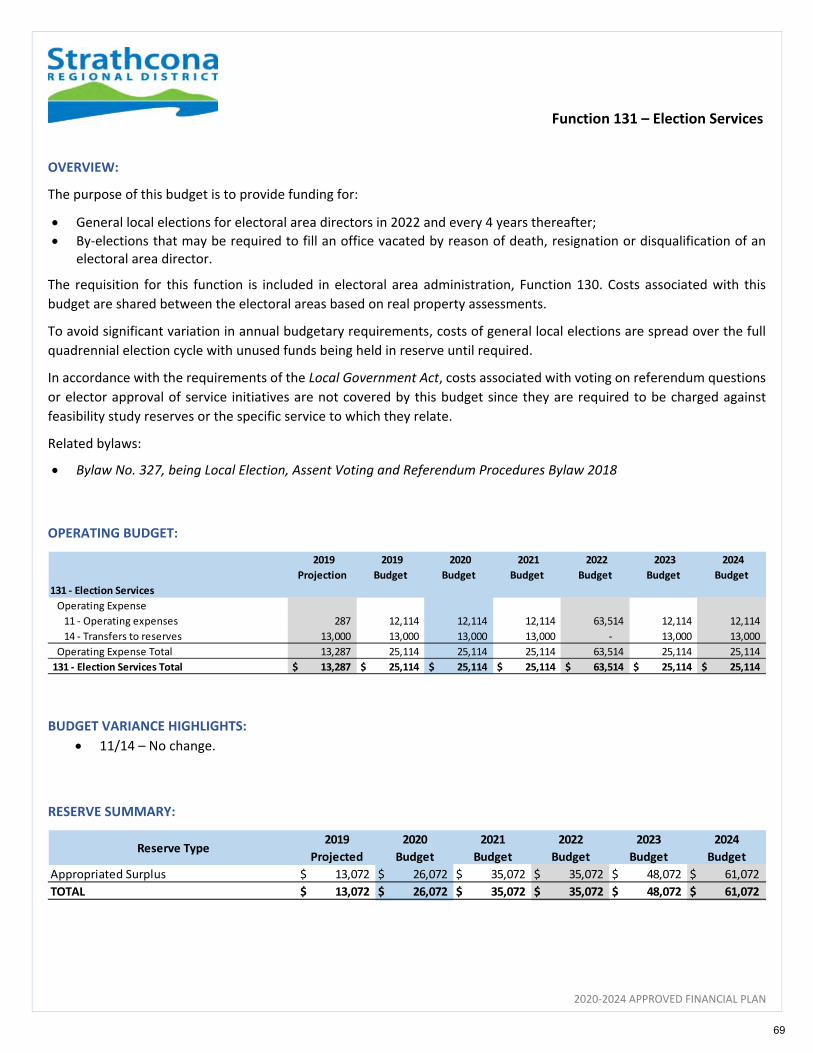
Function 131 – Election Services
2020‐2024 APPROVED FINANCIAL PLAN
OVERVIEW:
The purpose of this budget is to provide funding for:
General local elections for electoral area directors in 2022 and every 4 years thereafter;
By‐elections that may be required to fill an office vacated by reason of death, resignation or disqualification of an electoral area director.
The requisition for this function is included in electoral area administration, Function 130. Costs associated with this
budget are shared between the electoral areas based on real property assessments.
To avoid significant variation in annual budgetary requirements, costs of general local elections are spread over the full
quadrennial election cycle with unused funds being held in reserve until required.
In accordance with the requirements of the Local Government Act, costs associated with voting on referendum questions
or elector approval of service initiatives are not covered by this budget since they are required to be charged against
feasibility study reserves or the specific service to which they relate.
Related bylaws:
Bylaw No. 327, being Local Election, Assent Voting and Referendum Procedures Bylaw 2018
OPERATING BUDGET:
BUDGET VARIANCE HIGHLIGHTS:
11/14 – No change.
RESERVE SUMMARY:
2019
Projection
2019
Budget
2020
Budget
2021
Budget
2022
Budget
2023
Budget
2024
Budget
131 ‐ Election Services
Operating Expense
11 ‐ Operating expenses 287 12,114 12,114 12,114 63,514 12,114 12,114
14 ‐ Transfers to reserves 13,000 13,000 13,000 13,000 ‐ 13,000 13,000
Operating Expense Total 13,287 25,114 25,114 25,114 63,514 25,114 25,114
131 ‐ Election Services Total $ 13,287 $ 25,114 $ 25,114 $ 25,114 $ 63,514 $ 25,114 $ 25,114
Reserve Type2019
Projected
2020
Budget
2021
Budget
2022
Budget
2023
Budget
2024
Budget
Appropriated Surplus 13,072$ 26,072$ 35,072$ 35,072$ 48,072$ 61,072$
TOTAL 13,072$ 26,072$ 35,072$ 35,072$ 48,072$ 61,072$
69
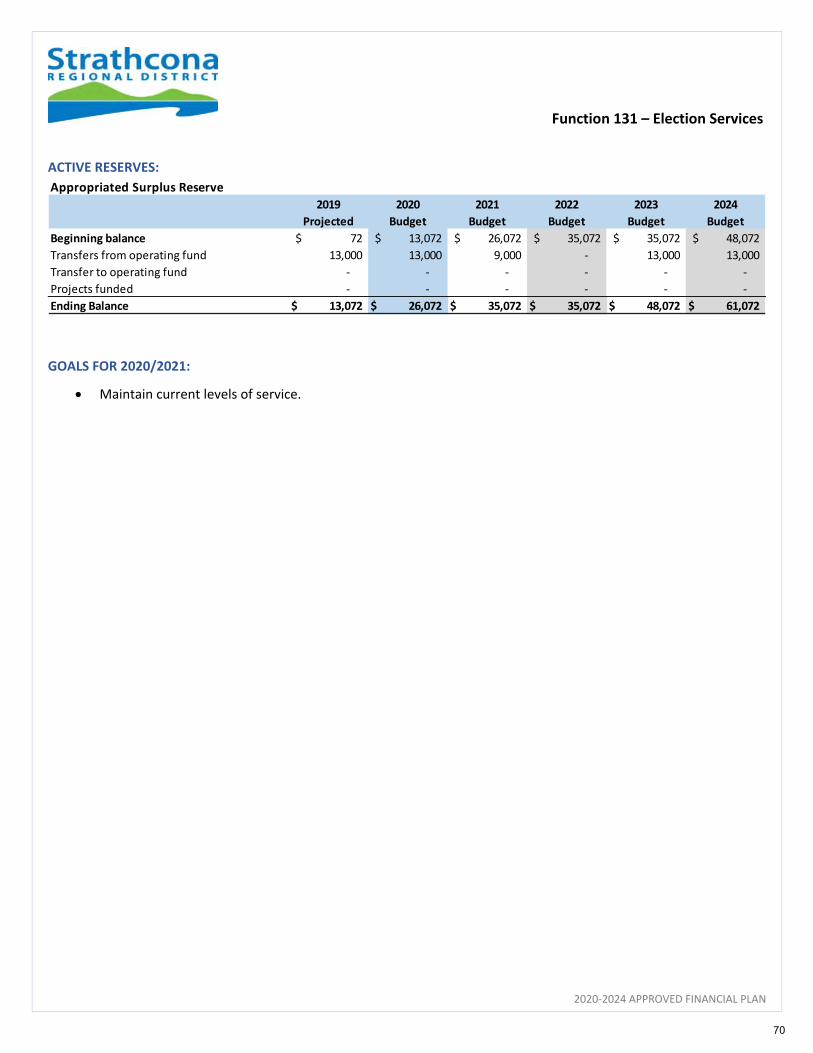
Function 131 – Election Services
2020‐2024 APPROVED FINANCIAL PLAN
ACTIVE RESERVES:
GOALS FOR 2020/2021:
Maintain current levels of service.
Appropriated Surplus Reserve
2019
Projected
2020
Budget
2021
Budget
2022
Budget
2023
Budget
2024
Budget
Beginning balance 72$ 13,072$ 26,072$ 35,072$ 35,072$ 48,072$
Transfers from operating fund 13,000 13,000 9,000 ‐ 13,000 13,000
Transfer to operating fund ‐ ‐ ‐ ‐ ‐ ‐
Projects funded ‐ ‐ ‐ ‐ ‐ ‐
Ending Balance 13,072$ 26,072$ 35,072$ 35,072$ 48,072$ 61,072$
70
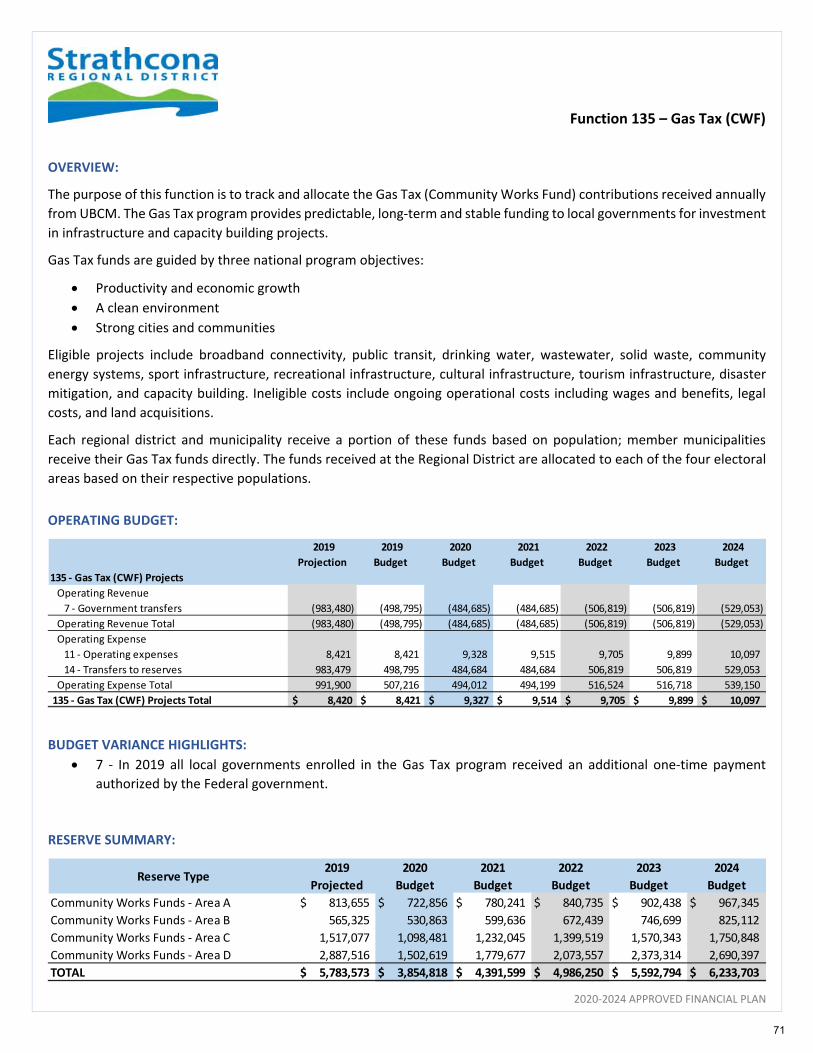
Function 135 – Gas Tax (CWF)
2020‐2024 APPROVED FINANCIAL PLAN
OVERVIEW:
The purpose of this function is to track and allocate the Gas Tax (Community Works Fund) contributions received annually
from UBCM. The Gas Tax program provides predictable, long‐term and stable funding to local governments for investment
in infrastructure and capacity building projects.
Gas Tax funds are guided by three national program objectives:
Productivity and economic growth
A clean environment
Strong cities and communities
Eligible projects include broadband connectivity, public transit, drinking water, wastewater, solid waste, community
energy systems, sport infrastructure, recreational infrastructure, cultural infrastructure, tourism infrastructure, disaster
mitigation, and capacity building. Ineligible costs include ongoing operational costs including wages and benefits, legal
costs, and land acquisitions.
Each regional district and municipality receive a portion of these funds based on population; member municipalities
receive their Gas Tax funds directly. The funds received at the Regional District are allocated to each of the four electoral
areas based on their respective populations.
OPERATING BUDGET:
BUDGET VARIANCE HIGHLIGHTS:
7 ‐ In 2019 all local governments enrolled in the Gas Tax program received an additional one‐time payment
authorized by the Federal government.
RESERVE SUMMARY:
2019
Projection
2019
Budget
2020
Budget
2021
Budget
2022
Budget
2023
Budget
2024
Budget
135 ‐ Gas Tax (CWF) Projects
Operating Revenue
7 ‐ Government transfers (983,480) (498,795) (484,685) (484,685) (506,819) (506,819) (529,053)
Operating Revenue Total (983,480) (498,795) (484,685) (484,685) (506,819) (506,819) (529,053)
Operating Expense
11 ‐ Operating expenses 8,421 8,421 9,328 9,515 9,705 9,899 10,097
14 ‐ Transfers to reserves 983,479 498,795 484,684 484,684 506,819 506,819 529,053
Operating Expense Total 991,900 507,216 494,012 494,199 516,524 516,718 539,150
135 ‐ Gas Tax (CWF) Projects Total $ 8,420 $ 8,421 $ 9,327 $ 9,514 $ 9,705 $ 9,899 $ 10,097
Reserve Type2019
Projected
2020
Budget
2021
Budget
2022
Budget
2023
Budget
2024
Budget
Community Works Funds ‐ Area A 813,655$ 722,856$ 780,241$ 840,735$ 902,438$ 967,345$
Community Works Funds ‐ Area B 565,325 530,863 599,636 672,439 746,699 825,112
Community Works Funds ‐ Area C 1,517,077 1,098,481 1,232,045 1,399,519 1,570,343 1,750,848
Community Works Funds ‐ Area D 2,887,516 1,502,619 1,779,677 2,073,557 2,373,314 2,690,397
TOTAL 5,783,573$ 3,854,818$ 4,391,599$ 4,986,250$ 5,592,794$ 6,233,703$
71
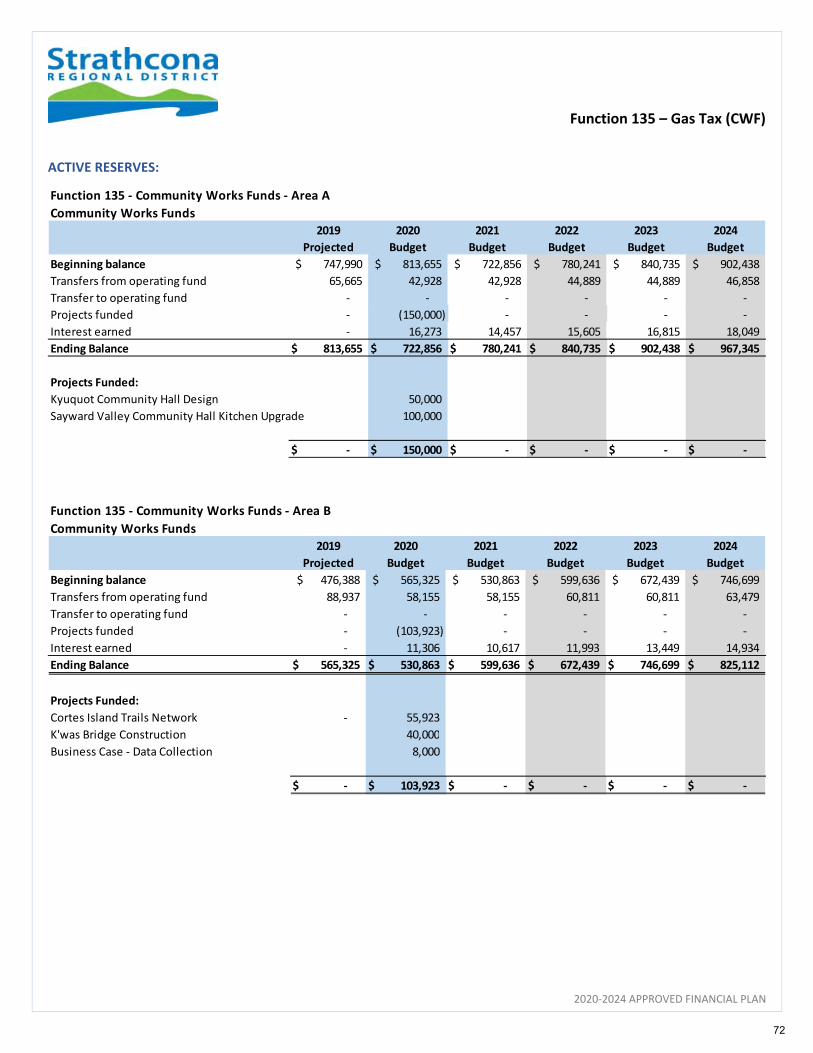
Function 135 – Gas Tax (CWF)
2020‐2024 APPROVED FINANCIAL PLAN
ACTIVE RESERVES:
Function 135 ‐ Community Works Funds ‐ Area A
Community Works Funds
2019
Projected
2020
Budget
2021
Budget
2022
Budget
2023
Budget
2024
Budget
Beginning balance 747,990$ 813,655$ 722,856$ 780,241$ 840,735$ 902,438$
Transfers from operating fund 65,665 42,928 42,928 44,889 44,889 46,858
Transfer to operating fund ‐ ‐ ‐ ‐ ‐ ‐
Projects funded ‐ (150,000) ‐ ‐ ‐ ‐
Interest earned ‐ 16,273 14,457 15,605 16,815 18,049
Ending Balance 813,655$ 722,856$ 780,241$ 840,735$ 902,438$ 967,345$
Projects Funded:
Kyuquot Community Hall Design 50,000
Sayward Valley Community Hall Kitchen Upgrade 100,000
‐$ 150,000$ ‐$ ‐$ ‐$ ‐$
Function 135 ‐ Community Works Funds ‐ Area B
Community Works Funds
2019
Projected
2020
Budget
2021
Budget
2022
Budget
2023
Budget
2024
Budget
Beginning balance 476,388$ 565,325$ 530,863$ 599,636$ 672,439$ 746,699$
Transfers from operating fund 88,937 58,155 58,155 60,811 60,811 63,479
Transfer to operating fund ‐ ‐ ‐ ‐ ‐ ‐
Projects funded ‐ (103,923) ‐ ‐ ‐ ‐
Interest earned ‐ 11,306 10,617 11,993 13,449 14,934
Ending Balance 565,325$ 530,863$ 599,636$ 672,439$ 746,699$ 825,112$
Projects Funded:
Cortes Island Trails Network ‐ 55,923
K'was Bridge Construction 40,000
Business Case ‐ Data Collection 8,000
‐$ 103,923$ ‐$ ‐$ ‐$ ‐$
72
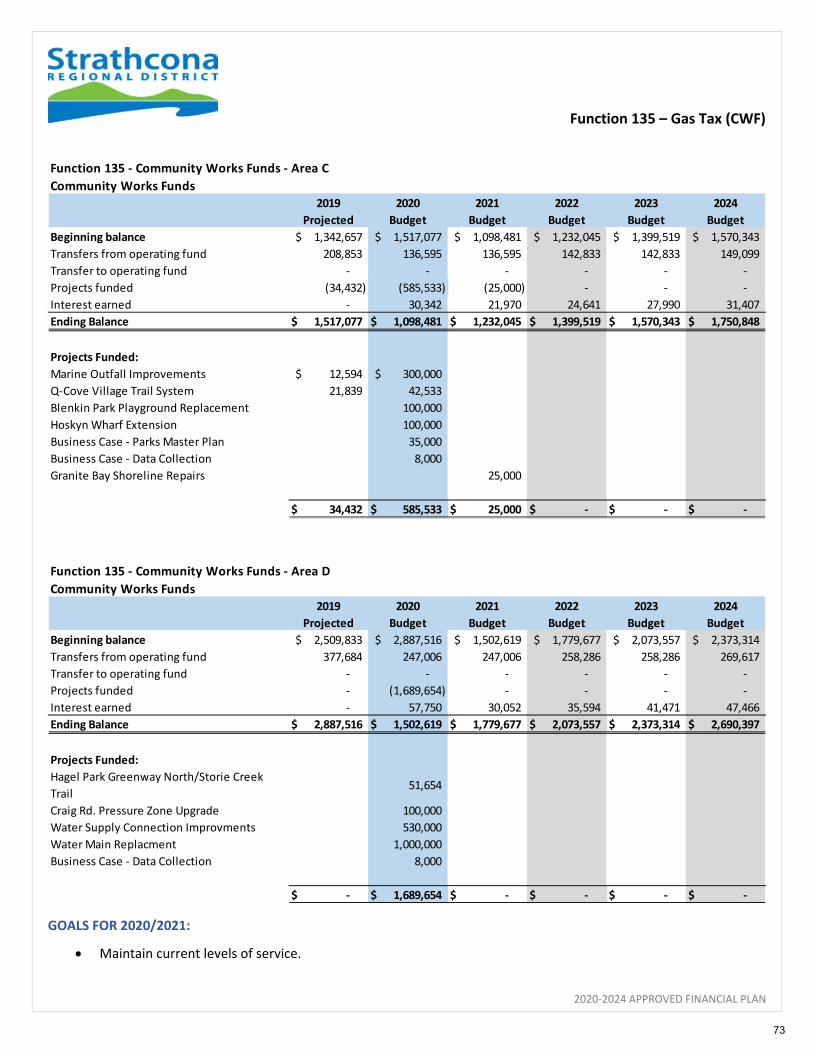
Function 135 – Gas Tax (CWF)
2020‐2024 APPROVED FINANCIAL PLAN
GOALS FOR 2020/2021:
Maintain current levels of service.
Function 135 ‐ Community Works Funds ‐ Area C
Community Works Funds
2019
Projected
2020
Budget
2021
Budget
2022
Budget
2023
Budget
2024
Budget
Beginning balance 1,342,657$ 1,517,077$ 1,098,481$ 1,232,045$ 1,399,519$ 1,570,343$
Transfers from operating fund 208,853 136,595 136,595 142,833 142,833 149,099
Transfer to operating fund ‐ ‐ ‐ ‐ ‐ ‐
Projects funded (34,432) (585,533) (25,000) ‐ ‐ ‐
Interest earned ‐ 30,342 21,970 24,641 27,990 31,407
Ending Balance 1,517,077$ 1,098,481$ 1,232,045$ 1,399,519$ 1,570,343$ 1,750,848$
Projects Funded:
Marine Outfall Improvements 12,594$ 300,000$
Q‐Cove Village Trail System 21,839 42,533
Blenkin Park Playground Replacement 100,000
Hoskyn Wharf Extension 100,000
Business Case ‐ Parks Master Plan 35,000
Business Case ‐ Data Collection 8,000
Granite Bay Shoreline Repairs 25,000
34,432$ 585,533$ 25,000$ ‐$ ‐$ ‐$
Function 135 ‐ Community Works Funds ‐ Area D
Community Works Funds
2019
Projected
2020
Budget
2021
Budget
2022
Budget
2023
Budget
2024
Budget
Beginning balance 2,509,833$ 2,887,516$ 1,502,619$ 1,779,677$ 2,073,557$ 2,373,314$
Transfers from operating fund 377,684 247,006 247,006 258,286 258,286 269,617
Transfer to operating fund ‐ ‐ ‐ ‐ ‐ ‐
Projects funded ‐ (1,689,654) ‐ ‐ ‐ ‐
Interest earned ‐ 57,750 30,052 35,594 41,471 47,466
Ending Balance 2,887,516$ 1,502,619$ 1,779,677$ 2,073,557$ 2,373,314$ 2,690,397$
Projects Funded:
Hagel Park Greenway North/Storie Creek
Trail51,654
Craig Rd. Pressure Zone Upgrade 100,000
Water Supply Connection Improvments 530,000
Water Main Replacment 1,000,000
Business Case ‐ Data Collection 8,000
‐$ 1,689,654$ ‐$ ‐$ ‐$ ‐$
73
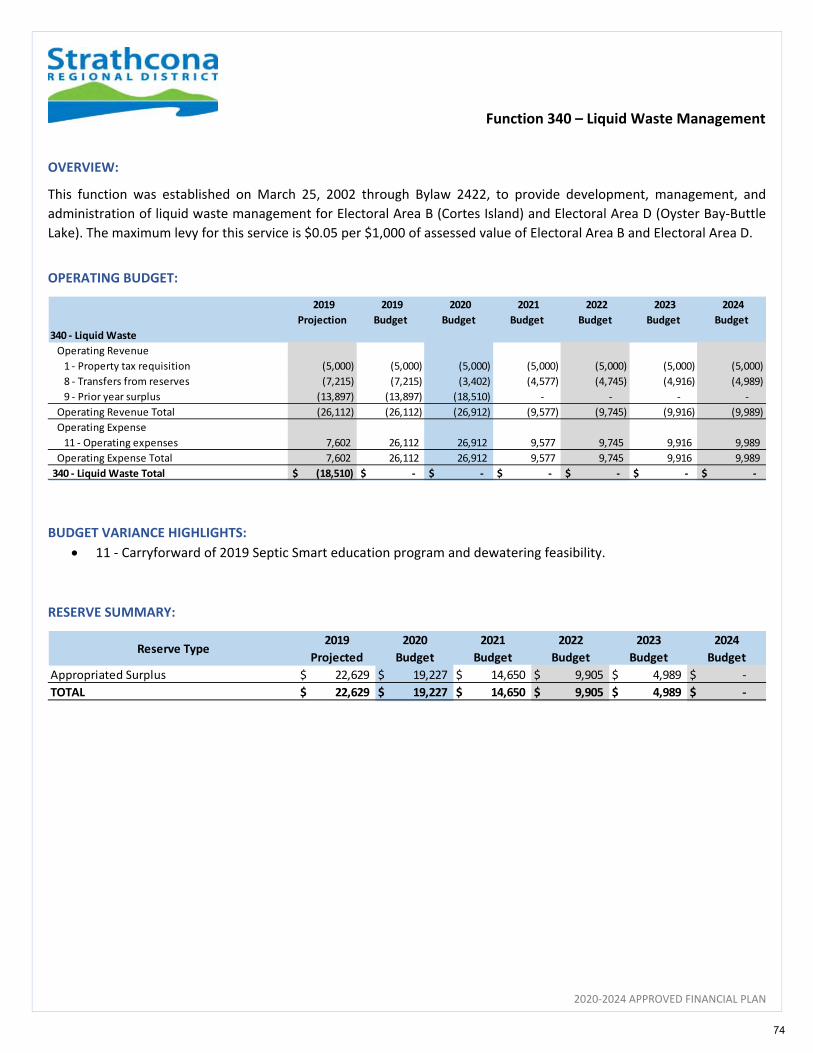
Function 340 – Liquid Waste Management
2020‐2024 APPROVED FINANCIAL PLAN
OVERVIEW:
This function was established on March 25, 2002 through Bylaw 2422, to provide development, management, and
administration of liquid waste management for Electoral Area B (Cortes Island) and Electoral Area D (Oyster Bay‐Buttle
Lake). The maximum levy for this service is $0.05 per $1,000 of assessed value of Electoral Area B and Electoral Area D.
OPERATING BUDGET:
BUDGET VARIANCE HIGHLIGHTS:
11 ‐ Carryforward of 2019 Septic Smart education program and dewatering feasibility.
RESERVE SUMMARY:
2019
Projection
2019
Budget
2020
Budget
2021
Budget
2022
Budget
2023
Budget
2024
Budget
340 ‐ Liquid Waste
Operating Revenue
1 ‐ Property tax requisition (5,000) (5,000) (5,000) (5,000) (5,000) (5,000) (5,000)
8 ‐ Transfers from reserves (7,215) (7,215) (3,402) (4,577) (4,745) (4,916) (4,989)
9 ‐ Prior year surplus (13,897) (13,897) (18,510) ‐ ‐ ‐ ‐
Operating Revenue Total (26,112) (26,112) (26,912) (9,577) (9,745) (9,916) (9,989)
Operating Expense
11 ‐ Operating expenses 7,602 26,112 26,912 9,577 9,745 9,916 9,989
Operating Expense Total 7,602 26,112 26,912 9,577 9,745 9,916 9,989
340 ‐ Liquid Waste Total $ (18,510) $ ‐ $ ‐ $ ‐ $ ‐ $ ‐ $ ‐
Reserve Type2019
Projected
2020
Budget
2021
Budget
2022
Budget
2023
Budget
2024
Budget
Appropriated Surplus 22,629$ 19,227$ 14,650$ 9,905$ 4,989$ ‐$
TOTAL 22,629$ 19,227$ 14,650$ 9,905$ 4,989$ ‐$
74
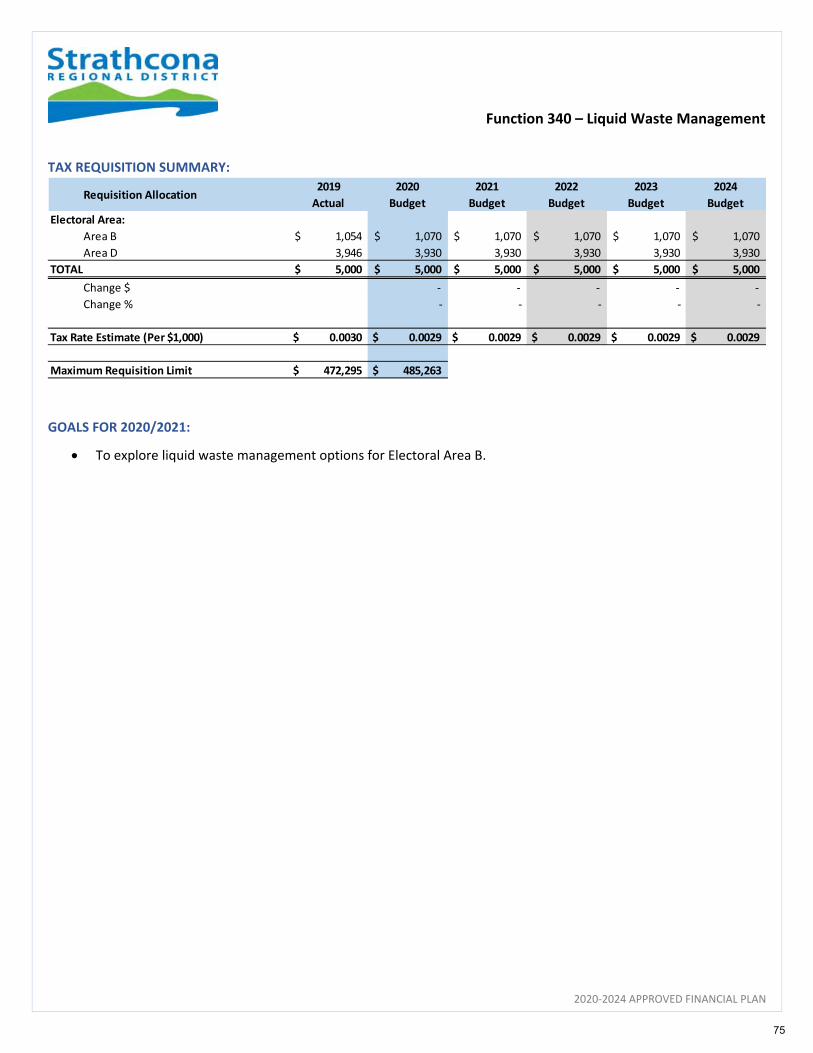
Function 340 – Liquid Waste Management
2020‐2024 APPROVED FINANCIAL PLAN
TAX REQUISITION SUMMARY:
GOALS FOR 2020/2021:
To explore liquid waste management options for Electoral Area B.
Requisition Allocation2019
Actual
2020
Budget
2021
Budget
2022
Budget
2023
Budget
2024
Budget
Electoral Area:
Area B 1,054$ 1,070$ 1,070$ 1,070$ 1,070$ 1,070$
Area D 3,946 3,930 3,930 3,930 3,930 3,930
TOTAL 5,000$ 5,000$ 5,000$ 5,000$ 5,000$ 5,000$
Change $ ‐ ‐ ‐ ‐ ‐
Change % ‐ ‐ ‐ ‐ ‐
Tax Rate Estimate (Per $1,000) 0.0030 $ 0.0029 $ 0.0029 $ 0.0029 $ 0.0029 $ 0.0029 $
Maximum Requisition Limit 472,295 $ 485,263 $
75
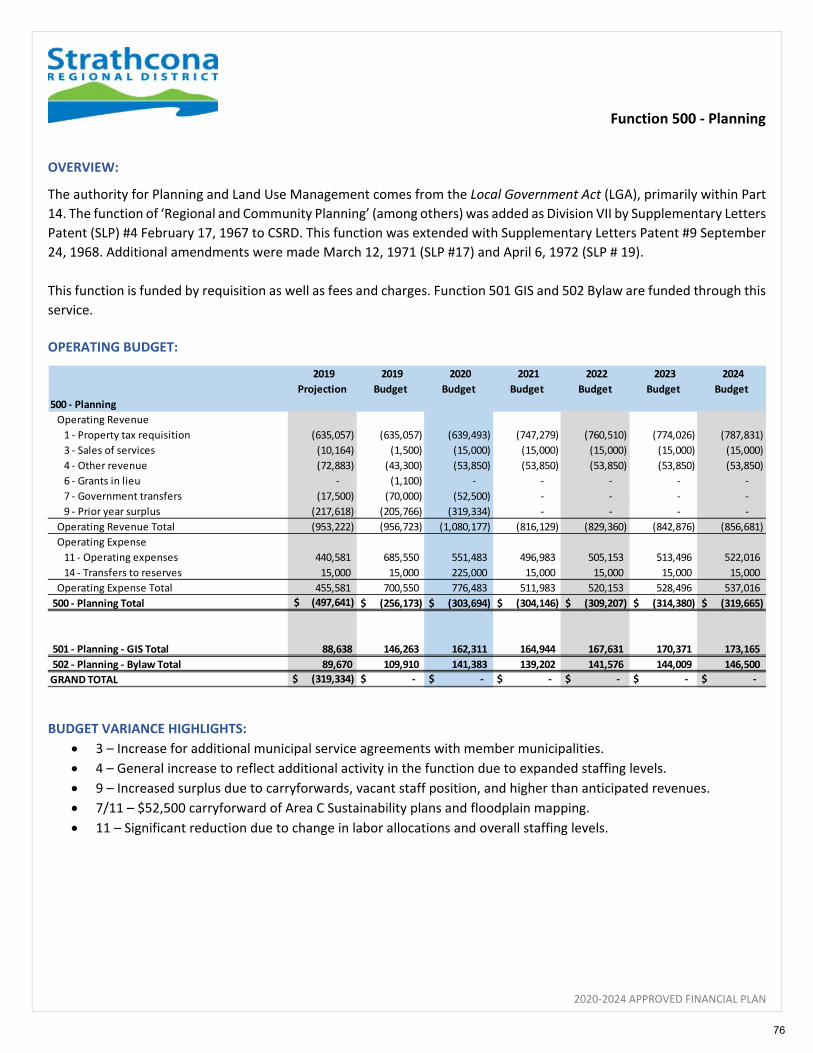
Function 500 ‐ Planning
2020‐2024 APPROVED FINANCIAL PLAN
OVERVIEW:
The authority for Planning and Land Use Management comes from the Local Government Act (LGA), primarily within Part
14. The function of ‘Regional and Community Planning’ (among others) was added as Division VII by Supplementary Letters
Patent (SLP) #4 February 17, 1967 to CSRD. This function was extended with Supplementary Letters Patent #9 September
24, 1968. Additional amendments were made March 12, 1971 (SLP #17) and April 6, 1972 (SLP # 19).
This function is funded by requisition as well as fees and charges. Function 501 GIS and 502 Bylaw are funded through this
service.
OPERATING BUDGET:
BUDGET VARIANCE HIGHLIGHTS:
3 – Increase for additional municipal service agreements with member municipalities.
4 – General increase to reflect additional activity in the function due to expanded staffing levels.
9 – Increased surplus due to carryforwards, vacant staff position, and higher than anticipated revenues.
7/11 – $52,500 carryforward of Area C Sustainability plans and floodplain mapping.
11 – Significant reduction due to change in labor allocations and overall staffing levels.
2019
Projection
2019
Budget
2020
Budget
2021
Budget
2022
Budget
2023
Budget
2024
Budget
500 ‐ Planning
Operating Revenue
1 ‐ Property tax requisition (635,057) (635,057) (639,493) (747,279) (760,510) (774,026) (787,831)
3 ‐ Sales of services (10,164) (1,500) (15,000) (15,000) (15,000) (15,000) (15,000)
4 ‐ Other revenue (72,883) (43,300) (53,850) (53,850) (53,850) (53,850) (53,850)
6 ‐ Grants in lieu ‐ (1,100) ‐ ‐ ‐ ‐ ‐
7 ‐ Government transfers (17,500) (70,000) (52,500) ‐ ‐ ‐ ‐
9 ‐ Prior year surplus (217,618) (205,766) (319,334) ‐ ‐ ‐ ‐
Operating Revenue Total (953,222) (956,723) (1,080,177) (816,129) (829,360) (842,876) (856,681)
Operating Expense
11 ‐ Operating expenses 440,581 685,550 551,483 496,983 505,153 513,496 522,016
14 ‐ Transfers to reserves 15,000 15,000 225,000 15,000 15,000 15,000 15,000
Operating Expense Total 455,581 700,550 776,483 511,983 520,153 528,496 537,016
500 ‐ Planning Total (497,641)$ $ (256,173) $ (303,694) $ (304,146) $ (309,207) $ (314,380) $ (319,665)
501 ‐ Planning ‐ GIS Total 88,638 146,263 162,311 164,944 167,631 170,371 173,165
502 ‐ Planning ‐ Bylaw Total 89,670 109,910 141,383 139,202 141,576 144,009 146,500
GRAND TOTAL $ (319,334) $ ‐ $ ‐ $ ‐ $ ‐ $ ‐ $ ‐
76
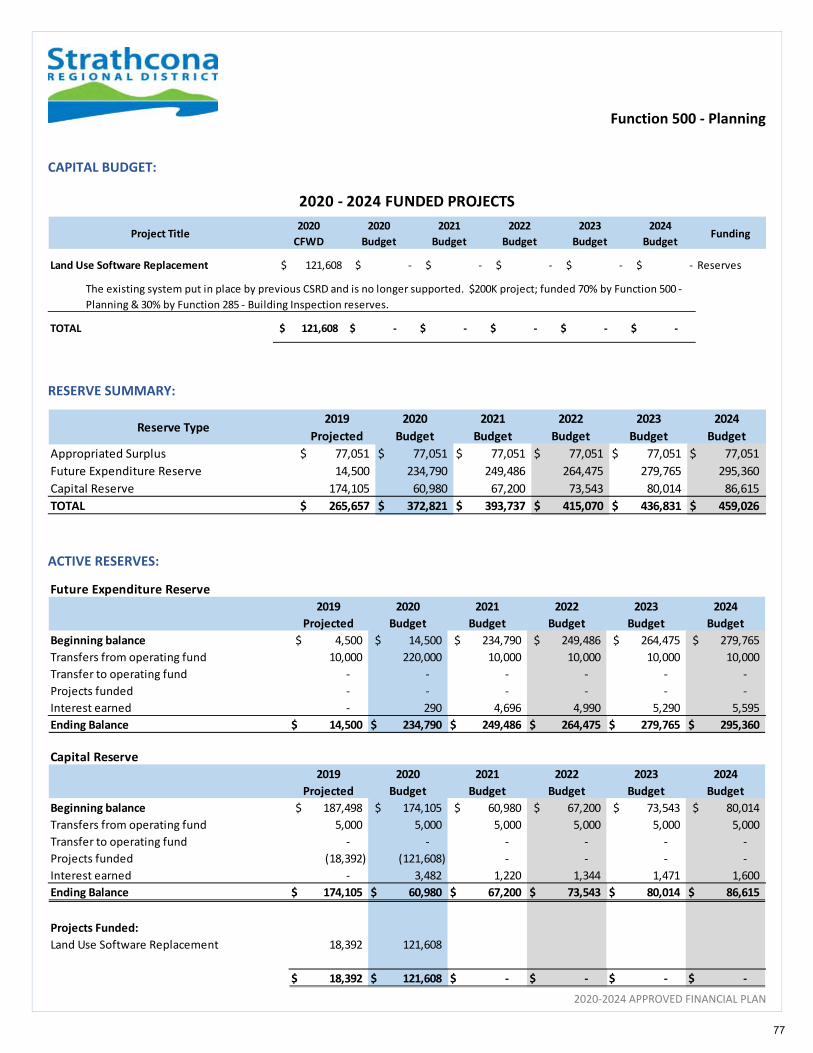
Function 500 ‐ Planning
2020‐2024 APPROVED FINANCIAL PLAN
CAPITAL BUDGET:
RESERVE SUMMARY:
ACTIVE RESERVES:
Project Title2020
CFWD
2020
Budget
2021
Budget
2022
Budget
2023
Budget
2024
BudgetFunding
Land Use Software Replacement $ 121,608 $ ‐ $ ‐ $ ‐ $ ‐ $ ‐ Reserves
TOTAL 121,608$ ‐$ ‐$ ‐$ ‐$ ‐$
2020 ‐ 2024 FUNDED PROJECTS
The existing system put in place by previous CSRD and is no longer supported. $200K project; funded 70% by Function 500 ‐
Planning & 30% by Function 285 ‐ Building Inspection reserves.
Reserve Type2019
Projected
2020
Budget
2021
Budget
2022
Budget
2023
Budget
2024
Budget
Appropriated Surplus 77,051$ 77,051$ 77,051$ 77,051$ 77,051$ 77,051$
Future Expenditure Reserve 14,500 234,790 249,486 264,475 279,765 295,360
Capital Reserve 174,105 60,980 67,200 73,543 80,014 86,615
TOTAL 265,657$ 372,821$ 393,737$ 415,070$ 436,831$ 459,026$
Future Expenditure Reserve
2019
Projected
2020
Budget
2021
Budget
2022
Budget
2023
Budget
2024
Budget
Beginning balance 4,500$ 14,500$ 234,790$ 249,486$ 264,475$ 279,765$
Transfers from operating fund 10,000 220,000 10,000 10,000 10,000 10,000
Transfer to operating fund ‐ ‐ ‐ ‐ ‐ ‐
Projects funded ‐ ‐ ‐ ‐ ‐ ‐
Interest earned ‐ 290 4,696 4,990 5,290 5,595
Ending Balance 14,500$ 234,790$ 249,486$ 264,475$ 279,765$ 295,360$
Capital Reserve
2019
Projected
2020
Budget
2021
Budget
2022
Budget
2023
Budget
2024
Budget
Beginning balance 187,498$ 174,105$ 60,980$ 67,200$ 73,543$ 80,014$
Transfers from operating fund 5,000 5,000 5,000 5,000 5,000 5,000
Transfer to operating fund ‐ ‐ ‐ ‐ ‐ ‐
Projects funded (18,392) (121,608) ‐ ‐ ‐ ‐
Interest earned ‐ 3,482 1,220 1,344 1,471 1,600
Ending Balance 174,105$ 60,980$ 67,200$ 73,543$ 80,014$ 86,615$
Projects Funded:
Land Use Software Replacement 18,392 121,608
18,392$ 121,608$ ‐$ ‐$ ‐$ ‐$
77

Function 500 ‐ Planning
2020‐2024 APPROVED FINANCIAL PLAN
TAX REQUISITION SUMMARY:
GOALS FOR 2020/2021:
Complete installation and implementation of the new land use software CityView to integrate all property
information.
Complete the Integrated Community Sustainability Plan for Electoral Area C.
Complete the Cortes Island Zoning Bylaw Review.
Complete a review of Bylaw No. 5 ‐ Planning Procedures and Fees Bylaw.
Action the outstanding Oyster Bay‐Buttle Lake Official Community Plan proposed draft plan.
Initiate review of the Quadra Island Zoning Bylaw.
Initiate Bylaw 1460 Desolation Sound Rural Land Use Bylaw to create an OCP for the area as well as an
accompanying regulatory zoning bylaw.
Requisition Allocation2019
Actual
2020
Budget
2021
Budget
2022
Budget
2023
Budget
2024
Budget
Electoral Area:
Area A 87,317$ 89,679$ 104,795$ 106,650$ 108,546$ 110,482$
Area B 75,076 73,621 86,030 87,553 89,109 90,699
Area C 191,546 205,631 240,290 244,545 248,891 253,330
Area D 281,118 270,561 316,164 321,762 327,480 333,321
TOTAL 635,057$ 639,493$ 747,279$ 760,510$ 774,026$ 787,831$
Change $ 4,436 107,786 13,231 13,516 13,805
Change % 0.7% 16.9% 1.8% 1.8% 1.8%
Tax Rate Estimate (Per $1,000) 0.2126 $ 0.1998 $ 0.2335 $ 0.2376 $ 0.2419 $ 0.2462 $
Maximum Requisition Limit No Limit No Limit
78
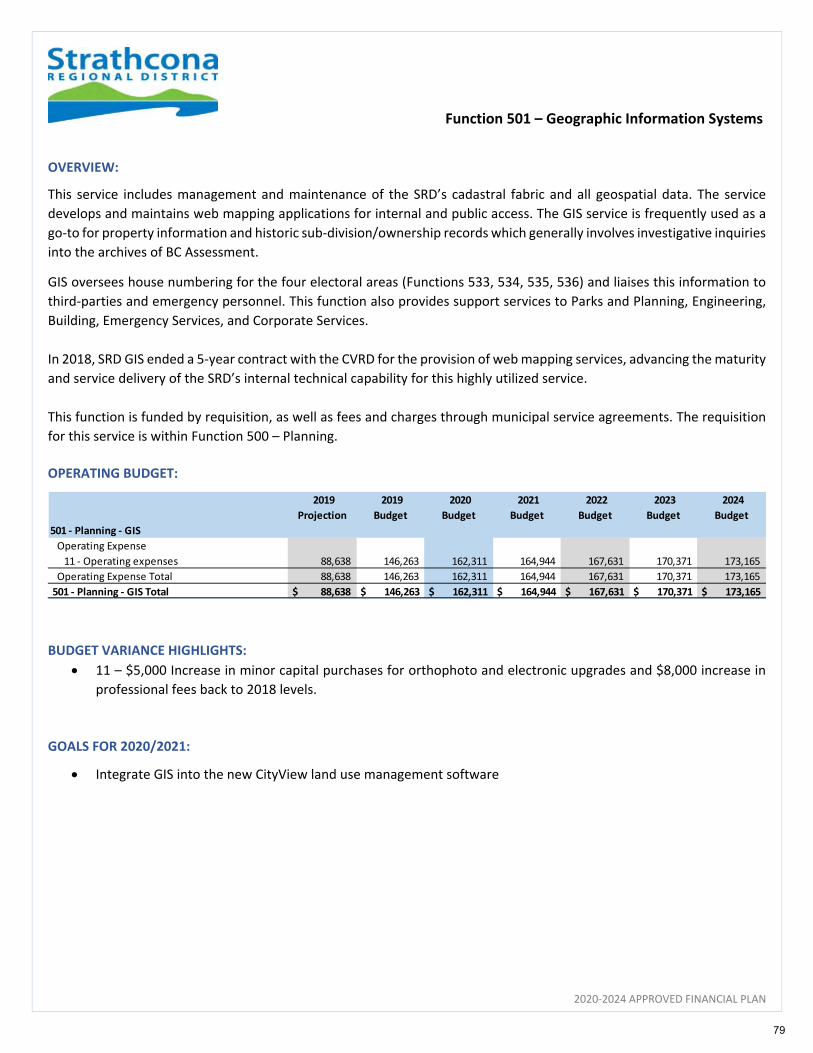
Function 501 – Geographic Information Systems
2020‐2024 APPROVED FINANCIAL PLAN
OVERVIEW:
This service includes management and maintenance of the SRD’s cadastral fabric and all geospatial data. The service
develops and maintains web mapping applications for internal and public access. The GIS service is frequently used as a
go‐to for property information and historic sub‐division/ownership records which generally involves investigative inquiries
into the archives of BC Assessment.
GIS oversees house numbering for the four electoral areas (Functions 533, 534, 535, 536) and liaises this information to
third‐parties and emergency personnel. This function also provides support services to Parks and Planning, Engineering,
Building, Emergency Services, and Corporate Services.
In 2018, SRD GIS ended a 5‐year contract with the CVRD for the provision of web mapping services, advancing the maturity
and service delivery of the SRD’s internal technical capability for this highly utilized service.
This function is funded by requisition, as well as fees and charges through municipal service agreements. The requisition
for this service is within Function 500 – Planning.
OPERATING BUDGET:
BUDGET VARIANCE HIGHLIGHTS:
11 – $5,000 Increase in minor capital purchases for orthophoto and electronic upgrades and $8,000 increase in
professional fees back to 2018 levels.
GOALS FOR 2020/2021:
Integrate GIS into the new CityView land use management software
2019
Projection
2019
Budget
2020
Budget
2021
Budget
2022
Budget
2023
Budget
2024
Budget
501 ‐ Planning ‐ GIS
Operating Expense
11 ‐ Operating expenses 88,638 146,263 162,311 164,944 167,631 170,371 173,165
Operating Expense Total 88,638 146,263 162,311 164,944 167,631 170,371 173,165
501 ‐ Planning ‐ GIS Total $ 88,638 $ 146,263 $ 162,311 $ 164,944 $ 167,631 $ 170,371 $ 173,165
79
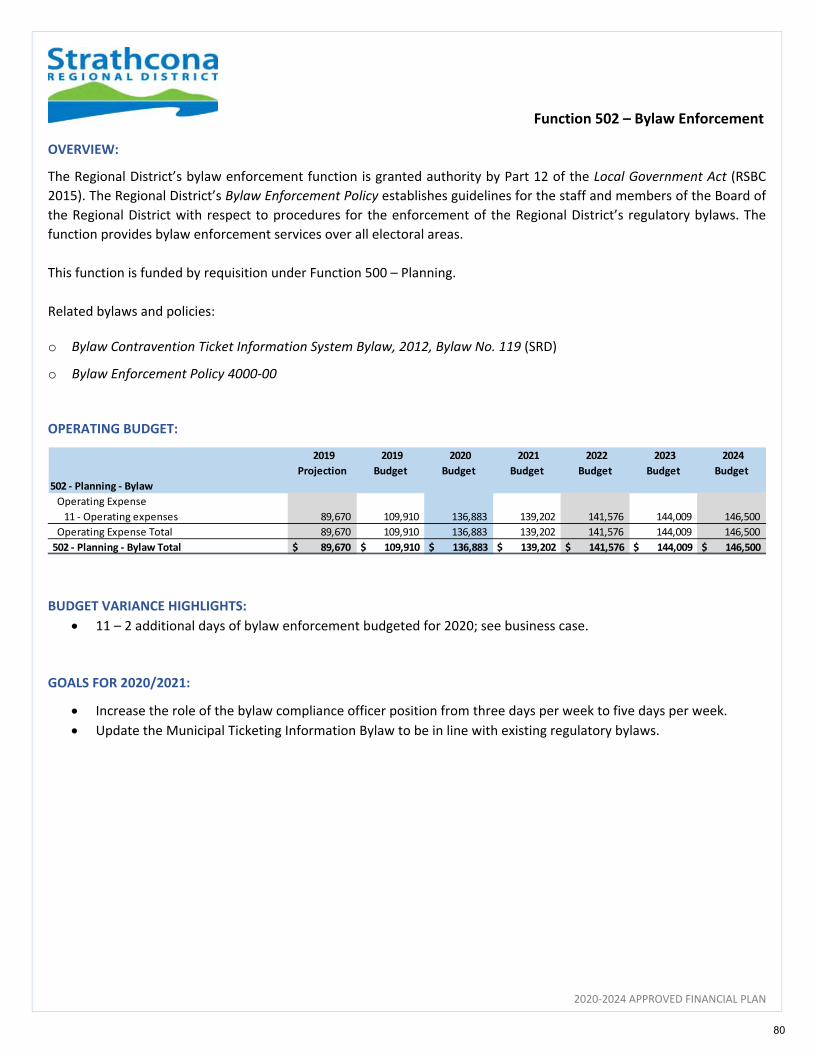
Function 502 – Bylaw Enforcement
2020‐2024 APPROVED FINANCIAL PLAN
OVERVIEW:
The Regional District’s bylaw enforcement function is granted authority by Part 12 of the Local Government Act (RSBC
2015). The Regional District’s Bylaw Enforcement Policy establishes guidelines for the staff and members of the Board of
the Regional District with respect to procedures for the enforcement of the Regional District’s regulatory bylaws. The
function provides bylaw enforcement services over all electoral areas.
This function is funded by requisition under Function 500 – Planning.
Related bylaws and policies:
o Bylaw Contravention Ticket Information System Bylaw, 2012, Bylaw No. 119 (SRD)
o Bylaw Enforcement Policy 4000‐00
OPERATING BUDGET:
BUDGET VARIANCE HIGHLIGHTS:
11 – 2 additional days of bylaw enforcement budgeted for 2020; see business case.
GOALS FOR 2020/2021:
Increase the role of the bylaw compliance officer position from three days per week to five days per week.
Update the Municipal Ticketing Information Bylaw to be in line with existing regulatory bylaws.
2019
Projection
2019
Budget
2020
Budget
2021
Budget
2022
Budget
2023
Budget
2024
Budget
502 ‐ Planning ‐ Bylaw
Operating Expense
11 ‐ Operating expenses 89,670 109,910 136,883 139,202 141,576 144,009 146,500
Operating Expense Total 89,670 109,910 136,883 139,202 141,576 144,009 146,500
502 ‐ Planning ‐ Bylaw Total $ 89,670 $ 109,910 $ 136,883 $ 139,202 $ 141,576 $ 144,009 $ 146,500
80
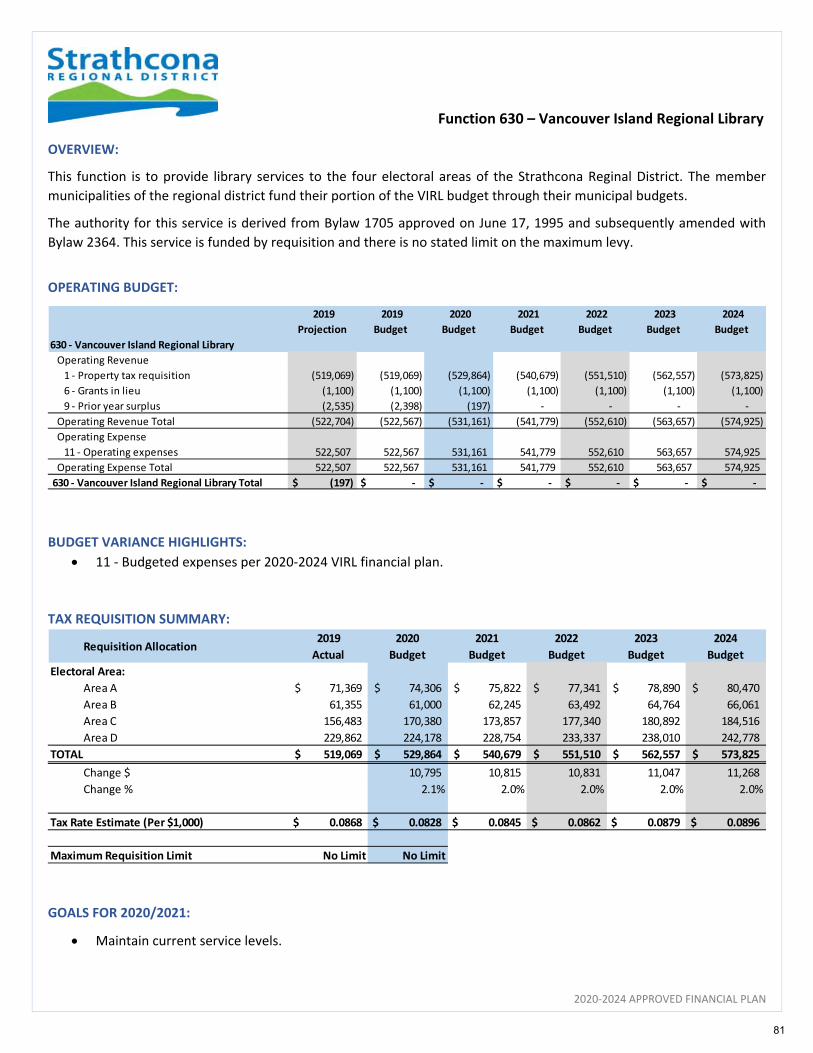
Function 630 – Vancouver Island Regional Library
2020‐2024 APPROVED FINANCIAL PLAN
OVERVIEW:
This function is to provide library services to the four electoral areas of the Strathcona Reginal District. The member
municipalities of the regional district fund their portion of the VIRL budget through their municipal budgets.
The authority for this service is derived from Bylaw 1705 approved on June 17, 1995 and subsequently amended with
Bylaw 2364. This service is funded by requisition and there is no stated limit on the maximum levy.
OPERATING BUDGET:
BUDGET VARIANCE HIGHLIGHTS:
11 ‐ Budgeted expenses per 2020‐2024 VIRL financial plan.
TAX REQUISITION SUMMARY:
GOALS FOR 2020/2021:
Maintain current service levels.
2019
Projection
2019
Budget
2020
Budget
2021
Budget
2022
Budget
2023
Budget
2024
Budget
630 ‐ Vancouver Island Regional Library
Operating Revenue
1 ‐ Property tax requisition (519,069) (519,069) (529,864) (540,679) (551,510) (562,557) (573,825)
6 ‐ Grants in lieu (1,100) (1,100) (1,100) (1,100) (1,100) (1,100) (1,100)
9 ‐ Prior year surplus (2,535) (2,398) (197) ‐ ‐ ‐ ‐
Operating Revenue Total (522,704) (522,567) (531,161) (541,779) (552,610) (563,657) (574,925)
Operating Expense
11 ‐ Operating expenses 522,507 522,567 531,161 541,779 552,610 563,657 574,925
Operating Expense Total 522,507 522,567 531,161 541,779 552,610 563,657 574,925
630 ‐ Vancouver Island Regional Library Total $ (197) $ ‐ $ ‐ $ ‐ $ ‐ $ ‐ $ ‐
Requisition Allocation2019
Actual
2020
Budget
2021
Budget
2022
Budget
2023
Budget
2024
Budget
Electoral Area:
Area A 71,369$ 74,306$ 75,822$ 77,341$ 78,890$ 80,470$
Area B 61,355 61,000 62,245 63,492 64,764 66,061
Area C 156,483 170,380 173,857 177,340 180,892 184,516
Area D 229,862 224,178 228,754 233,337 238,010 242,778
TOTAL 519,069$ 529,864$ 540,679$ 551,510$ 562,557$ 573,825$
Change $ 10,795 10,815 10,831 11,047 11,268
Change % 2.1% 2.0% 2.0% 2.0% 2.0%
Tax Rate Estimate (Per $1,000) 0.0868 $ 0.0828 $ 0.0845 $ 0.0862 $ 0.0879 $ 0.0896 $
Maximum Requisition Limit No Limit No Limit
81

Electoral Area Service – Business Cases
2020‐2024 APPROVED FINANCIAL PLAN
2020 Financial Plan - Business Case Enhanced Bylaw Enforcement Services
Executive Summary
The demand for bylaw enforcement services continues to grow and exceeds the capacity of the existing staff resource. Enhancing the current service to five days per week from the existing three days per week will increase the capacity of the department and provide a resource to more effectively manage workloads and enhance overall service delivery.
Business Problem and Opportunity
The Community Services Branch has consistently seen increases in workloads associated with bylaw enforcement across the region. The Board, as part of the 2019 budget process created a dedicated 3 day per week bylaw enforcement position, from 2 days per week. This arrangement has been in effect for nearly one year and although this service has been vastly improved, it continues to be found insufficient in managing the workloads of the department, especially when factoring in the service provided to member municipalities.
There are currently approximately 50 open bylaw enforcement files that are at varying stages of enforcement. The 2019 budget increase to provide for a dedicated three day per week position has increased the overall capacity and has contributed to the closing of many historic files. That being said, the current arrangement continues to restrict timely and due consideration of active bylaw enforcement files. This in turn continues to contribute to the SRD’s low credibility with the public in dealing with enforcement issues. Adding to the existing situation is the bylaw enforcement services 2019/2020 workplans, which includes several necessary policy and regulatory updates, including a full review of the SRD’s ticketing bylaw.
Existing staff resources are not sufficient to effectively manage current workloads and provide effective service delivery. The inability to complete projects on schedule is compromising the SRD’s credibility in the community as an effective and responsive organization. In 2019, 43 new bylaw enforcement files have been opened and although 31 of those new 2019 files have since been closed there still remains 50 current active bylaw enforcement files for one part time compliance officer.
Proposed Project Objectives
To improve the delivery of bylaw enforcement services within the Community Services Branch.
To address the SRD’s low credibility with respect to bylaw enforcement and have the capacity to improve on response times and enforcement outcomes. The addition of a enhancement of the bylaw enforcement officer position will allow the SRD for more timely delivery of enforcement matters including response times for complaints and resolution of enforcement files.
Business Risks
There are no risks and numerous benefits associated with this proposal, including increased credibility with respect to bylaw enforcement. Alternatively, it is likely that there are risks associated with not enhancing bylaw enforcement services, which may include reducing the likelihood of success during legal action.
Cost Benefits Analysis and Proposed Sources of Funding
The bylaw enforcement budget would require an increase to enhance the service to 5 days per week, from the current 3 days per week. This service is funded by all four Electoral Areas of the SRD. The cost below includes wages and benefits to add 2 more days to bylaw services. Note that there is current and future potential to offset some of these costs by expanding services to the member municipalities for bylaw inspection services. For example, currently the Village of Tahsis utilizes the SRD’s bylaw service on a schedule of one day bi-weekly and has committed to increase this to one day per week.
a) Total Costs 2020 2021 2022 2023 2024
Capital Costs $ $ $ $ $
Operational Revenues $ $ $ $ $
Operational Costs $30,199 $30,803 $31,419 $32,047 $32,688
Total $30,199 $30,803 $31,419 $32,047 $32,688
82
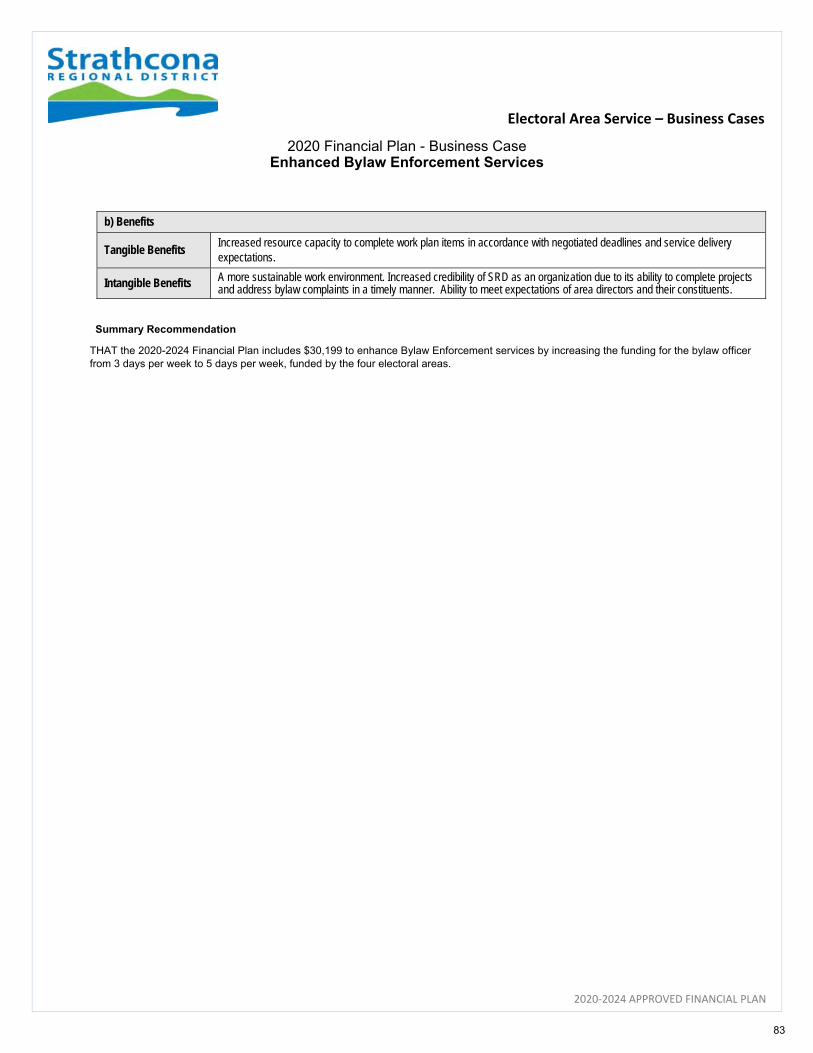
Electoral Area Service – Business Cases
2020‐2024 APPROVED FINANCIAL PLAN
2020 Financial Plan - Business Case Enhanced Bylaw Enforcement Services
Summary Recommendation
THAT the 2020-2024 Financial Plan includes $30,199 to enhance Bylaw Enforcement services by increasing the funding for the bylaw officer from 3 days per week to 5 days per week, funded by the four electoral areas.
b) Benefits
Tangible Benefits Increased resource capacity to complete work plan items in accordance with negotiated deadlines and service delivery expectations.
Intangible Benefits A more sustainable work environment. Increased credibility of SRD as an organization due to its ability to complete projects and address bylaw complaints in a timely manner. Ability to meet expectations of area directors and their constituents.
83
Electoral Area Services
2020‐2024 APPROVED FINANCIAL PLAN
84
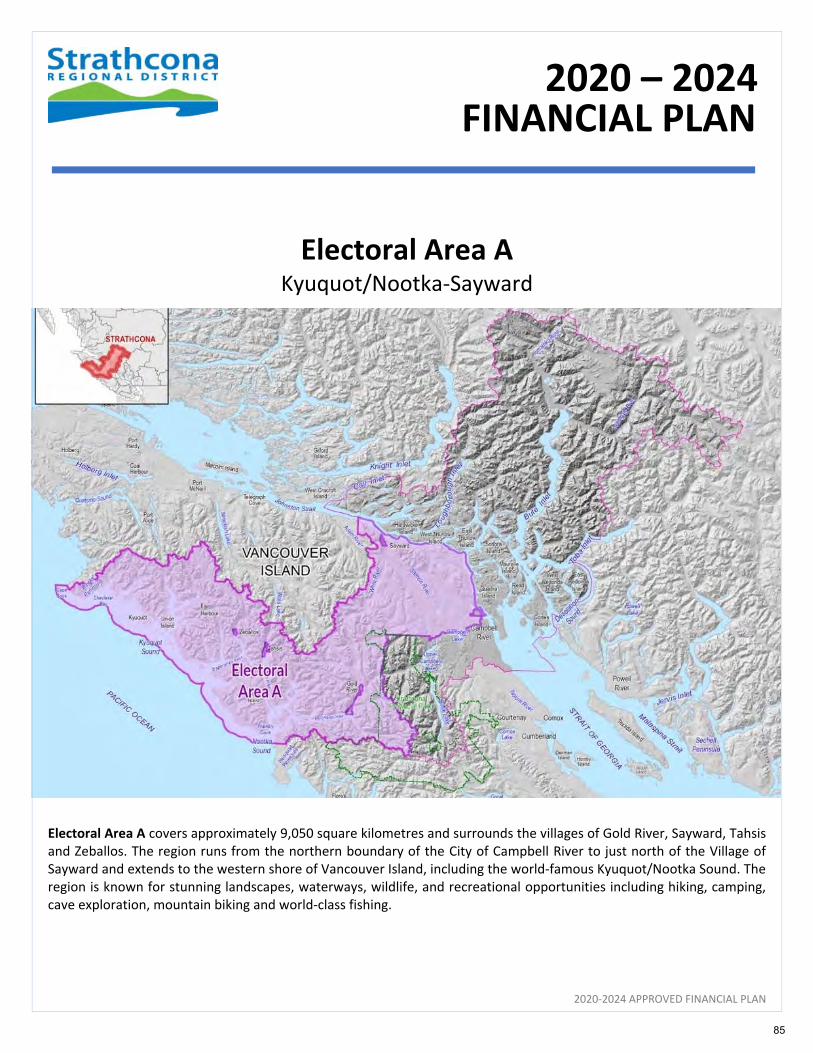
2020‐2024 APPROVED FINANCIAL PLAN
Electoral Area A
Kyuquot/Nootka‐Sayward
Electoral Area A covers approximately 9,050 square kilometres and surrounds the villages of Gold River, Sayward, Tahsis and Zeballos. The region runs from the northern boundary of the City of Campbell River to just north of the Village of Sayward and extends to the western shore of Vancouver Island, including the world‐famous Kyuquot/Nootka Sound. The region is known for stunning landscapes, waterways, wildlife, and recreational opportunities including hiking, camping, cave exploration, mountain biking and world‐class fishing.
FINANCIAL PLAN
2020 – 2024
Rebecca Spit, Quadra Island
85
Electoral Area A Summary
2020‐2024 APPROVED FINANCIAL PLAN
Electoral Area A includes the following functions:
Function # ‐ Function Description
120 ‐ Grant in Aid Area A
151 ‐ Feasibility Studies ‐ Electoral Area A
245 ‐ Sayward Valley Fire Protection
271 ‐ Kyuquot Nookta Emergency Program
364 ‐ Area A Kyuquot Nookta Solid Waste
368 ‐ Sayward and Area A Sayward Refuse
370 ‐ Solid Waste Local Service ‐ Sayward Valley
534 ‐ House Numbering Area A Sayward
554 ‐ Economic Development ‐ Area A Sayward
677 ‐ Kyuquot Community Hall
680 ‐ Sayward Valley Heritage Hall
86
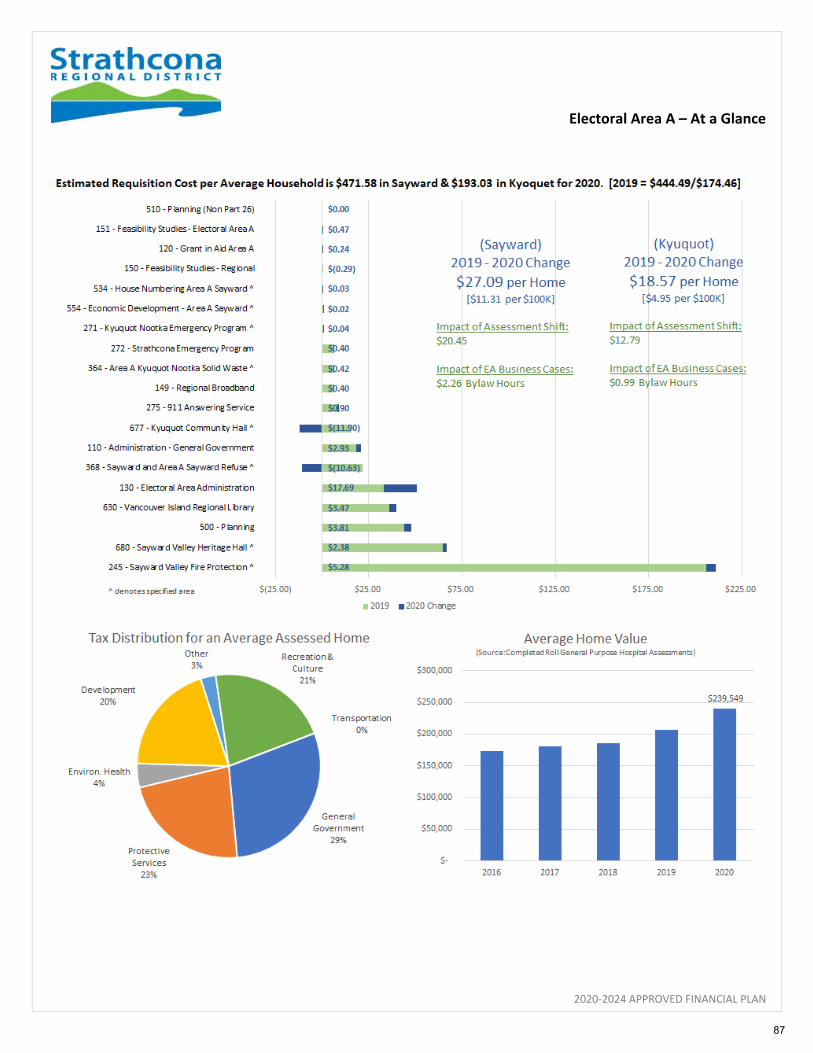
Electoral Area A – At a Glance
2020‐2024 APPROVED FINANCIAL PLAN
87
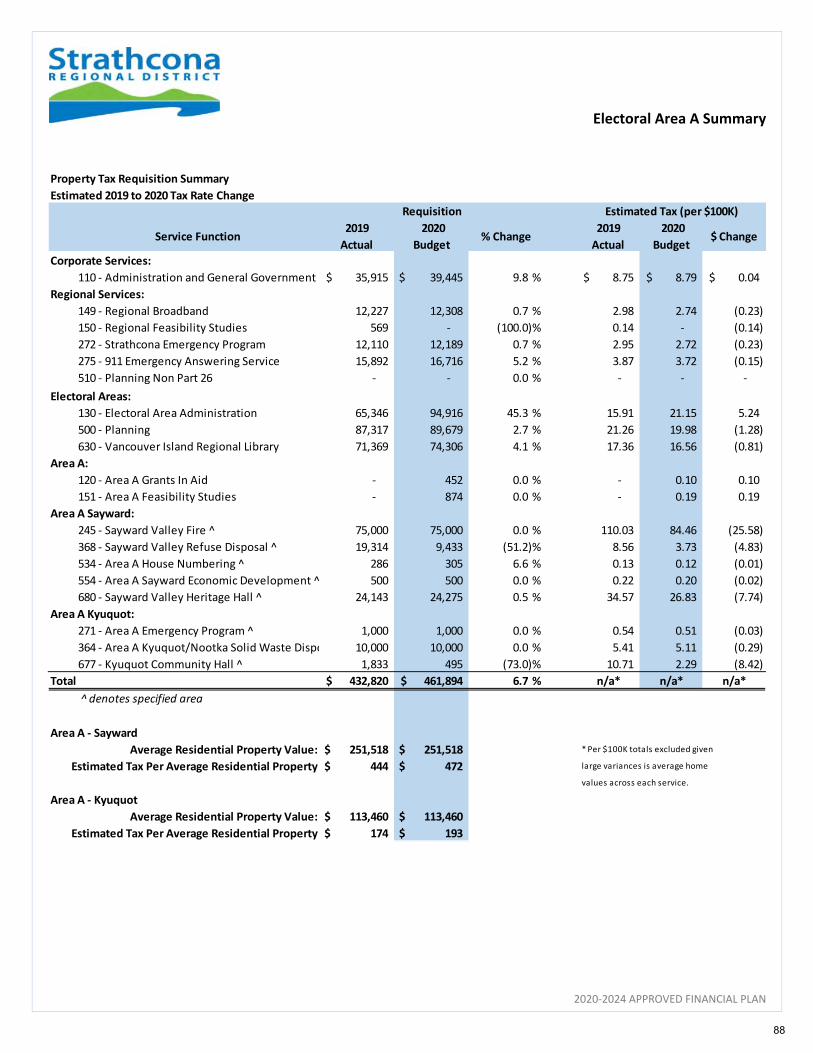
Electoral Area A Summary
2020‐2024 APPROVED FINANCIAL PLAN
Property Tax Requisition Summary
Estimated 2019 to 2020 Tax Rate Change
Service Function2019
Actual
2020
Budget % Change
2019
Actual
2020
Budget $ Change
Corporate Services:
110 ‐ Administration and General Government 35,915$ 39,445 $ 9.8 % 8.75$ 8.79$ 0.04$
Regional Services:
149 ‐ Regional Broadband 12,227 12,308 0.7 % 2.98 2.74 (0.23)
150 ‐ Regional Feasibility Studies 569 ‐ (100.0)% 0.14 ‐ (0.14)
272 ‐ Strathcona Emergency Program 12,110 12,189 0.7 % 2.95 2.72 (0.23)
275 ‐ 911 Emergency Answering Service 15,892 16,716 5.2 % 3.87 3.72 (0.15)
510 ‐ Planning Non Part 26 ‐ ‐ 0.0 % ‐ ‐ ‐
Electoral Areas:
130 ‐ Electoral Area Administration 65,346 94,916 45.3 % 15.91 21.15 5.24
500 ‐ Planning 87,317 89,679 2.7 % 21.26 19.98 (1.28)
630 ‐ Vancouver Island Regional Library 71,369 74,306 4.1 % 17.36 16.56 (0.81)
Area A:
120 ‐ Area A Grants In Aid ‐ 452 0.0 % ‐ 0.10 0.10
151 ‐ Area A Feasibility Studies ‐ 874 0.0 % ‐ 0.19 0.19
Area A Sayward:
245 ‐ Sayward Valley Fire ^ 75,000 75,000 0.0 % 110.03 84.46 (25.58)
368 ‐ Sayward Valley Refuse Disposal ^ 19,314 9,433 (51.2)% 8.56 3.73 (4.83)
534 ‐ Area A House Numbering ^ 286 305 6.6 % 0.13 0.12 (0.01)
554 ‐ Area A Sayward Economic Development ^ 500 500 0.0 % 0.22 0.20 (0.02)
680 ‐ Sayward Valley Heritage Hall ^ 24,143 24,275 0.5 % 34.57 26.83 (7.74)
Area A Kyuquot:
271 ‐ Area A Emergency Program ^ 1,000 1,000 0.0 % 0.54 0.51 (0.03)
364 ‐ Area A Kyuquot/Nootka Solid Waste Dispo 10,000 10,000 0.0 % 5.41 5.11 (0.29)
677 ‐ Kyuquot Community Hall ^ 1,833 495 (73.0)% 10.71 2.29 (8.42)
Total 432,820$ 461,894$ 6.7 % n/a* n/a* n/a*
̂denotes specified area
Area A ‐ Sayward
Average Residential Property Value: 251,518 $ 251,518 $ * Per $100K totals excluded given
Estimated Tax Per Average Residential Property 444 $ 472 $ large variances is average home
values across each service.
Area A ‐ Kyuquot
Average Residential Property Value: 113,460 $ 113,460 $
Estimated Tax Per Average Residential Property 174 $ 193 $
Requisition Estimated Tax (per $100K)
88
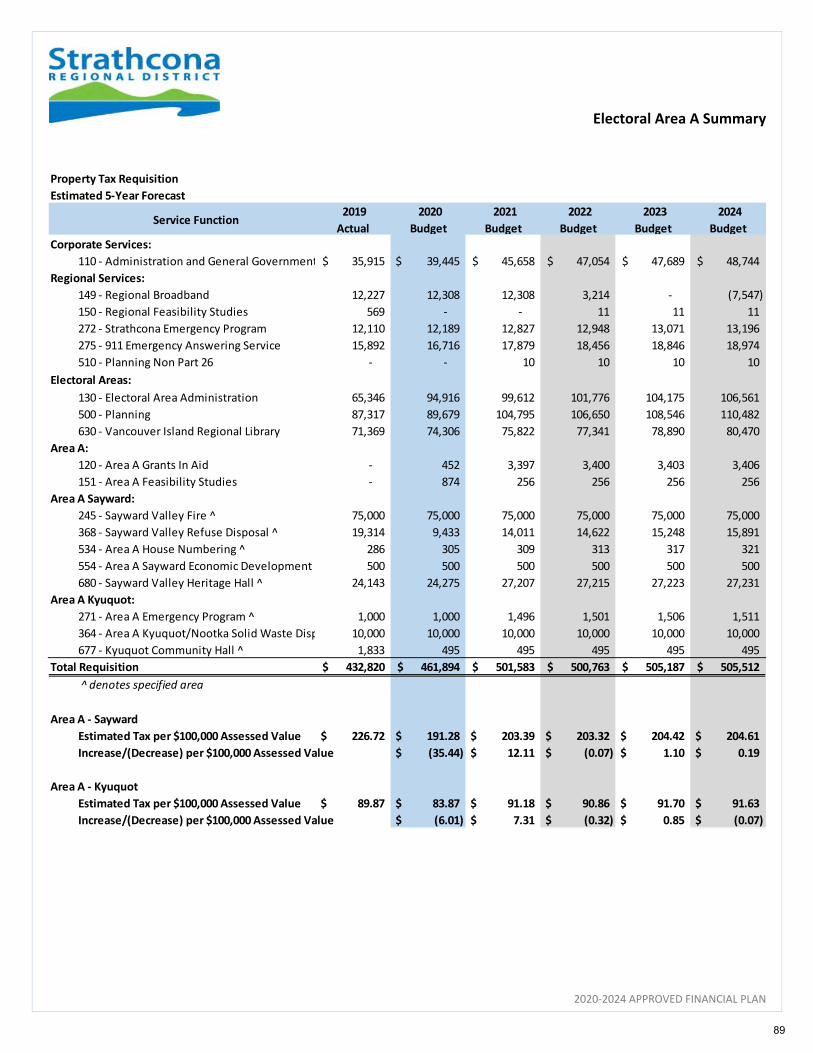
Electoral Area A Summary
2020‐2024 APPROVED FINANCIAL PLAN
Property Tax Requisition
Estimated 5‐Year Forecast
Service Function 2019
Actual
2020
Budget
2021
Budget
2022
Budget
2023
Budget
2024
Budget
Corporate Services:
110 ‐ Administration and General Government 35,915$ 39,445 $ 45,658$ 47,054$ 47,689$ 48,744$
Regional Services:
149 ‐ Regional Broadband 12,227 12,308 12,308 3,214 ‐ (7,547)
150 ‐ Regional Feasibility Studies 569 ‐ ‐ 11 11 11
272 ‐ Strathcona Emergency Program 12,110 12,189 12,827 12,948 13,071 13,196
275 ‐ 911 Emergency Answering Service 15,892 16,716 17,879 18,456 18,846 18,974
510 ‐ Planning Non Part 26 ‐ ‐ 10 10 10 10
Electoral Areas:
130 ‐ Electoral Area Administration 65,346 94,916 99,612 101,776 104,175 106,561
500 ‐ Planning 87,317 89,679 104,795 106,650 108,546 110,482
630 ‐ Vancouver Island Regional Library 71,369 74,306 75,822 77,341 78,890 80,470
Area A:
120 ‐ Area A Grants In Aid ‐ 452 3,397 3,400 3,403 3,406
151 ‐ Area A Feasibility Studies ‐ 874 256 256 256 256
Area A Sayward:
245 ‐ Sayward Valley Fire ^ 75,000 75,000 75,000 75,000 75,000 75,000
368 ‐ Sayward Valley Refuse Disposal ^ 19,314 9,433 14,011 14,622 15,248 15,891
534 ‐ Area A House Numbering ^ 286 305 309 313 317 321
554 ‐ Area A Sayward Economic Development ^ 500 500 500 500 500 500
680 ‐ Sayward Valley Heritage Hall ^ 24,143 24,275 27,207 27,215 27,223 27,231
Area A Kyuquot:
271 ‐ Area A Emergency Program ^ 1,000 1,000 1,496 1,501 1,506 1,511
364 ‐ Area A Kyuquot/Nootka Solid Waste Disp 10,000 10,000 10,000 10,000 10,000 10,000
677 ‐ Kyuquot Community Hall ^ 1,833 495 495 495 495 495
Total Requisition 432,820$ 461,894$ 501,583$ 500,763$ 505,187$ 505,512$
^ denotes specified area
Area A ‐ Sayward
Estimated Tax per $100,000 Assessed Value 226.72 $ 191.28 $ 203.39 $ 203.32 $ 204.42 $ 204.61 $
Increase/(Decrease) per $100,000 Assessed Value (35.44) $ 12.11 $ (0.07) $ 1.10 $ 0.19 $
Area A ‐ Kyuquot
Estimated Tax per $100,000 Assessed Value 89.87 $ 83.87 $ 91.18 $ 90.86 $ 91.70 $ 91.63 $
Increase/(Decrease) per $100,000 Assessed Value (6.01) $ 7.31 $ (0.32) $ 0.85 $ (0.07) $
89
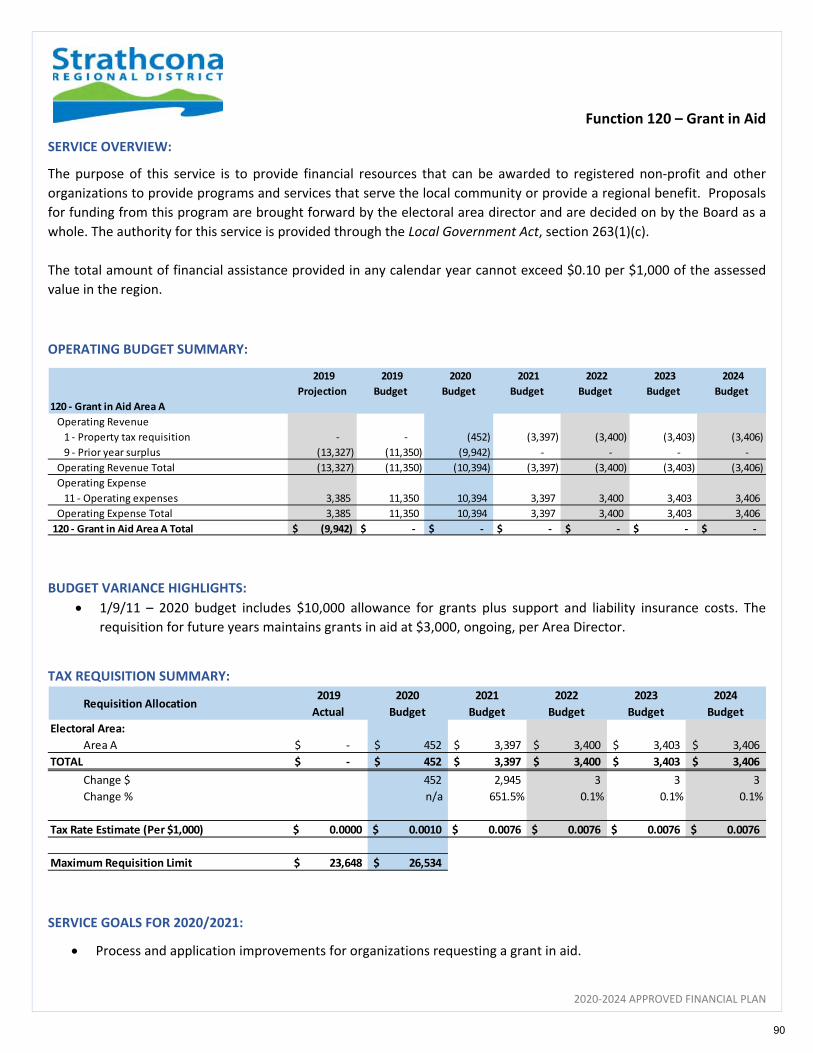
Function 120 – Grant in Aid
2020‐2024 APPROVED FINANCIAL PLAN
SERVICE OVERVIEW:
The purpose of this service is to provide financial resources that can be awarded to registered non‐profit and other
organizations to provide programs and services that serve the local community or provide a regional benefit. Proposals
for funding from this program are brought forward by the electoral area director and are decided on by the Board as a
whole. The authority for this service is provided through the Local Government Act, section 263(1)(c).
The total amount of financial assistance provided in any calendar year cannot exceed $0.10 per $1,000 of the assessed
value in the region.
OPERATING BUDGET SUMMARY:
BUDGET VARIANCE HIGHLIGHTS:
1/9/11 – 2020 budget includes $10,000 allowance for grants plus support and liability insurance costs. The
requisition for future years maintains grants in aid at $3,000, ongoing, per Area Director.
TAX REQUISITION SUMMARY:
SERVICE GOALS FOR 2020/2021:
Process and application improvements for organizations requesting a grant in aid.
2019
Projection
2019
Budget
2020
Budget
2021
Budget
2022
Budget
2023
Budget
2024
Budget
120 ‐ Grant in Aid Area A
Operating Revenue
1 ‐ Property tax requisition ‐ ‐ (452) (3,397) (3,400) (3,403) (3,406)
9 ‐ Prior year surplus (13,327) (11,350) (9,942) ‐ ‐ ‐ ‐
Operating Revenue Total (13,327) (11,350) (10,394) (3,397) (3,400) (3,403) (3,406)
Operating Expense
11 ‐ Operating expenses 3,385 11,350 10,394 3,397 3,400 3,403 3,406
Operating Expense Total 3,385 11,350 10,394 3,397 3,400 3,403 3,406
120 ‐ Grant in Aid Area A Total $ (9,942) $ ‐ $ ‐ $ ‐ $ ‐ $ ‐ $ ‐
Requisition Allocation2019
Actual
2020
Budget
2021
Budget
2022
Budget
2023
Budget
2024
Budget
Electoral Area:
Area A ‐$ 452$ 3,397$ 3,400$ 3,403$ 3,406$
TOTAL ‐$ 452$ 3,397$ 3,400$ 3,403$ 3,406$
Change $ 452 2,945 3 3 3
Change % n/a 651.5% 0.1% 0.1% 0.1%
Tax Rate Estimate (Per $1,000) 0.0000 $ 0.0010 $ 0.0076 $ 0.0076 $ 0.0076 $ 0.0076 $
Maximum Requisition Limit 23,648 $ 26,534 $
90

Function 151 ‐ Feasibility Studies
2020‐2024 APPROVED FINANCIAL PLAN
SERVICE OVERVIEW:
The purpose of this service is to provide funds to support the study of potential new services for the electoral area. If a
regional district undertakes a service after conducting a feasibility study in respect of the service, the costs of that study
are deemed to be costs of that service. The authority for this service which was established on October 30, 2000 is provided
through the Local Government Act, section 379(4).
The maximum levy for this service cannot exceed $0.10 per $1,000 of the assessed value in the region.
OPERATING BUDGET SUMMARY:
BUDGET VARIANCE HIGHLIGHTS:
11 – $5,000 budgeted allowance to provide for potential feasibility studies for new services in the electoral area.
Ongoing expenses are support services allocations from general administration.
TAX REQUISITION SUMMARY:
SERVICE GOALS FOR 2020/2021:
Currently no planned studies for new services for Electoral Area A.
2019
Projection
2019
Budget
2020
Budget
2021
Budget
2022
Budget
2023
Budget
2024
Budget
151 ‐ Feasibility Studies ‐ Electoral Area A
Operating Revenue
1 ‐ Property tax requisition ‐ ‐ (874) (256) (256) (256) (256)
9 ‐ Prior year surplus (4,638) (4,638) (4,382) ‐ ‐ ‐ ‐
Operating Revenue Total (4,638) (4,638) (5,256) (256) (256) (256) (256)
Operating Expense
11 ‐ Operating expenses 256 4,638 5,256 256 256 256 256
Operating Expense Total 256 4,638 5,256 256 256 256 256
151 ‐ Feasibility Studies ‐ Electoral Area A Total $ (4,382) $ ‐ $ ‐ $ ‐ $ ‐ $ ‐ $ ‐
Requisition Allocation2019
Actual
2020
Budget
2021
Budget
2022
Budget
2023
Budget
2024
Budget
Electoral Area:
Area A ‐$ 874$ 256$ 256$ 256$ 256$
TOTAL ‐$ 874$ 256$ 256$ 256$ 256$
Change $ 874 (618) ‐ ‐ ‐
Change % n/a (70.7%) ‐ ‐ ‐
Tax Rate Estimate (Per $1,000) 0.0000 $ 0.0019 $ 0.0006 $ 0.0006 $ 0.0006 $ 0.0006 $
Maximum Requisition Limit 23,648 $ 26,534 $
91
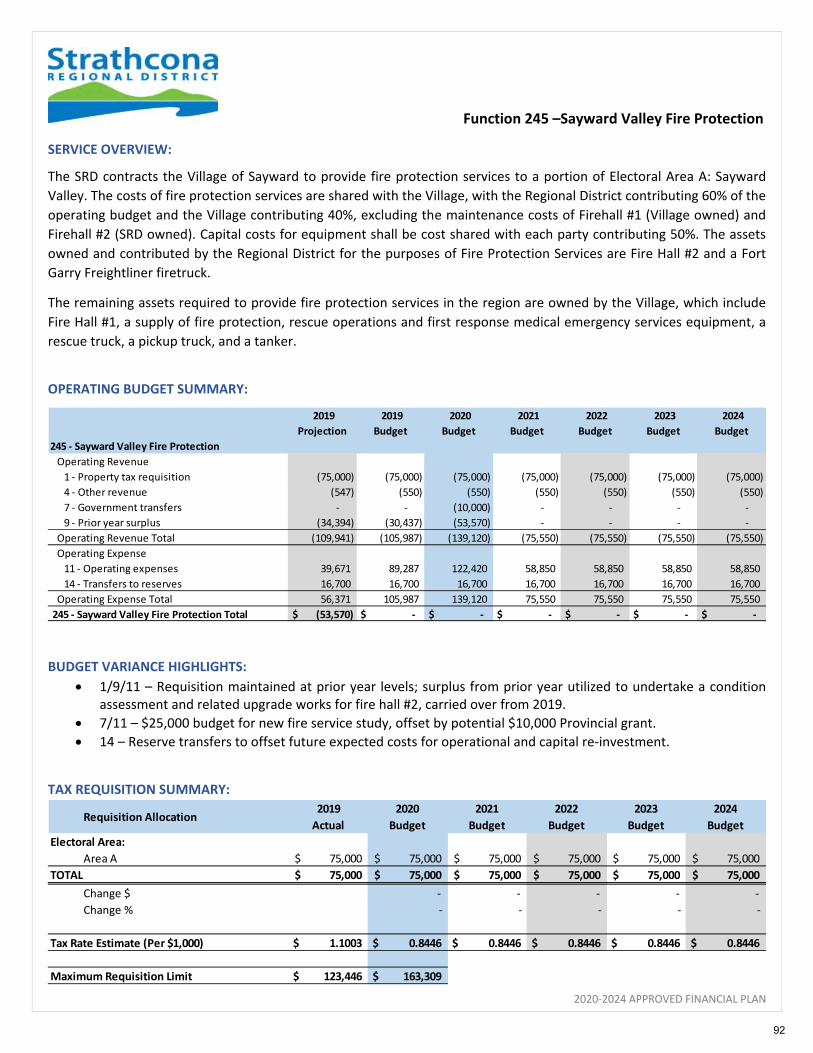
Function 245 –Sayward Valley Fire Protection
2020‐2024 APPROVED FINANCIAL PLAN
SERVICE OVERVIEW:
The SRD contracts the Village of Sayward to provide fire protection services to a portion of Electoral Area A: Sayward
Valley. The costs of fire protection services are shared with the Village, with the Regional District contributing 60% of the
operating budget and the Village contributing 40%, excluding the maintenance costs of Firehall #1 (Village owned) and
Firehall #2 (SRD owned). Capital costs for equipment shall be cost shared with each party contributing 50%. The assets
owned and contributed by the Regional District for the purposes of Fire Protection Services are Fire Hall #2 and a Fort
Garry Freightliner firetruck.
The remaining assets required to provide fire protection services in the region are owned by the Village, which include
Fire Hall #1, a supply of fire protection, rescue operations and first response medical emergency services equipment, a
rescue truck, a pickup truck, and a tanker.
OPERATING BUDGET SUMMARY:
BUDGET VARIANCE HIGHLIGHTS:
1/9/11 – Requisition maintained at prior year levels; surplus from prior year utilized to undertake a condition assessment and related upgrade works for fire hall #2, carried over from 2019.
7/11 – $25,000 budget for new fire service study, offset by potential $10,000 Provincial grant.
14 – Reserve transfers to offset future expected costs for operational and capital re‐investment.
TAX REQUISITION SUMMARY:
2019
Projection
2019
Budget
2020
Budget
2021
Budget
2022
Budget
2023
Budget
2024
Budget
245 ‐ Sayward Valley Fire Protection
Operating Revenue
1 ‐ Property tax requisition (75,000) (75,000) (75,000) (75,000) (75,000) (75,000) (75,000)
4 ‐ Other revenue (547) (550) (550) (550) (550) (550) (550)
7 ‐ Government transfers ‐ ‐ (10,000) ‐ ‐ ‐ ‐
9 ‐ Prior year surplus (34,394) (30,437) (53,570) ‐ ‐ ‐ ‐
Operating Revenue Total (109,941) (105,987) (139,120) (75,550) (75,550) (75,550) (75,550)
Operating Expense
11 ‐ Operating expenses 39,671 89,287 122,420 58,850 58,850 58,850 58,850
14 ‐ Transfers to reserves 16,700 16,700 16,700 16,700 16,700 16,700 16,700
Operating Expense Total 56,371 105,987 139,120 75,550 75,550 75,550 75,550
245 ‐ Sayward Valley Fire Protection Total $ (53,570) $ ‐ $ ‐ $ ‐ $ ‐ $ ‐ $ ‐
Requisition Allocation2019
Actual
2020
Budget
2021
Budget
2022
Budget
2023
Budget
2024
Budget
Electoral Area:
Area A 75,000$ 75,000$ 75,000$ 75,000$ 75,000$ 75,000$
TOTAL 75,000$ 75,000$ 75,000$ 75,000$ 75,000$ 75,000$
Change $ ‐ ‐ ‐ ‐ ‐
Change % ‐ ‐ ‐ ‐ ‐
Tax Rate Estimate (Per $1,000) 1.1003 $ 0.8446 $ 0.8446 $ 0.8446 $ 0.8446 $ 0.8446 $
Maximum Requisition Limit 123,446 $ 163,309 $
92
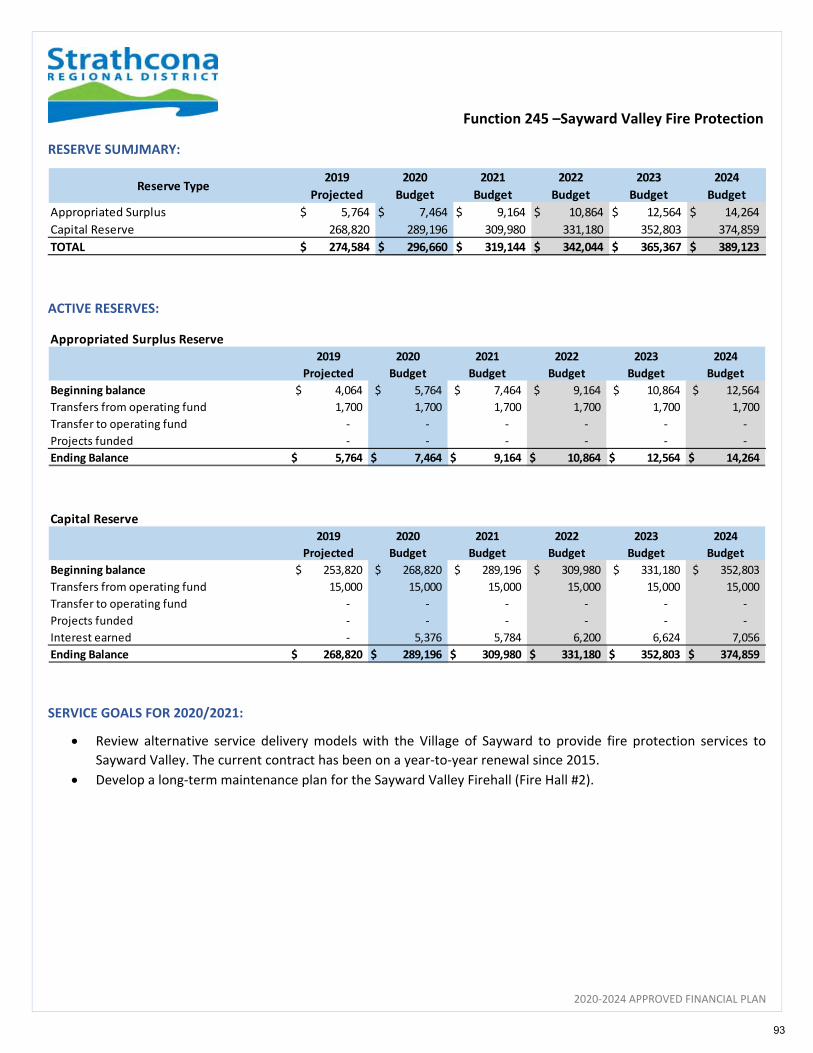
Function 245 –Sayward Valley Fire Protection
2020‐2024 APPROVED FINANCIAL PLAN
RESERVE SUMJMARY:
ACTIVE RESERVES:
SERVICE GOALS FOR 2020/2021:
Review alternative service delivery models with the Village of Sayward to provide fire protection services to
Sayward Valley. The current contract has been on a year‐to‐year renewal since 2015.
Develop a long‐term maintenance plan for the Sayward Valley Firehall (Fire Hall #2).
Reserve Type2019
Projected
2020
Budget
2021
Budget
2022
Budget
2023
Budget
2024
Budget
Appropriated Surplus 5,764$ 7,464$ 9,164$ 10,864$ 12,564$ 14,264$
Capital Reserve 268,820 289,196 309,980 331,180 352,803 374,859
TOTAL 274,584$ 296,660$ 319,144$ 342,044$ 365,367$ 389,123$
Appropriated Surplus Reserve
2019
Projected
2020
Budget
2021
Budget
2022
Budget
2023
Budget
2024
Budget
Beginning balance 4,064$ 5,764$ 7,464$ 9,164$ 10,864$ 12,564$
Transfers from operating fund 1,700 1,700 1,700 1,700 1,700 1,700
Transfer to operating fund ‐ ‐ ‐ ‐ ‐ ‐
Projects funded ‐ ‐ ‐ ‐ ‐ ‐
Ending Balance 5,764$ 7,464$ 9,164$ 10,864$ 12,564$ 14,264$
Capital Reserve
2019
Projected
2020
Budget
2021
Budget
2022
Budget
2023
Budget
2024
Budget
Beginning balance 253,820$ 268,820$ 289,196$ 309,980$ 331,180$ 352,803$
Transfers from operating fund 15,000 15,000 15,000 15,000 15,000 15,000
Transfer to operating fund ‐ ‐ ‐ ‐ ‐ ‐
Projects funded ‐ ‐ ‐ ‐ ‐ ‐
Interest earned ‐ 5,376 5,784 6,200 6,624 7,056
Ending Balance 268,820$ 289,196$ 309,980$ 331,180$ 352,803$ 374,859$
93
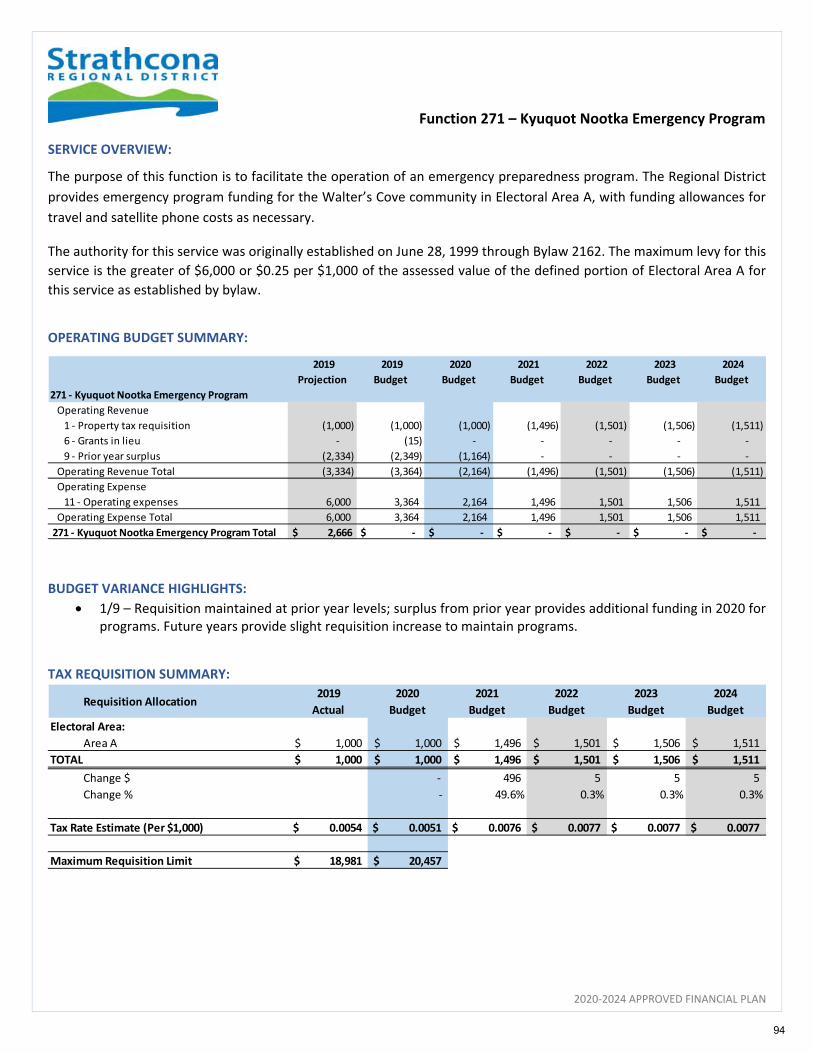
Function 271 – Kyuquot Nootka Emergency Program
2020‐2024 APPROVED FINANCIAL PLAN
SERVICE OVERVIEW:
The purpose of this function is to facilitate the operation of an emergency preparedness program. The Regional District
provides emergency program funding for the Walter’s Cove community in Electoral Area A, with funding allowances for
travel and satellite phone costs as necessary.
The authority for this service was originally established on June 28, 1999 through Bylaw 2162. The maximum levy for this
service is the greater of $6,000 or $0.25 per $1,000 of the assessed value of the defined portion of Electoral Area A for
this service as established by bylaw.
OPERATING BUDGET SUMMARY:
BUDGET VARIANCE HIGHLIGHTS:
1/9 – Requisition maintained at prior year levels; surplus from prior year provides additional funding in 2020 for programs. Future years provide slight requisition increase to maintain programs.
TAX REQUISITION SUMMARY:
2019
Projection
2019
Budget
2020
Budget
2021
Budget
2022
Budget
2023
Budget
2024
Budget
271 ‐ Kyuquot Nootka Emergency Program
Operating Revenue
1 ‐ Property tax requisition (1,000) (1,000) (1,000) (1,496) (1,501) (1,506) (1,511)
6 ‐ Grants in lieu ‐ (15) ‐ ‐ ‐ ‐ ‐
9 ‐ Prior year surplus (2,334) (2,349) (1,164) ‐ ‐ ‐ ‐
Operating Revenue Total (3,334) (3,364) (2,164) (1,496) (1,501) (1,506) (1,511)
Operating Expense
11 ‐ Operating expenses 6,000 3,364 2,164 1,496 1,501 1,506 1,511
Operating Expense Total 6,000 3,364 2,164 1,496 1,501 1,506 1,511
271 ‐ Kyuquot Nootka Emergency Program Total $ 2,666 $ ‐ $ ‐ $ ‐ $ ‐ $ ‐ $ ‐
Requisition Allocation2019
Actual
2020
Budget
2021
Budget
2022
Budget
2023
Budget
2024
Budget
Electoral Area:
Area A 1,000$ 1,000$ 1,496$ 1,501$ 1,506$ 1,511$
TOTAL 1,000$ 1,000$ 1,496$ 1,501$ 1,506$ 1,511$
Change $ ‐ 496 5 5 5
Change % ‐ 49.6% 0.3% 0.3% 0.3%
Tax Rate Estimate (Per $1,000) 0.0054 $ 0.0051 $ 0.0076 $ 0.0077 $ 0.0077 $ 0.0077 $
Maximum Requisition Limit 18,981 $ 20,457 $
94

Function 271 – Kyuquot Nootka Emergency Program
2020‐2024 APPROVED FINANCIAL PLAN
RESERVE SUMMARY:
SERVICE GOALS FOR 2020/2021:
Establish, support and train an emergency communications team.
Provide a stipend for a volunteer emergency coordinator who resides within the community.
Work with the Ka:'yu:'k't'h'/Che:k:tles7et'h' First Nations to pursue grant opportunities through the Community
Emergency Preparedness Fund.
Reserve Type2019
Projected
2020
Budget
2021
Budget
2022
Budget
2023
Budget
2024
Budget
Appropriated Surplus 2,252$ 2,252$ 2,252$ 2,252$ 2,252$ 2,252$
TOTAL 2,252$ 2,252$ 2,252$ 2,252$ 2,252$ 2,252$
95
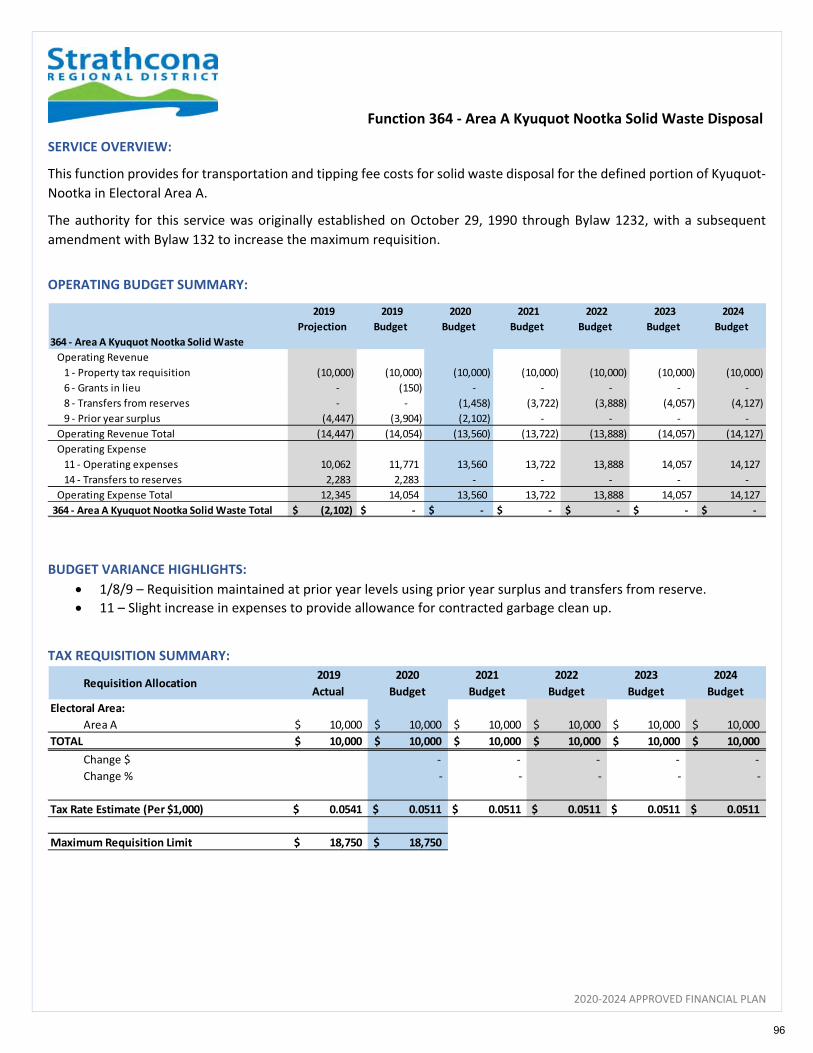
Function 364 ‐ Area A Kyuquot Nootka Solid Waste Disposal
2020‐2024 APPROVED FINANCIAL PLAN
SERVICE OVERVIEW:
This function provides for transportation and tipping fee costs for solid waste disposal for the defined portion of Kyuquot‐
Nootka in Electoral Area A.
The authority for this service was originally established on October 29, 1990 through Bylaw 1232, with a subsequent
amendment with Bylaw 132 to increase the maximum requisition.
OPERATING BUDGET SUMMARY:
BUDGET VARIANCE HIGHLIGHTS:
1/8/9 – Requisition maintained at prior year levels using prior year surplus and transfers from reserve.
11 – Slight increase in expenses to provide allowance for contracted garbage clean up.
TAX REQUISITION SUMMARY:
2019
Projection
2019
Budget
2020
Budget
2021
Budget
2022
Budget
2023
Budget
2024
Budget
364 ‐ Area A Kyuquot Nootka Solid Waste
Operating Revenue
1 ‐ Property tax requisition (10,000) (10,000) (10,000) (10,000) (10,000) (10,000) (10,000)
6 ‐ Grants in lieu ‐ (150) ‐ ‐ ‐ ‐ ‐
8 ‐ Transfers from reserves ‐ ‐ (1,458) (3,722) (3,888) (4,057) (4,127)
9 ‐ Prior year surplus (4,447) (3,904) (2,102) ‐ ‐ ‐ ‐
Operating Revenue Total (14,447) (14,054) (13,560) (13,722) (13,888) (14,057) (14,127)
Operating Expense
11 ‐ Operating expenses 10,062 11,771 13,560 13,722 13,888 14,057 14,127
14 ‐ Transfers to reserves 2,283 2,283 ‐ ‐ ‐ ‐ ‐
Operating Expense Total 12,345 14,054 13,560 13,722 13,888 14,057 14,127
364 ‐ Area A Kyuquot Nootka Solid Waste Total $ (2,102) $ ‐ $ ‐ $ ‐ $ ‐ $ ‐ $ ‐
Requisition Allocation2019
Actual
2020
Budget
2021
Budget
2022
Budget
2023
Budget
2024
Budget
Electoral Area:
Area A 10,000$ 10,000$ 10,000$ 10,000$ 10,000$ 10,000$
TOTAL 10,000$ 10,000$ 10,000$ 10,000$ 10,000$ 10,000$
Change $ ‐ ‐ ‐ ‐ ‐
Change % ‐ ‐ ‐ ‐ ‐
Tax Rate Estimate (Per $1,000) 0.0541 $ 0.0511 $ 0.0511 $ 0.0511 $ 0.0511 $ 0.0511 $
Maximum Requisition Limit 18,750 $ 18,750 $
96
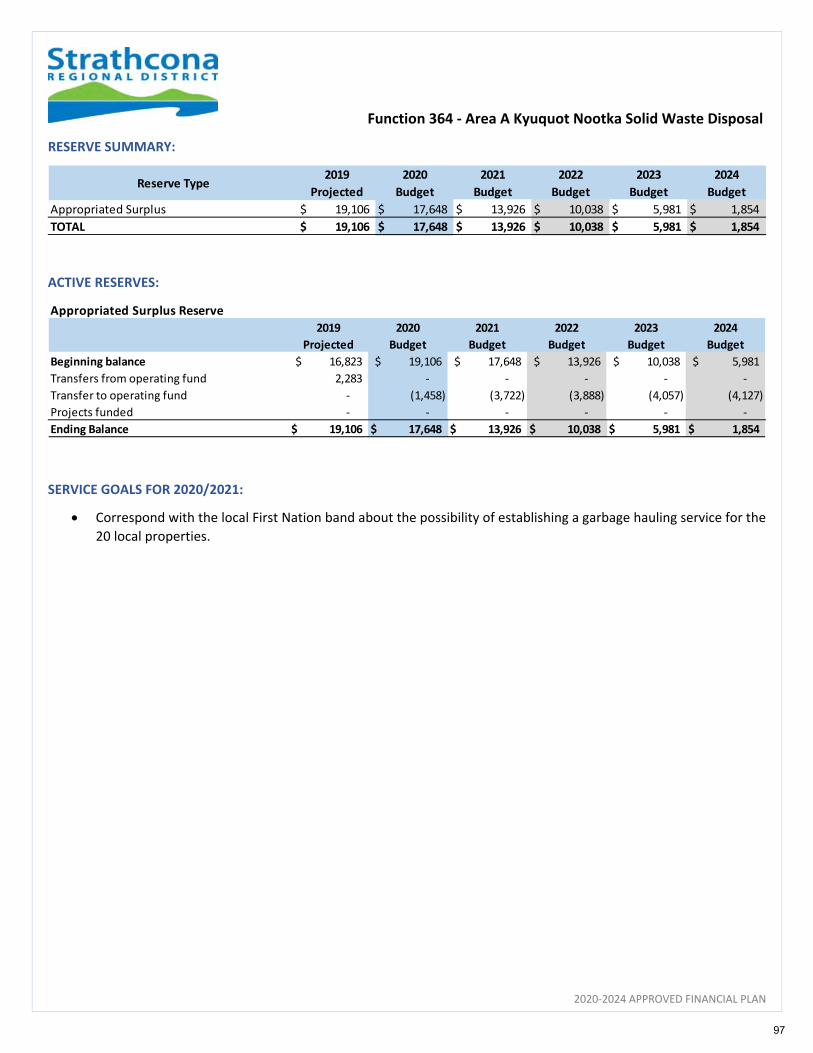
Function 364 ‐ Area A Kyuquot Nootka Solid Waste Disposal
2020‐2024 APPROVED FINANCIAL PLAN
RESERVE SUMMARY:
ACTIVE RESERVES:
SERVICE GOALS FOR 2020/2021:
Correspond with the local First Nation band about the possibility of establishing a garbage hauling service for the
20 local properties.
Reserve Type2019
Projected
2020
Budget
2021
Budget
2022
Budget
2023
Budget
2024
Budget
Appropriated Surplus 19,106$ 17,648$ 13,926$ 10,038$ 5,981$ 1,854$
TOTAL 19,106$ 17,648$ 13,926$ 10,038$ 5,981$ 1,854$
Appropriated Surplus Reserve
2019
Projected
2020
Budget
2021
Budget
2022
Budget
2023
Budget
2024
Budget
Beginning balance 16,823$ 19,106$ 17,648$ 13,926$ 10,038$ 5,981$
Transfers from operating fund 2,283 ‐ ‐ ‐ ‐ ‐
Transfer to operating fund ‐ (1,458) (3,722) (3,888) (4,057) (4,127)
Projects funded ‐ ‐ ‐ ‐ ‐ ‐
Ending Balance 19,106$ 17,648$ 13,926$ 10,038$ 5,981$ 1,854$
97
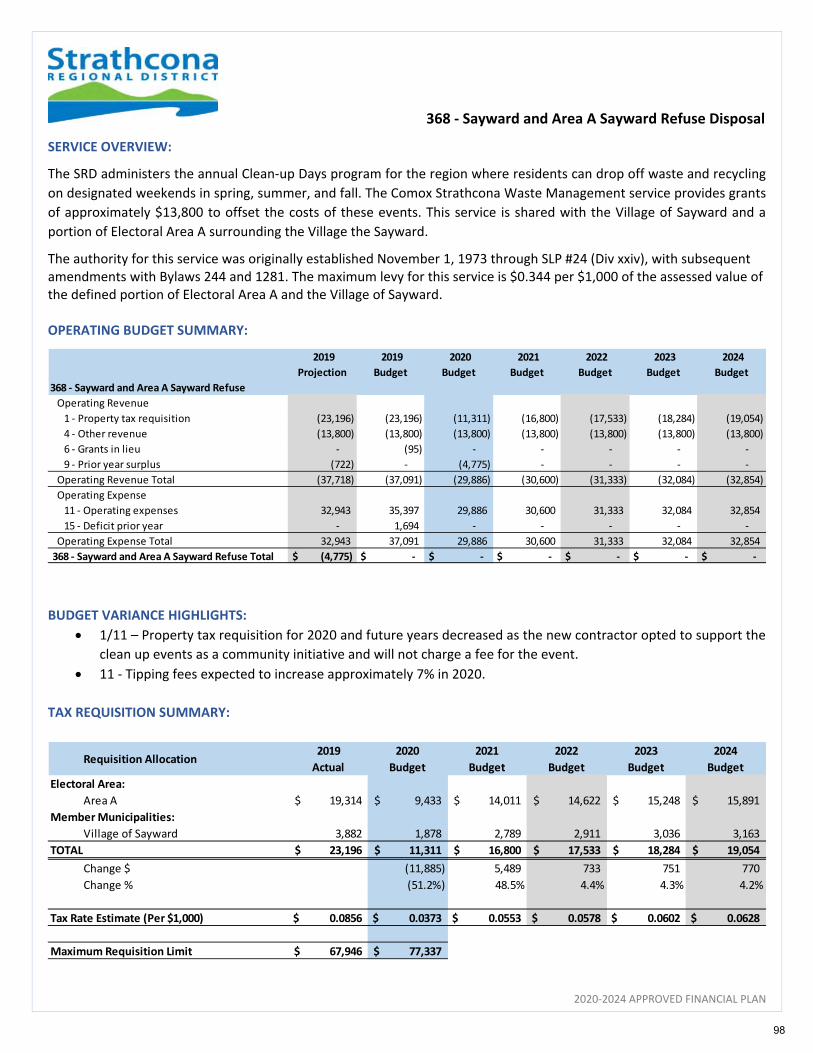
368 ‐ Sayward and Area A Sayward Refuse Disposal
2020‐2024 APPROVED FINANCIAL PLAN
SERVICE OVERVIEW:
The SRD administers the annual Clean‐up Days program for the region where residents can drop off waste and recycling
on designated weekends in spring, summer, and fall. The Comox Strathcona Waste Management service provides grants
of approximately $13,800 to offset the costs of these events. This service is shared with the Village of Sayward and a
portion of Electoral Area A surrounding the Village the Sayward.
The authority for this service was originally established November 1, 1973 through SLP #24 (Div xxiv), with subsequent amendments with Bylaws 244 and 1281. The maximum levy for this service is $0.344 per $1,000 of the assessed value of the defined portion of Electoral Area A and the Village of Sayward. OPERATING BUDGET SUMMARY:
BUDGET VARIANCE HIGHLIGHTS:
1/11 – Property tax requisition for 2020 and future years decreased as the new contractor opted to support the
clean up events as a community initiative and will not charge a fee for the event.
11 ‐ Tipping fees expected to increase approximately 7% in 2020.
TAX REQUISITION SUMMARY:
2019
Projection
2019
Budget
2020
Budget
2021
Budget
2022
Budget
2023
Budget
2024
Budget
368 ‐ Sayward and Area A Sayward Refuse
Operating Revenue
1 ‐ Property tax requisition (23,196) (23,196) (11,311) (16,800) (17,533) (18,284) (19,054)
4 ‐ Other revenue (13,800) (13,800) (13,800) (13,800) (13,800) (13,800) (13,800)
6 ‐ Grants in lieu ‐ (95) ‐ ‐ ‐ ‐ ‐
9 ‐ Prior year surplus (722) ‐ (4,775) ‐ ‐ ‐ ‐
Operating Revenue Total (37,718) (37,091) (29,886) (30,600) (31,333) (32,084) (32,854)
Operating Expense
11 ‐ Operating expenses 32,943 35,397 29,886 30,600 31,333 32,084 32,854
15 ‐ Deficit prior year ‐ 1,694 ‐ ‐ ‐ ‐ ‐
Operating Expense Total 32,943 37,091 29,886 30,600 31,333 32,084 32,854
368 ‐ Sayward and Area A Sayward Refuse Total $ (4,775) $ ‐ $ ‐ $ ‐ $ ‐ $ ‐ $ ‐
Requisition Allocation2019
Actual
2020
Budget
2021
Budget
2022
Budget
2023
Budget
2024
Budget
Electoral Area:
Area A 19,314$ 9,433$ 14,011$ 14,622$ 15,248$ 15,891$
Member Municipalities:
Village of Sayward 3,882 1,878 2,789 2,911 3,036 3,163
TOTAL 23,196$ 11,311$ 16,800$ 17,533$ 18,284$ 19,054$
Change $ (11,885) 5,489 733 751 770
Change % (51.2%) 48.5% 4.4% 4.3% 4.2%
Tax Rate Estimate (Per $1,000) 0.0856 $ 0.0373 $ 0.0553 $ 0.0578 $ 0.0602 $ 0.0628 $
Maximum Requisition Limit 67,946 $ 77,337 $
98
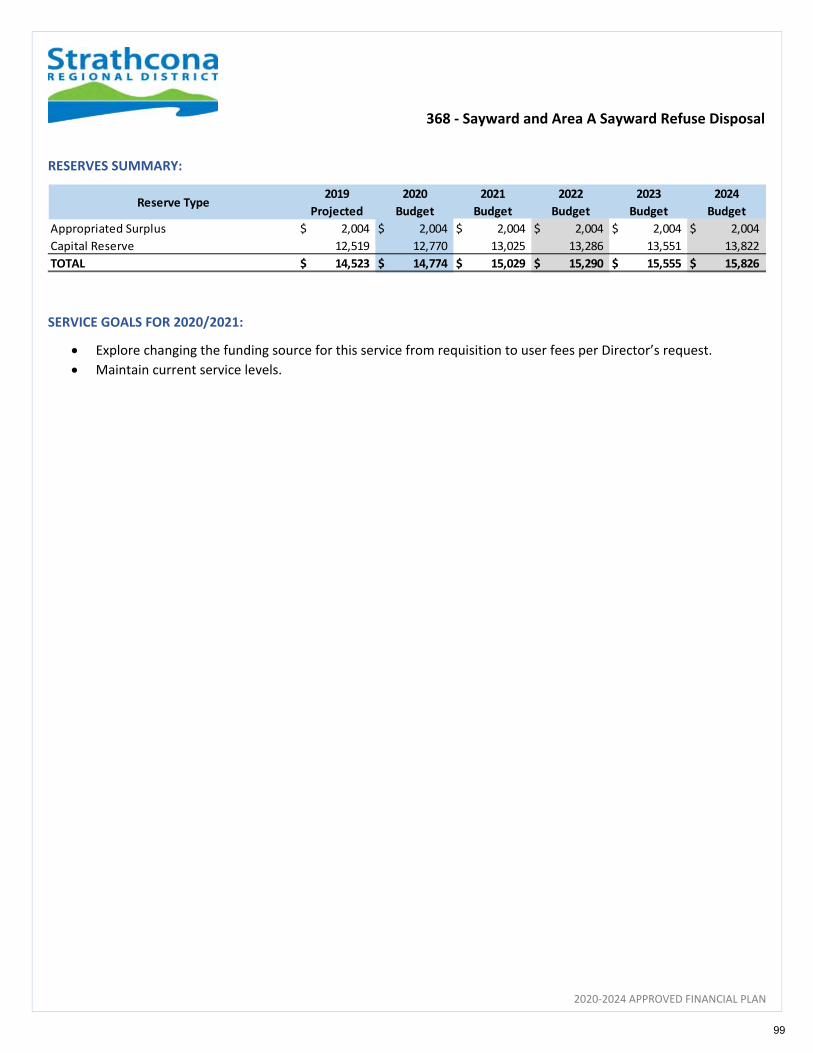
368 ‐ Sayward and Area A Sayward Refuse Disposal
2020‐2024 APPROVED FINANCIAL PLAN
RESERVES SUMMARY:
SERVICE GOALS FOR 2020/2021:
Explore changing the funding source for this service from requisition to user fees per Director’s request.
Maintain current service levels.
Reserve Type2019
Projected
2020
Budget
2021
Budget
2022
Budget
2023
Budget
2024
Budget
Appropriated Surplus 2,004$ 2,004$ 2,004$ 2,004$ 2,004$ 2,004$
Capital Reserve 12,519 12,770 13,025 13,286 13,551 13,822
TOTAL 14,523$ 14,774$ 15,029$ 15,290$ 15,555$ 15,826$
99
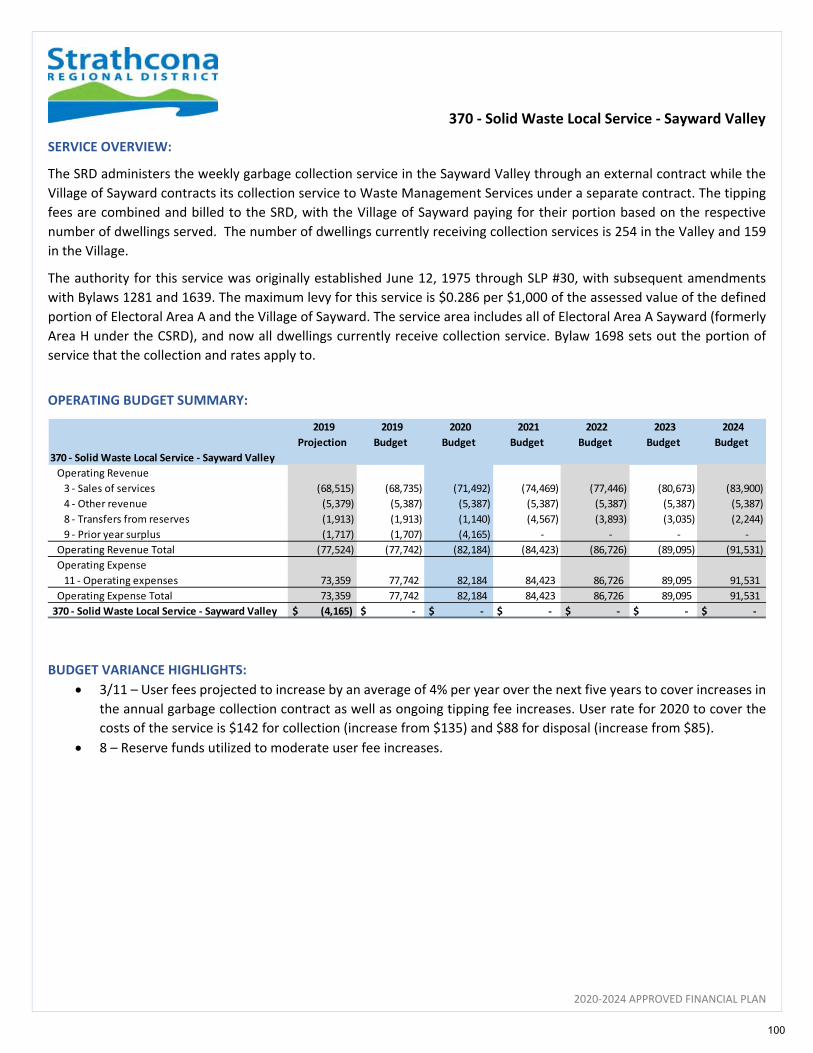
370 ‐ Solid Waste Local Service ‐ Sayward Valley
2020‐2024 APPROVED FINANCIAL PLAN
SERVICE OVERVIEW:
The SRD administers the weekly garbage collection service in the Sayward Valley through an external contract while the
Village of Sayward contracts its collection service to Waste Management Services under a separate contract. The tipping
fees are combined and billed to the SRD, with the Village of Sayward paying for their portion based on the respective
number of dwellings served. The number of dwellings currently receiving collection services is 254 in the Valley and 159
in the Village.
The authority for this service was originally established June 12, 1975 through SLP #30, with subsequent amendments
with Bylaws 1281 and 1639. The maximum levy for this service is $0.286 per $1,000 of the assessed value of the defined
portion of Electoral Area A and the Village of Sayward. The service area includes all of Electoral Area A Sayward (formerly
Area H under the CSRD), and now all dwellings currently receive collection service. Bylaw 1698 sets out the portion of
service that the collection and rates apply to.
OPERATING BUDGET SUMMARY:
BUDGET VARIANCE HIGHLIGHTS:
3/11 – User fees projected to increase by an average of 4% per year over the next five years to cover increases in
the annual garbage collection contract as well as ongoing tipping fee increases. User rate for 2020 to cover the
costs of the service is $142 for collection (increase from $135) and $88 for disposal (increase from $85).
8 – Reserve funds utilized to moderate user fee increases.
2019
Projection
2019
Budget
2020
Budget
2021
Budget
2022
Budget
2023
Budget
2024
Budget
370 ‐ Solid Waste Local Service ‐ Sayward Valley
Operating Revenue
3 ‐ Sales of services (68,515) (68,735) (71,492) (74,469) (77,446) (80,673) (83,900)
4 ‐ Other revenue (5,379) (5,387) (5,387) (5,387) (5,387) (5,387) (5,387)
8 ‐ Transfers from reserves (1,913) (1,913) (1,140) (4,567) (3,893) (3,035) (2,244)
9 ‐ Prior year surplus (1,717) (1,707) (4,165) ‐ ‐ ‐ ‐
Operating Revenue Total (77,524) (77,742) (82,184) (84,423) (86,726) (89,095) (91,531)
Operating Expense
11 ‐ Operating expenses 73,359 77,742 82,184 84,423 86,726 89,095 91,531
Operating Expense Total 73,359 77,742 82,184 84,423 86,726 89,095 91,531
370 ‐ Solid Waste Local Service ‐ Sayward Valley $ (4,165) $ ‐ $ ‐ $ ‐ $ ‐ $ ‐ $ ‐
100
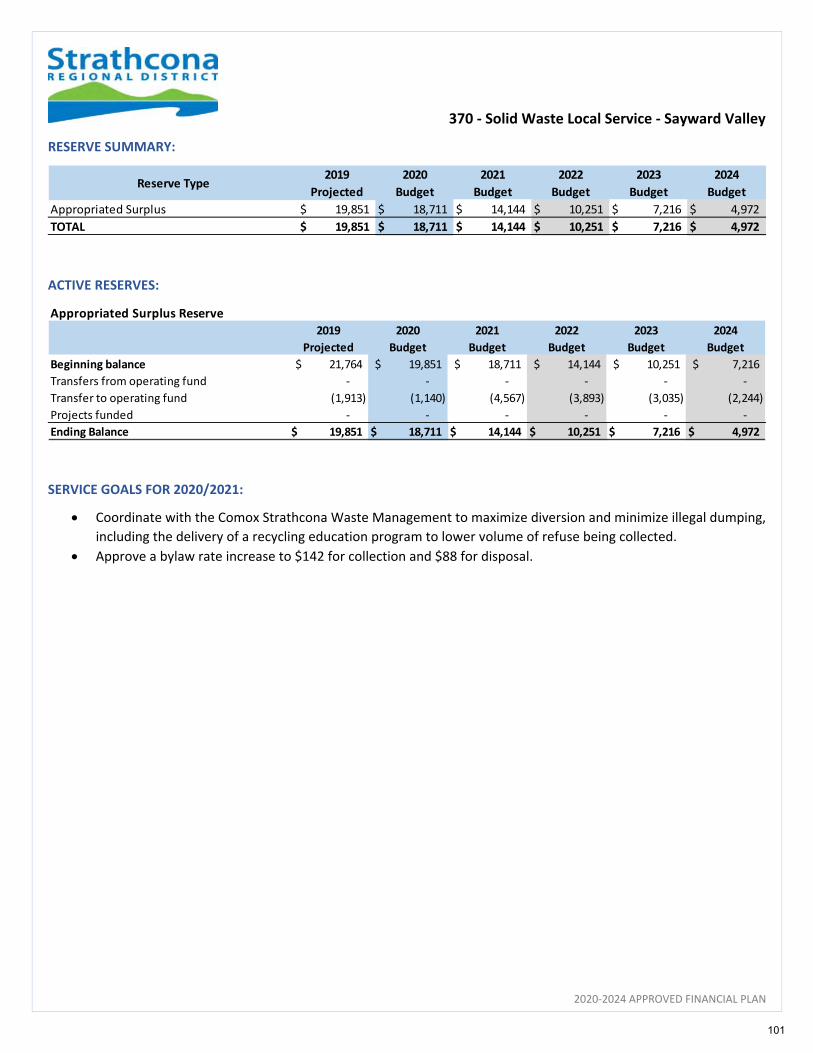
370 ‐ Solid Waste Local Service ‐ Sayward Valley
2020‐2024 APPROVED FINANCIAL PLAN
RESERVE SUMMARY:
ACTIVE RESERVES:
SERVICE GOALS FOR 2020/2021:
Coordinate with the Comox Strathcona Waste Management to maximize diversion and minimize illegal dumping,
including the delivery of a recycling education program to lower volume of refuse being collected.
Approve a bylaw rate increase to $142 for collection and $88 for disposal.
Reserve Type2019
Projected
2020
Budget
2021
Budget
2022
Budget
2023
Budget
2024
Budget
Appropriated Surplus 19,851$ 18,711$ 14,144$ 10,251$ 7,216$ 4,972$
TOTAL 19,851$ 18,711$ 14,144$ 10,251$ 7,216$ 4,972$
Appropriated Surplus Reserve
2019
Projected
2020
Budget
2021
Budget
2022
Budget
2023
Budget
2024
Budget
Beginning balance 21,764$ 19,851$ 18,711$ 14,144$ 10,251$ 7,216$
Transfers from operating fund ‐ ‐ ‐ ‐ ‐ ‐
Transfer to operating fund (1,913) (1,140) (4,567) (3,893) (3,035) (2,244)
Projects funded ‐ ‐ ‐ ‐ ‐ ‐
Ending Balance 19,851$ 18,711$ 14,144$ 10,251$ 7,216$ 4,972$
101
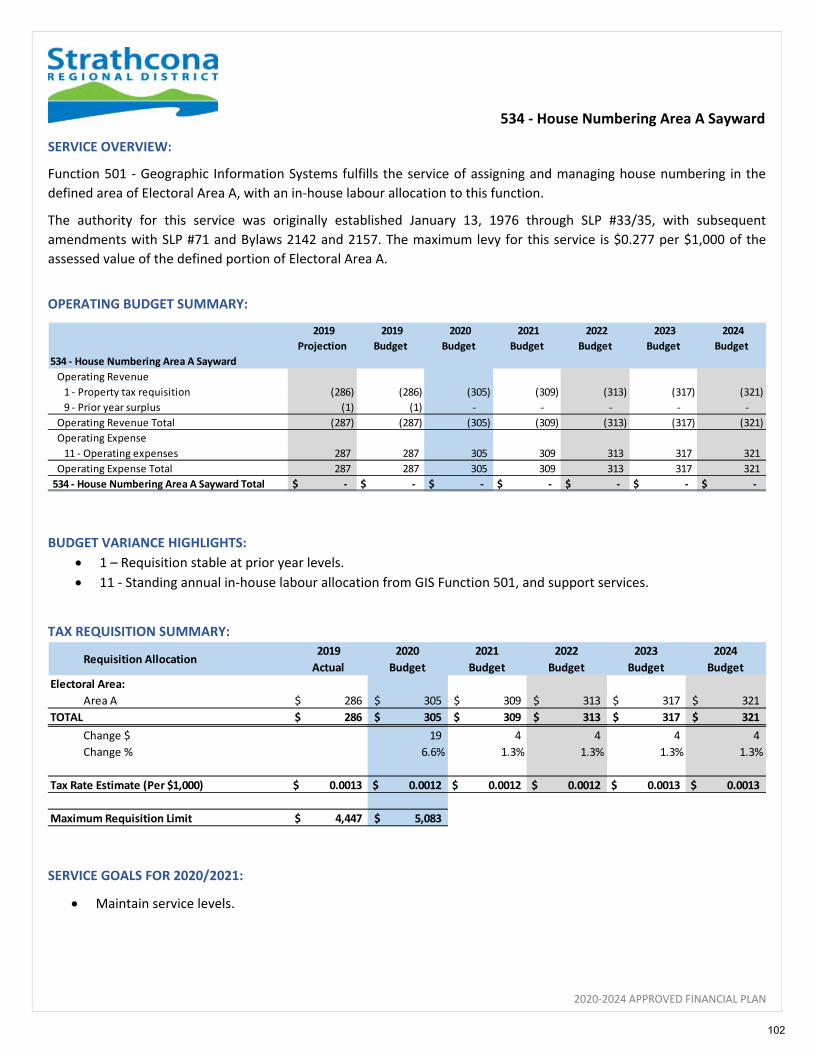
534 ‐ House Numbering Area A Sayward
2020‐2024 APPROVED FINANCIAL PLAN
SERVICE OVERVIEW:
Function 501 ‐ Geographic Information Systems fulfills the service of assigning and managing house numbering in the
defined area of Electoral Area A, with an in‐house labour allocation to this function.
The authority for this service was originally established January 13, 1976 through SLP #33/35, with subsequent
amendments with SLP #71 and Bylaws 2142 and 2157. The maximum levy for this service is $0.277 per $1,000 of the
assessed value of the defined portion of Electoral Area A.
OPERATING BUDGET SUMMARY:
BUDGET VARIANCE HIGHLIGHTS:
1 – Requisition stable at prior year levels.
11 ‐ Standing annual in‐house labour allocation from GIS Function 501, and support services.
TAX REQUISITION SUMMARY:
SERVICE GOALS FOR 2020/2021:
Maintain service levels.
2019
Projection
2019
Budget
2020
Budget
2021
Budget
2022
Budget
2023
Budget
2024
Budget
534 ‐ House Numbering Area A Sayward
Operating Revenue
1 ‐ Property tax requisition (286) (286) (305) (309) (313) (317) (321)
9 ‐ Prior year surplus (1) (1) ‐ ‐ ‐ ‐ ‐
Operating Revenue Total (287) (287) (305) (309) (313) (317) (321)
Operating Expense
11 ‐ Operating expenses 287 287 305 309 313 317 321
Operating Expense Total 287 287 305 309 313 317 321
534 ‐ House Numbering Area A Sayward Total $ ‐ $ ‐ $ ‐ $ ‐ $ ‐ $ ‐ $ ‐
Requisition Allocation2019
Actual
2020
Budget
2021
Budget
2022
Budget
2023
Budget
2024
Budget
Electoral Area:
Area A 286$ 305$ 309$ 313$ 317$ 321$
TOTAL 286$ 305$ 309$ 313$ 317$ 321$
Change $ 19 4 4 4 4
Change % 6.6% 1.3% 1.3% 1.3% 1.3%
Tax Rate Estimate (Per $1,000) 0.0013 $ 0.0012 $ 0.0012 $ 0.0012 $ 0.0013 $ 0.0013 $
Maximum Requisition Limit 4,447 $ 5,083 $
102

554 ‐ Economic Development ‐ Area A Sayward
2020‐2024 APPROVED FINANCIAL PLAN
SERVICE OVERVIEW:
The purpose of this budget is to provide supportive funding for organizations providing economic development services
within the part of Electoral Area A located within the Sayward Valley.
This function also includes lease revenues from a shared service agreement with the Village of Sayward using Sayward
Valley Communications to provide internet services in the region; a portion of the revenues generated for this service are
transferred back to Electoral A Sayward and the Village to be held for required infrastructure upgrades.
The authority for this service was originally established through Bylaw 2599 on February 23, 2004 with the maximum levy
for this service being $0.05 per $1,000 of the assessed values within the service area.
OPERATING BUDGET SUMMARY:
BUDGET VARIANCE HIGHLIGHTS:
1/9/11 – Property tax requisition maintained at prior year levels.
4/14 – Lease revenues and related transfer to reserve for the internet agreement which expires in 2021.
TAX REQUISITION SUMMARY:
2019
Projection
2019
Budget
2020
Budget
2021
Budget
2022
Budget
2023
Budget
2024
Budget
554 ‐ Economic Development ‐ Area A Sayward
Operating Revenue
1 ‐ Property tax requisition (500) (500) (500) (500) (500) (500) (500)
4 ‐ Other revenue (3,619) (3,400) (3,600) (3,000) ‐ ‐ ‐
9 ‐ Prior year surplus (537) (537) (615) ‐ ‐ ‐ ‐
Operating Revenue Total (4,656) (4,437) (4,715) (3,500) (500) (500) (500)
Operating Expense
11 ‐ Operating expenses 422 1,037 1,115 500 500 500 500
14 ‐ Transfers to reserves 3,619 3,400 3,600 3,000 ‐ ‐ ‐
Operating Expense Total 4,041 4,437 4,715 3,500 500 500 500
554 ‐ Economic Development ‐ Area A Sayward $ (615) $ ‐ $ ‐ $ ‐ $ ‐ $ ‐ $ ‐
Requisition Allocation2019
Actual
2020
Budget
2021
Budget
2022
Budget
2023
Budget
2024
Budget
Electoral Area:
Area A 500$ 500$ 500$ 500$ 500$ 500$
TOTAL 500$ 500$ 500$ 500$ 500$ 500$
Change $ ‐ ‐ ‐ ‐ ‐
Change % ‐ ‐ ‐ ‐ ‐
Tax Rate Estimate (Per $1,000) 0.0022 $ 0.0020 $ 0.0020 $ 0.0020 $ 0.0020 $ 0.0020 $
Maximum Requisition Limit 80,278 $ 91,754 $
103

554 ‐ Economic Development ‐ Area A Sayward
2020‐2024 APPROVED FINANCIAL PLAN
RESERVE SUMMARY:
ACTIVE RESERVES:
SERVICE GOALS FOR 2020/2021:
Determine future plans for service with new owner taking over Sayward Communications; Area Director would
prefer to have the contractor take on the assets and operate the service and end the current agreement. If so,
this service would be repealed if no other economic initiatives are planned for the area.
Reserve Type2019
Projected
2020
Budget
2021
Budget
2022
Budget
2023
Budget
2024
Budget
Appropriated Surplus 36,285$ 39,885$ 42,885$ 42,885$ 42,885$ 42,885$
TOTAL 36,285$ 39,885$ 42,885$ 42,885$ 42,885$ 42,885$
Appropriated Surplus Reserve
2019
Projected
2020
Budget
2021
Budget
2022
Budget
2023
Budget
2024
Budget
Beginning balance 33,830$ 36,285$ 39,885$ 42,885$ 42,885$ 42,885$
Transfers from operating fund 2,455 3,600 3,000 ‐ ‐ ‐
Transfer to operating fund ‐ ‐ ‐ ‐ ‐ ‐
Projects funded ‐ ‐ ‐ ‐ ‐ ‐
Ending Balance 36,285$ 39,885$ 42,885$ 42,885$ 42,885$ 42,885$
104
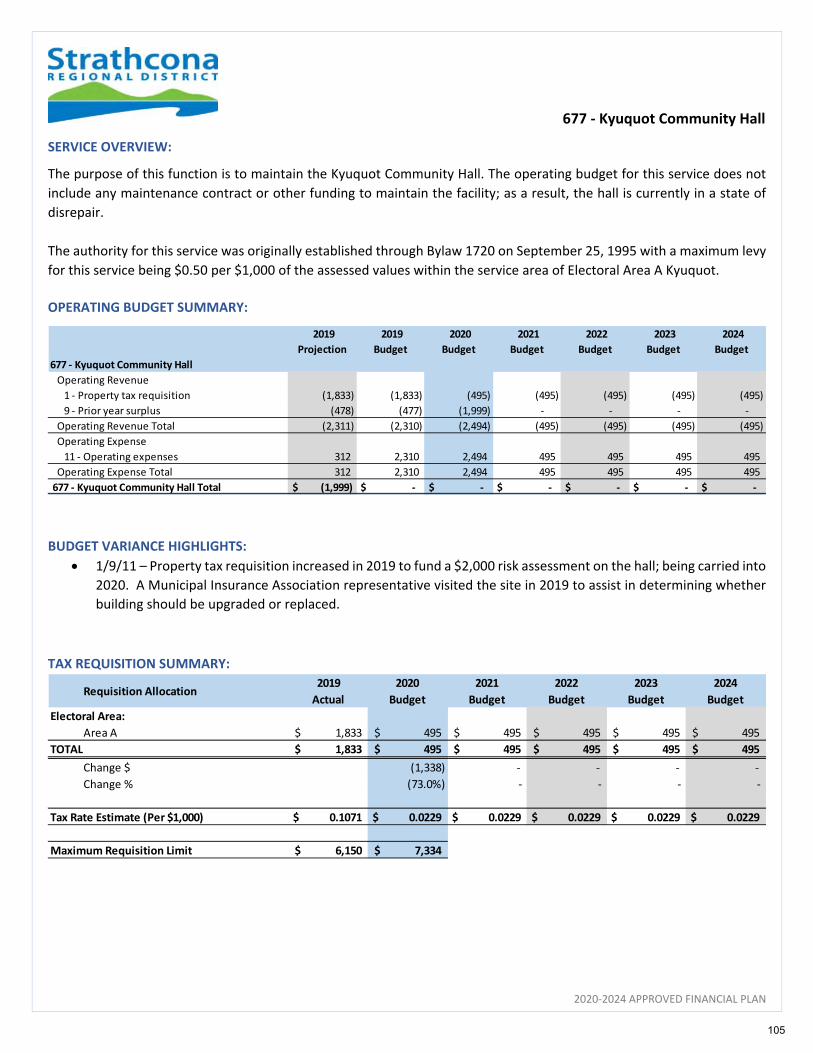
677 ‐ Kyuquot Community Hall
2020‐2024 APPROVED FINANCIAL PLAN
SERVICE OVERVIEW:
The purpose of this function is to maintain the Kyuquot Community Hall. The operating budget for this service does not
include any maintenance contract or other funding to maintain the facility; as a result, the hall is currently in a state of
disrepair.
The authority for this service was originally established through Bylaw 1720 on September 25, 1995 with a maximum levy
for this service being $0.50 per $1,000 of the assessed values within the service area of Electoral Area A Kyuquot.
OPERATING BUDGET SUMMARY:
BUDGET VARIANCE HIGHLIGHTS:
1/9/11 – Property tax requisition increased in 2019 to fund a $2,000 risk assessment on the hall; being carried into
2020. A Municipal Insurance Association representative visited the site in 2019 to assist in determining whether
building should be upgraded or replaced.
TAX REQUISITION SUMMARY:
2019
Projection
2019
Budget
2020
Budget
2021
Budget
2022
Budget
2023
Budget
2024
Budget
677 ‐ Kyuquot Community Hall
Operating Revenue
1 ‐ Property tax requisition (1,833) (1,833) (495) (495) (495) (495) (495)
9 ‐ Prior year surplus (478) (477) (1,999) ‐ ‐ ‐ ‐
Operating Revenue Total (2,311) (2,310) (2,494) (495) (495) (495) (495)
Operating Expense
11 ‐ Operating expenses 312 2,310 2,494 495 495 495 495
Operating Expense Total 312 2,310 2,494 495 495 495 495
677 ‐ Kyuquot Community Hall Total $ (1,999) $ ‐ $ ‐ $ ‐ $ ‐ $ ‐ $ ‐
Requisition Allocation2019
Actual
2020
Budget
2021
Budget
2022
Budget
2023
Budget
2024
Budget
Electoral Area:
Area A 1,833$ 495$ 495$ 495$ 495$ 495$
TOTAL 1,833$ 495$ 495$ 495$ 495$ 495$
Change $ (1,338) ‐ ‐ ‐ ‐
Change % (73.0%) ‐ ‐ ‐ ‐
Tax Rate Estimate (Per $1,000) 0.1071 $ 0.0229 $ 0.0229 $ 0.0229 $ 0.0229 $ 0.0229 $
Maximum Requisition Limit 6,150 $ 7,334 $
105
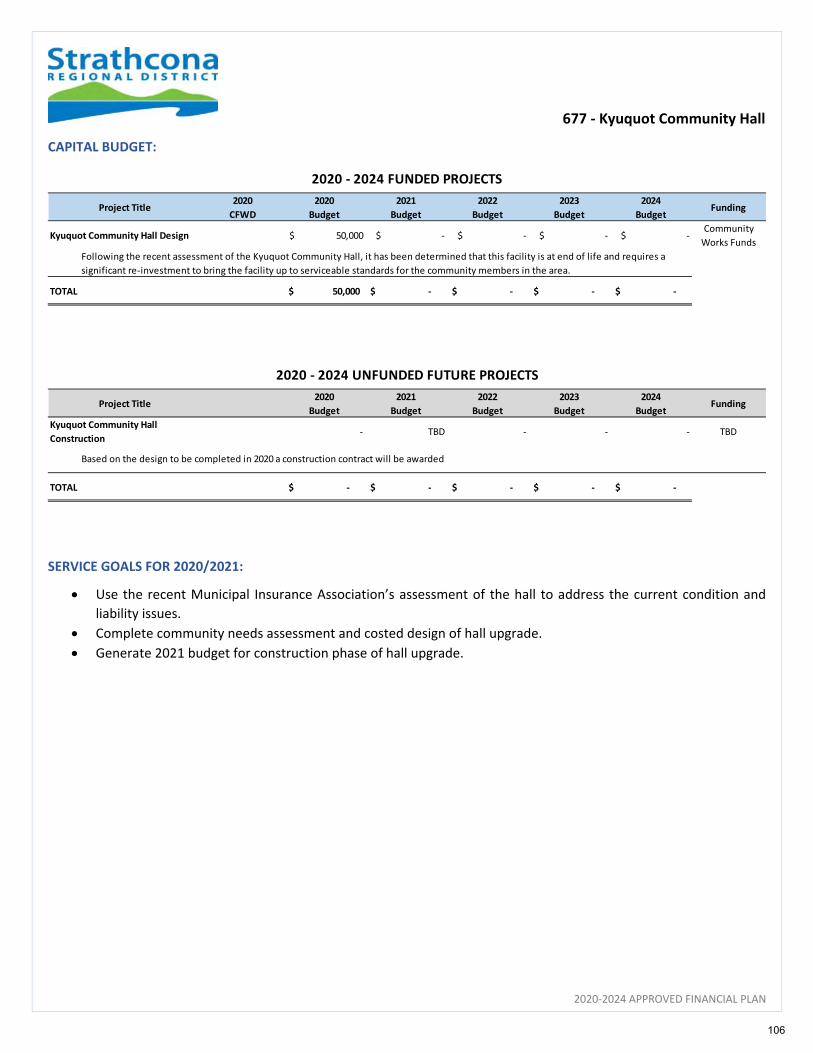
677 ‐ Kyuquot Community Hall
2020‐2024 APPROVED FINANCIAL PLAN
CAPITAL BUDGET:
SERVICE GOALS FOR 2020/2021:
Use the recent Municipal Insurance Association’s assessment of the hall to address the current condition and
liability issues.
Complete community needs assessment and costed design of hall upgrade.
Generate 2021 budget for construction phase of hall upgrade.
Project Title2020
CFWD
2020
Budget
2021
Budget
2022
Budget
2023
Budget
2024
BudgetFunding
Kyuquot Community Hall Design $ 50,000 $ ‐ $ ‐ $ ‐ $ ‐ Community
Works Funds
TOTAL 50,000$ ‐$ ‐$ ‐$ ‐$
2020 ‐ 2024 FUNDED PROJECTS
Following the recent assessment of the Kyuquot Community Hall, it has been determined that this facility is at end of life and requires a
significant re‐investment to bring the facility up to serviceable standards for the community members in the area.
Project Title2020
Budget
2021
Budget
2022
Budget
2023
Budget
2024
BudgetFunding
Kyuquot Community Hall
Construction ‐ TBD ‐ ‐ ‐ TBD
TOTAL ‐$ ‐$ ‐$ ‐$ ‐$
2020 ‐ 2024 UNFUNDED FUTURE PROJECTS
Based on the design to be completed in 2020 a construction contract will be awarded
106
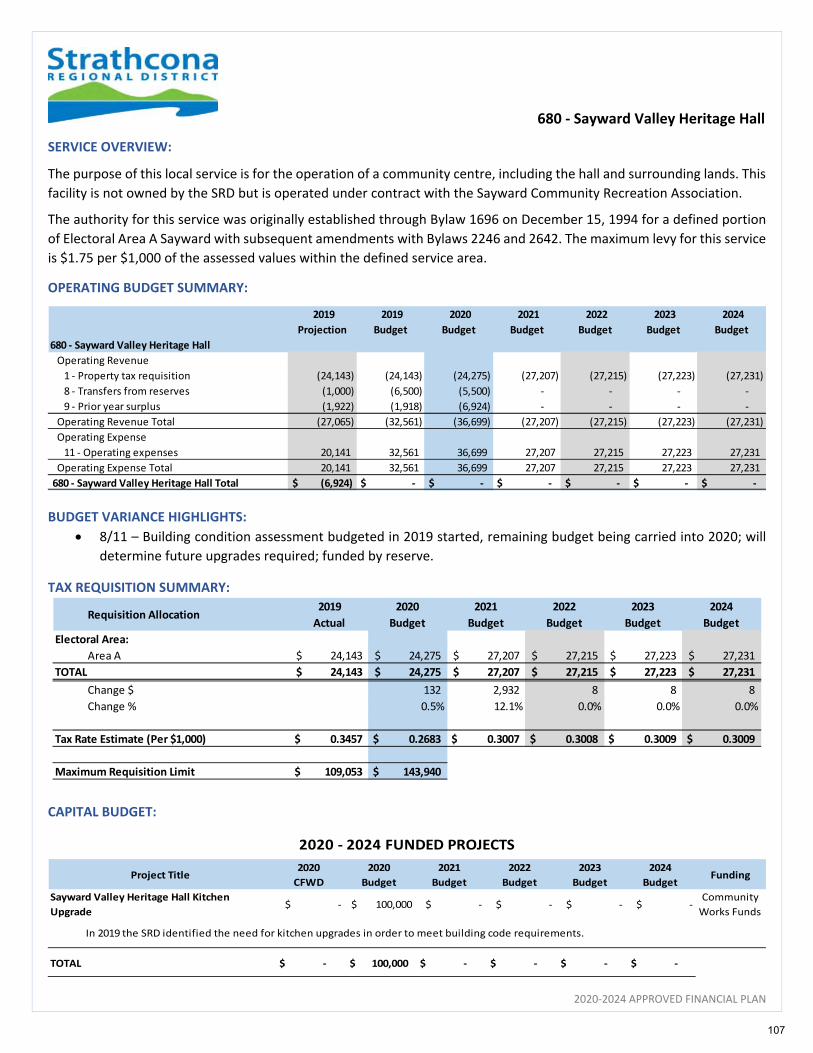
680 ‐ Sayward Valley Heritage Hall
2020‐2024 APPROVED FINANCIAL PLAN
SERVICE OVERVIEW:
The purpose of this local service is for the operation of a community centre, including the hall and surrounding lands. This
facility is not owned by the SRD but is operated under contract with the Sayward Community Recreation Association.
The authority for this service was originally established through Bylaw 1696 on December 15, 1994 for a defined portion
of Electoral Area A Sayward with subsequent amendments with Bylaws 2246 and 2642. The maximum levy for this service
is $1.75 per $1,000 of the assessed values within the defined service area.
OPERATING BUDGET SUMMARY:
BUDGET VARIANCE HIGHLIGHTS:
8/11 – Building condition assessment budgeted in 2019 started, remaining budget being carried into 2020; will
determine future upgrades required; funded by reserve.
TAX REQUISITION SUMMARY:
CAPITAL BUDGET:
2019
Projection
2019
Budget
2020
Budget
2021
Budget
2022
Budget
2023
Budget
2024
Budget
680 ‐ Sayward Valley Heritage Hall
Operating Revenue
1 ‐ Property tax requisition (24,143) (24,143) (24,275) (27,207) (27,215) (27,223) (27,231)
8 ‐ Transfers from reserves (1,000) (6,500) (5,500) ‐ ‐ ‐ ‐
9 ‐ Prior year surplus (1,922) (1,918) (6,924) ‐ ‐ ‐ ‐
Operating Revenue Total (27,065) (32,561) (36,699) (27,207) (27,215) (27,223) (27,231)
Operating Expense
11 ‐ Operating expenses 20,141 32,561 36,699 27,207 27,215 27,223 27,231
Operating Expense Total 20,141 32,561 36,699 27,207 27,215 27,223 27,231
680 ‐ Sayward Valley Heritage Hall Total $ (6,924) $ ‐ $ ‐ $ ‐ $ ‐ $ ‐ $ ‐
Requisition Allocation2019
Actual
2020
Budget
2021
Budget
2022
Budget
2023
Budget
2024
Budget
Electoral Area:
Area A 24,143$ 24,275$ 27,207$ 27,215$ 27,223$ 27,231$
TOTAL 24,143$ 24,275$ 27,207$ 27,215$ 27,223$ 27,231$
Change $ 132 2,932 8 8 8
Change % 0.5% 12.1% 0.0% 0.0% 0.0%
Tax Rate Estimate (Per $1,000) 0.3457 $ 0.2683 $ 0.3007 $ 0.3008 $ 0.3009 $ 0.3009 $
Maximum Requisition Limit 109,053 $ 143,940 $
Project Title2020
CFWD
2020
Budget
2021
Budget
2022
Budget
2023
Budget
2024
BudgetFunding
Sayward Valley Heritage Hall Kitchen
Upgrade $ ‐ $ 100,000 $ ‐ $ ‐ $ ‐ $ ‐
Community
Works Funds
TOTAL ‐$ 100,000$ ‐$ ‐$ ‐$ ‐$
In 2019 the SRD identified the need for kitchen upgrades in order to meet building code requirements.
2020 ‐ 2024 FUNDED PROJECTS
107
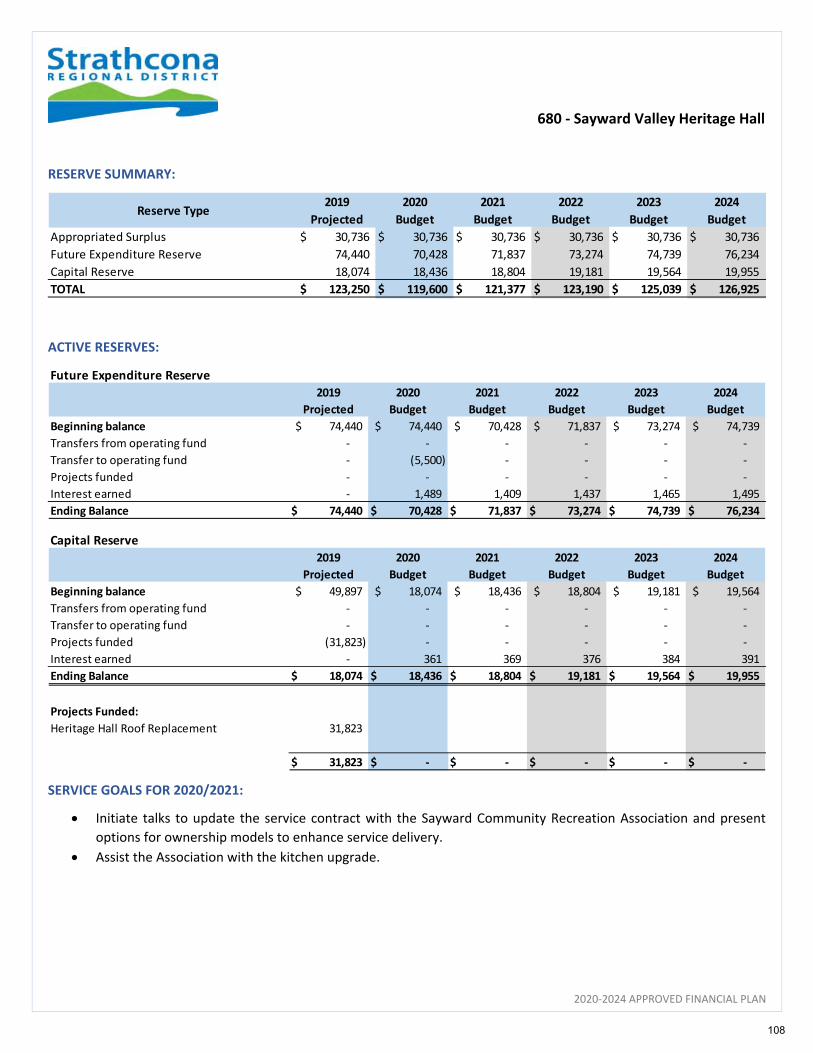
680 ‐ Sayward Valley Heritage Hall
2020‐2024 APPROVED FINANCIAL PLAN
RESERVE SUMMARY:
ACTIVE RESERVES:
SERVICE GOALS FOR 2020/2021:
Initiate talks to update the service contract with the Sayward Community Recreation Association and present
options for ownership models to enhance service delivery.
Assist the Association with the kitchen upgrade.
Reserve Type2019
Projected
2020
Budget
2021
Budget
2022
Budget
2023
Budget
2024
Budget
Appropriated Surplus 30,736$ 30,736$ 30,736$ 30,736$ 30,736$ 30,736$
Future Expenditure Reserve 74,440 70,428 71,837 73,274 74,739 76,234
Capital Reserve 18,074 18,436 18,804 19,181 19,564 19,955
TOTAL 123,250$ 119,600$ 121,377$ 123,190$ 125,039$ 126,925$
Future Expenditure Reserve
2019
Projected
2020
Budget
2021
Budget
2022
Budget
2023
Budget
2024
Budget
Beginning balance 74,440$ 74,440$ 70,428$ 71,837$ 73,274$ 74,739$
Transfers from operating fund ‐ ‐ ‐ ‐ ‐ ‐
Transfer to operating fund ‐ (5,500) ‐ ‐ ‐ ‐
Projects funded ‐ ‐ ‐ ‐ ‐ ‐
Interest earned ‐ 1,489 1,409 1,437 1,465 1,495
Ending Balance 74,440$ 70,428$ 71,837$ 73,274$ 74,739$ 76,234$
Capital Reserve
2019
Projected
2020
Budget
2021
Budget
2022
Budget
2023
Budget
2024
Budget
Beginning balance 49,897$ 18,074$ 18,436$ 18,804$ 19,181$ 19,564$
Transfers from operating fund ‐ ‐ ‐ ‐ ‐ ‐
Transfer to operating fund ‐ ‐ ‐ ‐ ‐ ‐
Projects funded (31,823) ‐ ‐ ‐ ‐ ‐
Interest earned ‐ 361 369 376 384 391
Ending Balance 18,074$ 18,436$ 18,804$ 19,181$ 19,564$ 19,955$
Projects Funded:
Heritage Hall Roof Replacement 31,823
31,823$ ‐$ ‐$ ‐$ ‐$ ‐$
108
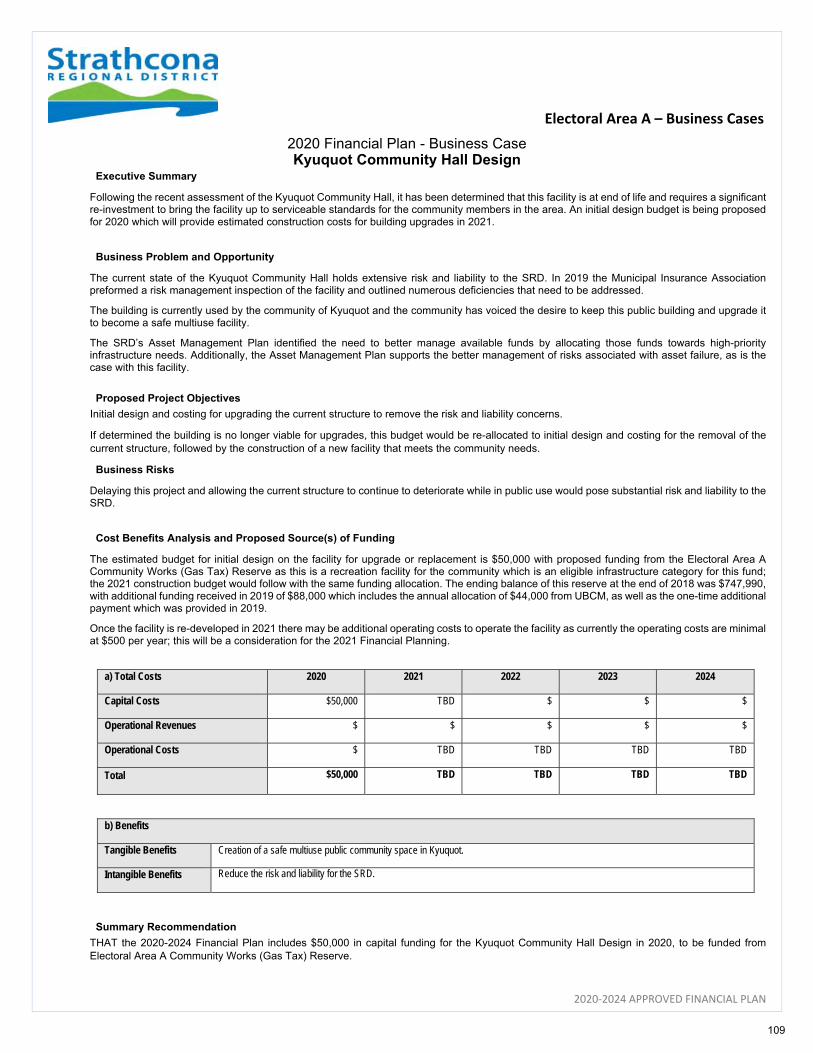
Electoral Area A – Business Cases
2020‐2024 APPROVED FINANCIAL PLAN
2020 Financial Plan - Business Case Kyuquot Community Hall Design
Executive Summary
Following the recent assessment of the Kyuquot Community Hall, it has been determined that this facility is at end of life and requires a significant re-investment to bring the facility up to serviceable standards for the community members in the area. An initial design budget is being proposed for 2020 which will provide estimated construction costs for building upgrades in 2021.
Business Problem and Opportunity
The current state of the Kyuquot Community Hall holds extensive risk and liability to the SRD. In 2019 the Municipal Insurance Association preformed a risk management inspection of the facility and outlined numerous deficiencies that need to be addressed.
The building is currently used by the community of Kyuquot and the community has voiced the desire to keep this public building and upgrade it to become a safe multiuse facility.
The SRD’s Asset Management Plan identified the need to better manage available funds by allocating those funds towards high-priority infrastructure needs. Additionally, the Asset Management Plan supports the better management of risks associated with asset failure, as is the case with this facility.
Proposed Project Objectives
Initial design and costing for upgrading the current structure to remove the risk and liability concerns.
If determined the building is no longer viable for upgrades, this budget would be re-allocated to initial design and costing for the removal of the current structure, followed by the construction of a new facility that meets the community needs.
Business Risks
Delaying this project and allowing the current structure to continue to deteriorate while in public use would pose substantial risk and liability to the SRD.
Cost Benefits Analysis and Proposed Source(s) of Funding
The estimated budget for initial design on the facility for upgrade or replacement is $50,000 with proposed funding from the Electoral Area A Community Works (Gas Tax) Reserve as this is a recreation facility for the community which is an eligible infrastructure category for this fund; the 2021 construction budget would follow with the same funding allocation. The ending balance of this reserve at the end of 2018 was $747,990, with additional funding received in 2019 of $88,000 which includes the annual allocation of $44,000 from UBCM, as well as the one-time additional payment which was provided in 2019.
Once the facility is re-developed in 2021 there may be additional operating costs to operate the facility as currently the operating costs are minimal at $500 per year; this will be a consideration for the 2021 Financial Planning.
a) Total Costs 2020 2021 2022 2023 2024
Capital Costs $50,000 TBD $ $ $
Operational Revenues $ $ $ $ $
Operational Costs $ TBD TBD TBD TBD
Total $50,000 TBD TBD TBD TBD
b) Benefits
Tangible Benefits Creation of a safe multiuse public community space in Kyuquot.
Intangible Benefits Reduce the risk and liability for the SRD.
Summary Recommendation
THAT the 2020-2024 Financial Plan includes $50,000 in capital funding for the Kyuquot Community Hall Design in 2020, to be funded from Electoral Area A Community Works (Gas Tax) Reserve.
109
Electoral Area A
2020‐2024 APPROVED FINANCIAL PLAN
110

2020‐2024 APPROVED FINANCIAL PLAN
Electoral Area B
Cortes Island
Electoral Area B includes all of Cortes Island and the surrounding archipelago islands. This electoral area is the smallest
region within the Strathcona Regional District (SRD) at just under 330 square kilometres.
Cortes Island residents and visitors enjoy a spectacular selection of marine, lake and forest environments. The Island has
just over 1,000 full‐time residents spread over several small villages, including Whaletown, Manson’s Landing, Squirrel
Cove and Cortes Bay. Parks range in diversity from dense forests, highlighted by old growth cedars, to expansive marine
areas. Recreational opportunities include superb hiking, mountain biking, swimming, camping and kayaking
FINANCIAL PLAN
2020 – 2024
Rebecca Spit, Quadra Island
111

Electoral Area B Summary
2020‐2024 APPROVED FINANCIAL PLAN
Electoral Area B includes the following functions:
Function # ‐ Function Description
126 ‐ Grant In Aid Area B
157 ‐ Feasibility Studies ‐ Electoral Area B
250 ‐ South Cortes Island Fire Protection
251 ‐ Cotes Island First Responder
374 ‐ Area B Refuse Disposal
376 ‐ Cortes Island Refuse Collection
535 ‐ House Numbering Area B
617 ‐ Community Parks Area B
682 ‐ Cortes Island Community Hall
697 ‐ Heritage Conservation ‐ Area B
112
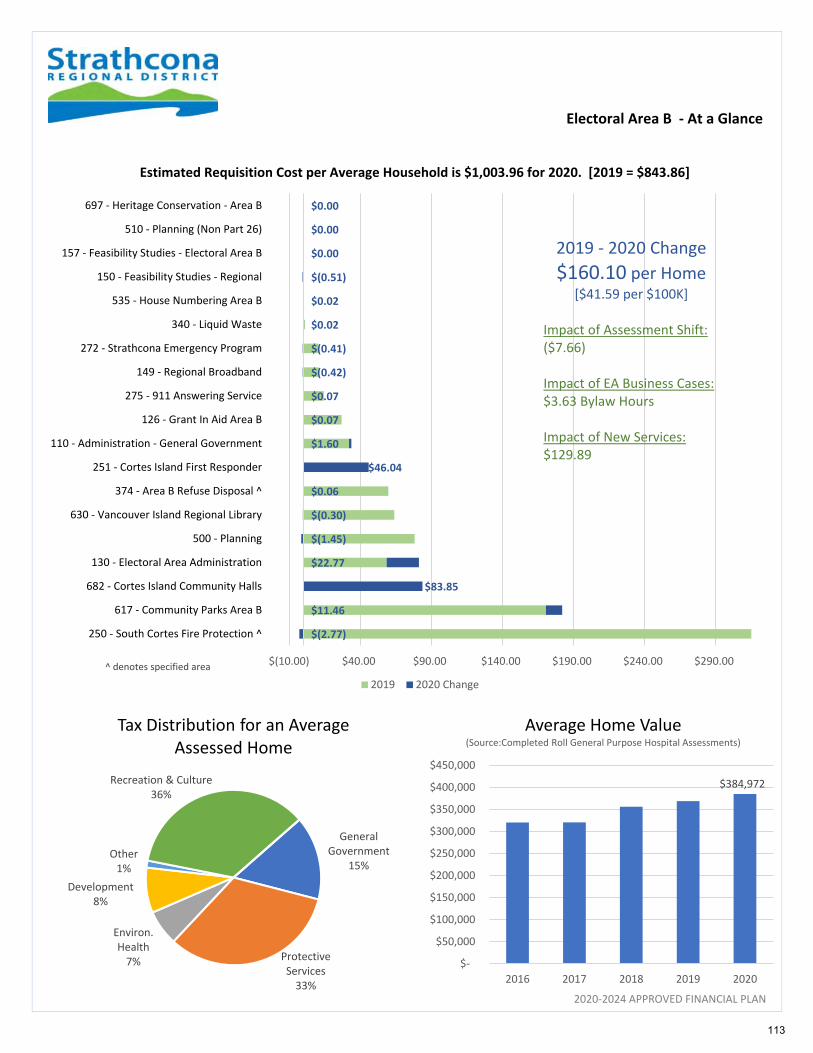
Electoral Area B ‐ At a Glance
2020‐2024 APPROVED FINANCIAL PLAN
$(2.77)
$11.46
$22.77
$(1.45)
$(0.30)
$0.06
$1.60
$0.07
$0.07
$(0.42)
$(0.41)
$0.02
$0.02
$(0.51)
$0.00
$0.00
$0.00
$83.85
$46.04
$(10.00) $40.00 $90.00 $140.00 $190.00 $240.00 $290.00
250 ‐ South Cortes Fire Protection ^
617 ‐ Community Parks Area B
682 ‐ Cortes Island Community Halls
130 ‐ Electoral Area Administration
500 ‐ Planning
630 ‐ Vancouver Island Regional Library
374 ‐ Area B Refuse Disposal ^
251 ‐ Cortes Island First Responder
110 ‐ Administration ‐ General Government
126 ‐ Grant In Aid Area B
275 ‐ 911 Answering Service
149 ‐ Regional Broadband
272 ‐ Strathcona Emergency Program
340 ‐ Liquid Waste
535 ‐ House Numbering Area B
150 ‐ Feasibility Studies ‐ Regional
157 ‐ Feasibility Studies ‐ Electoral Area B
510 ‐ Planning (Non Part 26)
697 ‐ Heritage Conservation ‐ Area B
2019 2020 Change
2019 ‐ 2020 Change
$160.10 per Home[$41.59 per $100K]
Impact of Assessment Shift:($7.66)
Impact of EA Business Cases:$3.63 Bylaw Hours
Impact of New Services:$129.89
General Government
15%
Protective Services33%
Environ. Health7%
Development8%
Other1%
Recreation & Culture36%
Tax Distribution for an Average Assessed Home
$384,972
$‐
$50,000
$100,000
$150,000
$200,000
$250,000
$300,000
$350,000
$400,000
$450,000
2016 2017 2018 2019 2020
Average Home Value(Source:Completed Roll General Purpose Hospital Assessments)
Estimated Requisition Cost per Average Household is $1,003.96 for 2020. [2019 = $843.86]
^ denotes specified area
113
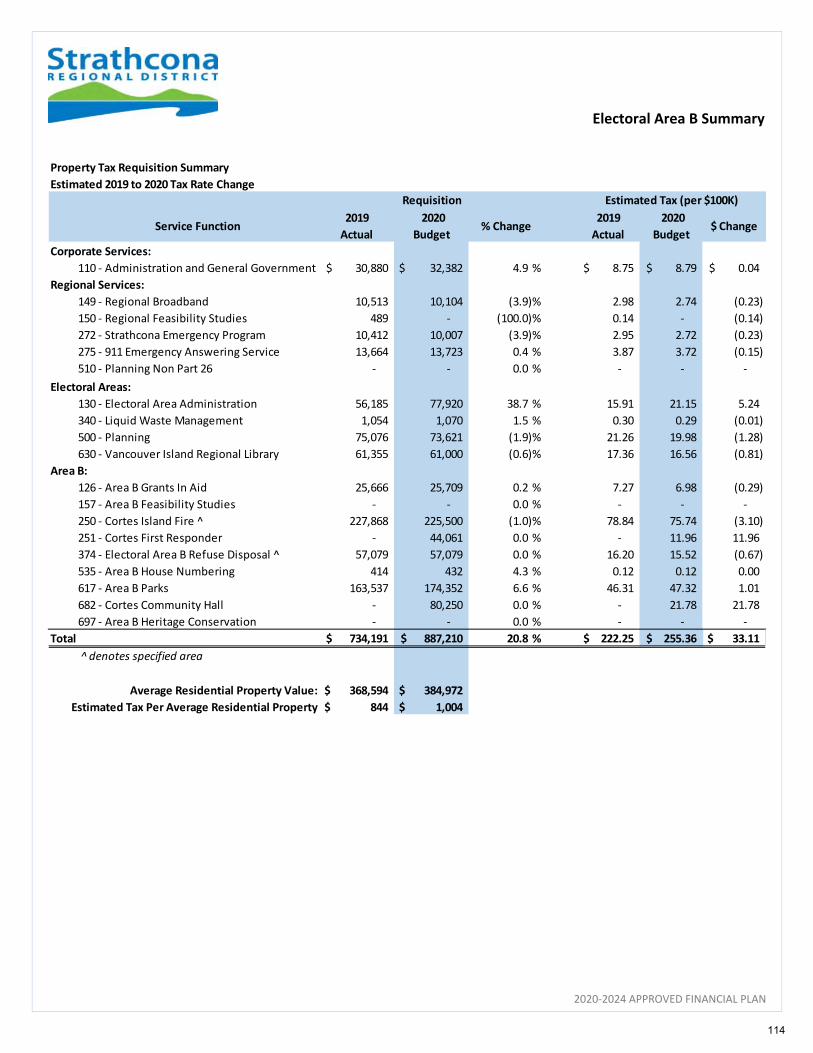
Electoral Area B Summary
2020‐2024 APPROVED FINANCIAL PLAN
Property Tax Requisition Summary
Estimated 2019 to 2020 Tax Rate Change
Service Function2019
Actual
2020
Budget % Change
2019
Actual
2020
Budget $ Change
Corporate Services:
110 ‐ Administration and General Government 30,880$ 32,382 $ 4.9 % 8.75$ 8.79$ 0.04$
Regional Services:
149 ‐ Regional Broadband 10,513 10,104 (3.9)% 2.98 2.74 (0.23)
150 ‐ Regional Feasibility Studies 489 ‐ (100.0)% 0.14 ‐ (0.14)
272 ‐ Strathcona Emergency Program 10,412 10,007 (3.9)% 2.95 2.72 (0.23)
275 ‐ 911 Emergency Answering Service 13,664 13,723 0.4 % 3.87 3.72 (0.15)
510 ‐ Planning Non Part 26 ‐ ‐ 0.0 % ‐ ‐ ‐
Electoral Areas:
130 ‐ Electoral Area Administration 56,185 77,920 38.7 % 15.91 21.15 5.24
340 ‐ Liquid Waste Management 1,054 1,070 1.5 % 0.30 0.29 (0.01)
500 ‐ Planning 75,076 73,621 (1.9)% 21.26 19.98 (1.28)
630 ‐ Vancouver Island Regional Library 61,355 61,000 (0.6)% 17.36 16.56 (0.81)
Area B:
126 ‐ Area B Grants In Aid 25,666 25,709 0.2 % 7.27 6.98 (0.29)
157 ‐ Area B Feasibility Studies ‐ ‐ 0.0 % ‐ ‐ ‐
250 ‐ Cortes Island Fire ^ 227,868 225,500 (1.0)% 78.84 75.74 (3.10)
251 ‐ Cortes First Responder ‐ 44,061 0.0 % ‐ 11.96 11.96
374 ‐ Electoral Area B Refuse Disposal ^ 57,079 57,079 0.0 % 16.20 15.52 (0.67)
535 ‐ Area B House Numbering 414 432 4.3 % 0.12 0.12 0.00
617 ‐ Area B Parks 163,537 174,352 6.6 % 46.31 47.32 1.01
682 ‐ Cortes Community Hall ‐ 80,250 0.0 % ‐ 21.78 21.78
697 ‐ Area B Heritage Conservation ‐ ‐ 0.0 % ‐ ‐ ‐
Total 734,191$ 887,210$ 20.8 % 222.25$ 255.36$ 33.11 $
̂denotes specified area
Average Residential Property Value: 368,594 $ 384,972 $
Estimated Tax Per Average Residential Property 844 $ 1,004 $
Requisition Estimated Tax (per $100K)
114
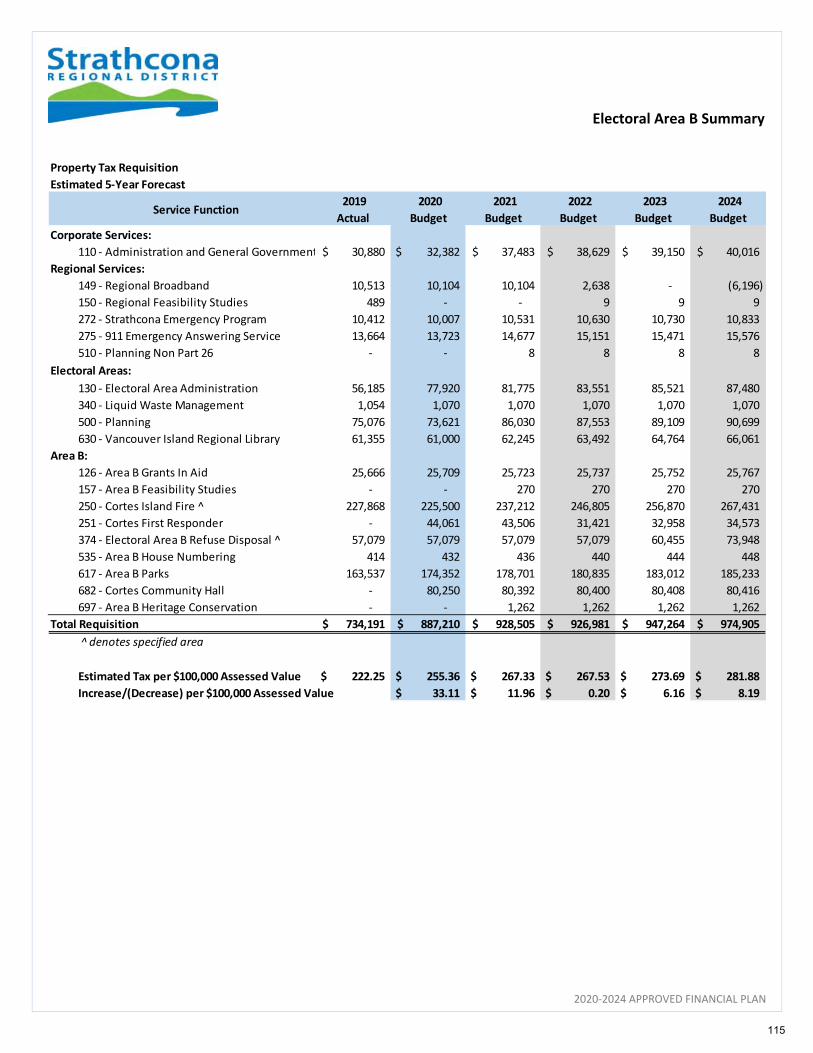
Electoral Area B Summary
2020‐2024 APPROVED FINANCIAL PLAN
Property Tax Requisition
Estimated 5‐Year Forecast
Service Function 2019
Actual
2020
Budget
2021
Budget
2022
Budget
2023
Budget
2024
Budget
Corporate Services:
110 ‐ Administration and General Government 30,880$ 32,382 $ 37,483$ 38,629$ 39,150$ 40,016$
Regional Services:
149 ‐ Regional Broadband 10,513 10,104 10,104 2,638 ‐ (6,196)
150 ‐ Regional Feasibility Studies 489 ‐ ‐ 9 9 9
272 ‐ Strathcona Emergency Program 10,412 10,007 10,531 10,630 10,730 10,833
275 ‐ 911 Emergency Answering Service 13,664 13,723 14,677 15,151 15,471 15,576
510 ‐ Planning Non Part 26 ‐ ‐ 8 8 8 8
Electoral Areas:
130 ‐ Electoral Area Administration 56,185 77,920 81,775 83,551 85,521 87,480
340 ‐ Liquid Waste Management 1,054 1,070 1,070 1,070 1,070 1,070
500 ‐ Planning 75,076 73,621 86,030 87,553 89,109 90,699
630 ‐ Vancouver Island Regional Library 61,355 61,000 62,245 63,492 64,764 66,061
Area B:
126 ‐ Area B Grants In Aid 25,666 25,709 25,723 25,737 25,752 25,767
157 ‐ Area B Feasibility Studies ‐ ‐ 270 270 270 270
250 ‐ Cortes Island Fire ^ 227,868 225,500 237,212 246,805 256,870 267,431
251 ‐ Cortes First Responder ‐ 44,061 43,506 31,421 32,958 34,573
374 ‐ Electoral Area B Refuse Disposal ^ 57,079 57,079 57,079 57,079 60,455 73,948
535 ‐ Area B House Numbering 414 432 436 440 444 448
617 ‐ Area B Parks 163,537 174,352 178,701 180,835 183,012 185,233
682 ‐ Cortes Community Hall ‐ 80,250 80,392 80,400 80,408 80,416
697 ‐ Area B Heritage Conservation ‐ ‐ 1,262 1,262 1,262 1,262
Total Requisition 734,191$ 887,210$ 928,505$ 926,981$ 947,264$ 974,905$
^ denotes specified area
Estimated Tax per $100,000 Assessed Value 222.25 $ 255.36 $ 267.33 $ 267.53 $ 273.69 $ 281.88 $
Increase/(Decrease) per $100,000 Assessed Value 33.11 $ 11.96 $ 0.20 $ 6.16 $ 8.19 $
115
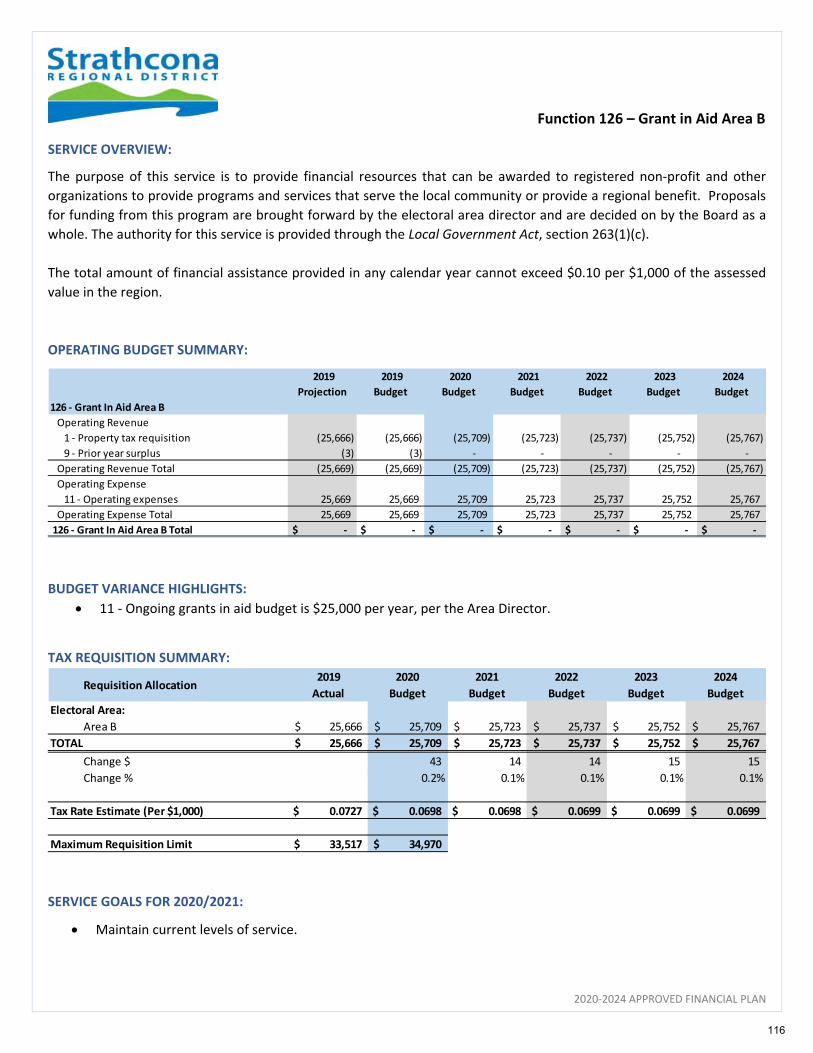
Function 126 – Grant in Aid Area B
2020‐2024 APPROVED FINANCIAL PLAN
SERVICE OVERVIEW:
The purpose of this service is to provide financial resources that can be awarded to registered non‐profit and other
organizations to provide programs and services that serve the local community or provide a regional benefit. Proposals
for funding from this program are brought forward by the electoral area director and are decided on by the Board as a
whole. The authority for this service is provided through the Local Government Act, section 263(1)(c).
The total amount of financial assistance provided in any calendar year cannot exceed $0.10 per $1,000 of the assessed
value in the region.
OPERATING BUDGET SUMMARY:
BUDGET VARIANCE HIGHLIGHTS:
11 ‐ Ongoing grants in aid budget is $25,000 per year, per the Area Director.
TAX REQUISITION SUMMARY:
SERVICE GOALS FOR 2020/2021:
Maintain current levels of service.
2019
Projection
2019
Budget
2020
Budget
2021
Budget
2022
Budget
2023
Budget
2024
Budget
126 ‐ Grant In Aid Area B
Operating Revenue
1 ‐ Property tax requisition (25,666) (25,666) (25,709) (25,723) (25,737) (25,752) (25,767)
9 ‐ Prior year surplus (3) (3) ‐ ‐ ‐ ‐ ‐
Operating Revenue Total (25,669) (25,669) (25,709) (25,723) (25,737) (25,752) (25,767)
Operating Expense
11 ‐ Operating expenses 25,669 25,669 25,709 25,723 25,737 25,752 25,767
Operating Expense Total 25,669 25,669 25,709 25,723 25,737 25,752 25,767
126 ‐ Grant In Aid Area B Total $ ‐ $ ‐ $ ‐ $ ‐ $ ‐ $ ‐ $ ‐
Requisition Allocation2019
Actual
2020
Budget
2021
Budget
2022
Budget
2023
Budget
2024
Budget
Electoral Area:
Area B 25,666$ 25,709$ 25,723$ 25,737$ 25,752$ 25,767$
TOTAL 25,666$ 25,709$ 25,723$ 25,737$ 25,752$ 25,767$
Change $ 43 14 14 15 15
Change % 0.2% 0.1% 0.1% 0.1% 0.1%
Tax Rate Estimate (Per $1,000) 0.0727 $ 0.0698 $ 0.0698 $ 0.0699 $ 0.0699 $ 0.0699 $
Maximum Requisition Limit 33,517 $ 34,970 $
116
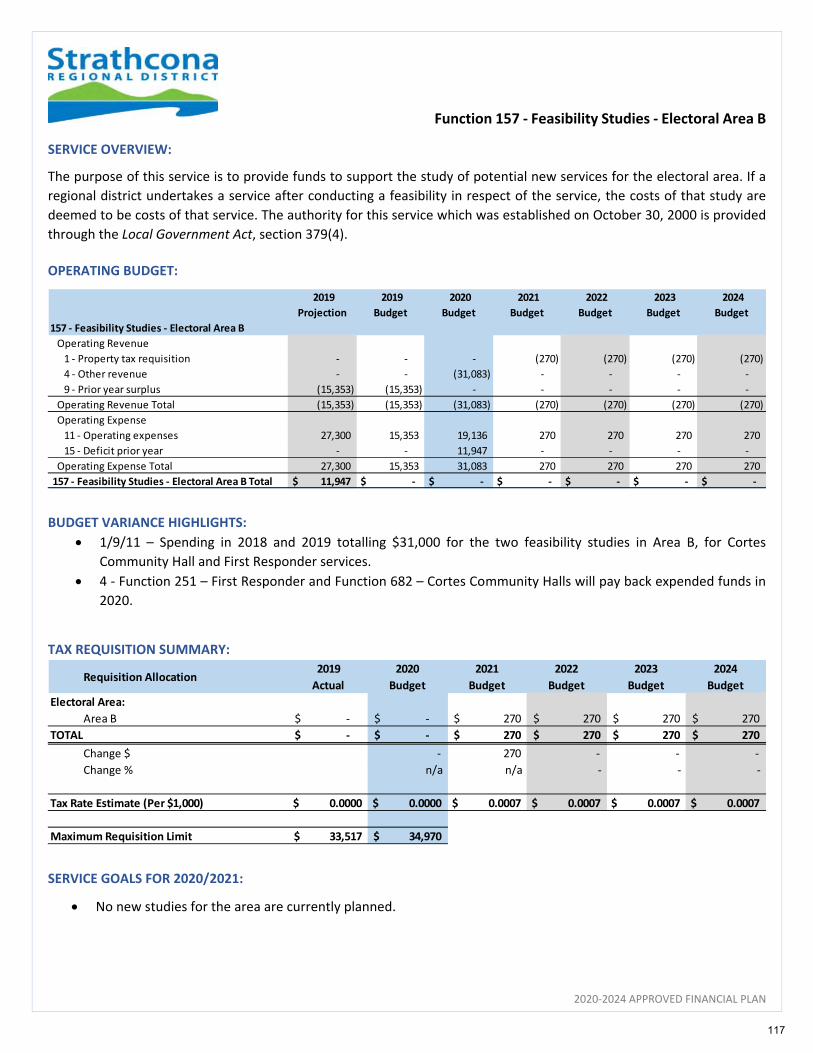
Function 157 ‐ Feasibility Studies ‐ Electoral Area B
2020‐2024 APPROVED FINANCIAL PLAN
SERVICE OVERVIEW:
The purpose of this service is to provide funds to support the study of potential new services for the electoral area. If a
regional district undertakes a service after conducting a feasibility in respect of the service, the costs of that study are
deemed to be costs of that service. The authority for this service which was established on October 30, 2000 is provided
through the Local Government Act, section 379(4).
OPERATING BUDGET:
BUDGET VARIANCE HIGHLIGHTS:
1/9/11 – Spending in 2018 and 2019 totalling $31,000 for the two feasibility studies in Area B, for Cortes
Community Hall and First Responder services.
4 ‐ Function 251 – First Responder and Function 682 – Cortes Community Halls will pay back expended funds in
2020.
TAX REQUISITION SUMMARY:
SERVICE GOALS FOR 2020/2021:
No new studies for the area are currently planned.
2019
Projection
2019
Budget
2020
Budget
2021
Budget
2022
Budget
2023
Budget
2024
Budget
157 ‐ Feasibility Studies ‐ Electoral Area B
Operating Revenue
1 ‐ Property tax requisition ‐ ‐ ‐ (270) (270) (270) (270)
4 ‐ Other revenue ‐ ‐ (31,083) ‐ ‐ ‐ ‐
9 ‐ Prior year surplus (15,353) (15,353) ‐ ‐ ‐ ‐ ‐
Operating Revenue Total (15,353) (15,353) (31,083) (270) (270) (270) (270)
Operating Expense
11 ‐ Operating expenses 27,300 15,353 19,136 270 270 270 270
15 ‐ Deficit prior year ‐ ‐ 11,947 ‐ ‐ ‐ ‐
Operating Expense Total 27,300 15,353 31,083 270 270 270 270
157 ‐ Feasibility Studies ‐ Electoral Area B Total $ 11,947 $ ‐ $ ‐ $ ‐ $ ‐ $ ‐ $ ‐
Requisition Allocation2019
Actual
2020
Budget
2021
Budget
2022
Budget
2023
Budget
2024
Budget
Electoral Area:
Area B ‐$ ‐$ 270$ 270$ 270$ 270$
TOTAL ‐$ ‐$ 270$ 270$ 270$ 270$
Change $ ‐ 270 ‐ ‐ ‐
Change % n/a n/a ‐ ‐ ‐
Tax Rate Estimate (Per $1,000) 0.0000 $ 0.0000 $ 0.0007 $ 0.0007 $ 0.0007 $ 0.0007 $
Maximum Requisition Limit 33,517 $ 34,970 $
117
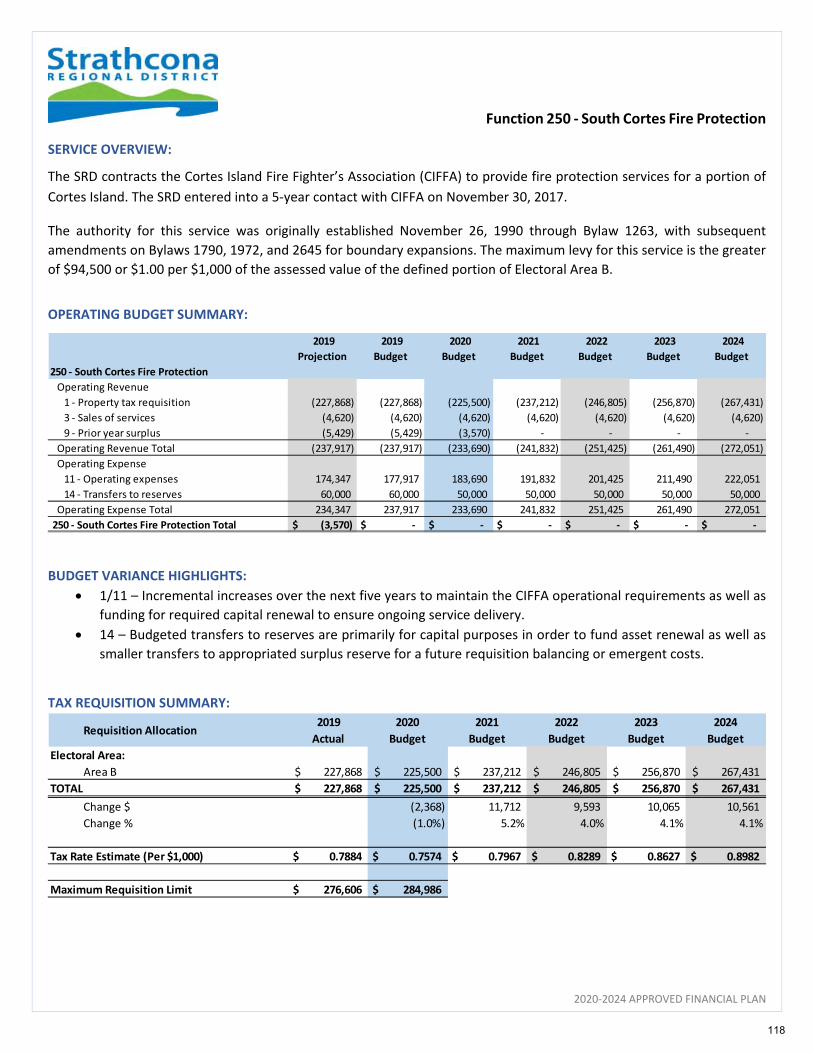
Function 250 ‐ South Cortes Fire Protection
2020‐2024 APPROVED FINANCIAL PLAN
SERVICE OVERVIEW:
The SRD contracts the Cortes Island Fire Fighter’s Association (CIFFA) to provide fire protection services for a portion of
Cortes Island. The SRD entered into a 5‐year contact with CIFFA on November 30, 2017.
The authority for this service was originally established November 26, 1990 through Bylaw 1263, with subsequent
amendments on Bylaws 1790, 1972, and 2645 for boundary expansions. The maximum levy for this service is the greater
of $94,500 or $1.00 per $1,000 of the assessed value of the defined portion of Electoral Area B.
OPERATING BUDGET SUMMARY:
BUDGET VARIANCE HIGHLIGHTS:
1/11 – Incremental increases over the next five years to maintain the CIFFA operational requirements as well as
funding for required capital renewal to ensure ongoing service delivery.
14 – Budgeted transfers to reserves are primarily for capital purposes in order to fund asset renewal as well as
smaller transfers to appropriated surplus reserve for a future requisition balancing or emergent costs.
TAX REQUISITION SUMMARY:
2019
Projection
2019
Budget
2020
Budget
2021
Budget
2022
Budget
2023
Budget
2024
Budget
250 ‐ South Cortes Fire Protection
Operating Revenue
1 ‐ Property tax requisition (227,868) (227,868) (225,500) (237,212) (246,805) (256,870) (267,431)
3 ‐ Sales of services (4,620) (4,620) (4,620) (4,620) (4,620) (4,620) (4,620)
9 ‐ Prior year surplus (5,429) (5,429) (3,570) ‐ ‐ ‐ ‐
Operating Revenue Total (237,917) (237,917) (233,690) (241,832) (251,425) (261,490) (272,051)
Operating Expense
11 ‐ Operating expenses 174,347 177,917 183,690 191,832 201,425 211,490 222,051
14 ‐ Transfers to reserves 60,000 60,000 50,000 50,000 50,000 50,000 50,000
Operating Expense Total 234,347 237,917 233,690 241,832 251,425 261,490 272,051
250 ‐ South Cortes Fire Protection Total $ (3,570) $ ‐ $ ‐ $ ‐ $ ‐ $ ‐ $ ‐
Requisition Allocation2019
Actual
2020
Budget
2021
Budget
2022
Budget
2023
Budget
2024
Budget
Electoral Area:
Area B 227,868$ 225,500$ 237,212$ 246,805$ 256,870$ 267,431$
TOTAL 227,868$ 225,500$ 237,212$ 246,805$ 256,870$ 267,431$
Change $ (2,368) 11,712 9,593 10,065 10,561
Change % (1.0%) 5.2% 4.0% 4.1% 4.1%
Tax Rate Estimate (Per $1,000) 0.7884 $ 0.7574 $ 0.7967 $ 0.8289 $ 0.8627 $ 0.8982 $
Maximum Requisition Limit 276,606 $ 284,986 $
118
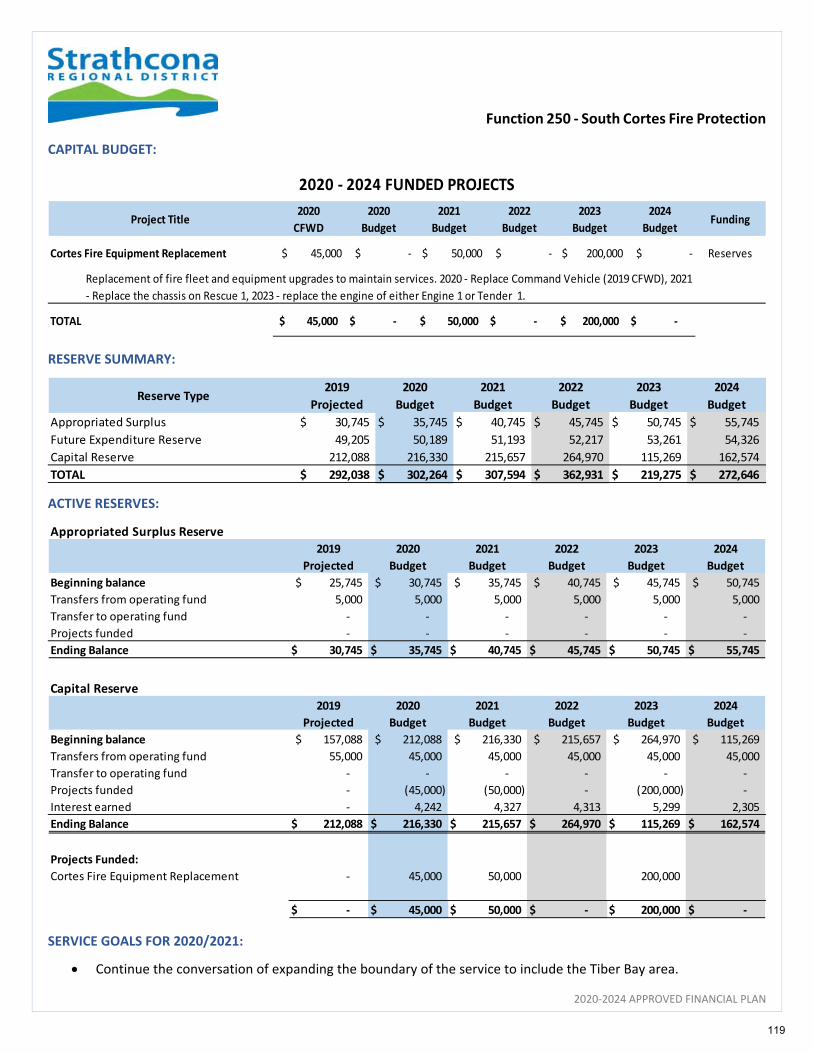
Function 250 ‐ South Cortes Fire Protection
2020‐2024 APPROVED FINANCIAL PLAN
CAPITAL BUDGET:
RESERVE SUMMARY:
ACTIVE RESERVES:
SERVICE GOALS FOR 2020/2021:
Continue the conversation of expanding the boundary of the service to include the Tiber Bay area.
Project Title2020
CFWD
2020
Budget
2021
Budget
2022
Budget
2023
Budget
2024
BudgetFunding
Cortes Fire Equipment Replacement $ 45,000 $ ‐ $ 50,000 $ ‐ $ 200,000 $ ‐ Reserves
TOTAL 45,000$ ‐$ 50,000$ ‐$ 200,000$ ‐$
Replacement of fire fleet and equipment upgrades to maintain services. 2020 ‐ Replace Command Vehicle (2019 CFWD), 2021
‐ Replace the chassis on Rescue 1, 2023 ‐ replace the engine of either Engine 1 or Tender 1.
2020 ‐ 2024 FUNDED PROJECTS
Reserve Type2019
Projected
2020
Budget
2021
Budget
2022
Budget
2023
Budget
2024
Budget
Appropriated Surplus 30,745$ 35,745$ 40,745$ 45,745$ 50,745$ 55,745$
Future Expenditure Reserve 49,205 50,189 51,193 52,217 53,261 54,326
Capital Reserve 212,088 216,330 215,657 264,970 115,269 162,574
TOTAL 292,038$ 302,264$ 307,594$ 362,931$ 219,275$ 272,646$
Appropriated Surplus Reserve
2019
Projected
2020
Budget
2021
Budget
2022
Budget
2023
Budget
2024
Budget
Beginning balance 25,745$ 30,745$ 35,745$ 40,745$ 45,745$ 50,745$
Transfers from operating fund 5,000 5,000 5,000 5,000 5,000 5,000
Transfer to operating fund ‐ ‐ ‐ ‐ ‐ ‐
Projects funded ‐ ‐ ‐ ‐ ‐ ‐
Ending Balance 30,745$ 35,745$ 40,745$ 45,745$ 50,745$ 55,745$
Capital Reserve
2019
Projected
2020
Budget
2021
Budget
2022
Budget
2023
Budget
2024
Budget
Beginning balance 157,088$ 212,088$ 216,330$ 215,657$ 264,970$ 115,269$
Transfers from operating fund 55,000 45,000 45,000 45,000 45,000 45,000
Transfer to operating fund ‐ ‐ ‐ ‐ ‐ ‐
Projects funded ‐ (45,000) (50,000) ‐ (200,000) ‐
Interest earned ‐ 4,242 4,327 4,313 5,299 2,305
Ending Balance 212,088$ 216,330$ 215,657$ 264,970$ 115,269$ 162,574$
Projects Funded:
Cortes Fire Equipment Replacement ‐ 45,000 50,000 200,000
‐$ 45,000$ 50,000$ ‐$ 200,000$ ‐$
119

Function 251 – Cortes Island First Responder
2020‐2024 APPROVED FINANCIAL PLAN
SERVICE OVERVIEW:
The first responder service for Cortes Island was established to provide initial response to persons requiring emergency
medical assistance. This includes training, equipping, and deploying of personnel to provide first aid during medical
emergencies until such time as those personnel have been relieved by paramedics.
The service establishing Bylaw 328 was adopted on November 21, 2019, with a maximum levy amount being the greater
of $45,000 or $0.1443 per $1,000 of net taxable value of land and improvements in Electoral Area B.
OPERATING BUDGET SUMMARY:
BUDGET VARIANCE HIGHLIGHTS:
1/11 – Property tax requisition starting in 2020 to fund the new service approved through the electorate in 2019.
Funding for 2020 includes the payback to the Area B Feasibility Function 157 for costs incurred to establish the
service, which totaled $15,541.
11 – The operating expenses are to fund the contracted costs of CIFFA (Cortes Island Fire Fighters Association)
which also provides a fire protection service to portions of Cortes Island, through Function 250.
14 – Budgeted transfers to reserve to provide additional funding for emergent costs or smooth tax requisitions.
TAX REQUISITION SUMMARY:
2019
Projection
2019
Budget
2020
Budget
2021
Budget
2022
Budget
2023
Budget
2024
Budget
251 ‐ Cortes Island First Responder
Operating Revenue
1 ‐ Property tax requisition ‐ ‐ (44,061) (43,506) (31,421) (32,958) (34,573)
Operating Revenue Total ‐ ‐ (44,061) (43,506) (31,421) (32,958) (34,573)
Operating Expense
11 ‐ Operating expenses ‐ ‐ 28,520 25,956 27,221 28,548 29,942
14 ‐ Transfers to reserves ‐ ‐ ‐ 17,550 4,200 4,410 4,631
16 ‐ Other transfers ‐ ‐ 15,541 ‐ ‐ ‐ ‐
Operating Expense Total ‐ ‐ 44,061 43,506 31,421 32,958 34,573
251 ‐ Cortes Island First Responder Total $ ‐ $ ‐ $ ‐ $ ‐ $ ‐ $ ‐ $ ‐
Requisition Allocation2019
Actual
2020
Budget
2021
Budget
2022
Budget
2023
Budget
2024
Budget
Electoral Area:
Area B ‐$ 44,061$ 43,506$ 31,421$ 32,958$ 34,573$
TOTAL ‐$ 44,061$ 43,506$ 31,421$ 32,958$ 34,573$
Change $ 44,061 (555) (12,085) 1,537 1,615
Change % n/a (1.3%) (27.8%) 4.9% 4.9%
Tax Rate Estimate (Per $1,000) 0.0000 $ 0.1196 $ 0.1181 $ 0.0853 $ 0.0895 $ 0.0938 $
Maximum Requisition Limit 48,365 $ 50,462 $
120

Function 251 – Cortes Island First Responder
2020‐2024 APPROVED FINANCIAL PLAN
RESERVE SUMMARY:
ACTIVE RESERVES:
SERVICE GOALS FOR 2020/2021:
Implement service.
Establish any required new service contracts and reporting requirements.
Reserve Type2019
Projected
2020
Budget
2021
Budget
2022
Budget
2023
Budget
2024
Budget
Appropriated Surplus ‐$ ‐$ 17,550$ 21,750$ 26,160$ 30,791$
TOTAL ‐$ ‐$ 17,550$ 21,750$ 26,160$ 30,791$
Appropriated Surplus Reserve
2019
Projected
2020
Budget
2021
Budget
2022
Budget
2023
Budget
2024
Budget
Beginning balance ‐$ ‐$ ‐$ 17,550$ 21,750$ 26,160$
Transfers from operating fund ‐ ‐ 17,550 4,200 4,410 4,631
Transfer to operating fund ‐ ‐ ‐ ‐ ‐ ‐
Projects funded ‐ ‐ ‐ ‐ ‐ ‐
Interest earned ‐ ‐ ‐ ‐ ‐ ‐
Ending Balance ‐$ ‐$ 17,550$ 21,750$ 26,160$ 30,791$
121

Function 374 ‐ Electoral Area "B" Refuse Disposal Grounds Specified Area
2020‐2024 APPROVED FINANCIAL PLAN
SERVICE OVERVIEW:
This function funds all the tipping fees incurred from waste generated on the Island and collected at the curb through
Function 376 or dropped off at the Cortes Island transfer station. Bylaw 2851 provides for a flat annual fee for commercial
users listed in the bylaw. Another applicable bylaw for this service includes Bylaw 912 Area I Refuse Site Operation.
The authority for this service was originally established September 27, 1971 through Bylaw 69, with subsequent
amendments with Bylaw 1281. The maximum levy for this service is $0.50 per $1,000 of the assessed value of Electoral
Area B.
OPERATING BUDGET:
BUDGET VARIANCE HIGHLIGHTS:
1/8 – Property tax requisition maintained at prior year levels using funds from the appropriated surplus reserve.
Projected requisition increase expected in 2023 when the reserve is eventually depleted. (Note: $17.66 per
average household increase would be needed to fund change of $16,869 (2024 requisition less 2022 requisition),
based on 2020 Completed Roll.)
4 – Currently on a flat fee billing for commercial customers; will review in 2020.
11 – Tipping fee increase of 7% in 2020.
TAX REQUISITION SUMMARY:
2019
Projection
2019
Budget
2020
Budget
2021
Budget
2022
Budget
2023
Budget
2024
Budget
374 ‐ Area B Refuse Disposal
Operating Revenue
1 ‐ Property tax requisition (57,079) (57,079) (57,079) (57,079) (57,079) (60,455) (73,948)
4 ‐ Other revenue (9,999) (9,999) (9,999) (9,999) (9,999) (9,999) (9,999)
8 ‐ Transfers from reserves (2,494) (2,494) (5,480) (10,421) (12,510) (11,283) ‐
9 ‐ Prior year surplus (2,887) (2,873) (2,909) ‐ ‐ ‐ ‐
Operating Revenue Total (72,459) (72,445) (75,467) (77,499) (79,588) (81,737) (83,947)
Operating Expense
11 ‐ Operating expenses 69,550 72,445 75,467 77,499 79,588 81,737 83,947
Operating Expense Total 69,550 72,445 75,467 77,499 79,588 81,737 83,947
374 ‐ Area B Refuse Disposal Total $ (2,909) $ ‐ $ ‐ $ ‐ $ ‐ $ ‐ $ ‐
Requisition Allocation2019
Actual
2020
Budget
2021
Budget
2022
Budget
2023
Budget
2024
Budget
Electoral Area:
Area B 57,079$ 57,079$ 57,079$ 57,079$ 60,455$ 73,948$
TOTAL 57,079$ 57,079$ 57,079$ 57,079$ 60,455$ 73,948$
Change $ ‐ ‐ ‐ 3,376 13,493
Change % ‐ ‐ ‐ 5.9% 22.3%
Tax Rate Estimate (Per $1,000) 0.1620 $ 0.1552 $ 0.1552 $ 0.1552 $ 0.1644 $ 0.2011 $
Maximum Requisition Limit 167,469 $ 174,726 $
122
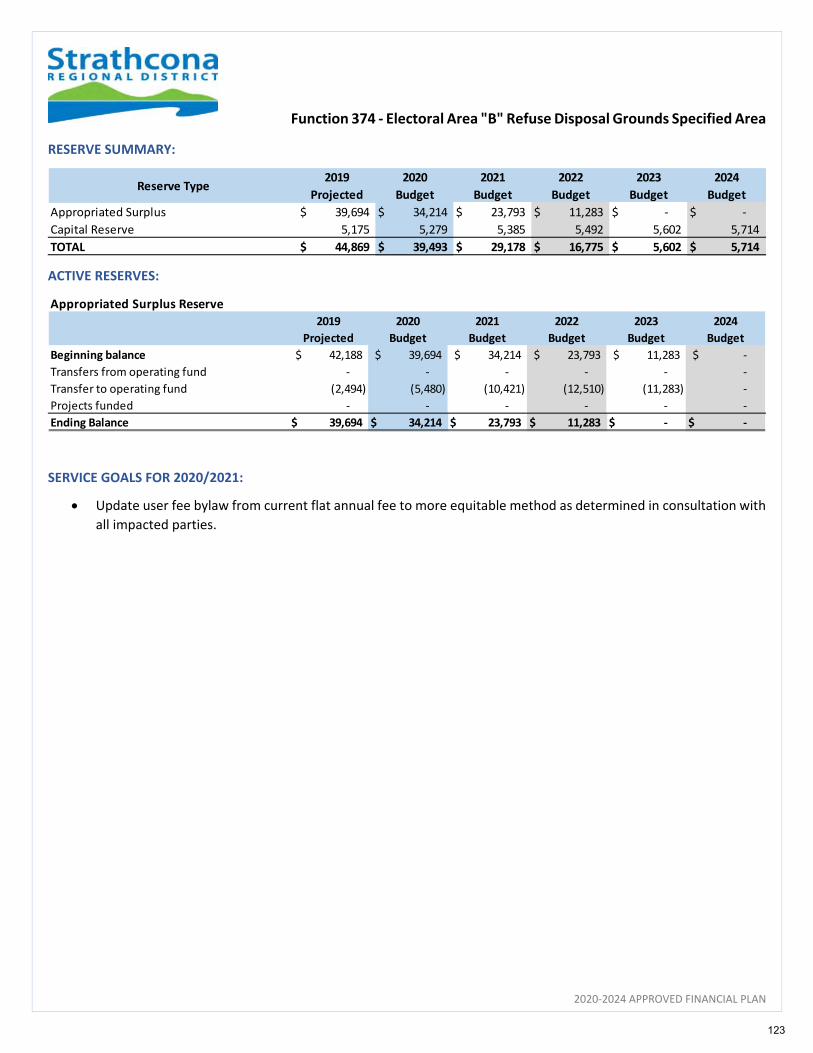
Function 374 ‐ Electoral Area "B" Refuse Disposal Grounds Specified Area
2020‐2024 APPROVED FINANCIAL PLAN
RESERVE SUMMARY:
ACTIVE RESERVES:
SERVICE GOALS FOR 2020/2021:
Update user fee bylaw from current flat annual fee to more equitable method as determined in consultation with
all impacted parties.
Reserve Type2019
Projected
2020
Budget
2021
Budget
2022
Budget
2023
Budget
2024
Budget
Appropriated Surplus 39,694$ 34,214$ 23,793$ 11,283$ ‐$ ‐$
Capital Reserve 5,175 5,279 5,385 5,492 5,602 5,714
TOTAL 44,869$ 39,493$ 29,178$ 16,775$ 5,602$ 5,714$
Appropriated Surplus Reserve
2019
Projected
2020
Budget
2021
Budget
2022
Budget
2023
Budget
2024
Budget
Beginning balance 42,188$ 39,694$ 34,214$ 23,793$ 11,283$ ‐$
Transfers from operating fund ‐ ‐ ‐ ‐ ‐ ‐
Transfer to operating fund (2,494) (5,480) (10,421) (12,510) (11,283) ‐
Projects funded ‐ ‐ ‐ ‐ ‐ ‐
Ending Balance 39,694$ 34,214$ 23,793$ 11,283$ ‐$ ‐$
123
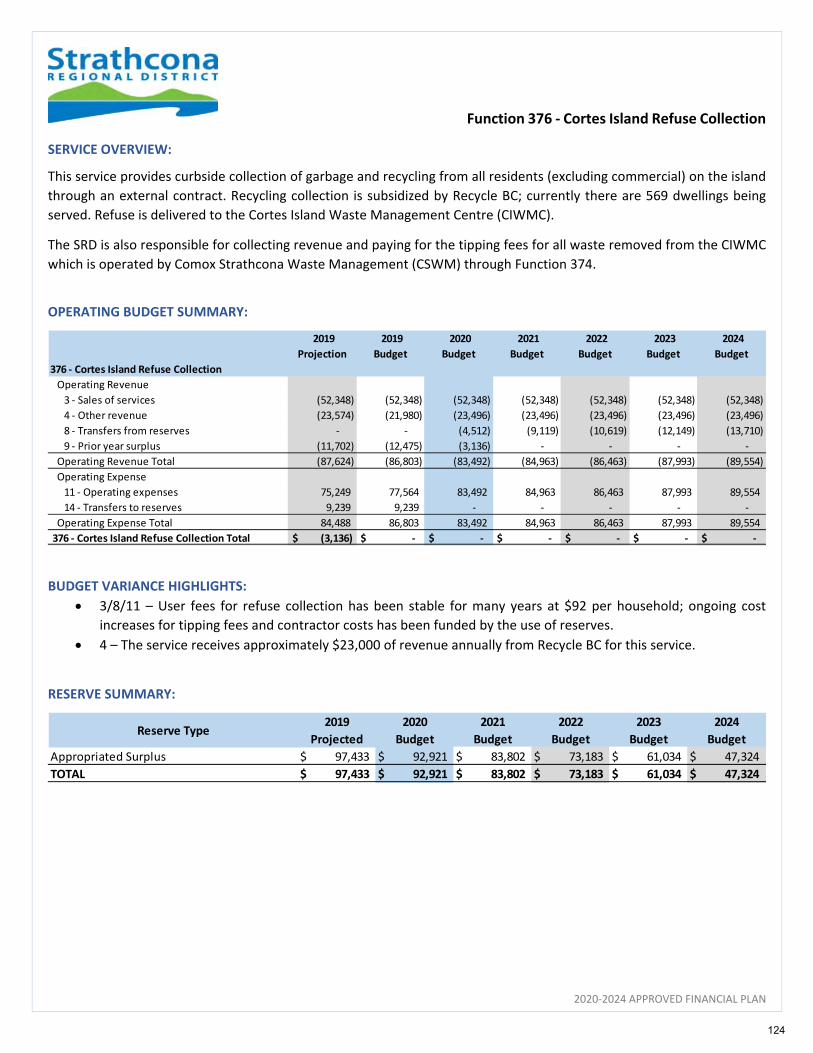
Function 376 ‐ Cortes Island Refuse Collection
2020‐2024 APPROVED FINANCIAL PLAN
SERVICE OVERVIEW:
This service provides curbside collection of garbage and recycling from all residents (excluding commercial) on the island
through an external contract. Recycling collection is subsidized by Recycle BC; currently there are 569 dwellings being
served. Refuse is delivered to the Cortes Island Waste Management Centre (CIWMC).
The SRD is also responsible for collecting revenue and paying for the tipping fees for all waste removed from the CIWMC
which is operated by Comox Strathcona Waste Management (CSWM) through Function 374.
OPERATING BUDGET SUMMARY:
BUDGET VARIANCE HIGHLIGHTS:
3/8/11 – User fees for refuse collection has been stable for many years at $92 per household; ongoing cost
increases for tipping fees and contractor costs has been funded by the use of reserves.
4 – The service receives approximately $23,000 of revenue annually from Recycle BC for this service.
RESERVE SUMMARY:
2019
Projection
2019
Budget
2020
Budget
2021
Budget
2022
Budget
2023
Budget
2024
Budget
376 ‐ Cortes Island Refuse Collection
Operating Revenue
3 ‐ Sales of services (52,348) (52,348) (52,348) (52,348) (52,348) (52,348) (52,348)
4 ‐ Other revenue (23,574) (21,980) (23,496) (23,496) (23,496) (23,496) (23,496)
8 ‐ Transfers from reserves ‐ ‐ (4,512) (9,119) (10,619) (12,149) (13,710)
9 ‐ Prior year surplus (11,702) (12,475) (3,136) ‐ ‐ ‐ ‐
Operating Revenue Total (87,624) (86,803) (83,492) (84,963) (86,463) (87,993) (89,554)
Operating Expense
11 ‐ Operating expenses 75,249 77,564 83,492 84,963 86,463 87,993 89,554
14 ‐ Transfers to reserves 9,239 9,239 ‐ ‐ ‐ ‐ ‐
Operating Expense Total 84,488 86,803 83,492 84,963 86,463 87,993 89,554
376 ‐ Cortes Island Refuse Collection Total $ (3,136) $ ‐ $ ‐ $ ‐ $ ‐ $ ‐ $ ‐
Reserve Type2019
Projected
2020
Budget
2021
Budget
2022
Budget
2023
Budget
2024
Budget
Appropriated Surplus 97,433$ 92,921$ 83,802$ 73,183$ 61,034$ 47,324$
TOTAL 97,433$ 92,921$ 83,802$ 73,183$ 61,034$ 47,324$
124
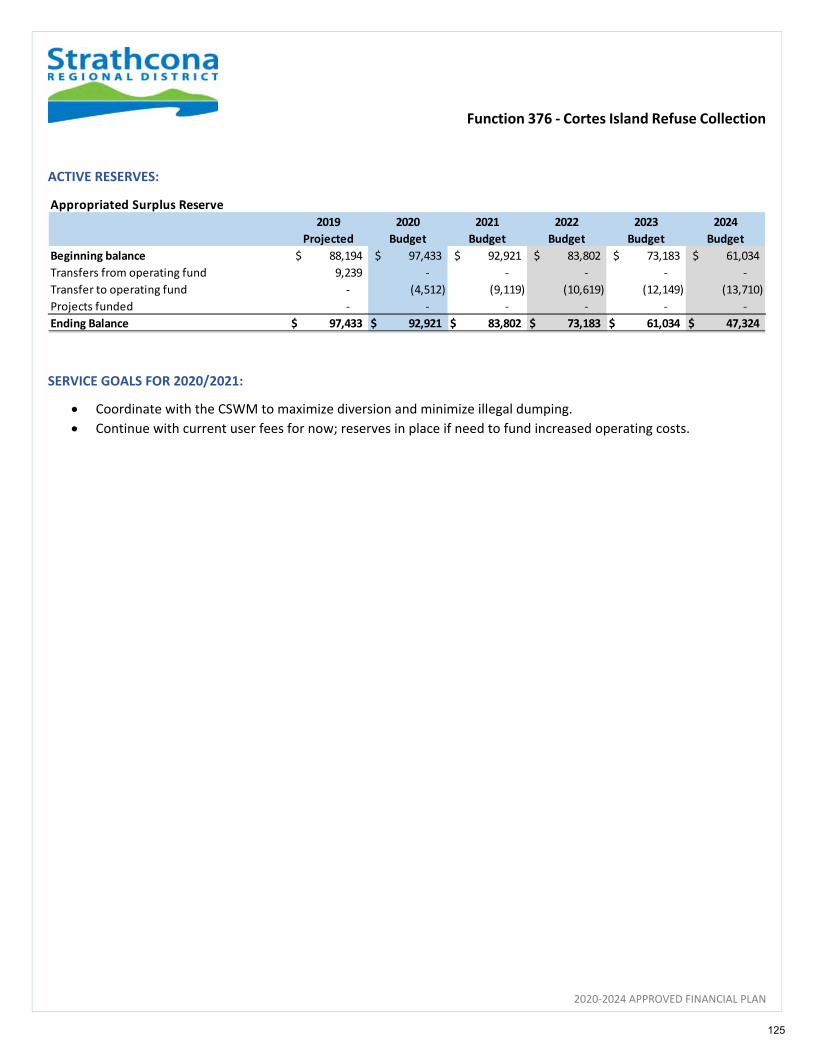
Function 376 ‐ Cortes Island Refuse Collection
2020‐2024 APPROVED FINANCIAL PLAN
ACTIVE RESERVES:
SERVICE GOALS FOR 2020/2021:
Coordinate with the CSWM to maximize diversion and minimize illegal dumping.
Continue with current user fees for now; reserves in place if need to fund increased operating costs.
Appropriated Surplus Reserve
2019
Projected
2020
Budget
2021
Budget
2022
Budget
2023
Budget
2024
Budget
Beginning balance 88,194$ 97,433$ 92,921$ 83,802$ 73,183$ 61,034$
Transfers from operating fund 9,239 ‐ ‐ ‐ ‐ ‐
Transfer to operating fund ‐ (4,512) (9,119) (10,619) (12,149) (13,710)
Projects funded ‐ ‐ ‐ ‐ ‐ ‐
Ending Balance 97,433$ 92,921$ 83,802$ 73,183$ 61,034$ 47,324$
125
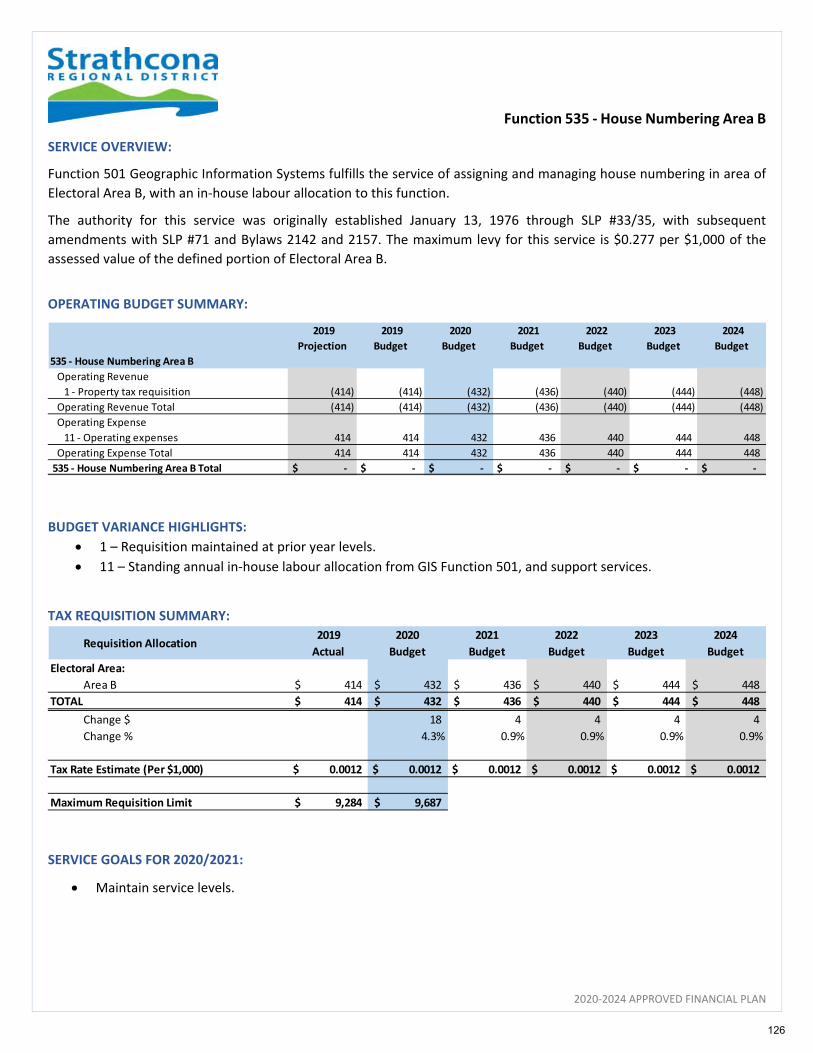
Function 535 ‐ House Numbering Area B
2020‐2024 APPROVED FINANCIAL PLAN
SERVICE OVERVIEW:
Function 501 Geographic Information Systems fulfills the service of assigning and managing house numbering in area of
Electoral Area B, with an in‐house labour allocation to this function.
The authority for this service was originally established January 13, 1976 through SLP #33/35, with subsequent
amendments with SLP #71 and Bylaws 2142 and 2157. The maximum levy for this service is $0.277 per $1,000 of the
assessed value of the defined portion of Electoral Area B.
OPERATING BUDGET SUMMARY:
BUDGET VARIANCE HIGHLIGHTS:
1 – Requisition maintained at prior year levels.
11 – Standing annual in‐house labour allocation from GIS Function 501, and support services.
TAX REQUISITION SUMMARY:
SERVICE GOALS FOR 2020/2021:
Maintain service levels.
2019
Projection
2019
Budget
2020
Budget
2021
Budget
2022
Budget
2023
Budget
2024
Budget
535 ‐ House Numbering Area B
Operating Revenue
1 ‐ Property tax requisition (414) (414) (432) (436) (440) (444) (448)
Operating Revenue Total (414) (414) (432) (436) (440) (444) (448)
Operating Expense
11 ‐ Operating expenses 414 414 432 436 440 444 448
Operating Expense Total 414 414 432 436 440 444 448
535 ‐ House Numbering Area B Total $ ‐ $ ‐ $ ‐ $ ‐ $ ‐ $ ‐ $ ‐
Requisition Allocation2019
Actual
2020
Budget
2021
Budget
2022
Budget
2023
Budget
2024
Budget
Electoral Area:
Area B 414$ 432$ 436$ 440$ 444$ 448$
TOTAL 414$ 432$ 436$ 440$ 444$ 448$
Change $ 18 4 4 4 4
Change % 4.3% 0.9% 0.9% 0.9% 0.9%
Tax Rate Estimate (Per $1,000) 0.0012 $ 0.0012 $ 0.0012 $ 0.0012 $ 0.0012 $ 0.0012 $
Maximum Requisition Limit 9,284 $ 9,687 $
126
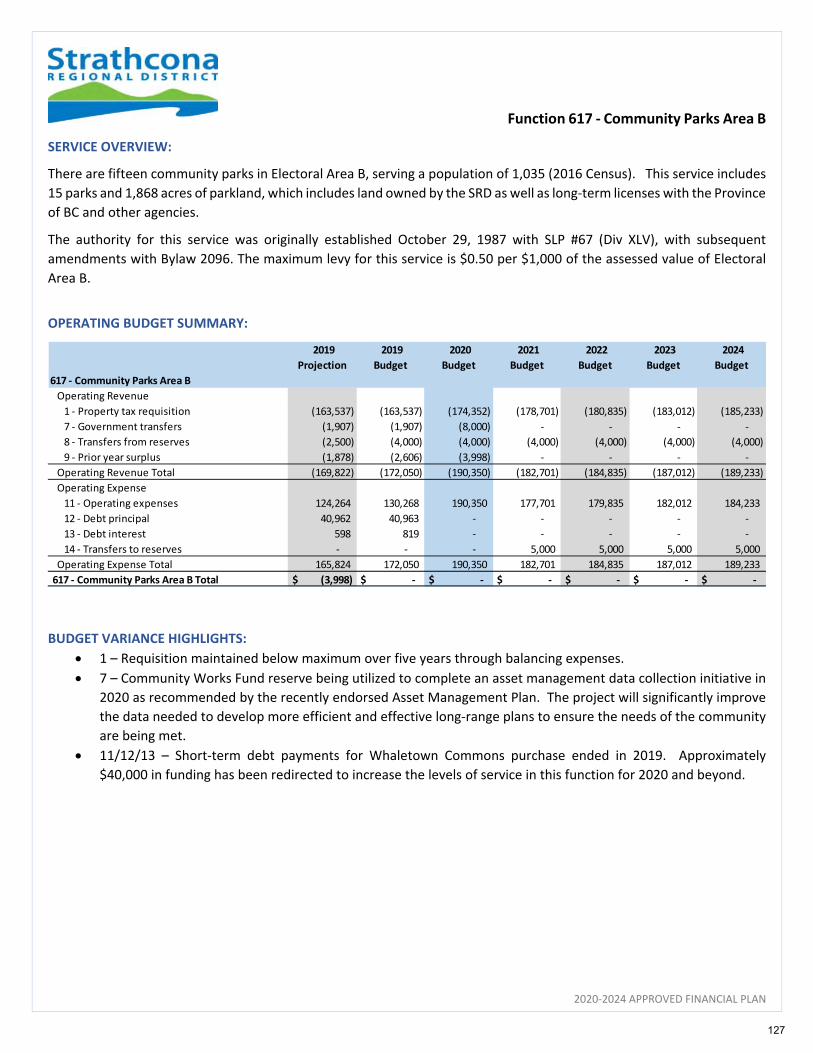
Function 617 ‐ Community Parks Area B
2020‐2024 APPROVED FINANCIAL PLAN
SERVICE OVERVIEW:
There are fifteen community parks in Electoral Area B, serving a population of 1,035 (2016 Census). This service includes
15 parks and 1,868 acres of parkland, which includes land owned by the SRD as well as long‐term licenses with the Province
of BC and other agencies.
The authority for this service was originally established October 29, 1987 with SLP #67 (Div XLV), with subsequent
amendments with Bylaw 2096. The maximum levy for this service is $0.50 per $1,000 of the assessed value of Electoral
Area B.
OPERATING BUDGET SUMMARY:
BUDGET VARIANCE HIGHLIGHTS:
1 – Requisition maintained below maximum over five years through balancing expenses.
7 – Community Works Fund reserve being utilized to complete an asset management data collection initiative in
2020 as recommended by the recently endorsed Asset Management Plan. The project will significantly improve
the data needed to develop more efficient and effective long‐range plans to ensure the needs of the community
are being met.
11/12/13 – Short‐term debt payments for Whaletown Commons purchase ended in 2019. Approximately
$40,000 in funding has been redirected to increase the levels of service in this function for 2020 and beyond.
2019
Projection
2019
Budget
2020
Budget
2021
Budget
2022
Budget
2023
Budget
2024
Budget
617 ‐ Community Parks Area B
Operating Revenue
1 ‐ Property tax requisition (163,537) (163,537) (174,352) (178,701) (180,835) (183,012) (185,233)
7 ‐ Government transfers (1,907) (1,907) (8,000) ‐ ‐ ‐ ‐
8 ‐ Transfers from reserves (2,500) (4,000) (4,000) (4,000) (4,000) (4,000) (4,000)
9 ‐ Prior year surplus (1,878) (2,606) (3,998) ‐ ‐ ‐ ‐
Operating Revenue Total (169,822) (172,050) (190,350) (182,701) (184,835) (187,012) (189,233)
Operating Expense
11 ‐ Operating expenses 124,264 130,268 190,350 177,701 179,835 182,012 184,233
12 ‐ Debt principal 40,962 40,963 ‐ ‐ ‐ ‐ ‐
13 ‐ Debt interest 598 819 ‐ ‐ ‐ ‐ ‐
14 ‐ Transfers to reserves ‐ ‐ ‐ 5,000 5,000 5,000 5,000
Operating Expense Total 165,824 172,050 190,350 182,701 184,835 187,012 189,233
617 ‐ Community Parks Area B Total $ (3,998) $ ‐ $ ‐ $ ‐ $ ‐ $ ‐ $ ‐
127
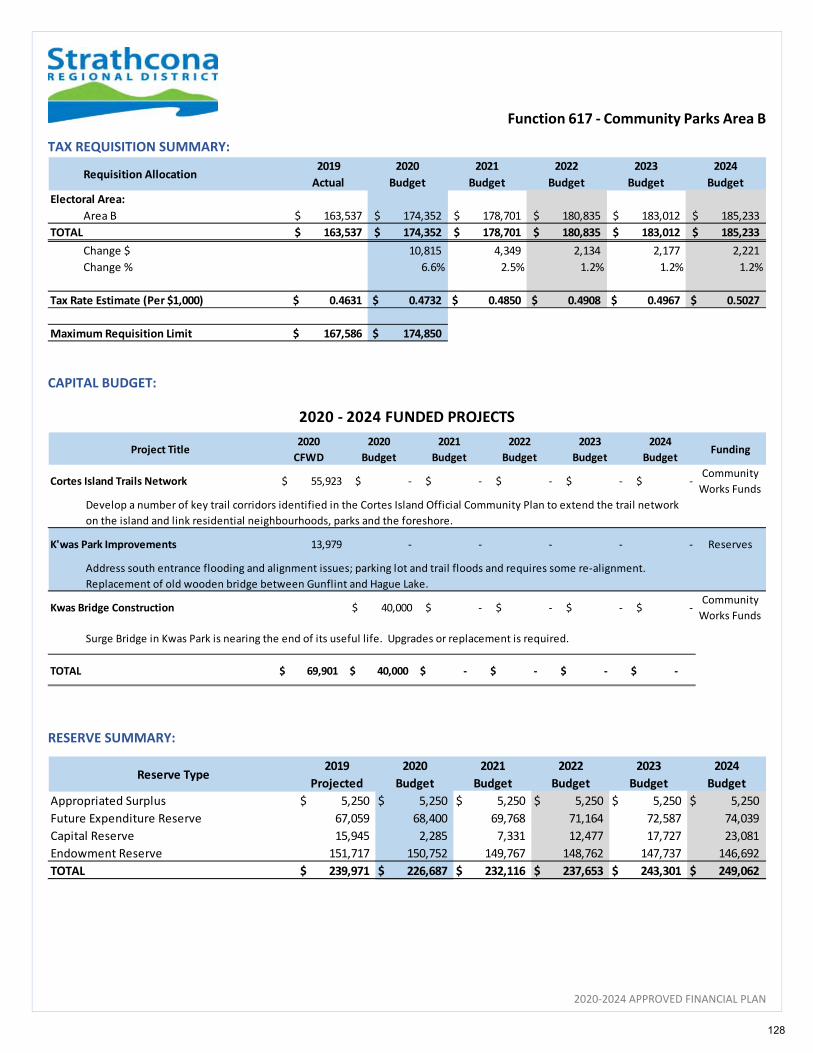
Function 617 ‐ Community Parks Area B
2020‐2024 APPROVED FINANCIAL PLAN
TAX REQUISITION SUMMARY:
CAPITAL BUDGET:
RESERVE SUMMARY:
Requisition Allocation2019
Actual
2020
Budget
2021
Budget
2022
Budget
2023
Budget
2024
Budget
Electoral Area:
Area B 163,537$ 174,352$ 178,701$ 180,835$ 183,012$ 185,233$
TOTAL 163,537$ 174,352$ 178,701$ 180,835$ 183,012$ 185,233$
Change $ 10,815 4,349 2,134 2,177 2,221
Change % 6.6% 2.5% 1.2% 1.2% 1.2%
Tax Rate Estimate (Per $1,000) 0.4631 $ 0.4732 $ 0.4850 $ 0.4908 $ 0.4967 $ 0.5027 $
Maximum Requisition Limit 167,586 $ 174,850 $
Project Title2020
CFWD
2020
Budget
2021
Budget
2022
Budget
2023
Budget
2024
BudgetFunding
Cortes Island Trails Network $ 55,923 $ ‐ $ ‐ $ ‐ $ ‐ $ ‐ Community
Works Funds
K'was Park Improvements 13,979 ‐ ‐ ‐ ‐ ‐ Reserves
Kwas Bridge Construction $ 40,000 $ ‐ $ ‐ $ ‐ $ ‐ Community
Works Funds
TOTAL 69,901$ 40,000$ ‐$ ‐$ ‐$ ‐$
2020 ‐ 2024 FUNDED PROJECTS
Develop a number of key trail corridors identified in the Cortes Island Official Community Plan to extend the trail network
on the island and link residential neighbourhoods, parks and the foreshore.
Address south entrance flooding and alignment issues; parking lot and trail floods and requires some re‐alignment.
Replacement of old wooden bridge between Gunflint and Hague Lake.
Surge Bridge in Kwas Park is nearing the end of its useful life. Upgrades or replacement is required.
Reserve Type2019
Projected
2020
Budget
2021
Budget
2022
Budget
2023
Budget
2024
Budget
Appropriated Surplus 5,250$ 5,250$ 5,250$ 5,250$ 5,250$ 5,250$
Future Expenditure Reserve 67,059 68,400 69,768 71,164 72,587 74,039
Capital Reserve 15,945 2,285 7,331 12,477 17,727 23,081
Endowment Reserve 151,717 150,752 149,767 148,762 147,737 146,692
TOTAL 239,971$ 226,687$ 232,116$ 237,653$ 243,301$ 249,062$
128
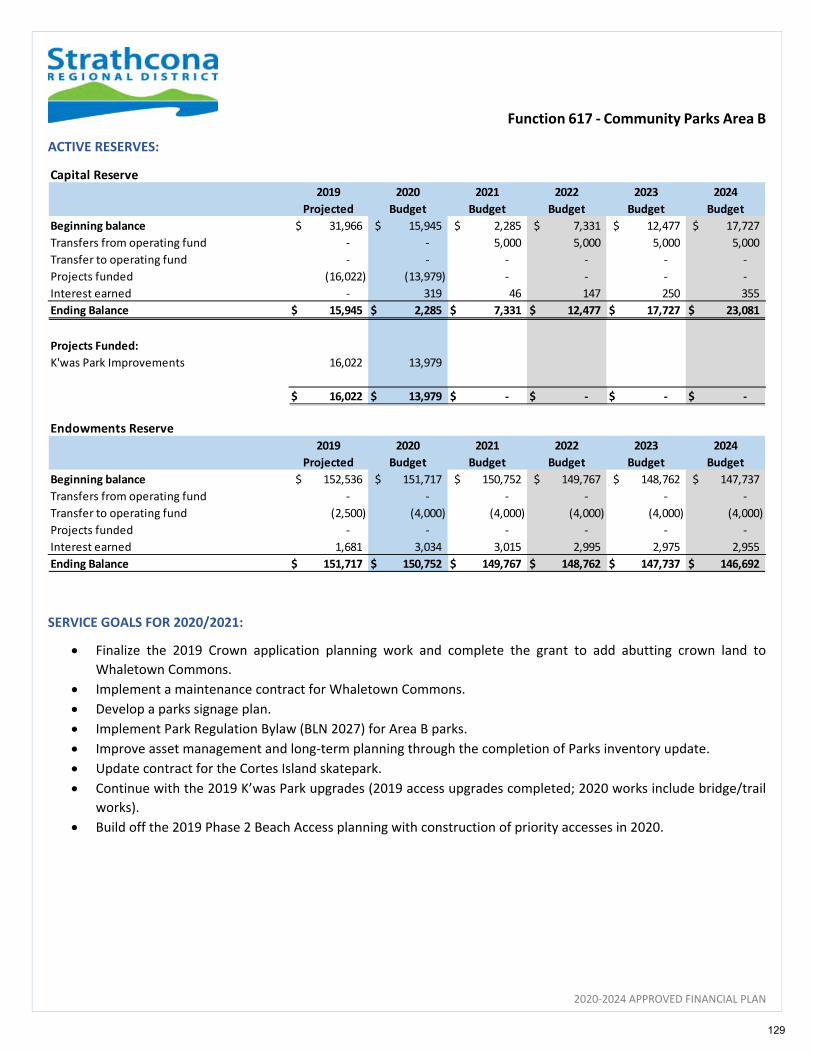
Function 617 ‐ Community Parks Area B
2020‐2024 APPROVED FINANCIAL PLAN
ACTIVE RESERVES:
SERVICE GOALS FOR 2020/2021:
Finalize the 2019 Crown application planning work and complete the grant to add abutting crown land to
Whaletown Commons.
Implement a maintenance contract for Whaletown Commons.
Develop a parks signage plan.
Implement Park Regulation Bylaw (BLN 2027) for Area B parks.
Improve asset management and long‐term planning through the completion of Parks inventory update.
Update contract for the Cortes Island skatepark.
Continue with the 2019 K’was Park upgrades (2019 access upgrades completed; 2020 works include bridge/trail
works).
Build off the 2019 Phase 2 Beach Access planning with construction of priority accesses in 2020.
Capital Reserve
2019
Projected
2020
Budget
2021
Budget
2022
Budget
2023
Budget
2024
Budget
Beginning balance 31,966$ 15,945$ 2,285$ 7,331$ 12,477$ 17,727$
Transfers from operating fund ‐ ‐ 5,000 5,000 5,000 5,000
Transfer to operating fund ‐ ‐ ‐ ‐ ‐ ‐
Projects funded (16,022) (13,979) ‐ ‐ ‐ ‐
Interest earned ‐ 319 46 147 250 355
Ending Balance 15,945$ 2,285$ 7,331$ 12,477$ 17,727$ 23,081$
Projects Funded:
K'was Park Improvements 16,022 13,979
16,022$ 13,979$ ‐$ ‐$ ‐$ ‐$
Endowments Reserve
2019
Projected
2020
Budget
2021
Budget
2022
Budget
2023
Budget
2024
Budget
Beginning balance 152,536$ 151,717$ 150,752$ 149,767$ 148,762$ 147,737$
Transfers from operating fund ‐ ‐ ‐ ‐ ‐ ‐
Transfer to operating fund (2,500) (4,000) (4,000) (4,000) (4,000) (4,000)
Projects funded ‐ ‐ ‐ ‐ ‐ ‐
Interest earned 1,681 3,034 3,015 2,995 2,975 2,955
Ending Balance 151,717$ 150,752$ 149,767$ 148,762$ 147,737$ 146,692$
129
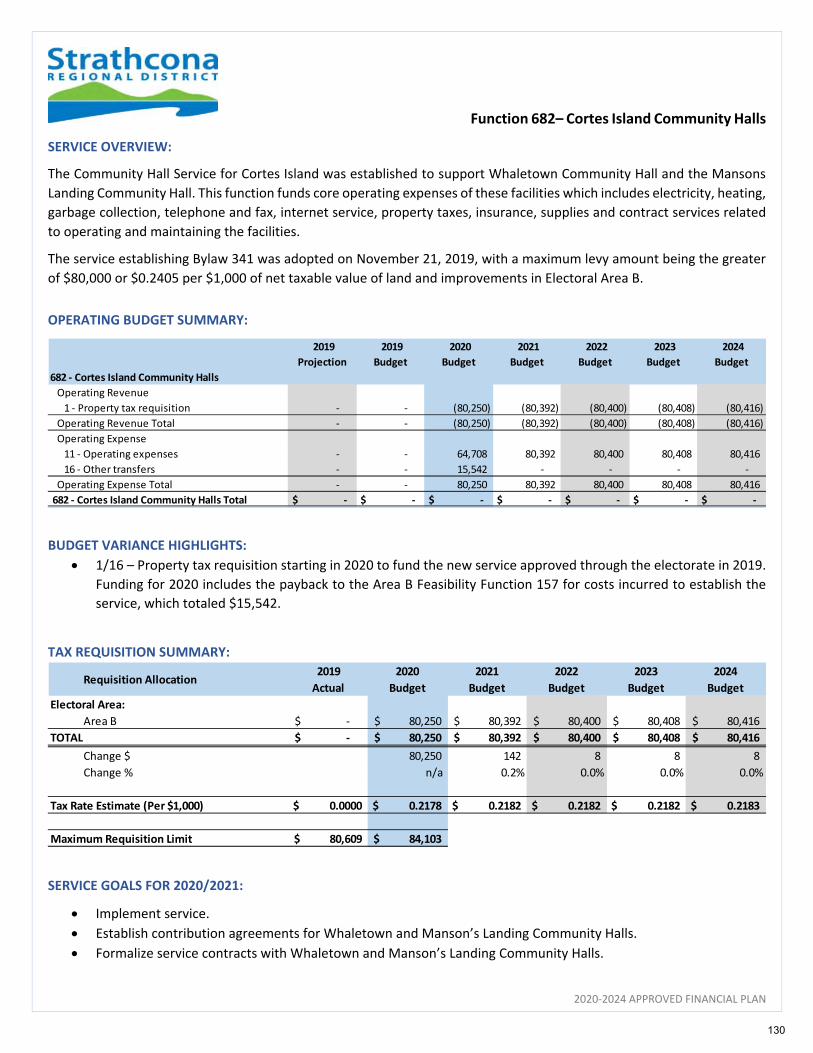
Function 682– Cortes Island Community Halls
2020‐2024 APPROVED FINANCIAL PLAN
SERVICE OVERVIEW:
The Community Hall Service for Cortes Island was established to support Whaletown Community Hall and the Mansons
Landing Community Hall. This function funds core operating expenses of these facilities which includes electricity, heating,
garbage collection, telephone and fax, internet service, property taxes, insurance, supplies and contract services related
to operating and maintaining the facilities.
The service establishing Bylaw 341 was adopted on November 21, 2019, with a maximum levy amount being the greater
of $80,000 or $0.2405 per $1,000 of net taxable value of land and improvements in Electoral Area B.
OPERATING BUDGET SUMMARY:
BUDGET VARIANCE HIGHLIGHTS:
1/16 – Property tax requisition starting in 2020 to fund the new service approved through the electorate in 2019.
Funding for 2020 includes the payback to the Area B Feasibility Function 157 for costs incurred to establish the
service, which totaled $15,542.
TAX REQUISITION SUMMARY:
SERVICE GOALS FOR 2020/2021:
Implement service.
Establish contribution agreements for Whaletown and Manson’s Landing Community Halls.
Formalize service contracts with Whaletown and Manson’s Landing Community Halls.
2019
Projection
2019
Budget
2020
Budget
2021
Budget
2022
Budget
2023
Budget
2024
Budget
682 ‐ Cortes Island Community Halls
Operating Revenue
1 ‐ Property tax requisition ‐ ‐ (80,250) (80,392) (80,400) (80,408) (80,416)
Operating Revenue Total ‐ ‐ (80,250) (80,392) (80,400) (80,408) (80,416)
Operating Expense
11 ‐ Operating expenses ‐ ‐ 64,708 80,392 80,400 80,408 80,416
16 ‐ Other transfers ‐ ‐ 15,542 ‐ ‐ ‐ ‐
Operating Expense Total ‐ ‐ 80,250 80,392 80,400 80,408 80,416
682 ‐ Cortes Island Community Halls Total $ ‐ $ ‐ $ ‐ $ ‐ $ ‐ $ ‐ $ ‐
Requisition Allocation2019
Actual
2020
Budget
2021
Budget
2022
Budget
2023
Budget
2024
Budget
Electoral Area:
Area B ‐$ 80,250$ 80,392$ 80,400$ 80,408$ 80,416$
TOTAL ‐$ 80,250$ 80,392$ 80,400$ 80,408$ 80,416$
Change $ 80,250 142 8 8 8
Change % n/a 0.2% 0.0% 0.0% 0.0%
Tax Rate Estimate (Per $1,000) 0.0000 $ 0.2178 $ 0.2182 $ 0.2182 $ 0.2182 $ 0.2183 $
Maximum Requisition Limit 80,609 $ 84,103 $
130
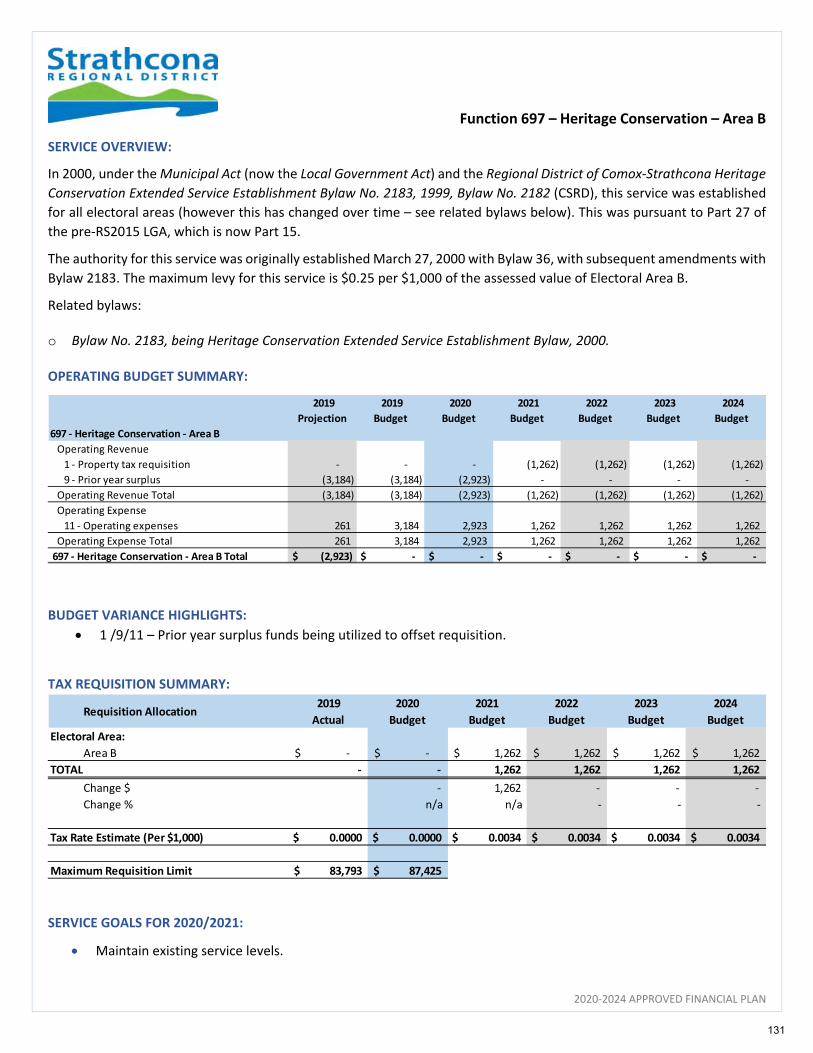
Function 697 – Heritage Conservation – Area B
2020‐2024 APPROVED FINANCIAL PLAN
SERVICE OVERVIEW:
In 2000, under the Municipal Act (now the Local Government Act) and the Regional District of Comox‐Strathcona Heritage
Conservation Extended Service Establishment Bylaw No. 2183, 1999, Bylaw No. 2182 (CSRD), this service was established
for all electoral areas (however this has changed over time – see related bylaws below). This was pursuant to Part 27 of
the pre‐RS2015 LGA, which is now Part 15.
The authority for this service was originally established March 27, 2000 with Bylaw 36, with subsequent amendments with
Bylaw 2183. The maximum levy for this service is $0.25 per $1,000 of the assessed value of Electoral Area B.
Related bylaws:
o Bylaw No. 2183, being Heritage Conservation Extended Service Establishment Bylaw, 2000. OPERATING BUDGET SUMMARY:
BUDGET VARIANCE HIGHLIGHTS:
1 /9/11 – Prior year surplus funds being utilized to offset requisition.
TAX REQUISITION SUMMARY:
SERVICE GOALS FOR 2020/2021:
Maintain existing service levels.
2019
Projection
2019
Budget
2020
Budget
2021
Budget
2022
Budget
2023
Budget
2024
Budget
697 ‐ Heritage Conservation ‐ Area B
Operating Revenue
1 ‐ Property tax requisition ‐ ‐ ‐ (1,262) (1,262) (1,262) (1,262)
9 ‐ Prior year surplus (3,184) (3,184) (2,923) ‐ ‐ ‐ ‐
Operating Revenue Total (3,184) (3,184) (2,923) (1,262) (1,262) (1,262) (1,262)
Operating Expense
11 ‐ Operating expenses 261 3,184 2,923 1,262 1,262 1,262 1,262
Operating Expense Total 261 3,184 2,923 1,262 1,262 1,262 1,262
697 ‐ Heritage Conservation ‐ Area B Total $ (2,923) $ ‐ $ ‐ $ ‐ $ ‐ $ ‐ $ ‐
Requisition Allocation2019
Actual
2020
Budget
2021
Budget
2022
Budget
2023
Budget
2024
Budget
Electoral Area:
Area B ‐$ ‐$ 1,262$ 1,262$ 1,262$ 1,262$
TOTAL ‐ ‐ 1,262 1,262 1,262 1,262
Change $ ‐ 1,262 ‐ ‐ ‐
Change % n/a n/a ‐ ‐ ‐
Tax Rate Estimate (Per $1,000) 0.0000 $ 0.0000 $ 0.0034 $ 0.0034 $ 0.0034 $ 0.0034 $
Maximum Requisition Limit 83,793 $ 87,425 $
131

Electoral Area B – Business Cases
2020‐2024 APPROVED FINANCIAL PLAN
2020 Financial Plan - Business Case Asset Management Data Collection
Executive Summary A key finding in the recently completed Asset Management Plan was that the SRD’s asset data information for linear infrastructure for sewer and water is very high level and lacking granularity which is difficult to plan efficiently for ongoing maintenance and asset replacement. Parks data was also identified as very limited given the many assets contributed to the SRD by provincial and other agencies, as well as limited condition of this expansive asset infrastructure spreading diverse geographic electoral areas. This led to difficulty in quantifying the estimated replacement value, condition rating, and annual sustainable investment levels for capital re-investment which limits the ability for future planning and efficient management of the parks service in each of electoral Area B, C, and D where this service exists.
Improving the asset data inventory for completeness, granularity, accuracy, and condition is the first recommendation in the asset management improvement strategy. The SRD does not have the staffing capacity to collect this data therefore it is recommended that a dedicated resource is allocated to collect this key data for sewer, water, and parks infrastructure in 2019 to improve management of these core infrastructure assets moving forward.
Business Problem and Opportunity
Currently, the data sets for linear and parks infrastructure are a patchwork of as-built drawings, work order invoices, feasibility studies and staff knowledge using information available. The asset management plan has shown that the greatest weakness for forecasting renewals and replacement is the lack of granularity of the data. In order to accurately forecast the strategic capital re-investments and efficient service delivery, more comprehensive data sets are required. This can only be accomplished by boots-on-the-ground asset identification and condition assessments.
A focused effort to collect this data for sewer, water, and parks infrastructure through a dedicated resource would maximize the investment in this effort and minimize costs, while ensuring consistent data collection practices to ensure efficient management of this core information moving forward. Utilizing external resources with expertise and experience would ensure that the deliverables would provide long-lasting benefit.
Proposed Project Objectives Collect data to improve current data sets with regards to asset location and condition to enhance inventory for future re-investment forecasting through asset management as recommended in the asset management improvement strategies.
Business Risks
The coarse nature of the current asset inventory limits the ability to plan for future renewals and re-investments. This puts the organization at risk of unforeseen system failures and service interruptions as well as an increase in financial risk caused by these potential situations. The lack of detailed asset data also limits the ability to strategically plan for capital re-investment and maintenance of assets on the most needed areas.
Cost Benefits Analysis and Proposed Source(s) of Funding The estimated costs to undertake this project is $40,000 which would maximize funding allocated by combining under one project; funding would be distributed to the five service areas minimizing costs to each service. This work would fall under asset management practices implementation and would be eligible for Community Works Reserve funding. The respective electoral area Community Works Reserve balances at the end of 2018 having balances of $476,388 for Area B, $1,342,658 for Area C, and $2,509,833. Alternatively, this operating project could be funded through the respective services areas Future Expenditure Reserves; Area B having a 2018 year-ending balance of $67,059, Area C $29,353, and Area D $225,394.
a) Total Costs 2020 2021 2022 2023 2024
Capital Costs $ $ $ $ $
Operational Revenues $ $ $ $ $
Operational Costs $40,000 $ $ $ $
Total $40,000 $ $ $4 $
132
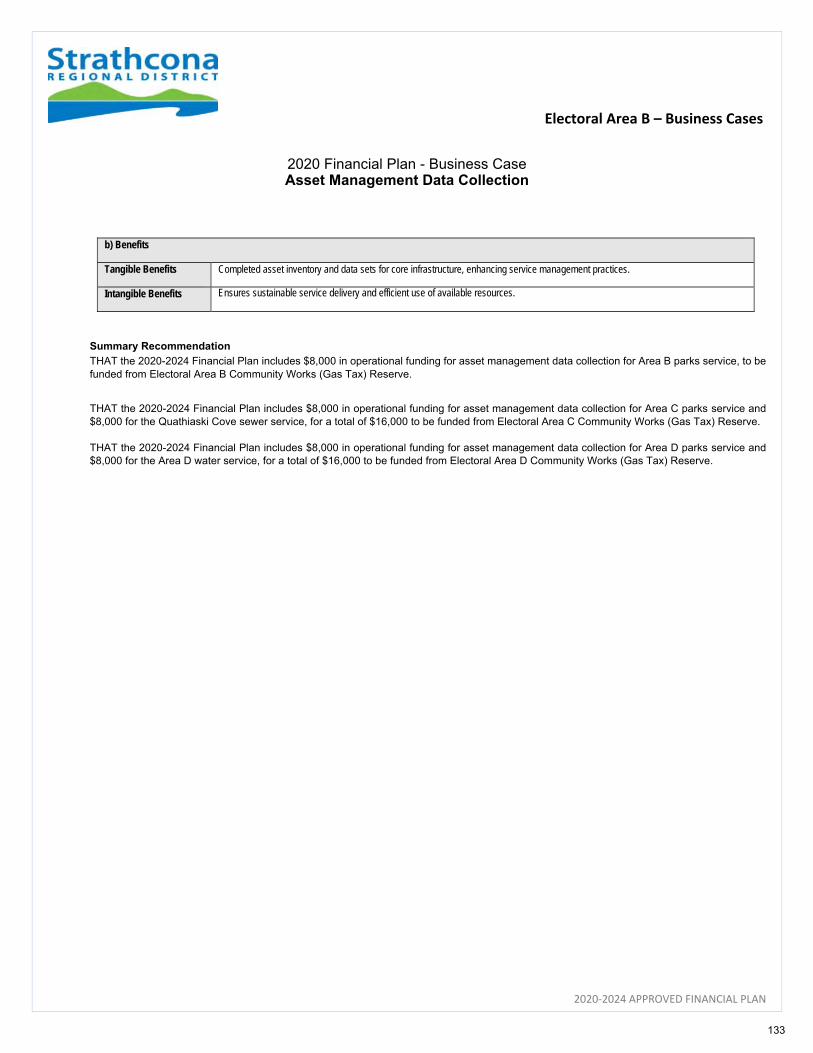
Electoral Area B – Business Cases
2020‐2024 APPROVED FINANCIAL PLAN
2020 Financial Plan - Business Case Asset Management Data Collection
b) Benefits
Tangible Benefits Completed asset inventory and data sets for core infrastructure, enhancing service management practices.
Intangible Benefits Ensures sustainable service delivery and efficient use of available resources.
Summary Recommendation
THAT the 2020-2024 Financial Plan includes $8,000 in operational funding for asset management data collection for Area B parks service, to be funded from Electoral Area B Community Works (Gas Tax) Reserve.
THAT the 2020-2024 Financial Plan includes $8,000 in operational funding for asset management data collection for Area C parks service and $8,000 for the Quathiaski Cove sewer service, for a total of $16,000 to be funded from Electoral Area C Community Works (Gas Tax) Reserve. THAT the 2020-2024 Financial Plan includes $8,000 in operational funding for asset management data collection for Area D parks service and $8,000 for the Area D water service, for a total of $16,000 to be funded from Electoral Area D Community Works (Gas Tax) Reserve.
133

Electoral Area B
2020‐2024 APPROVED FINANCIAL PLAN
134

2020‐2024 APPROVED FINANCIAL PLAN
Electoral Area C
Discovery Islands ‐ Mainland Inlets
Electoral Area C is the largest electoral area within the Strathcona Regional District (SRD), and covers approximately
10,650 square kilometres, including Quadra Island, Read Island, Redonda Island, Port Neville, Refuge Cove, Hardwick
Island, East & West Thurlow Islands & Mainland Inlets.
The region boasts several islands and the intricate waterways that are known for amazing beaches, wildlife viewing and natural beauty. There is also an abundance of on‐land activities to enjoy such as endless mountain biking trails, climbing sites, hiking routes, camping and parks. Visitors will find everything from fishing and kayak lodges to a floating post office.
FINANCIAL PLAN
2020 – 2024
Rebecca Spit, Quadra Island
135
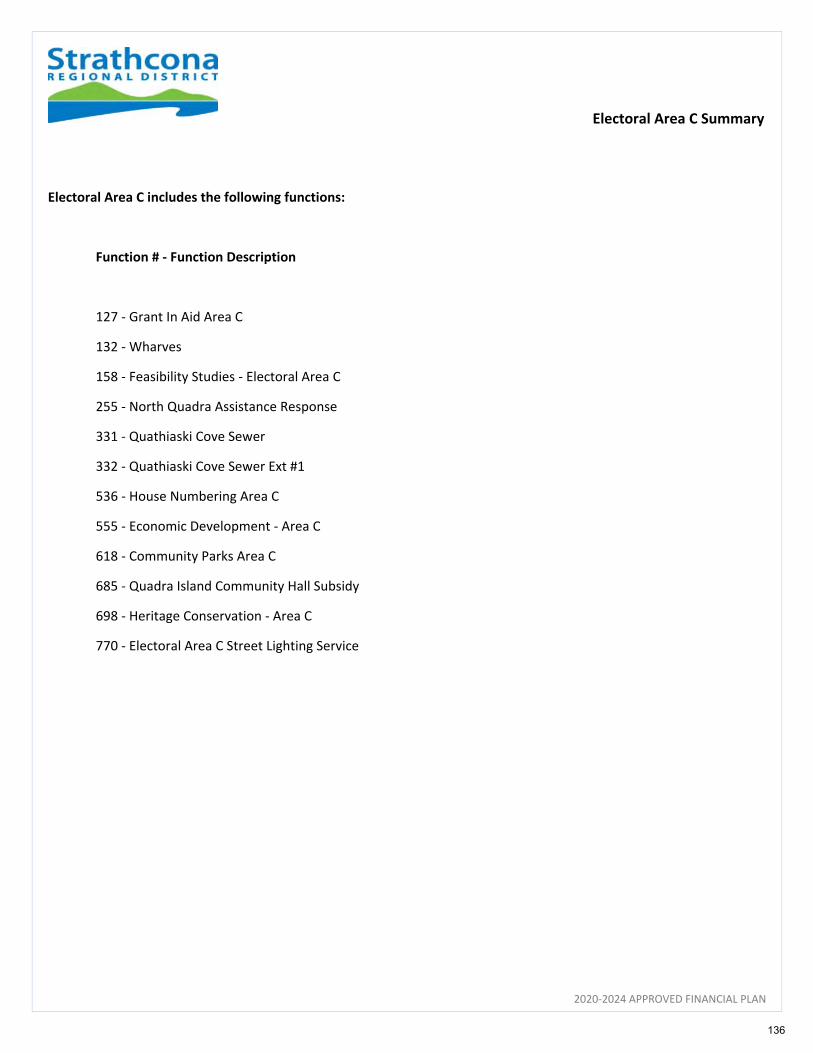
Electoral Area C Summary
2020‐2024 APPROVED FINANCIAL PLAN
Electoral Area C includes the following functions:
Function # ‐ Function Description
127 ‐ Grant In Aid Area C
132 ‐ Wharves
158 ‐ Feasibility Studies ‐ Electoral Area C
255 ‐ North Quadra Assistance Response
331 ‐ Quathiaski Cove Sewer
332 ‐ Quathiaski Cove Sewer Ext #1
536 ‐ House Numbering Area C
555 ‐ Economic Development ‐ Area C
618 ‐ Community Parks Area C
685 ‐ Quadra Island Community Hall Subsidy
698 ‐ Heritage Conservation ‐ Area C
770 ‐ Electoral Area C Street Lighting Service
136
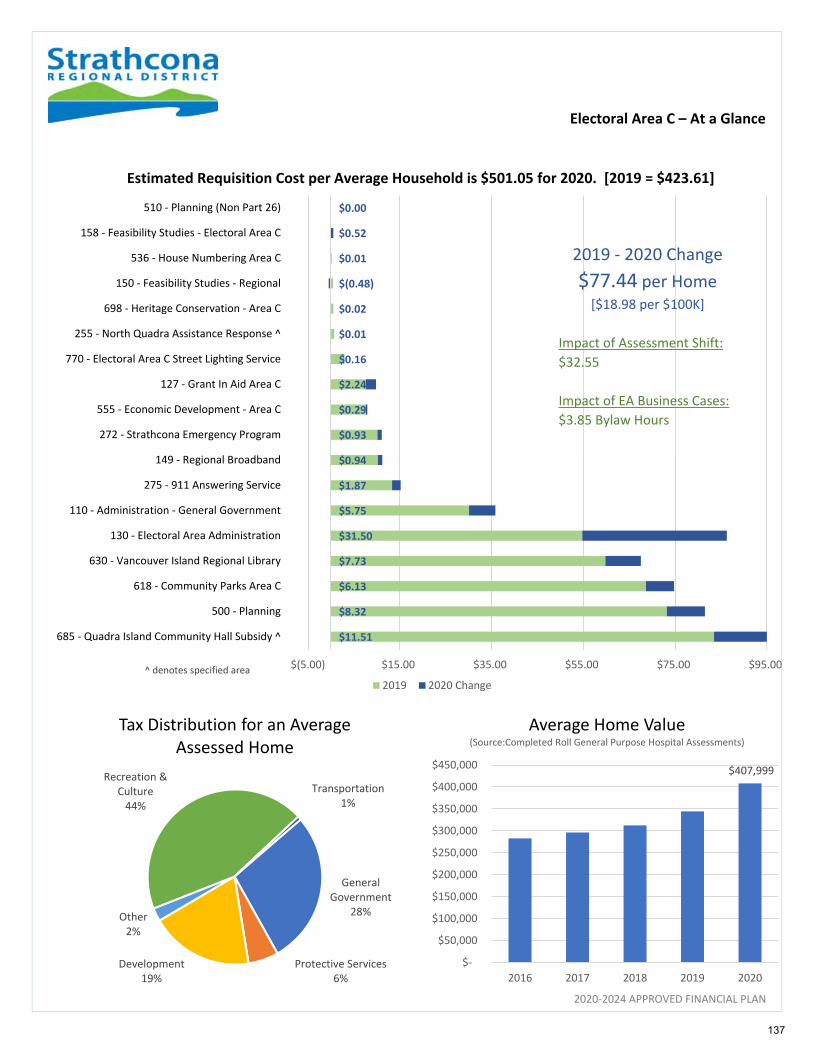
Electoral Area C – At a Glance
2020‐2024 APPROVED FINANCIAL PLAN
$11.51
$8.32
$6.13
$7.73
$31.50
$5.75
$1.87
$0.94
$0.93
$0.29
$2.24
$0.16
$0.01
$0.02
$(0.48)
$0.01
$0.52
$0.00
$(5.00) $15.00 $35.00 $55.00 $75.00 $95.00
685 ‐ Quadra Island Community Hall Subsidy ^
500 ‐ Planning
618 ‐ Community Parks Area C
630 ‐ Vancouver Island Regional Library
130 ‐ Electoral Area Administration
110 ‐ Administration ‐ General Government
275 ‐ 911 Answering Service
149 ‐ Regional Broadband
272 ‐ Strathcona Emergency Program
555 ‐ Economic Development ‐ Area C
127 ‐ Grant In Aid Area C
770 ‐ Electoral Area C Street Lighting Service
255 ‐ North Quadra Assistance Response ^
698 ‐ Heritage Conservation ‐ Area C
150 ‐ Feasibility Studies ‐ Regional
536 ‐ House Numbering Area C
158 ‐ Feasibility Studies ‐ Electoral Area C
510 ‐ Planning (Non Part 26)
2019 2020 Change
Estimated Requisition Cost per Average Household is $501.05 for 2020. [2019 = $423.61]
General Government
28%
Protective Services6%
Development19%
Other2%
Recreation & Culture44%
Transportation1%
Tax Distribution for an Average Assessed Home
$407,999
$‐
$50,000
$100,000
$150,000
$200,000
$250,000
$300,000
$350,000
$400,000
$450,000
2016 2017 2018 2019 2020
Average Home Value(Source:Completed Roll General Purpose Hospital Assessments)
^ denotes specified area
2019 ‐ 2020 Change
$77.44 per Home [$18.98 per $100K]
Impact of Assessment Shift:
$32.55
Impact of EA Business Cases:
$3.85 Bylaw Hours
137
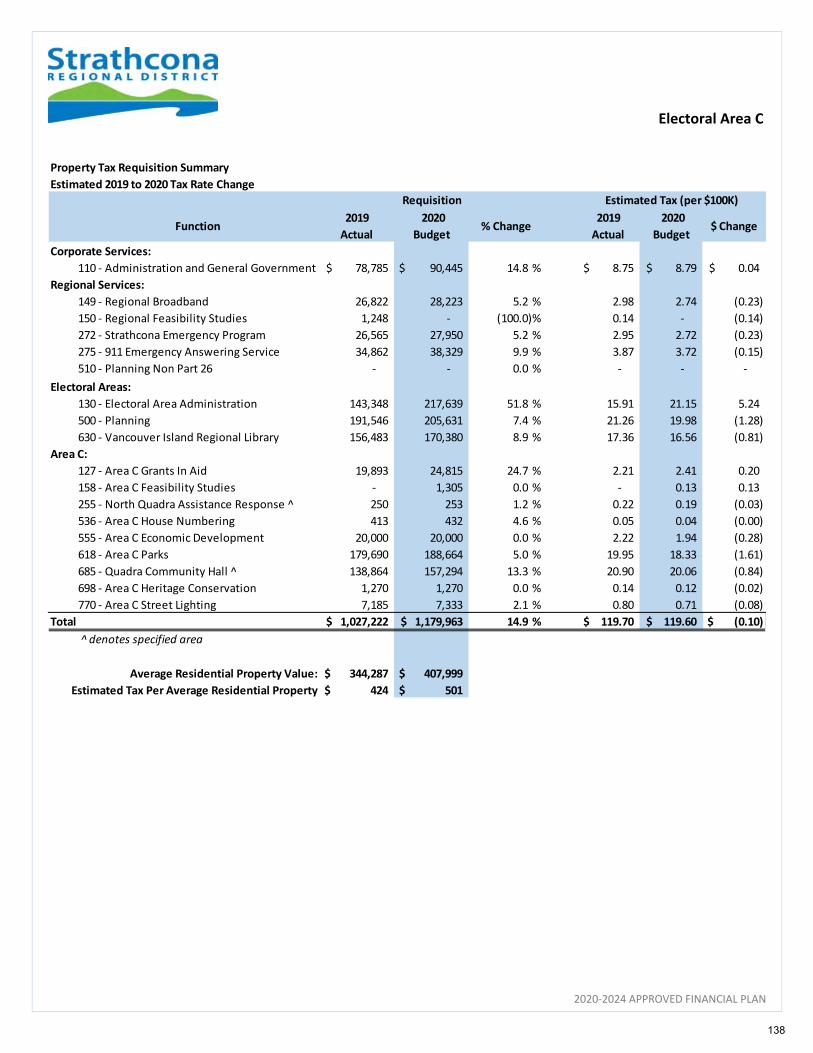
Electoral Area C
2020‐2024 APPROVED FINANCIAL PLAN
Property Tax Requisition Summary
Estimated 2019 to 2020 Tax Rate Change
Function2019
Actual
2020
Budget % Change
2019
Actual
2020
Budget $ Change
Corporate Services:
110 ‐ Administration and General Government 78,785$ 90,445 $ 14.8 % 8.75$ 8.79$ 0.04$
Regional Services:
149 ‐ Regional Broadband 26,822 28,223 5.2 % 2.98 2.74 (0.23)
150 ‐ Regional Feasibility Studies 1,248 ‐ (100.0)% 0.14 ‐ (0.14)
272 ‐ Strathcona Emergency Program 26,565 27,950 5.2 % 2.95 2.72 (0.23)
275 ‐ 911 Emergency Answering Service 34,862 38,329 9.9 % 3.87 3.72 (0.15)
510 ‐ Planning Non Part 26 ‐ ‐ 0.0 % ‐ ‐ ‐
Electoral Areas:
130 ‐ Electoral Area Administration 143,348 217,639 51.8 % 15.91 21.15 5.24
500 ‐ Planning 191,546 205,631 7.4 % 21.26 19.98 (1.28)
630 ‐ Vancouver Island Regional Library 156,483 170,380 8.9 % 17.36 16.56 (0.81)
Area C:
127 ‐ Area C Grants In Aid 19,893 24,815 24.7 % 2.21 2.41 0.20
158 ‐ Area C Feasibility Studies ‐ 1,305 0.0 % ‐ 0.13 0.13
255 ‐ North Quadra Assistance Response ^ 250 253 1.2 % 0.22 0.19 (0.03)
536 ‐ Area C House Numbering 413 432 4.6 % 0.05 0.04 (0.00)
555 ‐ Area C Economic Development 20,000 20,000 0.0 % 2.22 1.94 (0.28)
618 ‐ Area C Parks 179,690 188,664 5.0 % 19.95 18.33 (1.61)
685 ‐ Quadra Community Hall ^ 138,864 157,294 13.3 % 20.90 20.06 (0.84)
698 ‐ Area C Heritage Conservation 1,270 1,270 0.0 % 0.14 0.12 (0.02)
770 ‐ Area C Street Lighting 7,185 7,333 2.1 % 0.80 0.71 (0.08)
Total 1,027,222$ 1,179,963$ 14.9 % 119.70$ 119.60$ (0.10) $
̂denotes specified area
Average Residential Property Value: 344,287 $ 407,999 $
Estimated Tax Per Average Residential Property 424 $ 501 $
Requisition Estimated Tax (per $100K)
138

Electoral Area C
2020‐2024 APPROVED FINANCIAL PLAN
Property Tax Requisition
Estimated 5‐Year Forecast
Function 2019
Actual
2020
Budget
2021
Budget
2022
Budget
2023
Budget
2024
Budget
Corporate Services:
110 ‐ Administration and General Government 78,785$ 90,445 $ 104,693$ 107,894$ 109,349$ 111,768$
Regional Services:
149 ‐ Regional Broadband 26,822 28,223 28,223 7,369 ‐ (17,305)
150 ‐ Regional Feasibility Studies 1,248 ‐ ‐ 25 25 25
272 ‐ Strathcona Emergency Program 26,565 27,950 29,413 29,689 29,971 30,259
275 ‐ 911 Emergency Answering Service 34,862 38,329 40,995 42,319 43,213 43,506
510 ‐ Planning Non Part 26 ‐ ‐ 24 24 24 24
Electoral Areas:
130 ‐ Electoral Area Administration 143,348 217,639 228,406 233,367 238,870 244,341
500 ‐ Planning 191,546 205,631 240,290 244,545 248,891 253,330
630 ‐ Vancouver Island Regional Library 156,483 170,380 173,857 177,340 180,892 184,516
Area C:
127 ‐ Area C Grants In Aid 19,893 24,815 25,879 25,897 25,915 25,933
158 ‐ Area C Feasibility Studies ‐ 1,305 270 270 270 270
255 ‐ North Quadra Assistance Response ^ 250 253 505 510 515 520
536 ‐ Area C House Numbering 413 432 436 440 444 448
555 ‐ Area C Economic Development 20,000 20,000 20,824 20,841 20,858 20,875
618 ‐ Area C Parks 179,690 188,664 228,602 230,955 233,357 235,810
685 ‐ Quadra Community Hall ^ 138,864 157,294 167,107 170,115 173,123 173,131
698 ‐ Area C Heritage Conservation 1,270 1,270 1,270 1,270 1,270 1,270
770 ‐ Area C Street Lighting 7,185 7,333 7,740 7,895 8,053 8,214
Total Requisition 1,027,222$ 1,179,963$ 1,298,535$ 1,300,766$ 1,315,041$ 1,316,934$
^ denotes specified area
Estimated Tax per $100,000 Assessed Value 119.70 $ 119.60 $ 131.58 $ 131.89 $ 133.37 $ 133.56 $
Increase/(Decrease) per $100,000 Assessed Value (0.10) $ 11.98 $ 0.31 $ 1.48 $ 0.19 $
139
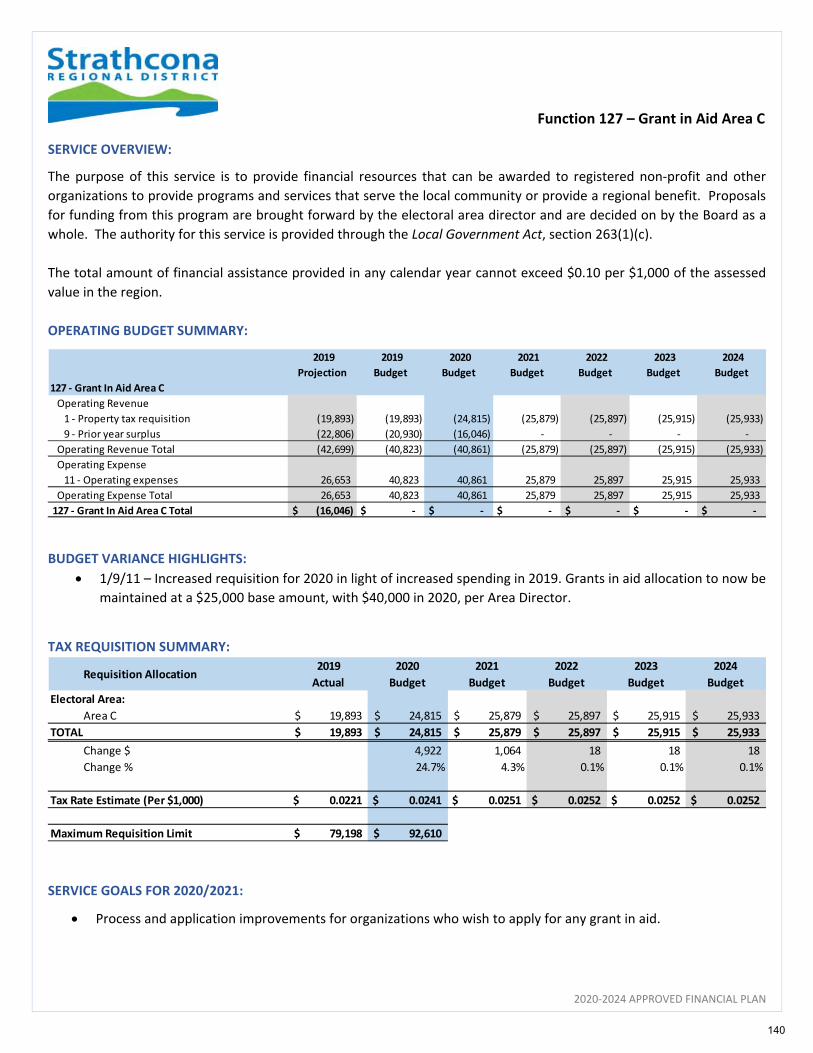
Function 127 – Grant in Aid Area C
2020‐2024 APPROVED FINANCIAL PLAN
SERVICE OVERVIEW:
The purpose of this service is to provide financial resources that can be awarded to registered non‐profit and other
organizations to provide programs and services that serve the local community or provide a regional benefit. Proposals
for funding from this program are brought forward by the electoral area director and are decided on by the Board as a
whole. The authority for this service is provided through the Local Government Act, section 263(1)(c).
The total amount of financial assistance provided in any calendar year cannot exceed $0.10 per $1,000 of the assessed
value in the region.
OPERATING BUDGET SUMMARY:
BUDGET VARIANCE HIGHLIGHTS:
1/9/11 – Increased requisition for 2020 in light of increased spending in 2019. Grants in aid allocation to now be
maintained at a $25,000 base amount, with $40,000 in 2020, per Area Director.
TAX REQUISITION SUMMARY:
SERVICE GOALS FOR 2020/2021:
Process and application improvements for organizations who wish to apply for any grant in aid.
2019
Projection
2019
Budget
2020
Budget
2021
Budget
2022
Budget
2023
Budget
2024
Budget
127 ‐ Grant In Aid Area C
Operating Revenue
1 ‐ Property tax requisition (19,893) (19,893) (24,815) (25,879) (25,897) (25,915) (25,933)
9 ‐ Prior year surplus (22,806) (20,930) (16,046) ‐ ‐ ‐ ‐
Operating Revenue Total (42,699) (40,823) (40,861) (25,879) (25,897) (25,915) (25,933)
Operating Expense
11 ‐ Operating expenses 26,653 40,823 40,861 25,879 25,897 25,915 25,933
Operating Expense Total 26,653 40,823 40,861 25,879 25,897 25,915 25,933
127 ‐ Grant In Aid Area C Total $ (16,046) $ ‐ $ ‐ $ ‐ $ ‐ $ ‐ $ ‐
Requisition Allocation2019
Actual
2020
Budget
2021
Budget
2022
Budget
2023
Budget
2024
Budget
Electoral Area:
Area C 19,893$ 24,815$ 25,879$ 25,897$ 25,915$ 25,933$
TOTAL 19,893$ 24,815$ 25,879$ 25,897$ 25,915$ 25,933$
Change $ 4,922 1,064 18 18 18
Change % 24.7% 4.3% 0.1% 0.1% 0.1%
Tax Rate Estimate (Per $1,000) 0.0221 $ 0.0241 $ 0.0251 $ 0.0252 $ 0.0252 $ 0.0252 $
Maximum Requisition Limit 79,198 $ 92,610 $
140

Function 132 – Wharves
2020‐2024 APPROVED FINANCIAL PLAN
SERVICE OVERVIEW:
This function is responsible for the operation and maintenance of Owen Bay Wharf, Port Neville Wharf and Surge Narrows
Wharf which were all divested from Transport Canada. The divested funds are transferred to revenue when eligible
operating expenses or capital upgrades have been incurred.
OPERATING BUDGET SUMMARY:
BUDGET VARIANCE HIGHLIGHTS:
4 – Interest revenue on Transport Canada divestiture funds; will decrease as funds are spent on eligible operations
and capital upgrades.
7/11 – Budgeted transfers from divested funds to operate and upgrade wharves, per Transport Canada
agreement.
CAPITAL BUDGET:
2019
Projection
2019
Budget
2020
Budget
2021
Budget
2022
Budget
2023
Budget
2024
Budget
132 ‐ Wharves
Operating Revenue
3 ‐ Sales of services (363) (365) (365) (365) (365) (365) (365)
4 ‐ Other revenue (52,975) (22,440) (30,000) (30,000) (30,000) (30,000) (30,000)
7 ‐ Government transfers 6,657 (103,710) (139,417) (140,369) (141,340) (142,331) (143,342)
Operating Revenue Total (46,682) (126,515) (169,782) (170,734) (171,705) (172,696) (173,707)
Operating Expense
11 ‐ Operating expenses 46,682 126,515 169,782 170,734 171,705 172,696 173,707
Operating Expense Total 46,682 126,515 169,782 170,734 171,705 172,696 173,707
132 ‐ Wharves Total $ ‐ $ ‐ $ ‐ $ ‐ $ ‐ $ ‐ $ ‐
Project Title2020
CFWD
2020
Budget
2021
Budget
2022
Budget
2023
Budget
2024
BudgetFunding
Port Neville Wharf Upgrades $ 400,000 $ 500,000 $ ‐ $ ‐ $ ‐ $ ‐ Grants
Owen Bay Wharf Upgrades 50,000 400,000 ‐ ‐ Grants
Surge Narrows Wharf Upgrades 50,000 ‐ 500,000 ‐ ‐ ‐ Grants
TOTAL 500,000$ 900,000$ 500,000$ ‐$ ‐$ ‐$
Design and upgrade to expand dock space to meet service demand. 2019 ‐ design works including approval of expanded
tenure and Transport Canada approval, 2020/2021 construction.
Design and upgrade to expand dock space to meet service demand. 2019 ‐ design works including approval of expanded
tenure and Transport Canada approval, 2020/2021 construction.
Replace wharf; 2014 engineering study recommended substantial replacements. 2019 construction, 2020 completion
including information signs, re‐establishment of natural habitat.
2020 ‐ 2024 FUNDED PROJECTS
141
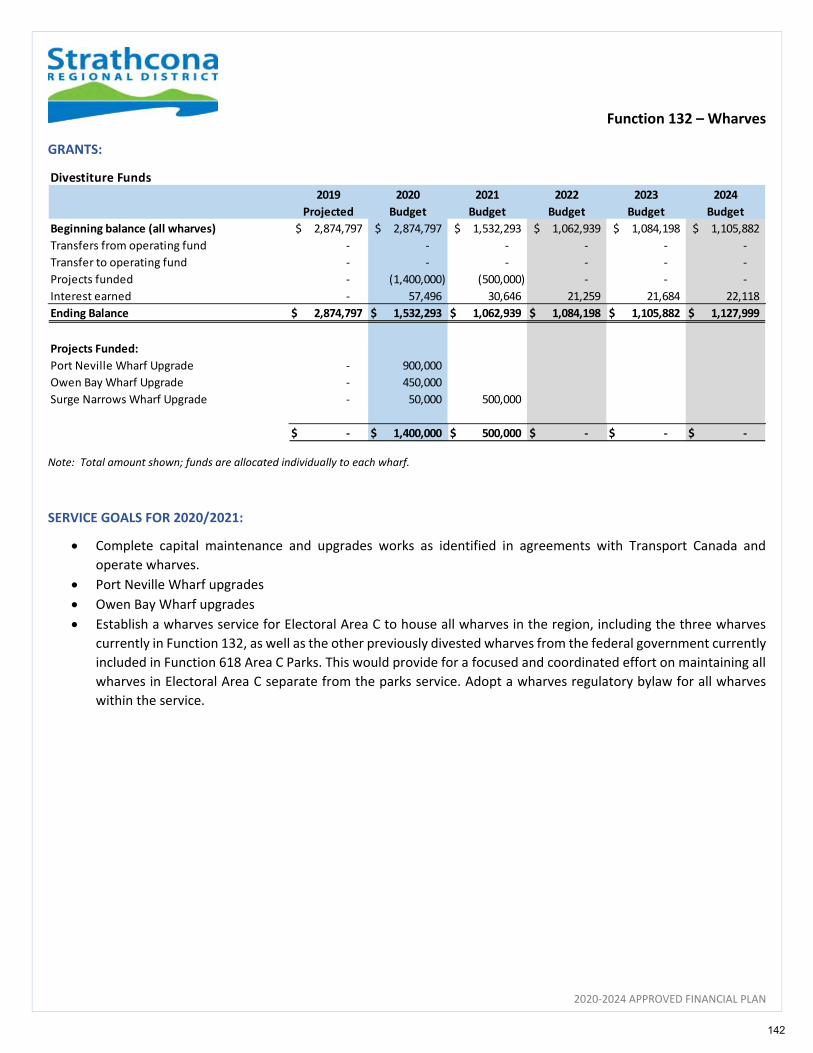
Function 132 – Wharves
2020‐2024 APPROVED FINANCIAL PLAN
GRANTS:
Note: Total amount shown; funds are allocated individually to each wharf.
SERVICE GOALS FOR 2020/2021:
Complete capital maintenance and upgrades works as identified in agreements with Transport Canada and
operate wharves.
Port Neville Wharf upgrades
Owen Bay Wharf upgrades
Establish a wharves service for Electoral Area C to house all wharves in the region, including the three wharves
currently in Function 132, as well as the other previously divested wharves from the federal government currently
included in Function 618 Area C Parks. This would provide for a focused and coordinated effort on maintaining all
wharves in Electoral Area C separate from the parks service. Adopt a wharves regulatory bylaw for all wharves
within the service.
Divestiture Funds
2019
Projected
2020
Budget
2021
Budget
2022
Budget
2023
Budget
2024
Budget
Beginning balance (all wharves) 2,874,797$ 2,874,797$ 1,532,293$ 1,062,939$ 1,084,198$ 1,105,882$
Transfers from operating fund ‐ ‐ ‐ ‐ ‐ ‐
Transfer to operating fund ‐ ‐ ‐ ‐ ‐ ‐
Projects funded ‐ (1,400,000) (500,000) ‐ ‐ ‐
Interest earned ‐ 57,496 30,646 21,259 21,684 22,118
Ending Balance 2,874,797$ 1,532,293$ 1,062,939$ 1,084,198$ 1,105,882$ 1,127,999$
Projects Funded:
Port Neville Wharf Upgrade ‐ 900,000
Owen Bay Wharf Upgrade ‐ 450,000
Surge Narrows Wharf Upgrade ‐ 50,000 500,000
‐$ 1,400,000$ 500,000$ ‐$ ‐$ ‐$
142
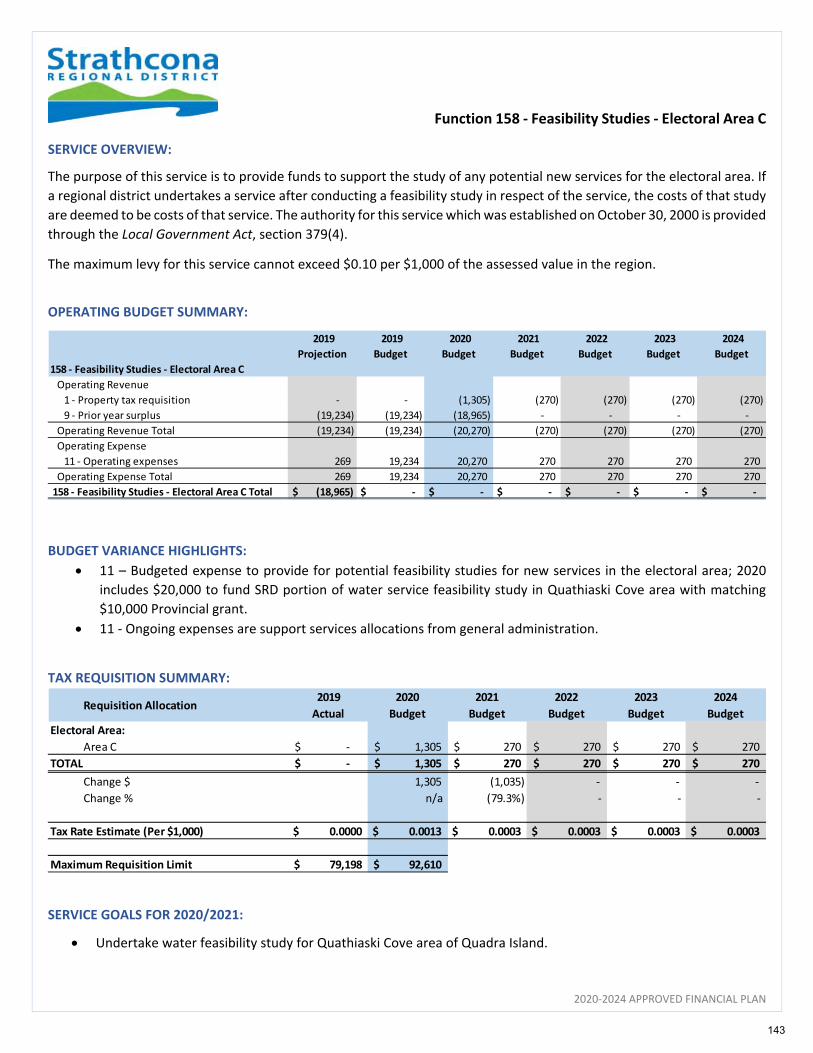
Function 158 ‐ Feasibility Studies ‐ Electoral Area C
2020‐2024 APPROVED FINANCIAL PLAN
SERVICE OVERVIEW:
The purpose of this service is to provide funds to support the study of any potential new services for the electoral area. If
a regional district undertakes a service after conducting a feasibility study in respect of the service, the costs of that study
are deemed to be costs of that service. The authority for this service which was established on October 30, 2000 is provided
through the Local Government Act, section 379(4).
The maximum levy for this service cannot exceed $0.10 per $1,000 of the assessed value in the region.
OPERATING BUDGET SUMMARY:
BUDGET VARIANCE HIGHLIGHTS:
11 – Budgeted expense to provide for potential feasibility studies for new services in the electoral area; 2020
includes $20,000 to fund SRD portion of water service feasibility study in Quathiaski Cove area with matching
$10,000 Provincial grant.
11 ‐ Ongoing expenses are support services allocations from general administration.
TAX REQUISITION SUMMARY:
SERVICE GOALS FOR 2020/2021:
Undertake water feasibility study for Quathiaski Cove area of Quadra Island.
2019
Projection
2019
Budget
2020
Budget
2021
Budget
2022
Budget
2023
Budget
2024
Budget
158 ‐ Feasibility Studies ‐ Electoral Area C
Operating Revenue
1 ‐ Property tax requisition ‐ ‐ (1,305) (270) (270) (270) (270)
9 ‐ Prior year surplus (19,234) (19,234) (18,965) ‐ ‐ ‐ ‐
Operating Revenue Total (19,234) (19,234) (20,270) (270) (270) (270) (270)
Operating Expense
11 ‐ Operating expenses 269 19,234 20,270 270 270 270 270
Operating Expense Total 269 19,234 20,270 270 270 270 270
158 ‐ Feasibility Studies ‐ Electoral Area C Total $ (18,965) $ ‐ $ ‐ $ ‐ $ ‐ $ ‐ $ ‐
Requisition Allocation2019
Actual
2020
Budget
2021
Budget
2022
Budget
2023
Budget
2024
Budget
Electoral Area:
Area C ‐$ 1,305$ 270$ 270$ 270$ 270$
TOTAL ‐$ 1,305$ 270$ 270$ 270$ 270$
Change $ 1,305 (1,035) ‐ ‐ ‐
Change % n/a (79.3%) ‐ ‐ ‐
Tax Rate Estimate (Per $1,000) 0.0000 $ 0.0013 $ 0.0003 $ 0.0003 $ 0.0003 $ 0.0003 $
Maximum Requisition Limit 79,198 $ 92,610 $
143
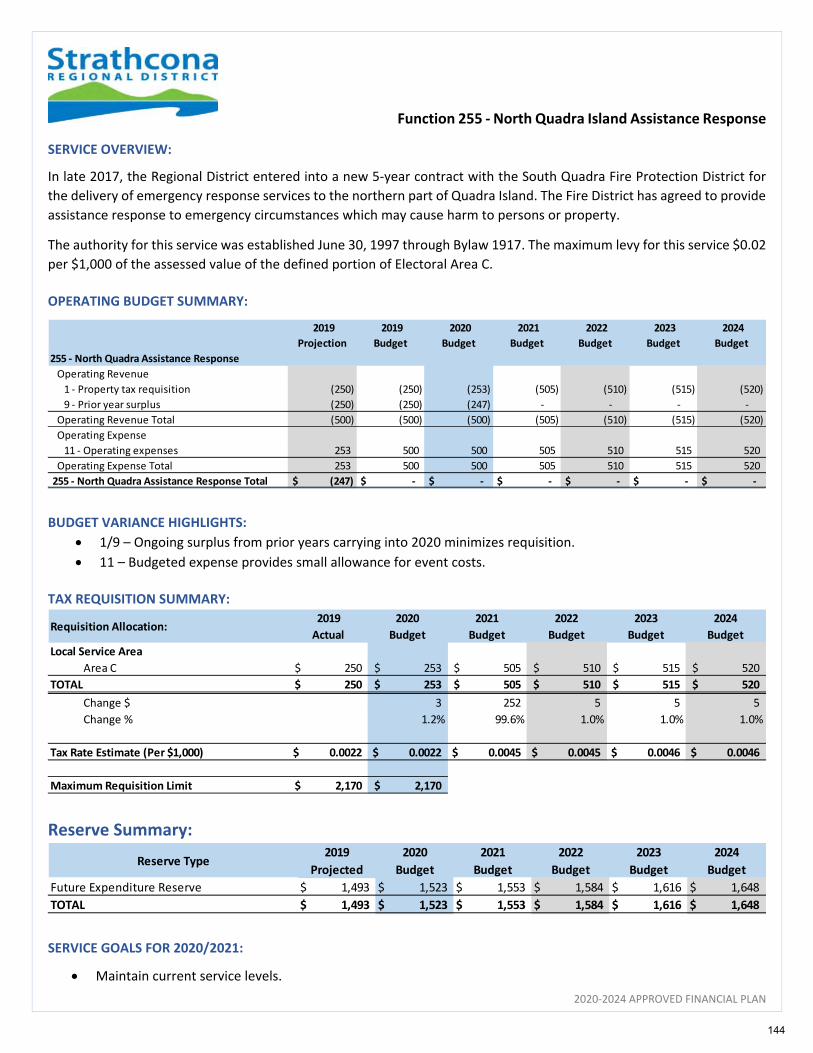
Function 255 ‐ North Quadra Island Assistance Response
2020‐2024 APPROVED FINANCIAL PLAN
SERVICE OVERVIEW:
In late 2017, the Regional District entered into a new 5‐year contract with the South Quadra Fire Protection District for
the delivery of emergency response services to the northern part of Quadra Island. The Fire District has agreed to provide
assistance response to emergency circumstances which may cause harm to persons or property.
The authority for this service was established June 30, 1997 through Bylaw 1917. The maximum levy for this service $0.02
per $1,000 of the assessed value of the defined portion of Electoral Area C.
OPERATING BUDGET SUMMARY:
BUDGET VARIANCE HIGHLIGHTS:
1/9 – Ongoing surplus from prior years carrying into 2020 minimizes requisition.
11 – Budgeted expense provides small allowance for event costs.
TAX REQUISITION SUMMARY:
Reserve Summary:
SERVICE GOALS FOR 2020/2021:
Maintain current service levels.
2019
Projection
2019
Budget
2020
Budget
2021
Budget
2022
Budget
2023
Budget
2024
Budget
255 ‐ North Quadra Assistance Response
Operating Revenue
1 ‐ Property tax requisition (250) (250) (253) (505) (510) (515) (520)
9 ‐ Prior year surplus (250) (250) (247) ‐ ‐ ‐ ‐
Operating Revenue Total (500) (500) (500) (505) (510) (515) (520)
Operating Expense
11 ‐ Operating expenses 253 500 500 505 510 515 520
Operating Expense Total 253 500 500 505 510 515 520
255 ‐ North Quadra Assistance Response Total $ (247) $ ‐ $ ‐ $ ‐ $ ‐ $ ‐ $ ‐
Requisition Allocation:2019
Actual
2020
Budget
2021
Budget
2022
Budget
2023
Budget
2024
Budget
Local Service Area
Area C 250$ 253$ 505$ 510$ 515$ 520$
TOTAL 250$ 253$ 505$ 510$ 515$ 520$
Change $ 3 252 5 5 5
Change % 1.2% 99.6% 1.0% 1.0% 1.0%
Tax Rate Estimate (Per $1,000) 0.0022 $ 0.0022 $ 0.0045 $ 0.0045 $ 0.0046 $ 0.0046 $
Maximum Requisition Limit 2,170 $ 2,170 $
Reserve Type2019
Projected
2020
Budget
2021
Budget
2022
Budget
2023
Budget
2024
Budget
Future Expenditure Reserve 1,493$ 1,523$ 1,553$ 1,584$ 1,616$ 1,648$
TOTAL 1,493$ 1,523$ 1,553$ 1,584$ 1,616$ 1,648$
144

Function 331 ‐ Quathiaski Cove Sewer
2020‐2024 APPROVED FINANCIAL PLAN
SERVICE OVERVIEW:
The Q‐Cove sewer system collects wastewater from approximately 176 dwellings in 2019 and expected to increase to 192
dwellings in 2020 for the remaining users who have land improvements and can connect to the sewer system following
the extension project upgrade completed in 2018/19.
The authority for this service was established May 30, 1994 through Bylaw 1588, with a subsequent amendment with
Bylaw 2870. This service is currently funded by user fees; however, the service bylaw provides for the provision of parcel
taxes, and property value taxation to a requisition maximum of $30,000 for the defined portion of Electoral Area C.
OPERATING BUDGET SUMMARY:
BUDGET VARIANCE HIGHLIGHTS:
3 – A $23,000 revenue shortfall occurred primarily due to actual user fees only increasing by 13% versus a required
increase of 25% ($17,973). In addition, 16 new users were forecasted to connect and begin paying annual fees
however only 6 connected during the year (10 x $575 = $5,750).
3 – A user fee increase of 38% is required to balance the 2020 budget, this would increase user fees by $220 to
$795 per year for a typical residential dwelling.
9 – Surplus is due to water treatment plant study not being completed by the end of the year; approximately
$28,000 in costs are being carried forward in 2020.
11 – This service requires significant renewal and maintenance in order to sustain the service. The wastewater
treatment plant, which was purchased second hand in 1996, is now far beyond its expected service life and needs
replacement. See Unfunded Project listing.
14 – No reserve transfer is being budgeted for 2020 to minimize the impact of the required rate increase. The
reserve balance for this function is very low given it maintains a $5 million asset group.
12/13 – In 2019 approximately $300,000 in capital upgrades occurred on the existing system and were 83%
funded by the Provincial and Federal Governments through the Clean Water and Wastewater Fund. The
remaining 17% (approx. $55,000) is anticipated to be funded 50% through short‐term debt over 5 years and 50%
from the Capital Reserve in order to minimize the impact on current ratepayers.
2019
Projection
2019
Budget
2020
Budget
2021
Budget
2022
Budget
2023
Budget
2024
Budget
331 ‐ Quathiaski Cove Sewer
Operating Revenue
3 ‐ Sales of services (129,769) (151,418) (194,111) (208,076) (210,632) (213,256) (215,952)
9 ‐ Prior year surplus (48,019) (47,846) (22,388) ‐ ‐ ‐ ‐
Operating Revenue Total (177,788) (199,264) (216,499) (208,076) (210,632) (213,256) (215,952)
Operating Expense
11 ‐ Operating expenses 147,901 191,764 216,499 186,295 189,118 192,010 194,974
12 ‐ Debt principal ‐ ‐ ‐ 6,112 5,978 5,844 5,710
13 ‐ Debt interest ‐ ‐ ‐ 669 536 402 268
14 ‐ Transfers to reserves 7,500 7,500 ‐ 15,000 15,000 15,000 15,000
Operating Expense Total 155,401 199,264 216,499 208,076 210,632 213,256 215,952
331 ‐ Quathiaski Cove Sewer Total $ (22,388) $ ‐ $ ‐ $ ‐ $ ‐ $ ‐ $ ‐
145
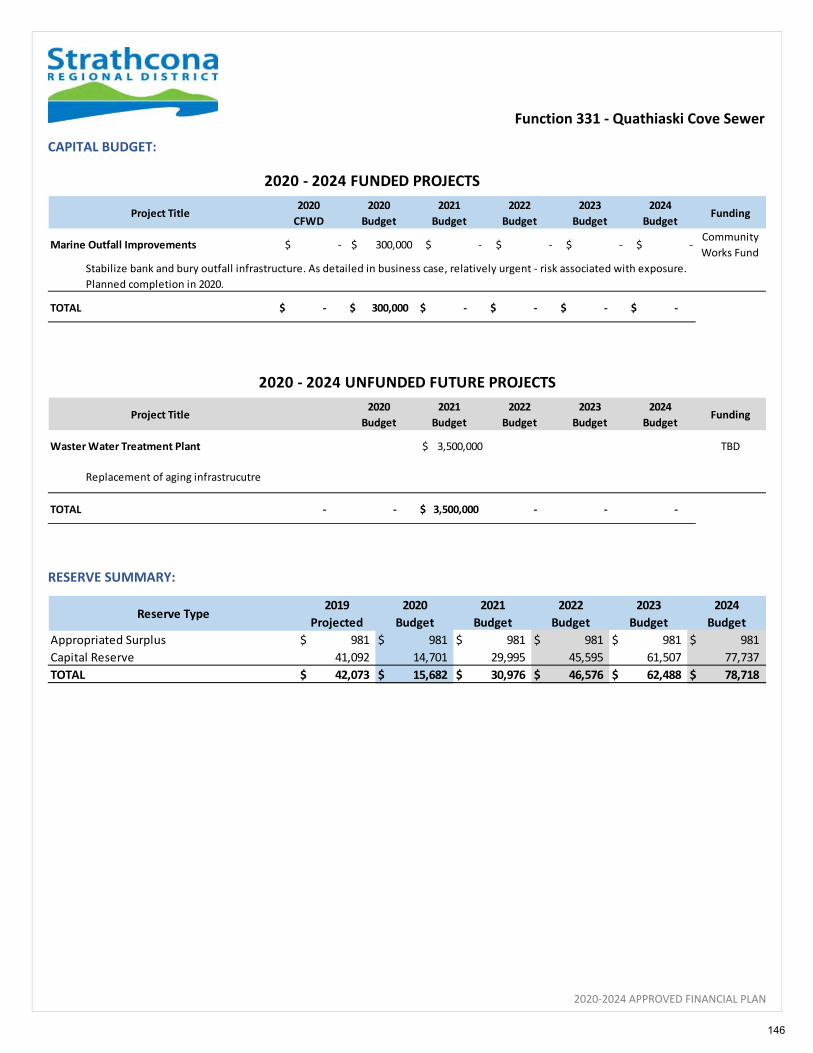
Function 331 ‐ Quathiaski Cove Sewer
2020‐2024 APPROVED FINANCIAL PLAN
CAPITAL BUDGET:
RESERVE SUMMARY:
Project Title2020
CFWD
2020
Budget
2021
Budget
2022
Budget
2023
Budget
2024
BudgetFunding
Marine Outfall Improvements $ ‐ $ 300,000 $ ‐ $ ‐ $ ‐ $ ‐ Community
Works Fund
TOTAL ‐$ 300,000$ ‐$ ‐$ ‐$ ‐$
2020 ‐ 2024 FUNDED PROJECTS
Stabilize bank and bury outfall infrastructure. As detailed in business case, relatively urgent ‐ risk associated with exposure.
Planned completion in 2020.
Project Title2020
Budget
2021
Budget
2022
Budget
2023
Budget
2024
BudgetFunding
Waster Water Treatment Plant $ 3,500,000 TBD
TOTAL ‐ ‐ 3,500,000$ ‐ ‐ ‐
Replacement of aging infrastrucutre
2020 ‐ 2024 UNFUNDED FUTURE PROJECTS
Reserve Type2019
Projected
2020
Budget
2021
Budget
2022
Budget
2023
Budget
2024
Budget
Appropriated Surplus 981$ 981$ 981$ 981$ 981$ 981$
Capital Reserve 41,092 14,701 29,995 45,595 61,507 77,737
TOTAL 42,073$ 15,682$ 30,976$ 46,576$ 62,488$ 78,718$
146
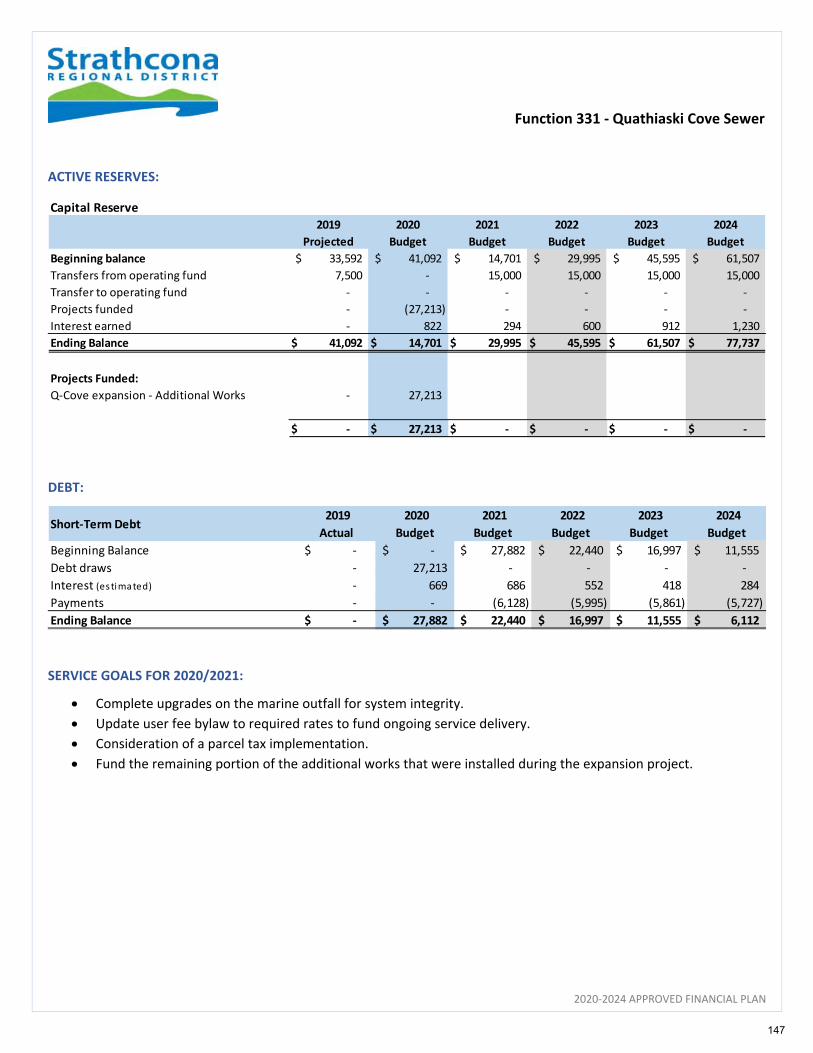
Function 331 ‐ Quathiaski Cove Sewer
2020‐2024 APPROVED FINANCIAL PLAN
ACTIVE RESERVES:
DEBT:
SERVICE GOALS FOR 2020/2021:
Complete upgrades on the marine outfall for system integrity.
Update user fee bylaw to required rates to fund ongoing service delivery.
Consideration of a parcel tax implementation.
Fund the remaining portion of the additional works that were installed during the expansion project.
Capital Reserve
2019
Projected
2020
Budget
2021
Budget
2022
Budget
2023
Budget
2024
Budget
Beginning balance 33,592$ 41,092$ 14,701$ 29,995$ 45,595$ 61,507$
Transfers from operating fund 7,500 ‐ 15,000 15,000 15,000 15,000
Transfer to operating fund ‐ ‐ ‐ ‐ ‐ ‐
Projects funded ‐ (27,213) ‐ ‐ ‐ ‐
Interest earned ‐ 822 294 600 912 1,230
Ending Balance 41,092$ 14,701$ 29,995$ 45,595$ 61,507$ 77,737$
Projects Funded:
Q‐Cove expansion ‐ Additional Works ‐ 27,213
‐$ 27,213$ ‐$ ‐$ ‐$ ‐$
Short‐Term Debt 2019
Actual
2020
Budget
2021
Budget
2022
Budget
2023
Budget
2024
Budget
Beginning Balance ‐$ ‐$ 27,882$ 22,440$ 16,997$ 11,555$
Debt draws ‐ 27,213 ‐ ‐ ‐ ‐
Interest (estimated) ‐ 669 686 552 418 284
Payments ‐ ‐ (6,128) (5,995) (5,861) (5,727)
Ending Balance ‐$ 27,882$ 22,440$ 16,997$ 11,555$ 6,112$
147
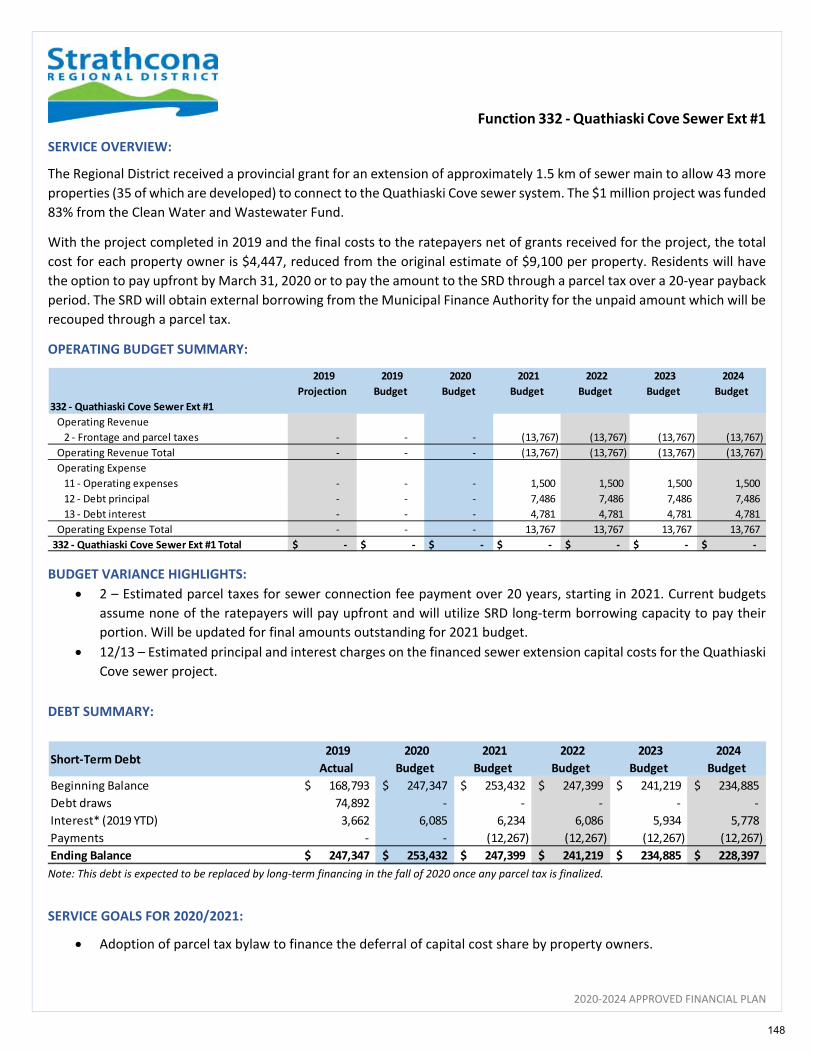
Function 332 ‐ Quathiaski Cove Sewer Ext #1
2020‐2024 APPROVED FINANCIAL PLAN
SERVICE OVERVIEW:
The Regional District received a provincial grant for an extension of approximately 1.5 km of sewer main to allow 43 more
properties (35 of which are developed) to connect to the Quathiaski Cove sewer system. The $1 million project was funded
83% from the Clean Water and Wastewater Fund.
With the project completed in 2019 and the final costs to the ratepayers net of grants received for the project, the total
cost for each property owner is $4,447, reduced from the original estimate of $9,100 per property. Residents will have
the option to pay upfront by March 31, 2020 or to pay the amount to the SRD through a parcel tax over a 20‐year payback
period. The SRD will obtain external borrowing from the Municipal Finance Authority for the unpaid amount which will be
recouped through a parcel tax.
OPERATING BUDGET SUMMARY:
BUDGET VARIANCE HIGHLIGHTS:
2 – Estimated parcel taxes for sewer connection fee payment over 20 years, starting in 2021. Current budgets
assume none of the ratepayers will pay upfront and will utilize SRD long‐term borrowing capacity to pay their
portion. Will be updated for final amounts outstanding for 2021 budget.
12/13 – Estimated principal and interest charges on the financed sewer extension capital costs for the Quathiaski
Cove sewer project.
DEBT SUMMARY:
Note: This debt is expected to be replaced by long‐term financing in the fall of 2020 once any parcel tax is finalized.
SERVICE GOALS FOR 2020/2021:
Adoption of parcel tax bylaw to finance the deferral of capital cost share by property owners.
2019
Projection
2019
Budget
2020
Budget
2021
Budget
2022
Budget
2023
Budget
2024
Budget
332 ‐ Quathiaski Cove Sewer Ext #1
Operating Revenue
2 ‐ Frontage and parcel taxes ‐ ‐ ‐ (13,767) (13,767) (13,767) (13,767)
Operating Revenue Total ‐ ‐ ‐ (13,767) (13,767) (13,767) (13,767)
Operating Expense
11 ‐ Operating expenses ‐ ‐ ‐ 1,500 1,500 1,500 1,500
12 ‐ Debt principal ‐ ‐ ‐ 7,486 7,486 7,486 7,486
13 ‐ Debt interest ‐ ‐ ‐ 4,781 4,781 4,781 4,781
Operating Expense Total ‐ ‐ ‐ 13,767 13,767 13,767 13,767
332 ‐ Quathiaski Cove Sewer Ext #1 Total $ ‐ $ ‐ $ ‐ $ ‐ $ ‐ $ ‐ $ ‐
Short‐Term Debt 2019
Actual
2020
Budget
2021
Budget
2022
Budget
2023
Budget
2024
Budget
Beginning Balance 168,793$ 247,347$ 253,432$ 247,399$ 241,219$ 234,885$
Debt draws 74,892 ‐ ‐ ‐ ‐ ‐
Interest* (2019 YTD) 3,662 6,085 6,234 6,086 5,934 5,778
Payments ‐ ‐ (12,267) (12,267) (12,267) (12,267)
Ending Balance 247,347$ 253,432$ 247,399$ 241,219$ 234,885$ 228,397$
148

Function 536 ‐ House Numbering Area C
2020‐2024 APPROVED FINANCIAL PLAN
SERVICE OVERVIEW:
Function 501 ‐ Geographic Information Systems fulfills the service of assigning and managing house numbering in Electoral
Area C.
The authority for this service was originally established January 13, 1976 through SLP #33/35, with subsequent
amendments with SLP #71 and Bylaws 2142 and 2157. The maximum levy for this service is $0.277 per $1,000 of the
assessed value of the Electoral Area C.
OPERATING BUDGET SUMMARY:
BUDGET VARIANCE HIGHLIGHTS:
1 – Requisition maintained at prior year levels.
11 ‐ Standing annual in‐house labour allocation from Function 501 ‐ GIS and a support services allocation.
TAX REQUISITION SUMMARY:
SERVICE GOALS FOR 2020/2021:
Maintain service levels.
2019
Projection
2019
Budget
2020
Budget
2021
Budget
2022
Budget
2023
Budget
2024
Budget
536 ‐ House Numbering Area C
Operating Revenue
1 ‐ Property tax requisition (413) (413) (432) (436) (440) (444) (448)
9 ‐ Prior year surplus (1) (1) ‐ ‐ ‐ ‐ ‐
Operating Revenue Total (414) (414) (432) (436) (440) (444) (448)
Operating Expense
11 ‐ Operating expenses 414 414 432 436 440 444 448
Operating Expense Total 414 414 432 436 440 444 448
536 ‐ House Numbering Area C Total $ ‐ $ ‐ $ ‐ $ ‐ $ ‐ $ ‐ $ ‐
Requisition Allocation2019
Actual
2020
Budget
2021
Budget
2022
Budget
2023
Budget
2024
Budget
Electoral Area:
Area C 413$ 432$ 436$ 440$ 444$ 448$
TOTAL 413$ 432$ 436$ 440$ 444$ 448$
Change $ 19 4 4 4 4
Change % 4.6% 0.9% 0.9% 0.9% 0.9%
Tax Rate Estimate (Per $1,000) 0.0005 $ 0.0004 $ 0.0004 $ 0.0004 $ 0.0004 $ 0.0004 $
Maximum Requisition Limit 21,938 $ 25,653 $
149
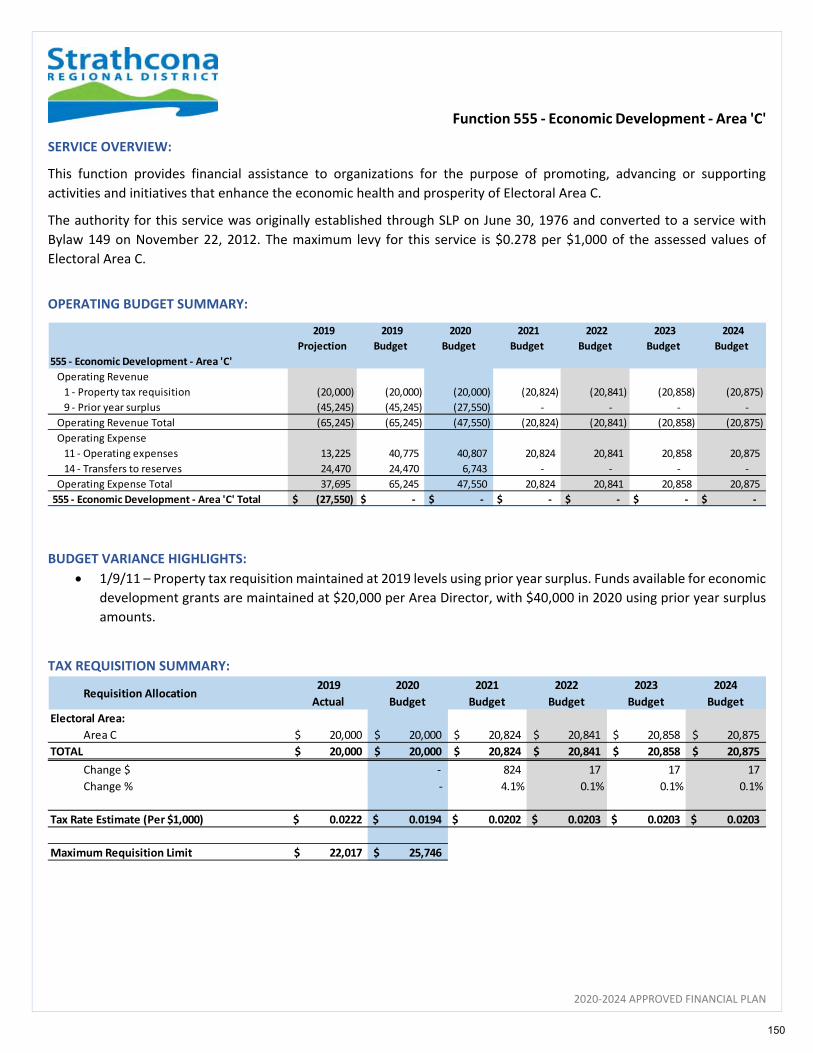
Function 555 ‐ Economic Development ‐ Area 'C'
2020‐2024 APPROVED FINANCIAL PLAN
SERVICE OVERVIEW:
This function provides financial assistance to organizations for the purpose of promoting, advancing or supporting
activities and initiatives that enhance the economic health and prosperity of Electoral Area C.
The authority for this service was originally established through SLP on June 30, 1976 and converted to a service with
Bylaw 149 on November 22, 2012. The maximum levy for this service is $0.278 per $1,000 of the assessed values of
Electoral Area C.
OPERATING BUDGET SUMMARY:
BUDGET VARIANCE HIGHLIGHTS:
1/9/11 – Property tax requisition maintained at 2019 levels using prior year surplus. Funds available for economic
development grants are maintained at $20,000 per Area Director, with $40,000 in 2020 using prior year surplus
amounts.
TAX REQUISITION SUMMARY:
2019
Projection
2019
Budget
2020
Budget
2021
Budget
2022
Budget
2023
Budget
2024
Budget
555 ‐ Economic Development ‐ Area 'C'
Operating Revenue
1 ‐ Property tax requisition (20,000) (20,000) (20,000) (20,824) (20,841) (20,858) (20,875)
9 ‐ Prior year surplus (45,245) (45,245) (27,550) ‐ ‐ ‐ ‐
Operating Revenue Total (65,245) (65,245) (47,550) (20,824) (20,841) (20,858) (20,875)
Operating Expense
11 ‐ Operating expenses 13,225 40,775 40,807 20,824 20,841 20,858 20,875
14 ‐ Transfers to reserves 24,470 24,470 6,743 ‐ ‐ ‐ ‐
Operating Expense Total 37,695 65,245 47,550 20,824 20,841 20,858 20,875
555 ‐ Economic Development ‐ Area 'C' Total $ (27,550) $ ‐ $ ‐ $ ‐ $ ‐ $ ‐ $ ‐
Requisition Allocation2019
Actual
2020
Budget
2021
Budget
2022
Budget
2023
Budget
2024
Budget
Electoral Area:
Area C 20,000$ 20,000$ 20,824$ 20,841$ 20,858$ 20,875$
TOTAL 20,000$ 20,000$ 20,824$ 20,841$ 20,858$ 20,875$
Change $ ‐ 824 17 17 17
Change % ‐ 4.1% 0.1% 0.1% 0.1%
Tax Rate Estimate (Per $1,000) 0.0222 $ 0.0194 $ 0.0202 $ 0.0203 $ 0.0203 $ 0.0203 $
Maximum Requisition Limit 22,017 $ 25,746 $
150
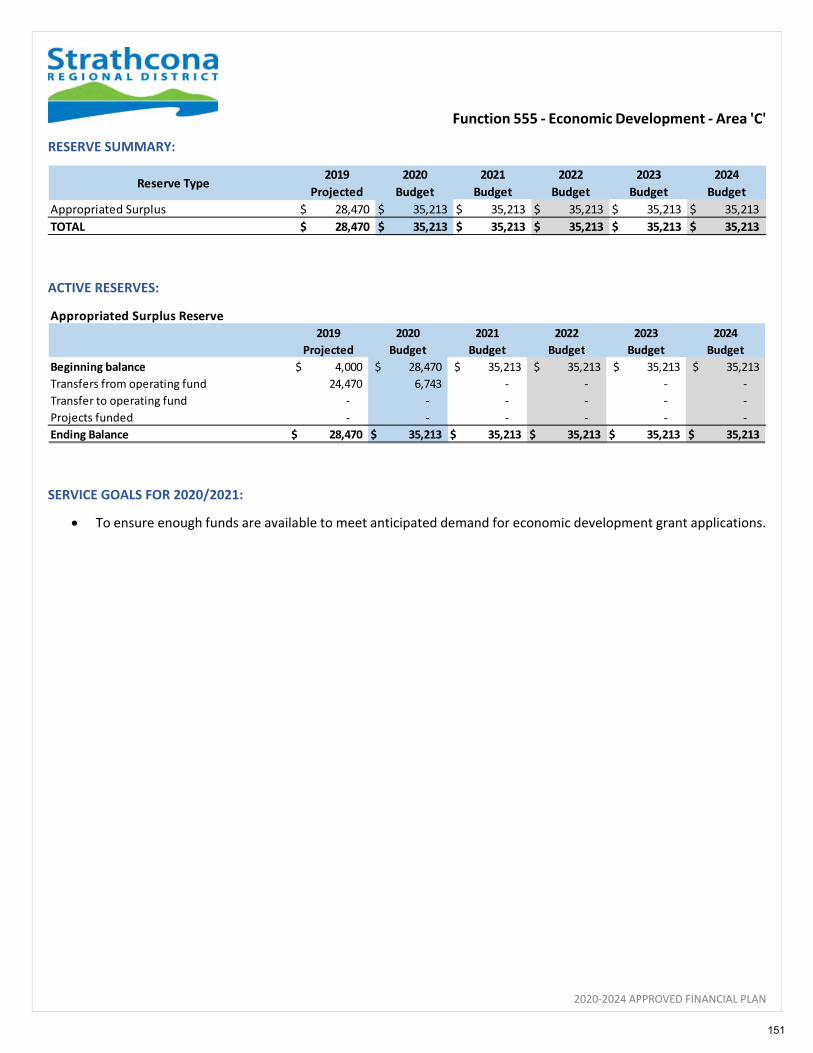
Function 555 ‐ Economic Development ‐ Area 'C'
2020‐2024 APPROVED FINANCIAL PLAN
RESERVE SUMMARY:
ACTIVE RESERVES:
SERVICE GOALS FOR 2020/2021:
To ensure enough funds are available to meet anticipated demand for economic development grant applications.
Reserve Type2019
Projected
2020
Budget
2021
Budget
2022
Budget
2023
Budget
2024
Budget
Appropriated Surplus 28,470$ 35,213$ 35,213$ 35,213$ 35,213$ 35,213$
TOTAL 28,470$ 35,213$ 35,213$ 35,213$ 35,213$ 35,213$
Appropriated Surplus Reserve
2019
Projected
2020
Budget
2021
Budget
2022
Budget
2023
Budget
2024
Budget
Beginning balance 4,000$ 28,470$ 35,213$ 35,213$ 35,213$ 35,213$
Transfers from operating fund 24,470 6,743 ‐ ‐ ‐ ‐
Transfer to operating fund ‐ ‐ ‐ ‐ ‐ ‐
Projects funded ‐ ‐ ‐ ‐ ‐ ‐
Ending Balance 28,470$ 35,213$ 35,213$ 35,213$ 35,213$ 35,213$
151
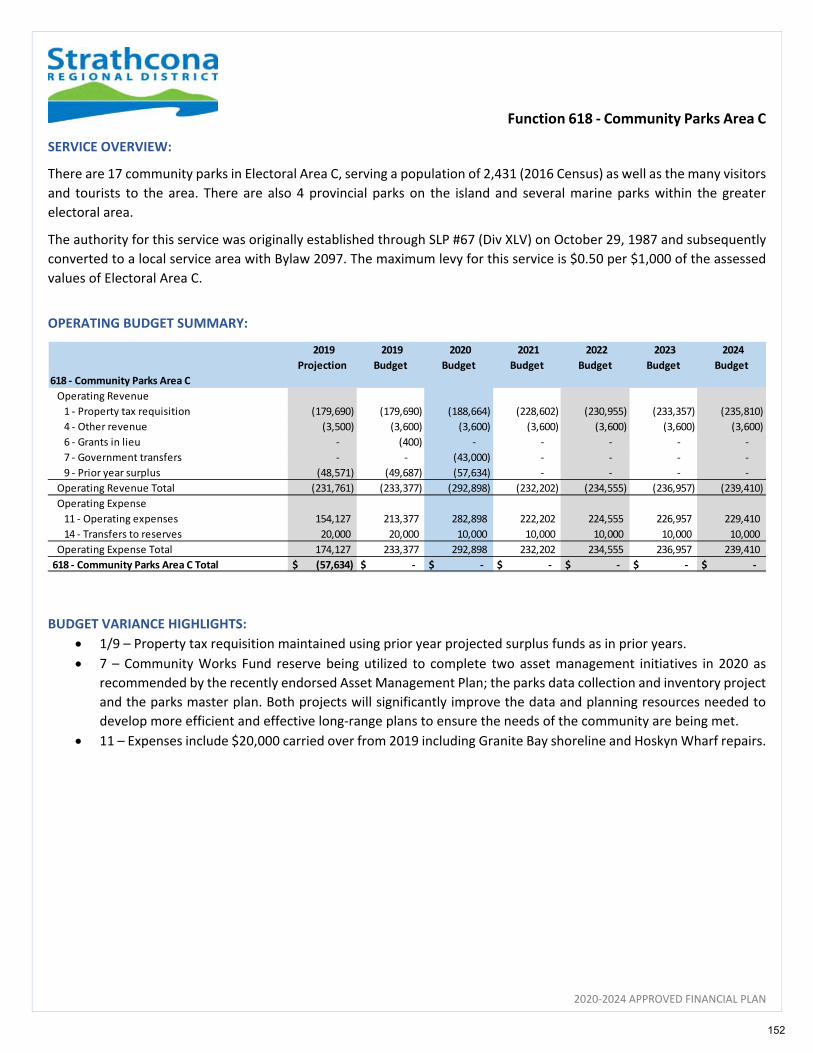
Function 618 ‐ Community Parks Area C
2020‐2024 APPROVED FINANCIAL PLAN
SERVICE OVERVIEW:
There are 17 community parks in Electoral Area C, serving a population of 2,431 (2016 Census) as well as the many visitors
and tourists to the area. There are also 4 provincial parks on the island and several marine parks within the greater
electoral area.
The authority for this service was originally established through SLP #67 (Div XLV) on October 29, 1987 and subsequently
converted to a local service area with Bylaw 2097. The maximum levy for this service is $0.50 per $1,000 of the assessed
values of Electoral Area C.
OPERATING BUDGET SUMMARY:
BUDGET VARIANCE HIGHLIGHTS:
1/9 – Property tax requisition maintained using prior year projected surplus funds as in prior years.
7 – Community Works Fund reserve being utilized to complete two asset management initiatives in 2020 as
recommended by the recently endorsed Asset Management Plan; the parks data collection and inventory project
and the parks master plan. Both projects will significantly improve the data and planning resources needed to
develop more efficient and effective long‐range plans to ensure the needs of the community are being met.
11 – Expenses include $20,000 carried over from 2019 including Granite Bay shoreline and Hoskyn Wharf repairs.
2019
Projection
2019
Budget
2020
Budget
2021
Budget
2022
Budget
2023
Budget
2024
Budget
618 ‐ Community Parks Area C
Operating Revenue
1 ‐ Property tax requisition (179,690) (179,690) (188,664) (228,602) (230,955) (233,357) (235,810)
4 ‐ Other revenue (3,500) (3,600) (3,600) (3,600) (3,600) (3,600) (3,600)
6 ‐ Grants in lieu ‐ (400) ‐ ‐ ‐ ‐ ‐
7 ‐ Government transfers ‐ ‐ (43,000) ‐ ‐ ‐ ‐
9 ‐ Prior year surplus (48,571) (49,687) (57,634) ‐ ‐ ‐ ‐
Operating Revenue Total (231,761) (233,377) (292,898) (232,202) (234,555) (236,957) (239,410)
Operating Expense
11 ‐ Operating expenses 154,127 213,377 282,898 222,202 224,555 226,957 229,410
14 ‐ Transfers to reserves 20,000 20,000 10,000 10,000 10,000 10,000 10,000
Operating Expense Total 174,127 233,377 292,898 232,202 234,555 236,957 239,410
618 ‐ Community Parks Area C Total $ (57,634) $ ‐ $ ‐ $ ‐ $ ‐ $ ‐ $ ‐
152
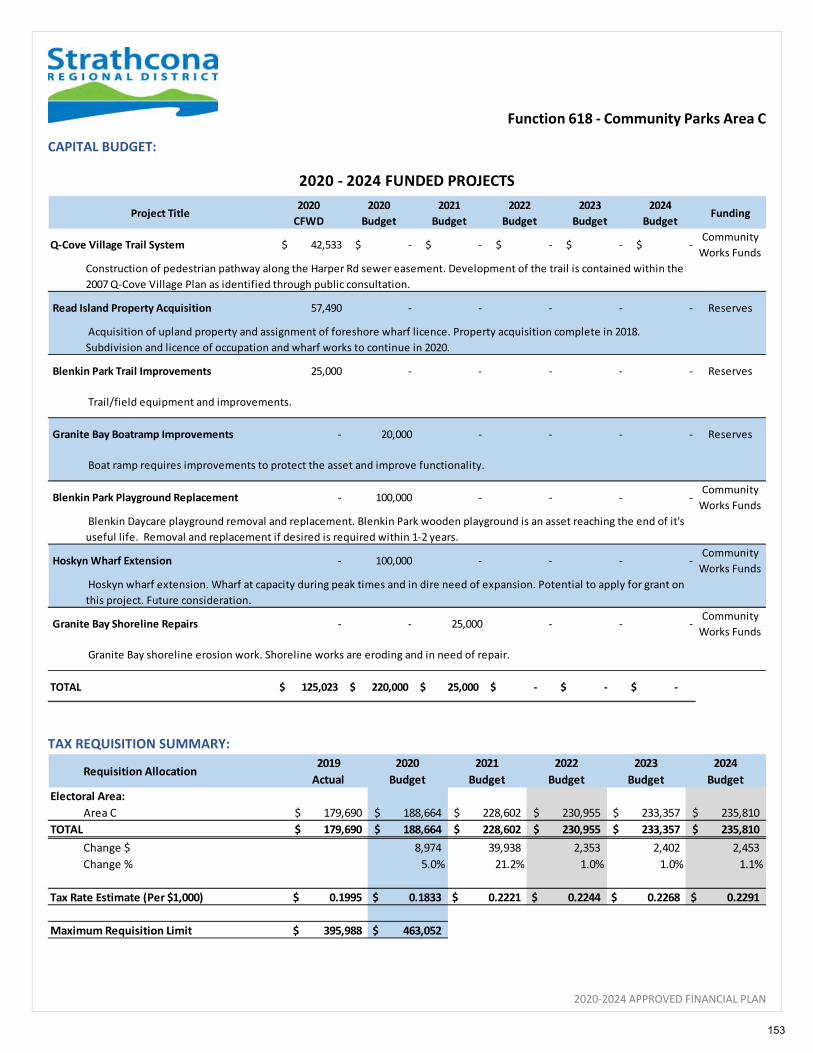
Function 618 ‐ Community Parks Area C
2020‐2024 APPROVED FINANCIAL PLAN
CAPITAL BUDGET:
TAX REQUISITION SUMMARY:
Project Title2020
CFWD
2020
Budget
2021
Budget
2022
Budget
2023
Budget
2024
BudgetFunding
Q‐Cove Village Trail System $ 42,533 $ ‐ $ ‐ $ ‐ $ ‐ $ ‐ Community
Works Funds
Read Island Property Acquisition 57,490 ‐ ‐ ‐ ‐ ‐ Reserves
Blenkin Park Trail Improvements 25,000 ‐ ‐ ‐ ‐ ‐ Reserves
Granite Bay Boatramp Improvements ‐ 20,000 ‐ ‐ ‐ ‐ Reserves
Blenkin Park Playground Replacement ‐ 100,000 ‐ ‐ ‐ ‐ Community
Works Funds
Hoskyn Wharf Extension ‐ 100,000 ‐ ‐ ‐ ‐ Community
Works Funds
Granite Bay Shoreline Repairs ‐ ‐ 25,000 ‐ ‐ ‐ Community
Works Funds
TOTAL 125,023$ 220,000$ 25,000$ ‐$ ‐$ ‐$
2020 ‐ 2024 FUNDED PROJECTS
Boat ramp requires improvements to protect the asset and improve functionality.
Trail/field equipment and improvements.
Blenkin Daycare playground removal and replacement. Blenkin Park wooden playground is an asset reaching the end of it's
useful life. Removal and replacement if desired is required within 1‐2 years.
Hoskyn wharf extension. Wharf at capacity during peak times and in dire need of expansion. Potential to apply for grant on
this project. Future consideration.
Granite Bay shoreline erosion work. Shoreline works are eroding and in need of repair.
Construction of pedestrian pathway along the Harper Rd sewer easement. Development of the trail is contained within the
2007 Q‐Cove Village Plan as identified through public consultation.
Acquisition of upland property and assignment of foreshore wharf licence. Property acquisition complete in 2018.
Subdivision and licence of occupation and wharf works to continue in 2020.
Requisition Allocation2019
Actual
2020
Budget
2021
Budget
2022
Budget
2023
Budget
2024
Budget
Electoral Area:
Area C 179,690$ 188,664$ 228,602$ 230,955$ 233,357$ 235,810$
TOTAL 179,690$ 188,664$ 228,602$ 230,955$ 233,357$ 235,810$
Change $ 8,974 39,938 2,353 2,402 2,453
Change % 5.0% 21.2% 1.0% 1.0% 1.1%
Tax Rate Estimate (Per $1,000) 0.1995 $ 0.1833 $ 0.2221 $ 0.2244 $ 0.2268 $ 0.2291 $
Maximum Requisition Limit 395,988 $ 463,052 $
153
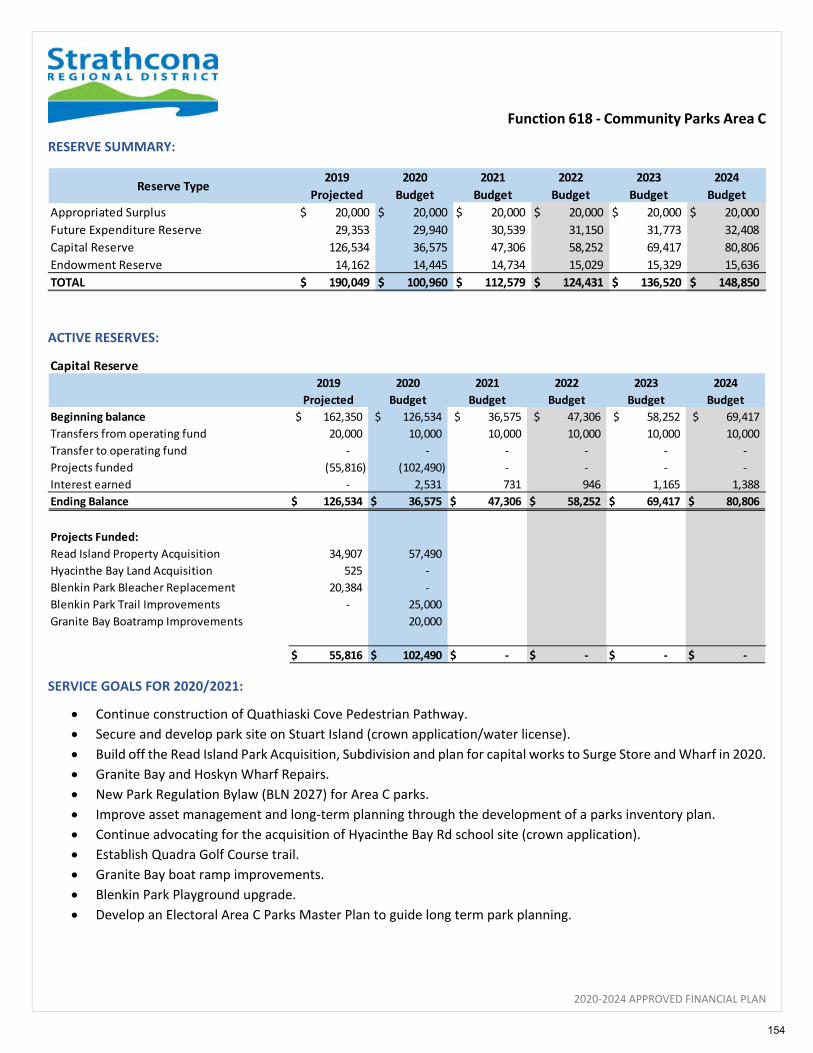
Function 618 ‐ Community Parks Area C
2020‐2024 APPROVED FINANCIAL PLAN
RESERVE SUMMARY:
ACTIVE RESERVES:
SERVICE GOALS FOR 2020/2021:
Continue construction of Quathiaski Cove Pedestrian Pathway.
Secure and develop park site on Stuart Island (crown application/water license).
Build off the Read Island Park Acquisition, Subdivision and plan for capital works to Surge Store and Wharf in 2020.
Granite Bay and Hoskyn Wharf Repairs.
New Park Regulation Bylaw (BLN 2027) for Area C parks.
Improve asset management and long‐term planning through the development of a parks inventory plan.
Continue advocating for the acquisition of Hyacinthe Bay Rd school site (crown application).
Establish Quadra Golf Course trail.
Granite Bay boat ramp improvements.
Blenkin Park Playground upgrade.
Develop an Electoral Area C Parks Master Plan to guide long term park planning.
Reserve Type2019
Projected
2020
Budget
2021
Budget
2022
Budget
2023
Budget
2024
Budget
Appropriated Surplus 20,000$ 20,000$ 20,000$ 20,000$ 20,000$ 20,000$
Future Expenditure Reserve 29,353 29,940 30,539 31,150 31,773 32,408
Capital Reserve 126,534 36,575 47,306 58,252 69,417 80,806
Endowment Reserve 14,162 14,445 14,734 15,029 15,329 15,636
TOTAL 190,049$ 100,960$ 112,579$ 124,431$ 136,520$ 148,850$
Capital Reserve
2019
Projected
2020
Budget
2021
Budget
2022
Budget
2023
Budget
2024
Budget
Beginning balance 162,350$ 126,534$ 36,575$ 47,306$ 58,252$ 69,417$
Transfers from operating fund 20,000 10,000 10,000 10,000 10,000 10,000
Transfer to operating fund ‐ ‐ ‐ ‐ ‐ ‐
Projects funded (55,816) (102,490) ‐ ‐ ‐ ‐
Interest earned ‐ 2,531 731 946 1,165 1,388
Ending Balance 126,534$ 36,575$ 47,306$ 58,252$ 69,417$ 80,806$
Projects Funded:
Read Island Property Acquisition 34,907 57,490
Hyacinthe Bay Land Acquisition 525 ‐
Blenkin Park Bleacher Replacement 20,384 ‐
Blenkin Park Trail Improvements ‐ 25,000
Granite Bay Boatramp Improvements 20,000
55,816$ 102,490$ ‐$ ‐$ ‐$ ‐$
154
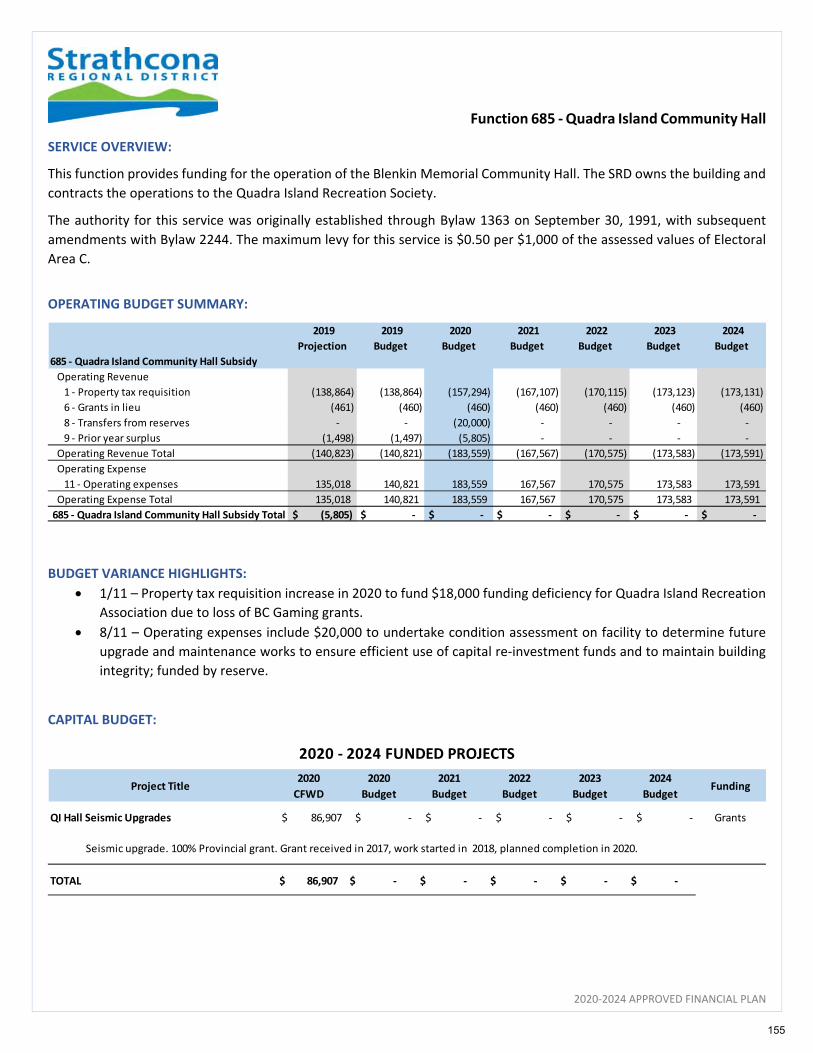
Function 685 ‐ Quadra Island Community Hall
2020‐2024 APPROVED FINANCIAL PLAN
SERVICE OVERVIEW:
This function provides funding for the operation of the Blenkin Memorial Community Hall. The SRD owns the building and
contracts the operations to the Quadra Island Recreation Society.
The authority for this service was originally established through Bylaw 1363 on September 30, 1991, with subsequent
amendments with Bylaw 2244. The maximum levy for this service is $0.50 per $1,000 of the assessed values of Electoral
Area C.
OPERATING BUDGET SUMMARY:
BUDGET VARIANCE HIGHLIGHTS:
1/11 – Property tax requisition increase in 2020 to fund $18,000 funding deficiency for Quadra Island Recreation
Association due to loss of BC Gaming grants.
8/11 – Operating expenses include $20,000 to undertake condition assessment on facility to determine future
upgrade and maintenance works to ensure efficient use of capital re‐investment funds and to maintain building
integrity; funded by reserve.
CAPITAL BUDGET:
2019
Projection
2019
Budget
2020
Budget
2021
Budget
2022
Budget
2023
Budget
2024
Budget
685 ‐ Quadra Island Community Hall Subsidy
Operating Revenue
1 ‐ Property tax requisition (138,864) (138,864) (157,294) (167,107) (170,115) (173,123) (173,131)
6 ‐ Grants in lieu (461) (460) (460) (460) (460) (460) (460)
8 ‐ Transfers from reserves ‐ ‐ (20,000) ‐ ‐ ‐ ‐
9 ‐ Prior year surplus (1,498) (1,497) (5,805) ‐ ‐ ‐ ‐
Operating Revenue Total (140,823) (140,821) (183,559) (167,567) (170,575) (173,583) (173,591)
Operating Expense
11 ‐ Operating expenses 135,018 140,821 183,559 167,567 170,575 173,583 173,591
Operating Expense Total 135,018 140,821 183,559 167,567 170,575 173,583 173,591
685 ‐ Quadra Island Community Hall Subsidy Total $ (5,805) $ ‐ $ ‐ $ ‐ $ ‐ $ ‐ $ ‐
Project Title2020
CFWD
2020
Budget
2021
Budget
2022
Budget
2023
Budget
2024
BudgetFunding
QI Hall Seismic Upgrades $ 86,907 $ ‐ $ ‐ $ ‐ $ ‐ $ ‐ Grants
TOTAL 86,907$ ‐$ ‐$ ‐$ ‐$ ‐$
2020 ‐ 2024 FUNDED PROJECTS
Seismic upgrade. 100% Provincial grant. Grant received in 2017, work started in 2018, planned completion in 2020.
155
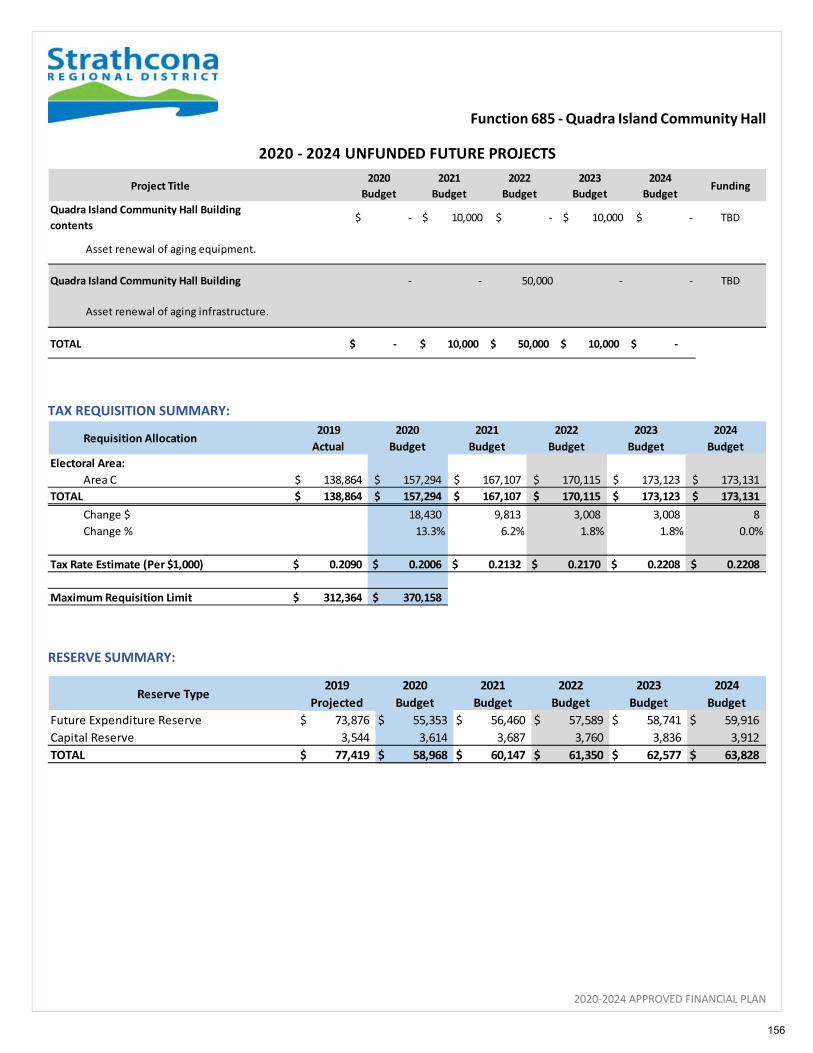
Function 685 ‐ Quadra Island Community Hall
2020‐2024 APPROVED FINANCIAL PLAN
TAX REQUISITION SUMMARY:
RESERVE SUMMARY:
Project Title2020
Budget
2021
Budget
2022
Budget
2023
Budget
2024
BudgetFunding
Quadra Island Community Hall Building
contents $ ‐ $ 10,000 $ ‐ $ 10,000 $ ‐ TBD
Asset renewal of aging equipment.
Quadra Island Community Hall Building ‐ ‐ 50,000 ‐ ‐ TBD
TOTAL ‐$ 10,000$ 50,000$ 10,000$ ‐$
Asset renewal of aging infrastructure.
2020 ‐ 2024 UNFUNDED FUTURE PROJECTS
Requisition Allocation2019
Actual
2020
Budget
2021
Budget
2022
Budget
2023
Budget
2024
Budget
Electoral Area:
Area C 138,864$ 157,294$ 167,107$ 170,115$ 173,123$ 173,131$
TOTAL 138,864$ 157,294$ 167,107$ 170,115$ 173,123$ 173,131$
Change $ 18,430 9,813 3,008 3,008 8
Change % 13.3% 6.2% 1.8% 1.8% 0.0%
Tax Rate Estimate (Per $1,000) 0.2090 $ 0.2006 $ 0.2132 $ 0.2170 $ 0.2208 $ 0.2208 $
Maximum Requisition Limit 312,364 $ 370,158 $
Reserve Type2019
Projected
2020
Budget
2021
Budget
2022
Budget
2023
Budget
2024
Budget
Future Expenditure Reserve 73,876$ 55,353$ 56,460$ 57,589$ 58,741$ 59,916$
Capital Reserve 3,544 3,614 3,687 3,760 3,836 3,912
TOTAL 77,419$ 58,968$ 60,147$ 61,350$ 62,577$ 63,828$
156
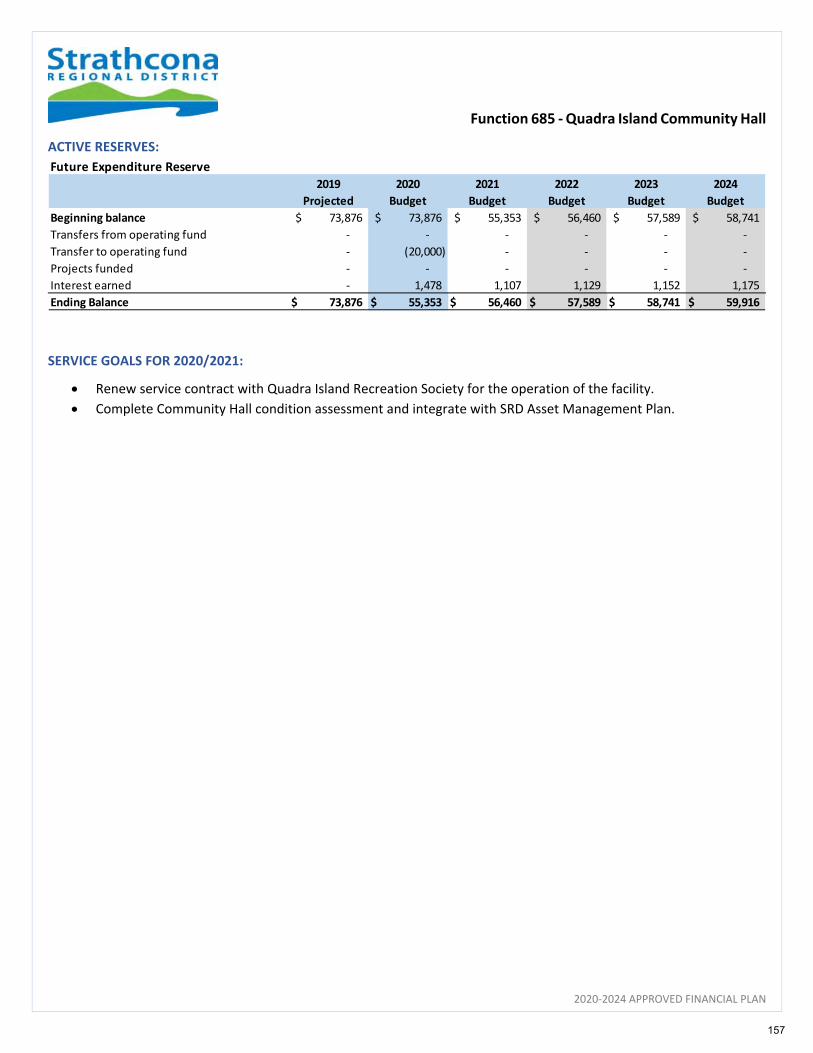
Function 685 ‐ Quadra Island Community Hall
2020‐2024 APPROVED FINANCIAL PLAN
ACTIVE RESERVES:
SERVICE GOALS FOR 2020/2021:
Renew service contract with Quadra Island Recreation Society for the operation of the facility.
Complete Community Hall condition assessment and integrate with SRD Asset Management Plan.
Future Expenditure Reserve
2019
Projected
2020
Budget
2021
Budget
2022
Budget
2023
Budget
2024
Budget
Beginning balance 73,876$ 73,876$ 55,353$ 56,460$ 57,589$ 58,741$
Transfers from operating fund ‐ ‐ ‐ ‐ ‐ ‐
Transfer to operating fund ‐ (20,000) ‐ ‐ ‐ ‐
Projects funded ‐ ‐ ‐ ‐ ‐ ‐
Interest earned ‐ 1,478 1,107 1,129 1,152 1,175
Ending Balance 73,876$ 55,353$ 56,460$ 57,589$ 58,741$ 59,916$
157
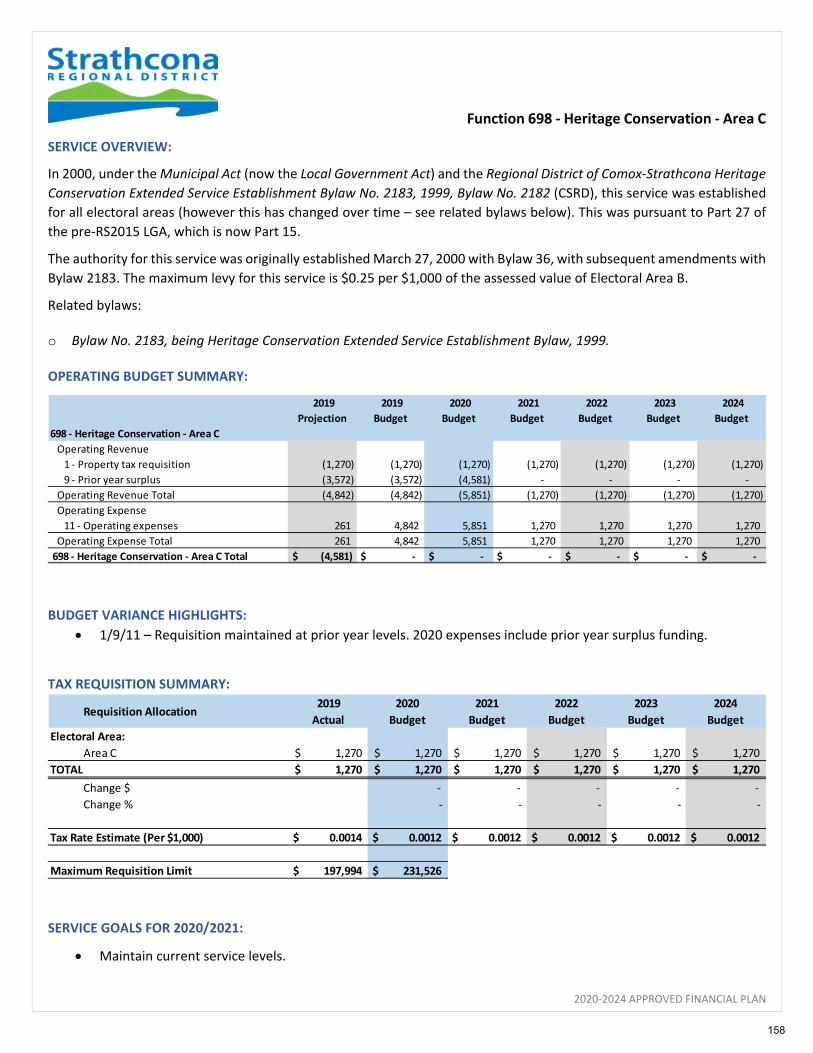
Function 698 ‐ Heritage Conservation ‐ Area C
2020‐2024 APPROVED FINANCIAL PLAN
SERVICE OVERVIEW:
In 2000, under the Municipal Act (now the Local Government Act) and the Regional District of Comox‐Strathcona Heritage
Conservation Extended Service Establishment Bylaw No. 2183, 1999, Bylaw No. 2182 (CSRD), this service was established
for all electoral areas (however this has changed over time – see related bylaws below). This was pursuant to Part 27 of
the pre‐RS2015 LGA, which is now Part 15.
The authority for this service was originally established March 27, 2000 with Bylaw 36, with subsequent amendments with
Bylaw 2183. The maximum levy for this service is $0.25 per $1,000 of the assessed value of Electoral Area B.
Related bylaws:
o Bylaw No. 2183, being Heritage Conservation Extended Service Establishment Bylaw, 1999. OPERATING BUDGET SUMMARY:
BUDGET VARIANCE HIGHLIGHTS:
1/9/11 – Requisition maintained at prior year levels. 2020 expenses include prior year surplus funding.
TAX REQUISITION SUMMARY:
SERVICE GOALS FOR 2020/2021:
Maintain current service levels.
2019
Projection
2019
Budget
2020
Budget
2021
Budget
2022
Budget
2023
Budget
2024
Budget
698 ‐ Heritage Conservation ‐ Area C
Operating Revenue
1 ‐ Property tax requisition (1,270) (1,270) (1,270) (1,270) (1,270) (1,270) (1,270)
9 ‐ Prior year surplus (3,572) (3,572) (4,581) ‐ ‐ ‐ ‐
Operating Revenue Total (4,842) (4,842) (5,851) (1,270) (1,270) (1,270) (1,270)
Operating Expense
11 ‐ Operating expenses 261 4,842 5,851 1,270 1,270 1,270 1,270
Operating Expense Total 261 4,842 5,851 1,270 1,270 1,270 1,270
698 ‐ Heritage Conservation ‐ Area C Total $ (4,581) $ ‐ $ ‐ $ ‐ $ ‐ $ ‐ $ ‐
Requisition Allocation2019
Actual
2020
Budget
2021
Budget
2022
Budget
2023
Budget
2024
Budget
Electoral Area:
Area C 1,270$ 1,270$ 1,270$ 1,270$ 1,270$ 1,270$
TOTAL 1,270$ 1,270$ 1,270$ 1,270$ 1,270$ 1,270$
Change $ ‐ ‐ ‐ ‐ ‐
Change % ‐ ‐ ‐ ‐ ‐
Tax Rate Estimate (Per $1,000) 0.0014 $ 0.0012 $ 0.0012 $ 0.0012 $ 0.0012 $ 0.0012 $
Maximum Requisition Limit 197,994 $ 231,526 $
158
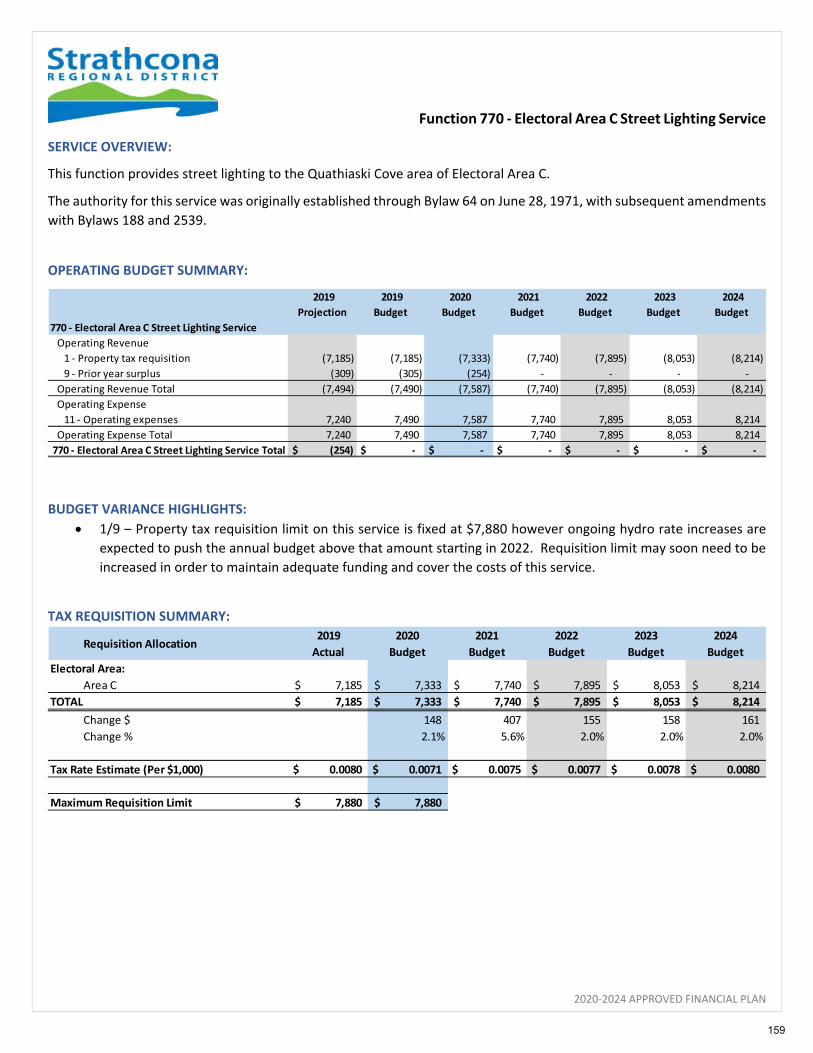
Function 770 ‐ Electoral Area C Street Lighting Service
2020‐2024 APPROVED FINANCIAL PLAN
SERVICE OVERVIEW:
This function provides street lighting to the Quathiaski Cove area of Electoral Area C.
The authority for this service was originally established through Bylaw 64 on June 28, 1971, with subsequent amendments
with Bylaws 188 and 2539.
OPERATING BUDGET SUMMARY:
BUDGET VARIANCE HIGHLIGHTS:
1/9 – Property tax requisition limit on this service is fixed at $7,880 however ongoing hydro rate increases are
expected to push the annual budget above that amount starting in 2022. Requisition limit may soon need to be
increased in order to maintain adequate funding and cover the costs of this service.
TAX REQUISITION SUMMARY:
2019
Projection
2019
Budget
2020
Budget
2021
Budget
2022
Budget
2023
Budget
2024
Budget
770 ‐ Electoral Area C Street Lighting Service
Operating Revenue
1 ‐ Property tax requisition (7,185) (7,185) (7,333) (7,740) (7,895) (8,053) (8,214)
9 ‐ Prior year surplus (309) (305) (254) ‐ ‐ ‐ ‐
Operating Revenue Total (7,494) (7,490) (7,587) (7,740) (7,895) (8,053) (8,214)
Operating Expense
11 ‐ Operating expenses 7,240 7,490 7,587 7,740 7,895 8,053 8,214
Operating Expense Total 7,240 7,490 7,587 7,740 7,895 8,053 8,214
770 ‐ Electoral Area C Street Lighting Service Total $ (254) $ ‐ $ ‐ $ ‐ $ ‐ $ ‐ $ ‐
Requisition Allocation2019
Actual
2020
Budget
2021
Budget
2022
Budget
2023
Budget
2024
Budget
Electoral Area:
Area C 7,185$ 7,333$ 7,740$ 7,895$ 8,053$ 8,214$
TOTAL 7,185$ 7,333$ 7,740$ 7,895$ 8,053$ 8,214$
Change $ 148 407 155 158 161
Change % 2.1% 5.6% 2.0% 2.0% 2.0%
Tax Rate Estimate (Per $1,000) 0.0080 $ 0.0071 $ 0.0075 $ 0.0077 $ 0.0078 $ 0.0080 $
Maximum Requisition Limit 7,880 $ 7,880 $
159
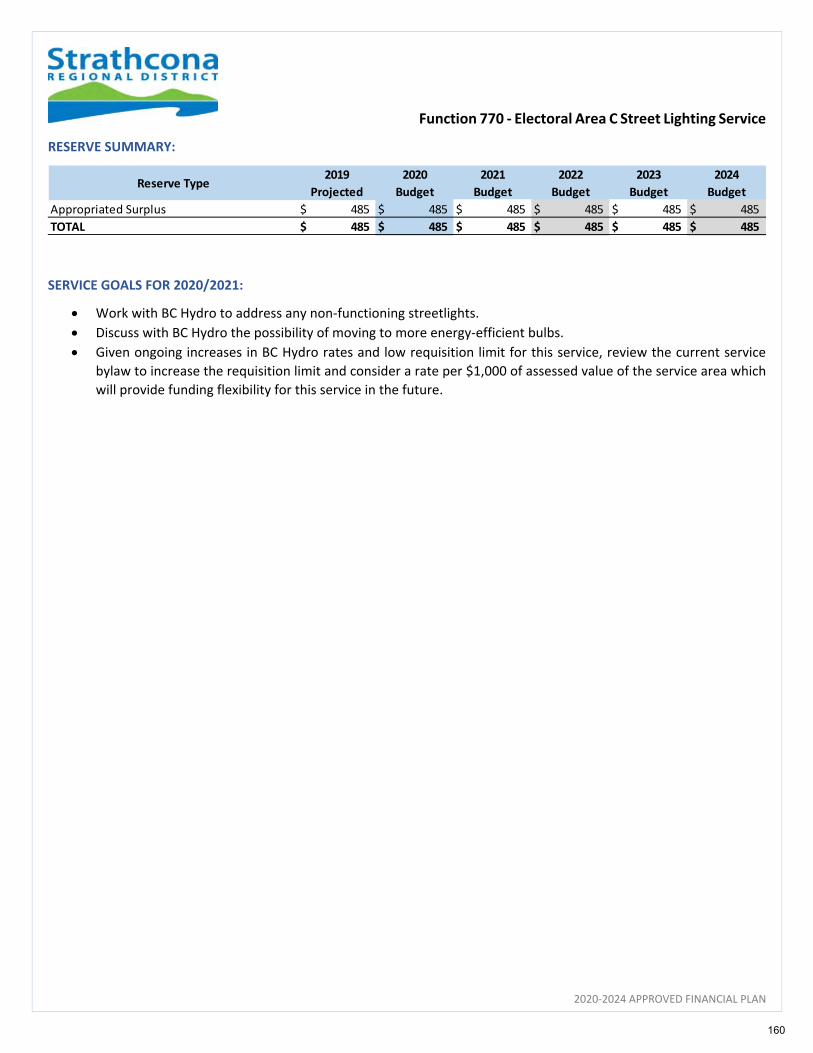
Function 770 ‐ Electoral Area C Street Lighting Service
2020‐2024 APPROVED FINANCIAL PLAN
RESERVE SUMMARY:
SERVICE GOALS FOR 2020/2021:
Work with BC Hydro to address any non‐functioning streetlights.
Discuss with BC Hydro the possibility of moving to more energy‐efficient bulbs.
Given ongoing increases in BC Hydro rates and low requisition limit for this service, review the current service
bylaw to increase the requisition limit and consider a rate per $1,000 of assessed value of the service area which
will provide funding flexibility for this service in the future.
Reserve Type2019
Projected
2020
Budget
2021
Budget
2022
Budget
2023
Budget
2024
Budget
Appropriated Surplus 485$ 485$ 485$ 485$ 485$ 485$
TOTAL 485$ 485$ 485$ 485$ 485$ 485$
160
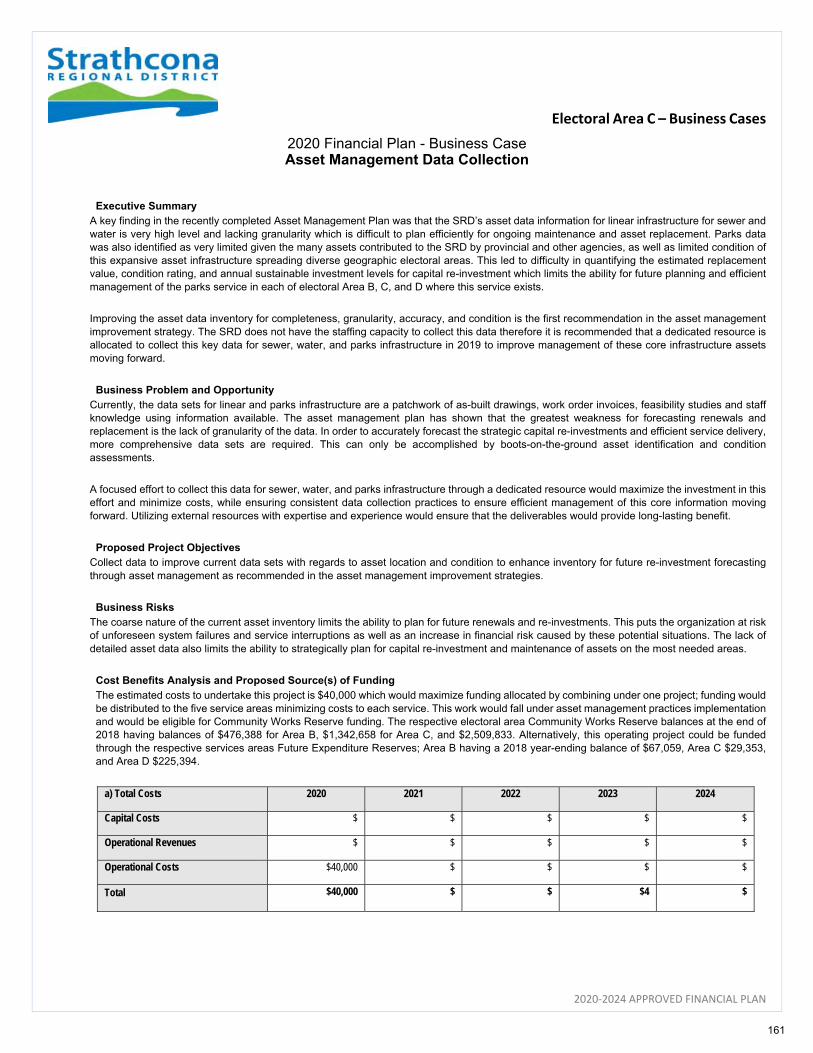
Electoral Area C – Business Cases
2020‐2024 APPROVED FINANCIAL PLAN
2020 Financial Plan - Business Case Asset Management Data Collection
Executive Summary A key finding in the recently completed Asset Management Plan was that the SRD’s asset data information for linear infrastructure for sewer and water is very high level and lacking granularity which is difficult to plan efficiently for ongoing maintenance and asset replacement. Parks data was also identified as very limited given the many assets contributed to the SRD by provincial and other agencies, as well as limited condition of this expansive asset infrastructure spreading diverse geographic electoral areas. This led to difficulty in quantifying the estimated replacement value, condition rating, and annual sustainable investment levels for capital re-investment which limits the ability for future planning and efficient management of the parks service in each of electoral Area B, C, and D where this service exists.
Improving the asset data inventory for completeness, granularity, accuracy, and condition is the first recommendation in the asset management improvement strategy. The SRD does not have the staffing capacity to collect this data therefore it is recommended that a dedicated resource is allocated to collect this key data for sewer, water, and parks infrastructure in 2019 to improve management of these core infrastructure assets moving forward.
Business Problem and Opportunity
Currently, the data sets for linear and parks infrastructure are a patchwork of as-built drawings, work order invoices, feasibility studies and staff knowledge using information available. The asset management plan has shown that the greatest weakness for forecasting renewals and replacement is the lack of granularity of the data. In order to accurately forecast the strategic capital re-investments and efficient service delivery, more comprehensive data sets are required. This can only be accomplished by boots-on-the-ground asset identification and condition assessments.
A focused effort to collect this data for sewer, water, and parks infrastructure through a dedicated resource would maximize the investment in this effort and minimize costs, while ensuring consistent data collection practices to ensure efficient management of this core information moving forward. Utilizing external resources with expertise and experience would ensure that the deliverables would provide long-lasting benefit.
Proposed Project Objectives Collect data to improve current data sets with regards to asset location and condition to enhance inventory for future re-investment forecasting through asset management as recommended in the asset management improvement strategies.
Business Risks
The coarse nature of the current asset inventory limits the ability to plan for future renewals and re-investments. This puts the organization at risk of unforeseen system failures and service interruptions as well as an increase in financial risk caused by these potential situations. The lack of detailed asset data also limits the ability to strategically plan for capital re-investment and maintenance of assets on the most needed areas.
Cost Benefits Analysis and Proposed Source(s) of Funding
The estimated costs to undertake this project is $40,000 which would maximize funding allocated by combining under one project; funding would be distributed to the five service areas minimizing costs to each service. This work would fall under asset management practices implementation and would be eligible for Community Works Reserve funding. The respective electoral area Community Works Reserve balances at the end of 2018 having balances of $476,388 for Area B, $1,342,658 for Area C, and $2,509,833. Alternatively, this operating project could be funded through the respective services areas Future Expenditure Reserves; Area B having a 2018 year-ending balance of $67,059, Area C $29,353, and Area D $225,394.
a) Total Costs 2020 2021 2022 2023 2024
Capital Costs $ $ $ $ $
Operational Revenues $ $ $ $ $
Operational Costs $40,000 $ $ $ $
Total $40,000 $ $ $4 $
161

Electoral Area C – Business Cases
2020‐2024 APPROVED FINANCIAL PLAN
2020 Financial Plan - Business Case Asset Management Data Collection
b) Benefits
Tangible Benefits Completed asset inventory and data sets for core infrastructure, enhancing service management practices.
Intangible Benefits Ensures sustainable service delivery and efficient use of available resources.
Summary Recommendation
THAT the 2020-2024 Financial Plan includes $8,000 in operational funding for asset management data collection for Area B parks service, to be funded from Electoral Area B Community Works (Gas Tax) Reserve.
THAT the 2020-2024 Financial Plan includes $8,000 in operational funding for asset management data collection for Area C parks service and $8,000 for the Quathiaski Cove sewer service, for a total of $16,000 to be funded from Electoral Area C Community Works (Gas Tax) Reserve. THAT the 2020-2024 Financial Plan includes $8,000 in operational funding for asset management data collection for Area D parks service and $8,000 for the Area D water service, for a total of $16,000 to be funded from Electoral Area D Community Works (Gas Tax) Reserve.
162
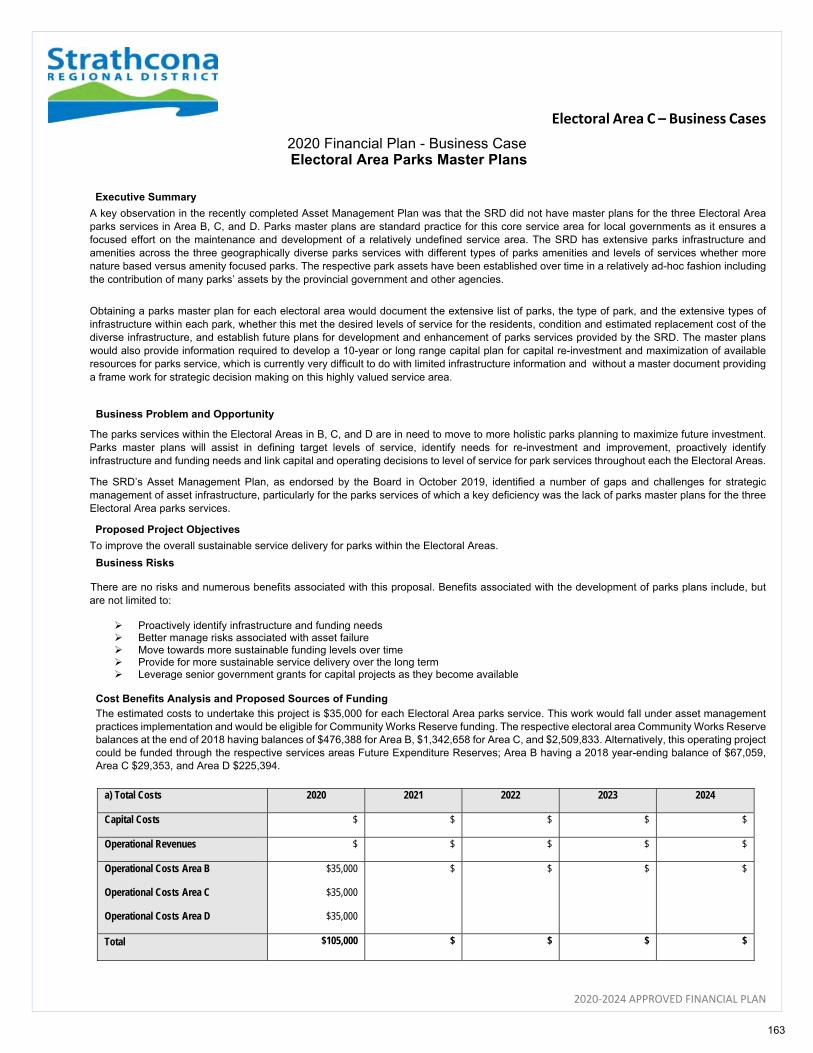
Electoral Area C – Business Cases
2020‐2024 APPROVED FINANCIAL PLAN
2020 Financial Plan - Business Case Electoral Area Parks Master Plans
Executive Summary
A key observation in the recently completed Asset Management Plan was that the SRD did not have master plans for the three Electoral Area parks services in Area B, C, and D. Parks master plans are standard practice for this core service area for local governments as it ensures a focused effort on the maintenance and development of a relatively undefined service area. The SRD has extensive parks infrastructure and amenities across the three geographically diverse parks services with different types of parks amenities and levels of services whether more nature based versus amenity focused parks. The respective park assets have been established over time in a relatively ad-hoc fashion including the contribution of many parks’ assets by the provincial government and other agencies.
Obtaining a parks master plan for each electoral area would document the extensive list of parks, the type of park, and the extensive types of infrastructure within each park, whether this met the desired levels of service for the residents, condition and estimated replacement cost of the diverse infrastructure, and establish future plans for development and enhancement of parks services provided by the SRD. The master plans would also provide information required to develop a 10-year or long range capital plan for capital re-investment and maximization of available resources for parks service, which is currently very difficult to do with limited infrastructure information and without a master document providing a frame work for strategic decision making on this highly valued service area.
Business Problem and Opportunity
The parks services within the Electoral Areas in B, C, and D are in need to move to more holistic parks planning to maximize future investment. Parks master plans will assist in defining target levels of service, identify needs for re-investment and improvement, proactively identify infrastructure and funding needs and link capital and operating decisions to level of service for park services throughout each the Electoral Areas.
The SRD’s Asset Management Plan, as endorsed by the Board in October 2019, identified a number of gaps and challenges for strategic management of asset infrastructure, particularly for the parks services of which a key deficiency was the lack of parks master plans for the three Electoral Area parks services.
Proposed Project Objectives
To improve the overall sustainable service delivery for parks within the Electoral Areas.
Business Risks
There are no risks and numerous benefits associated with this proposal. Benefits associated with the development of parks plans include, but are not limited to:
Proactively identify infrastructure and funding needs Better manage risks associated with asset failure Move towards more sustainable funding levels over time Provide for more sustainable service delivery over the long term Leverage senior government grants for capital projects as they become available
Cost Benefits Analysis and Proposed Sources of Funding
The estimated costs to undertake this project is $35,000 for each Electoral Area parks service. This work would fall under asset management practices implementation and would be eligible for Community Works Reserve funding. The respective electoral area Community Works Reserve balances at the end of 2018 having balances of $476,388 for Area B, $1,342,658 for Area C, and $2,509,833. Alternatively, this operating project could be funded through the respective services areas Future Expenditure Reserves; Area B having a 2018 year-ending balance of $67,059, Area C $29,353, and Area D $225,394.
a) Total Costs 2020 2021 2022 2023 2024
Capital Costs $ $ $ $ $
Operational Revenues $ $ $ $ $
Operational Costs Area B
Operational Costs Area C
Operational Costs Area D
$35,000
$35,000
$35,000
$ $ $ $
Total $105,000 $ $ $ $
163
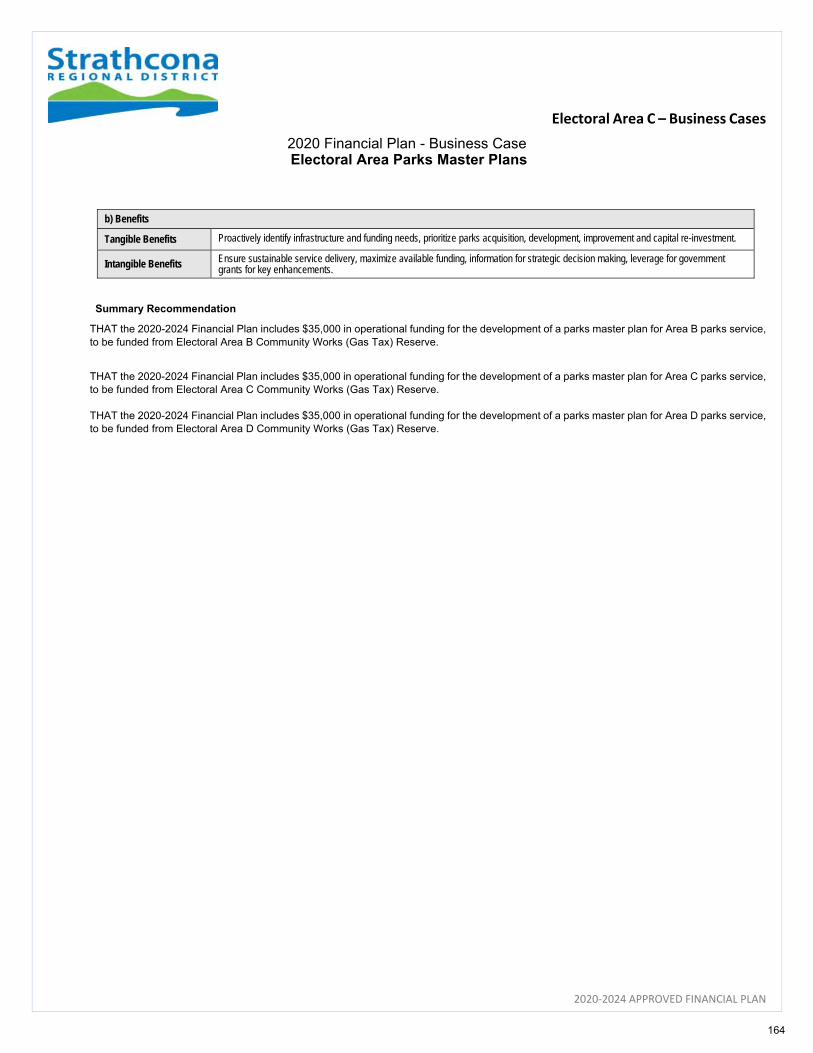
Electoral Area C – Business Cases
2020‐2024 APPROVED FINANCIAL PLAN
2020 Financial Plan - Business Case Electoral Area Parks Master Plans
b) Benefits
Tangible Benefits Proactively identify infrastructure and funding needs, prioritize parks acquisition, development, improvement and capital re-investment.
Intangible Benefits Ensure sustainable service delivery, maximize available funding, information for strategic decision making, leverage for government grants for key enhancements.
Summary Recommendation
THAT the 2020-2024 Financial Plan includes $35,000 in operational funding for the development of a parks master plan for Area B parks service, to be funded from Electoral Area B Community Works (Gas Tax) Reserve.
THAT the 2020-2024 Financial Plan includes $35,000 in operational funding for the development of a parks master plan for Area C parks service, to be funded from Electoral Area C Community Works (Gas Tax) Reserve. THAT the 2020-2024 Financial Plan includes $35,000 in operational funding for the development of a parks master plan for Area D parks service, to be funded from Electoral Area D Community Works (Gas Tax) Reserve.
164

Electoral Area C – Business Cases
2020‐2024 APPROVED FINANCIAL PLAN
2020 Financial Plan - Business Case Quadra Island Community Hall Condition Assessment
Executive Summary
In order to ensure sustainable service delivery for tis key community facility, a condition assessment on the current state of core building components of the Quadra Island Community Centre to be used for building a 10-year capital re-investment plan to maintain building integrity in accordance to the SRD Asset Management Plan is recommended.
Business Problem and Opportunity
The Quadra Island Community Hall is an important asset for Area C and the SRD. It is well maintained and has received numerous upgrades in its life.
The SRD’s Asset Management Plan recommends improving the SRD’s understanding of its assets so that core upgrades to maintain infrastructure can be planned for in advance of any asset failures and escalating costs for repairs. This is accomplished through improving asset inventory of core asset components and conducting condition assessments. A thorough condition assessment would provide the SRD with an asset register and precise information to use in the development of a 10-year capital re-investment plan which would maximize available funding to maintain this facility.
Proposed Project Objectives Assessment of the current condition on all SRD assets which includes the Quadra Island Community Hall.
Compile asset condition on facility components to develop 10-year capital re-investment plan that maximizes available funding for maintaining this core community facility.
Business Risks
There are no risks associated with this project.
Cost Benefits Analysis and Proposed Source(s) of Funding
The proposed funding source for this one-time project is the Future Expenditure Reserve for this service, which had a $73,875 balance at the end of 2018. Funding from reserve is an appropriate use of funding for one-time projects, which does not impact the annual requisition for this service.
a) Total Costs 2020 2021 2022 2023 2024
Capital Costs $ $ $ $ $
Operational Revenues $ $ $ $ $
Operational Costs $20,000 $ $ $ $
Total $20,000 $ $ $ $
Summary Recommendation
THAT the 2020-2024 Financial Plan includes $20,000 in funding for the Quadra Island Community Hall Condition Assessment, to be funded from the Quadra Island Community Hall Future Expenditure Reserve.
b) Benefits
Tangible Benefits Populate asset register for condition of core building components to maximize available funding for capital re-investment.
Intangible Benefits Data can be used to determine future capital work and minimize potential emergent and costly repairs.
165
Electoral Area C
2020‐2024 APPROVED FINANCIAL PLAN
166
2020‐2024 APPROVED FINANCIAL PLAN
Electoral Area D Oyster Bay ‐ Buttle Lake
Electoral Area D of the Strathcona Regional District (SRD) covers just under 1,850 square kilometres. The area runs from Jubilee Parkway to the Oyster River and east into Strathcona Provincial Park.
Within this vibrant and beautiful area there is an abundance of recreational opportunities, ranging from swimming potholes, waterfall adventures and beautiful ocean beaches to miles of mountain bike and hiking trails, wildlife viewing and water sports such as kayaking, boating and fishing.
FINANCIAL PLAN
2020 – 2024
Rebecca Spit, Quadra Island
167

Electoral Area D Summary
2020‐2024 APPROVED FINANCIAL PLAN
Electoral Area D includes the following functions:
Function # ‐ Function Description
123 ‐ Grant In Aid Area D
154 ‐ Feasibility Studies ‐ Electoral Area D
210 ‐ Campbell River Fire Protection
285 ‐ Building Inspection
290 ‐ Electoral Area D Animal Control
295 ‐ Noise Control
297 ‐ Soil Deposit & Removal Control
298 ‐ Unsightly Premises
318 ‐ Craig Road Water
319 ‐ Electoral Area D Water
533 ‐ House Numbering Area D
614 ‐ Community Parks Area D
750 ‐ Electoral Area D Street Lighting Service
785 ‐ Transit ‐ Area D
790 ‐ Oyster River Bank Protection
168

Electoral Area D – At a Glance
2020‐2024 APPROVED FINANCIAL PLAN
$15.14
$26.21
$(170.13)
$(1.62)
$(3.80)
$(2.12)
$(0.17)
$25.60
$0.64
$1.77
$1.05
$13.96
$(0.88)
$(0.29)
$(0.79)
$(0.78)
$2.07
$(0.01)
$(0.62)
$0.01
$(0.00)
$(0.04)
$0.00
$0.02
$0.00
$(150.00) $(50.00) $50.00 $150.00 $250.00 $350.00 $450.00
319 ‐ Electoral Area D Water ^
210 ‐ Campbell River Fire Protection ^
790 ‐ Oyster River Bank Protection ^
640 ‐ Strathcona Gardens
500 ‐ Planning
630 ‐ Vancouver Island Regional Library
614 ‐ Community Parks Area D
130 ‐ Electoral Area Administration
785 ‐ Transit ‐ Area D
750 ‐ Electoral Area D Street Lighting Service ^
110 ‐ Administration ‐ General Government
285 ‐ Building Inspection
123 ‐ Grant In Aid Area D
275 ‐ 911 Answering Service
149 ‐ Regional Broadband
272 ‐ Strathcona Emergency Program
290 ‐ Electoral Area D Animal Control
340 ‐ Liquid Waste
150 ‐ Feasibility Studies ‐ Regional
533 ‐ House Numbering Area D
298 ‐ Unsightly Premises
297 ‐ Soil Deposit & Removal Control
154 ‐ Feasibility Studies ‐ Electoral Area D
295 ‐ Noise Control
510 ‐ Planning (Non Part 26)
2019 2020 Change
$459,176
$‐
$50,000
$100,000
$150,000
$200,000
$250,000
$300,000
$350,000
$400,000
$450,000
$500,000
2016 2017 2018 2019 2020
Average Home Value(Source:Completed Roll General Purpose Hospital Assessments)
^ denotes specified area Note: Function 790 only affects 35
properties; amount excluded from
all totals.
General Government
13%Protective Services
21%
Environ. Health17%
Development8%
Other1%
Recreation & Culture34%
Transportation6%
Tax Distribution for an Average Assessed Home
2019 ‐ 2020 Change
$75.36 per Home
[$16.41 per $100K]
Impact of Assessment Shift:
($37.10)
Impact of EA Business Cases:
$4.33 Bylaw Hours
Estimated Requisition Cost per Average Household is $1,719.03 for 2020. [2019 = $1,643.67]
169
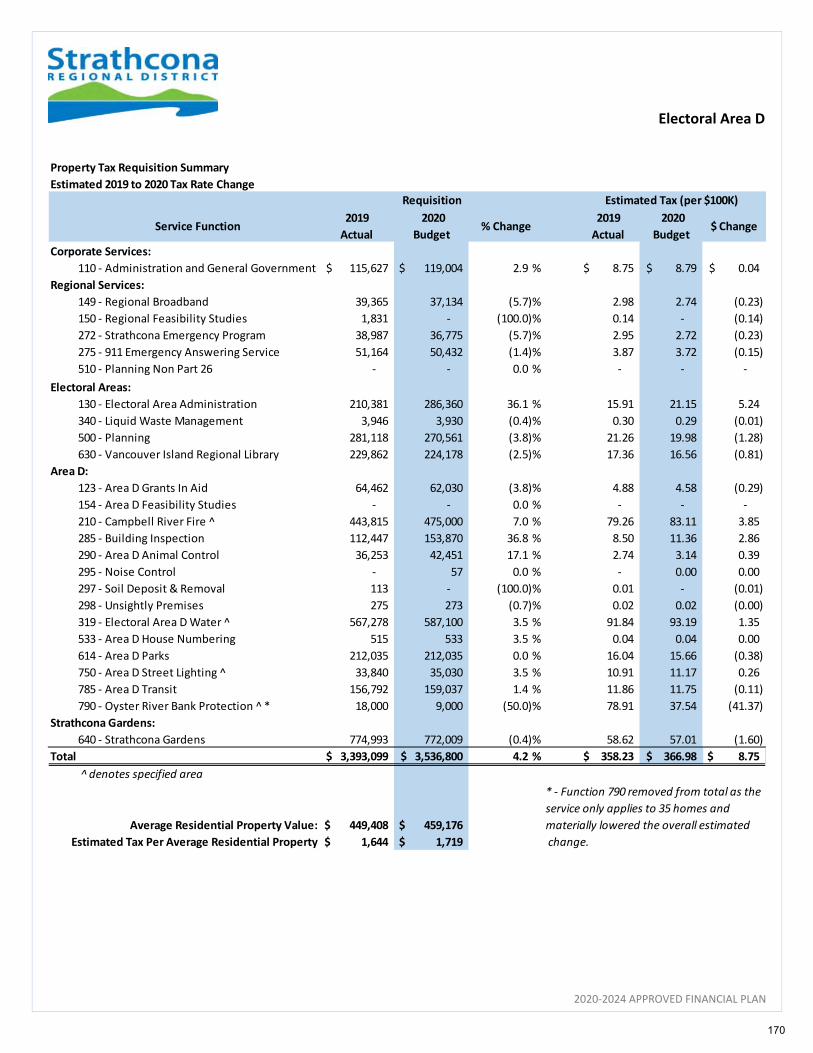
Electoral Area D
2020‐2024 APPROVED FINANCIAL PLAN
Property Tax Requisition Summary
Estimated 2019 to 2020 Tax Rate Change
Service Function2019
Actual
2020
Budget % Change
2019
Actual
2020
Budget $ Change
Corporate Services:
110 ‐ Administration and General Government 115,627$ 119,004 $ 2.9 % 8.75$ 8.79$ 0.04$
Regional Services:
149 ‐ Regional Broadband 39,365 37,134 (5.7)% 2.98 2.74 (0.23)
150 ‐ Regional Feasibility Studies 1,831 ‐ (100.0)% 0.14 ‐ (0.14)
272 ‐ Strathcona Emergency Program 38,987 36,775 (5.7)% 2.95 2.72 (0.23)
275 ‐ 911 Emergency Answering Service 51,164 50,432 (1.4)% 3.87 3.72 (0.15)
510 ‐ Planning Non Part 26 ‐ ‐ 0.0 % ‐ ‐ ‐
Electoral Areas:
130 ‐ Electoral Area Administration 210,381 286,360 36.1 % 15.91 21.15 5.24
340 ‐ Liquid Waste Management 3,946 3,930 (0.4)% 0.30 0.29 (0.01)
500 ‐ Planning 281,118 270,561 (3.8)% 21.26 19.98 (1.28)
630 ‐ Vancouver Island Regional Library 229,862 224,178 (2.5)% 17.36 16.56 (0.81)
Area D:
123 ‐ Area D Grants In Aid 64,462 62,030 (3.8)% 4.88 4.58 (0.29)
154 ‐ Area D Feasibility Studies ‐ ‐ 0.0 % ‐ ‐ ‐
210 ‐ Campbell River Fire ^ 443,815 475,000 7.0 % 79.26 83.11 3.85
285 ‐ Building Inspection 112,447 153,870 36.8 % 8.50 11.36 2.86
290 ‐ Area D Animal Control 36,253 42,451 17.1 % 2.74 3.14 0.39
295 ‐ Noise Control ‐ 57 0.0 % ‐ 0.00 0.00
297 ‐ Soil Deposit & Removal 113 ‐ (100.0)% 0.01 ‐ (0.01)
298 ‐ Unsightly Premises 275 273 (0.7)% 0.02 0.02 (0.00)
319 ‐ Electoral Area D Water ^ 567,278 587,100 3.5 % 91.84 93.19 1.35
533 ‐ Area D House Numbering 515 533 3.5 % 0.04 0.04 0.00
614 ‐ Area D Parks 212,035 212,035 0.0 % 16.04 15.66 (0.38)
750 ‐ Area D Street Lighting ^ 33,840 35,030 3.5 % 10.91 11.17 0.26
785 ‐ Area D Transit 156,792 159,037 1.4 % 11.86 11.75 (0.11)
790 ‐ Oyster River Bank Protection ^ * 18,000 9,000 (50.0)% 78.91 37.54 (41.37)
Strathcona Gardens:
640 ‐ Strathcona Gardens 774,993 772,009 (0.4)% 58.62 57.01 (1.60)
Total 3,393,099$ 3,536,800$ 4.2 % 358.23$ 366.98$ 8.75 $
̂denotes specified area
* ‐ Function 790 removed from total as the
service only applies to 35 homes and
Average Residential Property Value: 449,408 $ 459,176 $ materially lowered the overall estimated
Estimated Tax Per Average Residential Property 1,644 $ 1,719 $ change.
Estimated Tax (per $100K)Requisition
170
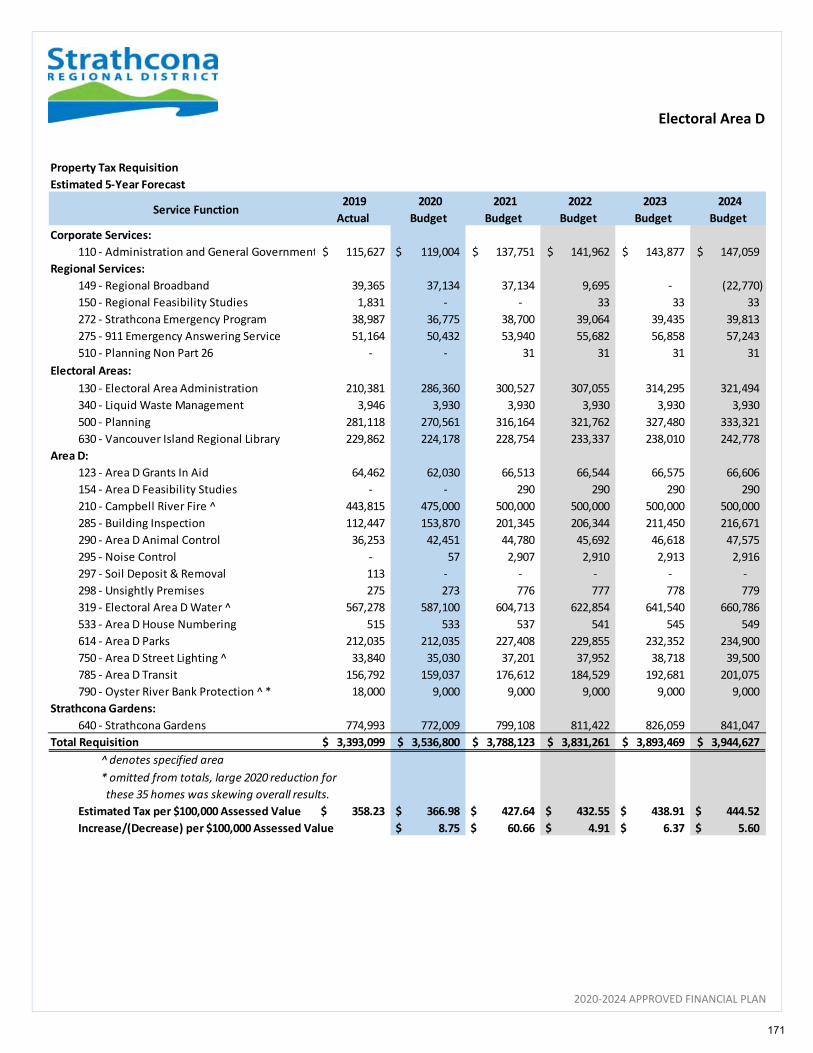
Electoral Area D
2020‐2024 APPROVED FINANCIAL PLAN
Property Tax Requisition
Estimated 5‐Year Forecast
Service Function 2019
Actual
2020
Budget
2021
Budget
2022
Budget
2023
Budget
2024
Budget
Corporate Services:
110 ‐ Administration and General Government 115,627$ 119,004 $ 137,751$ 141,962$ 143,877$ 147,059$
Regional Services:
149 ‐ Regional Broadband 39,365 37,134 37,134 9,695 ‐ (22,770)
150 ‐ Regional Feasibility Studies 1,831 ‐ ‐ 33 33 33
272 ‐ Strathcona Emergency Program 38,987 36,775 38,700 39,064 39,435 39,813
275 ‐ 911 Emergency Answering Service 51,164 50,432 53,940 55,682 56,858 57,243
510 ‐ Planning Non Part 26 ‐ ‐ 31 31 31 31
Electoral Areas:
130 ‐ Electoral Area Administration 210,381 286,360 300,527 307,055 314,295 321,494
340 ‐ Liquid Waste Management 3,946 3,930 3,930 3,930 3,930 3,930
500 ‐ Planning 281,118 270,561 316,164 321,762 327,480 333,321
630 ‐ Vancouver Island Regional Library 229,862 224,178 228,754 233,337 238,010 242,778
Area D:
123 ‐ Area D Grants In Aid 64,462 62,030 66,513 66,544 66,575 66,606
154 ‐ Area D Feasibility Studies ‐ ‐ 290 290 290 290
210 ‐ Campbell River Fire ^ 443,815 475,000 500,000 500,000 500,000 500,000
285 ‐ Building Inspection 112,447 153,870 201,345 206,344 211,450 216,671
290 ‐ Area D Animal Control 36,253 42,451 44,780 45,692 46,618 47,575
295 ‐ Noise Control ‐ 57 2,907 2,910 2,913 2,916
297 ‐ Soil Deposit & Removal 113 ‐ ‐ ‐ ‐ ‐
298 ‐ Unsightly Premises 275 273 776 777 778 779
319 ‐ Electoral Area D Water ^ 567,278 587,100 604,713 622,854 641,540 660,786
533 ‐ Area D House Numbering 515 533 537 541 545 549
614 ‐ Area D Parks 212,035 212,035 227,408 229,855 232,352 234,900
750 ‐ Area D Street Lighting ^ 33,840 35,030 37,201 37,952 38,718 39,500
785 ‐ Area D Transit 156,792 159,037 176,612 184,529 192,681 201,075
790 ‐ Oyster River Bank Protection ^ * 18,000 9,000 9,000 9,000 9,000 9,000
Strathcona Gardens:
640 ‐ Strathcona Gardens 774,993 772,009 799,108 811,422 826,059 841,047
Total Requisition 3,393,099$ 3,536,800$ 3,788,123$ 3,831,261$ 3,893,469$ 3,944,627$
^ denotes specified area
* omitted from totals, large 2020 reduction for
these 35 homes was skewing overall results.
Estimated Tax per $100,000 Assessed Value 358.23 $ 366.98 $ 427.64 $ 432.55 $ 438.91 $ 444.52 $
Increase/(Decrease) per $100,000 Assessed Value 8.75 $ 60.66 $ 4.91 $ 6.37 $ 5.60 $
171

Function 123 ‐ Grant In Aid Area D
2020‐2024 APPROVED FINANCIAL PLAN
SERVICE OVERVIEW:
The purpose of this service is to provide financial resources that can be awarded for assistance to registered non‐profit
and other organizations to provide programs and services that serve the local community or provide a regional benefit.
Proposals for funding from this program are brought forward by the electoral area director and are decided on by the
Board. The authority for this service is provided through the Local Government Act, section 263(1)(c).
The total amount of financial assistance provided in any calendar year cannot exceed $0.10 per $1,000 of the assessed
value in the region.
OPERATING BUDGET SUMMARY:
BUDGET VARIANCE HIGHLIGHTS:
1/9 – Projected 2019 surplus reducing property tax requisition slightly for 2020.
11 – Budget for grants in aid maintained at $65,000, as requested by the Electoral Area Director.
TAX REQUISITION SUMMARY:
SERVICE GOALS FOR 2020/2021:
Process and application improvements for organizations requesting a grant in aid.
2019
Projection
2019
Budget
2020
Budget
2021
Budget
2022
Budget
2023
Budget
2024
Budget
123 ‐ Grant In Aid Area D
Operating Revenue
1 ‐ Property tax requisition (64,462) (64,462) (62,030) (66,513) (66,544) (66,575) (66,606)
9 ‐ Prior year surplus (3,456) (1,947) (4,454) ‐ ‐ ‐ ‐
Operating Revenue Total (67,918) (66,409) (66,484) (66,513) (66,544) (66,575) (66,606)
Operating Expense
11 ‐ Operating expenses 63,464 66,409 66,484 66,513 66,544 66,575 66,606
Operating Expense Total 63,464 66,409 66,484 66,513 66,544 66,575 66,606
123 ‐ Grant In Aid Area D Total $ (4,454) $ ‐ $ ‐ $ ‐ $ ‐ $ ‐ $ ‐
Requisition Allocation2019
Actual
2020
Budget
2021
Budget
2022
Budget
2023
Budget
2024
Budget
Electoral Area:
Area D 64,462$ 62,030$ 66,513$ 66,544$ 66,575$ 66,606$
TOTAL 64,462$ 62,030$ 66,513$ 66,544$ 66,575$ 66,606$
Change $ (2,432) 4,483 31 31 31
Change % (3.8%) 7.2% 0.0% 0.0% 0.0%
Tax Rate Estimate (Per $1,000) 0.0488 $ 0.0458 $ 0.0491 $ 0.0491 $ 0.0492 $ 0.0492 $
Maximum Requisition Limit 101,424 $ 103,677 $
172
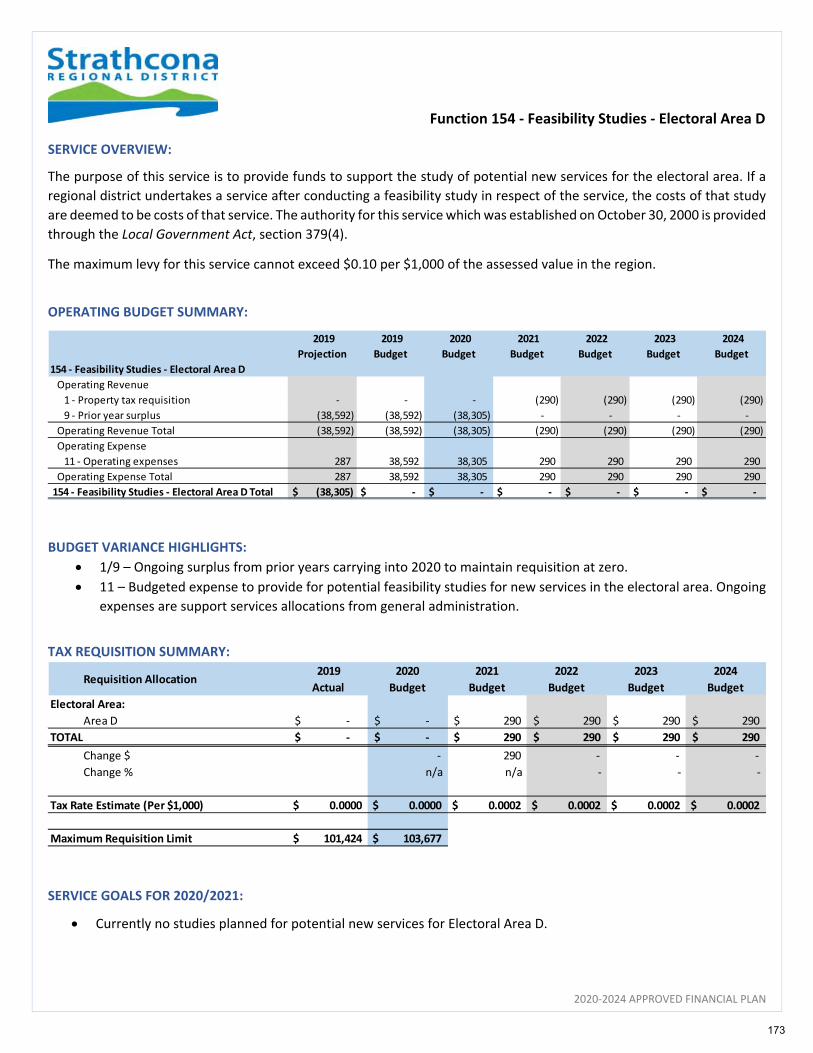
Function 154 ‐ Feasibility Studies ‐ Electoral Area D
2020‐2024 APPROVED FINANCIAL PLAN
SERVICE OVERVIEW:
The purpose of this service is to provide funds to support the study of potential new services for the electoral area. If a
regional district undertakes a service after conducting a feasibility study in respect of the service, the costs of that study
are deemed to be costs of that service. The authority for this service which was established on October 30, 2000 is provided
through the Local Government Act, section 379(4).
The maximum levy for this service cannot exceed $0.10 per $1,000 of the assessed value in the region.
OPERATING BUDGET SUMMARY:
BUDGET VARIANCE HIGHLIGHTS:
1/9 – Ongoing surplus from prior years carrying into 2020 to maintain requisition at zero.
11 – Budgeted expense to provide for potential feasibility studies for new services in the electoral area. Ongoing
expenses are support services allocations from general administration.
TAX REQUISITION SUMMARY:
SERVICE GOALS FOR 2020/2021:
Currently no studies planned for potential new services for Electoral Area D.
2019
Projection
2019
Budget
2020
Budget
2021
Budget
2022
Budget
2023
Budget
2024
Budget
154 ‐ Feasibility Studies ‐ Electoral Area D
Operating Revenue
1 ‐ Property tax requisition ‐ ‐ ‐ (290) (290) (290) (290)
9 ‐ Prior year surplus (38,592) (38,592) (38,305) ‐ ‐ ‐ ‐
Operating Revenue Total (38,592) (38,592) (38,305) (290) (290) (290) (290)
Operating Expense
11 ‐ Operating expenses 287 38,592 38,305 290 290 290 290
Operating Expense Total 287 38,592 38,305 290 290 290 290
154 ‐ Feasibility Studies ‐ Electoral Area D Total $ (38,305) $ ‐ $ ‐ $ ‐ $ ‐ $ ‐ $ ‐
Requisition Allocation2019
Actual
2020
Budget
2021
Budget
2022
Budget
2023
Budget
2024
Budget
Electoral Area:
Area D ‐$ ‐$ 290$ 290$ 290$ 290$
TOTAL ‐$ ‐$ 290$ 290$ 290$ 290$
Change $ ‐ 290 ‐ ‐ ‐
Change % n/a n/a ‐ ‐ ‐
Tax Rate Estimate (Per $1,000) 0.0000 $ 0.0000 $ 0.0002 $ 0.0002 $ 0.0002 $ 0.0002 $
Maximum Requisition Limit 101,424 $ 103,677 $
173
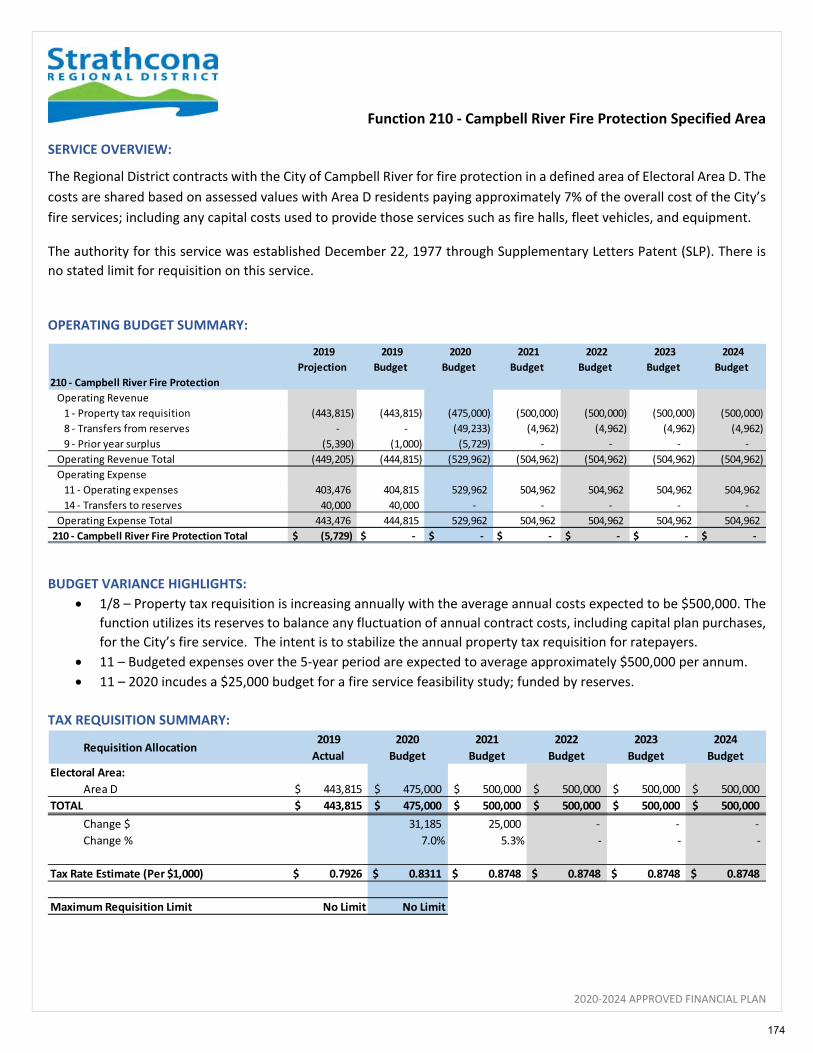
Function 210 ‐ Campbell River Fire Protection Specified Area
2020‐2024 APPROVED FINANCIAL PLAN
SERVICE OVERVIEW:
The Regional District contracts with the City of Campbell River for fire protection in a defined area of Electoral Area D. The
costs are shared based on assessed values with Area D residents paying approximately 7% of the overall cost of the City’s
fire services; including any capital costs used to provide those services such as fire halls, fleet vehicles, and equipment.
The authority for this service was established December 22, 1977 through Supplementary Letters Patent (SLP). There is
no stated limit for requisition on this service.
OPERATING BUDGET SUMMARY:
BUDGET VARIANCE HIGHLIGHTS:
1/8 – Property tax requisition is increasing annually with the average annual costs expected to be $500,000. The
function utilizes its reserves to balance any fluctuation of annual contract costs, including capital plan purchases,
for the City’s fire service. The intent is to stabilize the annual property tax requisition for ratepayers.
11 – Budgeted expenses over the 5‐year period are expected to average approximately $500,000 per annum.
11 – 2020 incudes a $25,000 budget for a fire service feasibility study; funded by reserves.
TAX REQUISITION SUMMARY:
2019
Projection
2019
Budget
2020
Budget
2021
Budget
2022
Budget
2023
Budget
2024
Budget
210 ‐ Campbell River Fire Protection
Operating Revenue
1 ‐ Property tax requisition (443,815) (443,815) (475,000) (500,000) (500,000) (500,000) (500,000)
8 ‐ Transfers from reserves ‐ ‐ (49,233) (4,962) (4,962) (4,962) (4,962)
9 ‐ Prior year surplus (5,390) (1,000) (5,729) ‐ ‐ ‐ ‐
Operating Revenue Total (449,205) (444,815) (529,962) (504,962) (504,962) (504,962) (504,962)
Operating Expense
11 ‐ Operating expenses 403,476 404,815 529,962 504,962 504,962 504,962 504,962
14 ‐ Transfers to reserves 40,000 40,000 ‐ ‐ ‐ ‐ ‐
Operating Expense Total 443,476 444,815 529,962 504,962 504,962 504,962 504,962
210 ‐ Campbell River Fire Protection Total $ (5,729) $ ‐ $ ‐ $ ‐ $ ‐ $ ‐ $ ‐
Requisition Allocation2019
Actual
2020
Budget
2021
Budget
2022
Budget
2023
Budget
2024
Budget
Electoral Area:
Area D 443,815$ 475,000$ 500,000$ 500,000$ 500,000$ 500,000$
TOTAL 443,815$ 475,000$ 500,000$ 500,000$ 500,000$ 500,000$
Change $ 31,185 25,000 ‐ ‐ ‐
Change % 7.0% 5.3% ‐ ‐ ‐
Tax Rate Estimate (Per $1,000) 0.7926 $ 0.8311 $ 0.8748 $ 0.8748 $ 0.8748 $ 0.8748 $
Maximum Requisition Limit No Limit No Limit
174

Function 210 ‐ Campbell River Fire Protection Specified Area
2020‐2024 APPROVED FINANCIAL PLAN
RESERVE SUMMARY:
ACTIVE RESERVES:
SERVICE GOALS FOR 2020/2021:
Undertake a feasibility study to determine other potential options for fire service for Electoral Area D.
Reserve Type2019
Projected
2020
Budget
2021
Budget
2022
Budget
2023
Budget
2024
Budget
Appropriated Surplus 69,220$ 19,987$ 15,025$ 10,063$ 5,101$ 139$
TOTAL 69,220$ 19,987$ 15,025$ 10,063$ 5,101$ 139$
Appropriated Surplus Reserve
2019
Projected
2020
Budget
2021
Budget
2022
Budget
2023
Budget
2024
Budget
Beginning balance 29,220$ 69,220$ 19,987$ 15,025$ 10,063$ 5,101$
Transfers from operating fund 40,000 ‐ ‐ ‐ ‐ ‐
Transfer to operating fund ‐ (24,233) (4,962) (4,962) (4,962) (4,962)
Projects funded ‐ (25,000) ‐ ‐ ‐ ‐
Ending Balance 69,220$ 19,987$ 15,025$ 10,063$ 5,101$ 139$
Projects Funded:
New Fire Service Feasibility Study 25,000
‐$ 25,000$ ‐$ ‐$ ‐$ ‐$
175

Function 285 ‐ Building Inspection
2020‐2024 APPROVED FINANCIAL PLAN
SERVICE OVERVIEW:
The purpose of this function is to provide building inspection services to Electoral Area D, which includes building
inspection, building permits, plumbing permits, and other related services supporting development activity.
The authority for this service was established January 1, 1969 by the Municipal Act section 818 through Bylaw 1160, with subsequent amendments on Bylaw 2489. There is no stated limit for requisition on this service. OPERATING BUDGET SUMMARY:
BUDGET VARIANCE HIGHLIGHTS:
1/9 – Property tax requisition increased in 2020 given reduced surplus projected for carryforward and increased
operating expenses.
11 – 2020 operational expense increases relate to staff wages and overtime required to maintain service levels
given the high demand for the service.
14 – Transfers to the reserves budgeted where possible to mitigate future cost increases.
CAPITAL BUDGET:
2019
Projection
2019
Budget
2020
Budget
2021
Budget
2022
Budget
2023
Budget
2024
Budget
285 ‐ Building Inspection
Operating Revenue
1 ‐ Property tax requisition (112,447) (112,447) (153,870) (201,345) (206,344) (211,450) (216,671)
3 ‐ Sales of services (13,030) (2,500) (12,000) (12,000) (12,000) (12,000) (12,000)
4 ‐ Other revenue (46,536) (44,780) (44,050) (44,050) (44,050) (44,050) (44,050)
9 ‐ Prior year surplus (75,422) (71,677) (42,585) ‐ ‐ ‐ ‐
Operating Revenue Total (247,435) (231,404) (252,505) (257,395) (262,394) (267,500) (272,721)
Operating Expense
11 ‐ Operating expenses 180,851 207,404 248,505 253,395 258,394 263,500 268,721
14 ‐ Transfers to reserves 24,000 24,000 4,000 4,000 4,000 4,000 4,000
Operating Expense Total 204,851 231,404 252,505 257,395 262,394 267,500 272,721
285 ‐ Building Inspection Total $ (42,585) $ ‐ $ ‐ $ ‐ $ ‐ $ ‐ $ ‐
Project Title2020
CFWD
2020
Budget
2021
Budget
2022
Budget
2023
Budget
2024
BudgetFunding
Land Use Software Replacement $ 52,118 $ ‐ $ ‐ $ ‐ $ ‐ $ ‐ Reserves
TOTAL 52,118$ ‐$ ‐$ ‐$ ‐$ ‐$
The existing system put in place by previous CSRD and is no longer supported. $200K project; funded 70% by Function 500 ‐
Planning & 30% by Function 285 ‐ Building Inspection reserves.
2020 ‐ 2024 FUNDED PROJECTS
176

Function 285 ‐ Building Inspection
2020‐2024 APPROVED FINANCIAL PLAN
TAX REQUISITION SUMMARY:
RESERVE SUMMARY:
ACTIVE RESERVES:
Requisition Allocation2019
Actual
2020
Budget
2021
Budget
2022
Budget
2023
Budget
2024
Budget
Electoral Area:
Area D 112,447$ 153,870$ 201,345$ 206,344$ 211,450$ 216,671$
TOTAL 112,447$ 153,870$ 201,345$ 206,344$ 211,450$ 216,671$
Change $ 41,423 47,475 4,999 5,106 5,221
Change % 36.8% 30.9% 2.5% 2.5% 2.5%
Tax Rate Estimate (Per $1,000) 0.0850 $ 0.1136 $ 0.1487 $ 0.1524 $ 0.1562 $ 0.1600 $
Maximum Requisition Limit No Limit No Limit
Reserve Type2019
Projected
2020
Budget
2021
Budget
2022
Budget
2023
Budget
2024
Budget
Appropriated Surplus 61,699$ 61,699$ 61,699$ 61,699$ 61,699$ 61,699$
Future Expenditure Reserve 55,359 60,466 65,676 70,989 76,409 81,937
Capital Reserve 60,183 9,269 9,455 9,644 9,837 10,033
TOTAL 177,241$ 131,435$ 136,829$ 142,332$ 147,945$ 153,670$
Future Expenditure Reserve
2019
Projected
2020
Budget
2021
Budget
2022
Budget
2023
Budget
2024
Budget
Beginning balance 51,359$ 55,359$ 60,466$ 65,676$ 70,989$ 76,409$
Transfers from operating fund 4,000 4,000 4,000 4,000 4,000 4,000
Transfer to operating fund ‐ ‐ ‐ ‐ ‐ ‐
Projects funded ‐ ‐ ‐ ‐ ‐ ‐
Interest earned ‐ 1,107 1,209 1,314 1,420 1,528
Ending Balance 55,359$ 60,466$ 65,676$ 70,989$ 76,409$ 81,937$
177
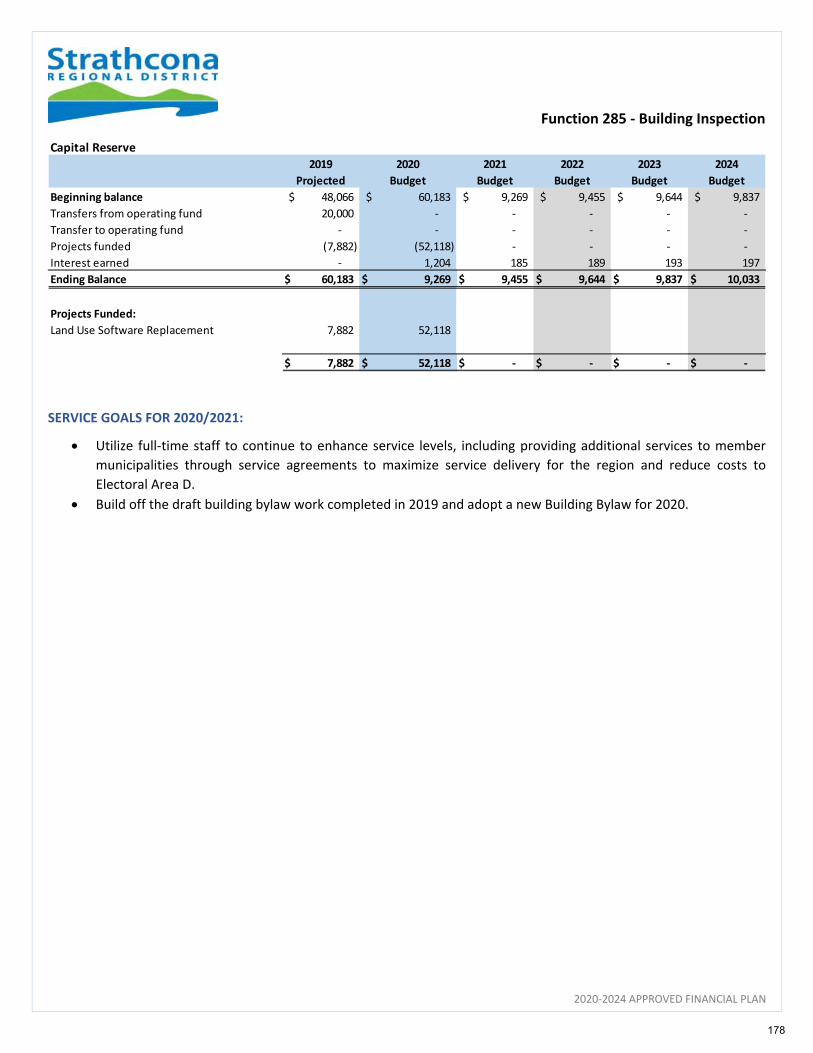
Function 285 ‐ Building Inspection
2020‐2024 APPROVED FINANCIAL PLAN
SERVICE GOALS FOR 2020/2021:
Utilize full‐time staff to continue to enhance service levels, including providing additional services to member
municipalities through service agreements to maximize service delivery for the region and reduce costs to
Electoral Area D.
Build off the draft building bylaw work completed in 2019 and adopt a new Building Bylaw for 2020.
Capital Reserve
2019
Projected
2020
Budget
2021
Budget
2022
Budget
2023
Budget
2024
Budget
Beginning balance 48,066$ 60,183$ 9,269$ 9,455$ 9,644$ 9,837$
Transfers from operating fund 20,000 ‐ ‐ ‐ ‐ ‐
Transfer to operating fund ‐ ‐ ‐ ‐ ‐ ‐
Projects funded (7,882) (52,118) ‐ ‐ ‐ ‐
Interest earned ‐ 1,204 185 189 193 197
Ending Balance 60,183$ 9,269$ 9,455$ 9,644$ 9,837$ 10,033$
Projects Funded:
Land Use Software Replacement 7,882 52,118
7,882$ 52,118$ ‐$ ‐$ ‐$ ‐$
178
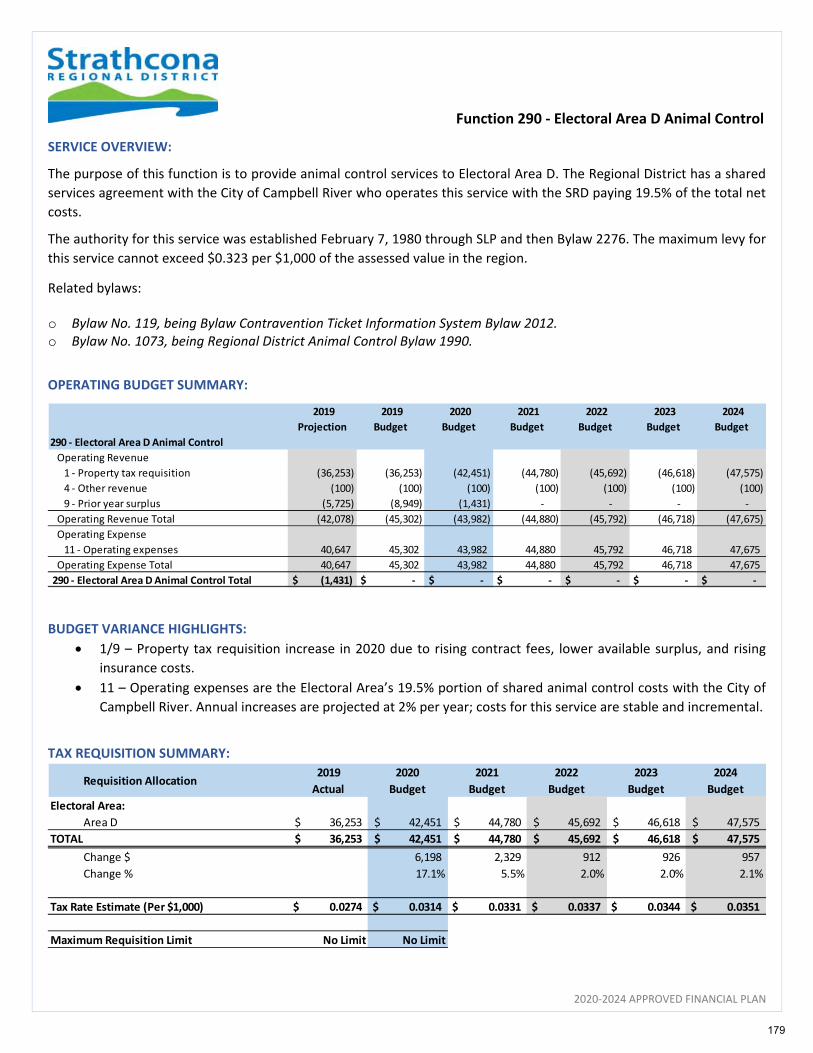
Function 290 ‐ Electoral Area D Animal Control
2020‐2024 APPROVED FINANCIAL PLAN
SERVICE OVERVIEW:
The purpose of this function is to provide animal control services to Electoral Area D. The Regional District has a shared
services agreement with the City of Campbell River who operates this service with the SRD paying 19.5% of the total net
costs.
The authority for this service was established February 7, 1980 through SLP and then Bylaw 2276. The maximum levy for
this service cannot exceed $0.323 per $1,000 of the assessed value in the region.
Related bylaws:
o Bylaw No. 119, being Bylaw Contravention Ticket Information System Bylaw 2012. o Bylaw No. 1073, being Regional District Animal Control Bylaw 1990.
OPERATING BUDGET SUMMARY:
BUDGET VARIANCE HIGHLIGHTS:
1/9 – Property tax requisition increase in 2020 due to rising contract fees, lower available surplus, and rising
insurance costs.
11 – Operating expenses are the Electoral Area’s 19.5% portion of shared animal control costs with the City of
Campbell River. Annual increases are projected at 2% per year; costs for this service are stable and incremental.
TAX REQUISITION SUMMARY:
2019
Projection
2019
Budget
2020
Budget
2021
Budget
2022
Budget
2023
Budget
2024
Budget
290 ‐ Electoral Area D Animal Control
Operating Revenue
1 ‐ Property tax requisition (36,253) (36,253) (42,451) (44,780) (45,692) (46,618) (47,575)
4 ‐ Other revenue (100) (100) (100) (100) (100) (100) (100)
9 ‐ Prior year surplus (5,725) (8,949) (1,431) ‐ ‐ ‐ ‐
Operating Revenue Total (42,078) (45,302) (43,982) (44,880) (45,792) (46,718) (47,675)
Operating Expense
11 ‐ Operating expenses 40,647 45,302 43,982 44,880 45,792 46,718 47,675
Operating Expense Total 40,647 45,302 43,982 44,880 45,792 46,718 47,675
290 ‐ Electoral Area D Animal Control Total $ (1,431) $ ‐ $ ‐ $ ‐ $ ‐ $ ‐ $ ‐
Requisition Allocation2019
Actual
2020
Budget
2021
Budget
2022
Budget
2023
Budget
2024
Budget
Electoral Area:
Area D 36,253$ 42,451$ 44,780$ 45,692$ 46,618$ 47,575$
TOTAL 36,253$ 42,451$ 44,780$ 45,692$ 46,618$ 47,575$
Change $ 6,198 2,329 912 926 957
Change % 17.1% 5.5% 2.0% 2.0% 2.1%
Tax Rate Estimate (Per $1,000) 0.0274 $ 0.0314 $ 0.0331 $ 0.0337 $ 0.0344 $ 0.0351 $
Maximum Requisition Limit No Limit No Limit
179
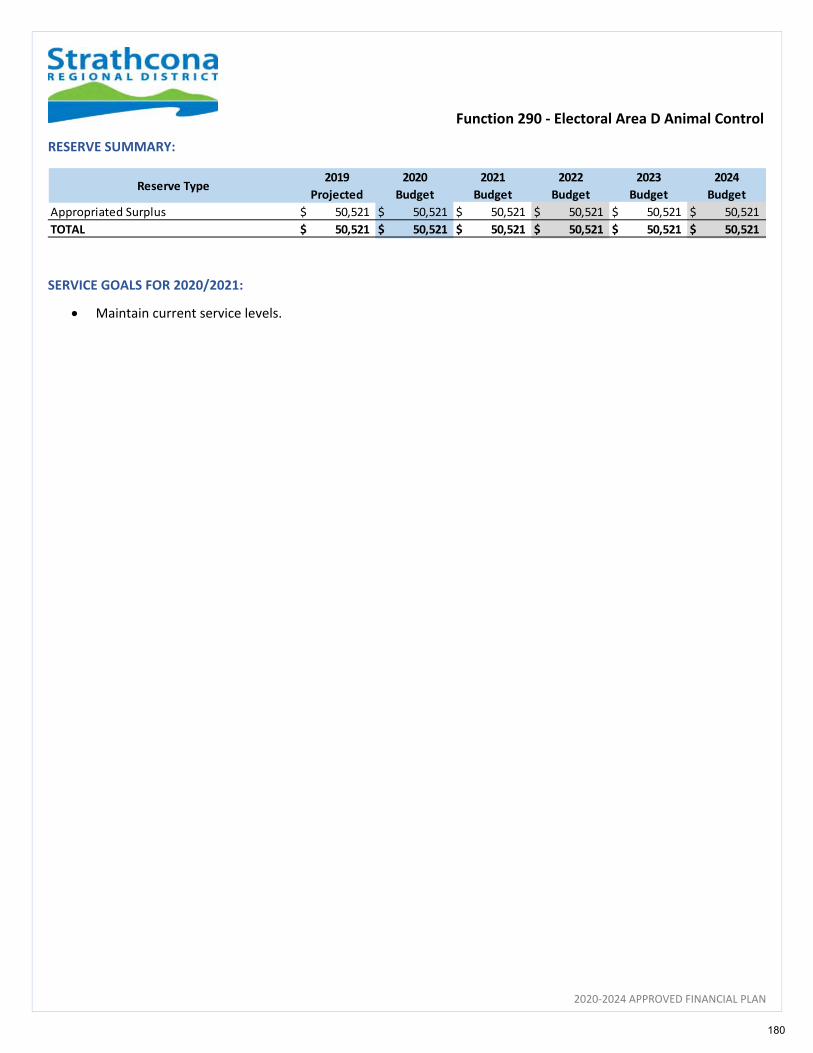
Function 290 ‐ Electoral Area D Animal Control
2020‐2024 APPROVED FINANCIAL PLAN
RESERVE SUMMARY:
SERVICE GOALS FOR 2020/2021:
Maintain current service levels.
Reserve Type2019
Projected
2020
Budget
2021
Budget
2022
Budget
2023
Budget
2024
Budget
Appropriated Surplus 50,521$ 50,521$ 50,521$ 50,521$ 50,521$ 50,521$
TOTAL 50,521$ 50,521$ 50,521$ 50,521$ 50,521$ 50,521$
180
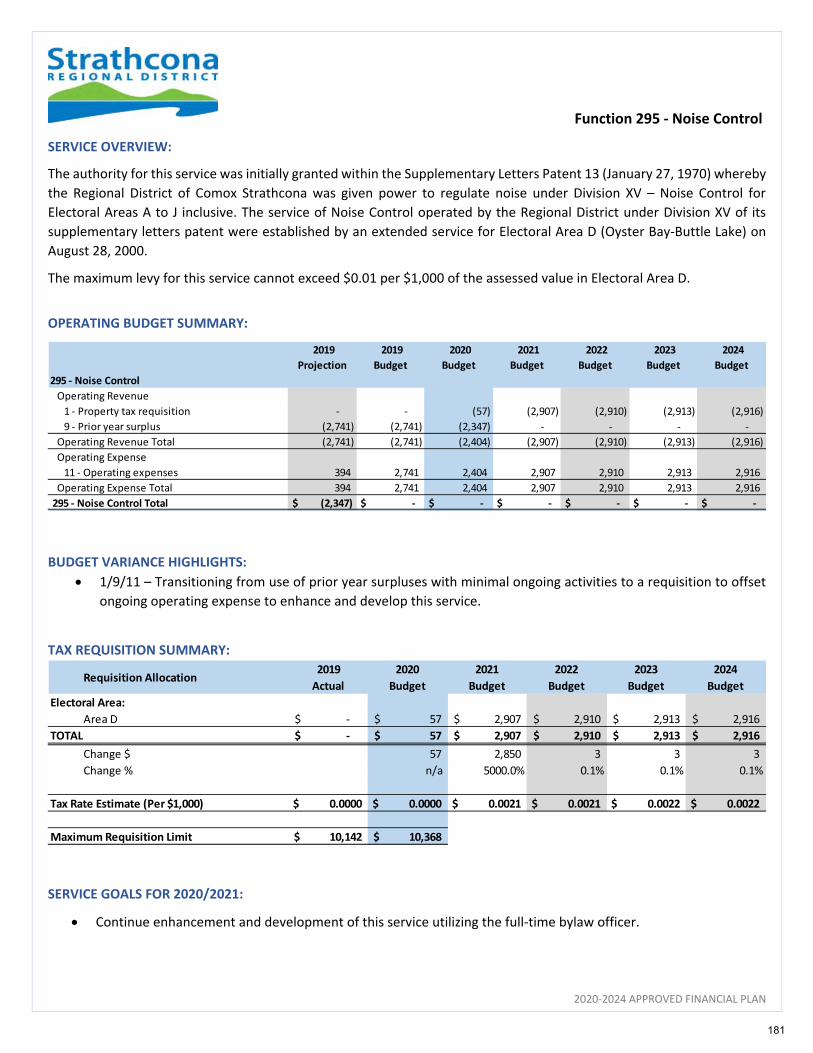
Function 295 ‐ Noise Control
2020‐2024 APPROVED FINANCIAL PLAN
SERVICE OVERVIEW:
The authority for this service was initially granted within the Supplementary Letters Patent 13 (January 27, 1970) whereby
the Regional District of Comox Strathcona was given power to regulate noise under Division XV – Noise Control for
Electoral Areas A to J inclusive. The service of Noise Control operated by the Regional District under Division XV of its
supplementary letters patent were established by an extended service for Electoral Area D (Oyster Bay‐Buttle Lake) on
August 28, 2000.
The maximum levy for this service cannot exceed $0.01 per $1,000 of the assessed value in Electoral Area D.
OPERATING BUDGET SUMMARY:
BUDGET VARIANCE HIGHLIGHTS:
1/9/11 – Transitioning from use of prior year surpluses with minimal ongoing activities to a requisition to offset
ongoing operating expense to enhance and develop this service.
TAX REQUISITION SUMMARY:
SERVICE GOALS FOR 2020/2021:
Continue enhancement and development of this service utilizing the full‐time bylaw officer.
2019
Projection
2019
Budget
2020
Budget
2021
Budget
2022
Budget
2023
Budget
2024
Budget
295 ‐ Noise Control
Operating Revenue
1 ‐ Property tax requisition ‐ ‐ (57) (2,907) (2,910) (2,913) (2,916)
9 ‐ Prior year surplus (2,741) (2,741) (2,347) ‐ ‐ ‐ ‐
Operating Revenue Total (2,741) (2,741) (2,404) (2,907) (2,910) (2,913) (2,916)
Operating Expense
11 ‐ Operating expenses 394 2,741 2,404 2,907 2,910 2,913 2,916
Operating Expense Total 394 2,741 2,404 2,907 2,910 2,913 2,916
295 ‐ Noise Control Total $ (2,347) $ ‐ $ ‐ $ ‐ $ ‐ $ ‐ $ ‐
Requisition Allocation2019
Actual
2020
Budget
2021
Budget
2022
Budget
2023
Budget
2024
Budget
Electoral Area:
Area D ‐$ 57$ 2,907$ 2,910$ 2,913$ 2,916$
TOTAL ‐$ 57$ 2,907$ 2,910$ 2,913$ 2,916$
Change $ 57 2,850 3 3 3
Change % n/a 5000.0% 0.1% 0.1% 0.1%
Tax Rate Estimate (Per $1,000) 0.0000 $ 0.0000 $ 0.0021 $ 0.0021 $ 0.0022 $ 0.0022 $
Maximum Requisition Limit 10,142 $ 10,368 $
181
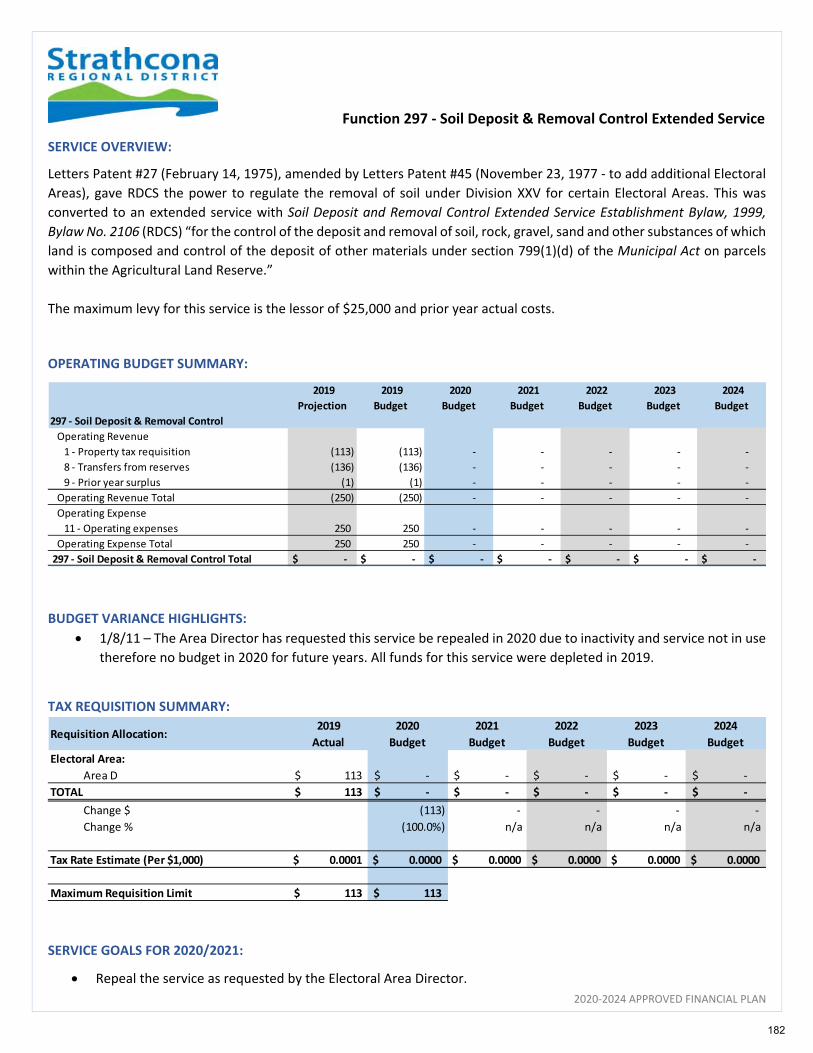
Function 297 ‐ Soil Deposit & Removal Control Extended Service
2020‐2024 APPROVED FINANCIAL PLAN
SERVICE OVERVIEW:
Letters Patent #27 (February 14, 1975), amended by Letters Patent #45 (November 23, 1977 ‐ to add additional Electoral
Areas), gave RDCS the power to regulate the removal of soil under Division XXV for certain Electoral Areas. This was
converted to an extended service with Soil Deposit and Removal Control Extended Service Establishment Bylaw, 1999,
Bylaw No. 2106 (RDCS) “for the control of the deposit and removal of soil, rock, gravel, sand and other substances of which
land is composed and control of the deposit of other materials under section 799(1)(d) of the Municipal Act on parcels
within the Agricultural Land Reserve.”
The maximum levy for this service is the lessor of $25,000 and prior year actual costs.
OPERATING BUDGET SUMMARY:
BUDGET VARIANCE HIGHLIGHTS:
1/8/11 – The Area Director has requested this service be repealed in 2020 due to inactivity and service not in use
therefore no budget in 2020 for future years. All funds for this service were depleted in 2019.
TAX REQUISITION SUMMARY:
SERVICE GOALS FOR 2020/2021:
Repeal the service as requested by the Electoral Area Director.
2019
Projection
2019
Budget
2020
Budget
2021
Budget
2022
Budget
2023
Budget
2024
Budget
297 ‐ Soil Deposit & Removal Control
Operating Revenue
1 ‐ Property tax requisition (113) (113) ‐ ‐ ‐ ‐ ‐
8 ‐ Transfers from reserves (136) (136) ‐ ‐ ‐ ‐ ‐
9 ‐ Prior year surplus (1) (1) ‐ ‐ ‐ ‐ ‐
Operating Revenue Total (250) (250) ‐ ‐ ‐ ‐ ‐
Operating Expense
11 ‐ Operating expenses 250 250 ‐ ‐ ‐ ‐ ‐
Operating Expense Total 250 250 ‐ ‐ ‐ ‐ ‐
297 ‐ Soil Deposit & Removal Control Total $ ‐ $ ‐ $ ‐ $ ‐ $ ‐ $ ‐ $ ‐
Requisition Allocation:2019
Actual
2020
Budget
2021
Budget
2022
Budget
2023
Budget
2024
Budget
Electoral Area:
Area D 113$ ‐$ ‐$ ‐$ ‐$ ‐$
TOTAL 113$ ‐$ ‐$ ‐$ ‐$ ‐$
Change $ (113) ‐ ‐ ‐ ‐
Change % (100.0%) n/a n/a n/a n/a
Tax Rate Estimate (Per $1,000) 0.0001 $ 0.0000 $ 0.0000 $ 0.0000 $ 0.0000 $ 0.0000 $
Maximum Requisition Limit 113 $ 113 $
182

Function 298 ‐ Unsightly Premises Extended Service
2020‐2024 APPROVED FINANCIAL PLAN
OVERVIEW:
Established with Unsightly Premises Extended Service Establishment Bylaw, 1998, Bylaw No. 2051 (CSRD) for then Electoral
Areas A, B and C within the now Comox Valley Regional District. The bylaw was amended in 2001 to include Electoral Area
D within the service area. The extended service is established and to be operated for the control of nuisances, unsightly
premises, unwholesome or noxious materials and odours.
The maximum levy for this service is the greater of $25,000 or $0.002 per $1,000 of assessed value in Electoral Area D.
OPERATING BUDGET SUMMARY:
BUDGET VARIANCE HIGHLIGHTS:
1/9/11 – Transitioning from use of prior year surpluses with minimal ongoing activities to a requisition to offset
ongoing operating expense to enhance and develop this service.
TAX REQUISITION SUMMARY:
2019
Projection
2019
Budget
2020
Budget
2021
Budget
2022
Budget
2023
Budget
2024
Budget
298 ‐ Unsightly Premises
Operating Revenue
1 ‐ Property tax requisition (275) (275) (273) (776) (777) (778) (779)
9 ‐ Prior year surplus (500) (500) (502) ‐ ‐ ‐ ‐
Operating Revenue Total (775) (775) (775) (776) (777) (778) (779)
Operating Expense
11 ‐ Operating expenses 273 775 775 776 777 778 779
Operating Expense Total 273 775 775 776 777 778 779
298 ‐ Unsightly Premises Total $ (502) $ ‐ $ ‐ $ ‐ $ ‐ $ ‐ $ ‐
Requisition Allocation2019
Actual
2020
Budget
2021
Budget
2022
Budget
2023
Budget
2024
Budget
Electoral Area:
Area D 275$ 273$ 776$ 777$ 778$ 779$
TOTAL 275$ 273$ 776$ 777$ 778$ 779$
Change $ (2) 503 1 1 1
Change % (0.7%) 184.2% 0.1% 0.1% 0.1%
Tax Rate Estimate (Per $1,000) 0.0002 $ 0.0002 $ 0.0006 $ 0.0006 $ 0.0006 $ 0.0006 $
Maximum Requisition Limit 10,142 $ 10,368 $
183
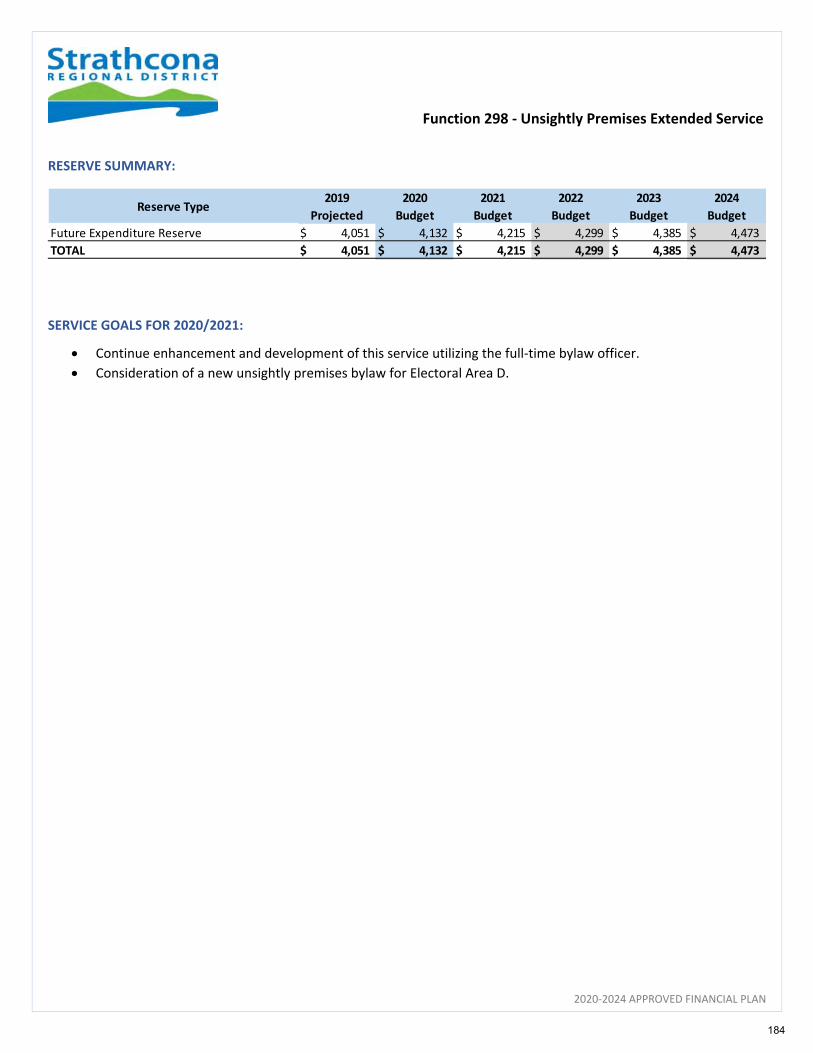
Function 298 ‐ Unsightly Premises Extended Service
2020‐2024 APPROVED FINANCIAL PLAN
RESERVE SUMMARY:
SERVICE GOALS FOR 2020/2021:
Continue enhancement and development of this service utilizing the full‐time bylaw officer.
Consideration of a new unsightly premises bylaw for Electoral Area D.
Reserve Type2019
Projected
2020
Budget
2021
Budget
2022
Budget
2023
Budget
2024
Budget
Future Expenditure Reserve 4,051$ 4,132$ 4,215$ 4,299$ 4,385$ 4,473$
TOTAL 4,051$ 4,132$ 4,215$ 4,299$ 4,385$ 4,473$
184
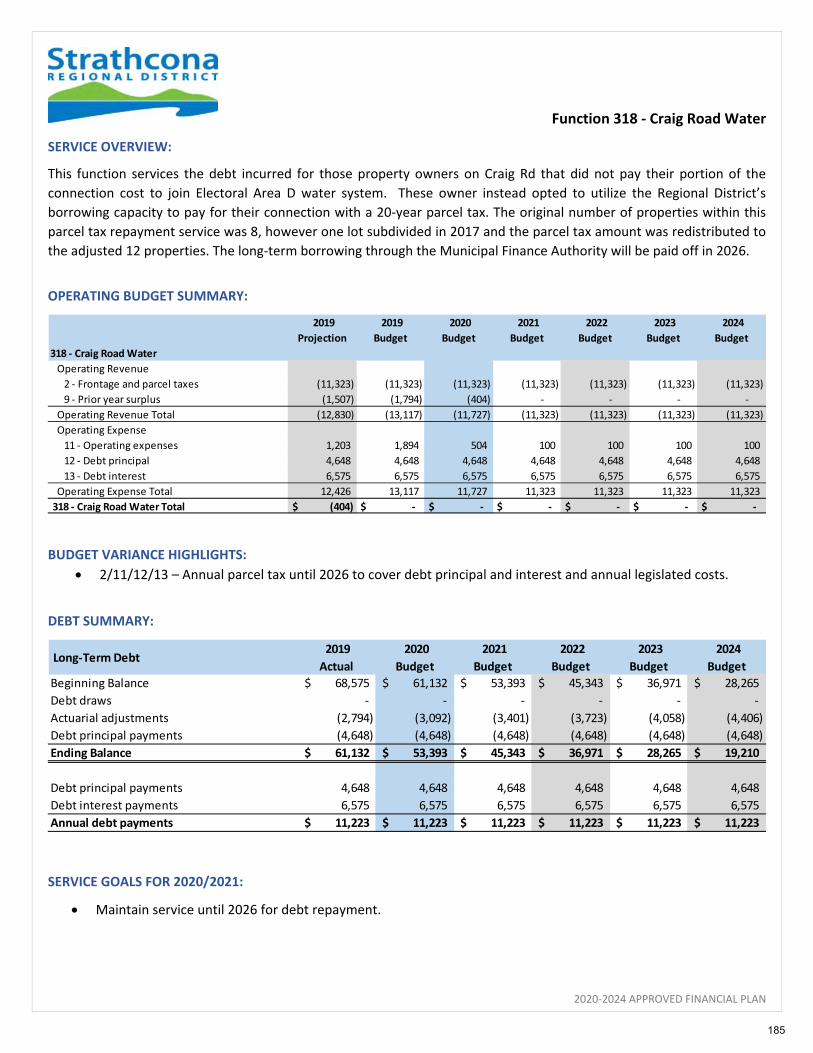
Function 318 ‐ Craig Road Water
2020‐2024 APPROVED FINANCIAL PLAN
SERVICE OVERVIEW:
This function services the debt incurred for those property owners on Craig Rd that did not pay their portion of the
connection cost to join Electoral Area D water system. These owner instead opted to utilize the Regional District’s
borrowing capacity to pay for their connection with a 20‐year parcel tax. The original number of properties within this
parcel tax repayment service was 8, however one lot subdivided in 2017 and the parcel tax amount was redistributed to
the adjusted 12 properties. The long‐term borrowing through the Municipal Finance Authority will be paid off in 2026.
OPERATING BUDGET SUMMARY:
BUDGET VARIANCE HIGHLIGHTS:
2/11/12/13 – Annual parcel tax until 2026 to cover debt principal and interest and annual legislated costs.
DEBT SUMMARY:
SERVICE GOALS FOR 2020/2021:
Maintain service until 2026 for debt repayment.
2019
Projection
2019
Budget
2020
Budget
2021
Budget
2022
Budget
2023
Budget
2024
Budget
318 ‐ Craig Road Water
Operating Revenue
2 ‐ Frontage and parcel taxes (11,323) (11,323) (11,323) (11,323) (11,323) (11,323) (11,323)
9 ‐ Prior year surplus (1,507) (1,794) (404) ‐ ‐ ‐ ‐
Operating Revenue Total (12,830) (13,117) (11,727) (11,323) (11,323) (11,323) (11,323)
Operating Expense
11 ‐ Operating expenses 1,203 1,894 504 100 100 100 100
12 ‐ Debt principal 4,648 4,648 4,648 4,648 4,648 4,648 4,648
13 ‐ Debt interest 6,575 6,575 6,575 6,575 6,575 6,575 6,575
Operating Expense Total 12,426 13,117 11,727 11,323 11,323 11,323 11,323
318 ‐ Craig Road Water Total $ (404) $ ‐ $ ‐ $ ‐ $ ‐ $ ‐ $ ‐
Long‐Term Debt 2019
Actual
2020
Budget
2021
Budget
2022
Budget
2023
Budget
2024
Budget
Beginning Balance 68,575$ 61,132$ 53,393$ 45,343$ 36,971$ 28,265$
Debt draws ‐ ‐ ‐ ‐ ‐ ‐
Actuarial adjustments (2,794) (3,092) (3,401) (3,723) (4,058) (4,406)
Debt principal payments (4,648) (4,648) (4,648) (4,648) (4,648) (4,648)
Ending Balance 61,132$ 53,393$ 45,343$ 36,971$ 28,265$ 19,210$
Debt principal payments 4,648 4,648 4,648 4,648 4,648 4,648
Debt interest payments 6,575 6,575 6,575 6,575 6,575 6,575
Annual debt payments 11,223$ 11,223$ 11,223$ 11,223$ 11,223$ 11,223$
185
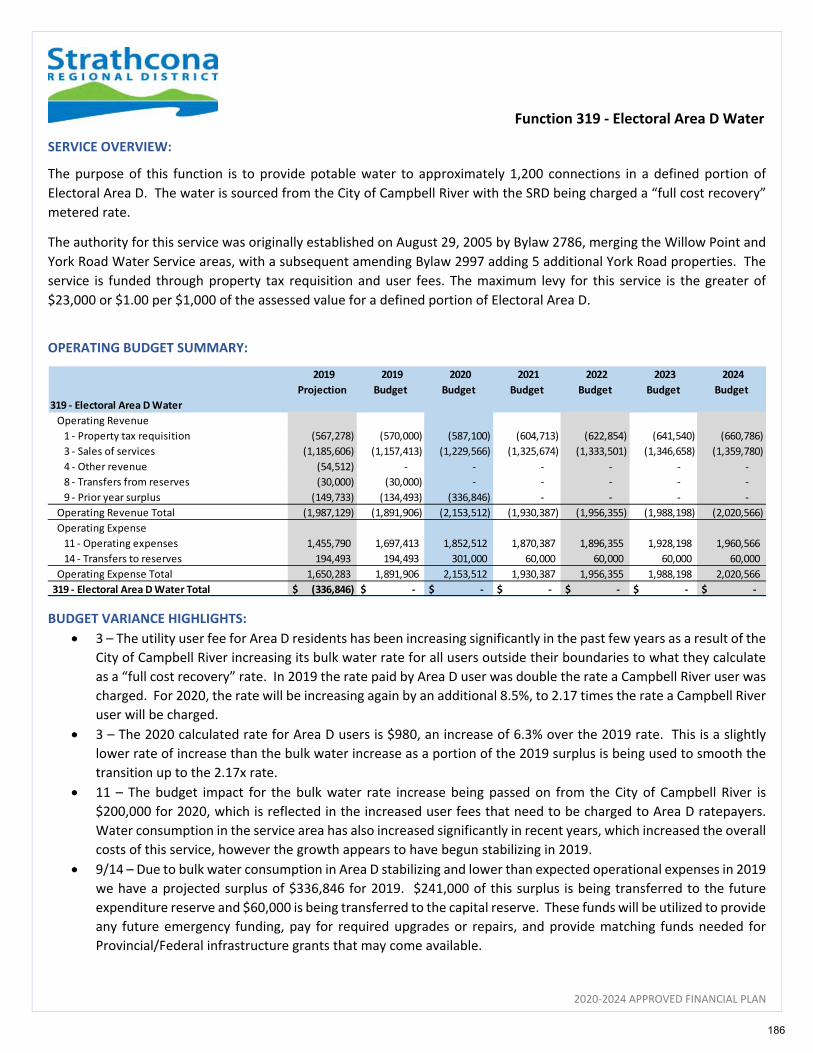
Function 319 ‐ Electoral Area D Water
2020‐2024 APPROVED FINANCIAL PLAN
SERVICE OVERVIEW:
The purpose of this function is to provide potable water to approximately 1,200 connections in a defined portion of
Electoral Area D. The water is sourced from the City of Campbell River with the SRD being charged a “full cost recovery”
metered rate.
The authority for this service was originally established on August 29, 2005 by Bylaw 2786, merging the Willow Point and
York Road Water Service areas, with a subsequent amending Bylaw 2997 adding 5 additional York Road properties. The
service is funded through property tax requisition and user fees. The maximum levy for this service is the greater of
$23,000 or $1.00 per $1,000 of the assessed value for a defined portion of Electoral Area D.
OPERATING BUDGET SUMMARY:
BUDGET VARIANCE HIGHLIGHTS:
3 – The utility user fee for Area D residents has been increasing significantly in the past few years as a result of the
City of Campbell River increasing its bulk water rate for all users outside their boundaries to what they calculate
as a “full cost recovery” rate. In 2019 the rate paid by Area D user was double the rate a Campbell River user was
charged. For 2020, the rate will be increasing again by an additional 8.5%, to 2.17 times the rate a Campbell River
user will be charged.
3 – The 2020 calculated rate for Area D users is $980, an increase of 6.3% over the 2019 rate. This is a slightly
lower rate of increase than the bulk water increase as a portion of the 2019 surplus is being used to smooth the
transition up to the 2.17x rate.
11 – The budget impact for the bulk water rate increase being passed on from the City of Campbell River is
$200,000 for 2020, which is reflected in the increased user fees that need to be charged to Area D ratepayers.
Water consumption in the service area has also increased significantly in recent years, which increased the overall
costs of this service, however the growth appears to have begun stabilizing in 2019.
9/14 – Due to bulk water consumption in Area D stabilizing and lower than expected operational expenses in 2019
we have a projected surplus of $336,846 for 2019. $241,000 of this surplus is being transferred to the future
expenditure reserve and $60,000 is being transferred to the capital reserve. These funds will be utilized to provide
any future emergency funding, pay for required upgrades or repairs, and provide matching funds needed for
Provincial/Federal infrastructure grants that may come available.
2019
Projection
2019
Budget
2020
Budget
2021
Budget
2022
Budget
2023
Budget
2024
Budget
319 ‐ Electoral Area D Water
Operating Revenue
1 ‐ Property tax requisition (567,278) (570,000) (587,100) (604,713) (622,854) (641,540) (660,786)
3 ‐ Sales of services (1,185,606) (1,157,413) (1,229,566) (1,325,674) (1,333,501) (1,346,658) (1,359,780)
4 ‐ Other revenue (54,512) ‐ ‐ ‐ ‐ ‐ ‐
8 ‐ Transfers from reserves (30,000) (30,000) ‐ ‐ ‐ ‐ ‐
9 ‐ Prior year surplus (149,733) (134,493) (336,846) ‐ ‐ ‐ ‐
Operating Revenue Total (1,987,129) (1,891,906) (2,153,512) (1,930,387) (1,956,355) (1,988,198) (2,020,566)
Operating Expense
11 ‐ Operating expenses 1,455,790 1,697,413 1,852,512 1,870,387 1,896,355 1,928,198 1,960,566
14 ‐ Transfers to reserves 194,493 194,493 301,000 60,000 60,000 60,000 60,000
Operating Expense Total 1,650,283 1,891,906 2,153,512 1,930,387 1,956,355 1,988,198 2,020,566
319 ‐ Electoral Area D Water Total $ (336,846) $ ‐ $ ‐ $ ‐ $ ‐ $ ‐ $ ‐
186

Function 319 ‐ Electoral Area D Water
2020‐2024 APPROVED FINANCIAL PLAN
CAPITAL BUDGET:
TAX REQUISITION SUMMARY:
Project Title2020
CFWD
2020
Budget
2021
Budget
2022
Budget
2023
Budget
2024
BudgetFunding
Craig Rd Pressure Zone Upgrade $ 100,000 ‐ ‐ ‐ ‐ ‐ Community
Works Fund
Water Supply Connection Improvements 530,000 ‐ ‐ ‐ ‐ Community
Works Fund
Water Main Replacement 1,000,000 Community
Works Fund
TOTAL 630,000$ 1,000,000$ ‐$ ‐$ ‐$ ‐$
2020 ‐ 2024 FUNDED PROJECTS
Localized water pressure solution for Craig Rd. Re‐allocation of Area D booster pump station project alternate solution to
pressure issues identified with a significant reduction in project costs.
Need to begin pipe replacement for all 26km of AC pipe as per the Asset Management Plan.
Install new bulk meters, back flow prevention valves and new chambers. As detailed in business case, ensure accuracy and
improve integrity of bulk water meter readings; provide better management of system.
Project Title2020
Budget
2021
Budget
2022
Budget
2023
Budget
2024
BudgetFunding
Water Main Replacement $ ‐ $ 1,000,000 $ 1,000,000 $ 1,000,000 $ 1,000,000 TBD
TOTAL ‐$ 1,000,000$ 1,000,000$ 1,000,000$ 1,000,000$
2020 ‐ 2024 UNFUNDED FUTURE PROJECTS
Need to begin pipe replacement for all 26km of AC pipe as per the Asset Management Plan.
Requisition Allocation2019
Actual
2020
Budget
2021
Budget
2022
Budget
2023
Budget
2024
Budget
Electoral Area:
Area D 567,278$ 587,100$ 604,713$ 622,854$ 641,540$ 660,786$
TOTAL 567,278$ 587,100$ 604,713$ 622,854$ 641,540$ 660,786$
Change $ 19,822 17,613 18,141 18,686 19,246
Change % 3.5% 3.0% 3.0% 3.0% 3.0%
Tax Rate Estimate (Per $1,000) 0.9184 $ 0.9319 $ 0.9598 $ 0.9886 $ 1.0183 $ 1.0488 $
Maximum Requisition Limit 605,346 $ 617,139 $
187
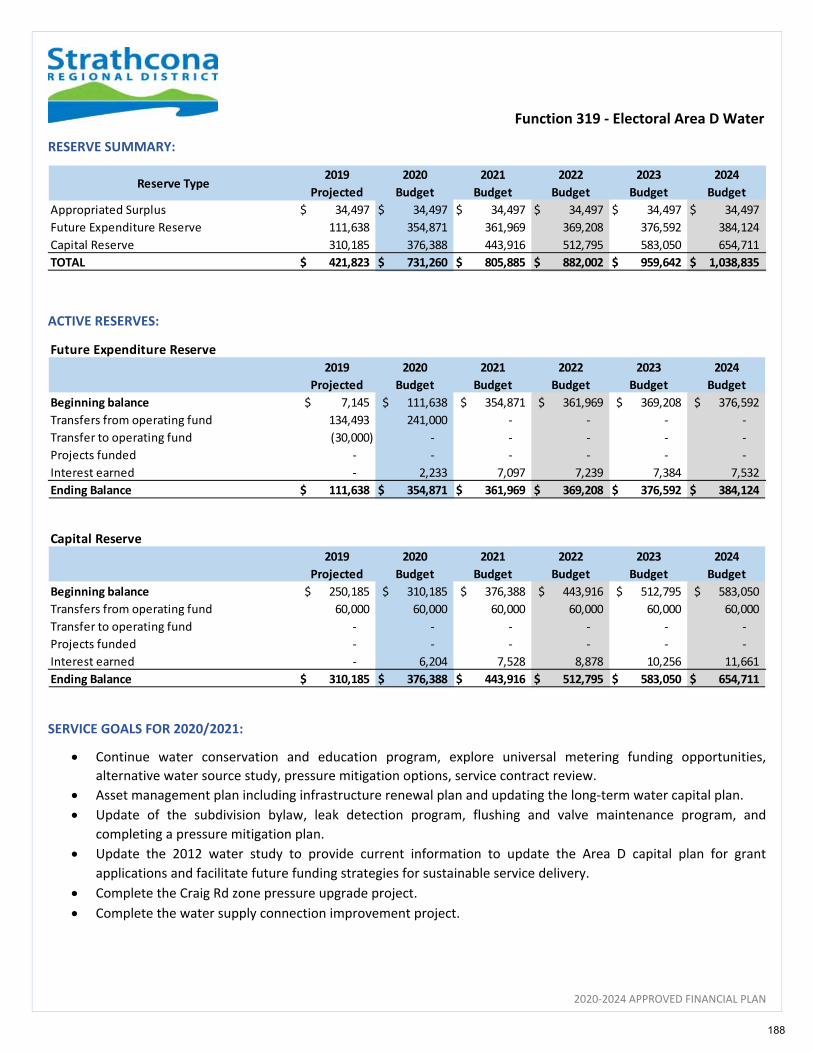
Function 319 ‐ Electoral Area D Water
2020‐2024 APPROVED FINANCIAL PLAN
RESERVE SUMMARY:
ACTIVE RESERVES:
SERVICE GOALS FOR 2020/2021:
Continue water conservation and education program, explore universal metering funding opportunities,
alternative water source study, pressure mitigation options, service contract review.
Asset management plan including infrastructure renewal plan and updating the long‐term water capital plan.
Update of the subdivision bylaw, leak detection program, flushing and valve maintenance program, and
completing a pressure mitigation plan.
Update the 2012 water study to provide current information to update the Area D capital plan for grant
applications and facilitate future funding strategies for sustainable service delivery.
Complete the Craig Rd zone pressure upgrade project.
Complete the water supply connection improvement project.
Reserve Type2019
Projected
2020
Budget
2021
Budget
2022
Budget
2023
Budget
2024
Budget
Appropriated Surplus 34,497$ 34,497$ 34,497$ 34,497$ 34,497$ 34,497$
Future Expenditure Reserve 111,638 354,871 361,969 369,208 376,592 384,124
Capital Reserve 310,185 376,388 443,916 512,795 583,050 654,711
TOTAL 421,823$ 731,260$ 805,885$ 882,002$ 959,642$ 1,038,835$
Future Expenditure Reserve
2019
Projected
2020
Budget
2021
Budget
2022
Budget
2023
Budget
2024
Budget
Beginning balance 7,145$ 111,638$ 354,871$ 361,969$ 369,208$ 376,592$
Transfers from operating fund 134,493 241,000 ‐ ‐ ‐ ‐
Transfer to operating fund (30,000) ‐ ‐ ‐ ‐ ‐
Projects funded ‐ ‐ ‐ ‐ ‐ ‐
Interest earned ‐ 2,233 7,097 7,239 7,384 7,532
Ending Balance 111,638$ 354,871$ 361,969$ 369,208$ 376,592$ 384,124$
Capital Reserve
2019
Projected
2020
Budget
2021
Budget
2022
Budget
2023
Budget
2024
Budget
Beginning balance 250,185$ 310,185$ 376,388$ 443,916$ 512,795$ 583,050$
Transfers from operating fund 60,000 60,000 60,000 60,000 60,000 60,000
Transfer to operating fund ‐ ‐ ‐ ‐ ‐ ‐
Projects funded ‐ ‐ ‐ ‐ ‐ ‐
Interest earned ‐ 6,204 7,528 8,878 10,256 11,661
Ending Balance 310,185$ 376,388$ 443,916$ 512,795$ 583,050$ 654,711$
188
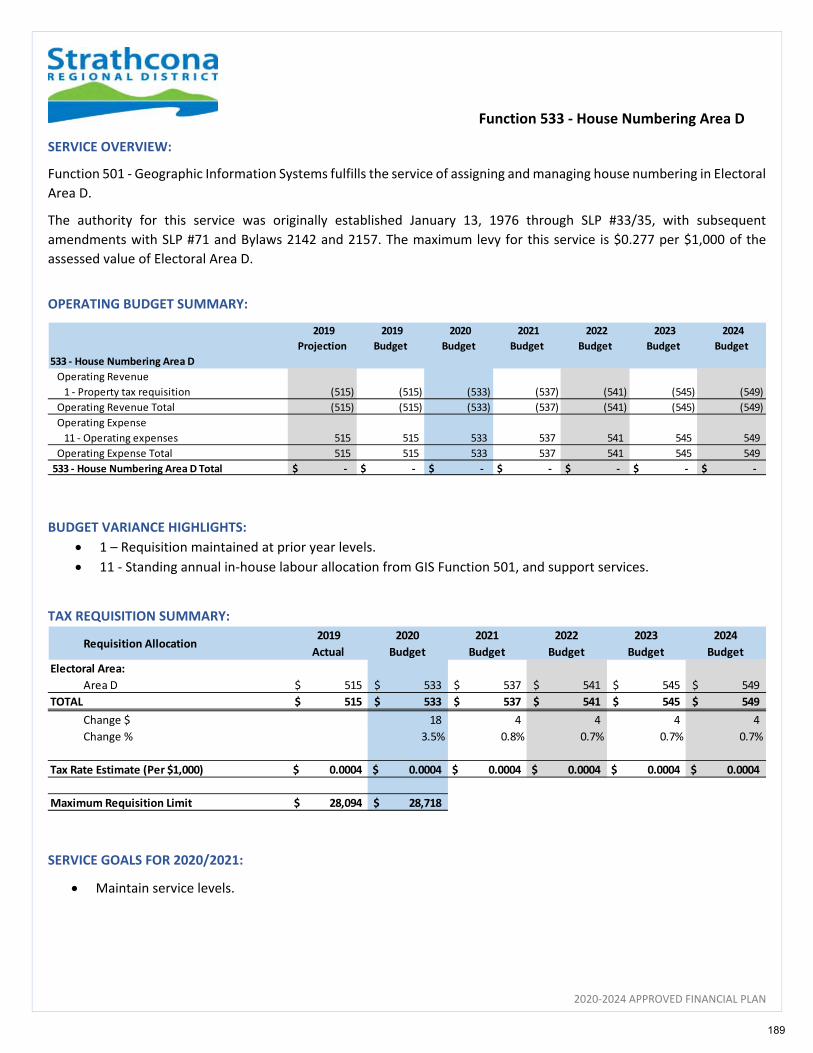
Function 533 ‐ House Numbering Area D
2020‐2024 APPROVED FINANCIAL PLAN
SERVICE OVERVIEW:
Function 501 ‐ Geographic Information Systems fulfills the service of assigning and managing house numbering in Electoral
Area D.
The authority for this service was originally established January 13, 1976 through SLP #33/35, with subsequent
amendments with SLP #71 and Bylaws 2142 and 2157. The maximum levy for this service is $0.277 per $1,000 of the
assessed value of Electoral Area D.
OPERATING BUDGET SUMMARY:
BUDGET VARIANCE HIGHLIGHTS:
1 – Requisition maintained at prior year levels.
11 ‐ Standing annual in‐house labour allocation from GIS Function 501, and support services.
TAX REQUISITION SUMMARY:
SERVICE GOALS FOR 2020/2021:
Maintain service levels.
2019
Projection
2019
Budget
2020
Budget
2021
Budget
2022
Budget
2023
Budget
2024
Budget
533 ‐ House Numbering Area D
Operating Revenue
1 ‐ Property tax requisition (515) (515) (533) (537) (541) (545) (549)
Operating Revenue Total (515) (515) (533) (537) (541) (545) (549)
Operating Expense
11 ‐ Operating expenses 515 515 533 537 541 545 549
Operating Expense Total 515 515 533 537 541 545 549
533 ‐ House Numbering Area D Total $ ‐ $ ‐ $ ‐ $ ‐ $ ‐ $ ‐ $ ‐
Requisition Allocation2019
Actual
2020
Budget
2021
Budget
2022
Budget
2023
Budget
2024
Budget
Electoral Area:
Area D 515$ 533$ 537$ 541$ 545$ 549$
TOTAL 515$ 533$ 537$ 541$ 545$ 549$
Change $ 18 4 4 4 4
Change % 3.5% 0.8% 0.7% 0.7% 0.7%
Tax Rate Estimate (Per $1,000) 0.0004 $ 0.0004 $ 0.0004 $ 0.0004 $ 0.0004 $ 0.0004 $
Maximum Requisition Limit 28,094 $ 28,718 $
189
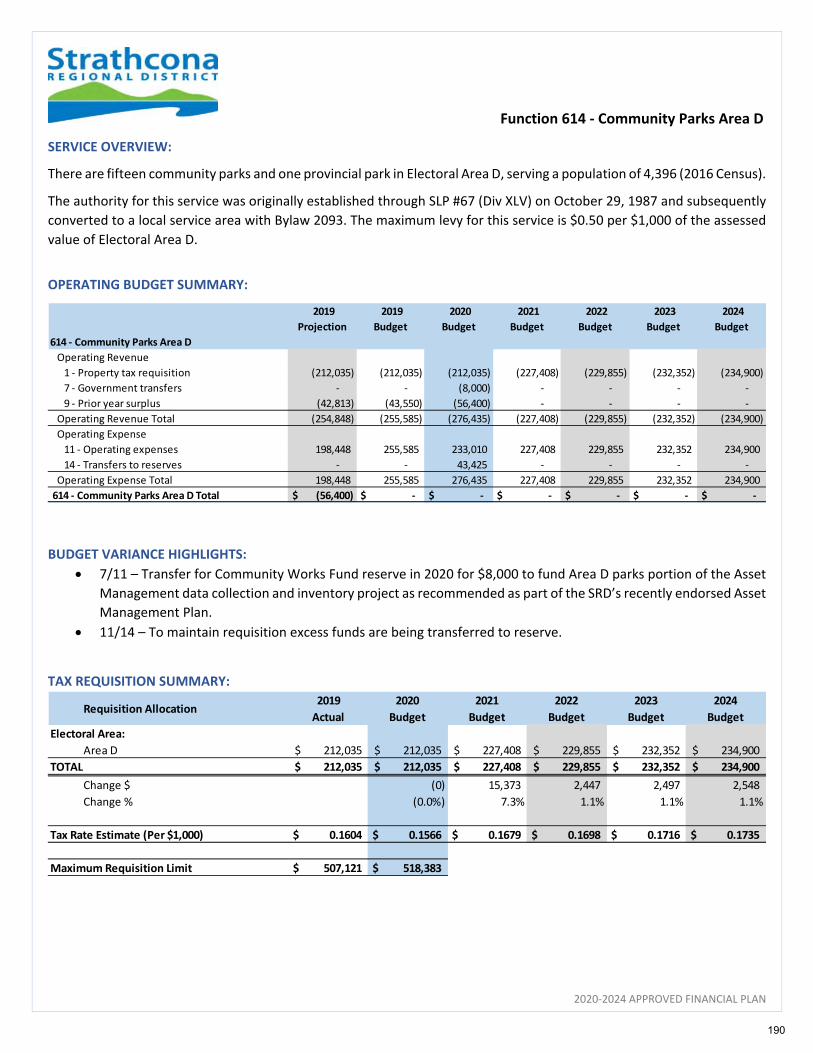
Function 614 ‐ Community Parks Area D
2020‐2024 APPROVED FINANCIAL PLAN
SERVICE OVERVIEW:
There are fifteen community parks and one provincial park in Electoral Area D, serving a population of 4,396 (2016 Census).
The authority for this service was originally established through SLP #67 (Div XLV) on October 29, 1987 and subsequently
converted to a local service area with Bylaw 2093. The maximum levy for this service is $0.50 per $1,000 of the assessed
value of Electoral Area D.
OPERATING BUDGET SUMMARY:
BUDGET VARIANCE HIGHLIGHTS:
7/11 – Transfer for Community Works Fund reserve in 2020 for $8,000 to fund Area D parks portion of the Asset
Management data collection and inventory project as recommended as part of the SRD’s recently endorsed Asset
Management Plan.
11/14 – To maintain requisition excess funds are being transferred to reserve.
TAX REQUISITION SUMMARY:
2019
Projection
2019
Budget
2020
Budget
2021
Budget
2022
Budget
2023
Budget
2024
Budget
614 ‐ Community Parks Area D
Operating Revenue
1 ‐ Property tax requisition (212,035) (212,035) (212,035) (227,408) (229,855) (232,352) (234,900)
7 ‐ Government transfers ‐ ‐ (8,000) ‐ ‐ ‐ ‐
9 ‐ Prior year surplus (42,813) (43,550) (56,400) ‐ ‐ ‐ ‐
Operating Revenue Total (254,848) (255,585) (276,435) (227,408) (229,855) (232,352) (234,900)
Operating Expense
11 ‐ Operating expenses 198,448 255,585 233,010 227,408 229,855 232,352 234,900
14 ‐ Transfers to reserves ‐ ‐ 43,425 ‐ ‐ ‐ ‐
Operating Expense Total 198,448 255,585 276,435 227,408 229,855 232,352 234,900
614 ‐ Community Parks Area D Total $ (56,400) $ ‐ $ ‐ $ ‐ $ ‐ $ ‐ $ ‐
Requisition Allocation2019
Actual
2020
Budget
2021
Budget
2022
Budget
2023
Budget
2024
Budget
Electoral Area:
Area D 212,035$ 212,035$ 227,408$ 229,855$ 232,352$ 234,900$
TOTAL 212,035$ 212,035$ 227,408$ 229,855$ 232,352$ 234,900$
Change $ (0) 15,373 2,447 2,497 2,548
Change % (0.0%) 7.3% 1.1% 1.1% 1.1%
Tax Rate Estimate (Per $1,000) 0.1604 $ 0.1566 $ 0.1679 $ 0.1698 $ 0.1716 $ 0.1735 $
Maximum Requisition Limit 507,121 $ 518,383 $
190

Function 614 ‐ Community Parks Area D
2020‐2024 APPROVED FINANCIAL PLAN
CAPITAL BUDGET:
RESERVE SUMMARY:
Project Title2020
CFWD
2020
Budget
2021
Budget
2022
Budget
2023
Budget
2024
BudgetFunding
Hagel Park Greenway North/Storie Creek
Trail $ 51,654 $ ‐ $ ‐ $ ‐ $ ‐ $ ‐
Community
Works Funds
Salmon Point Trail Head Development 30,000 ‐ ‐ ‐ ‐ ‐ Reserves
Oyster River Parking Lot Expansion 25,000 ‐ ‐ ‐ ‐ Reserves
Mitlenatch Slide Replacement ‐ 40,000 ‐ ‐ ‐ ‐ Reserves
Hagel Park Drainage ‐ ‐ 15,000 ‐ ‐ ‐ Reserves
TOTAL 81,654$ 65,000$ 15,000$ ‐$ ‐$ ‐$
Hagel Park Greenway North and Storie Creek Trail Enhancement for trail connectivity and walkability throughout the area.
2020 ‐ 2024 FUNDED PROJECTS
Upgrade of trailhead and trail. The park endures seasonal flooding and this has caused substantial degradation of the
trail/trail head.
Replacement of aging infrastructure.
Expansion of the lower parking lot and improvement of the access road is being proposed to provide the required space for
safe vehicle traffic as well as additional public parking capacity; as approved by business case.
Seasonal ponding within Hagel Park results in portions of the park being inaccessible and possible damage.
Reserve Type2019
Projected
2020
Budget
2021
Budget
2022
Budget
2023
Budget
2024
Budget
Appropriated Surplus 10,000$ 10,000$ 10,000$ 10,000$ 10,000$ 10,000$
Future Expenditure Reserve 225,394 229,902 234,500 239,190 243,974 248,853
Capital Reserve 426,105 383,052 375,713 383,227 390,892 398,710
Parkland Acquisition Reserve 997 1,017 1,038 1,058 1,079 1,101
TOTAL 662,496$ 623,971$ 621,250$ 633,475$ 645,945$ 658,664$
191
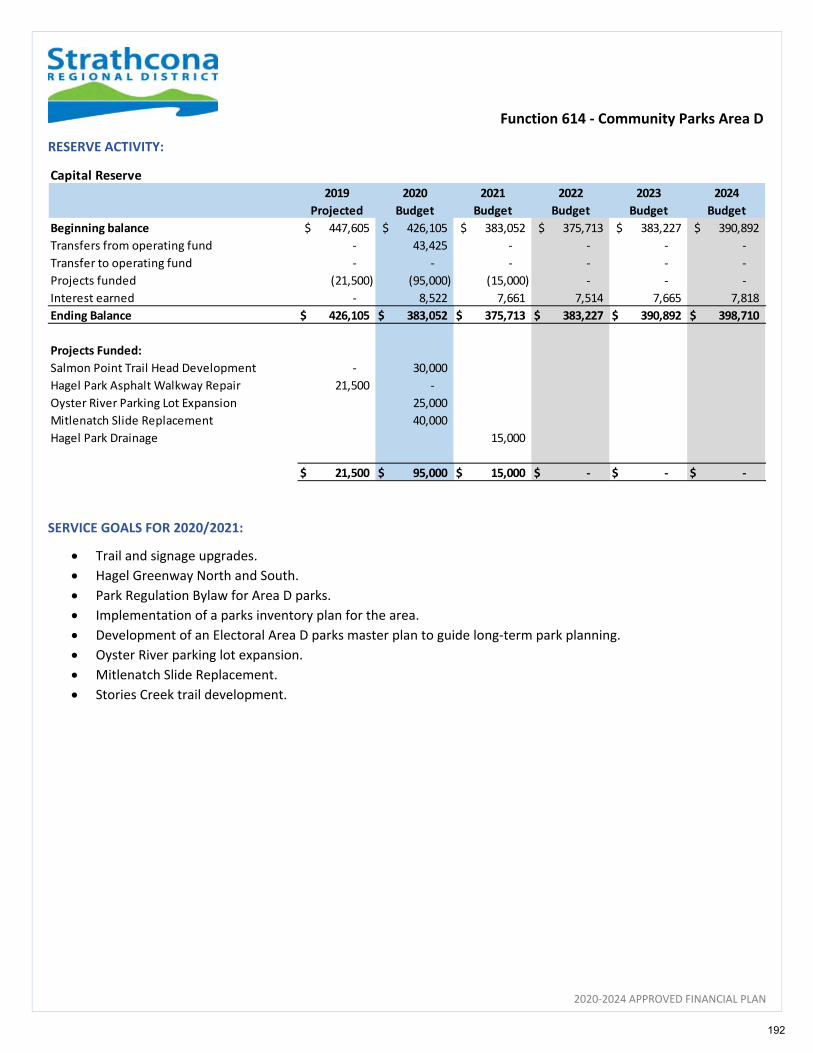
Function 614 ‐ Community Parks Area D
2020‐2024 APPROVED FINANCIAL PLAN
RESERVE ACTIVITY:
SERVICE GOALS FOR 2020/2021:
Trail and signage upgrades.
Hagel Greenway North and South.
Park Regulation Bylaw for Area D parks.
Implementation of a parks inventory plan for the area.
Development of an Electoral Area D parks master plan to guide long‐term park planning.
Oyster River parking lot expansion.
Mitlenatch Slide Replacement.
Stories Creek trail development.
Capital Reserve2019
Projected
2020
Budget
2021
Budget
2022
Budget
2023
Budget
2024
Budget
Beginning balance 447,605$ 426,105$ 383,052$ 375,713$ 383,227$ 390,892$
Transfers from operating fund ‐ 43,425 ‐ ‐ ‐ ‐
Transfer to operating fund ‐ ‐ ‐ ‐ ‐ ‐
Projects funded (21,500) (95,000) (15,000) ‐ ‐ ‐
Interest earned ‐ 8,522 7,661 7,514 7,665 7,818
Ending Balance 426,105$ 383,052$ 375,713$ 383,227$ 390,892$ 398,710$
Projects Funded:
Salmon Point Trail Head Development ‐ 30,000
Hagel Park Asphalt Walkway Repair 21,500 ‐
Oyster River Parking Lot Expansion 25,000
Mitlenatch Slide Replacement 40,000
Hagel Park Drainage 15,000
21,500$ 95,000$ 15,000$ ‐$ ‐$ ‐$
192

Function 750 ‐ Electoral Area D Street Lighting Service
2020‐2024 APPROVED FINANCIAL PLAN
SERVICE OVERVIEW:
This function provides street lighting for a defined portion of Electoral Area D.
The authority for this service was originally established through Bylaw 64 on June 28, 1971, with amendments with Bylaw
143 on October 25, 2012 where all seven Area D street lighting services were merged into a single service. The maximum
levy for this service is $0.20 per $1,000 of the assessed value of the defined portion of Electoral Area D.
OPERATING BUDGET SUMMARY:
BUDGET VARIANCE HIGHLIGHTS:
1/11 – Projected ongoing rate increases for BC Hydro, and related increases to property tax requisition to fund.
TAX REQUISITION SUMMARY:
SERVICE GOALS FOR 2020/2021:
Maintain service levels.
2019
Projection
2019
Budget
2020
Budget
2021
Budget
2022
Budget
2023
Budget
2024
Budget
750 ‐ Electoral Area D Street Lighting Service
Operating Revenue
1 ‐ Property tax requisition (33,840) (33,840) (35,030) (37,201) (37,952) (38,718) (39,500)
4 ‐ Other revenue (360) (360) (360) (360) (360) (360) (360)
9 ‐ Prior year surplus (1,887) (1,852) (1,434) ‐ ‐ ‐ ‐
Operating Revenue Total (36,087) (36,052) (36,824) (37,561) (38,312) (39,078) (39,860)
Operating Expense
11 ‐ Operating expenses 34,653 36,052 36,824 37,561 38,312 39,078 39,860
Operating Expense Total 34,653 36,052 36,824 37,561 38,312 39,078 39,860
750 ‐ Electoral Area D Street Lighting Service Total $ (1,434) $ ‐ $ ‐ $ ‐ $ ‐ $ ‐ $ ‐
Requisition Allocation2019
Actual
2020
Budget
2021
Budget
2022
Budget
2023
Budget
2024
Budget
Electoral Area:
Area D 33,840$ 35,030$ 37,201$ 37,952$ 38,718$ 39,500$
TOTAL 33,840$ 35,030$ 37,201$ 37,952$ 38,718$ 39,500$
Change $ 1,190 2,171 751 766 782
Change % 3.5% 6.2% 2.0% 2.0% 2.0%
Tax Rate Estimate (Per $1,000) 0.1091 $ 0.1117 $ 0.1186 $ 0.1210 $ 0.1235 $ 0.1260 $
Maximum Requisition Limit 61,628 $ 62,437 $
193

Function 785 ‐ Transit ‐ Area D
2020‐2024 APPROVED FINANCIAL PLAN
SERVICE OVERVIEW:
The transit service in Area D is part of a shared service agreement with the City Campbell River through BC Transit, with
Area D paying approximately 12% of the overall system costs. There is a transit exchange near the Oyster River where the
Campbell River transit system meets the Comox Valley transit system so any upgrades need to be coordinated with the
three entities.
The authority for this service was established through Bylaw 1340 on July 29, 1991. The maximum levy for this service is
$0.20 per $1,000 of the assessed value of Electoral Area D.
OPERATING BUDGET SUMMARY:
BUDGET VARIANCE HIGHLIGHTS:
1/11 – Property tax requisition increasing to align with ongoing increases of Area D’s share of transit service costs.
Electoral Area D pays 11.41% of net conventional transit costs and 12% of net custom transit costs through the
City and BC Transit. The average increase of the shared services contract is 6% annually.
9/14 – Prior year surplus and operating costs included a $20,000 carry forward to replace Area D bus shelters,
which has been re‐allocated to the capital plan for 2020.
CAPITAL BUDGET:
2019
Projection
2019
Budget
2020
Budget
2021
Budget
2022
Budget
2023
Budget
2024
Budget
785 ‐ Transit ‐ Area D
Operating Revenue
1 ‐ Property tax requisition (156,792) (156,792) (159,037) (176,612) (184,529) (192,681) (201,075)
9 ‐ Prior year surplus (26,683) (22,234) (26,243) ‐ ‐ ‐ ‐
Operating Revenue Total (183,475) (179,026) (185,280) (176,612) (184,529) (192,681) (201,075)
Operating Expense
11 ‐ Operating expenses 157,232 179,026 165,280 176,612 184,529 192,681 201,075
14 ‐ Transfers to reserves ‐ ‐ 20,000 ‐ ‐ ‐ ‐
Operating Expense Total 157,232 179,026 185,280 176,612 184,529 192,681 201,075
785 ‐ Transit ‐ Area D Total $ (26,243) $ ‐ $ ‐ $ ‐ $ ‐ $ ‐ $ ‐
Project Title2020
CFWD
2020
Budget
2021
Budget
2022
Budget
2023
Budget
2024
BudgetFunding
Bus Shelter Replacement $ ‐ $ 20,000 $ ‐ $ ‐ $ ‐ $ ‐ Reserve
TOTAL ‐$ 20,000$ ‐$ ‐$ ‐$ ‐$
Replacement and installation of bus shelters for the Area D transit route; locations to be determined.
194

Function 785 ‐ Transit ‐ Area D
2020‐2024 APPROVED FINANCIAL PLAN
TAX REQUISITION SUMMARY:
RESERVE SUMMARY:
ACTIVE RESERVES:
SERVICE GOALS FOR 2020/2021:
Increase ridership through improved infrastructure, scheduling and promotion.
Crosswalk/bus & shelter/stop review and improvement program, promotion program, shelter maintenance,
updating the transit agreement with CCR.
Glenmore transit exchange upgrade planning.
Per Electoral Area Director, review the current shared services contract with the City of Campbell River as the
service levels for Electoral Area D have been decreased without any reduction of cost.
Requisition Allocation2019
Actual
2020
Budget
2021
Budget
2022
Budget
2023
Budget
2024
Budget
Electoral Area:
Area D 156,792$ 159,037$ 176,612$ 184,529$ 192,681$ 201,075$
TOTAL 156,792$ 159,037$ 176,612$ 184,529$ 192,681$ 201,075$
Change $ 2,245 17,575 7,917 8,152 8,394
Change % 1.4% 11.1% 4.5% 4.4% 4.4%
Tax Rate Estimate (Per $1,000) 0.1186 $ 0.1175 $ 0.1304 $ 0.1363 $ 0.1423 $ 0.1485 $
Maximum Requisition Limit 202,848 $ 207,353 $
Reserve Type2019
Projected
2020
Budget
2021
Budget
2022
Budget
2023
Budget
2024
Budget
Appropriated Surplus 15,000$ 15,000$ 15,000$ 15,000$ 15,000$ 15,000$
TOTAL 15,000$ 15,000$ 15,000$ 15,000$ 15,000$ 15,000$
Appropriated Surplus Reserve2019
Projected
2020
Budget
2021
Budget
2022
Budget
2023
Budget
2024
Budget
Beginning balance 15,000$ 15,000$ 15,000$ 15,000$ 15,000$ 15,000$
Transfers from operating fund ‐ 20,000 ‐ ‐ ‐ ‐
Transfer to operating fund ‐ ‐ ‐ ‐ ‐ ‐
Projects funded ‐ (20,000) ‐ ‐ ‐ ‐
Ending Balance 15,000$ 15,000$ 15,000$ 15,000$ 15,000$ 15,000$
Projects Funded:
Bus Shelter Replacement 20,000
‐$ 20,000$ ‐$ ‐$ ‐$ ‐$
195
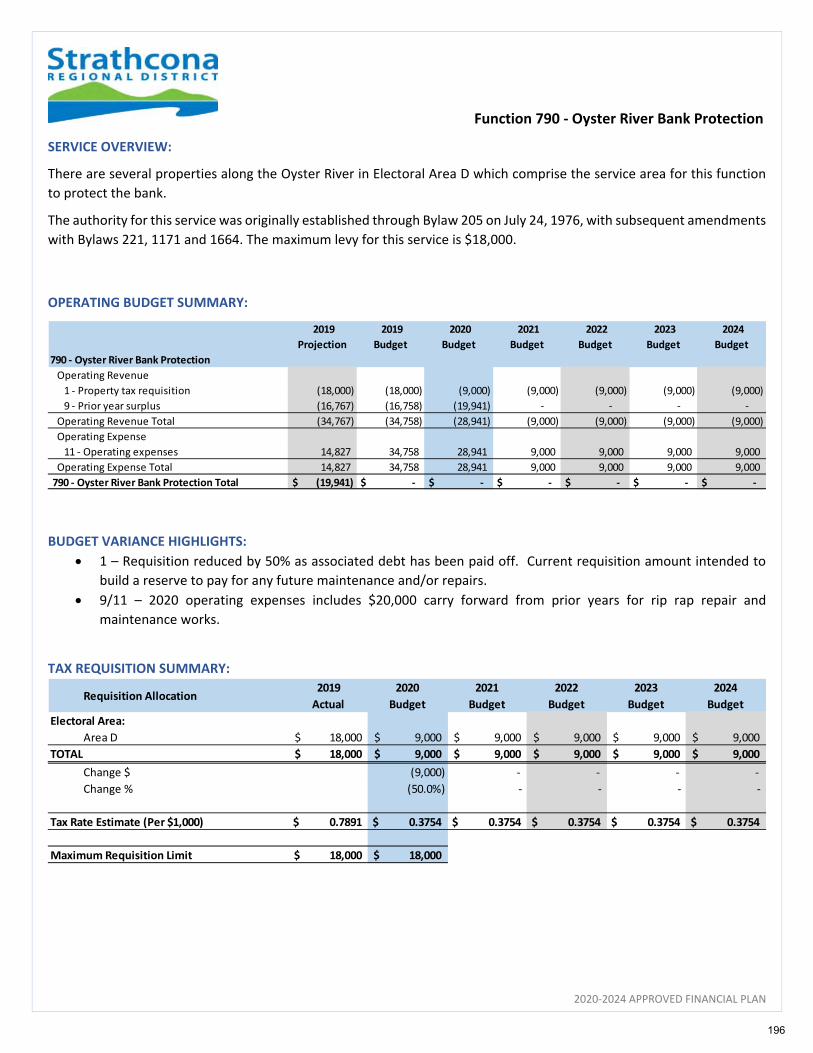
Function 790 ‐ Oyster River Bank Protection
2020‐2024 APPROVED FINANCIAL PLAN
SERVICE OVERVIEW:
There are several properties along the Oyster River in Electoral Area D which comprise the service area for this function
to protect the bank.
The authority for this service was originally established through Bylaw 205 on July 24, 1976, with subsequent amendments
with Bylaws 221, 1171 and 1664. The maximum levy for this service is $18,000.
OPERATING BUDGET SUMMARY:
BUDGET VARIANCE HIGHLIGHTS:
1 – Requisition reduced by 50% as associated debt has been paid off. Current requisition amount intended to
build a reserve to pay for any future maintenance and/or repairs.
9/11 – 2020 operating expenses includes $20,000 carry forward from prior years for rip rap repair and
maintenance works.
TAX REQUISITION SUMMARY:
2019
Projection
2019
Budget
2020
Budget
2021
Budget
2022
Budget
2023
Budget
2024
Budget
790 ‐ Oyster River Bank Protection
Operating Revenue
1 ‐ Property tax requisition (18,000) (18,000) (9,000) (9,000) (9,000) (9,000) (9,000)
9 ‐ Prior year surplus (16,767) (16,758) (19,941) ‐ ‐ ‐ ‐
Operating Revenue Total (34,767) (34,758) (28,941) (9,000) (9,000) (9,000) (9,000)
Operating Expense
11 ‐ Operating expenses 14,827 34,758 28,941 9,000 9,000 9,000 9,000
Operating Expense Total 14,827 34,758 28,941 9,000 9,000 9,000 9,000
790 ‐ Oyster River Bank Protection Total $ (19,941) $ ‐ $ ‐ $ ‐ $ ‐ $ ‐ $ ‐
Requisition Allocation2019
Actual
2020
Budget
2021
Budget
2022
Budget
2023
Budget
2024
Budget
Electoral Area:
Area D 18,000$ 9,000$ 9,000$ 9,000$ 9,000$ 9,000$
TOTAL 18,000$ 9,000$ 9,000$ 9,000$ 9,000$ 9,000$
Change $ (9,000) ‐ ‐ ‐ ‐
Change % (50.0%) ‐ ‐ ‐ ‐
Tax Rate Estimate (Per $1,000) 0.7891 $ 0.3754 $ 0.3754 $ 0.3754 $ 0.3754 $ 0.3754 $
Maximum Requisition Limit 18,000 $ 18,000 $
196
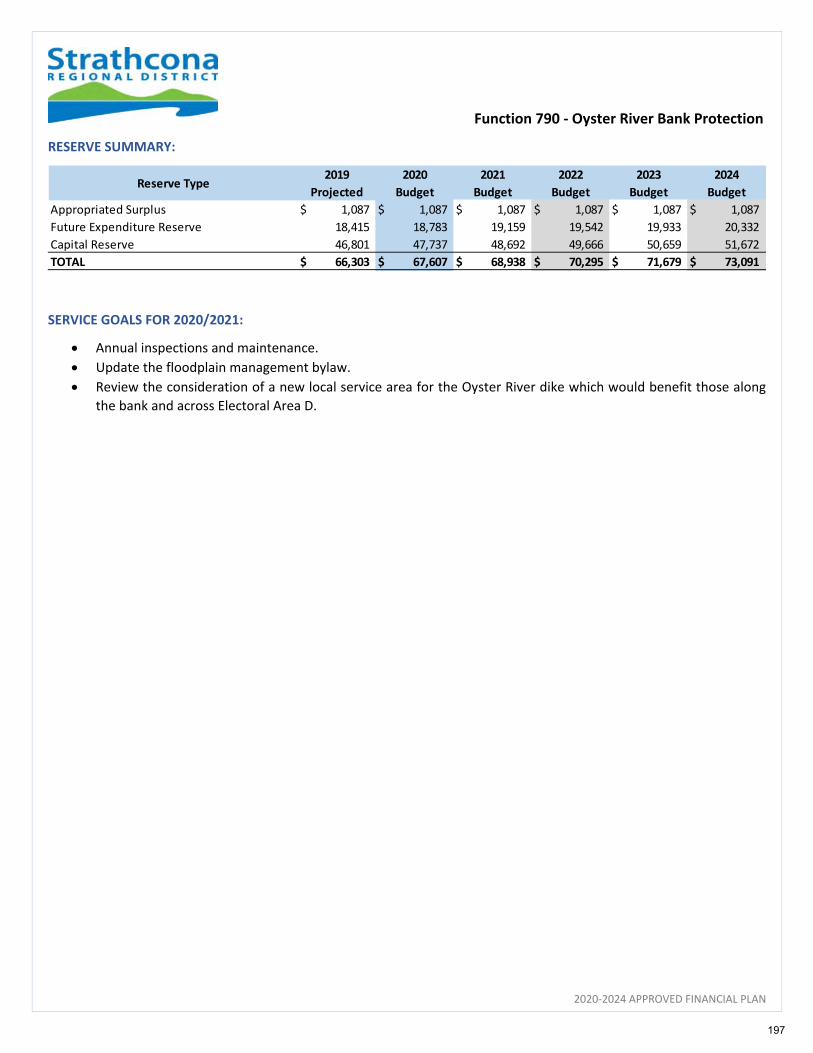
Function 790 ‐ Oyster River Bank Protection
2020‐2024 APPROVED FINANCIAL PLAN
RESERVE SUMMARY:
SERVICE GOALS FOR 2020/2021:
Annual inspections and maintenance.
Update the floodplain management bylaw.
Review the consideration of a new local service area for the Oyster River dike which would benefit those along
the bank and across Electoral Area D.
Reserve Type2019
Projected
2020
Budget
2021
Budget
2022
Budget
2023
Budget
2024
Budget
Appropriated Surplus 1,087$ 1,087$ 1,087$ 1,087$ 1,087$ 1,087$
Future Expenditure Reserve 18,415 18,783 19,159 19,542 19,933 20,332
Capital Reserve 46,801 47,737 48,692 49,666 50,659 51,672
TOTAL 66,303$ 67,607$ 68,938$ 70,295$ 71,679$ 73,091$
197

Electoral Area D – Business Cases
2020‐2024 APPROVED FINANCIAL PLAN
2020 Financial Plan - Business Case Asset Management Data Collection
Executive Summary
A key finding in the recently completed Asset Management Plan was that the SRD’s asset data information for linear infrastructure for sewer and water is very high level and lacking granularity which is difficult to plan efficiently for ongoing maintenance and asset replacement. Parks data was also identified as very limited given the many assets contributed to the SRD by provincial and other agencies, as well as limited condition of this expansive asset infrastructure spreading diverse geographic electoral areas. This led to difficulty in quantifying the estimated replacement value, condition rating, and annual sustainable investment levels for capital re-investment which limits the ability for future planning and efficient management of the parks service in each of electoral Area B, C, and D where this service exists.
Improving the asset data inventory for completeness, granularity, accuracy, and condition is the first recommendation in the asset management improvement strategy. The SRD does not have the staffing capacity to collect this data therefore it is recommended that a dedicated resource is allocated to collect this key data for sewer, water, and parks infrastructure in 2019 to improve management of these core infrastructure assets moving forward.
Business Problem and Opportunity
Currently, the data sets for linear and parks infrastructure are a patchwork of as-built drawings, work order invoices, feasibility studies and staff knowledge using information available. The asset management plan has shown that the greatest weakness for forecasting renewals and replacement is the lack of granularity of the data. In order to accurately forecast the strategic capital re-investments and efficient service delivery, more comprehensive data sets are required. This can only be accomplished by boots-on-the-ground asset identification and condition assessments.
A focused effort to collect this data for sewer, water, and parks infrastructure through a dedicated resource would maximize the investment in this effort and minimize costs, while ensuring consistent data collection practices to ensure efficient management of this core information moving forward. Utilizing external resources with expertise and experience would ensure that the deliverables would provide long-lasting benefit.
Proposed Project Objectives
Collect data to improve current data sets with regards to asset location and condition to enhance inventory for future re-investment forecasting through asset management as recommended in the asset management improvement strategies.
Business Risks The coarse nature of the current asset inventory limits the ability to plan for future renewals and re-investments. This puts the organization at risk of unforeseen system failures and service interruptions as well as an increase in financial risk caused by these potential situations. The lack of detailed asset data also limits the ability to strategically plan for capital re-investment and maintenance of assets on the most needed areas.
Cost Benefits Analysis and Proposed Source(s) of Funding
The estimated costs to undertake this project is $40,000 which would maximize funding allocated by combining under one project; funding would be distributed to the five service areas minimizing costs to each service. This work would fall under asset management practices implementation and would be eligible for Community Works Reserve funding. The respective electoral area Community Works Reserve balances at the end of 2018 having balances of $476,388 for Area B, $1,342,658 for Area C, and $2,509,833. Alternatively, this operating project could be funded through the respective services areas Future Expenditure Reserves; Area B having a 2018 year-ending balance of $67,059, Area C $29,353, and Area D $225,394.
a) Total Costs 2020 2021 2022 2023 2024
Capital Costs $ $ $ $ $
Operational Revenues $ $ $ $ $
Operational Costs $40,000 $ $ $ $
Total $40,000 $ $ $4 $
198

Electoral Area D – Business Cases
2020‐2024 APPROVED FINANCIAL PLAN
2020 Financial Plan - Business Case Asset Management Data Collection
b) Benefits
Tangible Benefits Completed asset inventory and data sets for core infrastructure, enhancing service management practices.
Intangible Benefits Ensures sustainable service delivery and efficient use of available resources.
Summary Recommendation THAT the 2020-2024 Financial Plan includes $8,000 in operational funding for asset management data collection for Area B parks service, to be funded from Electoral Area B Community Works (Gas Tax) Reserve.
THAT the 2020-2024 Financial Plan includes $8,000 in operational funding for asset management data collection for Area C parks service and $8,000 for the Quathiaski Cove sewer service, for a total of $16,000 to be funded from Electoral Area C Community Works (Gas Tax) Reserve. THAT the 2020-2024 Financial Plan includes $8,000 in operational funding for asset management data collection for Area D parks service and $8,000 for the Area D water service, for a total of $16,000 to be funded from Electoral Area D Community Works (Gas Tax) Reserve.
199
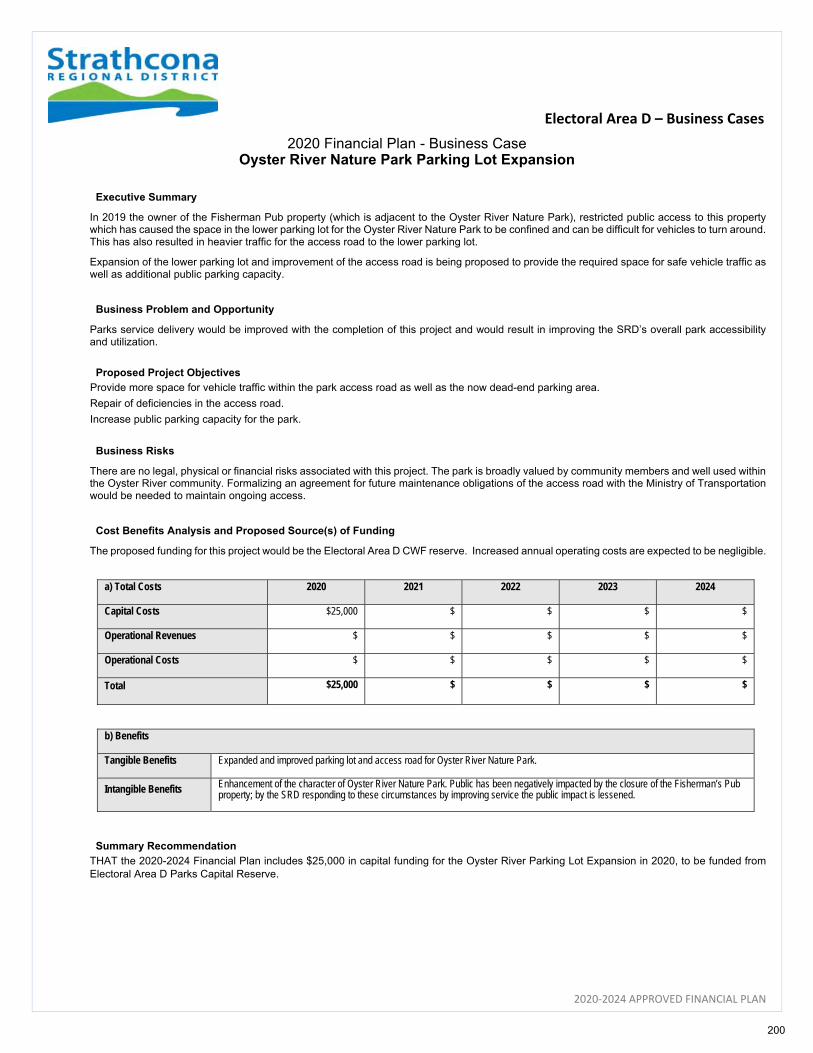
Electoral Area D – Business Cases
2020‐2024 APPROVED FINANCIAL PLAN
2020 Financial Plan - Business Case Oyster River Nature Park Parking Lot Expansion
Executive Summary
In 2019 the owner of the Fisherman Pub property (which is adjacent to the Oyster River Nature Park), restricted public access to this property which has caused the space in the lower parking lot for the Oyster River Nature Park to be confined and can be difficult for vehicles to turn around. This has also resulted in heavier traffic for the access road to the lower parking lot.
Expansion of the lower parking lot and improvement of the access road is being proposed to provide the required space for safe vehicle traffic as well as additional public parking capacity.
Business Problem and Opportunity
Parks service delivery would be improved with the completion of this project and would result in improving the SRD’s overall park accessibility and utilization.
Proposed Project Objectives
Provide more space for vehicle traffic within the park access road as well as the now dead-end parking area.
Repair of deficiencies in the access road.
Increase public parking capacity for the park.
Business Risks
There are no legal, physical or financial risks associated with this project. The park is broadly valued by community members and well used within the Oyster River community. Formalizing an agreement for future maintenance obligations of the access road with the Ministry of Transportation would be needed to maintain ongoing access.
Cost Benefits Analysis and Proposed Source(s) of Funding
The proposed funding for this project would be the Electoral Area D CWF reserve. Increased annual operating costs are expected to be negligible.
a) Total Costs 2020 2021 2022 2023 2024
Capital Costs $25,000 $ $ $ $
Operational Revenues $ $ $ $ $
Operational Costs $ $ $ $ $
Total $25,000 $ $ $ $
b) Benefits
Tangible Benefits Expanded and improved parking lot and access road for Oyster River Nature Park.
Intangible Benefits Enhancement of the character of Oyster River Nature Park. Public has been negatively impacted by the closure of the Fisherman’s Pub property; by the SRD responding to these circumstances by improving service the public impact is lessened.
Summary Recommendation
THAT the 2020-2024 Financial Plan includes $25,000 in capital funding for the Oyster River Parking Lot Expansion in 2020, to be funded from Electoral Area D Parks Capital Reserve.
200
2020‐2024 APPROVED FINANCIAL PLAN
Strathcona Gardens Recreation Complex
Strathcona Gardens Recreation Complex is a multi‐use facility located within the City of Campbell River. This complex
includes two NHL‐sized arenas, a leisure ice pad, a 37.5 metre pool, a leisure pool, a weight room, a fitness studio and
meeting rooms. In addition to user fees, this well‐used facility is funded by the taxpayers of the City of Campbell River and
Electoral Area D (Oyster Bay‐Buttle Lake).
FINANCIAL PLAN
2020 – 2024
Rebecca Spit, Quadra Island
201
Strathcona Gardens Recreation Complex Summary
2020‐2024 APPROVED FINANCIAL PLAN
Strathcona Gardens Recreation Complex includes the following functions:
Function # ‐ Function Description
640 ‐ Strathcona Gardens
641 ‐ Strathcona Gardens ‐ Administration & Concession
642 ‐ Strathcona Gardens ‐ Aquatics, Fitness & Rehab
643 ‐ Strathcona Gardens ‐ Facility Operations
644 ‐ Strathcona Gardens ‐ Ice & Other Programs
202
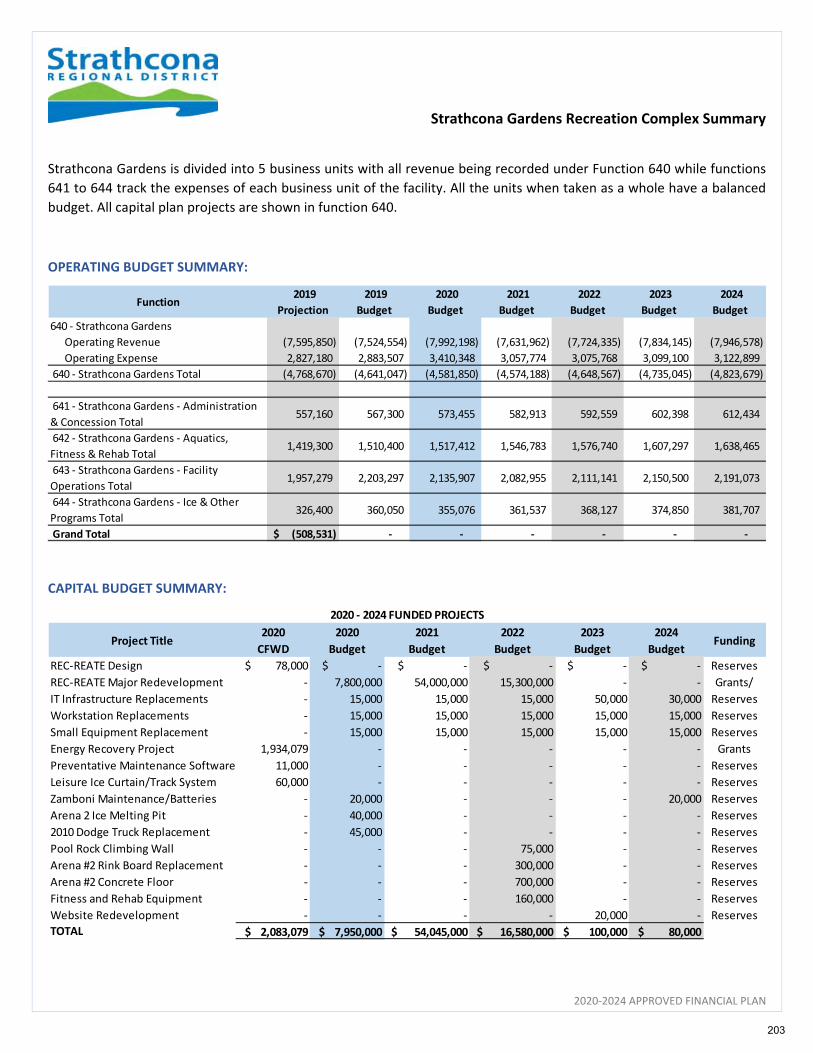
Strathcona Gardens Recreation Complex Summary
2020‐2024 APPROVED FINANCIAL PLAN
Strathcona Gardens is divided into 5 business units with all revenue being recorded under Function 640 while functions
641 to 644 track the expenses of each business unit of the facility. All the units when taken as a whole have a balanced
budget. All capital plan projects are shown in function 640.
OPERATING BUDGET SUMMARY:
CAPITAL BUDGET SUMMARY:
Function 2019
Projection
2019
Budget
2020
Budget
2021
Budget
2022
Budget
2023
Budget
2024
Budget
640 ‐ Strathcona Gardens
Operating Revenue (7,595,850) (7,524,554) (7,992,198) (7,631,962) (7,724,335) (7,834,145) (7,946,578)
Operating Expense 2,827,180 2,883,507 3,410,348 3,057,774 3,075,768 3,099,100 3,122,899
640 ‐ Strathcona Gardens Total (4,768,670) (4,641,047) (4,581,850) (4,574,188) (4,648,567) (4,735,045) (4,823,679)
641 ‐ Strathcona Gardens ‐ Administration
& Concession Total 557,160 567,300 573,455 582,913 592,559 602,398 612,434
642 ‐ Strathcona Gardens ‐ Aquatics,
Fitness & Rehab Total 1,419,300 1,510,400 1,517,412 1,546,783 1,576,740 1,607,297 1,638,465
643 ‐ Strathcona Gardens ‐ Facility
Operations Total 1,957,279 2,203,297 2,135,907 2,082,955 2,111,141 2,150,500 2,191,073
644 ‐ Strathcona Gardens ‐ Ice & Other
Programs Total 326,400 360,050 355,076 361,537 368,127 374,850 381,707
Grand Total (508,531)$ ‐ ‐ ‐ ‐ ‐ ‐
Project Title2020
CFWD
2020
Budget
2021
Budget
2022
Budget
2023
Budget
2024
BudgetFunding
REC‐REATE Design $ 78,000 $ ‐ $ ‐ $ ‐ $ ‐ $ ‐ Reserves
REC‐REATE Major Redevelopment ‐ 7,800,000 54,000,000 15,300,000 ‐ ‐ Grants/
IT Infrastructure Replacements ‐ 15,000 15,000 15,000 50,000 30,000 Reserves
Workstation Replacements ‐ 15,000 15,000 15,000 15,000 15,000 Reserves
Small Equipment Replacement ‐ 15,000 15,000 15,000 15,000 15,000 Reserves
Energy Recovery Project 1,934,079 ‐ ‐ ‐ ‐ ‐ Grants
Preventative Maintenance Software 11,000 ‐ ‐ ‐ ‐ ‐ Reserves
Leisure Ice Curtain/Track System 60,000 ‐ ‐ ‐ ‐ ‐ Reserves
Zamboni Maintenance/Batteries ‐ 20,000 ‐ ‐ ‐ 20,000 Reserves
Arena 2 Ice Melting Pit ‐ 40,000 ‐ ‐ ‐ ‐ Reserves
2010 Dodge Truck Replacement ‐ 45,000 ‐ ‐ ‐ ‐ Reserves
Pool Rock Climbing Wall ‐ ‐ ‐ 75,000 ‐ ‐ Reserves
Arena #2 Rink Board Replacement ‐ ‐ ‐ 300,000 ‐ ‐ Reserves
Arena #2 Concrete Floor ‐ ‐ ‐ 700,000 ‐ ‐ Reserves
Fitness and Rehab Equipment ‐ ‐ ‐ 160,000 ‐ ‐ Reserves
Website Redevelopment ‐ ‐ ‐ ‐ 20,000 ‐ Reserves
TOTAL $ 2,083,079 $ 7,950,000 $ 54,045,000 $ 16,580,000 $ 100,000 $ 80,000
2020 ‐ 2024 FUNDED PROJECTS
203
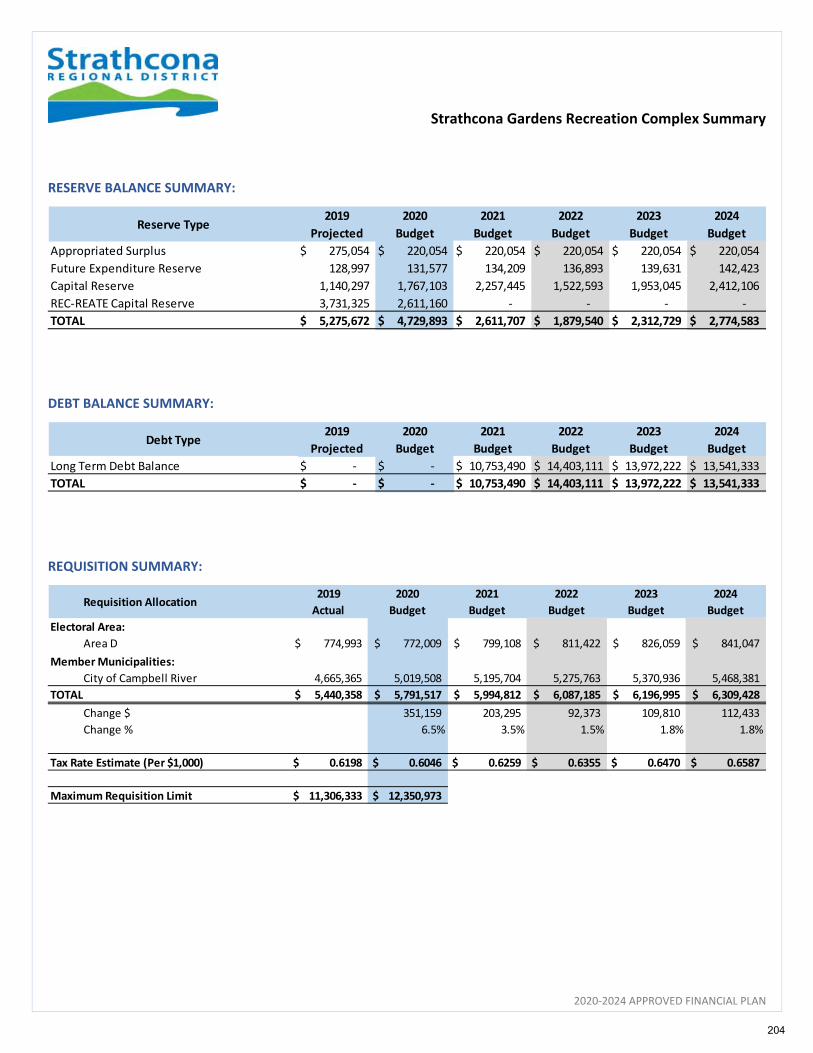
Strathcona Gardens Recreation Complex Summary
2020‐2024 APPROVED FINANCIAL PLAN
RESERVE BALANCE SUMMARY:
DEBT BALANCE SUMMARY:
REQUISITION SUMMARY:
Reserve Type2019
Projected
2020
Budget
2021
Budget
2022
Budget
2023
Budget
2024
Budget
Appropriated Surplus 275,054$ 220,054$ 220,054$ 220,054$ 220,054$ 220,054$
Future Expenditure Reserve 128,997 131,577 134,209 136,893 139,631 142,423
Capital Reserve 1,140,297 1,767,103 2,257,445 1,522,593 1,953,045 2,412,106
REC‐REATE Capital Reserve 3,731,325 2,611,160 ‐ ‐ ‐ ‐
TOTAL 5,275,672$ 4,729,893$ 2,611,707$ 1,879,540$ 2,312,729$ 2,774,583$
Debt Type2019
Projected
2020
Budget
2021
Budget
2022
Budget
2023
Budget
2024
Budget
Long Term Debt Balance ‐$ ‐$ 10,753,490$ 14,403,111$ 13,972,222$ 13,541,333$
TOTAL ‐$ ‐$ 10,753,490$ 14,403,111$ 13,972,222$ 13,541,333$
Requisition Allocation2019
Actual
2020
Budget
2021
Budget
2022
Budget
2023
Budget
2024
Budget
Electoral Area:
Area D 774,993$ 772,009$ 799,108$ 811,422$ 826,059$ 841,047$
Member Municipalities:
City of Campbell River 4,665,365 5,019,508 5,195,704 5,275,763 5,370,936 5,468,381
TOTAL 5,440,358$ 5,791,517$ 5,994,812$ 6,087,185$ 6,196,995$ 6,309,428$
Change $ 351,159 203,295 92,373 109,810 112,433
Change % 6.5% 3.5% 1.5% 1.8% 1.8%
Tax Rate Estimate (Per $1,000) 0.6198 $ 0.6046 $ 0.6259 $ 0.6355 $ 0.6470 $ 0.6587 $
Maximum Requisition Limit 11,306,333 $ 12,350,973 $
204
Strathcona Gardens Recreation Complex Summary
2020‐2024 APPROVED FINANCIAL PLAN
BUDGET HIGHLIGHTS FOR 2020‐2024:
Continue to focus on the pending application submitted in January 2019 to the Federal and Provincial Community,
Culture and Recreation grant fund for the major facility redevelopment project REC‐REATE estimated at a total
project cost of $77 million. Schematic design phase of the REC‐REATE Project completed in 2018.
Proceed with completing phase 3 and 4 of the $4.6 million grant funded energy retrofit project with completion
expected in fall 2020. Phases 1 and 2 which included moving from ammonia to a C02 plant were completed in fall
2019. Energy and operational efficiencies are expected through this upgrade, as well as enhanced safety for
employees and patrons moving away from an ammonia‐based system.
Continue to invest in the facility and related core assets including Arena #2, which is outside of the REC‐REATE
redevelopment project, through incremental increases to the capital renewal reserve. The recently endorsed SRD
Asset Management Plan identified the need to continue to invest in this significant community asset to ensure
sustainable service delivery. Accordingly, an additional $350,000 in recurring capital funding was approved in
January 2020.
Continue to plan ahead for operational and funding impacts with an enhanced community facility through re‐
development.
Collective agreement with the United Steel Workers Union Local 1‐1937 expires December 31, 2020; negotiation
costs are budgeted in 2020.
205
Strathcona Gardens Recreation Complex Summary
2020‐2024 APPROVED FINANCIAL PLAN
206

Strathcona Gardens Recreation Complex Summary
2020‐2024 APPROVED FINANCIAL PLAN
SERVICE OVERVIEW:
All Strathcona Gardens revenues are included in Function 640 whereas operational expenses may be grouped separately
in Functions 640 to 644. The authority for this service is provided through SLP 16, approved on February 19, 1971, with
subsequent amendments. The participants of this service are the City of Campbell River and Electoral Area D, with a
maximum requisition limit of $1.588 per $1,000 of assessed value in these service areas.
OPERATING BUDGET SUMMARY:
BUDGET VARIANCE HIGHLIGHTS:
1 – Requisition increase for 2020 entirely due to a $350,000 increase in Capital funding. 8/11 – Expenses for 2020 include $55,000 for union negotiations, funded by appropriated surplus reserve.
9 – The projected 2019 surplus for all business units of Strathcona Gardens is $509,000; this surplus is made up of
the 2018 surplus exceeding projections, lower than budgeted repairs and maintenance on the facility, reduction
in operating expenses with delayed closures for the C02 plant installation delays, staffing vacancies and leaves,
and other minor savings in operational expenses including minor capital and permits.
11 – The operational expense increases for 2020 relate to funding the remaining 50% portion of the new Assistant
Manager Facilities approved through business case in 2019, annual wages and support services increases.
12/13 ‐ Debt repayment for REC‐REATE Major Redevelopment project budgeted to start in 2022; debt repayment
funded by re‐allocating existing $1,038,095 annual REC‐REATE reserve contribution.
14 ‐ Reserve transfers for 2020 include the annual $150,000 to capital renewal reserve, the annual $1,038,095 for
REC‐REATE Strathcona Gardens redevelopment project, and an additional capital reserve transfer of $325,000 to
fund required capital renewal projects in the next five years; as well as a permanent capital funding increase of
$350,000 that was approved in early 2020.
2019
Projection
2019
Budget
2020
Budget
2021
Budget
2022
Budget
2023
Budget
2024
Budget
640 ‐ Strathcona Gardens
Operating Revenue
1 ‐ Property tax requisition (5,440,358) (5,440,358) (5,791,517) (5,994,812) (6,087,185) (6,196,995) (6,309,428)
3 ‐ Sales of services (1,507,231) (1,524,310) (1,564,950) (1,564,950) (1,564,950) (1,564,950) (1,564,950)
4 ‐ Other revenue (12,464) (5,200) (5,200) (5,200) (5,200) (5,200) (5,200)
6 ‐ Grants in lieu (45,000) (50,000) (45,000) (45,000) (45,000) (45,000) (45,000)
7 ‐ Government transfers (24,950) (22,000) (22,000) (22,000) (22,000) (22,000) (22,000)
8 ‐ Transfers from reserves ‐ ‐ (55,000) ‐ ‐ ‐ ‐
9 ‐ Prior year surplus (565,847) (482,686) (508,531) ‐ ‐ ‐ ‐
Operating Revenue Total (7,595,850) (7,524,554) (7,992,198) (7,631,962) (7,724,335) (7,834,145) (7,946,578)
Operating Expense
11 ‐ Operating expenses 1,327,180 1,383,507 1,547,253 1,519,679 1,542,553 1,565,885 1,589,684
12 ‐ Debt principal ‐ ‐ ‐ ‐ 434,661 434,661 434,661
13 ‐ Debt interest ‐ ‐ ‐ ‐ 598,554 598,554 598,554
14 ‐ Transfers to reserves 1,500,000 1,500,000 1,863,095 1,538,095 500,000 500,000 500,000
Operating Expense Total 2,827,180 2,883,507 3,410,348 3,057,774 3,075,768 3,099,100 3,122,899
640 ‐ Strathcona Gardens Total $ (4,768,670) $ (4,641,047) $ (4,581,850) $ (4,574,188) $ (4,648,567) $ (4,735,045) $ (4,823,679)
207

Function 641 – SG Admin and Concession
2020‐2024 APPROVED FINANCIAL PLAN
SERVICE OVERVIEW:
The administration function is the first point of contact for Strathcona Gardens customers and acts as the control center
for the facility. The customer service representatives work with all other functions at Strathcona Gardens to facilitate
programs, facility bookings, retail sales and generate other promotional opportunities. This function also oversees the
financial reporting and maintains the point of sale system.
The concession function is the operation of food and beverage services at Strathcona Gardens. This team provides the
patrons of Strathcona Gardens access to a variety of hot and cold food and beverages and is typically very well utilized
during hockey games and swim meets. The concession staff oversee the sale and preparation of goods and manage the
inventory of retail items utilizing the facility’s point of sale system.
OPERATING BUDGET SUMMARY:
BUDGET VARIANCE HIGHLIGHTS:
Wage and benefit increases.
GOALS FOR SERVICE IN 2020/2021:
Initiate a touch screen system that identifies which program or attraction the users are attending.
Continue to promote online registrations and provide training and education to clients to improve their access
and flexibility.
Review and evaluate concession menu options to look at pricing structure based on increases to food and
consumables, offer a product line that provides diversity to clientele based on service delivery and trends, and
pursue options for small equipment replacement (e.g. concession fryer).
2019
Projection
2019
Budget
2020
Budget
2021
Budget
2022
Budget
2023
Budget
2024
Budget
641 ‐ Strathcona Gardens ‐ Administration & Concession
Operating Expense
11 ‐ Operating expenses 557,160 567,300 573,455 582,913 592,559 602,398 612,434
Operating Expense Total 557,160 567,300 573,455 582,913 592,559 602,398 612,434
641 ‐ Strathcona Gardens ‐ Administration & $ 557,160 $ 567,300 $ 573,455 $ 582,913 $ 592,559 $ 602,398 $ 612,434
208
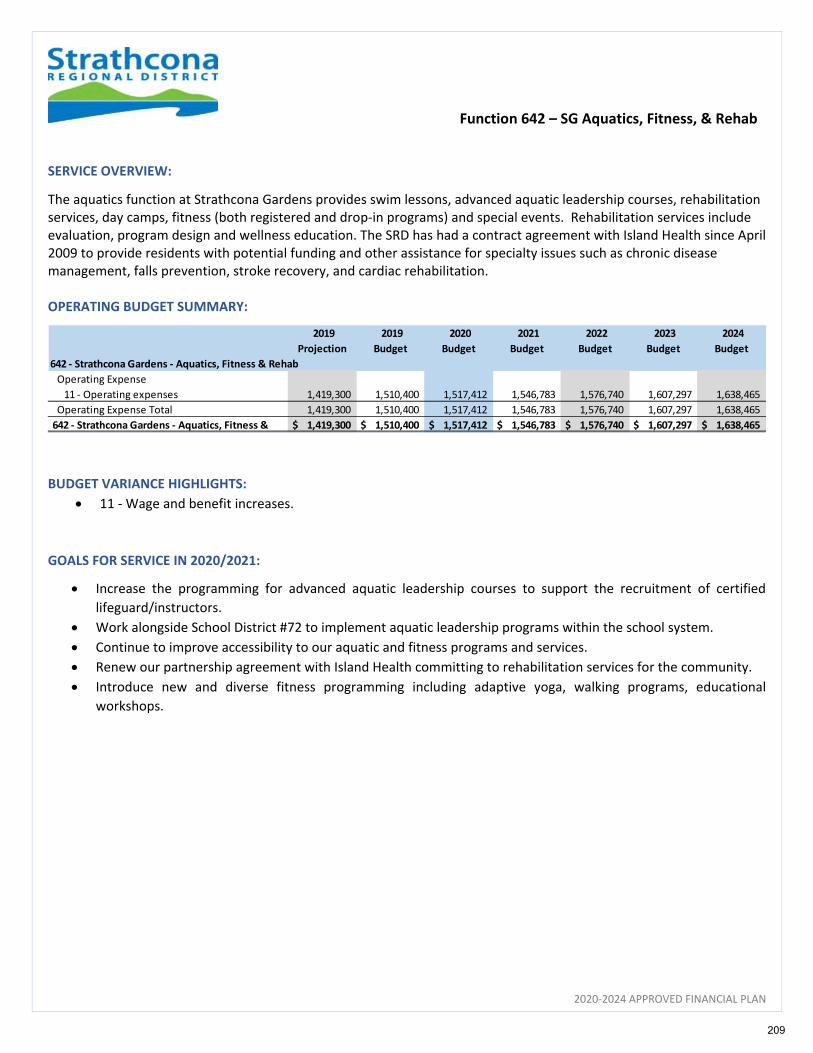
Function 642 – SG Aquatics, Fitness, & Rehab
2020‐2024 APPROVED FINANCIAL PLAN
SERVICE OVERVIEW:
The aquatics function at Strathcona Gardens provides swim lessons, advanced aquatic leadership courses, rehabilitation services, day camps, fitness (both registered and drop‐in programs) and special events. Rehabilitation services include evaluation, program design and wellness education. The SRD has had a contract agreement with Island Health since April 2009 to provide residents with potential funding and other assistance for specialty issues such as chronic disease management, falls prevention, stroke recovery, and cardiac rehabilitation. OPERATING BUDGET SUMMARY:
BUDGET VARIANCE HIGHLIGHTS:
11 ‐ Wage and benefit increases.
GOALS FOR SERVICE IN 2020/2021:
Increase the programming for advanced aquatic leadership courses to support the recruitment of certified
lifeguard/instructors.
Work alongside School District #72 to implement aquatic leadership programs within the school system.
Continue to improve accessibility to our aquatic and fitness programs and services.
Renew our partnership agreement with Island Health committing to rehabilitation services for the community.
Introduce new and diverse fitness programming including adaptive yoga, walking programs, educational
workshops.
2019
Projection
2019
Budget
2020
Budget
2021
Budget
2022
Budget
2023
Budget
2024
Budget
642 ‐ Strathcona Gardens ‐ Aquatics, Fitness & Rehab
Operating Expense
11 ‐ Operating expenses 1,419,300 1,510,400 1,517,412 1,546,783 1,576,740 1,607,297 1,638,465
Operating Expense Total 1,419,300 1,510,400 1,517,412 1,546,783 1,576,740 1,607,297 1,638,465
642 ‐ Strathcona Gardens ‐ Aquatics, Fitness & $ 1,419,300 $ 1,510,400 $ 1,517,412 $ 1,546,783 $ 1,576,740 $ 1,607,297 $ 1,638,465
209
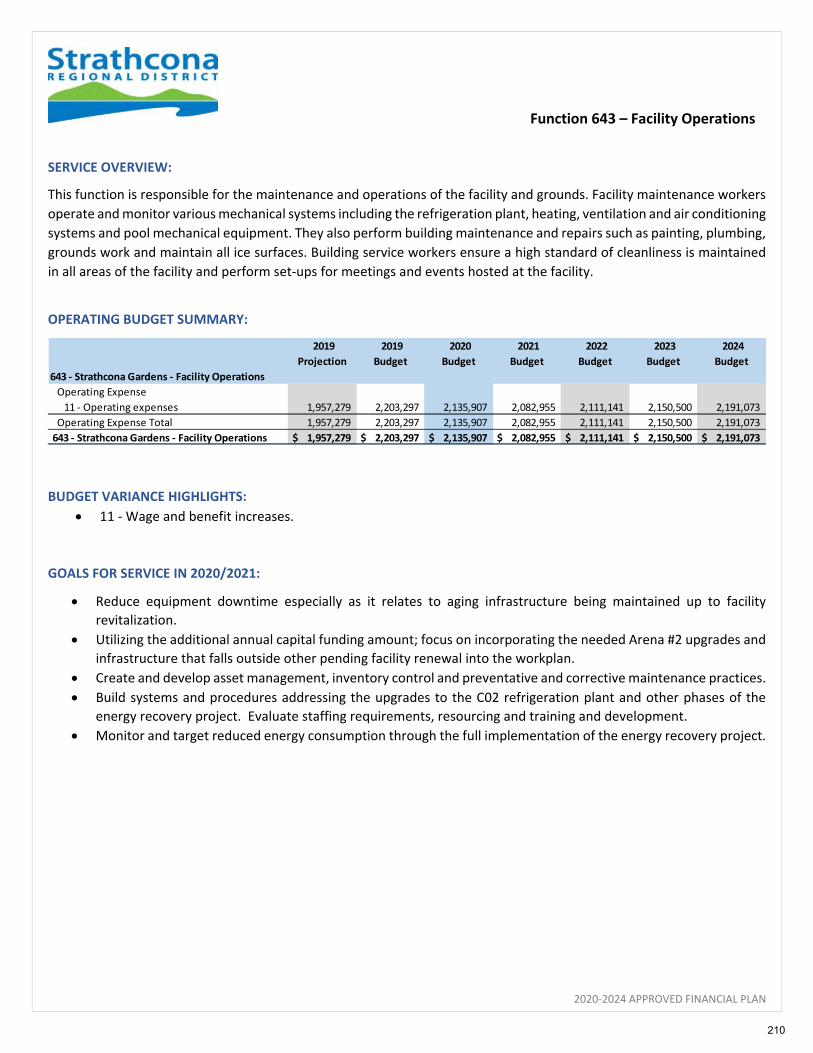
Function 643 – Facility Operations
2020‐2024 APPROVED FINANCIAL PLAN
SERVICE OVERVIEW:
This function is responsible for the maintenance and operations of the facility and grounds. Facility maintenance workers
operate and monitor various mechanical systems including the refrigeration plant, heating, ventilation and air conditioning
systems and pool mechanical equipment. They also perform building maintenance and repairs such as painting, plumbing,
grounds work and maintain all ice surfaces. Building service workers ensure a high standard of cleanliness is maintained
in all areas of the facility and perform set‐ups for meetings and events hosted at the facility.
OPERATING BUDGET SUMMARY:
BUDGET VARIANCE HIGHLIGHTS:
11 ‐ Wage and benefit increases.
GOALS FOR SERVICE IN 2020/2021:
Reduce equipment downtime especially as it relates to aging infrastructure being maintained up to facility
revitalization.
Utilizing the additional annual capital funding amount; focus on incorporating the needed Arena #2 upgrades and
infrastructure that falls outside other pending facility renewal into the workplan.
Create and develop asset management, inventory control and preventative and corrective maintenance practices.
Build systems and procedures addressing the upgrades to the C02 refrigeration plant and other phases of the
energy recovery project. Evaluate staffing requirements, resourcing and training and development.
Monitor and target reduced energy consumption through the full implementation of the energy recovery project.
2019
Projection
2019
Budget
2020
Budget
2021
Budget
2022
Budget
2023
Budget
2024
Budget
643 ‐ Strathcona Gardens ‐ Facility Operations
Operating Expense
11 ‐ Operating expenses 1,957,279 2,203,297 2,135,907 2,082,955 2,111,141 2,150,500 2,191,073
Operating Expense Total 1,957,279 2,203,297 2,135,907 2,082,955 2,111,141 2,150,500 2,191,073
643 ‐ Strathcona Gardens ‐ Facility Operations $ 1,957,279 $ 2,203,297 $ 2,135,907 $ 2,082,955 $ 2,111,141 $ 2,150,500 $ 2,191,073
210
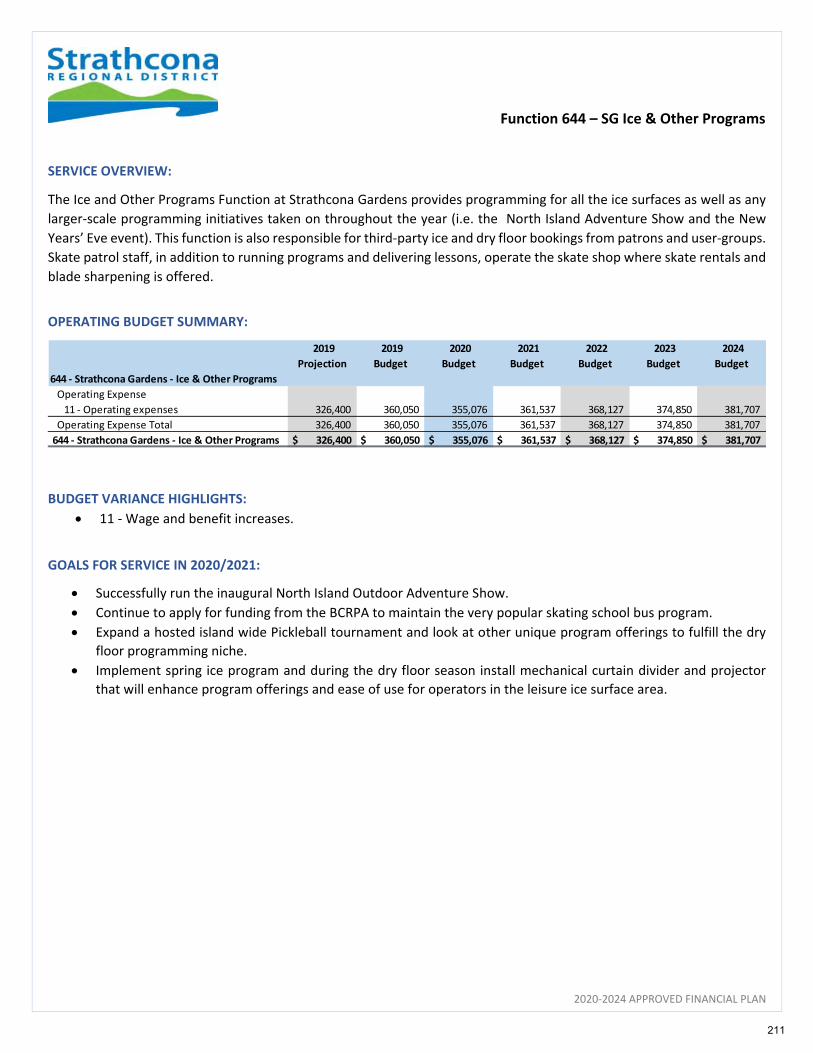
Function 644 – SG Ice & Other Programs
2020‐2024 APPROVED FINANCIAL PLAN
SERVICE OVERVIEW:
The Ice and Other Programs Function at Strathcona Gardens provides programming for all the ice surfaces as well as any
larger‐scale programming initiatives taken on throughout the year (i.e. the North Island Adventure Show and the New
Years’ Eve event). This function is also responsible for third‐party ice and dry floor bookings from patrons and user‐groups.
Skate patrol staff, in addition to running programs and delivering lessons, operate the skate shop where skate rentals and
blade sharpening is offered.
OPERATING BUDGET SUMMARY:
BUDGET VARIANCE HIGHLIGHTS:
11 ‐ Wage and benefit increases.
GOALS FOR SERVICE IN 2020/2021:
Successfully run the inaugural North Island Outdoor Adventure Show.
Continue to apply for funding from the BCRPA to maintain the very popular skating school bus program.
Expand a hosted island wide Pickleball tournament and look at other unique program offerings to fulfill the dry
floor programming niche.
Implement spring ice program and during the dry floor season install mechanical curtain divider and projector
that will enhance program offerings and ease of use for operators in the leisure ice surface area.
2019
Projection
2019
Budget
2020
Budget
2021
Budget
2022
Budget
2023
Budget
2024
Budget
644 ‐ Strathcona Gardens ‐ Ice & Other Programs
Operating Expense
11 ‐ Operating expenses 326,400 360,050 355,076 361,537 368,127 374,850 381,707
Operating Expense Total 326,400 360,050 355,076 361,537 368,127 374,850 381,707
644 ‐ Strathcona Gardens ‐ Ice & Other Programs $ 326,400 $ 360,050 $ 355,076 $ 361,537 $ 368,127 $ 374,850 $ 381,707
211
Strathcona Gardens
2020‐2024 APPROVED FINANCIAL PLAN
212
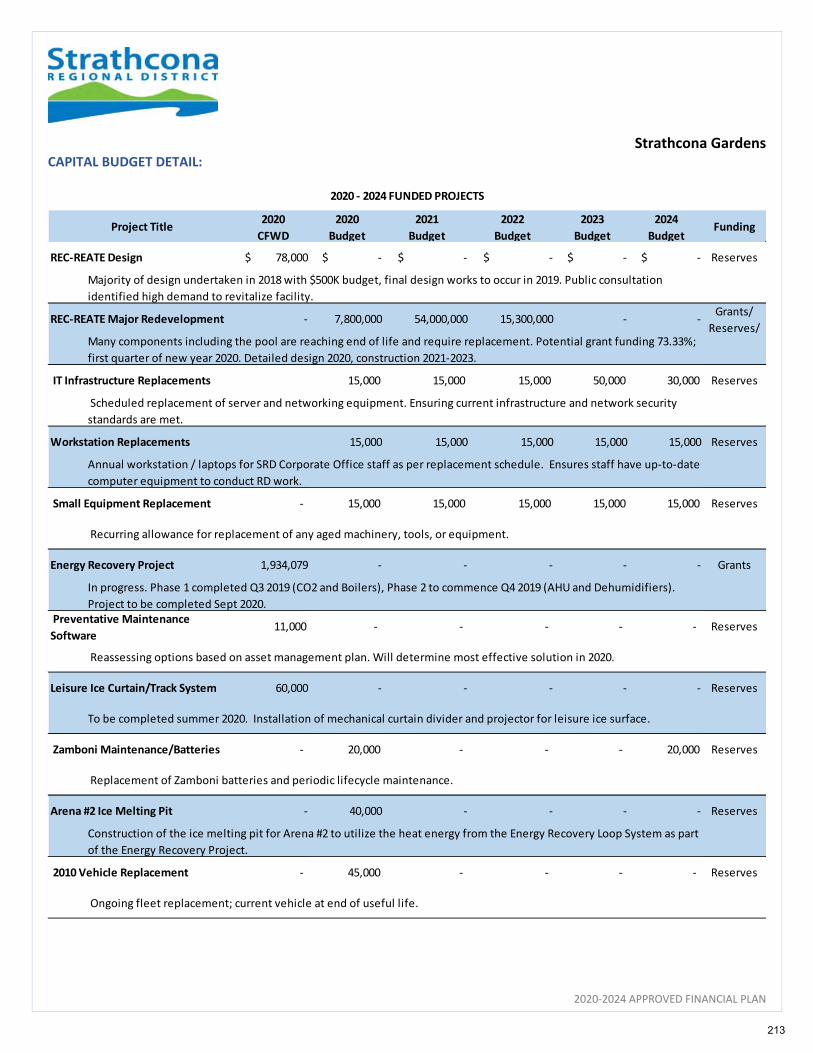
Strathcona Gardens
2020‐2024 APPROVED FINANCIAL PLAN
CAPITAL BUDGET DETAIL:
Project Title2020
CFWD
2020
Budget
2021
Budget
2022
Budget
2023
Budget
2024
BudgetFunding
REC‐REATE Design $ 78,000 $ ‐ $ ‐ $ ‐ $ ‐ $ ‐ Reserves
REC‐REATE Major Redevelopment ‐ 7,800,000 54,000,000 15,300,000 ‐ ‐ Grants/
Reserves/
IT Infrastructure Replacements 15,000 15,000 15,000 50,000 30,000 Reserves
Workstation Replacements 15,000 15,000 15,000 15,000 15,000 Reserves
Small Equipment Replacement ‐ 15,000 15,000 15,000 15,000 15,000 Reserves
Energy Recovery Project 1,934,079 ‐ ‐ ‐ ‐ ‐ Grants
Preventative Maintenance
Software 11,000 ‐ ‐ ‐ ‐ ‐ Reserves
Leisure Ice Curtain/Track System 60,000 ‐ ‐ ‐ ‐ ‐ Reserves
Zamboni Maintenance/Batteries ‐ 20,000 ‐ ‐ ‐ 20,000 Reserves
Arena #2 Ice Melting Pit ‐ 40,000 ‐ ‐ ‐ ‐ Reserves
2010 Vehicle Replacement ‐ 45,000 ‐ ‐ ‐ ‐ Reserves
Majority of design undertaken in 2018 with $500K budget, final design works to occur in 2019. Public consultation
identified high demand to revitalize facility.
Many components including the pool are reaching end of life and require replacement. Potential grant funding 73.33%;
first quarter of new year 2020. Detailed design 2020, construction 2021‐2023.
In progress. Phase 1 completed Q3 2019 (CO2 and Boilers), Phase 2 to commence Q4 2019 (AHU and Dehumidifiers).
Project to be completed Sept 2020.
2020 ‐ 2024 FUNDED PROJECTS
Ongoing fleet replacement; current vehicle at end of useful life.
Replacement of Zamboni batteries and periodic lifecycle maintenance.
Recurring allowance for replacement of any aged machinery, tools, or equipment.
Scheduled replacement of server and networking equipment. Ensuring current infrastructure and network security
standards are met.
Annual workstation / laptops for SRD Corporate Office staff as per replacement schedule. Ensures staff have up‐to‐date
computer equipment to conduct RD work.
Reassessing options based on asset management plan. Will determine most effective solution in 2020.
To be completed summer 2020. Installation of mechanical curtain divider and projector for leisure ice surface.
Construction of the ice melting pit for Arena #2 to utilize the heat energy from the Energy Recovery Loop System as part
of the Energy Recovery Project.
213
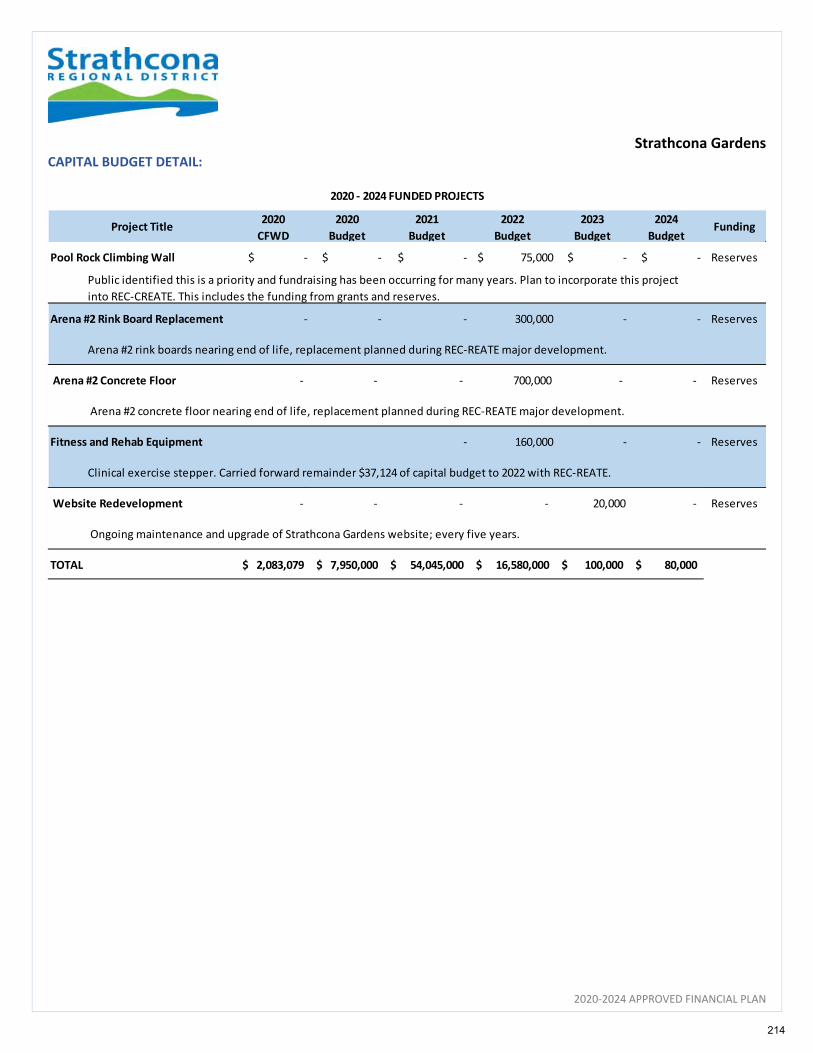
Strathcona Gardens
2020‐2024 APPROVED FINANCIAL PLAN
CAPITAL BUDGET DETAIL:
Project Title2020
CFWD
2020
Budget
2021
Budget
2022
Budget
2023
Budget
2024
BudgetFunding
Pool Rock Climbing Wall $ ‐ $ ‐ $ ‐ $ 75,000 $ ‐ $ ‐ Reserves
Arena #2 Rink Board Replacement ‐ ‐ ‐ 300,000 ‐ ‐ Reserves
Arena #2 Concrete Floor ‐ ‐ ‐ 700,000 ‐ ‐ Reserves
Fitness and Rehab Equipment ‐ 160,000 ‐ ‐ Reserves
Website Redevelopment ‐ ‐ ‐ ‐ 20,000 ‐ Reserves
TOTAL 2,083,079$ 7,950,000$ 54,045,000$ 16,580,000$ 100,000$ 80,000$
Clinical exercise stepper. Carried forward remainder $37,124 of capital budget to 2022 with REC‐REATE.
Arena #2 concrete floor nearing end of life, replacement planned during REC‐REATE major development.
Arena #2 rink boards nearing end of life, replacement planned during REC‐REATE major development.
Ongoing maintenance and upgrade of Strathcona Gardens website; every five years.
Public identified this is a priority and fundraising has been occurring for many years. Plan to incorporate this project
into REC‐CREATE. This includes the funding from grants and reserves.
2020 ‐ 2024 FUNDED PROJECTS
214
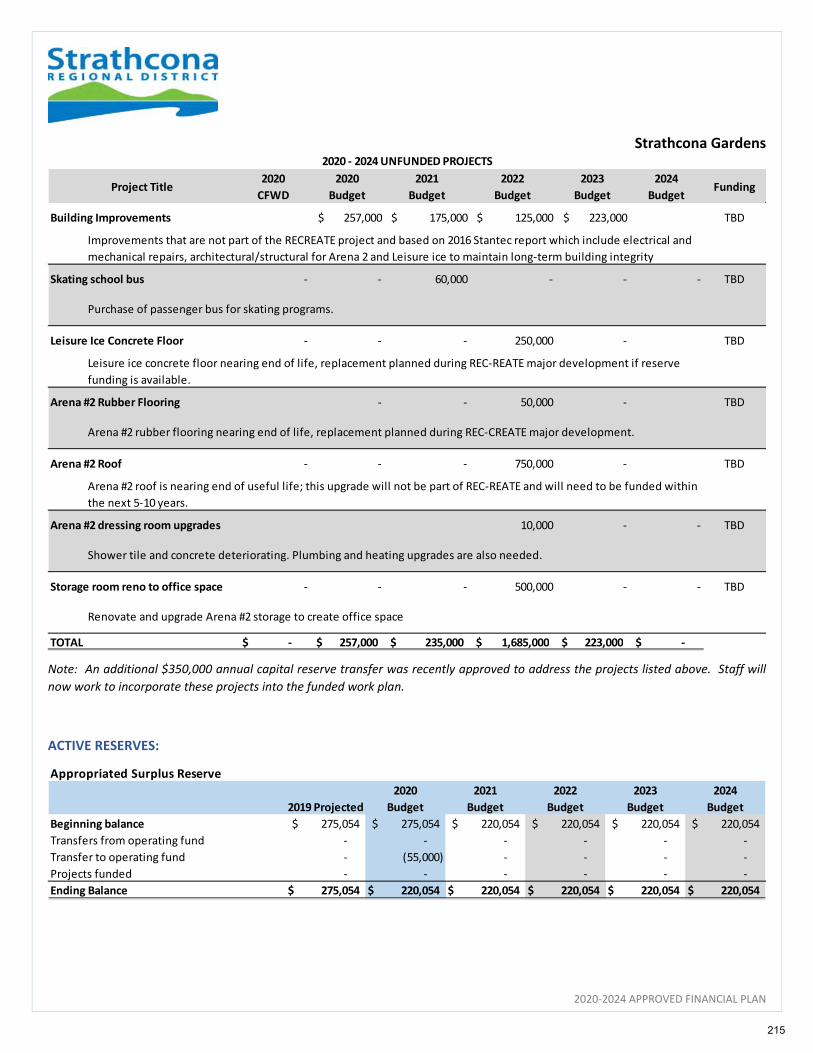
Strathcona Gardens
2020‐2024 APPROVED FINANCIAL PLAN
Note: An additional $350,000 annual capital reserve transfer was recently approved to address the projects listed above. Staff will
now work to incorporate these projects into the funded work plan.
ACTIVE RESERVES:
Project Title2020
CFWD
2020
Budget
2021
Budget
2022
Budget
2023
Budget
2024
BudgetFunding
Building Improvements $ 257,000 $ 175,000 $ 125,000 $ 223,000 TBD
Skating school bus ‐ ‐ 60,000 ‐ ‐ ‐ TBD
Leisure Ice Concrete Floor ‐ ‐ ‐ 250,000 ‐ TBD
Arena #2 Rubber Flooring ‐ ‐ 50,000 ‐ TBD
Arena #2 Roof ‐ ‐ ‐ 750,000 ‐ TBD
Arena #2 dressing room upgrades 10,000 ‐ ‐ TBD
Storage room reno to office space ‐ ‐ ‐ 500,000 ‐ ‐ TBD
TOTAL ‐$ 257,000$ 235,000$ 1,685,000$ 223,000$ ‐$
2020 ‐ 2024 UNFUNDED PROJECTS
Renovate and upgrade Arena #2 storage to create office space
Leisure ice concrete floor nearing end of life, replacement planned during REC‐REATE major development if reserve
funding is available.
Arena #2 rubber flooring nearing end of life, replacement planned during REC‐CREATE major development.
Arena #2 roof is nearing end of useful life; this upgrade will not be part of REC‐REATE and will need to be funded within
the next 5‐10 years.
Shower tile and concrete deteriorating. Plumbing and heating upgrades are also needed.
Purchase of passenger bus for skating programs.
Improvements that are not part of the RECREATE project and based on 2016 Stantec report which include electrical and
mechanical repairs, architectural/structural for Arena 2 and Leisure ice to maintain long‐term building integrity
Appropriated Surplus Reserve
2019 Projected
2020
Budget
2021
Budget
2022
Budget
2023
Budget
2024
Budget
Beginning balance 275,054$ 275,054$ 220,054$ 220,054$ 220,054$ 220,054$
Transfers from operating fund ‐ ‐ ‐ ‐ ‐ ‐
Transfer to operating fund ‐ (55,000) ‐ ‐ ‐ ‐
Projects funded ‐ ‐ ‐ ‐ ‐ ‐
Ending Balance 275,054$ 220,054$ 220,054$ 220,054$ 220,054$ 220,054$
215
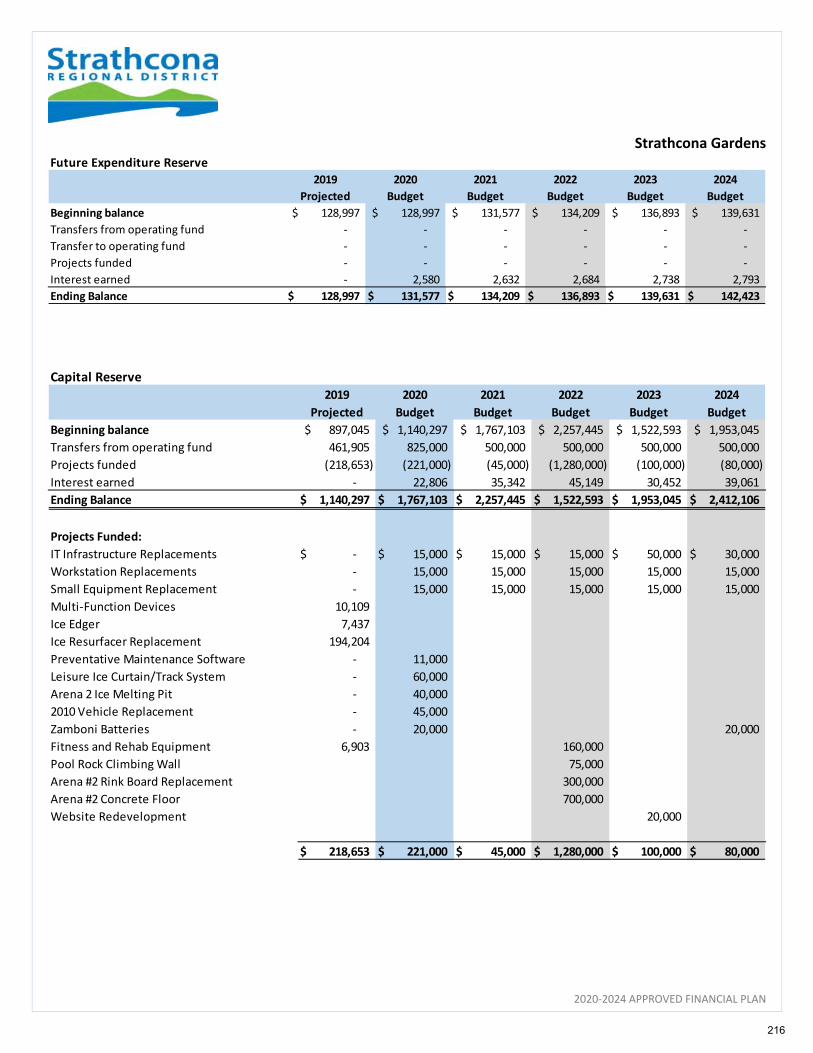
Strathcona Gardens
2020‐2024 APPROVED FINANCIAL PLAN
Future Expenditure Reserve
2019
Projected
2020
Budget
2021
Budget
2022
Budget
2023
Budget
2024
Budget
Beginning balance 128,997$ 128,997$ 131,577$ 134,209$ 136,893$ 139,631$
Transfers from operating fund ‐ ‐ ‐ ‐ ‐ ‐
Transfer to operating fund ‐ ‐ ‐ ‐ ‐ ‐
Projects funded ‐ ‐ ‐ ‐ ‐ ‐
Interest earned ‐ 2,580 2,632 2,684 2,738 2,793
Ending Balance 128,997$ 131,577$ 134,209$ 136,893$ 139,631$ 142,423$
Capital Reserve
2019
Projected
2020
Budget
2021
Budget
2022
Budget
2023
Budget
2024
Budget
Beginning balance 897,045$ 1,140,297$ 1,767,103$ 2,257,445$ 1,522,593$ 1,953,045$
Transfers from operating fund 461,905 825,000 500,000 500,000 500,000 500,000
Projects funded (218,653) (221,000) (45,000) (1,280,000) (100,000) (80,000)
Interest earned ‐ 22,806 35,342 45,149 30,452 39,061
Ending Balance 1,140,297$ 1,767,103$ 2,257,445$ 1,522,593$ 1,953,045$ 2,412,106$
Projects Funded:
IT Infrastructure Replacements ‐$ 15,000$ 15,000$ 15,000$ 50,000$ 30,000$
Workstation Replacements ‐ 15,000 15,000 15,000 15,000 15,000
Small Equipment Replacement ‐ 15,000 15,000 15,000 15,000 15,000
Multi‐Function Devices 10,109
Ice Edger 7,437
Ice Resurfacer Replacement 194,204
Preventative Maintenance Software ‐ 11,000
Leisure Ice Curtain/Track System ‐ 60,000
Arena 2 Ice Melting Pit ‐ 40,000
2010 Vehicle Replacement ‐ 45,000
Zamboni Batteries ‐ 20,000 20,000
Fitness and Rehab Equipment 6,903 160,000
Pool Rock Climbing Wall 75,000
Arena #2 Rink Board Replacement 300,000
Arena #2 Concrete Floor 700,000
Website Redevelopment 20,000
218,653$ 221,000$ 45,000$ 1,280,000$ 100,000$ 80,000$
216

Strathcona Gardens
2020‐2024 APPROVED FINANCIAL PLAN
DEBT DETAIL:
REC‐REATE Capital Reserve
2019
Projected
2020
Budget
2021
Budget
2022
Budget
2023
Budget
2024
Budget
Beginning balance 2,696,928$ 3,731,325$ 2,611,160$ ‐$ ‐$ ‐$
Transfers from operating fund 1,038,095 1,038,095 1,038,095
Transfer to operating fund ‐ ‐ ‐ ‐ ‐ ‐
Projects funded (3,698) (2,158,260) (3,648,310) ‐ ‐ ‐
Ending Balance 3,731,325$ 2,611,160$ ‐$ ‐$ ‐$ ‐$
Projects Funded:
REC‐REATE Design 3,698$ 78,000$
REC‐REATE Major Redevelopment 2,080,260 3,648,310
3,698$ 2,158,260$ 3,648,310$ ‐$ ‐$ ‐$
Long‐Term Debt Summary
2019
Actual
2020
Budget
2021
Budget
2022
Budget
2023
Budget
2024
Budget
Debt Balance
Beginning Balance ‐$ ‐$ ‐$ 10,753,490$ 14,403,111$ 13,972,222$
Debt Draws ‐ ‐ 10,753,490 4,080,510 ‐ ‐
Debt Principal Payments ‐ ‐ ‐ (430,889) (430,889) (430,889)
Ending Balance ‐ ‐ 10,753,490 14,403,111 13,972,222 13,541,333
Debt Details
REC‐REATE Major Redevelopment
Interest rate ‐ 4%
Payback ‐ 25 yrs
Year drawn ‐ 2019
Beginning Balance ‐ ‐ ‐ 10,753,490 14,403,111 13,972,222
Debt Draws ‐ ‐ 10,753,490 4,080,510 ‐ ‐
Debt Principal Payments ‐ ‐ ‐ (430,889) (430,889) (430,889)
Ending Balance ‐ ‐ 10,753,490 14,403,111 13,972,222 13,541,333
Debt Principal Payments ‐ ‐ ‐ 430,889 430,889 430,889
Debt Interest Payments ‐ ‐ ‐ 593,360 593,360 593,360
Annual Debt Payments ‐ ‐ ‐ 1,024,249 1,024,249 1,024,249
217
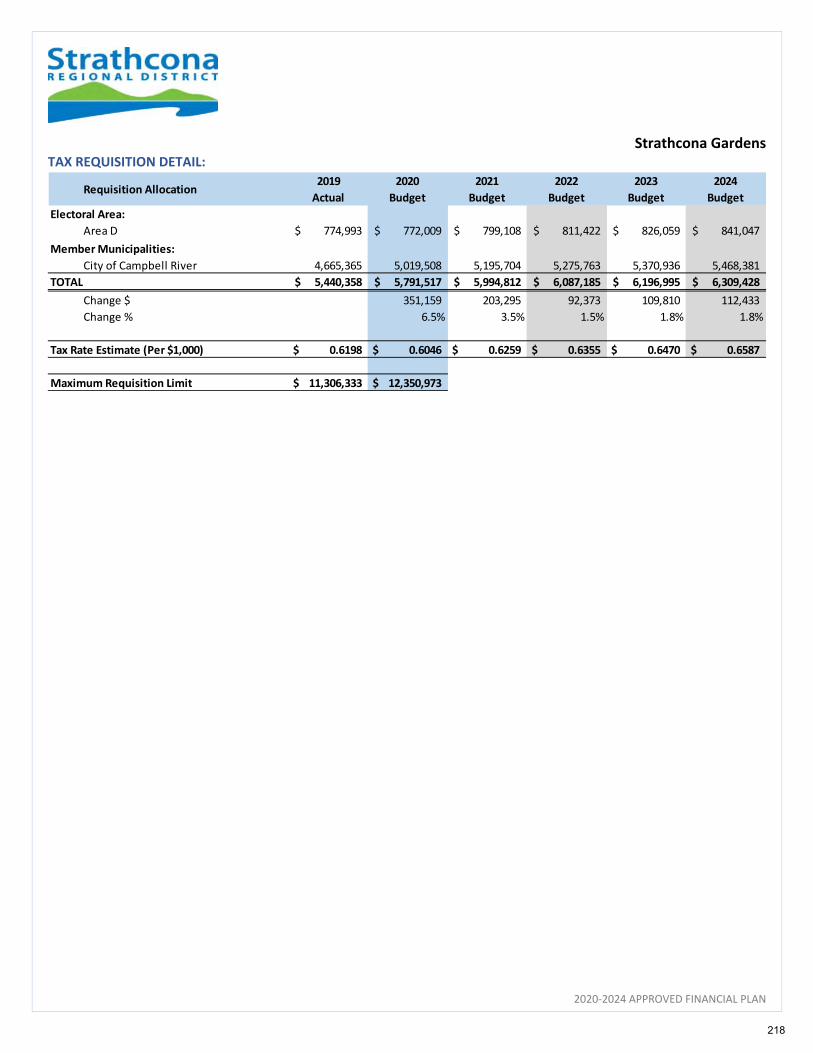
Strathcona Gardens
2020‐2024 APPROVED FINANCIAL PLAN
TAX REQUISITION DETAIL:
Requisition Allocation2019
Actual
2020
Budget
2021
Budget
2022
Budget
2023
Budget
2024
Budget
Electoral Area:
Area D 774,993$ 772,009$ 799,108$ 811,422$ 826,059$ 841,047$
Member Municipalities:
City of Campbell River 4,665,365 5,019,508 5,195,704 5,275,763 5,370,936 5,468,381
TOTAL 5,440,358$ 5,791,517$ 5,994,812$ 6,087,185$ 6,196,995$ 6,309,428$
Change $ 351,159 203,295 92,373 109,810 112,433
Change % 6.5% 3.5% 1.5% 1.8% 1.8%
Tax Rate Estimate (Per $1,000) 0.6198 $ 0.6046 $ 0.6259 $ 0.6355 $ 0.6470 $ 0.6587 $
Maximum Requisition Limit 11,306,333 $ 12,350,973 $
218
2020‐2024 APPROVED FINANCIAL PLAN
Financial Plan Bylaw
FINANCIAL PLAN
2020 – 2024
Rebecca Spit, Quadra Island
219

Strathcona REGIONAL DISTRICT
BYLAW NO. 382
A BYLAW TO ADOPT THE 2020 TO 2024 FINANCIAL PLAN AND CAPITAL EXPENDITURE PROGRAM
WHEREAS the Regional District must annually adopt a financial plan, by bylaw, which
covers the current year and the ensuing four years;
AND WHEREAS the Strathcona Regional District wishes to adopt a financial plan that
reflects its corporate priorities for the period 2020 to 2024;
AND WHEREAS a public consultation process regarding the 2020 to 2024 financial plan
has been completed;
NOW THEREFORE the Board of Directors of the Strathcona Regional District, in open
meeting assembled, enacts as follows:
Financial Plan and Capital Expenditure Program
1. Schedule A (Consolidated Expenses and Sources of Revenue), Schedule B (Capital Expenses and Sources of Revenue), Schedule C (Operating Expenses by Type) and Schedule D (Consolidated Expenses and Sources of Revenue by Service), all of which are attached hereto and form an integral part of this bylaw, are hereby designated and adopted as the financial plan and capital expenditure program for the period commencing on January 1, 2020 and terminating on December 31, 2024.
Citation
2. This bylaw may be cited for all purposes as Bylaw No. 382, being 2020 to 2024 Financial Plan and Capital Expenditure Program Bylaw.
READ A FIRST TIME ON THE 12TH DAY OF FEBRUARY, 2020
READ A SECOND TIME ON THE 12TH DAY OF FEBRUARY, 2020
READ A THIRD TIME ON THE 261H DAY OF FEBRUARY, 2020
220

BYLAW NO. 382 PAGE 2
RECONSIDERED, FINALLY PASSED AND ADOPTED ON THE 26TH DAY OF FEBRUARY, 2020
Corporate Officer
221

Financial Plan Bylaw
2020‐2024 APPROVED FINANCIAL PLAN
2020-2024 Financial Plan Bylaw 382Consolidated Expenses and Sources of Revenue Schedule A
2020 2021 2022 2023 2024
Operating Sources of Revenue
Frontage and parcel taxes 11,323$ 25,090$ 25,090$ 25,090$ 25,090$
Property value tax requisition 12,936,207 13,742,846 13,745,063 13,910,777 13,982,482
Grants in lieu of taxes 186,560 186,560 186,560 186,560 186,560
Conditional transfers 1,056,143 706,054 729,159 730,150 753,395
Unconditional transfers 211,500 211,500 211,500 211,500 211,500
Sales of services 3,220,368 3,333,418 3,346,778 3,365,786 3,384,831
Other revenue from own sources 1,661,531 1,692,627 1,995,687 2,327,984 2,932,992
Debt recoveries member municipalities 1,219,765 1,219,765 1,219,765 1,217,188 1,111,313
Transfers from reserves 149,725 41,368 83,617 44,402 34,032
Transfers from accumulated surplus 2,398,382 ‐ ‐ ‐ ‐
23,051,504 21,159,228 21,543,219 22,019,437 22,622,195
Capital Revenues ‐ Schedule B 19,718,721 79,460,000 19,920,000 395,000 135,000
Consolidated Revenues 42,770,225$ 100,619,228$ 41,463,219$ 22,414,437$ 22,757,195$
Operating Expenses by Category
General government services 5,232,251$ 4,827,488$ 4,929,247$ 4,958,746$ 5,060,813$
Protective services 2,175,467 1,951,115 1,972,164 2,002,760 2,027,531
Environmental health services 2,693,239 2,464,337 2,499,820 2,541,426 2,583,610
Development services 1,135,888 842,432 852,696 866,245 880,083
Parks, recreation and cultural services 9,594,818 9,094,245 9,207,407 9,338,364 9,469,311
Transportation Services 258,632 230,913 239,736 248,812 258,149
Other services 741,444 528,933 622,384 845,896 1,231,385
Debt payments member municipalities 1,219,765 1,219,765 1,219,765 1,217,188 1,111,313
23,051,504 21,159,228 21,543,219 22,019,437 22,622,195
Capital Expenses ‐ Schedule B 19,718,721 79,460,000 19,920,000 395,000 135,000
Consolidated Expenses 42,770,225$ 100,619,228$ 41,463,219$ 22,414,437$ 22,757,195$
222
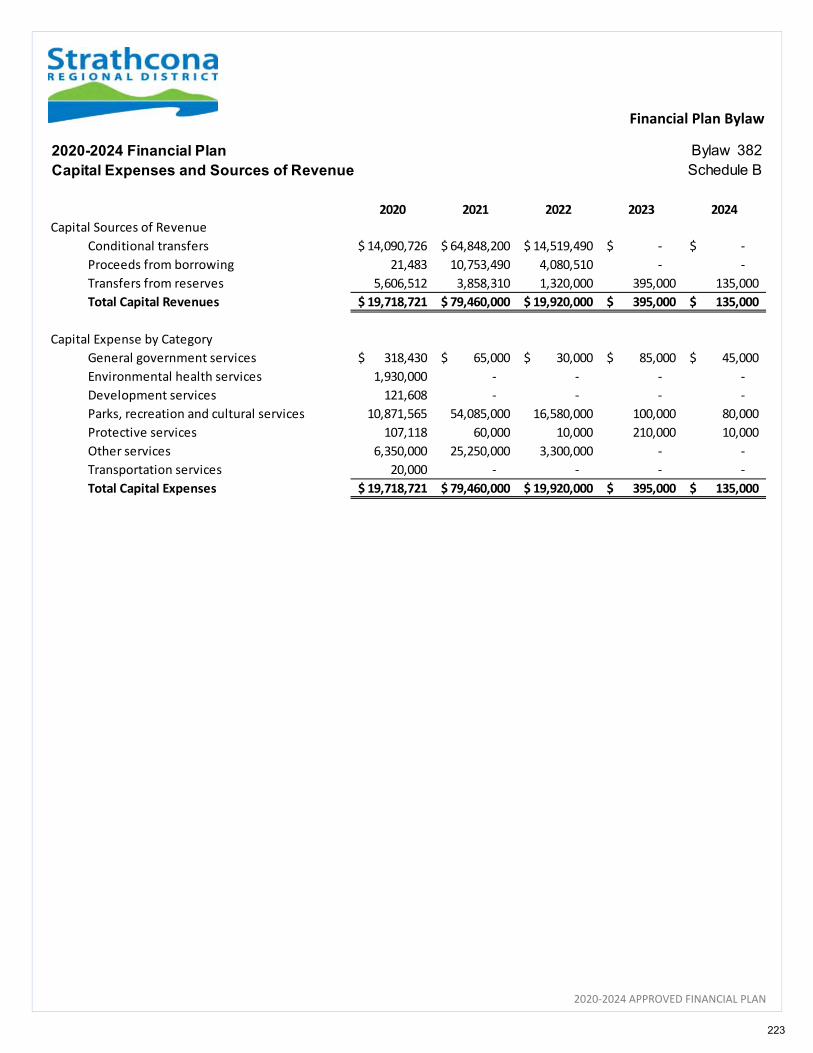
Financial Plan Bylaw
2020‐2024 APPROVED FINANCIAL PLAN
2020-2024 Financial Plan Bylaw 382Capital Expenses and Sources of Revenue Schedule B
2020 2021 2022 2023 2024
Capital Sources of Revenue
Conditional transfers 14,090,726$ 64,848,200$ 14,519,490$ ‐$ ‐$
Proceeds from borrowing 21,483 10,753,490 4,080,510 ‐ ‐
Transfers from reserves 5,606,512 3,858,310 1,320,000 395,000 135,000
Total Capital Revenues 19,718,721$ 79,460,000$ 19,920,000$ 395,000$ 135,000$
Capital Expense by Category
General government services 318,430$ 65,000$ 30,000$ 85,000$ 45,000$
Environmental health services 1,930,000 ‐ ‐ ‐ ‐
Development services 121,608 ‐ ‐ ‐ ‐
Parks, recreation and cultural services 10,871,565 54,085,000 16,580,000 100,000 80,000
Protective services 107,118 60,000 10,000 210,000 10,000
Other services 6,350,000 25,250,000 3,300,000 ‐ ‐
Transportation services 20,000 ‐ ‐ ‐ ‐
Total Capital Expenses 19,718,721$ 79,460,000$ 19,920,000$ 395,000$ 135,000$
223
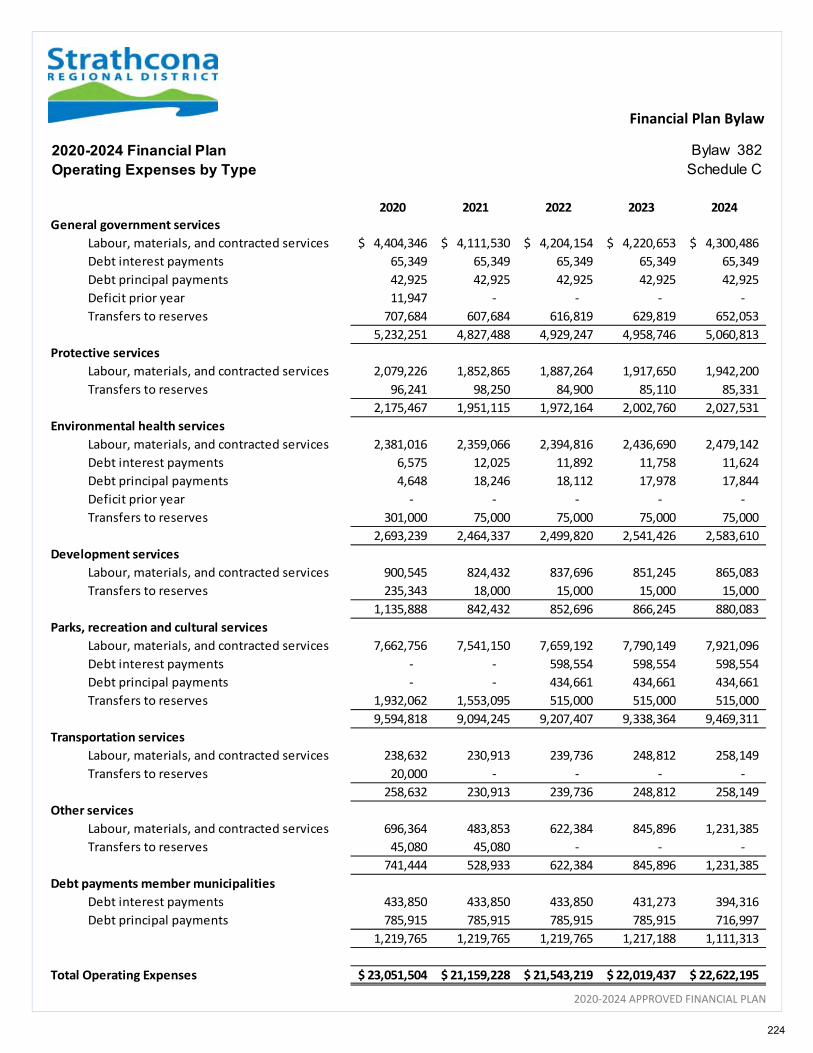
Financial Plan Bylaw
2020‐2024 APPROVED FINANCIAL PLAN
2020-2024 Financial Plan Bylaw 382Operating Expenses by Type Schedule C
2020 2021 2022 2023 2024
General government services
Labour, materials, and contracted services 4,404,346$ 4,111,530$ 4,204,154$ 4,220,653$ 4,300,486$
Debt interest payments 65,349 65,349 65,349 65,349 65,349
Debt principal payments 42,925 42,925 42,925 42,925 42,925
Deficit prior year 11,947 ‐ ‐ ‐ ‐
Transfers to reserves 707,684 607,684 616,819 629,819 652,053
5,232,251 4,827,488 4,929,247 4,958,746 5,060,813
Protective services
Labour, materials, and contracted services 2,079,226 1,852,865 1,887,264 1,917,650 1,942,200
Transfers to reserves 96,241 98,250 84,900 85,110 85,331
2,175,467 1,951,115 1,972,164 2,002,760 2,027,531
Environmental health services
Labour, materials, and contracted services 2,381,016 2,359,066 2,394,816 2,436,690 2,479,142
Debt interest payments 6,575 12,025 11,892 11,758 11,624
Debt principal payments 4,648 18,246 18,112 17,978 17,844
Deficit prior year ‐ ‐ ‐ ‐ ‐
Transfers to reserves 301,000 75,000 75,000 75,000 75,000
2,693,239 2,464,337 2,499,820 2,541,426 2,583,610
Development services
Labour, materials, and contracted services 900,545 824,432 837,696 851,245 865,083
Transfers to reserves 235,343 18,000 15,000 15,000 15,000
1,135,888 842,432 852,696 866,245 880,083
Parks, recreation and cultural services
Labour, materials, and contracted services 7,662,756 7,541,150 7,659,192 7,790,149 7,921,096
Debt interest payments ‐ ‐ 598,554 598,554 598,554
Debt principal payments ‐ ‐ 434,661 434,661 434,661
Transfers to reserves 1,932,062 1,553,095 515,000 515,000 515,000
9,594,818 9,094,245 9,207,407 9,338,364 9,469,311
Transportation services
Labour, materials, and contracted services 238,632 230,913 239,736 248,812 258,149
Transfers to reserves 20,000 ‐ ‐ ‐ ‐
258,632 230,913 239,736 248,812 258,149
Other services
Labour, materials, and contracted services 696,364 483,853 622,384 845,896 1,231,385
Transfers to reserves 45,080 45,080 ‐ ‐ ‐
741,444 528,933 622,384 845,896 1,231,385
Debt payments member municipalities
Debt interest payments 433,850 433,850 433,850 431,273 394,316
Debt principal payments 785,915 785,915 785,915 785,915 716,997
1,219,765 1,219,765 1,219,765 1,217,188 1,111,313
Total Operating Expenses 23,051,504$ 21,159,228$ 21,543,219$ 22,019,437$ 22,622,195$
224

Financial Plan Bylaw
2020‐2024 APPROVED FINANCIAL PLAN
2020-2024 Financial Plan Bylaw 382Consolidated Expenses and Sources of Revenue by Service Schedule D
2020 2021 2022 2023 2024
100 Member Municipality Administration
Property value tax requisition 376,933$ 409,111$ 416,065$ 423,158$ 430,393$
Grants in lieu of taxes 3,000 3,000 3,000 3,000 3,000
Transfers from accumulated surplus 25,361 ‐ ‐ ‐ ‐
Operating Revenue Total 405,294 412,111 419,065 426,158 433,393
Labour, materials, and contracted services 405,294 412,111 419,065 426,158 433,393
Transfers to reserves ‐ ‐ ‐ ‐ ‐
Operating Expense Total 405,294 412,111 419,065 426,158 433,393
110 Administration and General Government
Property value tax requisition 1,002,551 1,160,482 1,195,962 1,212,091 1,238,899
Sales of services 52,420 52,420 52,420 52,420 52,420
Other revenue from own sources 1,414,872 1,432,291 1,459,791 1,487,888 1,516,596
Conditional transfers 131,146 80,000 80,000 80,000 80,000
Unconditional transfers 190,500 190,500 190,500 190,500 190,500
Grants in lieu of taxes 137,000 137,000 137,000 137,000 137,000
Transfers from accumulated surplus 410,573 ‐ ‐ ‐ ‐
Operating Revenue Total 3,339,062 3,052,693 3,115,673 3,159,899 3,215,415
Labour, materials, and contracted services 3,020,788 2,834,419 2,897,399 2,941,625 2,997,141
Debt interest payments 65,349 65,349 65,349 65,349 65,349
Debt principal payments 42,925 42,925 42,925 42,925 42,925
Transfers to reserves 210,000 110,000 110,000 110,000 110,000
Operating Expense Total 3,339,062 3,052,693 3,115,673 3,159,899 3,215,415
Proceeds from borrowing 21,483 ‐ ‐ ‐ ‐
Transfers from reserves 296,947 65,000 30,000 85,000 45,000
Capital Sources of Revenue Total 318,430 65,000 30,000 85,000 45,000
Capital expenditure 318,430 65,000 30,000 85,000 45,000
Capital Expense Total 318,430 65,000 30,000 85,000 45,000
120 Grant in Aid Area A
Property value tax requisition 452 3,397 3,400 3,403 3,406
Transfers from accumulated surplus 9,942 ‐ ‐ ‐ ‐
Operating Revenue Total 10,394 3,397 3,400 3,403 3,406
Labour, materials, and contracted services 10,394 3,397 3,400 3,403 3,406
Operating Expense Total 10,394 3,397 3,400 3,403 3,406
225
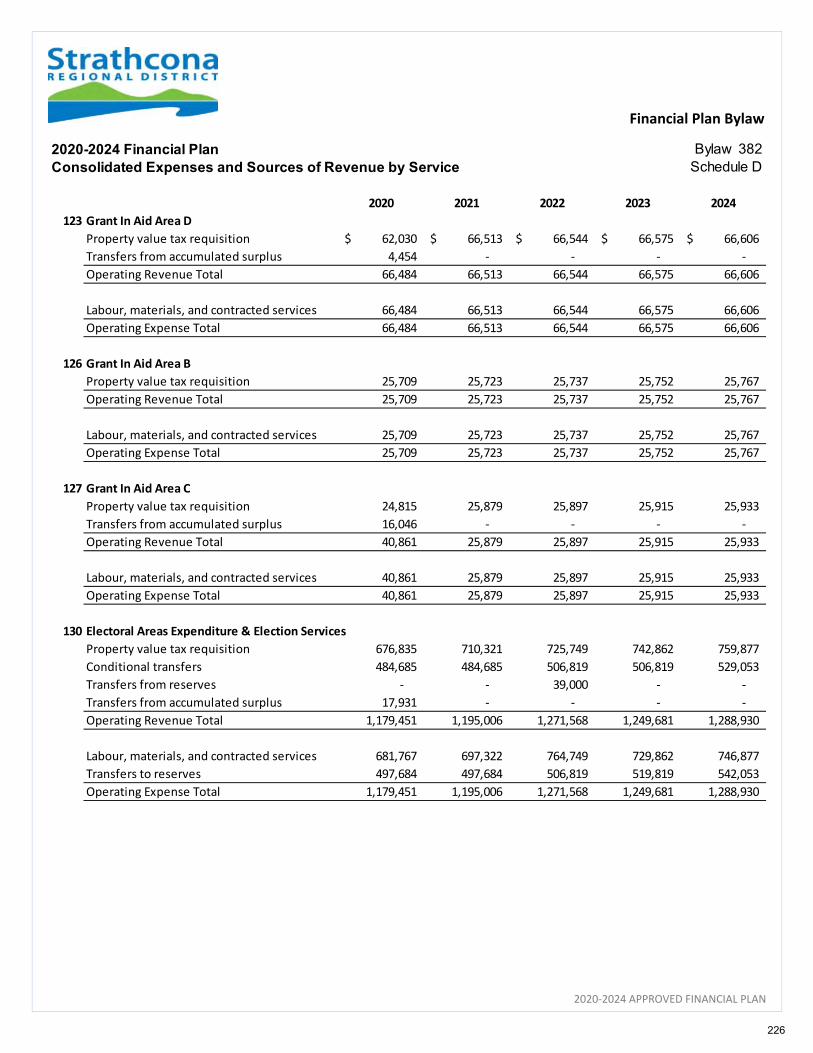
Financial Plan Bylaw
2020‐2024 APPROVED FINANCIAL PLAN
2020-2024 Financial Plan Bylaw 382Consolidated Expenses and Sources of Revenue by Service Schedule D
2020 2021 2022 2023 2024
123 Grant In Aid Area D
Property value tax requisition 62,030$ 66,513$ 66,544$ 66,575$ 66,606$
Transfers from accumulated surplus 4,454 ‐ ‐ ‐ ‐
Operating Revenue Total 66,484 66,513 66,544 66,575 66,606
Labour, materials, and contracted services 66,484 66,513 66,544 66,575 66,606
Operating Expense Total 66,484 66,513 66,544 66,575 66,606
126 Grant In Aid Area B
Property value tax requisition 25,709 25,723 25,737 25,752 25,767
Operating Revenue Total 25,709 25,723 25,737 25,752 25,767
Labour, materials, and contracted services 25,709 25,723 25,737 25,752 25,767
Operating Expense Total 25,709 25,723 25,737 25,752 25,767
127 Grant In Aid Area C
Property value tax requisition 24,815 25,879 25,897 25,915 25,933
Transfers from accumulated surplus 16,046 ‐ ‐ ‐ ‐
Operating Revenue Total 40,861 25,879 25,897 25,915 25,933
Labour, materials, and contracted services 40,861 25,879 25,897 25,915 25,933
Operating Expense Total 40,861 25,879 25,897 25,915 25,933
130 Electoral Areas Expenditure & Election Services
Property value tax requisition 676,835 710,321 725,749 742,862 759,877
Conditional transfers 484,685 484,685 506,819 506,819 529,053
Transfers from reserves ‐ ‐ 39,000 ‐ ‐
Transfers from accumulated surplus 17,931 ‐ ‐ ‐ ‐
Operating Revenue Total 1,179,451 1,195,006 1,271,568 1,249,681 1,288,930
Labour, materials, and contracted services 681,767 697,322 764,749 729,862 746,877
Transfers to reserves 497,684 497,684 506,819 519,819 542,053
Operating Expense Total 1,179,451 1,195,006 1,271,568 1,249,681 1,288,930
226

Financial Plan Bylaw
2020‐2024 APPROVED FINANCIAL PLAN
2020-2024 Financial Plan Bylaw 382Consolidated Expenses and Sources of Revenue by Service Schedule D
2020 2021 2022 2023 2024
132 Wharves
Sales of services 365$ 365$ 365$ 365$ 365$
Other revenue from own sources 30,000 30,000 30,000 30,000 30,000
Conditional transfers 139,417 140,369 141,340 142,331 143,342
Operating Revenue Total 169,782 170,734 171,705 172,696 173,707
Labour, materials, and contracted services 169,782 170,734 171,705 172,696 173,707
Operating Expense Total 169,782 170,734 171,705 172,696 173,707
Conditional transfers 1,400,000 500,000 ‐ ‐ ‐
Capital Sources of Revenue Total 1,400,000 500,000 ‐ ‐ ‐
Capital expenditure 1,400,000 500,000 ‐ ‐ ‐
Capital Expense Total 1,400,000 500,000 ‐ ‐
149 Regional Broadband
Property value tax requisition 312,839 312,839 81,679 ‐ (191,822)
Other revenue from own sources ‐ 45,360 369,000 673,200 1,249,500
Transfers from accumulated surplus 258,823 ‐ ‐ ‐ ‐
Operating Revenue Total 571,662 358,199 450,679 673,200 1,057,678
Labour, materials, and contracted services 526,582 313,119 450,679 673,200 1,057,678
Transfers to reserves 45,080 45,080 ‐ ‐ ‐
Operating Expense Total 571,662 358,199 450,679 673,200 1,057,678
Conditional transfers 4,950,000 24,750,000 3,300,000 ‐ ‐
Capital Sources of Revenue Total 4,950,000 24,750,000 3,300,000 ‐ ‐
Capital expenditure 4,950,000 24,750,000 3,300,000 ‐ ‐
Capital Expense Total 4,950,000 24,750,000 3,300,000 ‐ ‐
150 Feasibility Studies ‐ Regional
Other revenue from own sources 45,080 45,080 ‐ ‐ ‐
Property value tax requisition ‐ ‐ 277 277 277
Transfers from accumulated surplus 25,002 ‐ ‐ ‐ ‐
Operating Revenue Total 70,082 45,080 277 277 277
Labour, materials, and contracted services 70,082 45,080 277 277 277
Operating Expense Total 70,082 45,080 277 277 277
227

Financial Plan Bylaw
2020‐2024 APPROVED FINANCIAL PLAN
2020-2024 Financial Plan Bylaw 382Consolidated Expenses and Sources of Revenue by Service Schedule D
2020 2021 2022 2023 2024
151 Feasibility Studies ‐ Electoral Area A
Property value tax requisition 874$ 256$ 256$ 256$ 256$
Transfers from accumulated surplus 4,382 ‐ ‐ ‐ ‐
Operating Revenue Total 5,256 256 256 256 256
Labour, materials, and contracted services 5,256 256 256 256 256
Operating Expense Total 5,256 256 256 256 256
154 Feasibility Studies ‐ Electoral Area D
Property value tax requisition ‐ 290 290 290 290
Transfers from accumulated surplus 38,305 ‐ ‐ ‐ ‐
Operating Revenue Total 38,305 290 290 290 290
Labour, materials, and contracted services 38,305 290 290 290 290
Operating Expense Total 38,305 290 290 290 290
157 Feasibility Studies ‐ Electoral Area B
Other revenue from own sources 31,083 ‐ ‐ ‐ ‐
Property value tax requisition ‐ 270 270 270 270
Operating Revenue Total 31,083 270 270 270 270
Labour, materials, and contracted services 19,136 270 270 270 270
Deficit prior year 11,947 ‐ ‐ ‐ ‐
Operating Expense Total 31,083 270 270 270 270
158 Feasibility Studies ‐ Electoral Area C
Property value tax requisition 1,305 270 270 270 270
Transfers from accumulated surplus 18,965 ‐ ‐ ‐ ‐
Operating Revenue Total 20,270 270 270 270 270
Labour, materials, and contracted services 20,270 270 270 270 270
Operating Expense Total 20,270 270 270 270 270
190 Member Municipality Debt
Debt recoveries member municipalities 1,219,765 1,219,765 1,219,765 1,217,188 1,111,313
Operating Revenue Total 1,219,765 1,219,765 1,219,765 1,217,188 1,111,313
Debt interest payments 433,850 433,850 433,850 431,273 394,316
Debt principal payments 785,915 785,915 785,915 785,915 716,997
Operating Expense Total 1,219,765 1,219,765 1,219,765 1,217,188 1,111,313
228
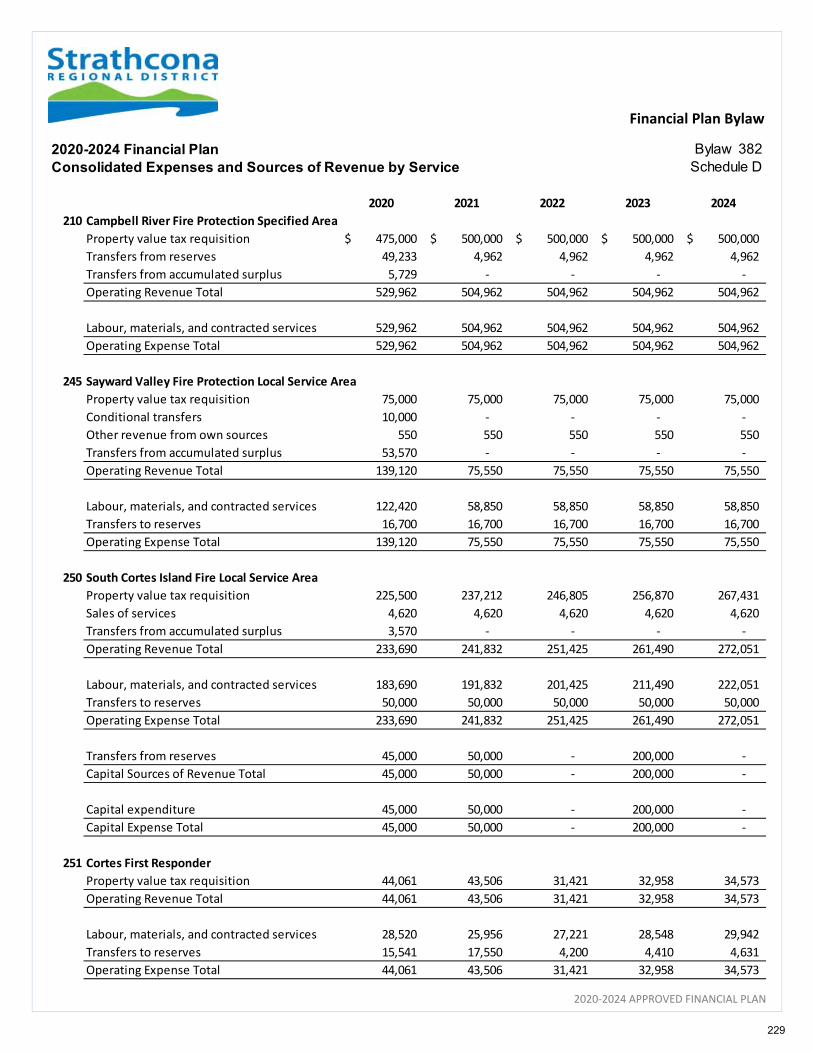
Financial Plan Bylaw
2020‐2024 APPROVED FINANCIAL PLAN
2020-2024 Financial Plan Bylaw 382Consolidated Expenses and Sources of Revenue by Service Schedule D
2020 2021 2022 2023 2024
210 Campbell River Fire Protection Specified Area
Property value tax requisition 475,000$ 500,000$ 500,000$ 500,000$ 500,000$
Transfers from reserves 49,233 4,962 4,962 4,962 4,962
Transfers from accumulated surplus 5,729 ‐ ‐ ‐ ‐
Operating Revenue Total 529,962 504,962 504,962 504,962 504,962
Labour, materials, and contracted services 529,962 504,962 504,962 504,962 504,962
Operating Expense Total 529,962 504,962 504,962 504,962 504,962
245 Sayward Valley Fire Protection Local Service Area
Property value tax requisition 75,000 75,000 75,000 75,000 75,000
Conditional transfers 10,000 ‐ ‐ ‐ ‐
Other revenue from own sources 550 550 550 550 550
Transfers from accumulated surplus 53,570 ‐ ‐ ‐ ‐
Operating Revenue Total 139,120 75,550 75,550 75,550 75,550
Labour, materials, and contracted services 122,420 58,850 58,850 58,850 58,850
Transfers to reserves 16,700 16,700 16,700 16,700 16,700
Operating Expense Total 139,120 75,550 75,550 75,550 75,550
250 South Cortes Island Fire Local Service Area
Property value tax requisition 225,500 237,212 246,805 256,870 267,431
Sales of services 4,620 4,620 4,620 4,620 4,620
Transfers from accumulated surplus 3,570 ‐ ‐ ‐ ‐
Operating Revenue Total 233,690 241,832 251,425 261,490 272,051
Labour, materials, and contracted services 183,690 191,832 201,425 211,490 222,051
Transfers to reserves 50,000 50,000 50,000 50,000 50,000
Operating Expense Total 233,690 241,832 251,425 261,490 272,051
Transfers from reserves 45,000 50,000 ‐ 200,000 ‐
Capital Sources of Revenue Total 45,000 50,000 ‐ 200,000 ‐
Capital expenditure 45,000 50,000 ‐ 200,000 ‐
Capital Expense Total 45,000 50,000 ‐ 200,000 ‐
251 Cortes First Responder
Property value tax requisition 44,061 43,506 31,421 32,958 34,573
Operating Revenue Total 44,061 43,506 31,421 32,958 34,573
Labour, materials, and contracted services 28,520 25,956 27,221 28,548 29,942
Transfers to reserves 15,541 17,550 4,200 4,410 4,631
Operating Expense Total 44,061 43,506 31,421 32,958 34,573
229
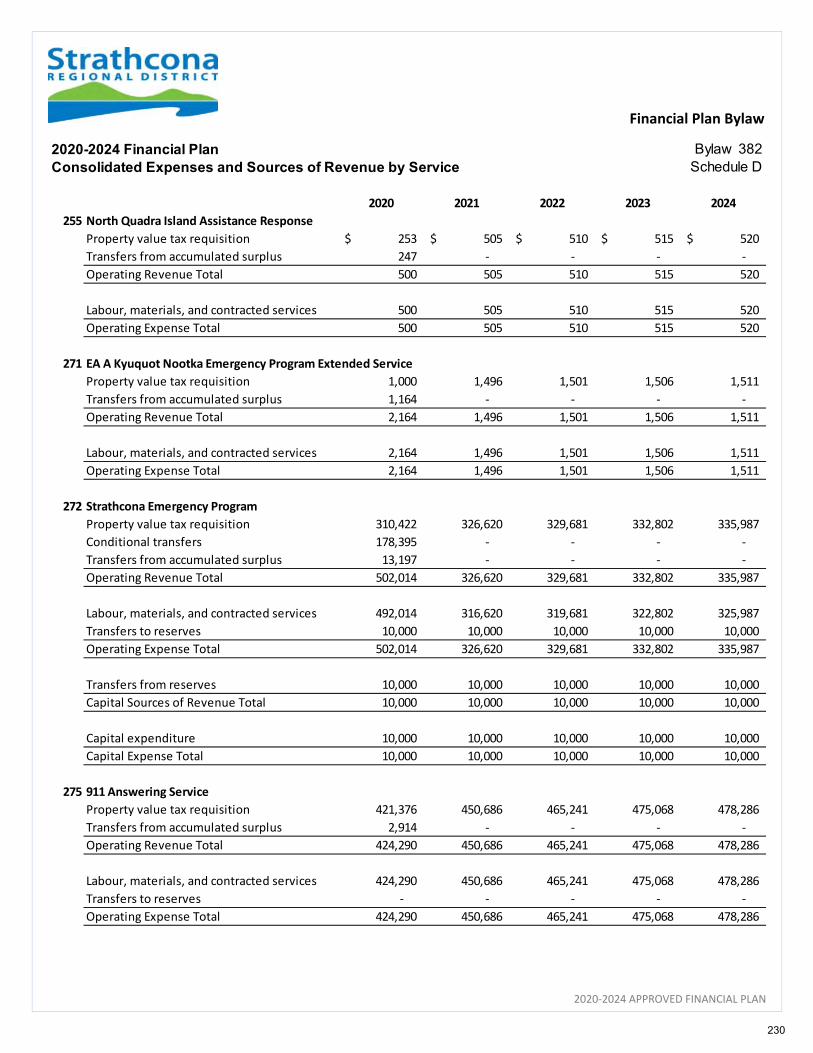
Financial Plan Bylaw
2020‐2024 APPROVED FINANCIAL PLAN
2020-2024 Financial Plan Bylaw 382Consolidated Expenses and Sources of Revenue by Service Schedule D
2020 2021 2022 2023 2024
255 North Quadra Island Assistance Response
Property value tax requisition 253$ 505$ 510$ 515$ 520$
Transfers from accumulated surplus 247 ‐ ‐ ‐ ‐
Operating Revenue Total 500 505 510 515 520
Labour, materials, and contracted services 500 505 510 515 520
Operating Expense Total 500 505 510 515 520
271 EA A Kyuquot Nootka Emergency Program Extended Service
Property value tax requisition 1,000 1,496 1,501 1,506 1,511
Transfers from accumulated surplus 1,164 ‐ ‐ ‐ ‐
Operating Revenue Total 2,164 1,496 1,501 1,506 1,511
Labour, materials, and contracted services 2,164 1,496 1,501 1,506 1,511
Operating Expense Total 2,164 1,496 1,501 1,506 1,511
272 Strathcona Emergency Program
Property value tax requisition 310,422 326,620 329,681 332,802 335,987
Conditional transfers 178,395 ‐ ‐ ‐ ‐
Transfers from accumulated surplus 13,197 ‐ ‐ ‐ ‐
Operating Revenue Total 502,014 326,620 329,681 332,802 335,987
Labour, materials, and contracted services 492,014 316,620 319,681 322,802 325,987
Transfers to reserves 10,000 10,000 10,000 10,000 10,000
Operating Expense Total 502,014 326,620 329,681 332,802 335,987
Transfers from reserves 10,000 10,000 10,000 10,000 10,000
Capital Sources of Revenue Total 10,000 10,000 10,000 10,000 10,000
Capital expenditure 10,000 10,000 10,000 10,000 10,000
Capital Expense Total 10,000 10,000 10,000 10,000 10,000
275 911 Answering Service
Property value tax requisition 421,376 450,686 465,241 475,068 478,286
Transfers from accumulated surplus 2,914 ‐ ‐ ‐ ‐
Operating Revenue Total 424,290 450,686 465,241 475,068 478,286
Labour, materials, and contracted services 424,290 450,686 465,241 475,068 478,286
Transfers to reserves ‐ ‐ ‐ ‐ ‐
Operating Expense Total 424,290 450,686 465,241 475,068 478,286
230

Financial Plan Bylaw
2020‐2024 APPROVED FINANCIAL PLAN
2020-2024 Financial Plan Bylaw 382Consolidated Expenses and Sources of Revenue by Service Schedule D
2020 2021 2022 2023 2024
285 Building Inspection
Property value tax requisition 153,870$ 201,345$ 206,344$ 211,450$ 216,671$
Sales of services 12,000 12,000 12,000 12,000 12,000
Other revenue from own sources 44,050 44,050 44,050 44,050 44,050
Transfers from accumulated surplus 42,585 ‐ ‐ ‐ ‐
Operating Revenue Total 252,505 257,395 262,394 267,500 272,721
Labour, materials, and contracted services 248,505 253,395 258,394 263,500 268,721
Transfers to reserves 4,000 4,000 4,000 4,000 4,000
Operating Expense Total 252,505 257,395 262,394 267,500 272,721
Transfers from reserves 52,118 ‐ ‐ ‐ ‐
Capital Sources of Revenue Total 52,118 ‐ ‐ ‐ ‐
Capital expenditure 52,118 ‐ ‐ ‐ ‐
Capital Expense Total 52,118 ‐ ‐ ‐ ‐
290 Electoral Area D Animal Control
Property value tax requisition 42,451 44,780 45,692 46,618 47,575
Other revenue from own sources 100 100 100 100 100
Transfers from accumulated surplus 1,431 ‐ ‐ ‐ ‐
Operating Revenue Total 43,982 44,880 45,792 46,718 47,675
Labour, materials, and contracted services 43,982 44,880 45,792 46,718 47,675
Operating Expense Total 43,982 44,880 45,792 46,718 47,675
295 Noise Control
Property value tax requisition 57 2,907 2,910 2,913 2,916
Transfers from accumulated surplus 2,347 ‐ ‐ ‐ ‐
Operating Revenue Total 2,404 2,907 2,910 2,913 2,916
Labour, materials, and contracted services 2,404 2,907 2,910 2,913 2,916
Operating Expense Total 2,404 2,907 2,910 2,913 2,916
298 Unsightly Premises Extended Service
Property value tax requisition 273 776 777 778 779
Transfers from accumulated surplus 502 ‐ ‐ ‐ ‐
Operating Revenue Total 775 776 777 778 779
Labour, materials, and contracted services 775 776 777 778 779
Operating Expense Total 775 776 777 778 779
231

Financial Plan Bylaw
2020‐2024 APPROVED FINANCIAL PLAN
2020-2024 Financial Plan Bylaw 382Consolidated Expenses and Sources of Revenue by Service Schedule D
2020 2021 2022 2023 2024
318 Craig Road Water
Frontage and parcel taxes 11,323$ 11,323$ 11,323$ 11,323$ 11,323$
Transfers from accumulated surplus 404 ‐ ‐ ‐ ‐
Operating Revenue Total 11,727 11,323 11,323 11,323 11,323
Labour, materials, and contracted services 504 100 100 100 100
Debt interest payments 6,575 6,575 6,575 6,575 6,575
Debt principal payments 4,648 4,648 4,648 4,648 4,648
Operating Expense Total 11,727 11,323 11,323 11,323 11,323
319 Electoral Area D Water
Property value tax requisition 587,100 604,713 622,854 641,540 660,786
Sales of services 1,229,566 1,325,674 1,333,501 1,346,658 1,359,780
Transfers from accumulated surplus 336,846 ‐ ‐ ‐ ‐
Operating Revenue Total 2,153,512 1,930,387 1,956,355 1,988,198 2,020,566
Labour, materials, and contracted services 1,852,512 1,870,387 1,896,355 1,928,198 1,960,566
Debt interest payments ‐ ‐ ‐ ‐ ‐
Debt principal payments ‐ ‐ ‐ ‐ ‐
Transfers to reserves 301,000 60,000 60,000 60,000 60,000
Operating Expense Total 2,153,512 1,930,387 1,956,355 1,988,198 2,020,566
Transfers from reserves 1,630,000 ‐ ‐ ‐ ‐
Capital Sources of Revenue Total 1,630,000 ‐ ‐ ‐ ‐
Capital expenditure 1,630,000 ‐ ‐ ‐ ‐
Capital Expense Total 1,630,000 ‐ ‐ ‐ ‐
331 Quathiaski Cove Sewer
Sales of services 194,111 208,076 210,632 213,256 215,952
Transfers from accumulated surplus 22,388 ‐ ‐ ‐ ‐
Operating Revenue Total 216,499 208,076 210,632 213,256 215,952
Labour, materials, and contracted services 216,499 186,295 189,118 192,010 194,974
Debt interest payments ‐ 669 536 402 268
Debt principal payments ‐ 6,112 5,978 5,844 5,710
Transfers to reserves ‐ 15,000 15,000 15,000 15,000
Operating Expense Total 216,499 208,076 210,632 213,256 215,952
Transfers from reserves 300,000 ‐ ‐ ‐ ‐
Capital Sources of Revenue Total 300,000 ‐ ‐ ‐ ‐
Capital expenditure 300,000 ‐ ‐ ‐ ‐
Capital Expense Total 300,000 ‐ ‐ ‐ ‐
232

Financial Plan Bylaw
2020‐2024 APPROVED FINANCIAL PLAN
2020-2024 Financial Plan Bylaw 382Consolidated Expenses and Sources of Revenue by Service Schedule D
2020 2021 2022 2023 2024
332 Quathiaski Cove Sewer Extension
Frontage and parcel taxes ‐$ 13,767$ 13,767$ 13,767$ 13,767$
Operating Revenue Total ‐ 13,767 13,767 13,767 13,767
Labour, materials, and contracted services ‐ 1,500 1,500 1,500 1,500
Debt interest payments ‐ 4,781 4,781 4,781 4,781
Debt principal payments ‐ 7,486 7,486 7,486 7,486
Operating Expense Total ‐ 13,767 13,767 13,767 13,767
340 Liquid Waste
Property value tax requisition 5,000 5,000 5,000 5,000 5,000
Transfers from reserves 3,402 4,577 4,745 4,916 4,989
Transfers from accumulated surplus 18,510 ‐ ‐ ‐ ‐
Operating Revenue Total 26,912 9,577 9,745 9,916 9,989
Labour, materials, and contracted services 26,912 9,577 9,745 9,916 9,989
Operating Expense Total 26,912 9,577 9,745 9,916 9,989
364 Area A Kyuquot Nootka Solid Waste Disposal
Property value tax requisition 10,000 10,000 10,000 10,000 10,000
Transfers from reserves 1,458 3,722 3,888 4,057 4,127
Transfers from accumulated surplus 2,102 ‐ ‐ ‐ ‐
Operating Revenue Total 13,560 13,722 13,888 14,057 14,127
Labour, materials, and contracted services 13,560 13,722 13,888 14,057 14,127
Operating Expense Total 13,560 13,722 13,888 14,057 14,127
368 Sayward and Area A Sayward Refuse Disposal
Property value tax requisition 11,311 16,800 17,533 18,284 19,054
Other revenue from own sources 13,800 13,800 13,800 13,800 13,800
Transfers from accumulated surplus 4,775 ‐ ‐ ‐ ‐
Operating Revenue Total 29,886 30,600 31,333 32,084 32,854
Labour, materials, and contracted services 29,886 30,600 31,333 32,084 32,854
Operating Expense Total 29,886 30,600 31,333 32,084 32,854
370 Solid Waste Local Service ‐ Sayward Valley
Other revenue from own sources 5,387 5,387 5,387 5,387 5,387
Sales of services 71,492 74,469 77,446 80,673 83,900
Transfers from reserves 1,140 4,567 3,893 3,035 2,244
Transfers from accumulated surplus 4,165 ‐ ‐ ‐ ‐
Operating Revenue Total 82,184 84,423 86,726 89,095 91,531
Labour, materials, and contracted services 82,184 84,423 86,726 89,095 91,531
Operating Expense Total 82,184 84,423 86,726 89,095 91,531
233
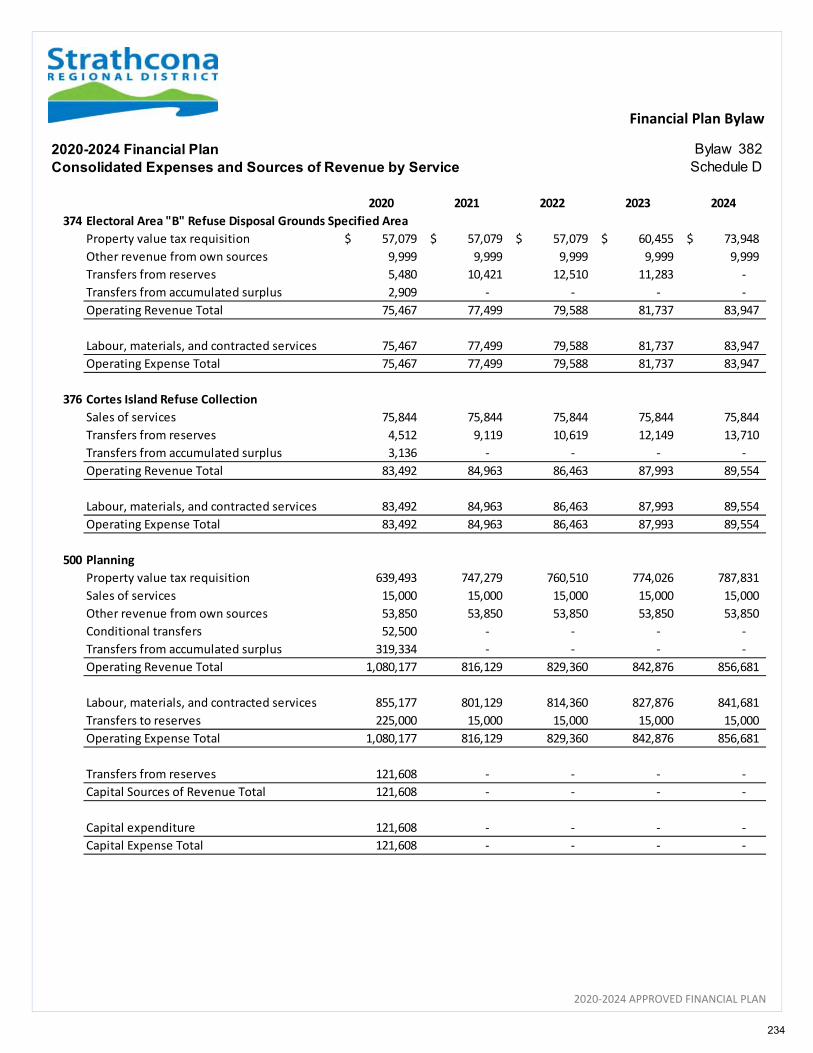
Financial Plan Bylaw
2020‐2024 APPROVED FINANCIAL PLAN
2020-2024 Financial Plan Bylaw 382Consolidated Expenses and Sources of Revenue by Service Schedule D
2020 2021 2022 2023 2024
374 Electoral Area "B" Refuse Disposal Grounds Specified Area
Property value tax requisition 57,079$ 57,079$ 57,079$ 60,455$ 73,948$
Other revenue from own sources 9,999 9,999 9,999 9,999 9,999
Transfers from reserves 5,480 10,421 12,510 11,283 ‐
Transfers from accumulated surplus 2,909 ‐ ‐ ‐ ‐
Operating Revenue Total 75,467 77,499 79,588 81,737 83,947
Labour, materials, and contracted services 75,467 77,499 79,588 81,737 83,947
Operating Expense Total 75,467 77,499 79,588 81,737 83,947
376 Cortes Island Refuse Collection
Sales of services 75,844 75,844 75,844 75,844 75,844
Transfers from reserves 4,512 9,119 10,619 12,149 13,710
Transfers from accumulated surplus 3,136 ‐ ‐ ‐ ‐
Operating Revenue Total 83,492 84,963 86,463 87,993 89,554
Labour, materials, and contracted services 83,492 84,963 86,463 87,993 89,554
Operating Expense Total 83,492 84,963 86,463 87,993 89,554
500 Planning
Property value tax requisition 639,493 747,279 760,510 774,026 787,831
Sales of services 15,000 15,000 15,000 15,000 15,000
Other revenue from own sources 53,850 53,850 53,850 53,850 53,850
Conditional transfers 52,500 ‐ ‐ ‐ ‐
Transfers from accumulated surplus 319,334 ‐ ‐ ‐ ‐
Operating Revenue Total 1,080,177 816,129 829,360 842,876 856,681
Labour, materials, and contracted services 855,177 801,129 814,360 827,876 841,681
Transfers to reserves 225,000 15,000 15,000 15,000 15,000
Operating Expense Total 1,080,177 816,129 829,360 842,876 856,681
Transfers from reserves 121,608 ‐ ‐ ‐ ‐
Capital Sources of Revenue Total 121,608 ‐ ‐ ‐ ‐
Capital expenditure 121,608 ‐ ‐ ‐ ‐
Capital Expense Total 121,608 ‐ ‐ ‐ ‐
234

Financial Plan Bylaw
2020‐2024 APPROVED FINANCIAL PLAN
2020-2024 Financial Plan Bylaw 382Consolidated Expenses and Sources of Revenue by Service Schedule D
2020 2021 2022 2023 2024
510 Planning (Non Part 26)
Property value tax requisition ‐$ 261$ 261$ 261$ 261$
Transfers from accumulated surplus 1,744 ‐ ‐ ‐ ‐
Operating Revenue Total 1,744 261 261 261 261
Labour, materials, and contracted services 1,744 261 261 261 261
Operating Expense Total 1,744 261 261 261 261
533 House Numbering Area D
Property value tax requisition 533 537 541 545 549
Operating Revenue Total 533 537 541 545 549
Labour, materials, and contracted services 533 537 541 545 549
Operating Expense Total 533 537 541 545 549
534 House Numbering Area A Sayward
Property value tax requisition 305 309 313 317 321
Operating Revenue Total 305 309 313 317 321
Labour, materials, and contracted services 305 309 313 317 321
Operating Expense Total 305 309 313 317 321
535 House Numbering Area B
Property value tax requisition 432 436 440 444 448
Operating Revenue Total 432 436 440 444 448
Labour, materials, and contracted services 432 436 440 444 448
Operating Expense Total 432 436 440 444 448
536 House Numbering Area C
Property value tax requisition 432 436 440 444 448
Operating Revenue Total 432 436 440 444 448
Labour, materials, and contracted services 432 436 440 444 448
Operating Expense Total 432 436 440 444 448
554 Economic Development ‐ Area A Sayward
Property value tax requisition 500 500 500 500 500
Other revenue from own sources 3,600 3,000 ‐ ‐ ‐
Transfers from accumulated surplus 615 ‐ ‐ ‐ ‐
Operating Revenue Total 4,715 3,500 500 500 500
Labour, materials, and contracted services 1,115 500 500 500 500
Transfers to reserves 3,600 3,000 ‐ ‐ ‐
Operating Expense Total 4,715 3,500 500 500 500
235
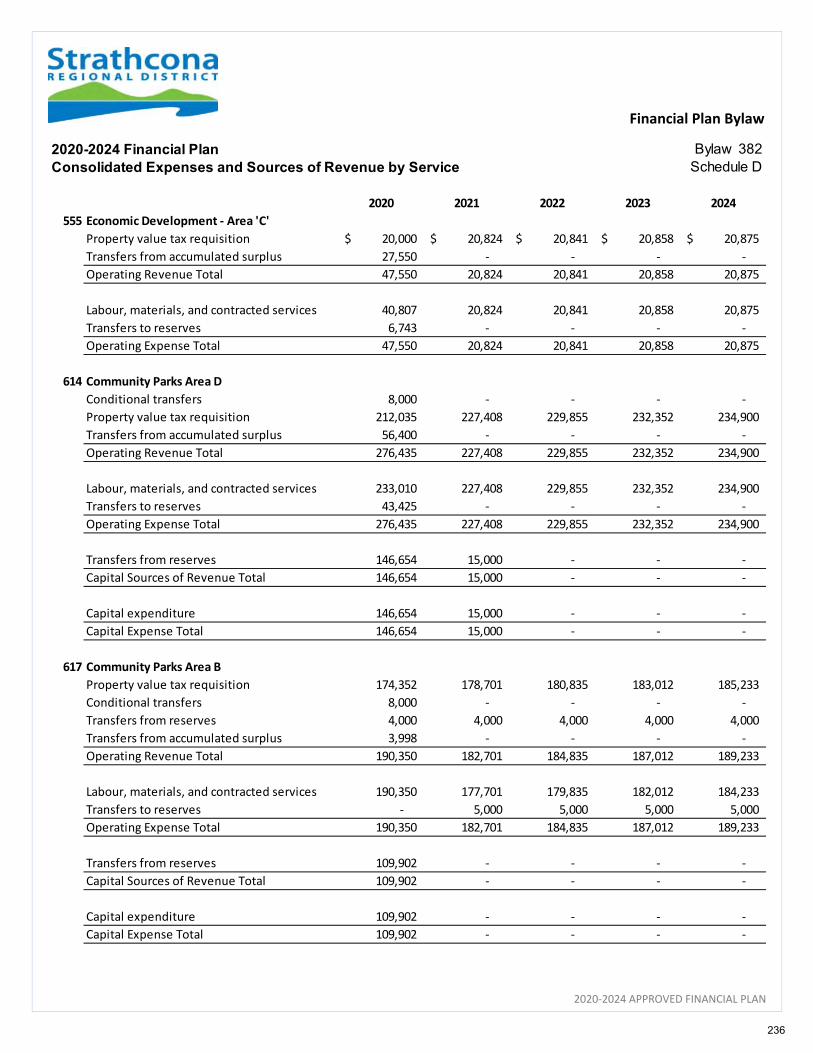
Financial Plan Bylaw
2020‐2024 APPROVED FINANCIAL PLAN
2020-2024 Financial Plan Bylaw 382Consolidated Expenses and Sources of Revenue by Service Schedule D
2020 2021 2022 2023 2024
555 Economic Development ‐ Area 'C'
Property value tax requisition 20,000$ 20,824$ 20,841$ 20,858$ 20,875$
Transfers from accumulated surplus 27,550 ‐ ‐ ‐ ‐
Operating Revenue Total 47,550 20,824 20,841 20,858 20,875
Labour, materials, and contracted services 40,807 20,824 20,841 20,858 20,875
Transfers to reserves 6,743 ‐ ‐ ‐ ‐
Operating Expense Total 47,550 20,824 20,841 20,858 20,875
614 Community Parks Area D
Conditional transfers 8,000 ‐ ‐ ‐ ‐
Property value tax requisition 212,035 227,408 229,855 232,352 234,900
Transfers from accumulated surplus 56,400 ‐ ‐ ‐ ‐
Operating Revenue Total 276,435 227,408 229,855 232,352 234,900
Labour, materials, and contracted services 233,010 227,408 229,855 232,352 234,900
Transfers to reserves 43,425 ‐ ‐ ‐ ‐
Operating Expense Total 276,435 227,408 229,855 232,352 234,900
Transfers from reserves 146,654 15,000 ‐ ‐ ‐
Capital Sources of Revenue Total 146,654 15,000 ‐ ‐ ‐
Capital expenditure 146,654 15,000 ‐ ‐ ‐
Capital Expense Total 146,654 15,000 ‐ ‐ ‐
617 Community Parks Area B
Property value tax requisition 174,352 178,701 180,835 183,012 185,233
Conditional transfers 8,000 ‐ ‐ ‐ ‐
Transfers from reserves 4,000 4,000 4,000 4,000 4,000
Transfers from accumulated surplus 3,998 ‐ ‐ ‐ ‐
Operating Revenue Total 190,350 182,701 184,835 187,012 189,233
Labour, materials, and contracted services 190,350 177,701 179,835 182,012 184,233
Transfers to reserves ‐ 5,000 5,000 5,000 5,000
Operating Expense Total 190,350 182,701 184,835 187,012 189,233
Transfers from reserves 109,902 ‐ ‐ ‐ ‐
Capital Sources of Revenue Total 109,902 ‐ ‐ ‐ ‐
Capital expenditure 109,902 ‐ ‐ ‐ ‐
Capital Expense Total 109,902 ‐ ‐ ‐ ‐
236
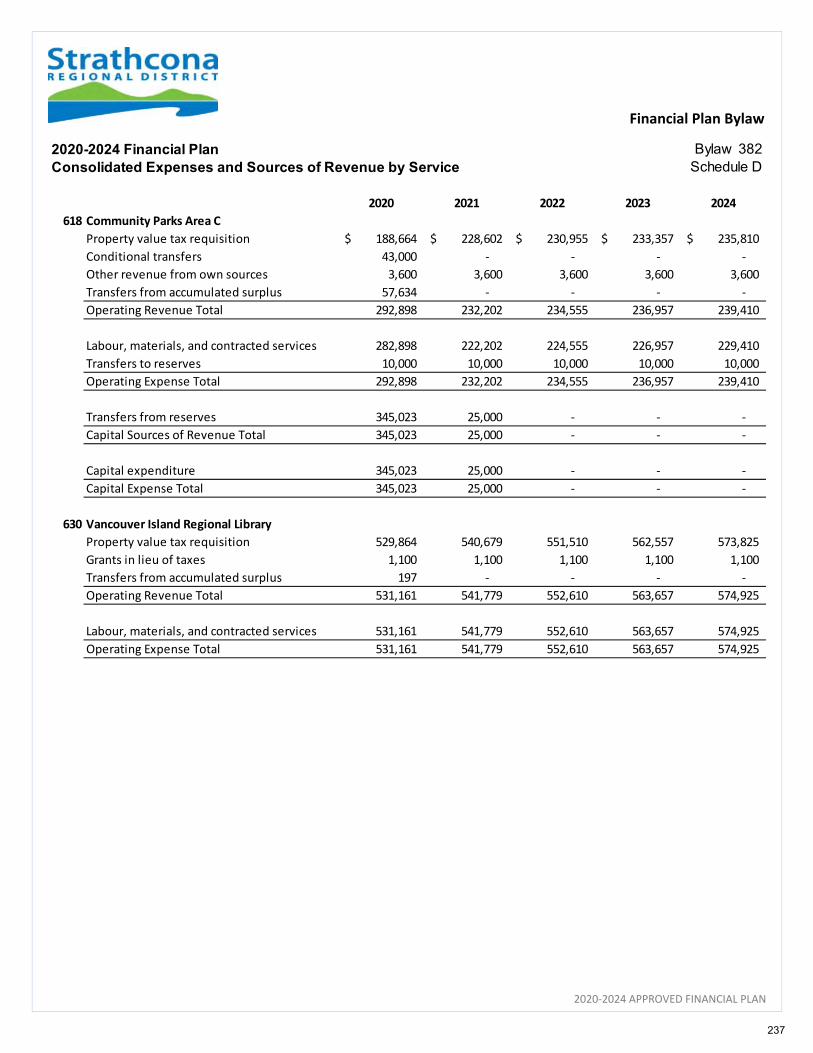
Financial Plan Bylaw
2020‐2024 APPROVED FINANCIAL PLAN
2020-2024 Financial Plan Bylaw 382Consolidated Expenses and Sources of Revenue by Service Schedule D
2020 2021 2022 2023 2024
618 Community Parks Area C
Property value tax requisition 188,664$ 228,602$ 230,955$ 233,357$ 235,810$
Conditional transfers 43,000 ‐ ‐ ‐ ‐
Other revenue from own sources 3,600 3,600 3,600 3,600 3,600
Transfers from accumulated surplus 57,634 ‐ ‐ ‐ ‐
Operating Revenue Total 292,898 232,202 234,555 236,957 239,410
Labour, materials, and contracted services 282,898 222,202 224,555 226,957 229,410
Transfers to reserves 10,000 10,000 10,000 10,000 10,000
Operating Expense Total 292,898 232,202 234,555 236,957 239,410
Transfers from reserves 345,023 25,000 ‐ ‐ ‐
Capital Sources of Revenue Total 345,023 25,000 ‐ ‐ ‐
Capital expenditure 345,023 25,000 ‐ ‐ ‐
Capital Expense Total 345,023 25,000 ‐ ‐ ‐
630 Vancouver Island Regional Library
Property value tax requisition 529,864 540,679 551,510 562,557 573,825
Grants in lieu of taxes 1,100 1,100 1,100 1,100 1,100
Transfers from accumulated surplus 197 ‐ ‐ ‐ ‐
Operating Revenue Total 531,161 541,779 552,610 563,657 574,925
Labour, materials, and contracted services 531,161 541,779 552,610 563,657 574,925
Operating Expense Total 531,161 541,779 552,610 563,657 574,925
237
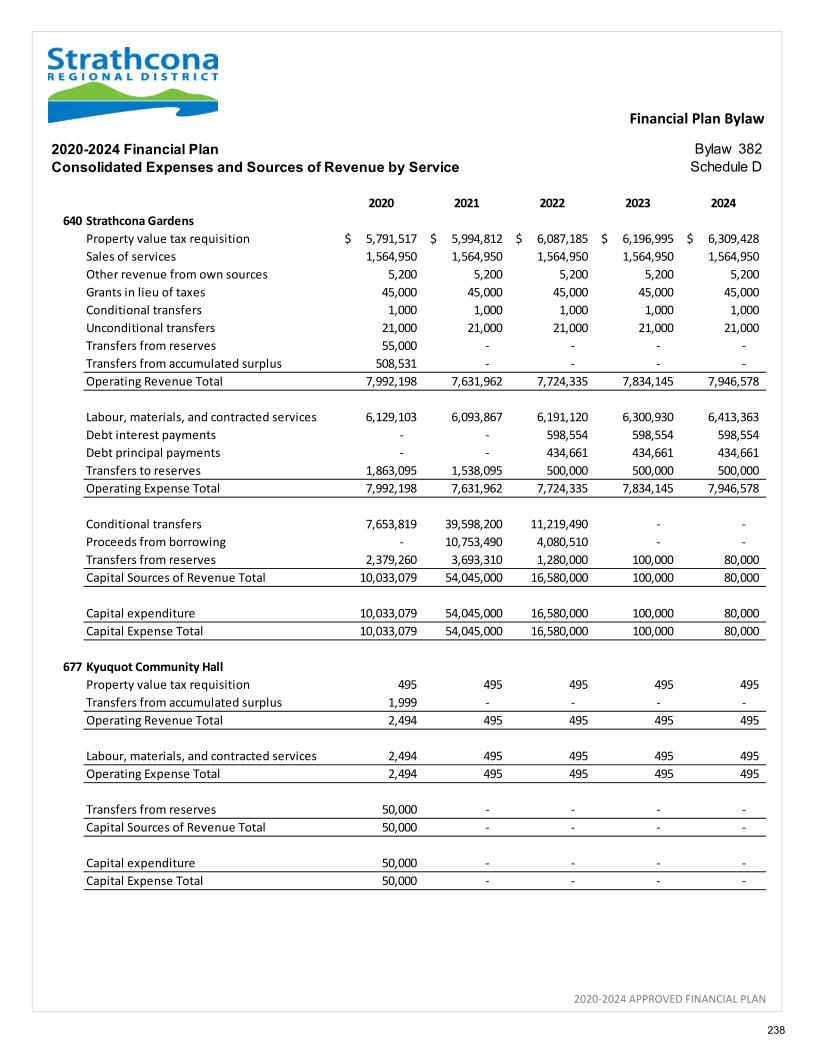
Financial Plan Bylaw
2020‐2024 APPROVED FINANCIAL PLAN
2020-2024 Financial Plan Bylaw 382Consolidated Expenses and Sources of Revenue by Service Schedule D
2020 2021 2022 2023 2024
640 Strathcona Gardens
Property value tax requisition 5,791,517$ 5,994,812$ 6,087,185$ 6,196,995$ 6,309,428$
Sales of services 1,564,950 1,564,950 1,564,950 1,564,950 1,564,950
Other revenue from own sources 5,200 5,200 5,200 5,200 5,200
Grants in lieu of taxes 45,000 45,000 45,000 45,000 45,000
Conditional transfers 1,000 1,000 1,000 1,000 1,000
Unconditional transfers 21,000 21,000 21,000 21,000 21,000
Transfers from reserves 55,000 ‐ ‐ ‐ ‐
Transfers from accumulated surplus 508,531 ‐ ‐ ‐ ‐
Operating Revenue Total 7,992,198 7,631,962 7,724,335 7,834,145 7,946,578
Labour, materials, and contracted services 6,129,103 6,093,867 6,191,120 6,300,930 6,413,363
Debt interest payments ‐ ‐ 598,554 598,554 598,554
Debt principal payments ‐ ‐ 434,661 434,661 434,661
Transfers to reserves 1,863,095 1,538,095 500,000 500,000 500,000
Operating Expense Total 7,992,198 7,631,962 7,724,335 7,834,145 7,946,578
Conditional transfers 7,653,819 39,598,200 11,219,490 ‐ ‐
Proceeds from borrowing ‐ 10,753,490 4,080,510 ‐ ‐
Transfers from reserves 2,379,260 3,693,310 1,280,000 100,000 80,000
Capital Sources of Revenue Total 10,033,079 54,045,000 16,580,000 100,000 80,000
Capital expenditure 10,033,079 54,045,000 16,580,000 100,000 80,000
Capital Expense Total 10,033,079 54,045,000 16,580,000 100,000 80,000
677 Kyuquot Community Hall
Property value tax requisition 495 495 495 495 495
Transfers from accumulated surplus 1,999 ‐ ‐ ‐ ‐
Operating Revenue Total 2,494 495 495 495 495
Labour, materials, and contracted services 2,494 495 495 495 495
Operating Expense Total 2,494 495 495 495 495
Transfers from reserves 50,000 ‐ ‐ ‐ ‐
Capital Sources of Revenue Total 50,000 ‐ ‐ ‐ ‐
Capital expenditure 50,000 ‐ ‐ ‐ ‐
Capital Expense Total 50,000 ‐ ‐ ‐ ‐
238
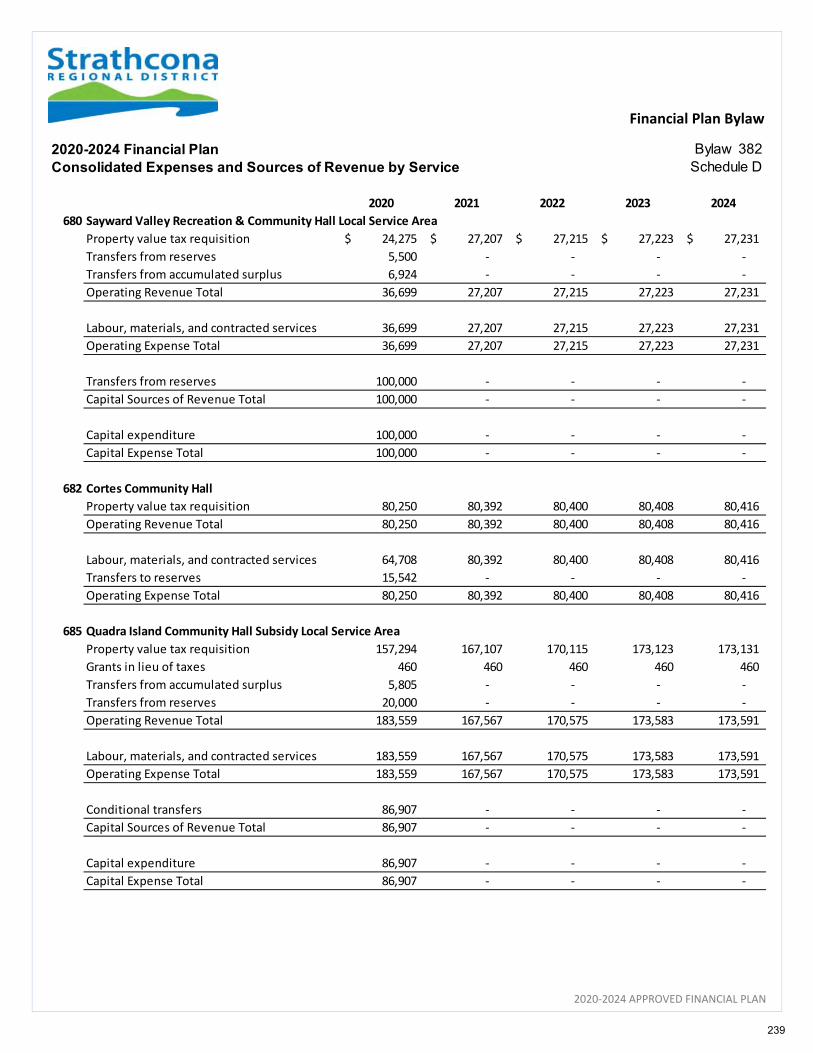
Financial Plan Bylaw
2020‐2024 APPROVED FINANCIAL PLAN
2020-2024 Financial Plan Bylaw 382Consolidated Expenses and Sources of Revenue by Service Schedule D
2020 2021 2022 2023 2024
680 Sayward Valley Recreation & Community Hall Local Service Area
Property value tax requisition 24,275$ 27,207$ 27,215$ 27,223$ 27,231$
Transfers from reserves 5,500 ‐ ‐ ‐ ‐
Transfers from accumulated surplus 6,924 ‐ ‐ ‐ ‐
Operating Revenue Total 36,699 27,207 27,215 27,223 27,231
Labour, materials, and contracted services 36,699 27,207 27,215 27,223 27,231
Operating Expense Total 36,699 27,207 27,215 27,223 27,231
Transfers from reserves 100,000 ‐ ‐ ‐ ‐
Capital Sources of Revenue Total 100,000 ‐ ‐ ‐ ‐
Capital expenditure 100,000 ‐ ‐ ‐ ‐
Capital Expense Total 100,000 ‐ ‐ ‐ ‐
682 Cortes Community Hall
Property value tax requisition 80,250 80,392 80,400 80,408 80,416
Operating Revenue Total 80,250 80,392 80,400 80,408 80,416
Labour, materials, and contracted services 64,708 80,392 80,400 80,408 80,416
Transfers to reserves 15,542 ‐ ‐ ‐ ‐
Operating Expense Total 80,250 80,392 80,400 80,408 80,416
685 Quadra Island Community Hall Subsidy Local Service Area
Property value tax requisition 157,294 167,107 170,115 173,123 173,131
Grants in lieu of taxes 460 460 460 460 460
Transfers from accumulated surplus 5,805 ‐ ‐ ‐ ‐
Transfers from reserves 20,000 ‐ ‐ ‐ ‐
Operating Revenue Total 183,559 167,567 170,575 173,583 173,591
Labour, materials, and contracted services 183,559 167,567 170,575 173,583 173,591
Operating Expense Total 183,559 167,567 170,575 173,583 173,591
Conditional transfers 86,907 ‐ ‐ ‐ ‐
Capital Sources of Revenue Total 86,907 ‐ ‐ ‐ ‐
Capital expenditure 86,907 ‐ ‐ ‐ ‐
Capital Expense Total 86,907 ‐ ‐ ‐ ‐
239

Financial Plan Bylaw
2020‐2024 APPROVED FINANCIAL PLAN
2020-2024 Financial Plan Bylaw 382Consolidated Expenses and Sources of Revenue by Service Schedule D
2020 2021 2022 2023 2024
697 Heritage Conservation ‐ Area B
Property value tax requisition ‐$ 1,262$ 1,262$ 1,262$ 1,262$
Transfers from accumulated surplus 2,923 ‐ ‐ ‐ ‐
Operating Revenue Total 2,923 1,262 1,262 1,262 1,262
Labour, materials, and contracted services 2,923 1,262 1,262 1,262 1,262
Operating Expense Total 2,923 1,262 1,262 1,262 1,262
698 Heritage Conservation ‐ Area C
Property value tax requisition 1,270 1,270 1,270 1,270 1,270
Transfers from accumulated surplus 4,581 ‐ ‐ ‐ ‐
Operating Revenue Total 5,851 1,270 1,270 1,270 1,270
Labour, materials, and contracted services 5,851 1,270 1,270 1,270 1,270
Operating Expense Total 5,851 1,270 1,270 1,270 1,270
750 Electoral Area D Street Lighting Service
Property value tax requisition 35,030 37,201 37,952 38,718 39,500
Other revenue from own sources 360 360 360 360 360
Transfers from accumulated surplus 1,434 ‐ ‐ ‐ ‐
Operating Revenue Total 36,824 37,561 38,312 39,078 39,860
Labour, materials, and contracted services 36,824 37,561 38,312 39,078 39,860
Operating Expense Total 36,824 37,561 38,312 39,078 39,860
770 Electoral Area C Street Lighting Service
Property value tax requisition 7,333 7,740 7,895 8,053 8,214
Transfers from accumulated surplus 254 ‐ ‐ ‐ ‐
Operating Revenue Total 7,587 7,740 7,895 8,053 8,214
Labour, materials, and contracted services 7,587 7,740 7,895 8,053 8,214
Operating Expense Total 7,587 7,740 7,895 8,053 8,214
240
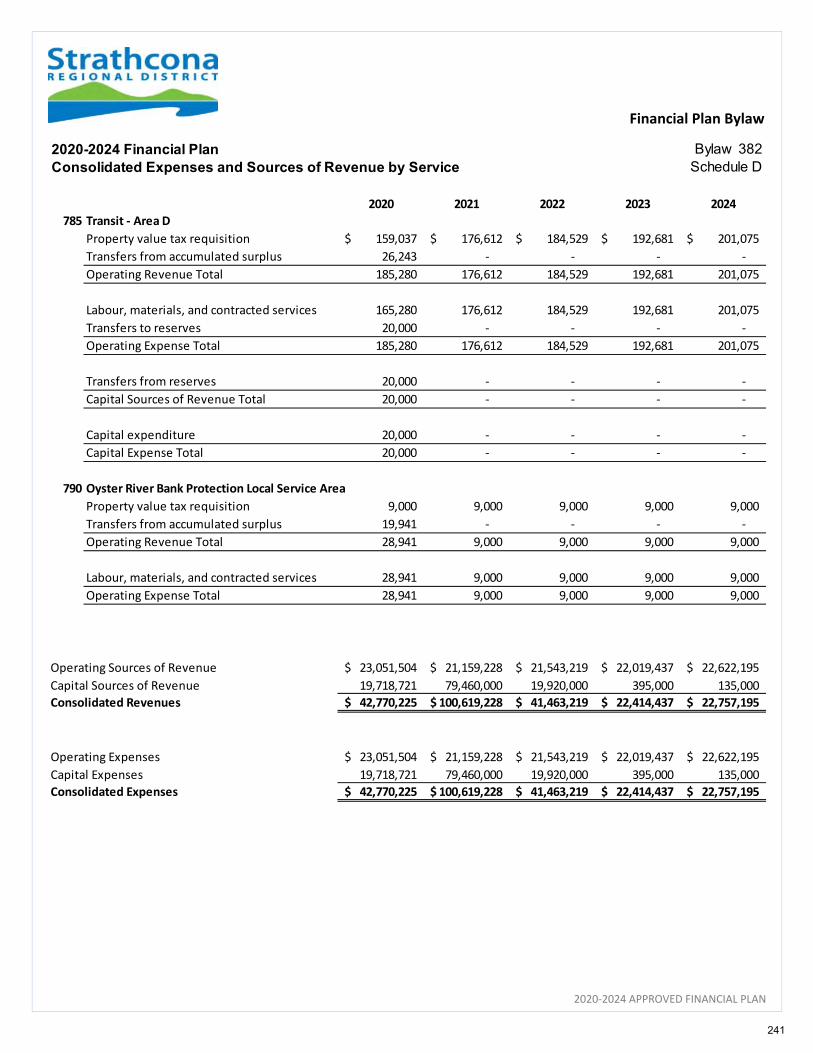
Financial Plan Bylaw
2020‐2024 APPROVED FINANCIAL PLAN
2020-2024 Financial Plan Bylaw 382Consolidated Expenses and Sources of Revenue by Service Schedule D
2020 2021 2022 2023 2024
785 Transit ‐ Area D
Property value tax requisition 159,037$ 176,612$ 184,529$ 192,681$ 201,075$
Transfers from accumulated surplus 26,243 ‐ ‐ ‐ ‐
Operating Revenue Total 185,280 176,612 184,529 192,681 201,075
Labour, materials, and contracted services 165,280 176,612 184,529 192,681 201,075
Transfers to reserves 20,000 ‐ ‐ ‐ ‐
Operating Expense Total 185,280 176,612 184,529 192,681 201,075
Transfers from reserves 20,000 ‐ ‐ ‐ ‐
Capital Sources of Revenue Total 20,000 ‐ ‐ ‐ ‐
Capital expenditure 20,000 ‐ ‐ ‐ ‐
Capital Expense Total 20,000 ‐ ‐ ‐ ‐
790 Oyster River Bank Protection Local Service Area
Property value tax requisition 9,000 9,000 9,000 9,000 9,000
Transfers from accumulated surplus 19,941 ‐ ‐ ‐ ‐
Operating Revenue Total 28,941 9,000 9,000 9,000 9,000
Labour, materials, and contracted services 28,941 9,000 9,000 9,000 9,000
Operating Expense Total 28,941 9,000 9,000 9,000 9,000
Operating Sources of Revenue 23,051,504$ 21,159,228$ 21,543,219$ 22,019,437$ 22,622,195$
Capital Sources of Revenue 19,718,721 79,460,000 19,920,000 395,000 135,000
Consolidated Revenues 42,770,225$ 100,619,228$ 41,463,219$ 22,414,437$ 22,757,195$
Operating Expenses 23,051,504$ 21,159,228$ 21,543,219$ 22,019,437$ 22,622,195$
Capital Expenses 19,718,721 79,460,000 19,920,000 395,000 135,000
Consolidated Expenses 42,770,225$ 100,619,228$ 41,463,219$ 22,414,437$ 22,757,195$
241

242242
2020‐2024 APPROVED FINANCIAL PLAN
Glossary & Indices
FINANCIAL PLAN
2020 – 2024
243
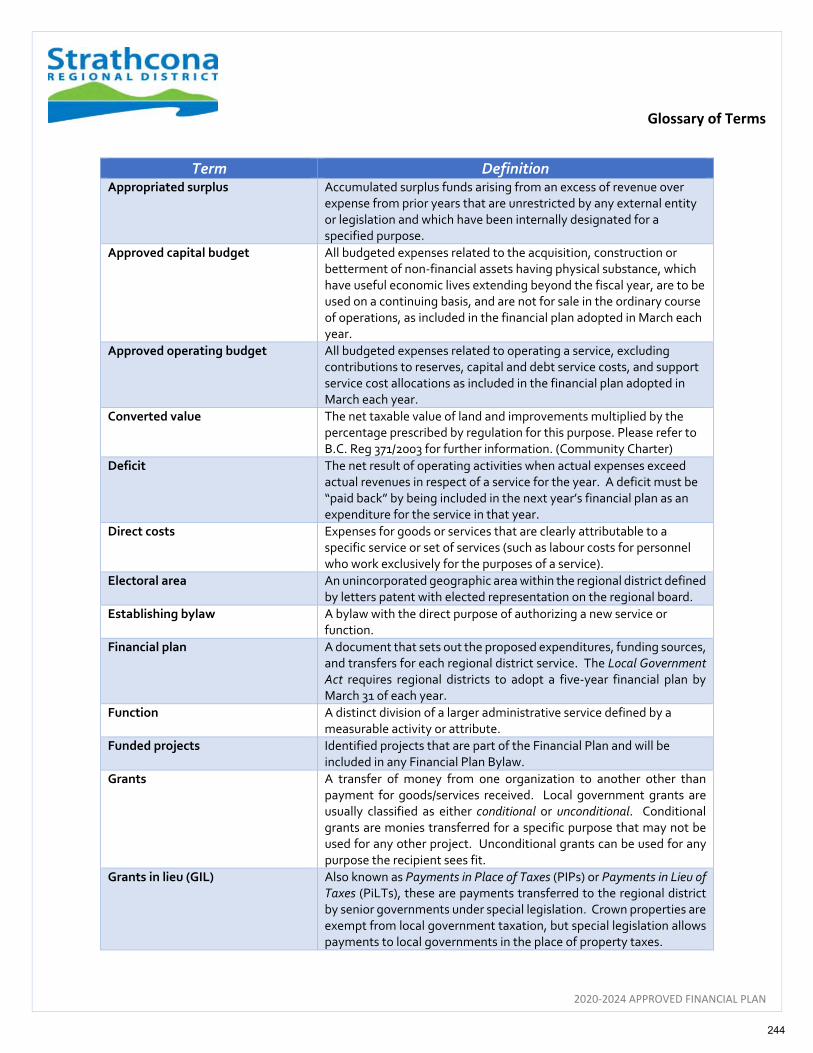
Glossary of Terms
2020‐2024 APPROVED FINANCIAL PLAN
Term Definition Appropriated surplus Accumulated surplus funds arising from an excess of revenue over
expense from prior years that are unrestricted by any external entity or legislation and which have been internally designated for a specified purpose.
Approved capital budget All budgeted expenses related to the acquisition, construction or betterment of non‐financial assets having physical substance, which have useful economic lives extending beyond the fiscal year, are to be used on a continuing basis, and are not for sale in the ordinary course of operations, as included in the financial plan adopted in March each year.
Approved operating budget All budgeted expenses related to operating a service, excluding contributions to reserves, capital and debt service costs, and support service cost allocations as included in the financial plan adopted in March each year.
Converted value The net taxable value of land and improvements multiplied by the percentage prescribed by regulation for this purpose. Please refer to B.C. Reg 371/2003 for further information. (Community Charter)
Deficit The net result of operating activities when actual expenses exceed actual revenues in respect of a service for the year. A deficit must be “paid back” by being included in the next year’s financial plan as an expenditure for the service in that year.
Direct costs Expenses for goods or services that are clearly attributable to a specific service or set of services (such as labour costs for personnel who work exclusively for the purposes of a service).
Electoral area An unincorporated geographic area within the regional district defined by letters patent with elected representation on the regional board.
Establishing bylaw A bylaw with the direct purpose of authorizing a new service or function.
Financial plan A document that sets out the proposed expenditures, funding sources, and transfers for each regional district service. The Local Government Act requires regional districts to adopt a five‐year financial plan by March 31 of each year.
Function A distinct division of a larger administrative service defined by a measurable activity or attribute.
Funded projects Identified projects that are part of the Financial Plan and will be included in any Financial Plan Bylaw.
Grants A transfer of money from one organization to another other than payment for goods/services received. Local government grants are usually classified as either conditional or unconditional. Conditional grants are monies transferred for a specific purpose that may not be used for any other project. Unconditional grants can be used for any purpose the recipient sees fit.
Grants in lieu (GIL) Also known as Payments in Place of Taxes (PIPs) or Payments in Lieu of Taxes (PiLTs), these are payments transferred to the regional district by senior governments under special legislation. Crown properties are exempt from local government taxation, but special legislation allows payments to local governments in the place of property taxes.
244
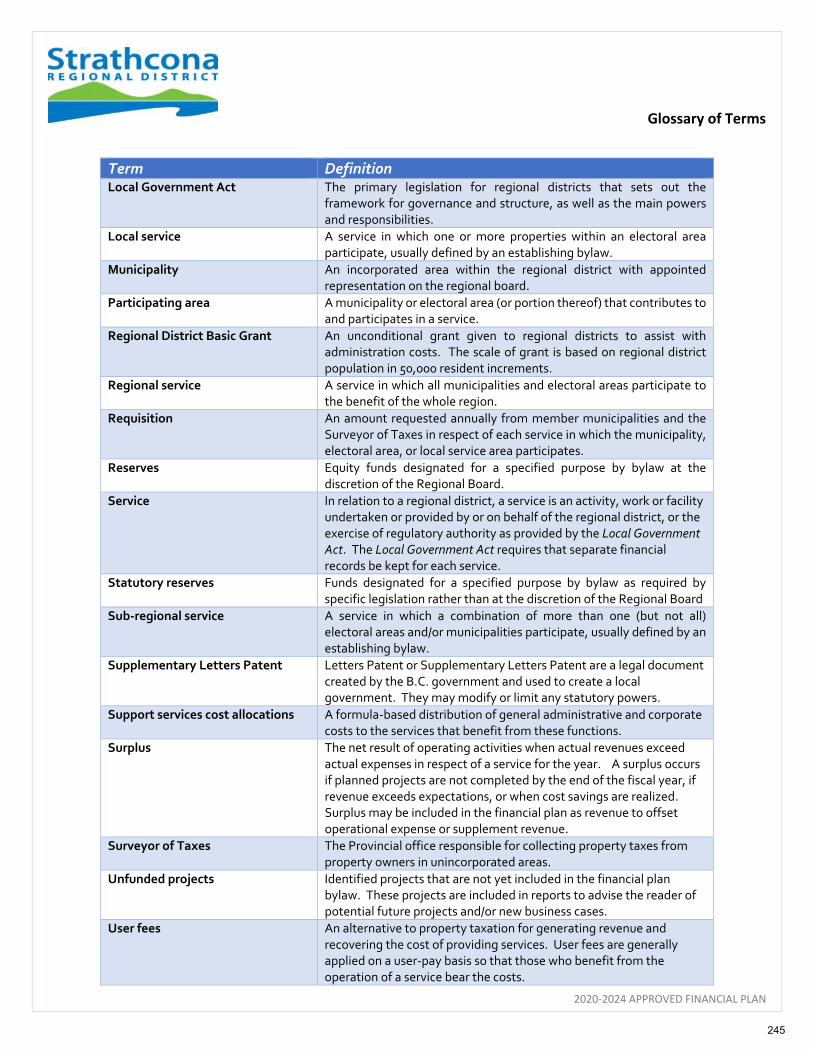
Glossary of Terms
2020‐2024 APPROVED FINANCIAL PLAN
Term Definition Local Government Act The primary legislation for regional districts that sets out the
framework for governance and structure, as well as the main powers and responsibilities.
Local service A service in which one or more properties within an electoral area participate, usually defined by an establishing bylaw.
Municipality An incorporated area within the regional district with appointed representation on the regional board.
Participating area A municipality or electoral area (or portion thereof) that contributes to and participates in a service.
Regional District Basic Grant An unconditional grant given to regional districts to assist with administration costs. The scale of grant is based on regional district population in 50,000 resident increments.
Regional service A service in which all municipalities and electoral areas participate to the benefit of the whole region.
Requisition An amount requested annually from member municipalities and the Surveyor of Taxes in respect of each service in which the municipality, electoral area, or local service area participates.
Reserves Equity funds designated for a specified purpose by bylaw at the discretion of the Regional Board.
Service In relation to a regional district, a service is an activity, work or facility undertaken or provided by or on behalf of the regional district, or the exercise of regulatory authority as provided by the Local Government Act. The Local Government Act requires that separate financial records be kept for each service.
Statutory reserves Funds designated for a specified purpose by bylaw as required by specific legislation rather than at the discretion of the Regional Board
Sub‐regional service A service in which a combination of more than one (but not all) electoral areas and/or municipalities participate, usually defined by an establishing bylaw.
Supplementary Letters Patent Letters Patent or Supplementary Letters Patent are a legal document created by the B.C. government and used to create a local government. They may modify or limit any statutory powers.
Support services cost allocations A formula‐based distribution of general administrative and corporate costs to the services that benefit from these functions.
Surplus The net result of operating activities when actual revenues exceed actual expenses in respect of a service for the year. A surplus occurs if planned projects are not completed by the end of the fiscal year, if revenue exceeds expectations, or when cost savings are realized. Surplus may be included in the financial plan as revenue to offset operational expense or supplement revenue.
Surveyor of Taxes The Provincial office responsible for collecting property taxes from property owners in unincorporated areas.
Unfunded projects Identified projects that are not yet included in the financial plan bylaw. These projects are included in reports to advise the reader of potential future projects and/or new business cases.
User fees An alternative to property taxation for generating revenue and recovering the cost of providing services. User fees are generally applied on a user‐pay basis so that those who benefit from the operation of a service bear the costs.
245
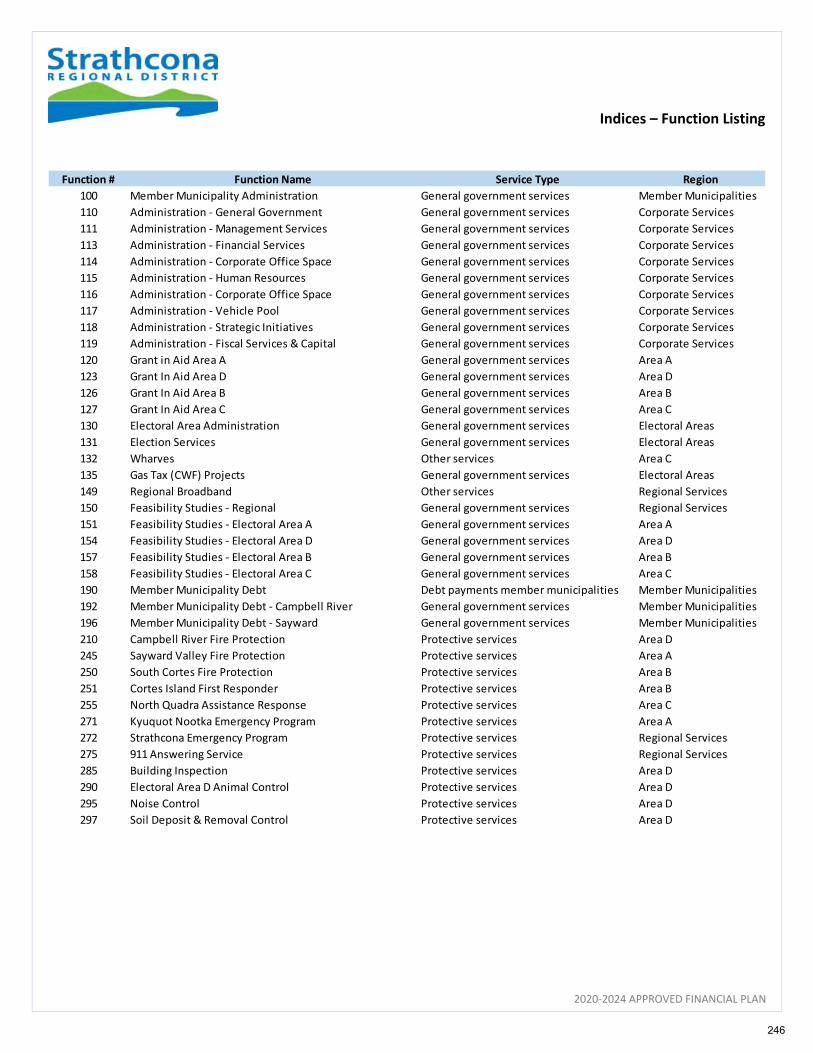
Indices – Function Listing
2020‐2024 APPROVED FINANCIAL PLAN
Function # Function Name Service Type Region
100 Member Municipality Administration General government services Member Municipalities
110 Administration ‐ General Government General government services Corporate Services
111 Administration ‐ Management Services General government services Corporate Services
113 Administration ‐ Financial Services General government services Corporate Services
114 Administration ‐ Corporate Office Space General government services Corporate Services
115 Administration ‐ Human Resources General government services Corporate Services
116 Administration ‐ Corporate Office Space General government services Corporate Services
117 Administration ‐ Vehicle Pool General government services Corporate Services
118 Administration ‐ Strategic Initiatives General government services Corporate Services
119 Administration ‐ Fiscal Services & Capital General government services Corporate Services
120 Grant in Aid Area A General government services Area A
123 Grant In Aid Area D General government services Area D
126 Grant In Aid Area B General government services Area B
127 Grant In Aid Area C General government services Area C
130 Electoral Area Administration General government services Electoral Areas
131 Election Services General government services Electoral Areas
132 Wharves Other services Area C
135 Gas Tax (CWF) Projects General government services Electoral Areas
149 Regional Broadband Other services Regional Services
150 Feasibility Studies ‐ Regional General government services Regional Services
151 Feasibility Studies ‐ Electoral Area A General government services Area A
154 Feasibility Studies ‐ Electoral Area D General government services Area D
157 Feasibility Studies ‐ Electoral Area B General government services Area B
158 Feasibility Studies ‐ Electoral Area C General government services Area C
190 Member Municipality Debt Debt payments member municipalities Member Municipalities
192 Member Municipality Debt ‐ Campbell River General government services Member Municipalities
196 Member Municipality Debt ‐ Sayward General government services Member Municipalities
210 Campbell River Fire Protection Protective services Area D
245 Sayward Valley Fire Protection Protective services Area A
250 South Cortes Fire Protection Protective services Area B
251 Cortes Island First Responder Protective services Area B
255 North Quadra Assistance Response Protective services Area C
271 Kyuquot Nootka Emergency Program Protective services Area A
272 Strathcona Emergency Program Protective services Regional Services
275 911 Answering Service Protective services Regional Services
285 Building Inspection Protective services Area D
290 Electoral Area D Animal Control Protective services Area D
295 Noise Control Protective services Area D
297 Soil Deposit & Removal Control Protective services Area D
246

Indices – Function Listing
2020‐2024 APPROVED FINANCIAL PLAN
Function # Function Name Service Type Region
298 Unsightly Premises Protective services Area D
318 Craig Road Water Environmental health services Area D
319 Electoral Area D Water Environmental health services Area D
331 Quathiaski Cove Sewer Environmental health services Area C
332 Quathiaski Cove Sewer Ext #1 Environmental health services Area C
340 Liquid Waste Environmental health services Electoral Areas
364 Area A Kyuquot Nootka Solid Waste Environmental health services Area A
368 Sayward and Area A Sayward Refuse Environmental health services Area A
370 Solid Waste Local Service ‐ Sayward Valley Environmental health services Area A
374 Area B Refuse Disposal Environmental health services Area B
376 Cortes Island Refuse Collection Environmental health services Area B
500 Planning Development services Electoral Areas
501 Planning ‐ GIS Development services Electoral Areas
502 Planning ‐ Bylaw Development services Electoral Areas
510 Planning (Non Part 26) Development services Regional Services
533 House Numbering Area D Development services Area D
534 House Numbering Area A Sayward Development services Area A
535 House Numbering Area B Development services Area B
536 House Numbering Area C Development services Area C
554 Economic Development ‐ Area A Sayward Development services Area A
555 Economic Development ‐ Area C Development services Area C
614 Community Parks Area D Parks, recreation and cultural services Area D
617 Community Parks Area B Parks, recreation and cultural services Area B
618 Community Parks Area C Parks, recreation and cultural services Area C
630 Vancouver Island Regional Library Parks, recreation and cultural services Electoral Areas
640 Strathcona Gardens Parks, recreation and cultural services Strathcona Gardens
641 Strathcona Gardens ‐ Administration & Concession Parks, recreation and cultural services Strathcona Gardens
642 Strathcona Gardens ‐ Aquatics, Fitness & Rehab Parks, recreation and cultural services Strathcona Gardens
643 Strathcona Gardens ‐ Facility Operations Parks, recreation and cultural services Strathcona Gardens
644 Strathcona Gardens ‐ Ice & Other Programs Parks, recreation and cultural services Strathcona Gardens
677 Kyuquot Community Hall Parks, recreation and cultural services Area A
680 Sayward Valley Heritage Hall Parks, recreation and cultural services Area A
682 Cortes Island Community Hall Parks, recreation and cultural services Area B
685 Quadra Island Community Hall Subsidy Parks, recreation and cultural services Area C
697 Heritage Conservation ‐ Area B Parks, recreation and cultural services Area B
698 Heritage Conservation ‐ Area C Parks, recreation and cultural services Area C
750 Electoral Area D Street Lighting Service Transportation services Area D
770 Electoral Area C Street Lighting Service Transportation services Area C
785 Transit ‐ Area D Transportation services Area D
790 Oyster River Bank Protection Transportation services Area D
247
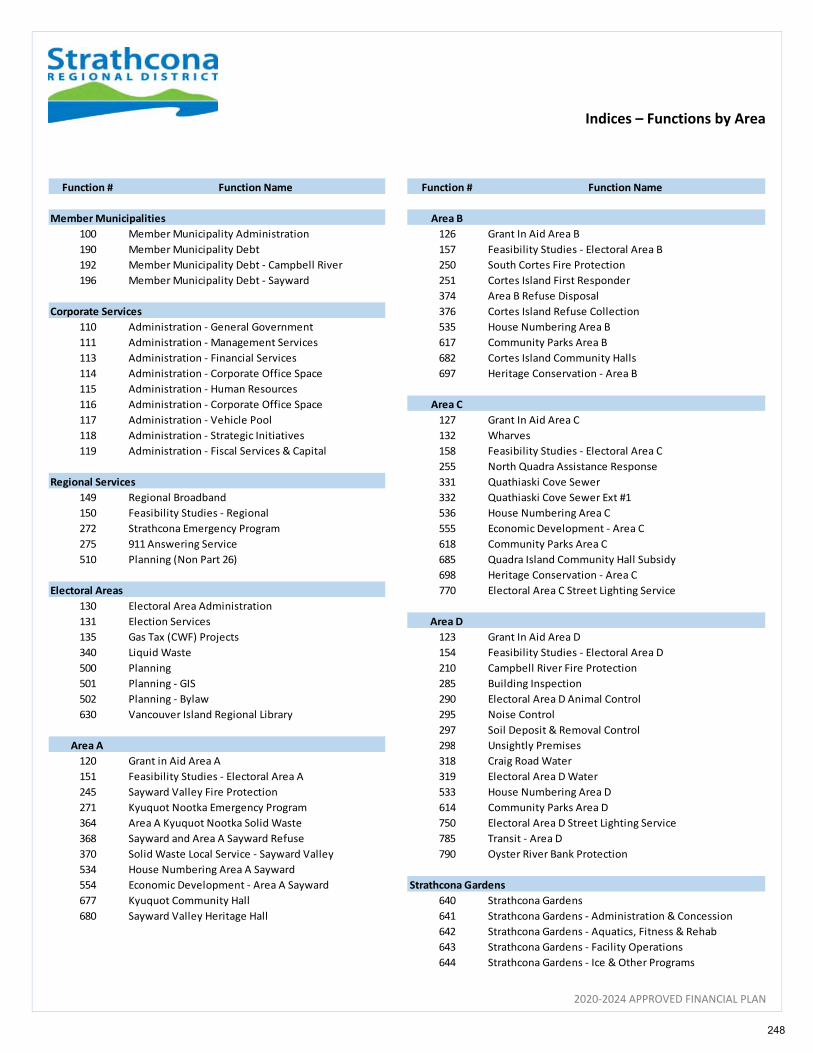
Indices – Functions by Area
2020‐2024 APPROVED FINANCIAL PLAN
Function # Function Name Function # Function Name
Member Municipalities Area B
100 Member Municipality Administration 126 Grant In Aid Area B
190 Member Municipality Debt 157 Feasibility Studies ‐ Electoral Area B
192 Member Municipality Debt ‐ Campbell River 250 South Cortes Fire Protection
196 Member Municipality Debt ‐ Sayward 251 Cortes Island First Responder
374 Area B Refuse Disposal
Corporate Services 376 Cortes Island Refuse Collection
110 Administration ‐ General Government 535 House Numbering Area B
111 Administration ‐ Management Services 617 Community Parks Area B
113 Administration ‐ Financial Services 682 Cortes Island Community Halls
114 Administration ‐ Corporate Office Space 697 Heritage Conservation ‐ Area B
115 Administration ‐ Human Resources
116 Administration ‐ Corporate Office Space Area C
117 Administration ‐ Vehicle Pool 127 Grant In Aid Area C
118 Administration ‐ Strategic Initiatives 132 Wharves
119 Administration ‐ Fiscal Services & Capital 158 Feasibility Studies ‐ Electoral Area C
255 North Quadra Assistance Response
Regional Services 331 Quathiaski Cove Sewer
149 Regional Broadband 332 Quathiaski Cove Sewer Ext #1
150 Feasibility Studies ‐ Regional 536 House Numbering Area C
272 Strathcona Emergency Program 555 Economic Development ‐ Area C
275 911 Answering Service 618 Community Parks Area C
510 Planning (Non Part 26) 685 Quadra Island Community Hall Subsidy
698 Heritage Conservation ‐ Area C
Electoral Areas 770 Electoral Area C Street Lighting Service
130 Electoral Area Administration
131 Election Services Area D
135 Gas Tax (CWF) Projects 123 Grant In Aid Area D
340 Liquid Waste 154 Feasibility Studies ‐ Electoral Area D
500 Planning 210 Campbell River Fire Protection
501 Planning ‐ GIS 285 Building Inspection
502 Planning ‐ Bylaw 290 Electoral Area D Animal Control
630 Vancouver Island Regional Library 295 Noise Control
297 Soil Deposit & Removal Control
Area A 298 Unsightly Premises
120 Grant in Aid Area A 318 Craig Road Water
151 Feasibility Studies ‐ Electoral Area A 319 Electoral Area D Water
245 Sayward Valley Fire Protection 533 House Numbering Area D
271 Kyuquot Nootka Emergency Program 614 Community Parks Area D
364 Area A Kyuquot Nootka Solid Waste 750 Electoral Area D Street Lighting Service
368 Sayward and Area A Sayward Refuse 785 Transit ‐ Area D
370 Solid Waste Local Service ‐ Sayward Valley 790 Oyster River Bank Protection
534 House Numbering Area A Sayward
554 Economic Development ‐ Area A Sayward Strathcona Gardens
677 Kyuquot Community Hall 640 Strathcona Gardens
680 Sayward Valley Heritage Hall 641 Strathcona Gardens ‐ Administration & Concession
642 Strathcona Gardens ‐ Aquatics, Fitness & Rehab
643 Strathcona Gardens ‐ Facility Operations
644 Strathcona Gardens ‐ Ice & Other Programs
248
2020‐2024 APPROVED FINANCIAL PLAN
Appendix A
Detailed General Ledger
FINANCIAL PLAN
2020 – 2024
249
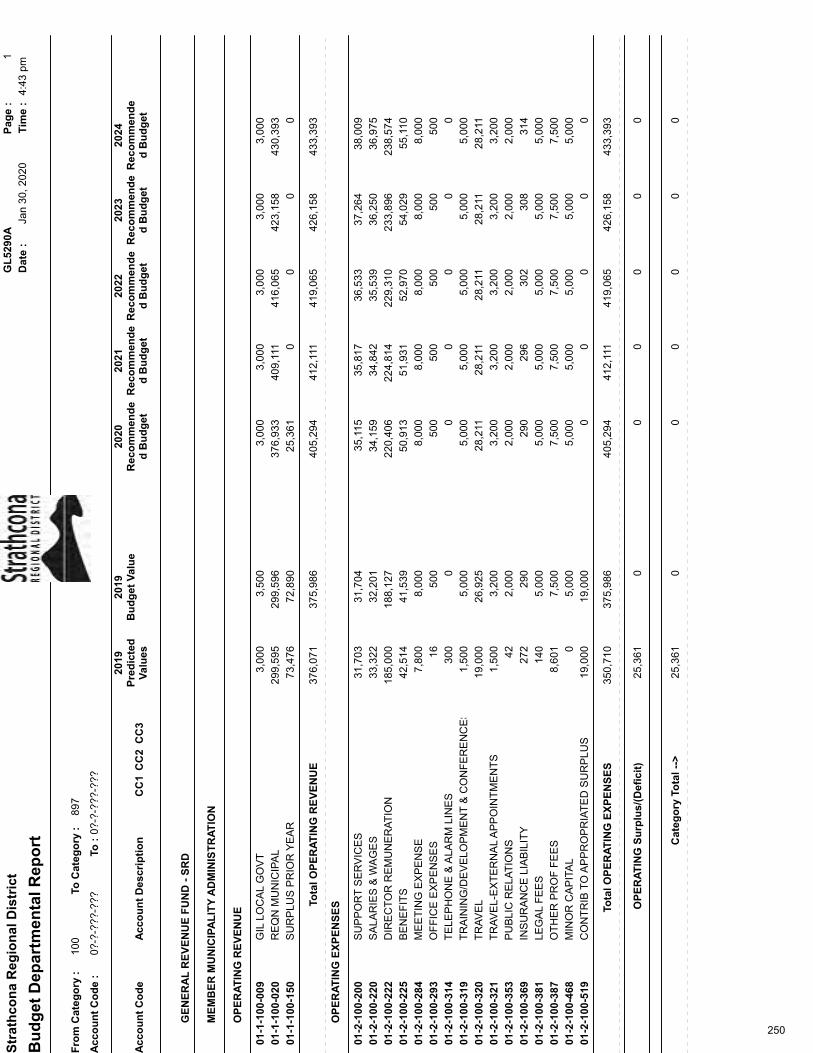
Str
ath
con
a R
egio
nal
Dis
tric
tG
L52
90A
Pag
e :
1
Dat
e :
Jan
30, 2
020
Tim
e :
4:43
pm
Bu
dg
et D
epar
tmen
tal R
epo
rt
Fro
m C
ateg
ory
:10
0To
Cat
ego
ry :
897
Acc
ou
nt
Co
de
:0?
-?-?
??-?
??To
:0?
-?-?
??-?
??
2019
2019
2020
2021
2022
2023
2024
Pre
dic
ted
Val
ues
Bu
dg
et V
alu
eR
eco
mm
end
ed
Bu
dg
etR
eco
mm
end
ed
Bu
dg
etR
eco
mm
end
ed
Bu
dg
etR
eco
mm
end
ed
Bu
dg
etR
eco
mm
end
ed
Bu
dg
etA
cco
un
t C
od
eA
cco
un
t D
escr
ipti
on
CC
1C
C2
CC
3
GE
NE
RA
L R
EV
EN
UE
FU
ND
- S
RD
ME
MB
ER
MU
NIC
IPA
LIT
Y A
DM
INIS
TR
AT
ION
OP
ER
AT
ING
RE
VE
NU
E
GIL
LO
CA
L G
OV
T01
-1-1
00-0
093,
500
3,00
03,
000
3,00
03,
000
3,00
03,
000
RE
QN
MU
NIC
IPA
L01
-1-1
00-0
2029
9,59
637
6,93
340
9,11
141
6,06
542
3,15
843
0,39
329
9,59
5
SU
RP
LUS
PR
IOR
YE
AR
01-1
-100
-150
72,8
9025
,361
00
00
73,4
76
Tota
l OP
ER
AT
ING
RE
VE
NU
E37
6,07
137
5,98
640
5,29
441
2,11
141
9,06
542
6,15
843
3,39
3
OP
ER
AT
ING
EX
PE
NS
ES
SU
PP
OR
T S
ER
VIC
ES
01-2
-100
-200
31,7
0435
,115
35,8
1736
,533
37,2
6438
,009
31,7
03
SA
LAR
IES
& W
AG
ES
01-2
-100
-220
32,2
0134
,159
34,8
4235
,539
36,2
5036
,975
33,3
22
DIR
EC
TO
R R
EM
UN
ER
AT
ION
01-2
-100
-222
188,
127
220,
406
224,
814
229,
310
233,
896
238,
574
185,
000
BE
NE
FIT
S01
-2-1
00-2
2541
,539
50,9
1351
,931
52,9
7054
,029
55,1
1042
,514
ME
ET
ING
EX
PE
NS
E01
-2-1
00-2
848,
000
8,00
08,
000
8,00
08,
000
8,00
07,
800
OF
FIC
E E
XP
EN
SE
S01
-2-1
00-2
9350
050
050
050
050
050
016
TE
LEP
HO
NE
& A
LAR
M L
INE
S01
-2-1
00-3
140
00
00
030
0
TR
AIN
ING
/DE
VE
LOP
ME
NT
& C
ON
FE
RE
NC
ES
01-2
-100
-319
5,00
05,
000
5,00
05,
000
5,00
05,
000
1,50
0
TR
AV
EL
01-2
-100
-320
26,9
2528
,211
28,2
1128
,211
28,2
1128
,211
19,0
00
TR
AV
EL-
EX
TE
RN
AL
AP
PO
INT
ME
NT
S01
-2-1
00-3
213,
200
3,20
03,
200
3,20
03,
200
3,20
01,
500
PU
BLI
C R
ELA
TIO
NS
01-2
-100
-353
2,00
02,
000
2,00
02,
000
2,00
02,
000
42
INS
UR
AN
CE
LIA
BIL
ITY
01-2
-100
-369
290
290
296
302
308
314
272
LEG
AL
FE
ES
01-2
-100
-381
5,00
05,
000
5,00
05,
000
5,00
05,
000
140
OT
HE
R P
RO
F F
EE
S01
-2-1
00-3
877,
500
7,50
07,
500
7,50
07,
500
7,50
08,
601
MIN
OR
CA
PIT
AL
01-2
-100
-468
5,00
05,
000
5,00
05,
000
5,00
05,
000
0
CO
NT
RIB
TO
AP
PR
OP
RIA
TE
D S
UR
PLU
S01
-2-1
00-5
1919
,000
00
00
019
,000
Tota
l O
PE
RA
TIN
G E
XP
EN
SE
S35
0,71
037
5,98
640
5,29
441
2,11
141
9,06
542
6,15
843
3,39
3
OP
ER
AT
ING
Su
rplu
s/(D
efic
it)
25,3
610
00
00
0
Cat
ego
ry T
ota
l -->
25,3
610
00
00
0
250
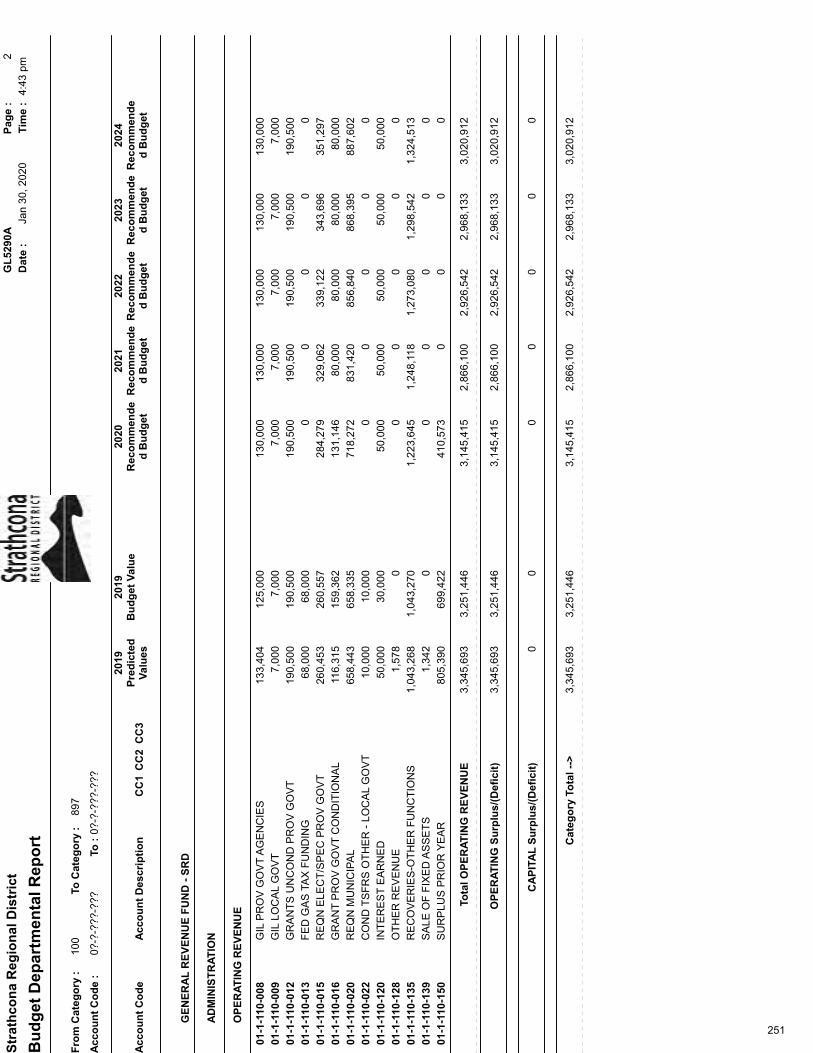
Str
ath
con
a R
egio
nal
Dis
tric
tG
L52
90A
Pag
e :
2
Dat
e :
Jan
30, 2
020
Tim
e :
4:43
pm
Bu
dg
et D
epar
tmen
tal R
epo
rt
Fro
m C
ateg
ory
:10
0To
Cat
ego
ry :
897
Acc
ou
nt
Co
de
:0?
-?-?
??-?
??To
:0?
-?-?
??-?
??
2019
2019
2020
2021
2022
2023
2024
Pre
dic
ted
Val
ues
Bu
dg
et V
alu
eR
eco
mm
end
ed
Bu
dg
etR
eco
mm
end
ed
Bu
dg
etR
eco
mm
end
ed
Bu
dg
etR
eco
mm
end
ed
Bu
dg
etR
eco
mm
end
ed
Bu
dg
etA
cco
un
t C
od
eA
cco
un
t D
escr
ipti
on
CC
1C
C2
CC
3
GE
NE
RA
L R
EV
EN
UE
FU
ND
- S
RD
AD
MIN
IST
RA
TIO
N
OP
ER
AT
ING
RE
VE
NU
E
GIL
PR
OV
GO
VT
AG
EN
CIE
S01
-1-1
10-0
0812
5,00
013
0,00
013
0,00
013
0,00
013
0,00
013
0,00
013
3,40
4
GIL
LO
CA
L G
OV
T01
-1-1
10-0
097,
000
7,00
07,
000
7,00
07,
000
7,00
07,
000
GR
AN
TS
UN
CO
ND
PR
OV
GO
VT
01-1
-110
-012
190,
500
190,
500
190,
500
190,
500
190,
500
190,
500
190,
500
FE
D G
AS
TA
X F
UN
DIN
G01
-1-1
10-0
1368
,000
00
00
068
,000
RE
QN
ELE
CT
/SP
EC
PR
OV
GO
VT
01-1
-110
-015
260,
557
284,
279
329,
062
339,
122
343,
696
351,
297
260,
453
GR
AN
T P
RO
V G
OV
T C
ON
DIT
ION
AL
01-1
-110
-016
159,
362
131,
146
80,0
0080
,000
80,0
0080
,000
116,
315
RE
QN
MU
NIC
IPA
L01
-1-1
10-0
2065
8,33
571
8,27
283
1,42
085
6,84
086
8,39
588
7,60
265
8,44
3
CO
ND
TS
FR
S O
TH
ER
- L
OC
AL
GO
VT
01-1
-110
-022
10,0
000
00
00
10,0
00
INT
ER
ES
T E
AR
NE
D01
-1-1
10-1
2030
,000
50,0
0050
,000
50,0
0050
,000
50,0
0050
,000
OT
HE
R R
EV
EN
UE
01-1
-110
-128
00
00
00
1,57
8
RE
CO
VE
RIE
S-O
TH
ER
FU
NC
TIO
NS
01-1
-110
-135
1,04
3,27
01,
223,
645
1,24
8,11
81,
273,
080
1,29
8,54
21,
324,
513
1,04
3,26
8
SA
LE O
F F
IXE
D A
SS
ET
S01
-1-1
10-1
390
00
00
01,
342
SU
RP
LUS
PR
IOR
YE
AR
01-1
-110
-150
699,
422
410,
573
00
00
805,
390
Tota
l OP
ER
AT
ING
RE
VE
NU
E3,
345,
693
3,25
1,44
63,
145,
415
2,86
6,10
02,
926,
542
2,96
8,13
33,
020,
912
OP
ER
AT
ING
Su
rplu
s/(D
efic
it)
3,34
5,69
33,
251,
446
3,14
5,41
52,
866,
100
2,92
6,54
22,
968,
133
3,02
0,91
2
CA
PIT
AL
Su
rplu
s/(D
efic
it)
00
00
00
0
Cat
ego
ry T
ota
l -->
3,34
5,69
33,
251,
446
3,14
5,41
52,
866,
100
2,92
6,54
22,
968,
133
3,02
0,91
2
251
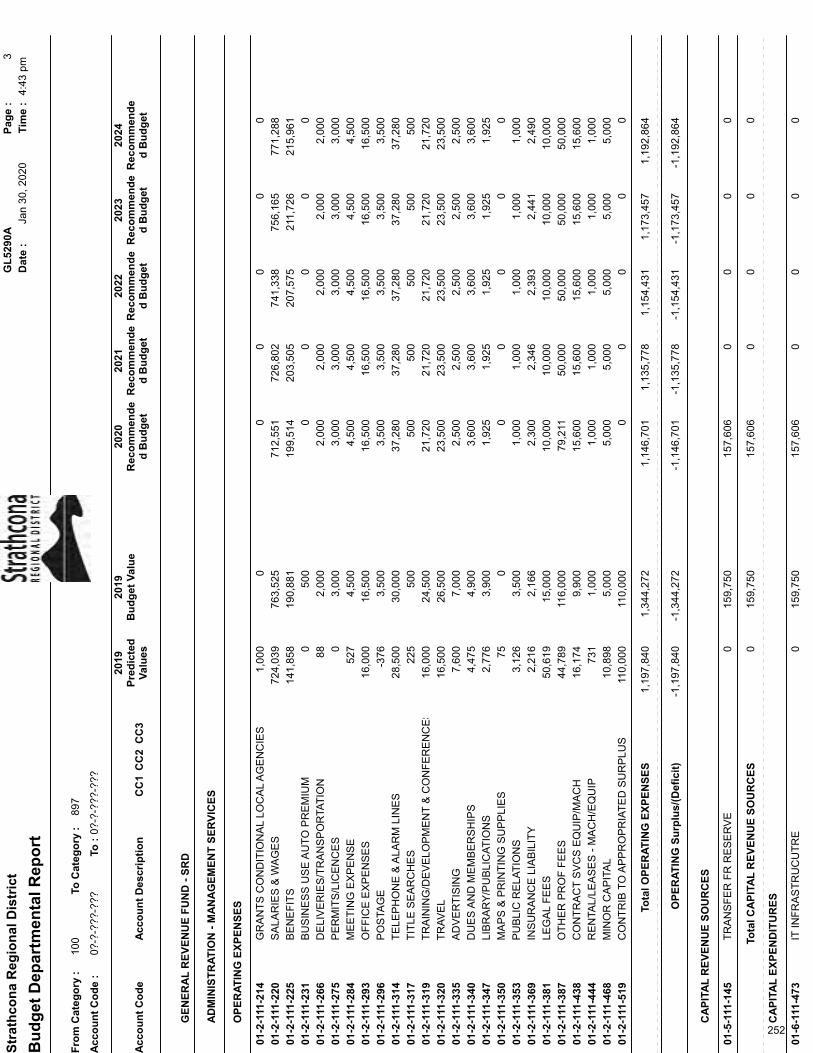
Str
ath
con
a R
egio
nal
Dis
tric
tG
L52
90A
Pag
e :
3
Dat
e :
Jan
30, 2
020
Tim
e :
4:43
pm
Bu
dg
et D
epar
tmen
tal R
epo
rt
Fro
m C
ateg
ory
:10
0To
Cat
ego
ry :
897
Acc
ou
nt
Co
de
:0?
-?-?
??-?
??To
:0?
-?-?
??-?
??
2019
2019
2020
2021
2022
2023
2024
Pre
dic
ted
Val
ues
Bu
dg
et V
alu
eR
eco
mm
end
ed
Bu
dg
etR
eco
mm
end
ed
Bu
dg
etR
eco
mm
end
ed
Bu
dg
etR
eco
mm
end
ed
Bu
dg
etR
eco
mm
end
ed
Bu
dg
etA
cco
un
t C
od
eA
cco
un
t D
escr
ipti
on
CC
1C
C2
CC
3
GE
NE
RA
L R
EV
EN
UE
FU
ND
- S
RD
AD
MIN
IST
RA
TIO
N -
MA
NA
GE
ME
NT
SE
RV
ICE
S
OP
ER
AT
ING
EX
PE
NS
ES
GR
AN
TS
CO
ND
ITIO
NA
L LO
CA
L A
GE
NC
IES
01-2
-111
-214
00
00
00
1,00
0
SA
LAR
IES
& W
AG
ES
01-2
-111
-220
763,
525
712,
551
726,
802
741,
338
756,
165
771,
288
724,
039
BE
NE
FIT
S01
-2-1
11-2
2519
0,88
119
9,51
420
3,50
520
7,57
521
1,72
621
5,96
114
1,85
8
BU
SIN
ES
S U
SE
AU
TO
PR
EM
IUM
01-2
-111
-231
500
00
00
00
DE
LIV
ER
IES
/TR
AN
SP
OR
TAT
ION
01-2
-111
-266
2,00
02,
000
2,00
02,
000
2,00
02,
000
88
PE
RM
ITS
/LIC
EN
CE
S01
-2-1
11-2
753,
000
3,00
03,
000
3,00
03,
000
3,00
00
ME
ET
ING
EX
PE
NS
E01
-2-1
11-2
844,
500
4,50
04,
500
4,50
04,
500
4,50
052
7
OF
FIC
E E
XP
EN
SE
S01
-2-1
11-2
9316
,500
16,5
0016
,500
16,5
0016
,500
16,5
0016
,000
PO
STA
GE
01-2
-111
-296
3,50
03,
500
3,50
03,
500
3,50
03,
500
-376
TE
LEP
HO
NE
& A
LAR
M L
INE
S01
-2-1
11-3
1430
,000
37,2
8037
,280
37,2
8037
,280
37,2
8028
,500
TIT
LE S
EA
RC
HE
S01
-2-1
11-3
1750
050
050
050
050
050
022
5
TR
AIN
ING
/DE
VE
LOP
ME
NT
& C
ON
FE
RE
NC
ES
01-2
-111
-319
24,5
0021
,720
21,7
2021
,720
21,7
2021
,720
16,0
00
TR
AV
EL
01-2
-111
-320
26,5
0023
,500
23,5
0023
,500
23,5
0023
,500
16,5
00
AD
VE
RT
ISIN
G01
-2-1
11-3
357,
000
2,50
02,
500
2,50
02,
500
2,50
07,
600
DU
ES
AN
D M
EM
BE
RS
HIP
S01
-2-1
11-3
404,
900
3,60
03,
600
3,60
03,
600
3,60
04,
475
LIB
RA
RY
/PU
BLI
CA
TIO
NS
01-2
-111
-347
3,90
01,
925
1,92
51,
925
1,92
51,
925
2,77
6
MA
PS
& P
RIN
TIN
G S
UP
PLI
ES
01-2
-111
-350
00
00
00
75
PU
BLI
C R
ELA
TIO
NS
01-2
-111
-353
3,50
01,
000
1,00
01,
000
1,00
01,
000
3,12
6
INS
UR
AN
CE
LIA
BIL
ITY
01-2
-111
-369
2,16
62,
300
2,34
62,
393
2,44
12,
490
2,21
6
LEG
AL
FE
ES
01-2
-111
-381
15,0
0010
,000
10,0
0010
,000
10,0
0010
,000
50,6
19
OT
HE
R P
RO
F F
EE
S01
-2-1
11-3
8711
6,00
079
,211
50,0
0050
,000
50,0
0050
,000
44,7
89
CO
NT
RA
CT
SV
CS
EQ
UIP
/MA
CH
01-2
-111
-438
9,90
015
,600
15,6
0015
,600
15,6
0015
,600
16,1
74
RE
NTA
L/LE
AS
ES
- M
AC
H/E
QU
IP01
-2-1
11-4
441,
000
1,00
01,
000
1,00
01,
000
1,00
073
1
MIN
OR
CA
PIT
AL
01-2
-111
-468
5,00
05,
000
5,00
05,
000
5,00
05,
000
10,8
98
CO
NT
RIB
TO
AP
PR
OP
RIA
TE
D S
UR
PLU
S01
-2-1
11-5
1911
0,00
00
00
00
110,
000
Tota
l O
PE
RA
TIN
G E
XP
EN
SE
S1,
197,
840
1,34
4,27
21,
146,
701
1,13
5,77
81,
154,
431
1,17
3,45
71,
192,
864
OP
ER
AT
ING
Su
rplu
s/(D
efic
it)
-1,1
97,8
40-1
,344
,272
-1,1
46,7
01-1
,135
,778
-1,1
54,4
31-1
,173
,457
-1,1
92,8
64
CA
PIT
AL
RE
VE
NU
E S
OU
RC
ES
TR
AN
SF
ER
FR
RE
SE
RV
E01
-5-1
11-1
4515
9,75
015
7,60
60
00
00
Tota
l CA
PIT
AL
RE
VE
NU
E S
OU
RC
ES
015
9,75
015
7,60
60
00
0
CA
PIT
AL
EX
PE
ND
ITU
RE
S
IT IN
FR
AS
TR
UC
UT
RE
01-6
-111
-473
159,
750
157,
606
00
00
0
252

Str
ath
con
a R
egio
nal
Dis
tric
tG
L52
90A
Pag
e :
4
Dat
e :
Jan
30, 2
020
Tim
e :
4:43
pm
Bu
dg
et D
epar
tmen
tal R
epo
rt
Fro
m C
ateg
ory
:10
0To
Cat
ego
ry :
897
Acc
ou
nt
Co
de
:0?
-?-?
??-?
??To
:0?
-?-?
??-?
??
2019
2019
2020
2021
2022
2023
2024
Pre
dic
ted
Val
ues
Bu
dg
et V
alu
eR
eco
mm
end
ed
Bu
dg
etR
eco
mm
end
ed
Bu
dg
etR
eco
mm
end
ed
Bu
dg
etR
eco
mm
end
ed
Bu
dg
etR
eco
mm
end
ed
Bu
dg
etA
cco
un
t C
od
eA
cco
un
t D
escr
ipti
on
CC
1C
C2
CC
3
Tota
l CA
PIT
AL
EX
PE
ND
ITU
RE
S0
159,
750
157,
606
00
00
CA
PIT
AL
Su
rplu
s/(D
efic
it)
00
00
00
0
Cat
ego
ry T
ota
l -->
-1,1
97,8
40-1
,344
,272
-1,1
46,7
01-1
,135
,778
-1,1
54,4
31-1
,173
,457
-1,1
92,8
64
253
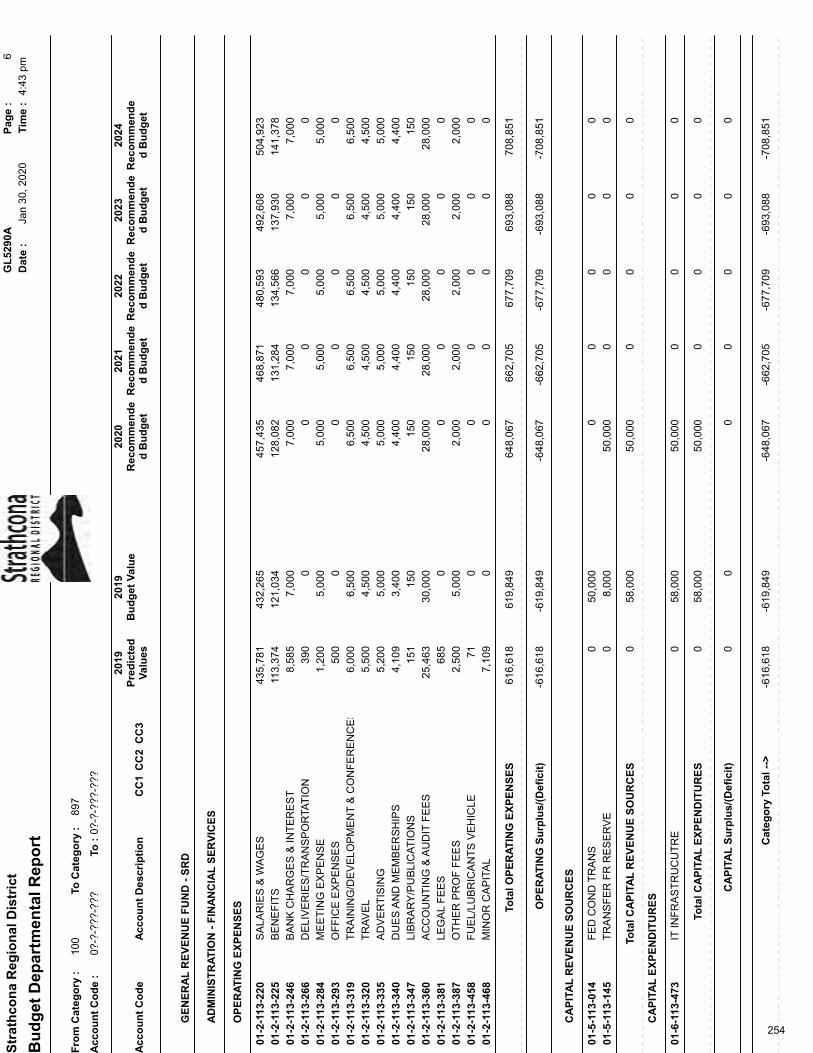
Str
ath
con
a R
egio
nal
Dis
tric
tG
L52
90A
Pag
e :
6
Dat
e :
Jan
30, 2
020
Tim
e :
4:43
pm
Bu
dg
et D
epar
tmen
tal R
epo
rt
Fro
m C
ateg
ory
:10
0To
Cat
ego
ry :
897
Acc
ou
nt
Co
de
:0?
-?-?
??-?
??To
:0?
-?-?
??-?
??
2019
2019
2020
2021
2022
2023
2024
Pre
dic
ted
Val
ues
Bu
dg
et V
alu
eR
eco
mm
end
ed
Bu
dg
etR
eco
mm
end
ed
Bu
dg
etR
eco
mm
end
ed
Bu
dg
etR
eco
mm
end
ed
Bu
dg
etR
eco
mm
end
ed
Bu
dg
etA
cco
un
t C
od
eA
cco
un
t D
escr
ipti
on
CC
1C
C2
CC
3
GE
NE
RA
L R
EV
EN
UE
FU
ND
- S
RD
AD
MIN
IST
RA
TIO
N -
FIN
AN
CIA
L S
ER
VIC
ES
OP
ER
AT
ING
EX
PE
NS
ES
SA
LAR
IES
& W
AG
ES
01-2
-113
-220
432,
265
457,
435
468,
871
480,
593
492,
608
504,
923
435,
781
BE
NE
FIT
S01
-2-1
13-2
2512
1,03
412
8,08
213
1,28
413
4,56
613
7,93
014
1,37
811
3,37
4
BA
NK
CH
AR
GE
S &
INT
ER
ES
T01
-2-1
13-2
467,
000
7,00
07,
000
7,00
07,
000
7,00
08,
585
DE
LIV
ER
IES
/TR
AN
SP
OR
TAT
ION
01-2
-113
-266
00
00
00
390
ME
ET
ING
EX
PE
NS
E01
-2-1
13-2
845,
000
5,00
05,
000
5,00
05,
000
5,00
01,
200
OF
FIC
E E
XP
EN
SE
S01
-2-1
13-2
930
00
00
050
0
TR
AIN
ING
/DE
VE
LOP
ME
NT
& C
ON
FE
RE
NC
ES
01-2
-113
-319
6,50
06,
500
6,50
06,
500
6,50
06,
500
6,00
0
TR
AV
EL
01-2
-113
-320
4,50
04,
500
4,50
04,
500
4,50
04,
500
5,50
0
AD
VE
RT
ISIN
G01
-2-1
13-3
355,
000
5,00
05,
000
5,00
05,
000
5,00
05,
200
DU
ES
AN
D M
EM
BE
RS
HIP
S01
-2-1
13-3
403,
400
4,40
04,
400
4,40
04,
400
4,40
04,
109
LIB
RA
RY
/PU
BLI
CA
TIO
NS
01-2
-113
-347
150
150
150
150
150
150
151
AC
CO
UN
TIN
G &
AU
DIT
FE
ES
01-2
-113
-360
30,0
0028
,000
28,0
0028
,000
28,0
0028
,000
25,4
63
LEG
AL
FE
ES
01-2
-113
-381
00
00
00
685
OT
HE
R P
RO
F F
EE
S01
-2-1
13-3
875,
000
2,00
02,
000
2,00
02,
000
2,00
02,
500
FU
EL/
LUB
RIC
AN
TS
VE
HIC
LE01
-2-1
13-4
580
00
00
071
MIN
OR
CA
PIT
AL
01-2
-113
-468
00
00
00
7,10
9
Tota
l O
PE
RA
TIN
G E
XP
EN
SE
S61
6,61
861
9,84
964
8,06
766
2,70
567
7,70
969
3,08
870
8,85
1
OP
ER
AT
ING
Su
rplu
s/(D
efic
it)
-616
,618
-619
,849
-648
,067
-662
,705
-677
,709
-693
,088
-708
,851
CA
PIT
AL
RE
VE
NU
E S
OU
RC
ES
FE
D C
ON
D T
RA
NS
01-5
-113
-014
50,0
000
00
00
0
TR
AN
SF
ER
FR
RE
SE
RV
E01
-5-1
13-1
458,
000
50,0
000
00
00
Tota
l CA
PIT
AL
RE
VE
NU
E S
OU
RC
ES
058
,000
50,0
000
00
0
CA
PIT
AL
EX
PE
ND
ITU
RE
S
IT IN
FR
AS
TR
UC
UT
RE
01-6
-113
-473
58,0
0050
,000
00
00
0
Tota
l CA
PIT
AL
EX
PE
ND
ITU
RE
S0
58,0
0050
,000
00
00
CA
PIT
AL
Su
rplu
s/(D
efic
it)
00
00
00
0
Cat
ego
ry T
ota
l -->
-616
,618
-619
,849
-648
,067
-662
,705
-677
,709
-693
,088
-708
,851
254
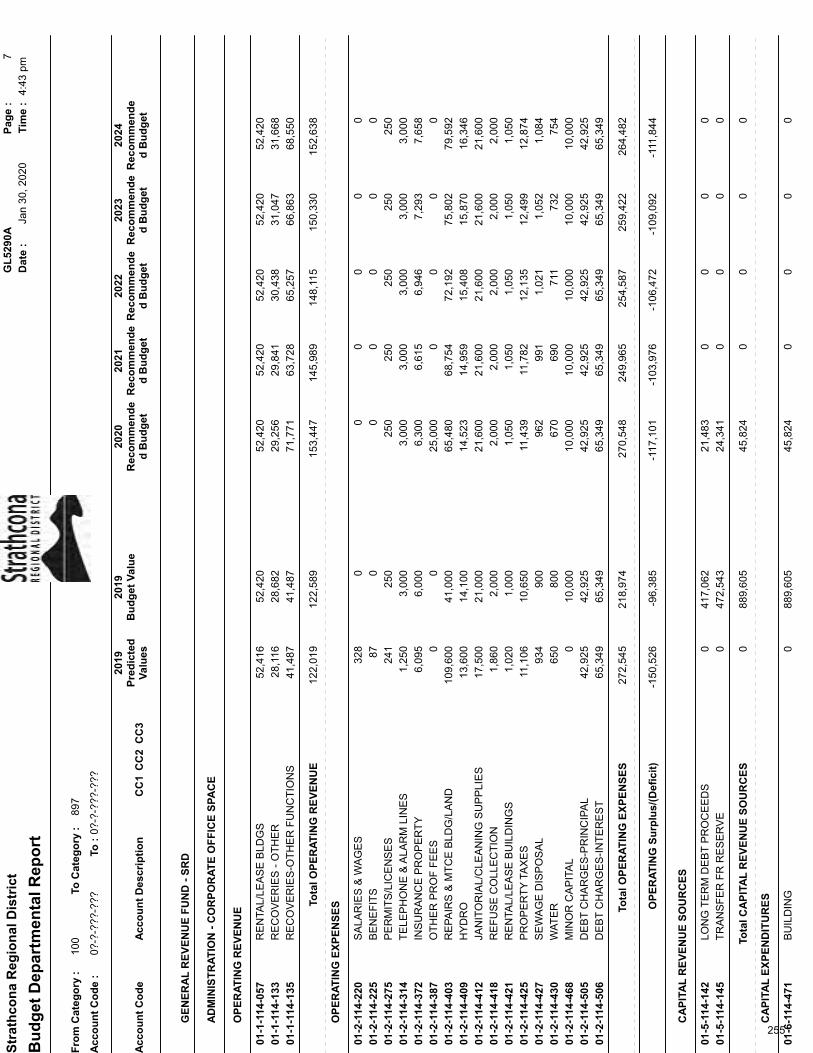
Str
ath
con
a R
egio
nal
Dis
tric
tG
L52
90A
Pag
e :
7
Dat
e :
Jan
30, 2
020
Tim
e :
4:43
pm
Bu
dg
et D
epar
tmen
tal R
epo
rt
Fro
m C
ateg
ory
:10
0To
Cat
ego
ry :
897
Acc
ou
nt
Co
de
:0?
-?-?
??-?
??To
:0?
-?-?
??-?
??
2019
2019
2020
2021
2022
2023
2024
Pre
dic
ted
Val
ues
Bu
dg
et V
alu
eR
eco
mm
end
ed
Bu
dg
etR
eco
mm
end
ed
Bu
dg
etR
eco
mm
end
ed
Bu
dg
etR
eco
mm
end
ed
Bu
dg
etR
eco
mm
end
ed
Bu
dg
etA
cco
un
t C
od
eA
cco
un
t D
escr
ipti
on
CC
1C
C2
CC
3
GE
NE
RA
L R
EV
EN
UE
FU
ND
- S
RD
AD
MIN
IST
RA
TIO
N -
CO
RP
OR
AT
E O
FF
ICE
SP
AC
E
OP
ER
AT
ING
RE
VE
NU
E
RE
NTA
L/LE
AS
E B
LDG
S01
-1-1
14-0
5752
,420
52,4
2052
,420
52,4
2052
,420
52,4
2052
,416
RE
CO
VE
RIE
S -
OT
HE
R01
-1-1
14-1
3328
,682
29,2
5629
,841
30,4
3831
,047
31,6
6828
,116
RE
CO
VE
RIE
S-O
TH
ER
FU
NC
TIO
NS
01-1
-114
-135
41,4
8771
,771
63,7
2865
,257
66,8
6368
,550
41,4
87
Tota
l OP
ER
AT
ING
RE
VE
NU
E12
2,01
912
2,58
915
3,44
714
5,98
914
8,11
515
0,33
015
2,63
8
OP
ER
AT
ING
EX
PE
NS
ES
SA
LAR
IES
& W
AG
ES
01-2
-114
-220
00
00
00
328
BE
NE
FIT
S01
-2-1
14-2
250
00
00
087
PE
RM
ITS
/LIC
EN
SE
S01
-2-1
14-2
7525
025
025
025
025
025
024
1
TE
LEP
HO
NE
& A
LAR
M L
INE
S01
-2-1
14-3
143,
000
3,00
03,
000
3,00
03,
000
3,00
01,
250
INS
UR
AN
CE
PR
OP
ER
TY
01-2
-114
-372
6,00
06,
300
6,61
56,
946
7,29
37,
658
6,09
5
OT
HE
R P
RO
F F
EE
S01
-2-1
14-3
870
25,0
000
00
00
RE
PA
IRS
& M
TC
E B
LDG
/LA
ND
01-2
-114
-403
41,0
0065
,480
68,7
5472
,192
75,8
0279
,592
109,
600
HY
DR
O01
-2-1
14-4
0914
,100
14,5
2314
,959
15,4
0815
,870
16,3
4613
,600
JAN
ITO
RIA
L/C
LEA
NIN
G S
UP
PLI
ES
01-2
-114
-412
21,0
0021
,600
21,6
0021
,600
21,6
0021
,600
17,5
00
RE
FU
SE
CO
LLE
CT
ION
01-2
-114
-418
2,00
02,
000
2,00
02,
000
2,00
02,
000
1,86
0
RE
NTA
L/LE
AS
E B
UIL
DIN
GS
01-2
-114
-421
1,00
01,
050
1,05
01,
050
1,05
01,
050
1,02
0
PR
OP
ER
TY
TA
XE
S01
-2-1
14-4
2510
,650
11,4
3911
,782
12,1
3512
,499
12,8
7411
,106
SE
WA
GE
DIS
PO
SA
L01
-2-1
14-4
2790
096
299
11,
021
1,05
21,
084
934
WA
TE
R01
-2-1
14-4
3080
067
069
071
173
275
465
0
MIN
OR
CA
PIT
AL
01-2
-114
-468
10,0
0010
,000
10,0
0010
,000
10,0
0010
,000
0
DE
BT
CH
AR
GE
S-P
RIN
CIP
AL
01-2
-114
-505
42,9
2542
,925
42,9
2542
,925
42,9
2542
,925
42,9
25
DE
BT
CH
AR
GE
S-I
NT
ER
ES
T01
-2-1
14-5
0665
,349
65,3
4965
,349
65,3
4965
,349
65,3
4965
,349
Tota
l O
PE
RA
TIN
G E
XP
EN
SE
S27
2,54
521
8,97
427
0,54
824
9,96
525
4,58
725
9,42
226
4,48
2
OP
ER
AT
ING
Su
rplu
s/(D
efic
it)
-150
,526
-96,
385
-117
,101
-103
,976
-106
,472
-109
,092
-111
,844
CA
PIT
AL
RE
VE
NU
E S
OU
RC
ES
LON
G T
ER
M D
EB
T P
RO
CE
ED
S01
-5-1
14-1
4241
7,06
221
,483
00
00
0
TR
AN
SF
ER
FR
RE
SE
RV
E01
-5-1
14-1
4547
2,54
324
,341
00
00
0
Tota
l CA
PIT
AL
RE
VE
NU
E S
OU
RC
ES
088
9,60
545
,824
00
00
CA
PIT
AL
EX
PE
ND
ITU
RE
S
BU
ILD
ING
01-6
-114
-471
889,
605
45,8
240
00
00
255

Str
ath
con
a R
egio
nal
Dis
tric
tG
L52
90A
Pag
e :
8
Dat
e :
Jan
30, 2
020
Tim
e :
4:43
pm
Bu
dg
et D
epar
tmen
tal R
epo
rt
Fro
m C
ateg
ory
:10
0To
Cat
ego
ry :
897
Acc
ou
nt
Co
de
:0?
-?-?
??-?
??To
:0?
-?-?
??-?
??
2019
2019
2020
2021
2022
2023
2024
Pre
dic
ted
Val
ues
Bu
dg
et V
alu
eR
eco
mm
end
ed
Bu
dg
etR
eco
mm
end
ed
Bu
dg
etR
eco
mm
end
ed
Bu
dg
etR
eco
mm
end
ed
Bu
dg
etR
eco
mm
end
ed
Bu
dg
etA
cco
un
t C
od
eA
cco
un
t D
escr
ipti
on
CC
1C
C2
CC
3
Tota
l CA
PIT
AL
EX
PE
ND
ITU
RE
S0
889,
605
45,8
240
00
0
CA
PIT
AL
Su
rplu
s/(D
efic
it)
00
00
00
0
Cat
ego
ry T
ota
l -->
-150
,526
-96,
385
-117
,101
-103
,976
-106
,472
-109
,092
-111
,844
256

Str
ath
con
a R
egio
nal
Dis
tric
tG
L52
90A
Pag
e :
9
Dat
e :
Jan
30, 2
020
Tim
e :
4:43
pm
Bu
dg
et D
epar
tmen
tal R
epo
rt
Fro
m C
ateg
ory
:10
0To
Cat
ego
ry :
897
Acc
ou
nt
Co
de
:0?
-?-?
??-?
??To
:0?
-?-?
??-?
??
2019
2019
2020
2021
2022
2023
2024
Pre
dic
ted
Val
ues
Bu
dg
et V
alu
eR
eco
mm
end
ed
Bu
dg
etR
eco
mm
end
ed
Bu
dg
etR
eco
mm
end
ed
Bu
dg
etR
eco
mm
end
ed
Bu
dg
etR
eco
mm
end
ed
Bu
dg
etA
cco
un
t C
od
eA
cco
un
t D
escr
ipti
on
CC
1C
C2
CC
3
GE
NE
RA
L R
EV
EN
UE
FU
ND
- S
RD
AD
MIN
IST
RA
TIO
N -
HU
MA
N R
ES
OU
RC
ES
OP
ER
AT
ING
EX
PE
NS
ES
SA
LAR
IES
& W
AG
ES
01-2
-115
-220
011
3,68
911
5,96
311
8,28
212
0,64
812
3,06
10
BE
NE
FIT
S01
-2-1
15-2
250
31,8
3332
,470
33,1
1933
,781
34,4
570
ME
ET
ING
EX
PE
NS
E01
-2-1
15-2
840
500
500
500
500
500
0
TR
AIN
ING
/DE
VE
LOP
ME
NT
& C
ON
FE
RE
NC
ES
01-2
-115
-319
03,
000
3,00
03,
000
3,00
03,
000
0
TR
AV
EL
01-2
-115
-320
03,
000
3,00
03,
000
3,00
03,
000
0
AD
VE
RT
ISIN
G01
-2-1
15-3
350
3,00
03,
000
3,00
03,
000
3,00
00
DU
ES
AN
D M
EM
BE
RS
HIP
S01
-2-1
15-3
400
1,60
01,
600
1,60
01,
600
1,60
00
LIB
RA
RY
/PU
BLI
CA
TIO
NS
01-2
-115
-347
050
050
050
050
050
00
PU
BLI
C R
ELA
TIO
NS
01-2
-115
-353
02,
500
2,50
02,
500
2,50
02,
500
0
LEG
AL
FE
ES
01-2
-115
-381
05,
000
5,00
05,
000
5,00
05,
000
0
OT
HE
R P
RO
F F
EE
S01
-2-1
15-3
870
61,0
0044
,000
54,0
0044
,000
44,0
000
MIN
OR
CA
PIT
AL
01-2
-115
-468
02,
000
00
00
0
Tota
l O
PE
RA
TIN
G E
XP
EN
SE
S0
022
7,62
221
1,53
322
4,50
121
7,52
922
0,61
8
OP
ER
AT
ING
Su
rplu
s/(D
efic
it)
00
-227
,622
-211
,533
-224
,501
-217
,529
-220
,618
Cat
ego
ry T
ota
l -->
00
-227
,622
-211
,533
-224
,501
-217
,529
-220
,618
257
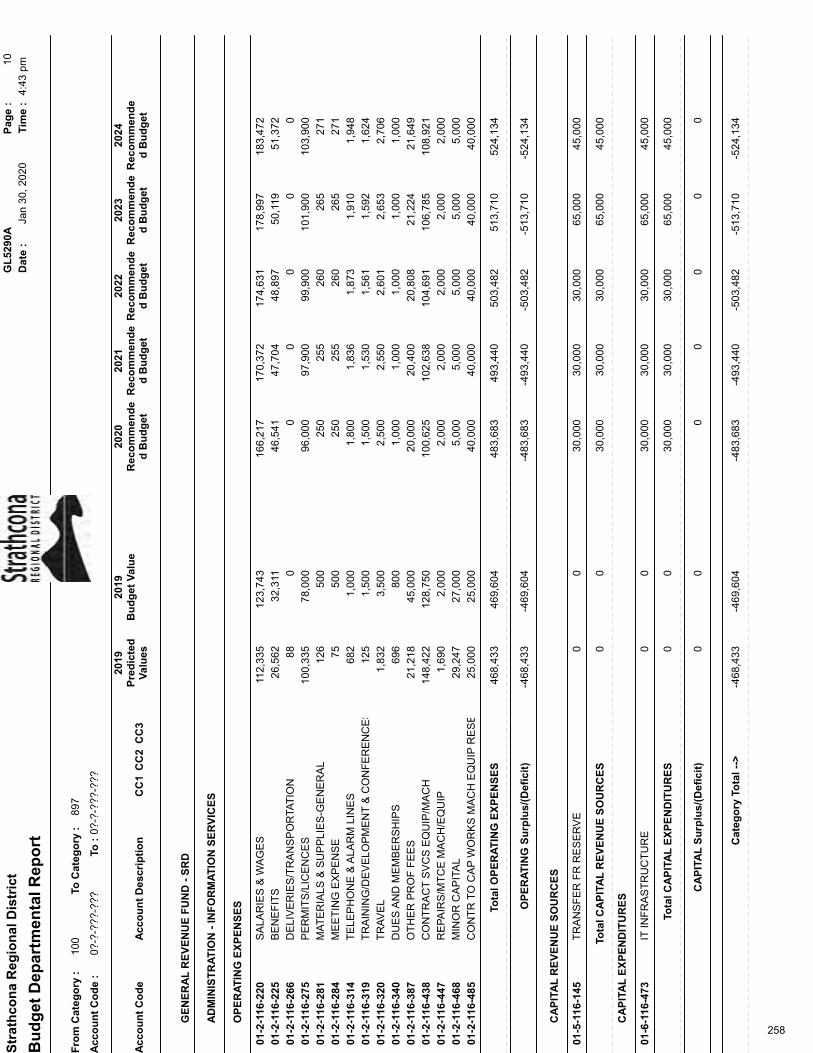
Str
ath
con
a R
egio
nal
Dis
tric
tG
L52
90A
Pag
e :
10
Dat
e :
Jan
30, 2
020
Tim
e :
4:43
pm
Bu
dg
et D
epar
tmen
tal R
epo
rt
Fro
m C
ateg
ory
:10
0To
Cat
ego
ry :
897
Acc
ou
nt
Co
de
:0?
-?-?
??-?
??To
:0?
-?-?
??-?
??
2019
2019
2020
2021
2022
2023
2024
Pre
dic
ted
Val
ues
Bu
dg
et V
alu
eR
eco
mm
end
ed
Bu
dg
etR
eco
mm
end
ed
Bu
dg
etR
eco
mm
end
ed
Bu
dg
etR
eco
mm
end
ed
Bu
dg
etR
eco
mm
end
ed
Bu
dg
etA
cco
un
t C
od
eA
cco
un
t D
escr
ipti
on
CC
1C
C2
CC
3
GE
NE
RA
L R
EV
EN
UE
FU
ND
- S
RD
AD
MIN
IST
RA
TIO
N -
INF
OR
MA
TIO
N S
ER
VIC
ES
OP
ER
AT
ING
EX
PE
NS
ES
SA
LAR
IES
& W
AG
ES
01-2
-116
-220
123,
743
166,
217
170,
372
174,
631
178,
997
183,
472
112,
335
BE
NE
FIT
S01
-2-1
16-2
2532
,311
46,5
4147
,704
48,8
9750
,119
51,3
7226
,562
DE
LIV
ER
IES
/TR
AN
SP
OR
TAT
ION
01-2
-116
-266
00
00
00
88
PE
RM
ITS
/LIC
EN
CE
S01
-2-1
16-2
7578
,000
96,0
0097
,900
99,9
0010
1,90
010
3,90
010
0,33
5
MA
TE
RIA
LS &
SU
PP
LIE
S-G
EN
ER
AL
01-2
-116
-281
500
250
255
260
265
271
126
ME
ET
ING
EX
PE
NS
E01
-2-1
16-2
8450
025
025
526
026
527
175
TE
LEP
HO
NE
& A
LAR
M L
INE
S01
-2-1
16-3
141,
000
1,80
01,
836
1,87
31,
910
1,94
868
2
TR
AIN
ING
/DE
VE
LOP
ME
NT
& C
ON
FE
RE
NC
ES
01-2
-116
-319
1,50
01,
500
1,53
01,
561
1,59
21,
624
125
TR
AV
EL
01-2
-116
-320
3,50
02,
500
2,55
02,
601
2,65
32,
706
1,83
2
DU
ES
AN
D M
EM
BE
RS
HIP
S01
-2-1
16-3
4080
01,
000
1,00
01,
000
1,00
01,
000
696
OT
HE
R P
RO
F F
EE
S01
-2-1
16-3
8745
,000
20,0
0020
,400
20,8
0821
,224
21,6
4921
,218
CO
NT
RA
CT
SV
CS
EQ
UIP
/MA
CH
01-2
-116
-438
128,
750
100,
625
102,
638
104,
691
106,
785
108,
921
148,
422
RE
PA
IRS
/MT
CE
MA
CH
/EQ
UIP
01-2
-116
-447
2,00
02,
000
2,00
02,
000
2,00
02,
000
1,69
0
MIN
OR
CA
PIT
AL
01-2
-116
-468
27,0
005,
000
5,00
05,
000
5,00
05,
000
29,2
47
CO
NT
R T
O C
AP
WO
RK
S M
AC
H E
QU
IP R
ES
ER
VE
01-2
-116
-485
25,0
0040
,000
40,0
0040
,000
40,0
0040
,000
25,0
00
Tota
l O
PE
RA
TIN
G E
XP
EN
SE
S46
8,43
346
9,60
448
3,68
349
3,44
050
3,48
251
3,71
052
4,13
4
OP
ER
AT
ING
Su
rplu
s/(D
efic
it)
-468
,433
-469
,604
-483
,683
-493
,440
-503
,482
-513
,710
-524
,134
CA
PIT
AL
RE
VE
NU
E S
OU
RC
ES
TR
AN
SF
ER
FR
RE
SE
RV
E01
-5-1
16-1
450
30,0
0030
,000
30,0
0065
,000
45,0
000
Tota
l CA
PIT
AL
RE
VE
NU
E S
OU
RC
ES
00
30,0
0030
,000
30,0
0065
,000
45,0
00
CA
PIT
AL
EX
PE
ND
ITU
RE
S
IT IN
FR
AS
TR
UC
TU
RE
01-6
-116
-473
030
,000
30,0
0030
,000
65,0
0045
,000
0
Tota
l CA
PIT
AL
EX
PE
ND
ITU
RE
S0
030
,000
30,0
0030
,000
65,0
0045
,000
CA
PIT
AL
Su
rplu
s/(D
efic
it)
00
00
00
0
Cat
ego
ry T
ota
l -->
-468
,433
-469
,604
-483
,683
-493
,440
-503
,482
-513
,710
-524
,134
258
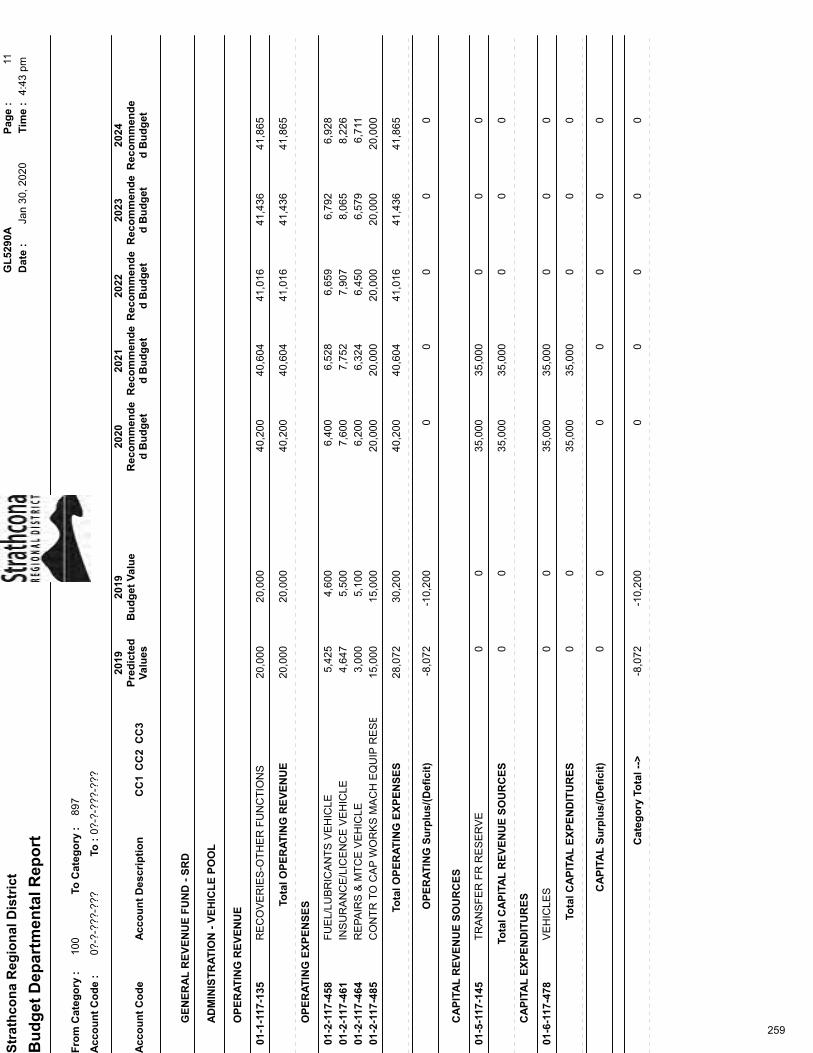
Str
ath
con
a R
egio
nal
Dis
tric
tG
L52
90A
Pag
e :
11
Dat
e :
Jan
30, 2
020
Tim
e :
4:43
pm
Bu
dg
et D
epar
tmen
tal R
epo
rt
Fro
m C
ateg
ory
:10
0To
Cat
ego
ry :
897
Acc
ou
nt
Co
de
:0?
-?-?
??-?
??To
:0?
-?-?
??-?
??
2019
2019
2020
2021
2022
2023
2024
Pre
dic
ted
Val
ues
Bu
dg
et V
alu
eR
eco
mm
end
ed
Bu
dg
etR
eco
mm
end
ed
Bu
dg
etR
eco
mm
end
ed
Bu
dg
etR
eco
mm
end
ed
Bu
dg
etR
eco
mm
end
ed
Bu
dg
etA
cco
un
t C
od
eA
cco
un
t D
escr
ipti
on
CC
1C
C2
CC
3
GE
NE
RA
L R
EV
EN
UE
FU
ND
- S
RD
AD
MIN
IST
RA
TIO
N -
VE
HIC
LE
PO
OL
OP
ER
AT
ING
RE
VE
NU
E
RE
CO
VE
RIE
S-O
TH
ER
FU
NC
TIO
NS
01-1
-117
-135
20,0
0040
,200
40,6
0441
,016
41,4
3641
,865
20,0
00
Tota
l OP
ER
AT
ING
RE
VE
NU
E20
,000
20,0
0040
,200
40,6
0441
,016
41,4
3641
,865
OP
ER
AT
ING
EX
PE
NS
ES
FU
EL/
LUB
RIC
AN
TS
VE
HIC
LE01
-2-1
17-4
584,
600
6,40
06,
528
6,65
96,
792
6,92
85,
425
INS
UR
AN
CE
/LIC
EN
CE
VE
HIC
LE01
-2-1
17-4
615,
500
7,60
07,
752
7,90
78,
065
8,22
64,
647
RE
PA
IRS
& M
TC
E V
EH
ICLE
01-2
-117
-464
5,10
06,
200
6,32
46,
450
6,57
96,
711
3,00
0
CO
NT
R T
O C
AP
WO
RK
S M
AC
H E
QU
IP R
ES
ER
VE
01-2
-117
-485
15,0
0020
,000
20,0
0020
,000
20,0
0020
,000
15,0
00
Tota
l O
PE
RA
TIN
G E
XP
EN
SE
S28
,072
30,2
0040
,200
40,6
0441
,016
41,4
3641
,865
OP
ER
AT
ING
Su
rplu
s/(D
efic
it)
-8,0
72-1
0,20
00
00
00
CA
PIT
AL
RE
VE
NU
E S
OU
RC
ES
TR
AN
SF
ER
FR
RE
SE
RV
E01
-5-1
17-1
450
35,0
0035
,000
00
00
Tota
l CA
PIT
AL
RE
VE
NU
E S
OU
RC
ES
00
35,0
0035
,000
00
0
CA
PIT
AL
EX
PE
ND
ITU
RE
S
VE
HIC
LES
01-6
-117
-478
035
,000
35,0
000
00
0
Tota
l CA
PIT
AL
EX
PE
ND
ITU
RE
S0
035
,000
35,0
000
00
CA
PIT
AL
Su
rplu
s/(D
efic
it)
00
00
00
0
Cat
ego
ry T
ota
l -->
-8,0
72-1
0,20
00
00
00
259
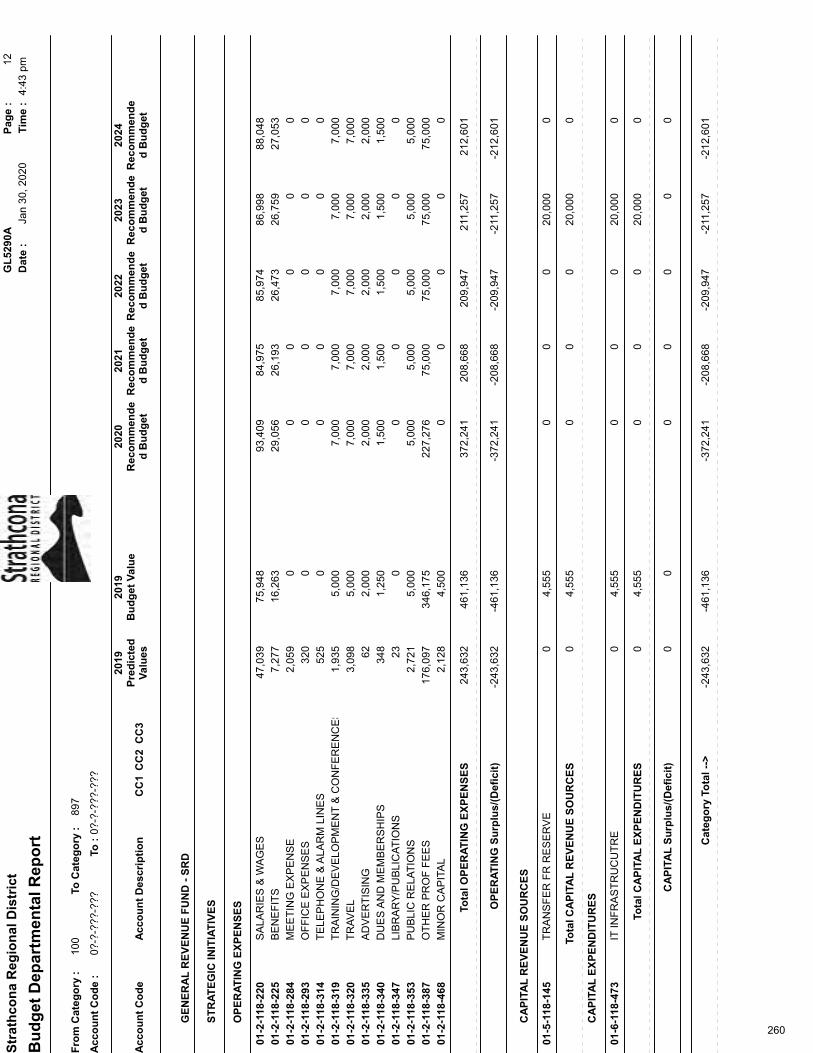
Str
ath
con
a R
egio
nal
Dis
tric
tG
L52
90A
Pag
e :
12
Dat
e :
Jan
30, 2
020
Tim
e :
4:43
pm
Bu
dg
et D
epar
tmen
tal R
epo
rt
Fro
m C
ateg
ory
:10
0To
Cat
ego
ry :
897
Acc
ou
nt
Co
de
:0?
-?-?
??-?
??To
:0?
-?-?
??-?
??
2019
2019
2020
2021
2022
2023
2024
Pre
dic
ted
Val
ues
Bu
dg
et V
alu
eR
eco
mm
end
ed
Bu
dg
etR
eco
mm
end
ed
Bu
dg
etR
eco
mm
end
ed
Bu
dg
etR
eco
mm
end
ed
Bu
dg
etR
eco
mm
end
ed
Bu
dg
etA
cco
un
t C
od
eA
cco
un
t D
escr
ipti
on
CC
1C
C2
CC
3
GE
NE
RA
L R
EV
EN
UE
FU
ND
- S
RD
ST
RA
TE
GIC
INIT
IAT
IVE
S
OP
ER
AT
ING
EX
PE
NS
ES
SA
LAR
IES
& W
AG
ES
01-2
-118
-220
75,9
4893
,409
84,9
7585
,974
86,9
9888
,048
47,0
39
BE
NE
FIT
S01
-2-1
18-2
2516
,263
29,0
5626
,193
26,4
7326
,759
27,0
537,
277
ME
ET
ING
EX
PE
NS
E01
-2-1
18-2
840
00
00
02,
059
OF
FIC
E E
XP
EN
SE
S01
-2-1
18-2
930
00
00
032
0
TE
LEP
HO
NE
& A
LAR
M L
INE
S01
-2-1
18-3
140
00
00
052
5
TR
AIN
ING
/DE
VE
LOP
ME
NT
& C
ON
FE
RE
NC
ES
01-2
-118
-319
5,00
07,
000
7,00
07,
000
7,00
07,
000
1,93
5
TR
AV
EL
01-2
-118
-320
5,00
07,
000
7,00
07,
000
7,00
07,
000
3,09
8
AD
VE
RT
ISIN
G01
-2-1
18-3
352,
000
2,00
02,
000
2,00
02,
000
2,00
062
DU
ES
AN
D M
EM
BE
RS
HIP
S01
-2-1
18-3
401,
250
1,50
01,
500
1,50
01,
500
1,50
034
8
LIB
RA
RY
/PU
BLI
CA
TIO
NS
01-2
-118
-347
00
00
00
23
PU
BLI
C R
ELA
TIO
NS
01-2
-118
-353
5,00
05,
000
5,00
05,
000
5,00
05,
000
2,72
1
OT
HE
R P
RO
F F
EE
S01
-2-1
18-3
8734
6,17
522
7,27
675
,000
75,0
0075
,000
75,0
0017
6,09
7
MIN
OR
CA
PIT
AL
01-2
-118
-468
4,50
00
00
00
2,12
8
Tota
l O
PE
RA
TIN
G E
XP
EN
SE
S24
3,63
246
1,13
637
2,24
120
8,66
820
9,94
721
1,25
721
2,60
1
OP
ER
AT
ING
Su
rplu
s/(D
efic
it)
-243
,632
-461
,136
-372
,241
-208
,668
-209
,947
-211
,257
-212
,601
CA
PIT
AL
RE
VE
NU
E S
OU
RC
ES
TR
AN
SF
ER
FR
RE
SE
RV
E01
-5-1
18-1
454,
555
00
020
,000
00
Tota
l CA
PIT
AL
RE
VE
NU
E S
OU
RC
ES
04,
555
00
020
,000
0
CA
PIT
AL
EX
PE
ND
ITU
RE
S
IT IN
FR
AS
TR
UC
UT
RE
01-6
-118
-473
4,55
50
00
20,0
000
0
Tota
l CA
PIT
AL
EX
PE
ND
ITU
RE
S0
4,55
50
00
20,0
000
CA
PIT
AL
Su
rplu
s/(D
efic
it)
00
00
00
0
Cat
ego
ry T
ota
l -->
-243
,632
-461
,136
-372
,241
-208
,668
-209
,947
-211
,257
-212
,601
260

Str
ath
con
a R
egio
nal
Dis
tric
tG
L52
90A
Pag
e :
13
Dat
e :
Jan
30, 2
020
Tim
e :
4:43
pm
Bu
dg
et D
epar
tmen
tal R
epo
rt
Fro
m C
ateg
ory
:10
0To
Cat
ego
ry :
897
Acc
ou
nt
Co
de
:0?
-?-?
??-?
??To
:0?
-?-?
??-?
??
2019
2019
2020
2021
2022
2023
2024
Pre
dic
ted
Val
ues
Bu
dg
et V
alu
eR
eco
mm
end
ed
Bu
dg
etR
eco
mm
end
ed
Bu
dg
etR
eco
mm
end
ed
Bu
dg
etR
eco
mm
end
ed
Bu
dg
etR
eco
mm
end
ed
Bu
dg
etA
cco
un
t C
od
eA
cco
un
t D
escr
ipti
on
CC
1C
C2
CC
3
GE
NE
RA
L R
EV
EN
UE
FU
ND
- S
RD
AD
MIN
IST
RA
TIO
N-F
ISC
AL
SE
RV
ICE
S &
CA
PIT
AL
OP
ER
AT
ING
EX
PE
NS
ES
CO
NT
R T
O C
AP
WO
RK
S M
AC
H E
QU
IP R
ES
ER
VE
01-2
-119
-485
250,
000
150,
000
50,0
0050
,000
50,0
0050
,000
250,
000
Tota
l O
PE
RA
TIN
G E
XP
EN
SE
S25
0,00
025
0,00
015
0,00
050
,000
50,0
0050
,000
50,0
00
OP
ER
AT
ING
Su
rplu
s/(D
efic
it)
-250
,000
-250
,000
-150
,000
-50,
000
-50,
000
-50,
000
-50,
000
Cat
ego
ry T
ota
l -->
-250
,000
-250
,000
-150
,000
-50,
000
-50,
000
-50,
000
-50,
000
261

Str
ath
con
a R
egio
nal
Dis
tric
tG
L52
90A
Pag
e :
14
Dat
e :
Jan
30, 2
020
Tim
e :
4:43
pm
Bu
dg
et D
epar
tmen
tal R
epo
rt
Fro
m C
ateg
ory
:10
0To
Cat
ego
ry :
897
Acc
ou
nt
Co
de
:0?
-?-?
??-?
??To
:0?
-?-?
??-?
??
2019
2019
2020
2021
2022
2023
2024
Pre
dic
ted
Val
ues
Bu
dg
et V
alu
eR
eco
mm
end
ed
Bu
dg
etR
eco
mm
end
ed
Bu
dg
etR
eco
mm
end
ed
Bu
dg
etR
eco
mm
end
ed
Bu
dg
etR
eco
mm
end
ed
Bu
dg
etA
cco
un
t C
od
eA
cco
un
t D
escr
ipti
on
CC
1C
C2
CC
3
GE
NE
RA
L R
EV
EN
UE
FU
ND
- S
RD
GR
AN
TS
IN A
ID -
AR
EA
A
OP
ER
AT
ING
RE
VE
NU
E
RE
QN
ELE
CT
/SP
EC
PR
OV
GO
VT
01-1
-120
-015
045
23,
397
3,40
03,
403
3,40
60
SU
RP
LUS
PR
IOR
YE
AR
01-1
-120
-150
11,3
509,
942
00
00
13,3
27
Tota
l OP
ER
AT
ING
RE
VE
NU
E13
,327
11,3
5010
,394
3,39
73,
400
3,40
33,
406
OP
ER
AT
ING
EX
PE
NS
ES
SU
PP
OR
T S
ER
VIC
ES
01-2
-120
-200
250
250
250
250
250
250
250
GR
AN
TS
-UN
CO
ND
LO
CA
L A
GE
NC
IES
01-2
-120
-212
10,9
5610
,000
3,00
03,
000
3,00
03,
000
3,00
0
INS
UR
AN
CE
LIA
BIL
ITY
01-2
-120
-369
144
144
147
150
153
156
135
Tota
l O
PE
RA
TIN
G E
XP
EN
SE
S3,
385
11,3
5010
,394
3,39
73,
400
3,40
33,
406
OP
ER
AT
ING
Su
rplu
s/(D
efic
it)
9,94
20
00
00
0
Cat
ego
ry T
ota
l -->
9,94
20
00
00
0
262

Str
ath
con
a R
egio
nal
Dis
tric
tG
L52
90A
Pag
e :
15
Dat
e :
Jan
30, 2
020
Tim
e :
4:43
pm
Bu
dg
et D
epar
tmen
tal R
epo
rt
Fro
m C
ateg
ory
:10
0To
Cat
ego
ry :
897
Acc
ou
nt
Co
de
:0?
-?-?
??-?
??To
:0?
-?-?
??-?
??
2019
2019
2020
2021
2022
2023
2024
Pre
dic
ted
Val
ues
Bu
dg
et V
alu
eR
eco
mm
end
ed
Bu
dg
etR
eco
mm
end
ed
Bu
dg
etR
eco
mm
end
ed
Bu
dg
etR
eco
mm
end
ed
Bu
dg
etR
eco
mm
end
ed
Bu
dg
etA
cco
un
t C
od
eA
cco
un
t D
escr
ipti
on
CC
1C
C2
CC
3
GE
NE
RA
L R
EV
EN
UE
FU
ND
- S
RD
GR
AN
TS
IN A
ID -
AR
EA
D
OP
ER
AT
ING
RE
VE
NU
E
RE
QN
ELE
CT
/SP
EC
PR
OV
GO
VT
01-1
-123
-015
64,4
6262
,030
66,5
1366
,544
66,5
7566
,606
64,4
62
SU
RP
LUS
PR
IOR
YE
AR
01-1
-123
-150
1,94
74,
454
00
00
3,45
6
Tota
l OP
ER
AT
ING
RE
VE
NU
E67
,918
66,4
0966
,484
66,5
1366
,544
66,5
7566
,606
OP
ER
AT
ING
EX
PE
NS
ES
SU
PP
OR
T S
ER
VIC
ES
01-2
-123
-200
694
769
784
800
816
832
694
GR
AN
TS
-UN
CO
ND
LO
CA
L A
GE
NC
IES
01-2
-123
-212
65,0
0065
,000
65,0
0065
,000
65,0
0065
,000
62,1
00
INS
UR
AN
CE
LIA
BIL
ITY
01-2
-123
-369
715
715
729
744
759
774
670
Tota
l O
PE
RA
TIN
G E
XP
EN
SE
S63
,464
66,4
0966
,484
66,5
1366
,544
66,5
7566
,606
OP
ER
AT
ING
Su
rplu
s/(D
efic
it)
4,45
40
00
00
0
Cat
ego
ry T
ota
l -->
4,45
40
00
00
0
263
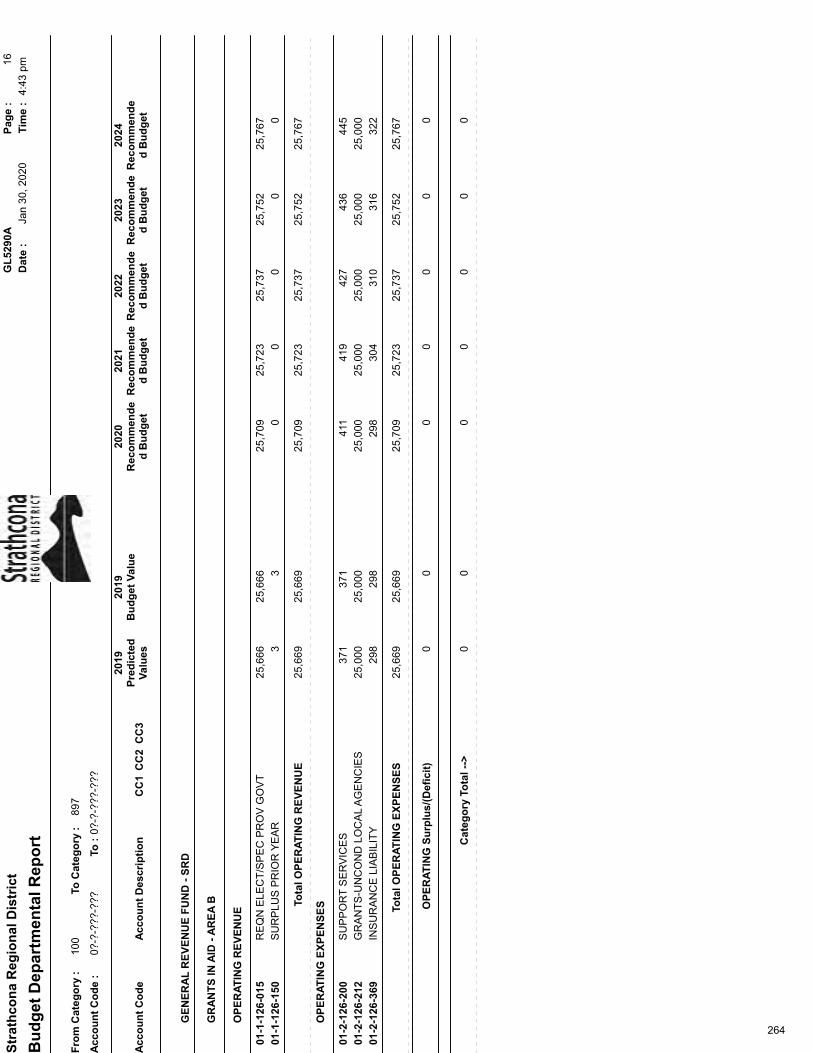
Str
ath
con
a R
egio
nal
Dis
tric
tG
L52
90A
Pag
e :
16
Dat
e :
Jan
30, 2
020
Tim
e :
4:43
pm
Bu
dg
et D
epar
tmen
tal R
epo
rt
Fro
m C
ateg
ory
:10
0To
Cat
ego
ry :
897
Acc
ou
nt
Co
de
:0?
-?-?
??-?
??To
:0?
-?-?
??-?
??
2019
2019
2020
2021
2022
2023
2024
Pre
dic
ted
Val
ues
Bu
dg
et V
alu
eR
eco
mm
end
ed
Bu
dg
etR
eco
mm
end
ed
Bu
dg
etR
eco
mm
end
ed
Bu
dg
etR
eco
mm
end
ed
Bu
dg
etR
eco
mm
end
ed
Bu
dg
etA
cco
un
t C
od
eA
cco
un
t D
escr
ipti
on
CC
1C
C2
CC
3
GE
NE
RA
L R
EV
EN
UE
FU
ND
- S
RD
GR
AN
TS
IN A
ID -
AR
EA
B
OP
ER
AT
ING
RE
VE
NU
E
RE
QN
ELE
CT
/SP
EC
PR
OV
GO
VT
01-1
-126
-015
25,6
6625
,709
25,7
2325
,737
25,7
5225
,767
25,6
66
SU
RP
LUS
PR
IOR
YE
AR
01-1
-126
-150
30
00
00
3
Tota
l OP
ER
AT
ING
RE
VE
NU
E25
,669
25,6
6925
,709
25,7
2325
,737
25,7
5225
,767
OP
ER
AT
ING
EX
PE
NS
ES
SU
PP
OR
T S
ER
VIC
ES
01-2
-126
-200
371
411
419
427
436
445
371
GR
AN
TS
-UN
CO
ND
LO
CA
L A
GE
NC
IES
01-2
-126
-212
25,0
0025
,000
25,0
0025
,000
25,0
0025
,000
25,0
00
INS
UR
AN
CE
LIA
BIL
ITY
01-2
-126
-369
298
298
304
310
316
322
298
Tota
l O
PE
RA
TIN
G E
XP
EN
SE
S25
,669
25,6
6925
,709
25,7
2325
,737
25,7
5225
,767
OP
ER
AT
ING
Su
rplu
s/(D
efic
it)
00
00
00
0
Cat
ego
ry T
ota
l -->
00
00
00
0
264

Str
ath
con
a R
egio
nal
Dis
tric
tG
L52
90A
Pag
e :
17
Dat
e :
Jan
30, 2
020
Tim
e :
4:43
pm
Bu
dg
et D
epar
tmen
tal R
epo
rt
Fro
m C
ateg
ory
:10
0To
Cat
ego
ry :
897
Acc
ou
nt
Co
de
:0?
-?-?
??-?
??To
:0?
-?-?
??-?
??
2019
2019
2020
2021
2022
2023
2024
Pre
dic
ted
Val
ues
Bu
dg
et V
alu
eR
eco
mm
end
ed
Bu
dg
etR
eco
mm
end
ed
Bu
dg
etR
eco
mm
end
ed
Bu
dg
etR
eco
mm
end
ed
Bu
dg
etR
eco
mm
end
ed
Bu
dg
etA
cco
un
t C
od
eA
cco
un
t D
escr
ipti
on
CC
1C
C2
CC
3
GE
NE
RA
L R
EV
EN
UE
FU
ND
- S
RD
GR
AN
TS
IN A
ID -
AR
EA
C
OP
ER
AT
ING
RE
VE
NU
E
RE
QN
ELE
CT
/SP
EC
PR
OV
GO
VT
01-1
-127
-015
19,8
9324
,815
25,8
7925
,897
25,9
1525
,933
19,8
93
SU
RP
LUS
PR
IOR
YE
AR
01-1
-127
-150
20,9
3016
,046
00
00
22,8
06
Tota
l OP
ER
AT
ING
RE
VE
NU
E42
,699
40,8
2340
,861
25,8
7925
,897
25,9
1525
,933
OP
ER
AT
ING
EX
PE
NS
ES
SU
PP
OR
T S
ER
VIC
ES
01-2
-127
-200
346
384
392
400
408
416
346
GR
AN
TS
-UN
CO
ND
LO
CA
L A
GE
NC
IES
01-2
-127
-212
40,0
0040
,000
25,0
0025
,000
25,0
0025
,000
25,8
60
INS
UR
AN
CE
LIA
BIL
ITY
01-2
-127
-369
477
477
487
497
507
517
447
Tota
l O
PE
RA
TIN
G E
XP
EN
SE
S26
,653
40,8
2340
,861
25,8
7925
,897
25,9
1525
,933
OP
ER
AT
ING
Su
rplu
s/(D
efic
it)
16,0
460
00
00
0
Cat
ego
ry T
ota
l -->
16,0
460
00
00
0
265
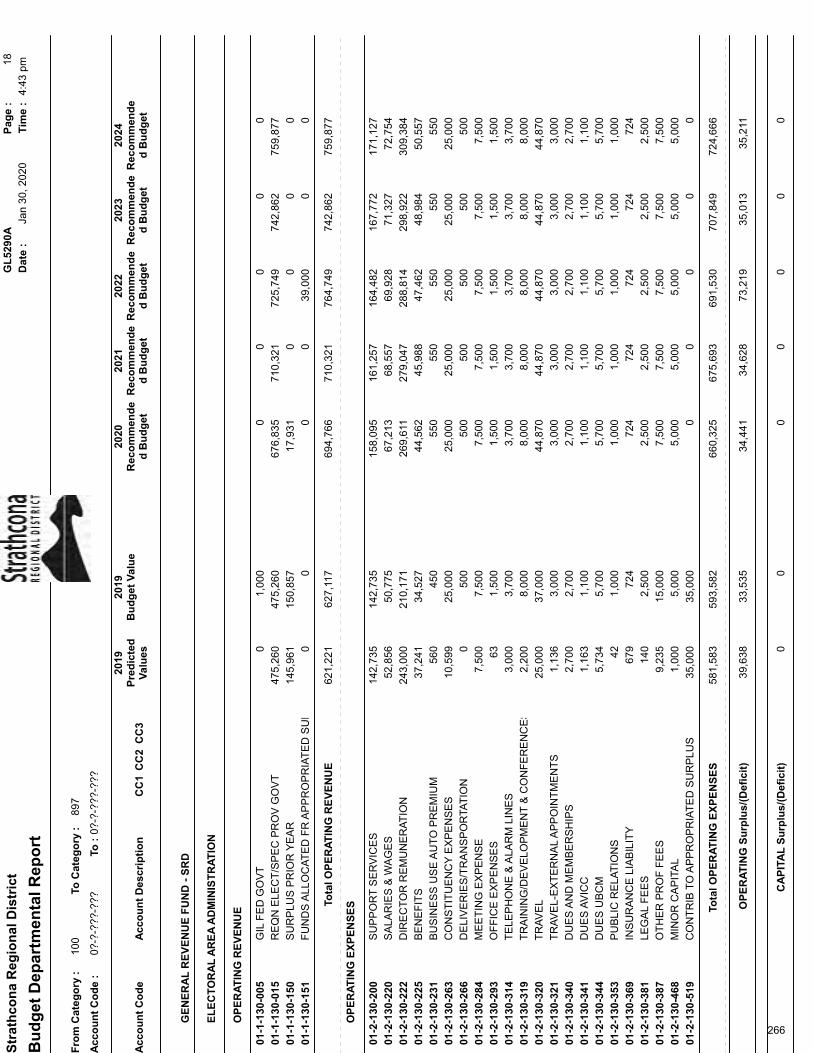
Str
ath
con
a R
egio
nal
Dis
tric
tG
L52
90A
Pag
e :
18
Dat
e :
Jan
30, 2
020
Tim
e :
4:43
pm
Bu
dg
et D
epar
tmen
tal R
epo
rt
Fro
m C
ateg
ory
:10
0To
Cat
ego
ry :
897
Acc
ou
nt
Co
de
:0?
-?-?
??-?
??To
:0?
-?-?
??-?
??
2019
2019
2020
2021
2022
2023
2024
Pre
dic
ted
Val
ues
Bu
dg
et V
alu
eR
eco
mm
end
ed
Bu
dg
etR
eco
mm
end
ed
Bu
dg
etR
eco
mm
end
ed
Bu
dg
etR
eco
mm
end
ed
Bu
dg
etR
eco
mm
end
ed
Bu
dg
etA
cco
un
t C
od
eA
cco
un
t D
escr
ipti
on
CC
1C
C2
CC
3
GE
NE
RA
L R
EV
EN
UE
FU
ND
- S
RD
EL
EC
TO
RA
L A
RE
A A
DM
INIS
TR
AT
ION
OP
ER
AT
ING
RE
VE
NU
E
GIL
FE
D G
OV
T01
-1-1
30-0
051,
000
00
00
00
RE
QN
ELE
CT
/SP
EC
PR
OV
GO
VT
01-1
-130
-015
475,
260
676,
835
710,
321
725,
749
742,
862
759,
877
475,
260
SU
RP
LUS
PR
IOR
YE
AR
01-1
-130
-150
150,
857
17,9
310
00
014
5,96
1
FU
ND
S A
LLO
CA
TE
D F
R A
PP
RO
PR
IAT
ED
SU
RP
LUS
01-1
-130
-151
00
039
,000
00
0
Tota
l OP
ER
AT
ING
RE
VE
NU
E62
1,22
162
7,11
769
4,76
671
0,32
176
4,74
974
2,86
275
9,87
7
OP
ER
AT
ING
EX
PE
NS
ES
SU
PP
OR
T S
ER
VIC
ES
01-2
-130
-200
142,
735
158,
095
161,
257
164,
482
167,
772
171,
127
142,
735
SA
LAR
IES
& W
AG
ES
01-2
-130
-220
50,7
7567
,213
68,5
5769
,928
71,3
2772
,754
52,8
56
DIR
EC
TO
R R
EM
UN
ER
AT
ION
01-2
-130
-222
210,
171
269,
611
279,
047
288,
814
298,
922
309,
384
243,
000
BE
NE
FIT
S01
-2-1
30-2
2534
,527
44,5
6245
,988
47,4
6248
,984
50,5
5737
,241
BU
SIN
ES
S U
SE
AU
TO
PR
EM
IUM
01-2
-130
-231
450
550
550
550
550
550
560
CO
NS
TIT
UE
NC
Y E
XP
EN
SE
S01
-2-1
30-2
6325
,000
25,0
0025
,000
25,0
0025
,000
25,0
0010
,599
DE
LIV
ER
IES
/TR
AN
SP
OR
TAT
ION
01-2
-130
-266
500
500
500
500
500
500
0
ME
ET
ING
EX
PE
NS
E01
-2-1
30-2
847,
500
7,50
07,
500
7,50
07,
500
7,50
07,
500
OF
FIC
E E
XP
EN
SE
S01
-2-1
30-2
931,
500
1,50
01,
500
1,50
01,
500
1,50
063
TE
LEP
HO
NE
& A
LAR
M L
INE
S01
-2-1
30-3
143,
700
3,70
03,
700
3,70
03,
700
3,70
03,
000
TR
AIN
ING
/DE
VE
LOP
ME
NT
& C
ON
FE
RE
NC
ES
01-2
-130
-319
8,00
08,
000
8,00
08,
000
8,00
08,
000
2,20
0
TR
AV
EL
01-2
-130
-320
37,0
0044
,870
44,8
7044
,870
44,8
7044
,870
25,0
00
TR
AV
EL-
EX
TE
RN
AL
AP
PO
INT
ME
NT
S01
-2-1
30-3
213,
000
3,00
03,
000
3,00
03,
000
3,00
01,
136
DU
ES
AN
D M
EM
BE
RS
HIP
S01
-2-1
30-3
402,
700
2,70
02,
700
2,70
02,
700
2,70
02,
700
DU
ES
AV
ICC
01-2
-130
-341
1,10
01,
100
1,10
01,
100
1,10
01,
100
1,16
3
DU
ES
UB
CM
01-2
-130
-344
5,70
05,
700
5,70
05,
700
5,70
05,
700
5,73
4
PU
BLI
C R
ELA
TIO
NS
01-2
-130
-353
1,00
01,
000
1,00
01,
000
1,00
01,
000
42
INS
UR
AN
CE
LIA
BIL
ITY
01-2
-130
-369
724
724
724
724
724
724
679
LEG
AL
FE
ES
01-2
-130
-381
2,50
02,
500
2,50
02,
500
2,50
02,
500
140
OT
HE
R P
RO
F F
EE
S01
-2-1
30-3
8715
,000
7,50
07,
500
7,50
07,
500
7,50
09,
235
MIN
OR
CA
PIT
AL
01-2
-130
-468
5,00
05,
000
5,00
05,
000
5,00
05,
000
1,00
0
CO
NT
RIB
TO
AP
PR
OP
RIA
TE
D S
UR
PLU
S01
-2-1
30-5
1935
,000
00
00
035
,000
Tota
l O
PE
RA
TIN
G E
XP
EN
SE
S58
1,58
359
3,58
266
0,32
567
5,69
369
1,53
070
7,84
972
4,66
6
OP
ER
AT
ING
Su
rplu
s/(D
efic
it)
39,6
3833
,535
34,4
4134
,628
73,2
1935
,013
35,2
11
CA
PIT
AL
Su
rplu
s/(D
efic
it)
00
00
00
0
266
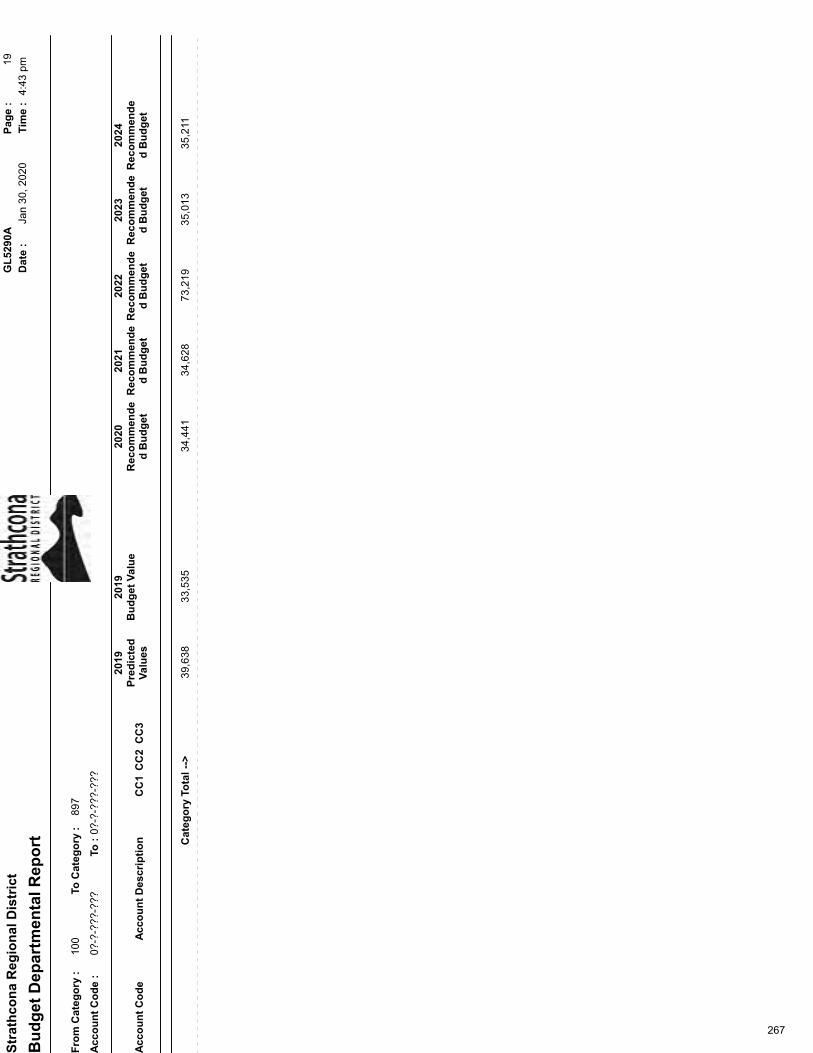
Str
ath
con
a R
egio
nal
Dis
tric
tG
L52
90A
Pag
e :
19
Dat
e :
Jan
30, 2
020
Tim
e :
4:43
pm
Bu
dg
et D
epar
tmen
tal R
epo
rt
Fro
m C
ateg
ory
:10
0To
Cat
ego
ry :
897
Acc
ou
nt
Co
de
:0?
-?-?
??-?
??To
:0?
-?-?
??-?
??
2019
2019
2020
2021
2022
2023
2024
Pre
dic
ted
Val
ues
Bu
dg
et V
alu
eR
eco
mm
end
ed
Bu
dg
etR
eco
mm
end
ed
Bu
dg
etR
eco
mm
end
ed
Bu
dg
etR
eco
mm
end
ed
Bu
dg
etR
eco
mm
end
ed
Bu
dg
etA
cco
un
t C
od
eA
cco
un
t D
escr
ipti
on
CC
1C
C2
CC
3
Cat
ego
ry T
ota
l -->
39,6
3833
,535
34,4
4134
,628
73,2
1935
,013
35,2
11
267
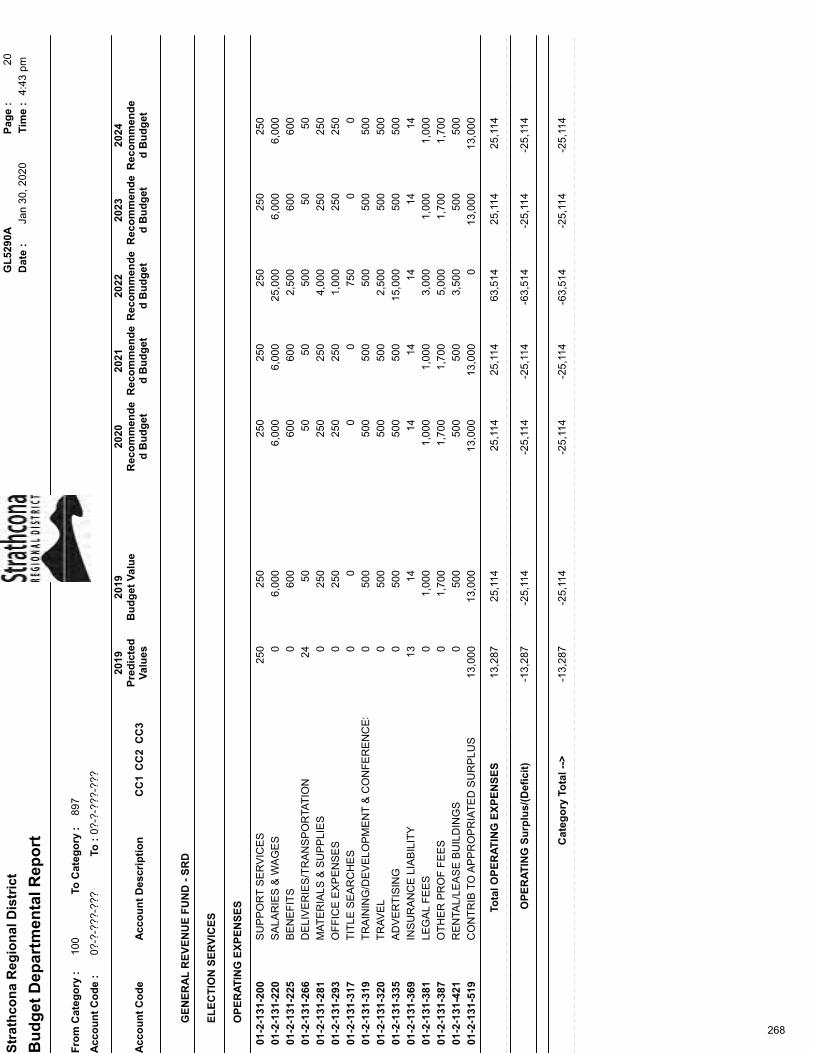
Str
ath
con
a R
egio
nal
Dis
tric
tG
L52
90A
Pag
e :
20
Dat
e :
Jan
30, 2
020
Tim
e :
4:43
pm
Bu
dg
et D
epar
tmen
tal R
epo
rt
Fro
m C
ateg
ory
:10
0To
Cat
ego
ry :
897
Acc
ou
nt
Co
de
:0?
-?-?
??-?
??To
:0?
-?-?
??-?
??
2019
2019
2020
2021
2022
2023
2024
Pre
dic
ted
Val
ues
Bu
dg
et V
alu
eR
eco
mm
end
ed
Bu
dg
etR
eco
mm
end
ed
Bu
dg
etR
eco
mm
end
ed
Bu
dg
etR
eco
mm
end
ed
Bu
dg
etR
eco
mm
end
ed
Bu
dg
etA
cco
un
t C
od
eA
cco
un
t D
escr
ipti
on
CC
1C
C2
CC
3
GE
NE
RA
L R
EV
EN
UE
FU
ND
- S
RD
EL
EC
TIO
N S
ER
VIC
ES
OP
ER
AT
ING
EX
PE
NS
ES
SU
PP
OR
T S
ER
VIC
ES
01-2
-131
-200
250
250
250
250
250
250
250
SA
LAR
IES
& W
AG
ES
01-2
-131
-220
6,00
06,
000
6,00
025
,000
6,00
06,
000
0
BE
NE
FIT
S01
-2-1
31-2
2560
060
060
02,
500
600
600
0
DE
LIV
ER
IES
/TR
AN
SP
OR
TAT
ION
01-2
-131
-266
5050
5050
050
5024
MA
TE
RIA
LS &
SU
PP
LIE
S01
-2-1
31-2
8125
025
025
04,
000
250
250
0
OF
FIC
E E
XP
EN
SE
S01
-2-1
31-2
9325
025
025
01,
000
250
250
0
TIT
LE S
EA
RC
HE
S01
-2-1
31-3
170
00
750
00
0
TR
AIN
ING
/DE
VE
LOP
ME
NT
& C
ON
FE
RE
NC
ES
01-2
-131
-319
500
500
500
500
500
500
0
TR
AV
EL
01-2
-131
-320
500
500
500
2,50
050
050
00
AD
VE
RT
ISIN
G01
-2-1
31-3
3550
050
050
015
,000
500
500
0
INS
UR
AN
CE
LIA
BIL
ITY
01-2
-131
-369
1414
1414
1414
13
LEG
AL
FE
ES
01-2
-131
-381
1,00
01,
000
1,00
03,
000
1,00
01,
000
0
OT
HE
R P
RO
F F
EE
S01
-2-1
31-3
871,
700
1,70
01,
700
5,00
01,
700
1,70
00
RE
NTA
L/LE
AS
E B
UIL
DIN
GS
01-2
-131
-421
500
500
500
3,50
050
050
00
CO
NT
RIB
TO
AP
PR
OP
RIA
TE
D S
UR
PLU
S01
-2-1
31-5
1913
,000
13,0
0013
,000
013
,000
13,0
0013
,000
Tota
l O
PE
RA
TIN
G E
XP
EN
SE
S13
,287
25,1
1425
,114
25,1
1463
,514
25,1
1425
,114
OP
ER
AT
ING
Su
rplu
s/(D
efic
it)
-13,
287
-25,
114
-25,
114
-25,
114
-63,
514
-25,
114
-25,
114
Cat
ego
ry T
ota
l -->
-13,
287
-25,
114
-25,
114
-25,
114
-63,
514
-25,
114
-25,
114
268
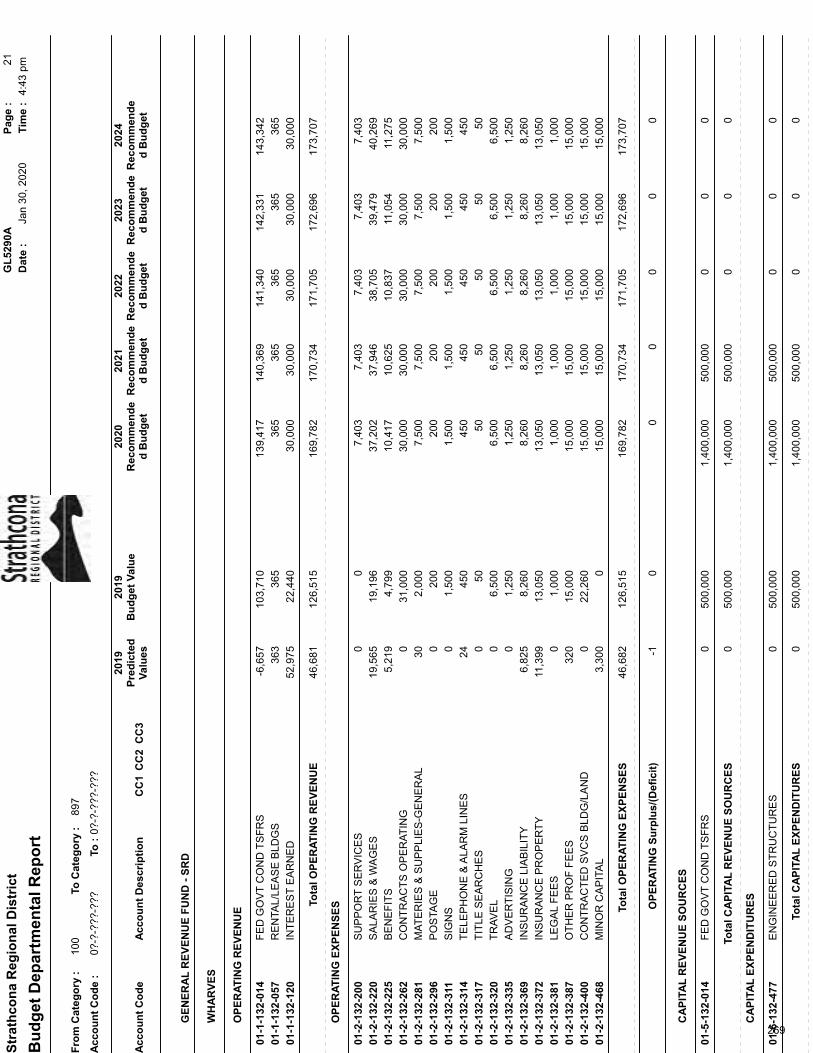
Str
ath
con
a R
egio
nal
Dis
tric
tG
L52
90A
Pag
e :
21
Dat
e :
Jan
30, 2
020
Tim
e :
4:43
pm
Bu
dg
et D
epar
tmen
tal R
epo
rt
Fro
m C
ateg
ory
:10
0To
Cat
ego
ry :
897
Acc
ou
nt
Co
de
:0?
-?-?
??-?
??To
:0?
-?-?
??-?
??
2019
2019
2020
2021
2022
2023
2024
Pre
dic
ted
Val
ues
Bu
dg
et V
alu
eR
eco
mm
end
ed
Bu
dg
etR
eco
mm
end
ed
Bu
dg
etR
eco
mm
end
ed
Bu
dg
etR
eco
mm
end
ed
Bu
dg
etR
eco
mm
end
ed
Bu
dg
etA
cco
un
t C
od
eA
cco
un
t D
escr
ipti
on
CC
1C
C2
CC
3
GE
NE
RA
L R
EV
EN
UE
FU
ND
- S
RD
WH
AR
VE
S
OP
ER
AT
ING
RE
VE
NU
E
FE
D G
OV
T C
ON
D T
SF
RS
01-1
-132
-014
103,
710
139,
417
140,
369
141,
340
142,
331
143,
342
-6,6
57
RE
NTA
L/LE
AS
E B
LDG
S01
-1-1
32-0
5736
536
536
536
536
536
536
3
INT
ER
ES
T E
AR
NE
D01
-1-1
32-1
2022
,440
30,0
0030
,000
30,0
0030
,000
30,0
0052
,975
Tota
l OP
ER
AT
ING
RE
VE
NU
E46
,681
126,
515
169,
782
170,
734
171,
705
172,
696
173,
707
OP
ER
AT
ING
EX
PE
NS
ES
SU
PP
OR
T S
ER
VIC
ES
01-2
-132
-200
07,
403
7,40
37,
403
7,40
37,
403
0
SA
LAR
IES
& W
AG
ES
01-2
-132
-220
19,1
9637
,202
37,9
4638
,705
39,4
7940
,269
19,5
65
BE
NE
FIT
S01
-2-1
32-2
254,
799
10,4
1710
,625
10,8
3711
,054
11,2
755,
219
CO
NT
RA
CT
S O
PE
RA
TIN
G01
-2-1
32-2
6231
,000
30,0
0030
,000
30,0
0030
,000
30,0
000
MA
TE
RIE
S &
SU
PP
LIE
S-G
EN
ER
AL
01-2
-132
-281
2,00
07,
500
7,50
07,
500
7,50
07,
500
30
PO
STA
GE
01-2
-132
-296
200
200
200
200
200
200
0
SIG
NS
01-2
-132
-311
1,50
01,
500
1,50
01,
500
1,50
01,
500
0
TE
LEP
HO
NE
& A
LAR
M L
INE
S01
-2-1
32-3
1445
045
045
045
045
045
024
TIT
LE S
EA
RC
HE
S01
-2-1
32-3
1750
5050
5050
500
TR
AV
EL
01-2
-132
-320
6,50
06,
500
6,50
06,
500
6,50
06,
500
0
AD
VE
RT
ISIN
G01
-2-1
32-3
351,
250
1,25
01,
250
1,25
01,
250
1,25
00
INS
UR
AN
CE
LIA
BIL
ITY
01-2
-132
-369
8,26
08,
260
8,26
08,
260
8,26
08,
260
6,82
5
INS
UR
AN
CE
PR
OP
ER
TY
01-2
-132
-372
13,0
5013
,050
13,0
5013
,050
13,0
5013
,050
11,3
99
LEG
AL
FE
ES
01-2
-132
-381
1,00
01,
000
1,00
01,
000
1,00
01,
000
0
OT
HE
R P
RO
F F
EE
S01
-2-1
32-3
8715
,000
15,0
0015
,000
15,0
0015
,000
15,0
0032
0
CO
NT
RA
CT
ED
SV
CS
BLD
G/L
AN
D01
-2-1
32-4
0022
,260
15,0
0015
,000
15,0
0015
,000
15,0
000
MIN
OR
CA
PIT
AL
01-2
-132
-468
015
,000
15,0
0015
,000
15,0
0015
,000
3,30
0
Tota
l O
PE
RA
TIN
G E
XP
EN
SE
S46
,682
126,
515
169,
782
170,
734
171,
705
172,
696
173,
707
OP
ER
AT
ING
Su
rplu
s/(D
efic
it)
-10
00
00
0
CA
PIT
AL
RE
VE
NU
E S
OU
RC
ES
FE
D G
OV
T C
ON
D T
SF
RS
01-5
-132
-014
500,
000
1,40
0,00
050
0,00
00
00
0
Tota
l CA
PIT
AL
RE
VE
NU
E S
OU
RC
ES
050
0,00
01,
400,
000
500,
000
00
0
CA
PIT
AL
EX
PE
ND
ITU
RE
S
EN
GIN
EE
RE
D S
TR
UC
TU
RE
S01
-6-1
32-4
7750
0,00
01,
400,
000
500,
000
00
00
Tota
l CA
PIT
AL
EX
PE
ND
ITU
RE
S0
500,
000
1,40
0,00
050
0,00
00
00
269
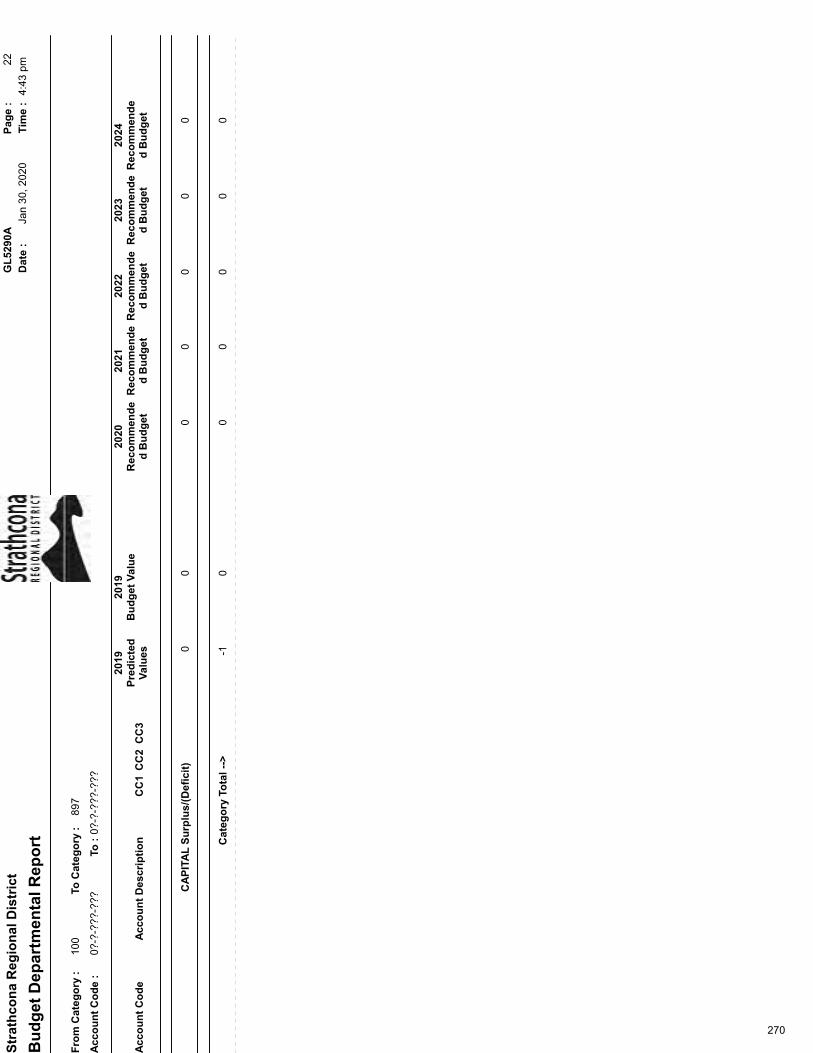
Str
ath
con
a R
egio
nal
Dis
tric
tG
L52
90A
Pag
e :
22
Dat
e :
Jan
30, 2
020
Tim
e :
4:43
pm
Bu
dg
et D
epar
tmen
tal R
epo
rt
Fro
m C
ateg
ory
:10
0To
Cat
ego
ry :
897
Acc
ou
nt
Co
de
:0?
-?-?
??-?
??To
:0?
-?-?
??-?
??
2019
2019
2020
2021
2022
2023
2024
Pre
dic
ted
Val
ues
Bu
dg
et V
alu
eR
eco
mm
end
ed
Bu
dg
etR
eco
mm
end
ed
Bu
dg
etR
eco
mm
end
ed
Bu
dg
etR
eco
mm
end
ed
Bu
dg
etR
eco
mm
end
ed
Bu
dg
etA
cco
un
t C
od
eA
cco
un
t D
escr
ipti
on
CC
1C
C2
CC
3
CA
PIT
AL
Su
rplu
s/(D
efic
it)
00
00
00
0
Cat
ego
ry T
ota
l -->
-10
00
00
0
270
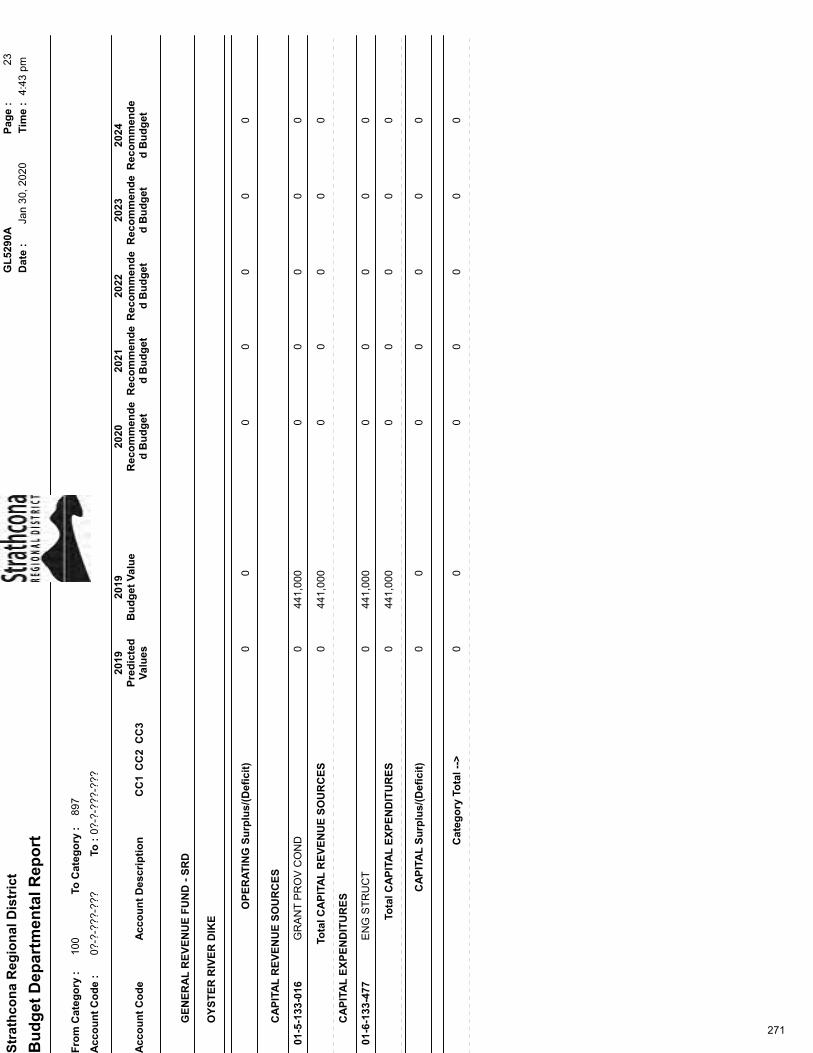
Str
ath
con
a R
egio
nal
Dis
tric
tG
L52
90A
Pag
e :
23
Dat
e :
Jan
30, 2
020
Tim
e :
4:43
pm
Bu
dg
et D
epar
tmen
tal R
epo
rt
Fro
m C
ateg
ory
:10
0To
Cat
ego
ry :
897
Acc
ou
nt
Co
de
:0?
-?-?
??-?
??To
:0?
-?-?
??-?
??
2019
2019
2020
2021
2022
2023
2024
Pre
dic
ted
Val
ues
Bu
dg
et V
alu
eR
eco
mm
end
ed
Bu
dg
etR
eco
mm
end
ed
Bu
dg
etR
eco
mm
end
ed
Bu
dg
etR
eco
mm
end
ed
Bu
dg
etR
eco
mm
end
ed
Bu
dg
etA
cco
un
t C
od
eA
cco
un
t D
escr
ipti
on
CC
1C
C2
CC
3
GE
NE
RA
L R
EV
EN
UE
FU
ND
- S
RD
OY
ST
ER
RIV
ER
DIK
E
OP
ER
AT
ING
Su
rplu
s/(D
efic
it)
00
00
00
0
CA
PIT
AL
RE
VE
NU
E S
OU
RC
ES
GR
AN
T P
RO
V C
ON
D01
-5-1
33-0
1644
1,00
00
00
00
0
Tota
l CA
PIT
AL
RE
VE
NU
E S
OU
RC
ES
044
1,00
00
00
00
CA
PIT
AL
EX
PE
ND
ITU
RE
S
EN
G S
TR
UC
T01
-6-1
33-4
7744
1,00
00
00
00
0
Tota
l CA
PIT
AL
EX
PE
ND
ITU
RE
S0
441,
000
00
00
0
CA
PIT
AL
Su
rplu
s/(D
efic
it)
00
00
00
0
Cat
ego
ry T
ota
l -->
00
00
00
0
271

Str
ath
con
a R
egio
nal
Dis
tric
tG
L52
90A
Pag
e :
24
Dat
e :
Jan
30, 2
020
Tim
e :
4:43
pm
Bu
dg
et D
epar
tmen
tal R
epo
rt
Fro
m C
ateg
ory
:10
0To
Cat
ego
ry :
897
Acc
ou
nt
Co
de
:0?
-?-?
??-?
??To
:0?
-?-?
??-?
??
2019
2019
2020
2021
2022
2023
2024
Pre
dic
ted
Val
ues
Bu
dg
et V
alu
eR
eco
mm
end
ed
Bu
dg
etR
eco
mm
end
ed
Bu
dg
etR
eco
mm
end
ed
Bu
dg
etR
eco
mm
end
ed
Bu
dg
etR
eco
mm
end
ed
Bu
dg
etA
cco
un
t C
od
eA
cco
un
t D
escr
ipti
on
CC
1C
C2
CC
3
GE
NE
RA
L R
EV
EN
UE
FU
ND
- S
RD
GA
S T
AX
(C
WF
) P
RO
JEC
TS
OP
ER
AT
ING
RE
VE
NU
E
FE
D G
AS
TA
X F
UN
DIN
G01
-1-1
35-0
1349
8,79
548
4,68
548
4,68
550
6,81
950
6,81
952
9,05
398
3,48
0
Tota
l OP
ER
AT
ING
RE
VE
NU
E98
3,48
049
8,79
548
4,68
548
4,68
550
6,81
950
6,81
952
9,05
3
OP
ER
AT
ING
EX
PE
NS
ES
SU
PP
OR
T S
ER
VIC
ES
01-2
-135
-200
8,42
19,
328
9,51
59,
705
9,89
910
,097
8,42
1
CO
NT
R T
O G
AS
TA
X R
ES
ER
VE
01-2
-135
-484
498,
795
484,
684
484,
684
506,
819
506,
819
529,
053
983,
479
Tota
l O
PE
RA
TIN
G E
XP
EN
SE
S99
1,90
050
7,21
649
4,01
249
4,19
951
6,52
451
6,71
853
9,15
0
OP
ER
AT
ING
Su
rplu
s/(D
efic
it)
-8,4
20-8
,421
-9,3
27-9
,514
-9,7
05-9
,899
-10,
097
Cat
ego
ry T
ota
l -->
-8,4
20-8
,421
-9,3
27-9
,514
-9,7
05-9
,899
-10,
097
272
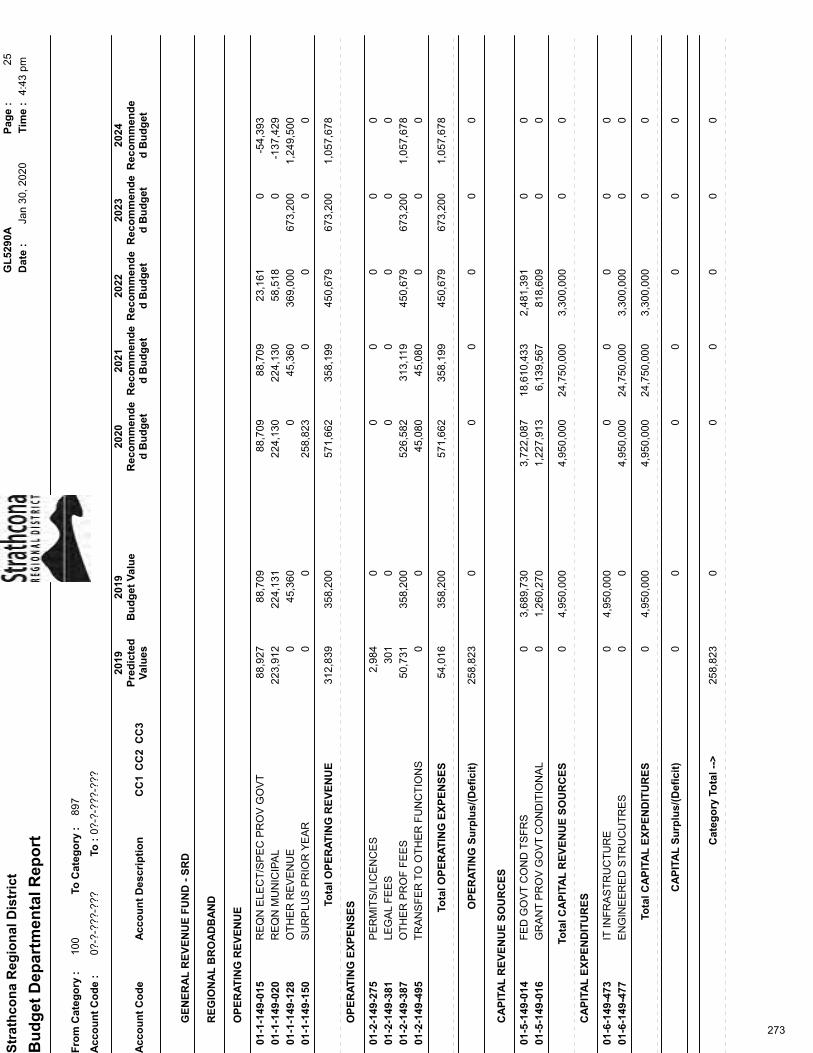
Str
ath
con
a R
egio
nal
Dis
tric
tG
L52
90A
Pag
e :
25
Dat
e :
Jan
30, 2
020
Tim
e :
4:43
pm
Bu
dg
et D
epar
tmen
tal R
epo
rt
Fro
m C
ateg
ory
:10
0To
Cat
ego
ry :
897
Acc
ou
nt
Co
de
:0?
-?-?
??-?
??To
:0?
-?-?
??-?
??
2019
2019
2020
2021
2022
2023
2024
Pre
dic
ted
Val
ues
Bu
dg
et V
alu
eR
eco
mm
end
ed
Bu
dg
etR
eco
mm
end
ed
Bu
dg
etR
eco
mm
end
ed
Bu
dg
etR
eco
mm
end
ed
Bu
dg
etR
eco
mm
end
ed
Bu
dg
etA
cco
un
t C
od
eA
cco
un
t D
escr
ipti
on
CC
1C
C2
CC
3
GE
NE
RA
L R
EV
EN
UE
FU
ND
- S
RD
RE
GIO
NA
L B
RO
AD
BA
ND
OP
ER
AT
ING
RE
VE
NU
E
RE
QN
ELE
CT
/SP
EC
PR
OV
GO
VT
01-1
-149
-015
88,7
0988
,709
88,7
0923
,161
0-5
4,39
388
,927
RE
QN
MU
NIC
IPA
L01
-1-1
49-0
2022
4,13
122
4,13
022
4,13
058
,518
0-1
37,4
2922
3,91
2
OT
HE
R R
EV
EN
UE
01-1
-149
-128
45,3
600
45,3
6036
9,00
067
3,20
01,
249,
500
0
SU
RP
LUS
PR
IOR
YE
AR
01-1
-149
-150
025
8,82
30
00
00
Tota
l OP
ER
AT
ING
RE
VE
NU
E31
2,83
935
8,20
057
1,66
235
8,19
945
0,67
967
3,20
01,
057,
678
OP
ER
AT
ING
EX
PE
NS
ES
PE
RM
ITS
/LIC
EN
CE
S01
-2-1
49-2
750
00
00
02,
984
LEG
AL
FE
ES
01-2
-149
-381
00
00
00
301
OT
HE
R P
RO
F F
EE
S01
-2-1
49-3
8735
8,20
052
6,58
231
3,11
945
0,67
967
3,20
01,
057,
678
50,7
31
TR
AN
SF
ER
TO
OT
HE
R F
UN
CT
ION
S01
-2-1
49-4
950
45,0
8045
,080
00
00
Tota
l O
PE
RA
TIN
G E
XP
EN
SE
S54
,016
358,
200
571,
662
358,
199
450,
679
673,
200
1,05
7,67
8
OP
ER
AT
ING
Su
rplu
s/(D
efic
it)
258,
823
00
00
00
CA
PIT
AL
RE
VE
NU
E S
OU
RC
ES
FE
D G
OV
T C
ON
D T
SF
RS
01-5
-149
-014
3,68
9,73
03,
722,
087
18,6
10,4
332,
481,
391
00
0
GR
AN
T P
RO
V G
OV
T C
ON
DIT
ION
AL
01-5
-149
-016
1,26
0,27
01,
227,
913
6,13
9,56
781
8,60
90
00
Tota
l CA
PIT
AL
RE
VE
NU
E S
OU
RC
ES
04,
950,
000
4,95
0,00
024
,750
,000
3,30
0,00
00
0
CA
PIT
AL
EX
PE
ND
ITU
RE
S
IT IN
FR
AS
TR
UC
TU
RE
01-6
-149
-473
4,95
0,00
00
00
00
0
EN
GIN
EE
RE
D S
TR
UC
UT
RE
S01
-6-1
49-4
770
4,95
0,00
024
,750
,000
3,30
0,00
00
00
Tota
l CA
PIT
AL
EX
PE
ND
ITU
RE
S0
4,95
0,00
04,
950,
000
24,7
50,0
003,
300,
000
00
CA
PIT
AL
Su
rplu
s/(D
efic
it)
00
00
00
0
Cat
ego
ry T
ota
l -->
258,
823
00
00
00
273
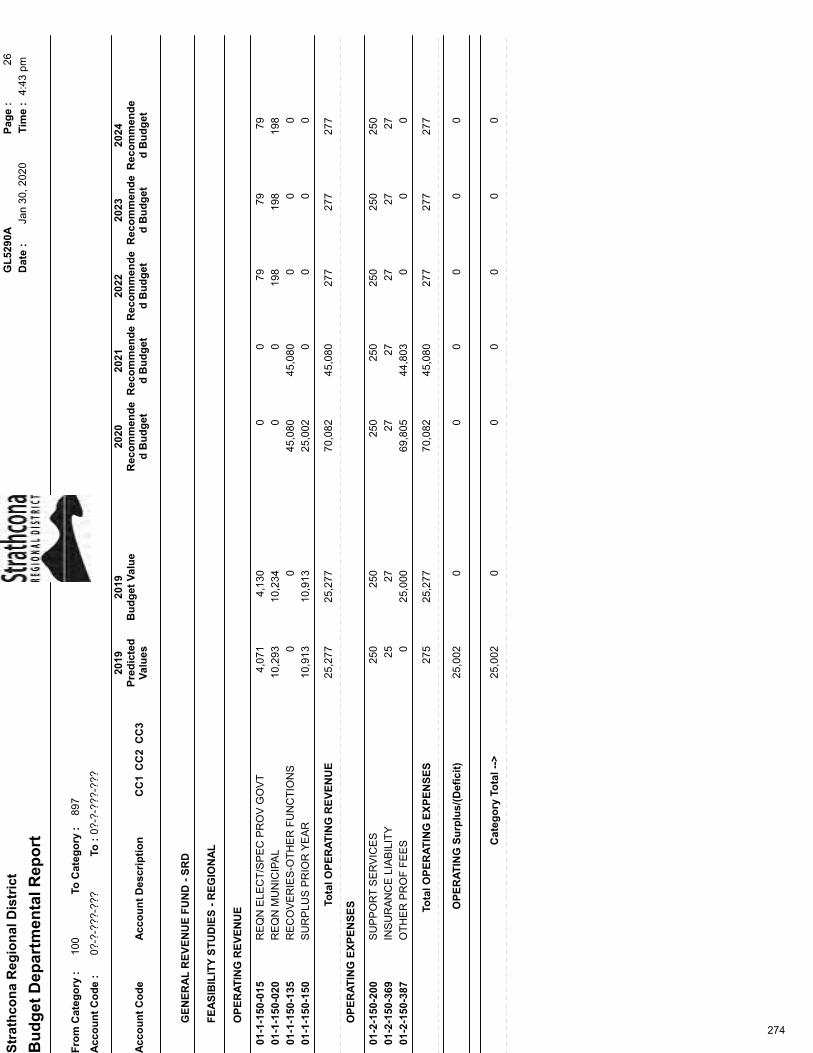
Str
ath
con
a R
egio
nal
Dis
tric
tG
L52
90A
Pag
e :
26
Dat
e :
Jan
30, 2
020
Tim
e :
4:43
pm
Bu
dg
et D
epar
tmen
tal R
epo
rt
Fro
m C
ateg
ory
:10
0To
Cat
ego
ry :
897
Acc
ou
nt
Co
de
:0?
-?-?
??-?
??To
:0?
-?-?
??-?
??
2019
2019
2020
2021
2022
2023
2024
Pre
dic
ted
Val
ues
Bu
dg
et V
alu
eR
eco
mm
end
ed
Bu
dg
etR
eco
mm
end
ed
Bu
dg
etR
eco
mm
end
ed
Bu
dg
etR
eco
mm
end
ed
Bu
dg
etR
eco
mm
end
ed
Bu
dg
etA
cco
un
t C
od
eA
cco
un
t D
escr
ipti
on
CC
1C
C2
CC
3
GE
NE
RA
L R
EV
EN
UE
FU
ND
- S
RD
FE
AS
IBIL
ITY
ST
UD
IES
- R
EG
ION
AL
OP
ER
AT
ING
RE
VE
NU
E
RE
QN
ELE
CT
/SP
EC
PR
OV
GO
VT
01-1
-150
-015
4,13
00
079
7979
4,07
1
RE
QN
MU
NIC
IPA
L01
-1-1
50-0
2010
,234
00
198
198
198
10,2
93
RE
CO
VE
RIE
S-O
TH
ER
FU
NC
TIO
NS
01-1
-150
-135
045
,080
45,0
800
00
0
SU
RP
LUS
PR
IOR
YE
AR
01-1
-150
-150
10,9
1325
,002
00
00
10,9
13
Tota
l OP
ER
AT
ING
RE
VE
NU
E25
,277
25,2
7770
,082
45,0
8027
727
727
7
OP
ER
AT
ING
EX
PE
NS
ES
SU
PP
OR
T S
ER
VIC
ES
01-2
-150
-200
250
250
250
250
250
250
250
INS
UR
AN
CE
LIA
BIL
ITY
01-2
-150
-369
2727
2727
2727
25
OT
HE
R P
RO
F F
EE
S01
-2-1
50-3
8725
,000
69,8
0544
,803
00
00
Tota
l O
PE
RA
TIN
G E
XP
EN
SE
S27
525
,277
70,0
8245
,080
277
277
277
OP
ER
AT
ING
Su
rplu
s/(D
efic
it)
25,0
020
00
00
0
Cat
ego
ry T
ota
l -->
25,0
020
00
00
0
274

Str
ath
con
a R
egio
nal
Dis
tric
tG
L52
90A
Pag
e :
27
Dat
e :
Jan
30, 2
020
Tim
e :
4:43
pm
Bu
dg
et D
epar
tmen
tal R
epo
rt
Fro
m C
ateg
ory
:10
0To
Cat
ego
ry :
897
Acc
ou
nt
Co
de
:0?
-?-?
??-?
??To
:0?
-?-?
??-?
??
2019
2019
2020
2021
2022
2023
2024
Pre
dic
ted
Val
ues
Bu
dg
et V
alu
eR
eco
mm
end
ed
Bu
dg
etR
eco
mm
end
ed
Bu
dg
etR
eco
mm
end
ed
Bu
dg
etR
eco
mm
end
ed
Bu
dg
etR
eco
mm
end
ed
Bu
dg
etA
cco
un
t C
od
eA
cco
un
t D
escr
ipti
on
CC
1C
C2
CC
3
GE
NE
RA
L R
EV
EN
UE
FU
ND
- S
RD
FE
AS
IBIL
ITY
ST
UD
IES
- E
LE
CT
OR
AL
AR
EA
A
OP
ER
AT
ING
RE
VE
NU
E
RE
QN
ELE
CT
/SP
EC
PR
OV
GO
VT
01-1
-151
-015
087
425
625
625
625
60
SU
RP
LUS
PR
IOR
YE
AR
01-1
-151
-150
4,63
84,
382
00
00
4,63
8
Tota
l OP
ER
AT
ING
RE
VE
NU
E4,
638
4,63
85,
256
256
256
256
256
OP
ER
AT
ING
EX
PE
NS
ES
SU
PP
OR
T S
ER
VIC
ES
01-2
-151
-200
250
250
250
250
250
250
250
INS
UR
AN
CE
LIA
BIL
ITY
01-2
-151
-369
66
66
66
6
OT
HE
R P
RO
F F
EE
S01
-2-1
51-3
874,
382
5,00
00
00
00
Tota
l O
PE
RA
TIN
G E
XP
EN
SE
S25
64,
638
5,25
625
625
625
625
6
OP
ER
AT
ING
Su
rplu
s/(D
efic
it)
4,38
20
00
00
0
Cat
ego
ry T
ota
l -->
4,38
20
00
00
0
275

Str
ath
con
a R
egio
nal
Dis
tric
tG
L52
90A
Pag
e :
28
Dat
e :
Jan
30, 2
020
Tim
e :
4:43
pm
Bu
dg
et D
epar
tmen
tal R
epo
rt
Fro
m C
ateg
ory
:10
0To
Cat
ego
ry :
897
Acc
ou
nt
Co
de
:0?
-?-?
??-?
??To
:0?
-?-?
??-?
??
2019
2019
2020
2021
2022
2023
2024
Pre
dic
ted
Val
ues
Bu
dg
et V
alu
eR
eco
mm
end
ed
Bu
dg
etR
eco
mm
end
ed
Bu
dg
etR
eco
mm
end
ed
Bu
dg
etR
eco
mm
end
ed
Bu
dg
etR
eco
mm
end
ed
Bu
dg
etA
cco
un
t C
od
eA
cco
un
t D
escr
ipti
on
CC
1C
C2
CC
3
GE
NE
RA
L R
EV
EN
UE
FU
ND
- S
RD
FE
AS
IBIL
ITY
ST
UD
IES
- E
LE
CT
OR
AL
AR
EA
D
OP
ER
AT
ING
RE
VE
NU
E
RE
QN
ELE
CT
/SP
EC
PR
OV
GO
VT
01-1
-154
-015
00
290
290
290
290
0
SU
RP
LUS
PR
IOR
YE
AR
01-1
-154
-150
38,5
9238
,305
00
00
38,5
92
Tota
l OP
ER
AT
ING
RE
VE
NU
E38
,592
38,5
9238
,305
290
290
290
290
OP
ER
AT
ING
EX
PE
NS
ES
SU
PP
OR
T S
ER
VIC
ES
01-2
-154
-200
250
250
250
250
250
250
250
INS
UR
AN
CE
LIA
BIL
ITY
01-2
-154
-369
4040
4040
4040
37
OT
HE
R P
RO
F F
EE
S01
-2-1
54-3
8738
,302
38,0
150
00
00
Tota
l O
PE
RA
TIN
G E
XP
EN
SE
S28
738
,592
38,3
0529
029
029
029
0
OP
ER
AT
ING
Su
rplu
s/(D
efic
it)
38,3
050
00
00
0
Cat
ego
ry T
ota
l -->
38,3
050
00
00
0
276
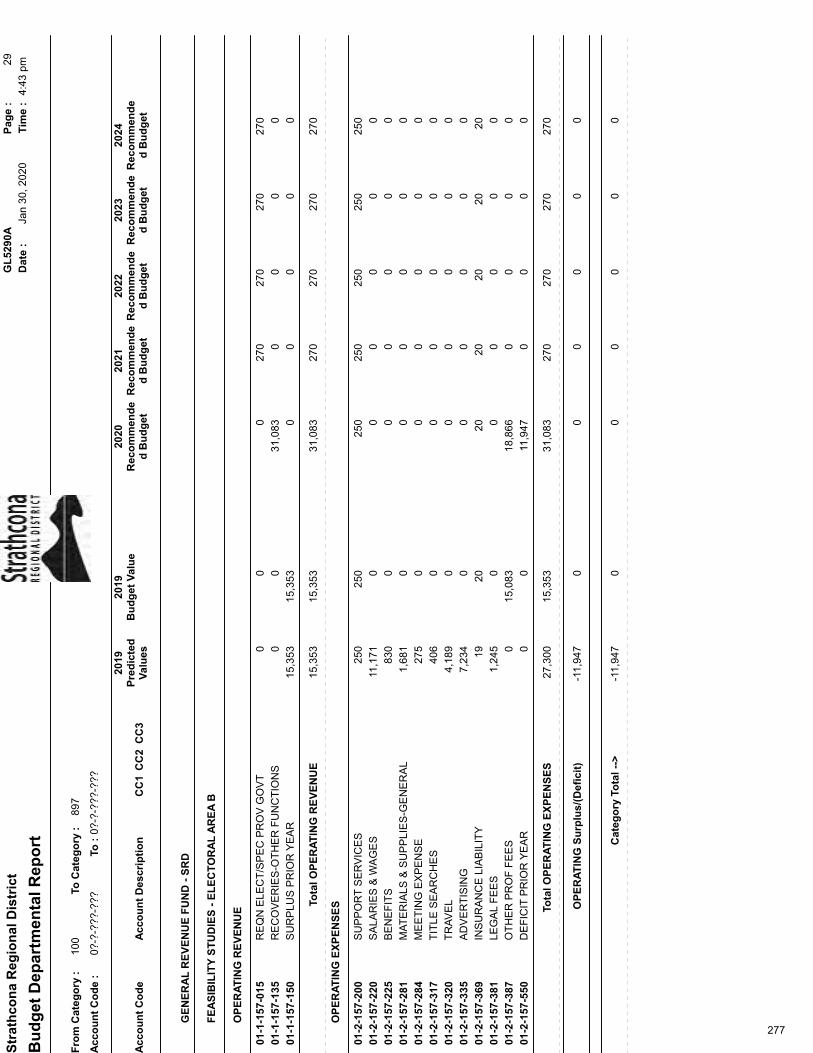
Str
ath
con
a R
egio
nal
Dis
tric
tG
L52
90A
Pag
e :
29
Dat
e :
Jan
30, 2
020
Tim
e :
4:43
pm
Bu
dg
et D
epar
tmen
tal R
epo
rt
Fro
m C
ateg
ory
:10
0To
Cat
ego
ry :
897
Acc
ou
nt
Co
de
:0?
-?-?
??-?
??To
:0?
-?-?
??-?
??
2019
2019
2020
2021
2022
2023
2024
Pre
dic
ted
Val
ues
Bu
dg
et V
alu
eR
eco
mm
end
ed
Bu
dg
etR
eco
mm
end
ed
Bu
dg
etR
eco
mm
end
ed
Bu
dg
etR
eco
mm
end
ed
Bu
dg
etR
eco
mm
end
ed
Bu
dg
etA
cco
un
t C
od
eA
cco
un
t D
escr
ipti
on
CC
1C
C2
CC
3
GE
NE
RA
L R
EV
EN
UE
FU
ND
- S
RD
FE
AS
IBIL
ITY
ST
UD
IES
- E
LE
CT
OR
AL
AR
EA
B
OP
ER
AT
ING
RE
VE
NU
E
RE
QN
ELE
CT
/SP
EC
PR
OV
GO
VT
01-1
-157
-015
00
270
270
270
270
0
RE
CO
VE
RIE
S-O
TH
ER
FU
NC
TIO
NS
01-1
-157
-135
031
,083
00
00
0
SU
RP
LUS
PR
IOR
YE
AR
01-1
-157
-150
15,3
530
00
00
15,3
53
Tota
l OP
ER
AT
ING
RE
VE
NU
E15
,353
15,3
5331
,083
270
270
270
270
OP
ER
AT
ING
EX
PE
NS
ES
SU
PP
OR
T S
ER
VIC
ES
01-2
-157
-200
250
250
250
250
250
250
250
SA
LAR
IES
& W
AG
ES
01-2
-157
-220
00
00
00
11,1
71
BE
NE
FIT
S01
-2-1
57-2
250
00
00
083
0
MA
TE
RIA
LS &
SU
PP
LIE
S-G
EN
ER
AL
01-2
-157
-281
00
00
00
1,68
1
ME
ET
ING
EX
PE
NS
E01
-2-1
57-2
840
00
00
027
5
TIT
LE S
EA
RC
HE
S01
-2-1
57-3
170
00
00
040
6
TR
AV
EL
01-2
-157
-320
00
00
00
4,18
9
AD
VE
RT
ISIN
G01
-2-1
57-3
350
00
00
07,
234
INS
UR
AN
CE
LIA
BIL
ITY
01-2
-157
-369
2020
2020
2020
19
LEG
AL
FE
ES
01-2
-157
-381
00
00
00
1,24
5
OT
HE
R P
RO
F F
EE
S01
-2-1
57-3
8715
,083
18,8
660
00
00
DE
FIC
IT P
RIO
R Y
EA
R01
-2-1
57-5
500
11,9
470
00
00
Tota
l O
PE
RA
TIN
G E
XP
EN
SE
S27
,300
15,3
5331
,083
270
270
270
270
OP
ER
AT
ING
Su
rplu
s/(D
efic
it)
-11,
947
00
00
00
Cat
ego
ry T
ota
l -->
-11,
947
00
00
00
277
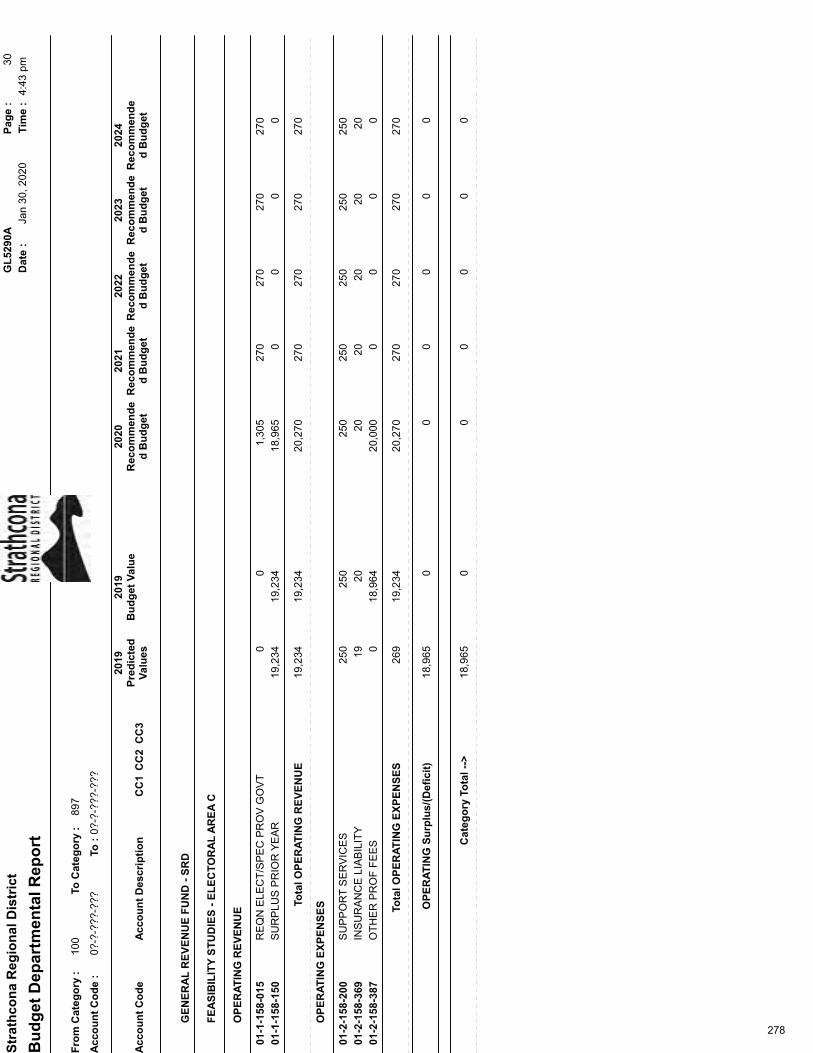
Str
ath
con
a R
egio
nal
Dis
tric
tG
L52
90A
Pag
e :
30
Dat
e :
Jan
30, 2
020
Tim
e :
4:43
pm
Bu
dg
et D
epar
tmen
tal R
epo
rt
Fro
m C
ateg
ory
:10
0To
Cat
ego
ry :
897
Acc
ou
nt
Co
de
:0?
-?-?
??-?
??To
:0?
-?-?
??-?
??
2019
2019
2020
2021
2022
2023
2024
Pre
dic
ted
Val
ues
Bu
dg
et V
alu
eR
eco
mm
end
ed
Bu
dg
etR
eco
mm
end
ed
Bu
dg
etR
eco
mm
end
ed
Bu
dg
etR
eco
mm
end
ed
Bu
dg
etR
eco
mm
end
ed
Bu
dg
etA
cco
un
t C
od
eA
cco
un
t D
escr
ipti
on
CC
1C
C2
CC
3
GE
NE
RA
L R
EV
EN
UE
FU
ND
- S
RD
FE
AS
IBIL
ITY
ST
UD
IES
- E
LE
CT
OR
AL
AR
EA
C
OP
ER
AT
ING
RE
VE
NU
E
RE
QN
ELE
CT
/SP
EC
PR
OV
GO
VT
01-1
-158
-015
01,
305
270
270
270
270
0
SU
RP
LUS
PR
IOR
YE
AR
01-1
-158
-150
19,2
3418
,965
00
00
19,2
34
Tota
l OP
ER
AT
ING
RE
VE
NU
E19
,234
19,2
3420
,270
270
270
270
270
OP
ER
AT
ING
EX
PE
NS
ES
SU
PP
OR
T S
ER
VIC
ES
01-2
-158
-200
250
250
250
250
250
250
250
INS
UR
AN
CE
LIA
BIL
ITY
01-2
-158
-369
2020
2020
2020
19
OT
HE
R P
RO
F F
EE
S01
-2-1
58-3
8718
,964
20,0
000
00
00
Tota
l O
PE
RA
TIN
G E
XP
EN
SE
S26
919
,234
20,2
7027
027
027
027
0
OP
ER
AT
ING
Su
rplu
s/(D
efic
it)
18,9
650
00
00
0
Cat
ego
ry T
ota
l -->
18,9
650
00
00
0
278
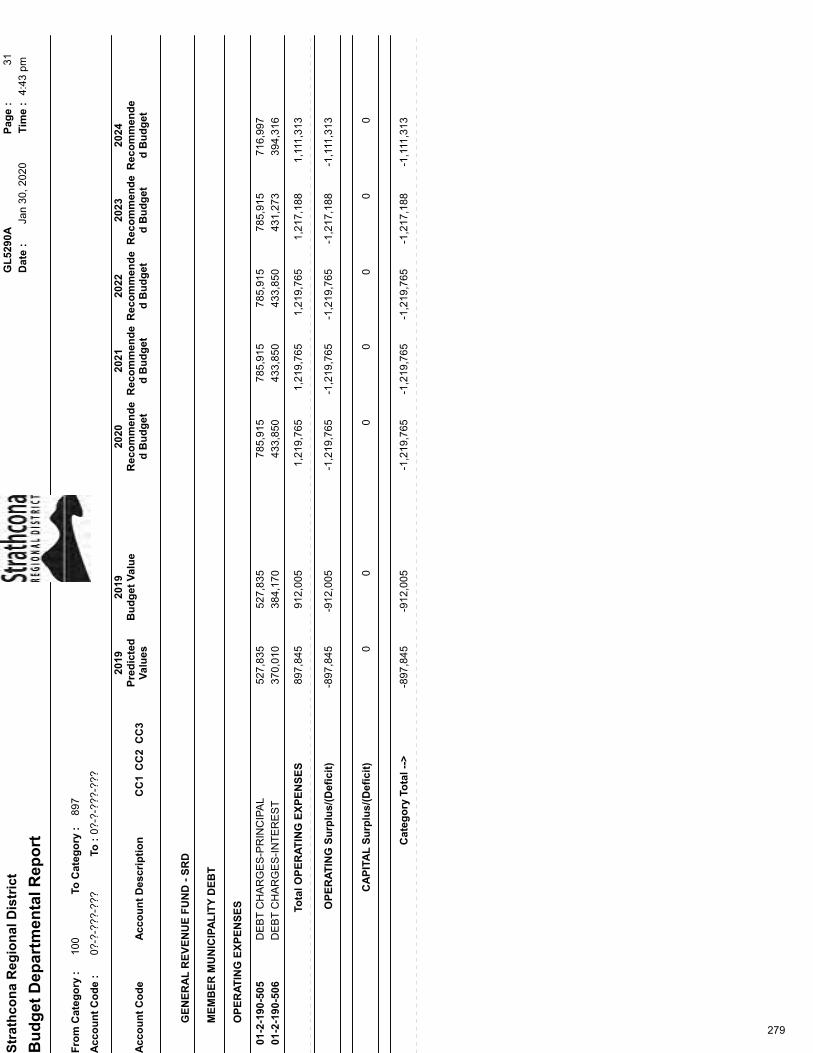
Str
ath
con
a R
egio
nal
Dis
tric
tG
L52
90A
Pag
e :
31
Dat
e :
Jan
30, 2
020
Tim
e :
4:43
pm
Bu
dg
et D
epar
tmen
tal R
epo
rt
Fro
m C
ateg
ory
:10
0To
Cat
ego
ry :
897
Acc
ou
nt
Co
de
:0?
-?-?
??-?
??To
:0?
-?-?
??-?
??
2019
2019
2020
2021
2022
2023
2024
Pre
dic
ted
Val
ues
Bu
dg
et V
alu
eR
eco
mm
end
ed
Bu
dg
etR
eco
mm
end
ed
Bu
dg
etR
eco
mm
end
ed
Bu
dg
etR
eco
mm
end
ed
Bu
dg
etR
eco
mm
end
ed
Bu
dg
etA
cco
un
t C
od
eA
cco
un
t D
escr
ipti
on
CC
1C
C2
CC
3
GE
NE
RA
L R
EV
EN
UE
FU
ND
- S
RD
ME
MB
ER
MU
NIC
IPA
LIT
Y D
EB
T
OP
ER
AT
ING
EX
PE
NS
ES
DE
BT
CH
AR
GE
S-P
RIN
CIP
AL
01-2
-190
-505
527,
835
785,
915
785,
915
785,
915
785,
915
716,
997
527,
835
DE
BT
CH
AR
GE
S-I
NT
ER
ES
T01
-2-1
90-5
0638
4,17
043
3,85
043
3,85
043
3,85
043
1,27
339
4,31
637
0,01
0
Tota
l O
PE
RA
TIN
G E
XP
EN
SE
S89
7,84
591
2,00
51,
219,
765
1,21
9,76
51,
219,
765
1,21
7,18
81,
111,
313
OP
ER
AT
ING
Su
rplu
s/(D
efic
it)
-897
,845
-912
,005
-1,2
19,7
65-1
,219
,765
-1,2
19,7
65-1
,217
,188
-1,1
11,3
13
CA
PIT
AL
Su
rplu
s/(D
efic
it)
00
00
00
0
Cat
ego
ry T
ota
l -->
-897
,845
-912
,005
-1,2
19,7
65-1
,219
,765
-1,2
19,7
65-1
,217
,188
-1,1
11,3
13
279
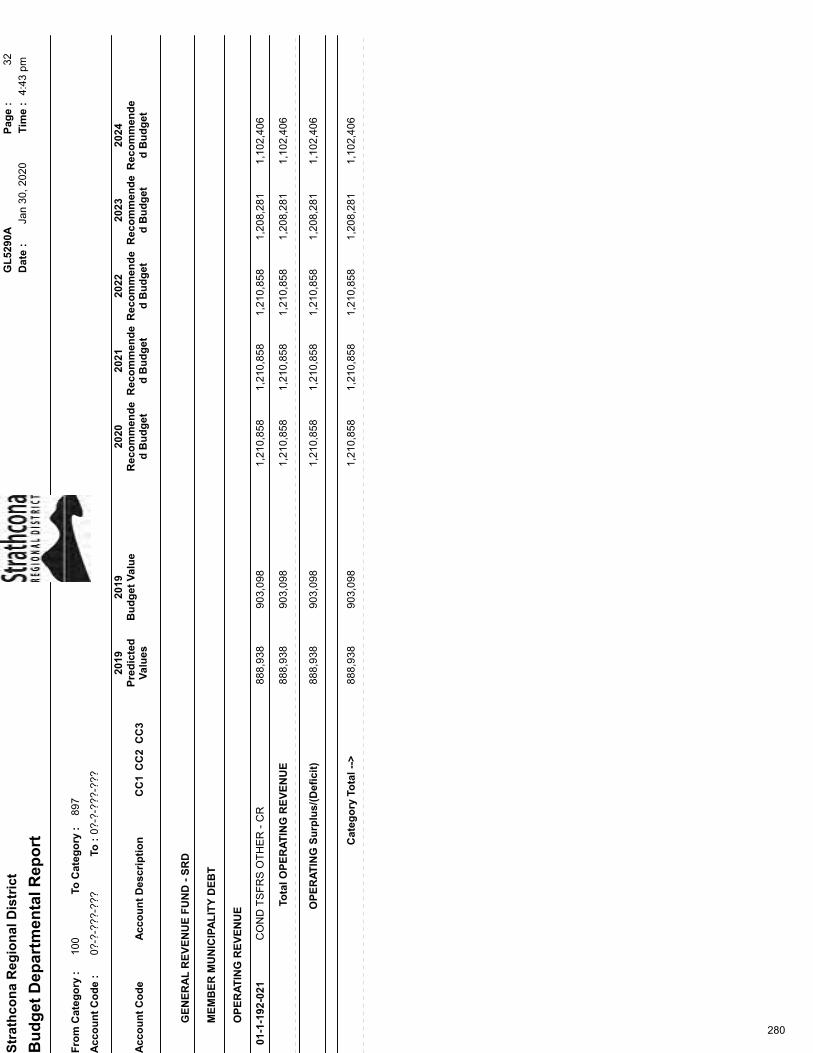
Str
ath
con
a R
egio
nal
Dis
tric
tG
L52
90A
Pag
e :
32
Dat
e :
Jan
30, 2
020
Tim
e :
4:43
pm
Bu
dg
et D
epar
tmen
tal R
epo
rt
Fro
m C
ateg
ory
:10
0To
Cat
ego
ry :
897
Acc
ou
nt
Co
de
:0?
-?-?
??-?
??To
:0?
-?-?
??-?
??
2019
2019
2020
2021
2022
2023
2024
Pre
dic
ted
Val
ues
Bu
dg
et V
alu
eR
eco
mm
end
ed
Bu
dg
etR
eco
mm
end
ed
Bu
dg
etR
eco
mm
end
ed
Bu
dg
etR
eco
mm
end
ed
Bu
dg
etR
eco
mm
end
ed
Bu
dg
etA
cco
un
t C
od
eA
cco
un
t D
escr
ipti
on
CC
1C
C2
CC
3
GE
NE
RA
L R
EV
EN
UE
FU
ND
- S
RD
ME
MB
ER
MU
NIC
IPA
LIT
Y D
EB
T
OP
ER
AT
ING
RE
VE
NU
E
CO
ND
TS
FR
S O
TH
ER
- C
R01
-1-1
92-0
2190
3,09
81,
210,
858
1,21
0,85
81,
210,
858
1,20
8,28
11,
102,
406
888,
938
Tota
l OP
ER
AT
ING
RE
VE
NU
E88
8,93
890
3,09
81,
210,
858
1,21
0,85
81,
210,
858
1,20
8,28
11,
102,
406
OP
ER
AT
ING
Su
rplu
s/(D
efic
it)
888,
938
903,
098
1,21
0,85
81,
210,
858
1,21
0,85
81,
208,
281
1,10
2,40
6
Cat
ego
ry T
ota
l -->
888,
938
903,
098
1,21
0,85
81,
210,
858
1,21
0,85
81,
208,
281
1,10
2,40
6
280
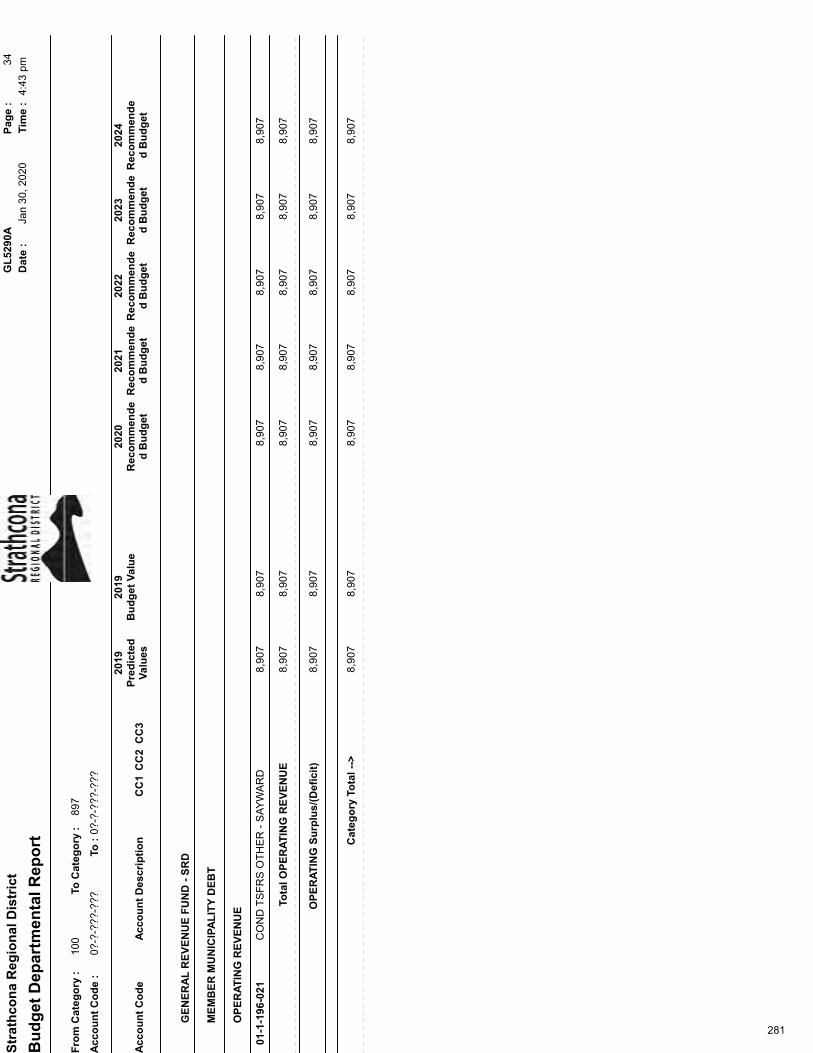
Str
ath
con
a R
egio
nal
Dis
tric
tG
L52
90A
Pag
e :
34
Dat
e :
Jan
30, 2
020
Tim
e :
4:43
pm
Bu
dg
et D
epar
tmen
tal R
epo
rt
Fro
m C
ateg
ory
:10
0To
Cat
ego
ry :
897
Acc
ou
nt
Co
de
:0?
-?-?
??-?
??To
:0?
-?-?
??-?
??
2019
2019
2020
2021
2022
2023
2024
Pre
dic
ted
Val
ues
Bu
dg
et V
alu
eR
eco
mm
end
ed
Bu
dg
etR
eco
mm
end
ed
Bu
dg
etR
eco
mm
end
ed
Bu
dg
etR
eco
mm
end
ed
Bu
dg
etR
eco
mm
end
ed
Bu
dg
etA
cco
un
t C
od
eA
cco
un
t D
escr
ipti
on
CC
1C
C2
CC
3
GE
NE
RA
L R
EV
EN
UE
FU
ND
- S
RD
ME
MB
ER
MU
NIC
IPA
LIT
Y D
EB
T
OP
ER
AT
ING
RE
VE
NU
E
CO
ND
TS
FR
S O
TH
ER
- S
AY
WA
RD
01-1
-196
-021
8,90
78,
907
8,90
78,
907
8,90
78,
907
8,90
7
Tota
l OP
ER
AT
ING
RE
VE
NU
E8,
907
8,90
78,
907
8,90
78,
907
8,90
78,
907
OP
ER
AT
ING
Su
rplu
s/(D
efic
it)
8,90
78,
907
8,90
78,
907
8,90
78,
907
8,90
7
Cat
ego
ry T
ota
l -->
8,90
78,
907
8,90
78,
907
8,90
78,
907
8,90
7
281

Str
ath
con
a R
egio
nal
Dis
tric
tG
L52
90A
Pag
e :
37
Dat
e :
Jan
30, 2
020
Tim
e :
4:43
pm
Bu
dg
et D
epar
tmen
tal R
epo
rt
Fro
m C
ateg
ory
:10
0To
Cat
ego
ry :
897
Acc
ou
nt
Co
de
:0?
-?-?
??-?
??To
:0?
-?-?
??-?
??
2019
2019
2020
2021
2022
2023
2024
Pre
dic
ted
Val
ues
Bu
dg
et V
alu
eR
eco
mm
end
ed
Bu
dg
etR
eco
mm
end
ed
Bu
dg
etR
eco
mm
end
ed
Bu
dg
etR
eco
mm
end
ed
Bu
dg
etR
eco
mm
end
ed
Bu
dg
etA
cco
un
t C
od
eA
cco
un
t D
escr
ipti
on
CC
1C
C2
CC
3
GE
NE
RA
L R
EV
EN
UE
FU
ND
- S
RD
CA
MP
BE
LL
RIV
ER
FIR
E
OP
ER
AT
ING
RE
VE
NU
E
RE
QN
ELE
CT
/SP
EC
PR
OV
GO
VT
01-1
-210
-015
443,
815
475,
000
500,
000
500,
000
500,
000
500,
000
443,
815
SU
RP
LUS
PR
IOR
YE
AR
01-1
-210
-150
1,00
05,
729
00
00
5,39
0
FU
ND
S A
LLO
CA
TE
D F
R A
PP
RO
PR
IAT
ED
SU
RP
LUS
01-1
-210
-151
049
,233
4,96
24,
962
4,96
24,
962
0
Tota
l OP
ER
AT
ING
RE
VE
NU
E44
9,20
544
4,81
552
9,96
250
4,96
250
4,96
250
4,96
250
4,96
2
OP
ER
AT
ING
EX
PE
NS
ES
SU
PP
OR
T S
ER
VIC
ES
01-2
-210
-200
250
250
250
250
250
250
250
MU
NIC
IPA
L C
ON
TR
AC
T01
-2-2
10-2
1639
9,35
350
0,00
050
0,00
050
0,00
050
0,00
050
0,00
039
9,27
9
INS
UR
AN
CE
LIA
BIL
ITY
01-2
-210
-369
4,21
24,
212
4,21
24,
212
4,21
24,
212
3,94
7
LEG
AL
FE
ES
01-2
-210
-381
1,00
050
050
050
050
050
00
OT
HE
R P
RO
F F
EE
S01
-2-2
10-3
870
25,0
000
00
00
CO
NT
RIB
TO
AP
PR
OP
RIA
TE
D S
UR
PLU
S01
-2-2
10-5
1940
,000
00
00
040
,000
Tota
l O
PE
RA
TIN
G E
XP
EN
SE
S44
3,47
644
4,81
552
9,96
250
4,96
250
4,96
250
4,96
250
4,96
2
OP
ER
AT
ING
Su
rplu
s/(D
efic
it)
5,72
90
00
00
0
Cat
ego
ry T
ota
l -->
5,72
90
00
00
0
282