Embed Size (px)
Citation preview

Annual results 2012
Financial performance George Quinn, Group CFO
Business update Michel M. Liès, Group CEO
Today’s agenda
2

Annual results 2012
Financial performance George Quinn, Group CFO
3
Annual results 2012
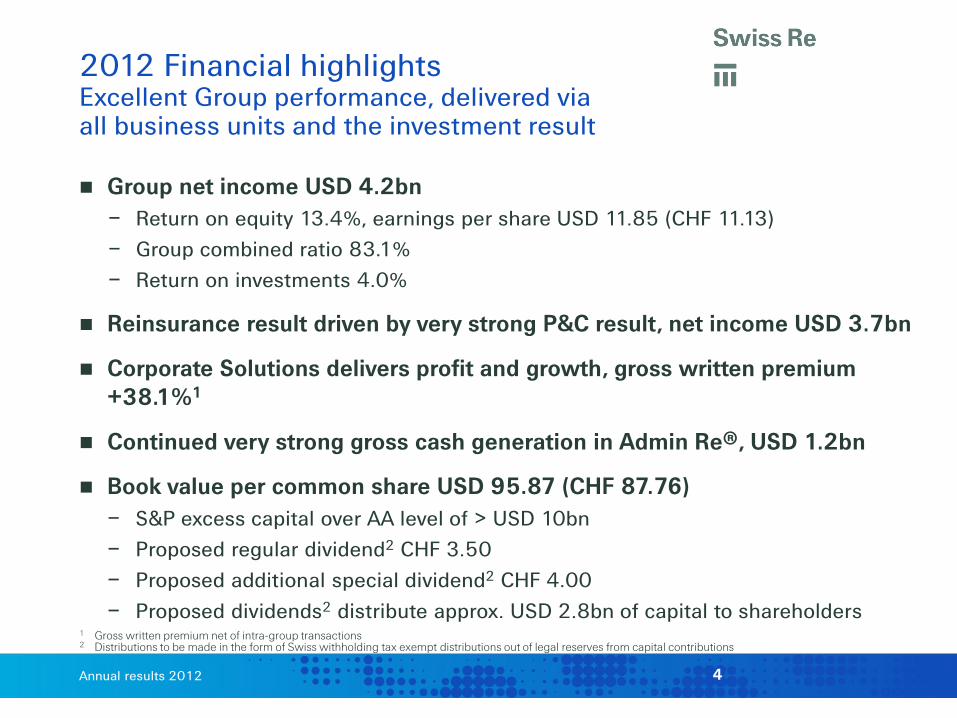
Group net income USD 4.2bn – Return on equity 13.4%, earnings per share USD 11.85 (CHF 11.13) – Group combined ratio 83.1% – Return on investments 4.0%
Reinsurance result driven by very strong P&C result, net income USD 3.7bn
Corporate Solutions delivers profit and growth, gross written premium +38.1%1
Continued very strong gross cash generation in Admin Re®, USD 1.2bn
Book value per common share USD 95.87 (CHF 87.76) – S&P excess capital over AA level of > USD 10bn
– Proposed regular dividend2 CHF 3.50 – Proposed additional special dividend2 CHF 4.00 – Proposed dividends2 distribute approx. USD 2.8bn of capital to shareholders
1 Gross written premium net of intra-group transactions 2 Distributions to be made in the form of Swiss withholding tax exempt distributions out of legal reserves from capital contributions
2012 Financial highlights Excellent Group performance, delivered via all business units and the investment result
4
Annual results 2012
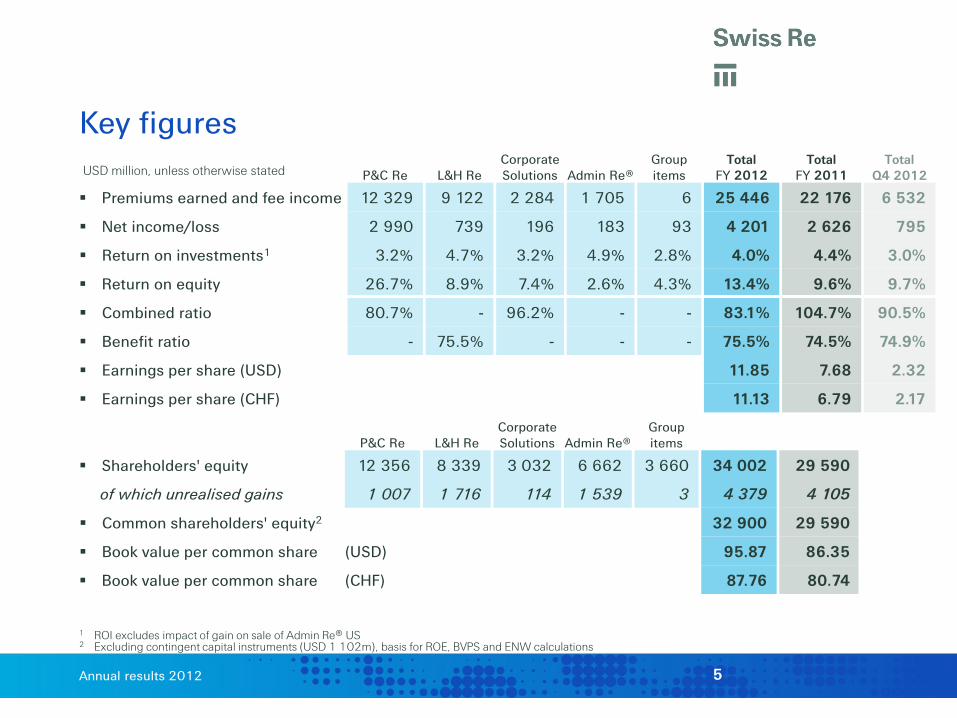
USD million, unless otherwise stated P&C Re L&H Re Corporate Solutions Admin Re®
Group items
Total FY 2012
Total FY 2011
Total Q4 2012
Premiums earned and fee income 12 329 9 122 2 284 1 705 6 25 446 22 176 6 532
Net income/loss 2 990 739 196 183 93 4 201 2 626 795
Return on investments1 3.2% 4.7% 3.2% 4.9% 2.8% 4.0% 4.4% 3.0%
Return on equity 26.7% 8.9% 7.4% 2.6% 4.3% 13.4% 9.6% 9.7%
Combined ratio 80.7% - 96.2% - - 83.1% 104.7% 90.5%
Benefit ratio - 75.5% - - - 75.5% 74.5% 74.9%
Earnings per share (USD) 11.85 7.68 2.32
Earnings per share (CHF) 11.13 6.79 2.17
Key figures
P&C Re L&H Re Corporate Solutions Admin Re®
Group items
Shareholders' equity 12 356 8 339 3 032 6 662 3 660 34 002 29 590
of which unrealised gains 1 007 1 716 114 1 539 3 4 379 4 105
Common shareholders' equity2 32 900 29 590
Book value per common share (USD) 95.87 86.35
Book value per common share (CHF) 87.76 80.74
1 ROI excludes impact of gain on sale of Admin Re® US 2 Excluding contingent capital instruments (USD 1 102m), basis for ROE, BVPS and ENW calculations
5
Annual results 2012
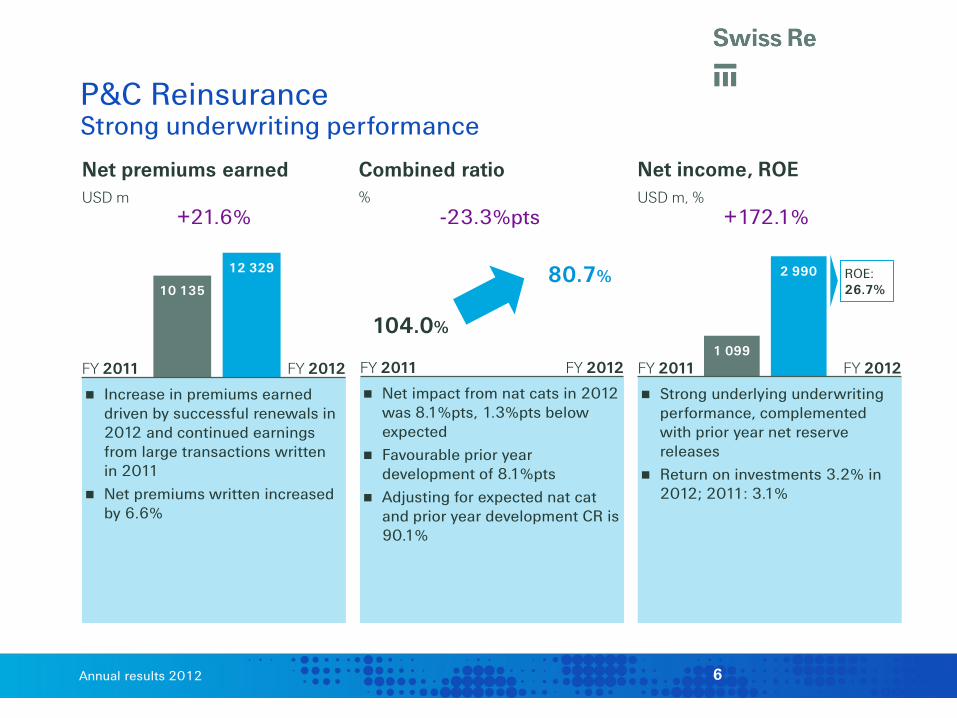
1 099
2 990 10 135
12 329
Net premiums earned USD m
Net income, ROE USD m, %
+21.6%
ROE: 26.7%
Combined ratio %
80.7%
104.0%
-23.3%pts +172.1%
P&C Reinsurance Strong underwriting performance
FY 2011 FY 2012
Increase in premiums earned driven by successful renewals in 2012 and continued earnings from large transactions written in 2011
Net premiums written increased by 6.6%
FY 2011 FY 2012
Net impact from nat cats in 2012 was 8.1%pts, 1.3%pts below expected
Favourable prior year development of 8.1%pts
Adjusting for expected nat cat and prior year development CR is 90.1%
FY 2011 FY 2012
Strong underlying underwriting performance, complemented with prior year net reserve releases
Return on investments 3.2% in 2012; 2011: 3.1%
6
Annual results 2012
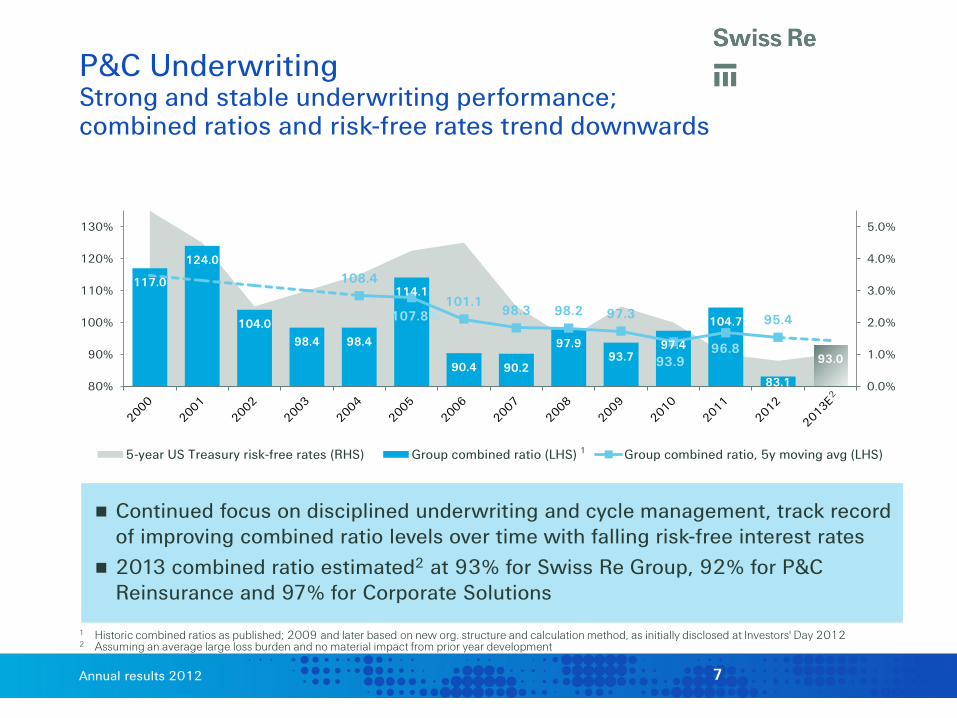
Continued focus on disciplined underwriting and cycle management, track record of improving combined ratio levels over time with falling risk-free interest rates
2013 combined ratio estimated2 at 93% for Swiss Re Group, 92% for P&C Reinsurance and 97% for Corporate Solutions
P&C Underwriting Strong and stable underwriting performance; combined ratios and risk-free rates trend downwards
1 Historic combined ratios as published; 2009 and later based on new org. structure and calculation method, as initially disclosed at Investors' Day 2012 2 Assuming an average large loss burden and no material impact from prior year development
117.0
124.0
104.0
98.4 98.4
114.1
90.4 90.2
97.9 93.7
97.4
104.7
83.1
93.0
108.4
107.8% 101.1
98.3 98.2 97.3
93.9 96.8
95.4
0.0%
1.0%
2.0%
3.0%
4.0%
5.0%
80%
90%
100%
110%
120%
130%
5-year US Treasury risk-free rates (RHS) Group combined ratio (LHS) Group combined ratio, 5y moving avg (LHS)1
7

Annual results 2012
1 664
739
9 948 10 488
Operating revenues USD m
Net income, ROE USD m, %
Benefit ratio1
% +5.4% +1.0%pts
75.5%
74.5%
1 Benefit ratio excludes the impact of VA & pre-2000 GMDB from all periods presented 2 Net realised gains excludes realised gains/losses related to reinsurance transactions (VA, pre-2000 GMDB, B36, etc) of USD -147m, largely contained in the VA,
pre-2000 GMDB, B36 result of USD -83m
ROE: 8.9%
-55.6%
FY 2011 FY 2012
Favourable mortality largely offset by unfavourable morbidity
Adverse results of pre-2004 US business, USD 144m loss; 2011: USD 33m loss
Higher benefit ratio partly due to change in business mix, particularly increase in weighting of new health business
FY 2011 FY 2012 The increase in premium and fee
income is driven by new health business in Europe and Asia and new longevity business in Europe
Premiums earned and fee income increased by 9%; Life grew 3% and Health 23%
Lower investment income due to lower investment yields
FY 2011 FY 2012
Net realised gains (incl. fx)2 of USD 709m significantly lower than in 2011: USD 1 152m
Net inv. income USD 1 365m in 2012; 2011: USD 1 544m
Return on investments 4.7% Exceptional 2011 tax rate (4.9%)
not repeated in 2012 (22.9%)
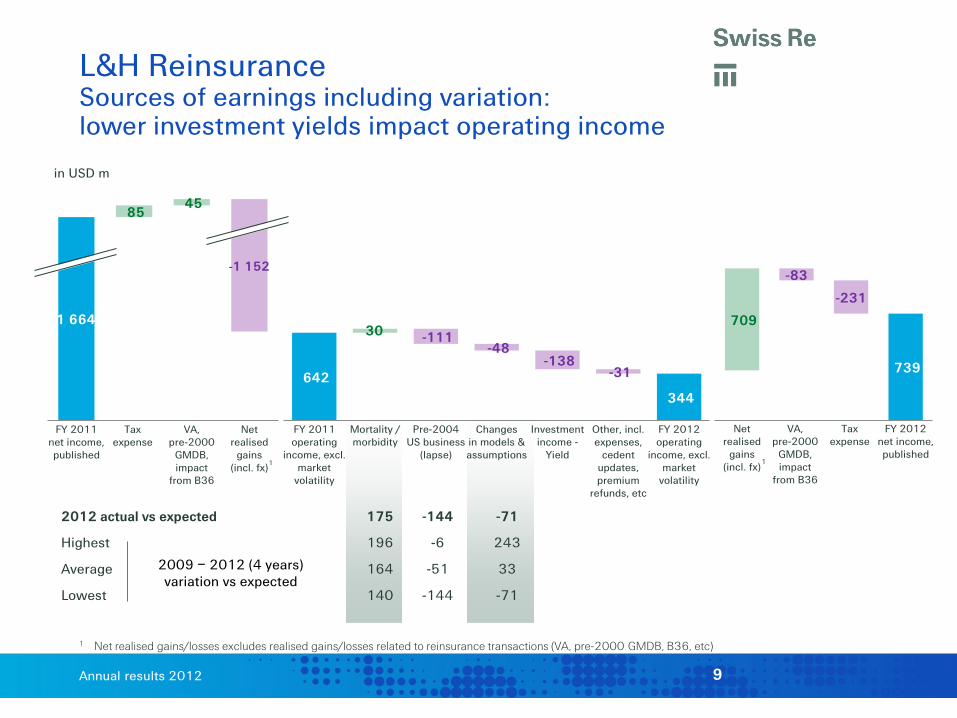
L&H Reinsurance Lower investment return and unfavourable impact of pre-2004 US business
8
Annual results 2012
2012 actual vs expected 175 -144 -71
Highest 196 -6 243
Average 164 -51 33
Lowest 140 -144 -71
L&H Reinsurance Sources of earnings including variation: lower investment yields impact operating income
1 Net realised gains/losses excludes realised gains/losses related to reinsurance transactions (VA, pre-2000 GMDB, B36, etc)
1 664
-1 152
85 45
FY 2011net income,published
Taxexpense
VA,pre-2000
GMDB,impact
from B36
Netrealised
gains(incl. fx)
-83
-231
709
739
Netrealised
gains(incl. fx)
VA,pre-2000
GMDB,impact
from B36
Taxexpense
FY 2012net income,published
in USD m
-111 -48
-138 -31
30
642 344
FY 2011operating
income, excl.market
volatility
Mortality /morbidity
Pre-2004US business
(lapse)
Changesin models &assumptions
Investmentincome -
Yield
Other, incl.expenses,
cedentupdates,premium
refunds, etc
FY 2012operating
income, excl.market
volatility
1 1
2009 – 2012 (4 years) variation vs expected
9
Annual results 2012
81
196
1 929 2 284
Net premiums earned USD m
Combined ratio %
Net income, ROE USD m, %
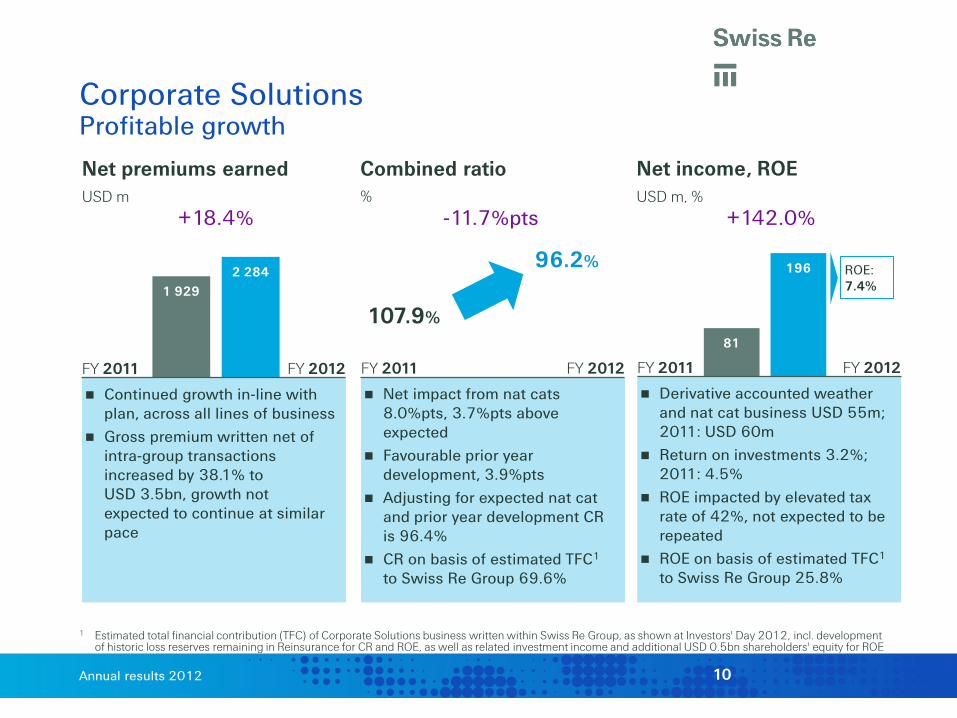
Corporate Solutions Profitable growth
1 Estimated total financial contribution (TFC) of Corporate Solutions business written within Swiss Re Group, as shown at Investors' Day 2012, incl. development of historic loss reserves remaining in Reinsurance for CR and ROE, as well as related investment income and additional USD 0.5bn shareholders' equity for ROE
FY 2011 FY 2012
Net impact from nat cats 8.0%pts, 3.7%pts above expected
Favourable prior year development, 3.9%pts
Adjusting for expected nat cat and prior year development CR is 96.4%
CR on basis of estimated TFC1 to Swiss Re Group 69.6%
FY 2011 FY 2012
Derivative accounted weather and nat cat business USD 55m; 2011: USD 60m
Return on investments 3.2%; 2011: 4.5%
ROE impacted by elevated tax rate of 42%, not expected to be repeated
ROE on basis of estimated TFC1
to Swiss Re Group 25.8%
FY 2011 FY 2012
Continued growth in-line with plan, across all lines of business
Gross premium written net of intra-group transactions increased by 38.1% to USD 3.5bn, growth not expected to continue at similar pace
+18.4%
96.2%
107.9%
-11.7%pts
ROE: 7.4%
+142.0%
10
Annual results 2012
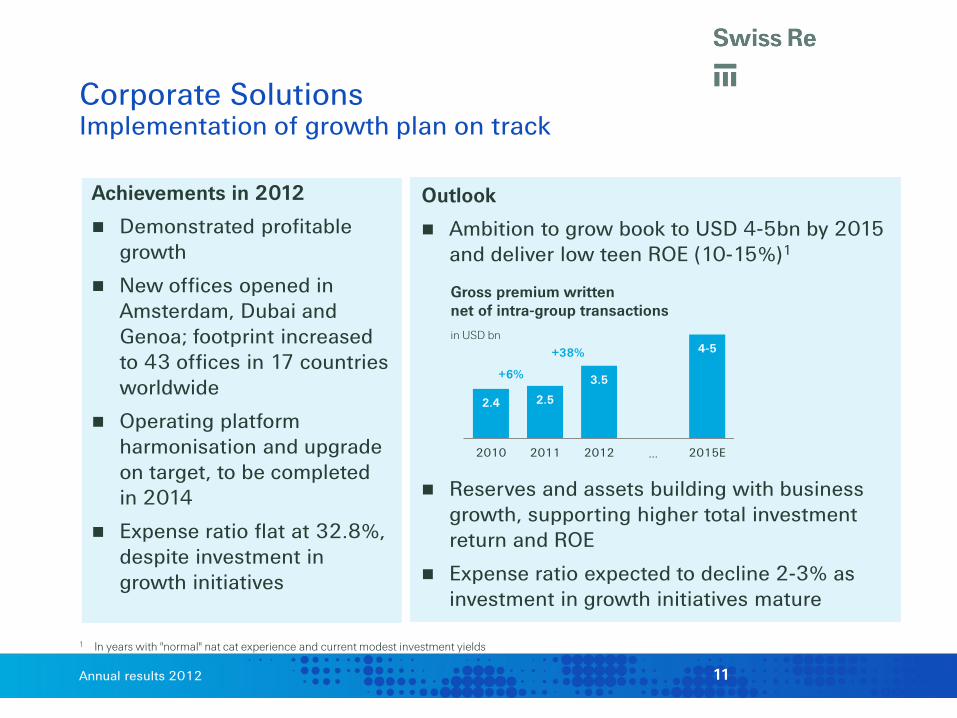
Outlook
Ambition to grow book to USD 4-5bn by 2015 and deliver low teen ROE (10-15%)1
Reserves and assets building with business growth, supporting higher total investment return and ROE
Expense ratio expected to decline 2-3% as investment in growth initiatives mature
Gross premium written net of intra-group transactions in USD bn
2.4 2.5
3.5
4-5
2010 2011 2012 … 2015E
Corporate Solutions Implementation of growth plan on track
1 In years with "normal" nat cat experience and current modest investment yields
+6%
+38%
Achievements in 2012
Demonstrated profitable growth
New offices opened in Amsterdam, Dubai and Genoa; footprint increased to 43 offices in 17 countries worldwide
Operating platform harmonisation and upgrade on target, to be completed in 2014
Expense ratio flat at 32.8%, despite investment in growth initiatives
11
Annual results 2012
Return on investments %
Net income, ROE USD m, %
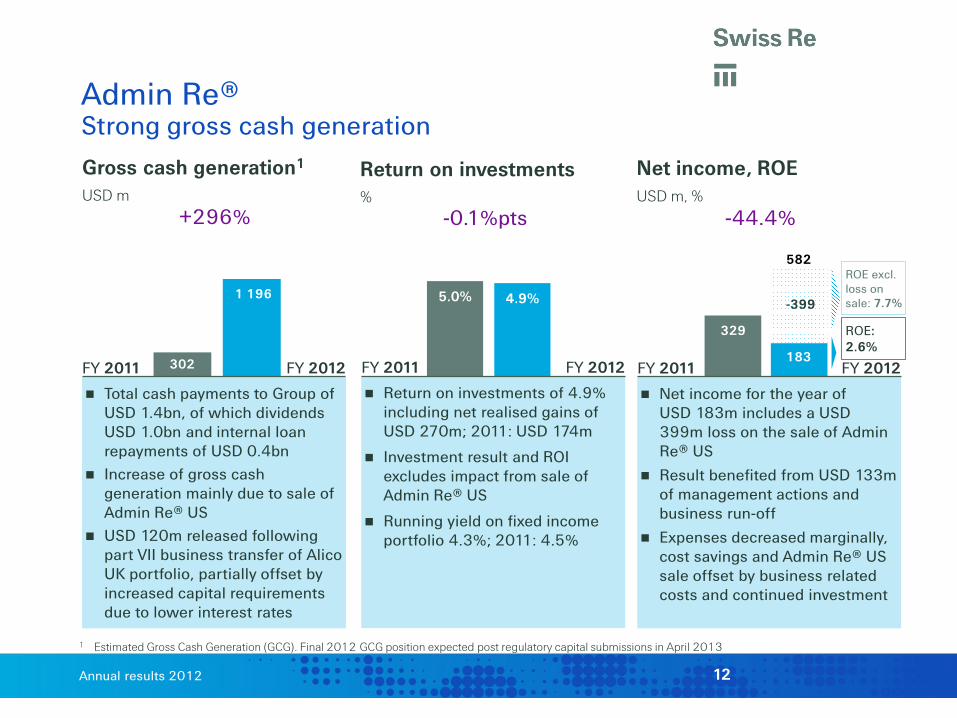
1 Estimated Gross Cash Generation (GCG). Final 2012 GCG position expected post regulatory capital submissions in April 2013
329
183
582
Gross cash generation1
USD m
5.0% 4.9% -399
ROE: 2.6%
ROE excl. loss on sale: 7.7%
Admin Re® Strong gross cash generation
-44.4% -0.1%pts +296%
302
1 196
FY 2011
FY 2012
Total cash payments to Group of USD 1.4bn, of which dividends USD 1.0bn and internal loan repayments of USD 0.4bn
Increase of gross cash generation mainly due to sale of Admin Re® US
USD 120m released following part VII business transfer of Alico UK portfolio, partially offset by increased capital requirements due to lower interest rates
FY 2011
FY 2012
Net income for the year of USD 183m includes a USD 399m loss on the sale of Admin Re® US
Result benefited from USD 133m of management actions and business run-off
Expenses decreased marginally, cost savings and Admin Re® US sale offset by business related costs and continued investment
12
FY 2011
FY 2012
Return on investments of 4.9% including net realised gains of USD 270m; 2011: USD 174m
Investment result and ROI excludes impact from sale of Admin Re® US
Running yield on fixed income portfolio 4.3%; 2011: 4.5%

Annual results 2012
1 050
50 - 140 100 - 150
~2 400 -
~2 500
GCG generated since1 Jan 2012
Revised base case2013-2016E
Operational efficiency& cost management
Active portfoliomanagement
Aspirational2012-2016E
(incl. mgt actions)
Admin Re® gross cash generation Increased forecast 2012-2016
USD m
GCG generated in the year included USD 198m from operational efficiency and cost management, previously within aspirational actions. Aspirational GCG range increased by USD 200m to USD 2.4bn - 2.5bn, due to additional portfolio steering related management actions driven by a change in strategic asset allocation in the UK
Estimated dividends of USD 2.0bn over 2012 - 2016, including USD 0.9bn paid in Q3 2012 following the completion of the sale of Admin Re® US
Future GCG will not be linear and may be negative in particular quarters e.g. due to new deals. Gross cash generation targets will continue to be re-forecast on an annual basis
1 250
Base case 2012 – 2016E
650 Sale of Admin Re® US
As at April 2012 Investors' Day
1 900
998
198
1 196
Base
Mgt. stretch
~2 250
13

Annual results 2012
8.7%
5.4% 4.4% 4.0%
FY 2011
FY 2012
ROI at 4.0%, driven by net investment income from fixed income and realised gains of USD 1 532m; 2011: USD 1 700m
ROI excluding fx of 4.2% in 2012 and 3.7% in 2011
Fixed income running yield of 3.2% for FY 2012 (Q4 2012: 3.1%), compared to 3.6% in FY 2011
123.9 122.8
Group investment result Consistent and strong performance
Total return %
Return on investments %
Avg. invested assets1
USD bn, basis for ROI calculation -0.4%pts -0.9%
1 2011 average assets calculated based on annual average due to new segmental structure
-3.3%pts
FY 2011 FY 2012
Impairments of USD 162m; minimal exposure to peripheral EU government debt USD 19m
Measured re-balancing into corporate bonds: USD 4.1bn and equities USD 0.8bn
Duration largely matched, DV01 USD +0.9m
FY 2011
FY 2012
Total return for FY 2012 impacted by mark-to-market gains from low interest rates, tighter credit spreads and a rise in equity markets
14
Annual results 2012
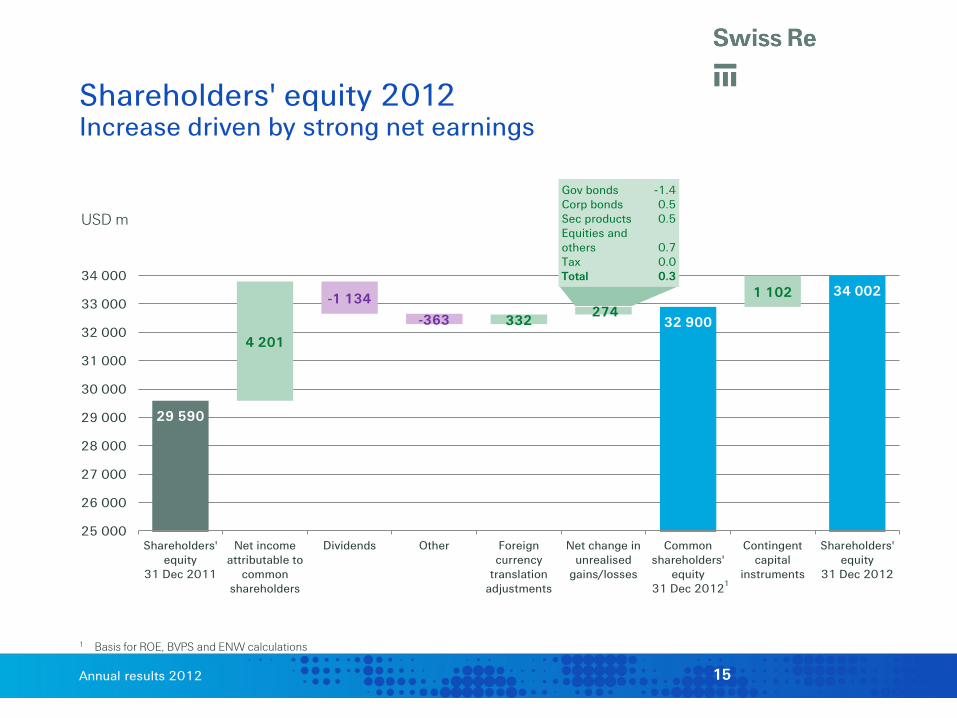
29 590
-1 134
-363
4 201
332 274
1 102
32 900
34 002
25 000
26 000
27 000
28 000
29 000
30 000
31 000
32 000
33 000
34 000
Shareholders'equity
31 Dec 2011
Net incomeattributable to
commonshareholders
Dividends Other Foreigncurrency
translationadjustments
Net change inunrealised
gains/losses
Commonshareholders'
equity31 Dec 2012
Contingentcapital
instruments
Shareholders'equity
31 Dec 2012
Shareholders' equity 2012 Increase driven by strong net earnings
USD m
1
1 Basis for ROE, BVPS and ENW calculations
Gov bonds -1.4 Corp bonds 0.5 Sec products 0.5 Equities and others 0.7 Tax 0.0 Total 0.3
15
Annual results 2012
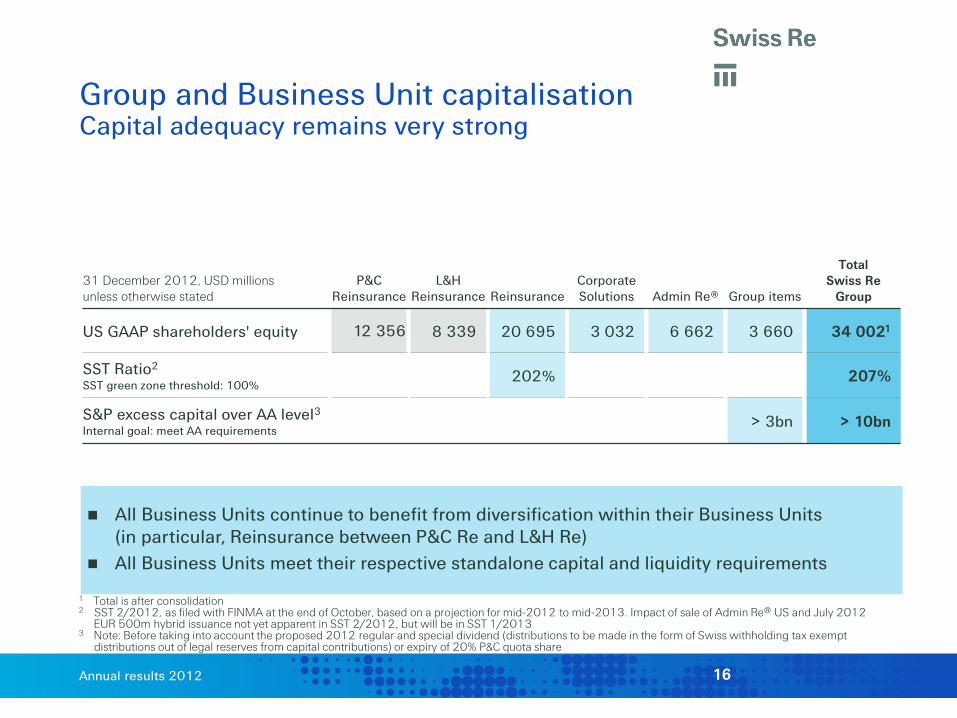
31 December 2012, USD millions unless otherwise stated
P&C Reinsurance
L&H Reinsurance Reinsurance
Corporate Solutions Admin Re® Group items
Total Swiss Re
Group
US GAAP shareholders' equity 12 356 8 339 20 695 3 032 6 662 3 660 34 0021
SST Ratio2
SST green zone threshold: 100% 202% 207%
S&P excess capital over AA level3 Internal goal: meet AA requirements
> 3bn > 10bn
Group and Business Unit capitalisation Capital adequacy remains very strong
All Business Units continue to benefit from diversification within their Business Units (in particular, Reinsurance between P&C Re and L&H Re)
All Business Units meet their respective standalone capital and liquidity requirements
1 Total is after consolidation 2 SST 2/2012, as filed with FINMA at the end of October, based on a projection for mid-2012 to mid-2013. Impact of sale of Admin Re® US and July 2012 EUR 500m hybrid issuance not yet apparent in SST 2/2012, but will be in SST 1/2013 3 Note: Before taking into account the proposed 2012 regular and special dividend (distributions to be made in the form of Swiss withholding tax exempt
distributions out of legal reserves from capital contributions) or expiry of 20% P&C quota share
16
Annual results 2012
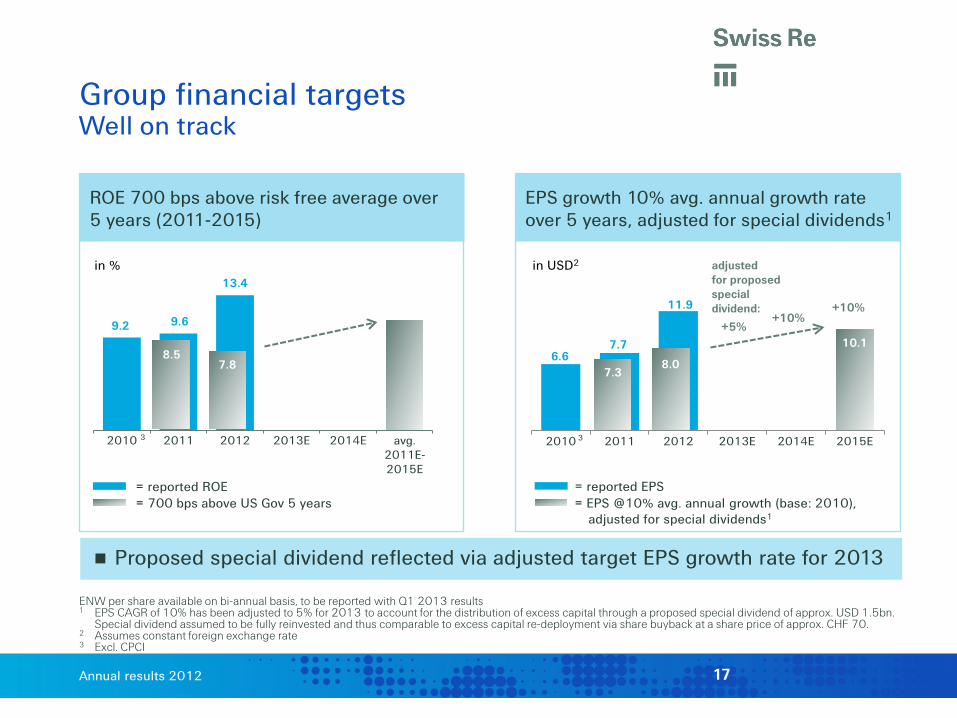
Group financial targets Well on track
ENW per share available on bi-annual basis, to be reported with Q1 2013 results 1 EPS CAGR of 10% has been adjusted to 5% for 2013 to account for the distribution of excess capital through a proposed special dividend of approx. USD 1.5bn.
Special dividend assumed to be fully reinvested and thus comparable to excess capital re-deployment via share buyback at a share price of approx. CHF 70. 2 Assumes constant foreign exchange rate 3 Excl. CPCI
Proposed special dividend reflected via adjusted target EPS growth rate for 2013
= EPS @10% avg. annual growth (base: 2010), adjusted for special dividends1
= reported EPS
in % in USD2
= reported ROE = 700 bps above US Gov 5 years
7.8
9.2 9.6
13.4
2010 2011 2012 2013E 2014E avg.2011E-2015E
3
7.8 8.5 6.6
7.7
11.9
10.1
2010 2011 2012 2013E 2014E 2015E
8.0 7.3
+10% +10%
adjusted for proposed special dividend:
+5%
3
ROE 700 bps above risk free average over 5 years (2011-2015)
EPS growth 10% avg. annual growth rate over 5 years, adjusted for special dividends1
17
Annual results 2012
Business update Michel M. Liès, Group CEO
18
Annual results 2012
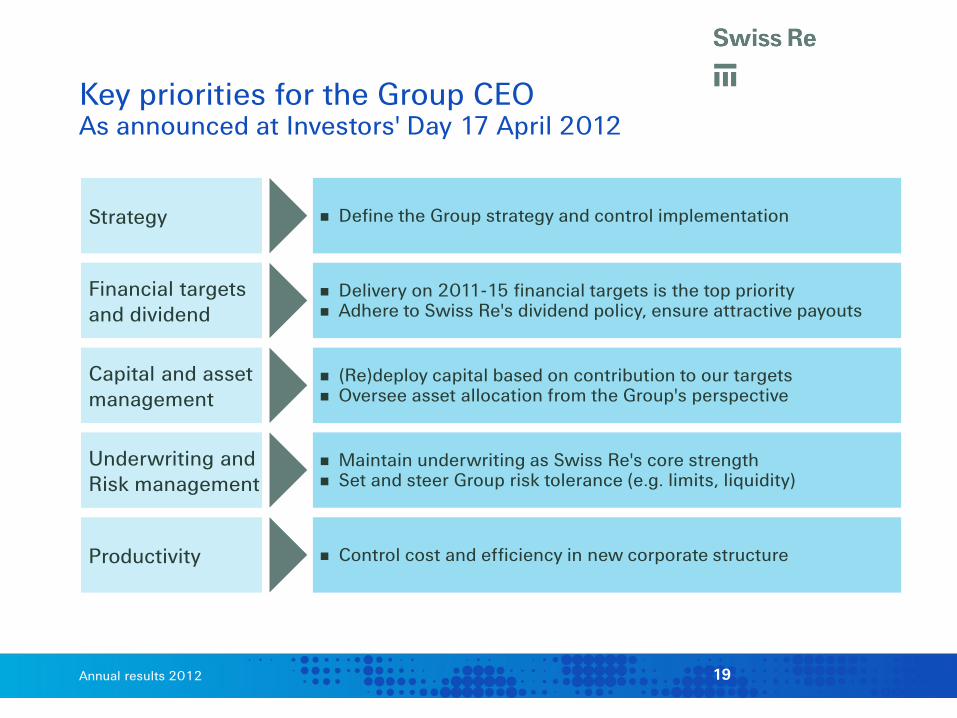
Key priorities for the Group CEO As announced at Investors' Day 17 April 2012
Define the Group strategy and control implementation
Delivery on 2011-15 financial targets is the top priority Adhere to Swiss Re's dividend policy, ensure attractive payouts
(Re)deploy capital based on contribution to our targets Oversee asset allocation from the Group's perspective
Control cost and efficiency in new corporate structure
Underwriting and Risk management
Maintain underwriting as Swiss Re's core strength Set and steer Group risk tolerance (e.g. limits, liquidity)
Capital and asset management
Financial targets and dividend
Strategy
Productivity
19
Annual results 2012
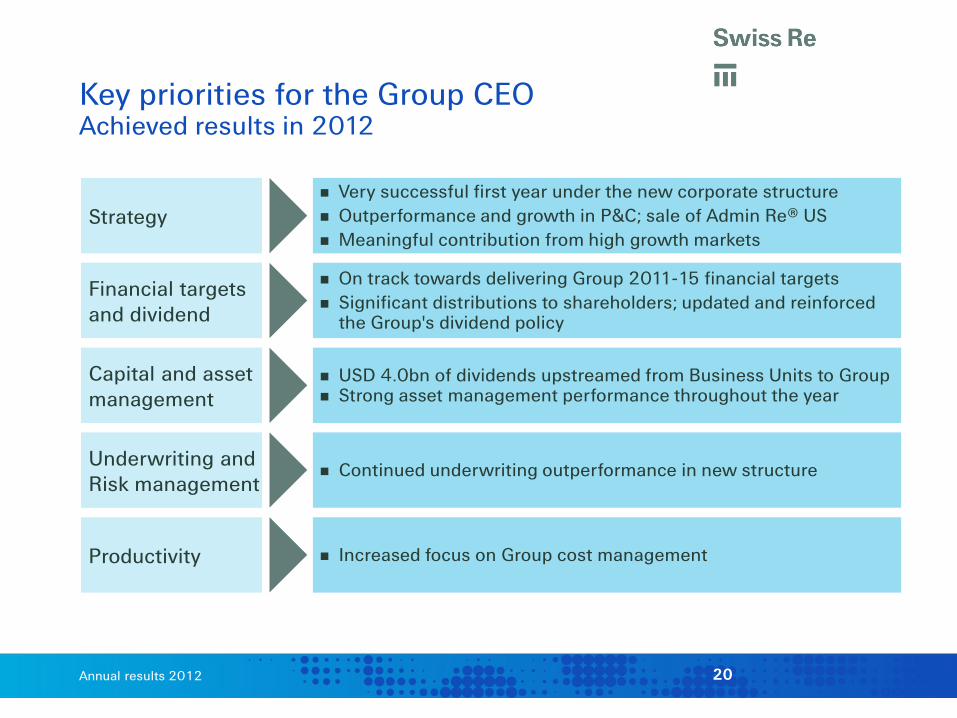
Key priorities for the Group CEO Achieved results in 2012
Very successful first year under the new corporate structure Outperformance and growth in P&C; sale of Admin Re® US Meaningful contribution from high growth markets
On track towards delivering Group 2011-15 financial targets Significant distributions to shareholders; updated and reinforced
the Group's dividend policy
USD 4.0bn of dividends upstreamed from Business Units to Group Strong asset management performance throughout the year
Increased focus on Group cost management
Underwriting and Risk management
Continued underwriting outperformance in new structure
Capital and asset management
Financial targets and dividend
Strategy
Productivity
20

Annual results 2012
100%
111%
Up for renewal1 Jan 2013
Growth Estimatedoutcome
P&C Re: January 2013 treaty renewals Successful renewals leading to profitable growth
Gross premium volume1
USD 9.3bn
USD 8.4bn
January renewals: 11% top line growth driven by structured solutions and solvency relief transactions in Europe and the Americas
11%
1 Note: Volume is shown on a gross basis, hence the impact from the P&C quota share is not visible 2 USD 2.9bn multi-year transactions written in January 2012 are not up for renewal in January 2013
USD 0.9bn
High growth markets (HGM)
– Lower solvency-related cessions in China led to reduction in premium volumes
– Outside of China, HGM premium grew to approx. USD 0.7bn
– Strongest growth rates achieved in emerging Asia (67%) ex China, Africa (48%) and Latin America (35%)
2
21
Annual results 2012
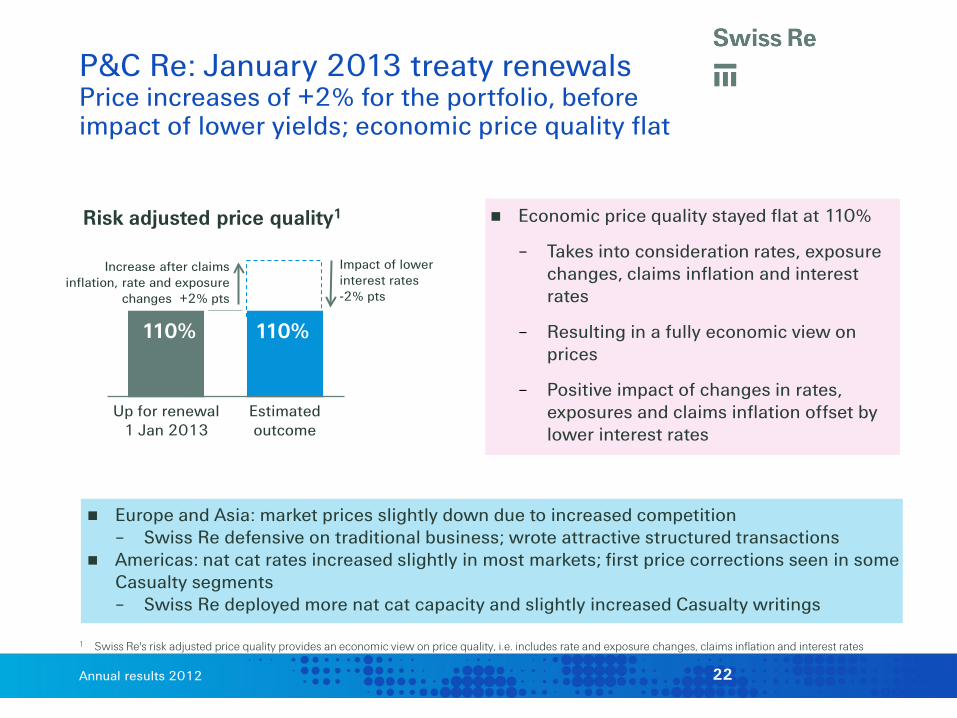
110% 110%
Up for renewal1 Jan 2013
Estimatedoutcome
P&C Re: January 2013 treaty renewals Price increases of +2% for the portfolio, before impact of lower yields; economic price quality flat
Europe and Asia: market prices slightly down due to increased competition – Swiss Re defensive on traditional business; wrote attractive structured transactions
Americas: nat cat rates increased slightly in most markets; first price corrections seen in some Casualty segments – Swiss Re deployed more nat cat capacity and slightly increased Casualty writings
Risk adjusted price quality1
1 Swiss Re's risk adjusted price quality provides an economic view on price quality, i.e. includes rate and exposure changes, claims inflation and interest rates
Economic price quality stayed flat at 110%
– Takes into consideration rates, exposure changes, claims inflation and interest rates
– Resulting in a fully economic view on prices
– Positive impact of changes in rates, exposures and claims inflation offset by lower interest rates
Impact of lower interest rates -2% pts
Increase after claims inflation, rate and exposure
changes +2% pts
22
Annual results 2012
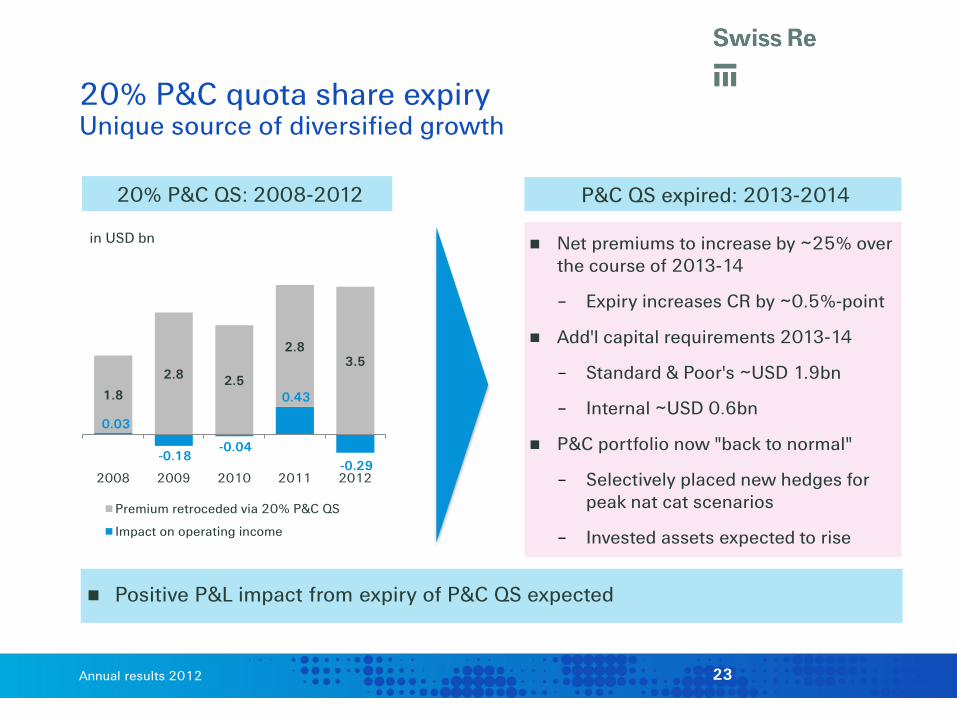
20% P&C quota share expiry Unique source of diversified growth
in USD bn
Positive P&L impact from expiry of P&C QS expected
Net premiums to increase by ~25% over the course of 2013-14
– Expiry increases CR by ~0.5%-point
Add'l capital requirements 2013-14
– Standard & Poor's ~USD 1.9bn
– Internal ~USD 0.6bn
P&C portfolio now "back to normal"
– Selectively placed new hedges for peak nat cat scenarios
– Invested assets expected to rise
20% P&C QS: 2008-2012 P&C QS expired: 2013-2014
0.03
-0.18 -0.04
0.43
-0.29
1.8
2.8 2.5
2.8 3.5
2008 2009 2010 2011 2012
Premium retroceded via 20% P&C QS
Impact on operating income
23
Annual results 2012
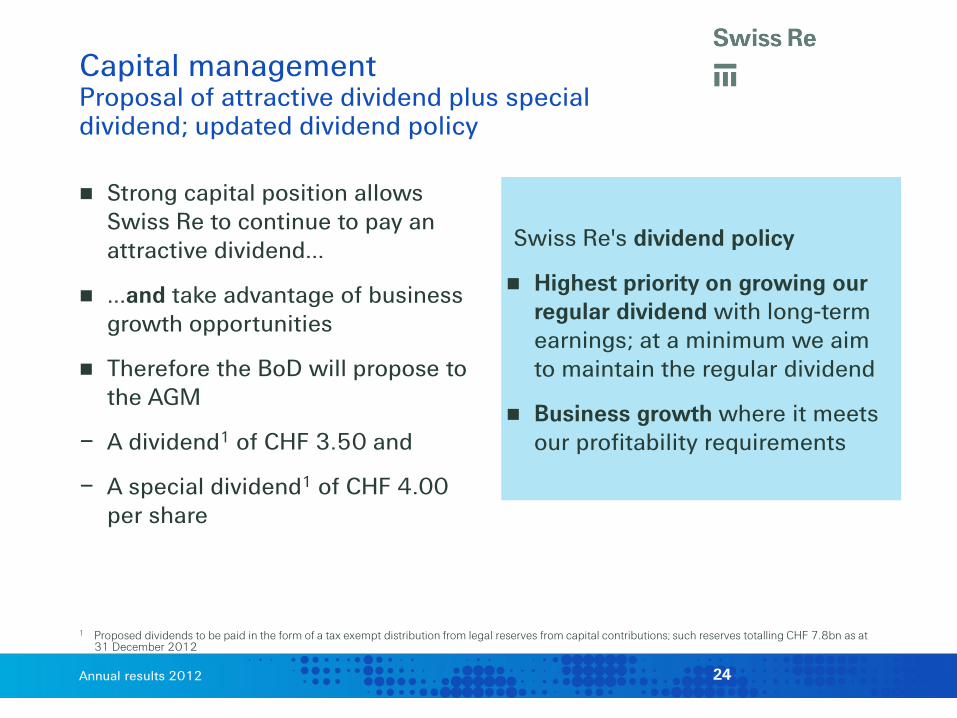
Strong capital position allows Swiss Re to continue to pay an attractive dividend…
…and take advantage of business growth opportunities
Therefore the BoD will propose to the AGM
– A dividend1 of CHF 3.50 and
– A special dividend1 of CHF 4.00 per share
Swiss Re's dividend policy
Highest priority on growing our regular dividend with long-term earnings; at a minimum we aim to maintain the regular dividend
Business growth where it meets our profitability requirements
Capital management Proposal of attractive dividend plus special dividend; updated dividend policy
1 Proposed dividends to be paid in the form of a tax exempt distribution from legal reserves from capital contributions; such reserves totalling CHF 7.8bn as at 31 December 2012
24
Annual results 2012
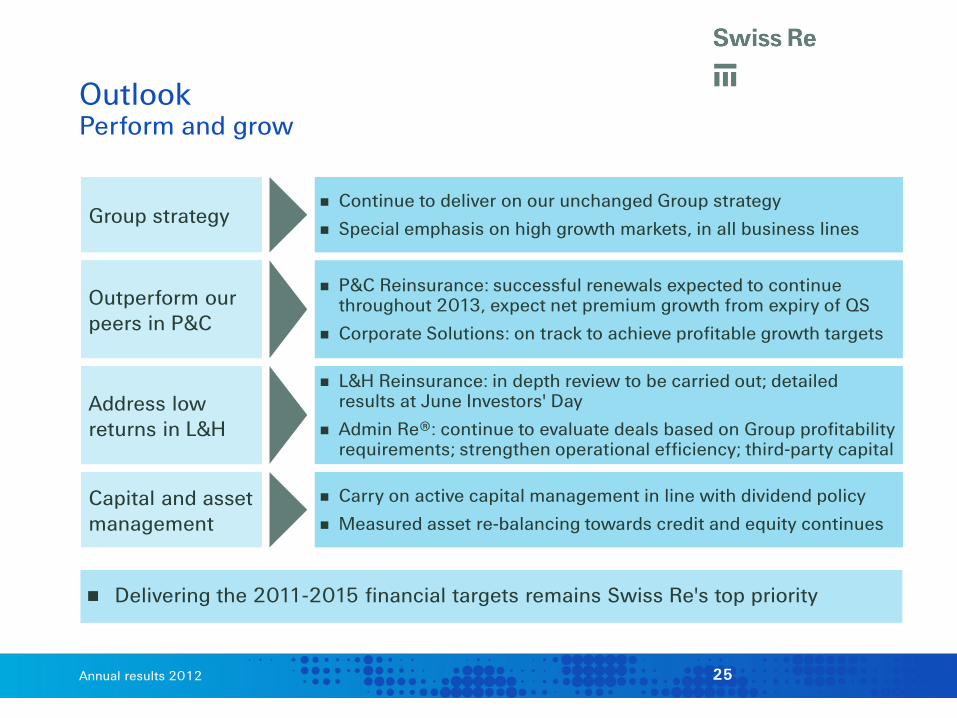
Outlook Perform and grow
Address low returns in L&H
L&H Reinsurance: in depth review to be carried out; detailed results at June Investors' Day
Admin Re®: continue to evaluate deals based on Group profitability requirements; strengthen operational efficiency; third-party capital
P&C Reinsurance: successful renewals expected to continue throughout 2013, expect net premium growth from expiry of QS
Corporate Solutions: on track to achieve profitable growth targets
Outperform our peers in P&C
Continue to deliver on our unchanged Group strategy
Special emphasis on high growth markets, in all business lines Group strategy
Delivering the 2011-2015 financial targets remains Swiss Re's top priority
Carry on active capital management in line with dividend policy
Measured asset re-balancing towards credit and equity continues Capital and asset management
25

Annual results 2012
Appendix
26
Annual results 2012
Appendix
Business segment results 2012 – P&L
Business segment results 2012 – Balance sheet
Shareholders' equity and ROE Q4 2012
Shareholders' equity and ROE 2012
Expected nat cat premiums and claims
Nat cat and large man-made claims
P&C Re – Underwriting performance
L&H Re – Income break-down
L&H Re – Q4 sources of earnings including variation
Corporate Solutions – Underwriting performance
Group items
Other assets/liabilities
Net investment income
Net realised gains/losses
Net unrealised gains/losses
Return on investments basis
Return on investments (ROI)
Overall investment portfolio
Fixed income securities
Government bonds
Corporate bonds
Securitised products
Equities and Alternative Investments
Investment mix and mid-term plan
Sensitivities
Shareholders' equity Q4 2012
Swiss Re's capital structure
Proposed capital motions for AGM 2013
Number of shares
Premiums by country
Exchange rates
Corporate calendar & contacts
Cautionary note on forward-looking statements
27

Annual results 2012
USD millions Re-
insurance P&C Re L&H Re Corporate Solutions
Admin Re®
Group items
Consoli-dation
Total FY 2012
Total FY 2011
Total Q4 2012
Revenues Premiums earned 21 379 12 329 9 050 2 284 992 6 - 24 661 21 300 6 390 Fee income from policyholders 72 - 72 - 713 - - 785 876 142 Net investment income/loss – non participating 2 816
1 451
1 365
109
1 548
18 -18
4 473 4 626 1 010
Net realised investment gains/losses – non participating 821
259
562
142
-89
73 -
947 1 634 54
Net investment result – unit-linked and with-profit 222
-
222
-
2 348
- -
2 570 -403 618
Other revenues 96 95 1 1 3 385 -297 188 50 4 Total revenues 25 406 14 134 11 272 2 536 5 515 482 -315 33 624 28 083 8 218 Expenses Claims and claim adjustment expenses -6 306 -6 306 - -1 448 - -14 5 -7 763 -8 810 -2 263 Life and health benefits -6 787 - -6 787 - -2 086 - -5 -8 878 -8 414 -2 221 Return credited to policyholders -271 - -271 - -2 688 - - -2 959 -61 -776 Acquisition costs -4 103 -2 316 -1 787 -300 -142 -3 - -4 548 -4 021 -1 083 Other expenses -2 158 -1 325 -833 -449 -457 -403 250 -3 217 -3 051 -867 Interest expenses -697 -111 -586 - -53 -51 65 -736 -851 -182 Total expenses -20 322 -10 058 -10 264 -2 197 -5 426 -471 -315 -28 101 -25 208 -7 392 Income before income tax expenses 5 084 4 076 1 008 339 89 11 - 5 523 2 875 826 Income tax expense/benefit -1 165 -934 -231 -143 101 82 - -1 125 -77 -13 Net income/loss before attribution of non-controlling interests 3 919
3 142
777
196
190
93 -
4 398 2 798 813
Income attributable to non-controlling interests -134
-134
-
-
-7
- -
-141 -172 -1
Net income/loss after attribution of non-controlling interests 3 785
3 008
777
196
183
93 -
4 257 2 626 812
Interest on contingent capital instruments -56 -18 -38 - - - - -56 0 -17 Net income/loss attributable to common shareholders 3 729
2 990
739
196
183
93 -
4 201 2 626 795
Business segment results 2012 Profit and loss statement
28
Annual results 2012
31 December 2012, USD millions Re-
insurance P&C Re L&H Re Corporate Solutions
Admin Re®
Group items
Consoli-dation
FY 2012
FY 2011
Assets
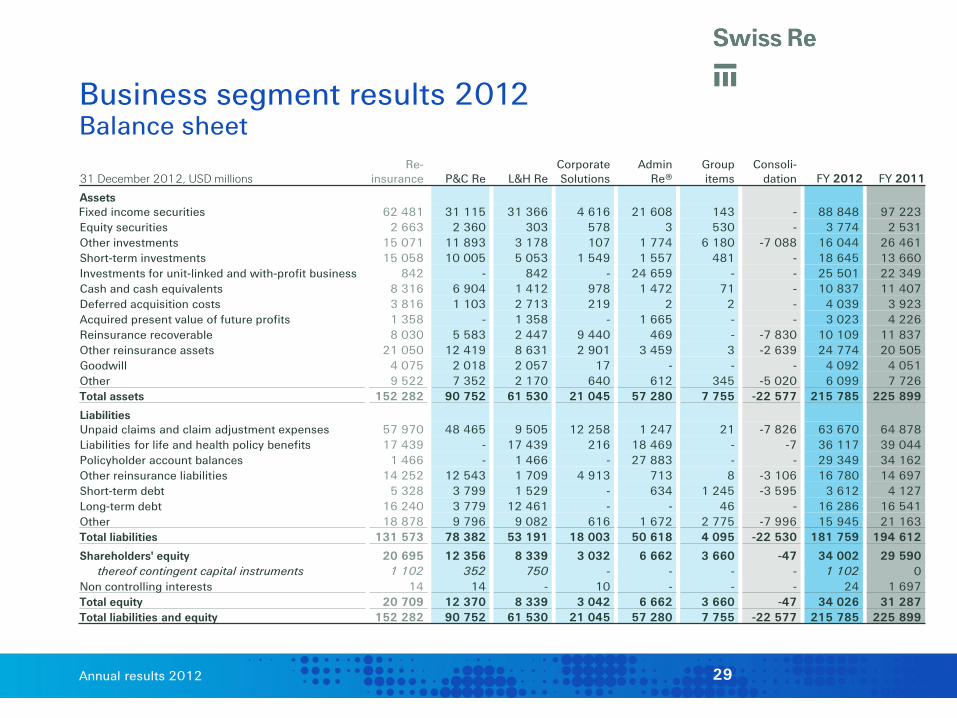
Fixed income securities 62 481 31 115 31 366 4 616 21 608 143 - 88 848 97 223 Equity securities 2 663 2 360 303 578 3 530 - 3 774 2 531 Other investments 15 071 11 893 3 178 107 1 774 6 180 -7 088 16 044 26 461 Short-term investments 15 058 10 005 5 053 1 549 1 557 481 - 18 645 13 660 Investments for unit-linked and with-profit business 842 - 842 - 24 659 - - 25 501 22 349 Cash and cash equivalents 8 316 6 904 1 412 978 1 472 71 - 10 837 11 407 Deferred acquisition costs 3 816 1 103 2 713 219 2 2 - 4 039 3 923 Acquired present value of future profits 1 358 - 1 358 - 1 665 - - 3 023 4 226 Reinsurance recoverable 8 030 5 583 2 447 9 440 469 - -7 830 10 109 11 837 Other reinsurance assets 21 050 12 419 8 631 2 901 3 459 3 -2 639 24 774 20 505 Goodwill 4 075 2 018 2 057 17 - - - 4 092 4 051 Other 9 522 7 352 2 170 640 612 345 -5 020 6 099 7 726 Total assets 152 282 90 752 61 530 21 045 57 280 7 755 -22 577 215 785 225 899
Liabilities Unpaid claims and claim adjustment expenses
64 878 57 970 48 465 9 505 12 258 1 247 21 -7 826 63 670
Liabilities for life and health policy benefits 17 439 - 17 439 216 18 469 - -7 36 117 39 044 Policyholder account balances 1 466 - 1 466 - 27 883 - - 29 349 34 162 Other reinsurance liabilities 14 252 12 543 1 709 4 913 713 8 -3 106 16 780 14 697 Short-term debt 5 328 3 799 1 529 - 634 1 245 -3 595 3 612 4 127 Long-term debt 16 240 3 779 12 461 - - 46 - 16 286 16 541 Other 18 878 9 796 9 082 616 1 672 2 775 -7 996 15 945 21 163 Total liabilities 131 573 78 382 53 191 18 003 50 618 4 095 -22 530 181 759 194 612
Shareholders' equity 20 695 12 356 8 339 3 032 6 662 3 660 -47 34 002 29 590 thereof contingent capital instruments 1 102 352 750 - - - - 1 102 0
Non controlling interests 14 14 - 10 - - - 24 1 697 Total equity 20 709 12 370 8 339 3 042 6 662 3 660 -47 34 026 31 287 Total liabilities and equity 152 282 90 752 61 530 21 045 57 280 7 755 -22 577 215 785 225 899
Business segment results 2012 Balance sheet
29
Annual results 2012
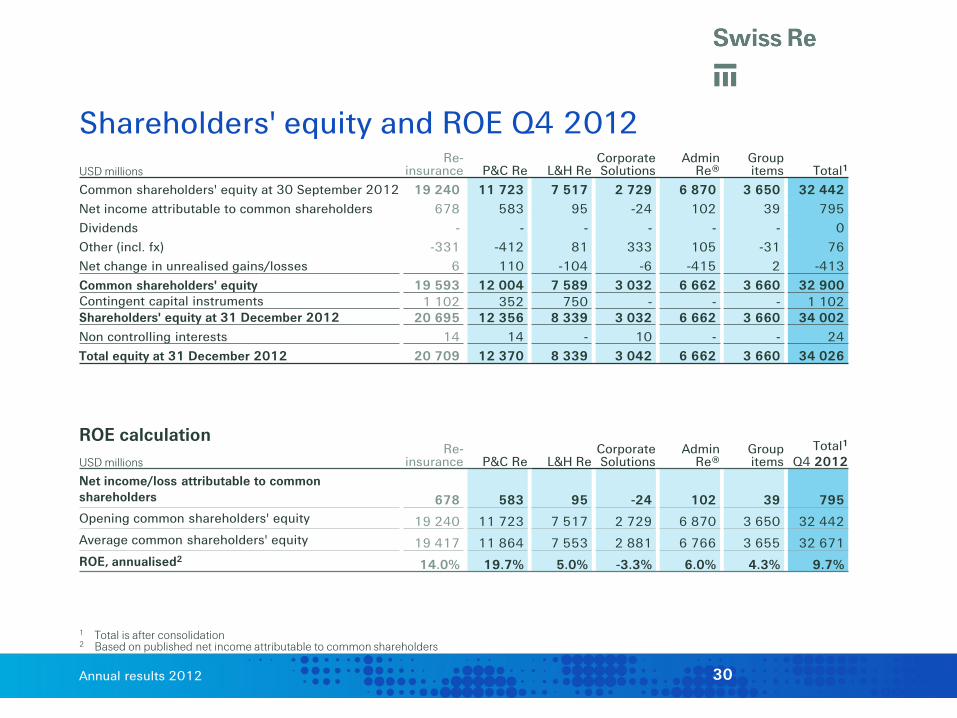
Shareholders' equity and ROE Q4 2012
ROE calculation USD millions
Re-
insurance
P&C Re L&H Re Corporate Solutions
Admin
Re® Group items
Total1 Q4 2012
Net income/loss attributable to common shareholders 678 583 95 -24 102 39 795 Opening common shareholders' equity 19 240 11 723 7 517 2 729 6 870 3 650 32 442 Average common shareholders' equity 19 417 11 864 7 553 2 881 6 766 3 655 32 671 ROE, annualised2 14.0% 19.7% 5.0% -3.3% 6.0% 4.3% 9.7%
1 Total is after consolidation 2 Based on published net income attributable to common shareholders
USD millions Re-
insurance P&C Re L&H Re Corporate Solutions
Admin Re®
Group items
Total1
Common shareholders' equity at 30 September 2012 19 240 11 723 7 517 2 729 6 870 3 650 32 442 Net income attributable to common shareholders 678 583 95 -24 102 39 795 Dividends - - - - - - 0 Other (incl. fx) -331 -412 81 333 105 -31 76 Net change in unrealised gains/losses 6 110 -104 -6 -415 2 -413 Common shareholders' equity 19 593 12 004 7 589 3 032 6 662 3 660 32 900 Contingent capital instruments 1 102 352 750 - - - 1 102 Shareholders' equity at 31 December 2012 20 695 12 356 8 339 3 032 6 662 3 660 34 002 Non controlling interests 14 14 - 10 - - 24 Total equity at 31 December 2012 20 709 12 370 8 339 3 042 6 662 3 660 34 026
30
Annual results 2012
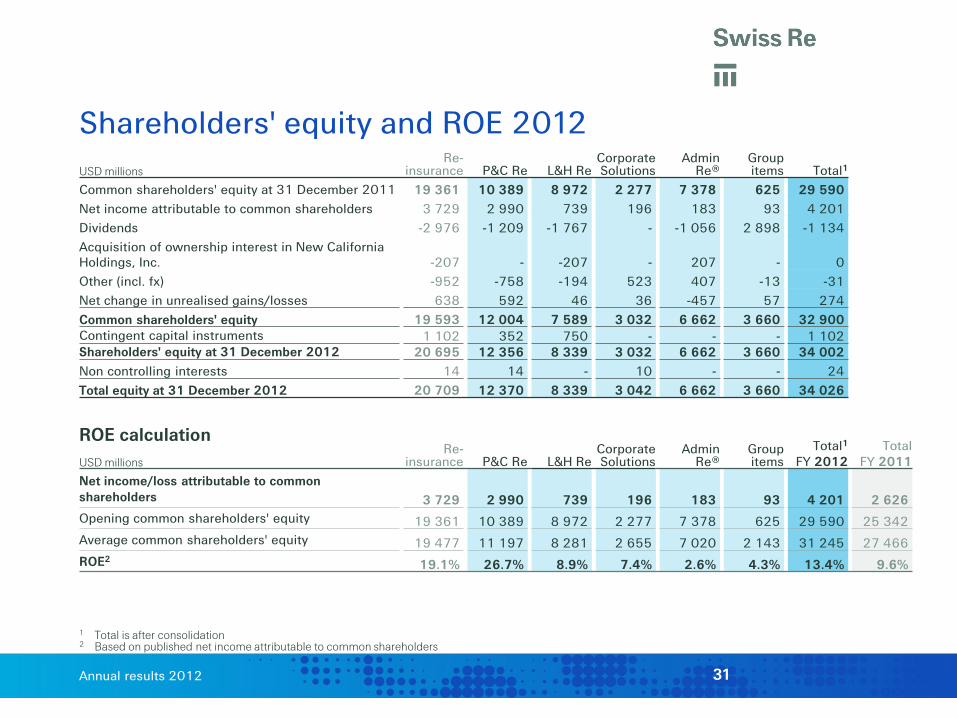
Shareholders' equity and ROE 2012
ROE calculation USD millions
Re-
insurance
P&C Re L&H Re Corporate Solutions
Admin
Re® Group items
Total1 FY 2012
Total FY 2011
Net income/loss attributable to common shareholders 3 729 2 990 739 196 183 93 4 201 2 626 Opening common shareholders' equity 19 361 10 389 8 972 2 277 7 378 625 29 590 25 342 Average common shareholders' equity 19 477 11 197 8 281 2 655 7 020 2 143 31 245 27 466 ROE2 19.1% 26.7% 8.9% 7.4% 2.6% 4.3% 13.4% 9.6%
1 Total is after consolidation 2 Based on published net income attributable to common shareholders
USD millions Re-
insurance P&C Re L&H Re Corporate Solutions
Admin Re®
Group items
Total1
Common shareholders' equity at 31 December 2011 19 361 10 389 8 972 2 277 7 378 625 29 590 Net income attributable to common shareholders 3 729 2 990 739 196 183 93 4 201 Dividends -2 976 -1 209 -1 767 - -1 056 2 898 -1 134 Acquisition of ownership interest in New California Holdings, Inc. -207 - -207 - 207 - 0 Other (incl. fx) -952 -758 -194 523 407 -13 -31 Net change in unrealised gains/losses 638 592 46 36 -457 57 274 Common shareholders' equity 19 593 12 004 7 589 3 032 6 662 3 660 32 900 Contingent capital instruments 1 102 352 750 - - - 1 102 Shareholders' equity at 31 December 2012 20 695 12 356 8 339 3 032 6 662 3 660 34 002 Non controlling interests 14 14 - 10 - - 24 Total equity at 31 December 2012 20 709 12 370 8 339 3 042 6 662 3 660 34 026
31
Annual results 2012
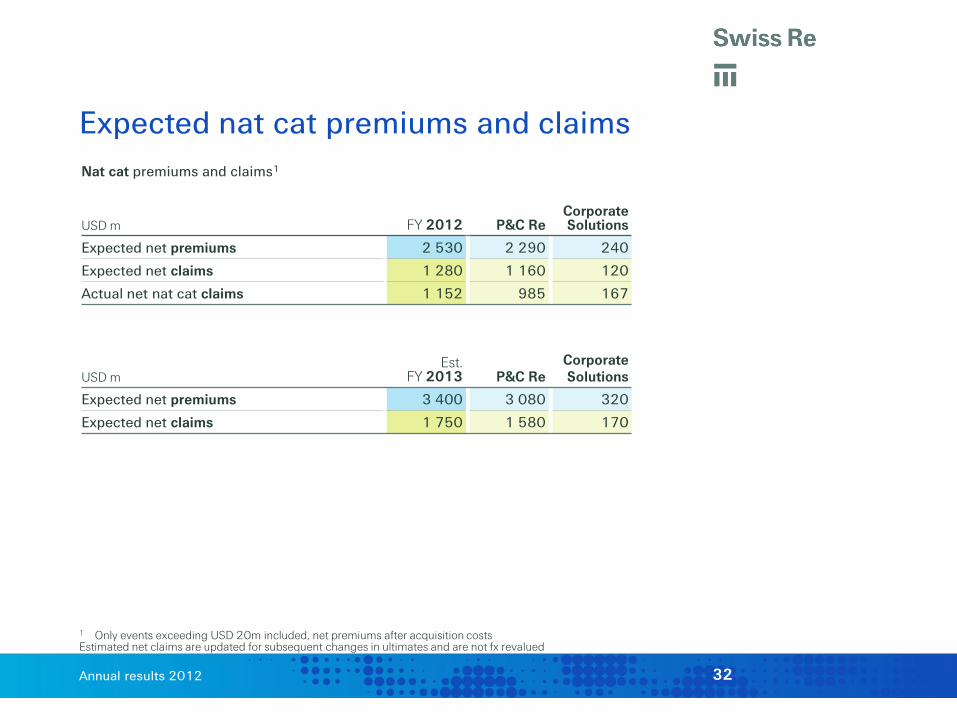
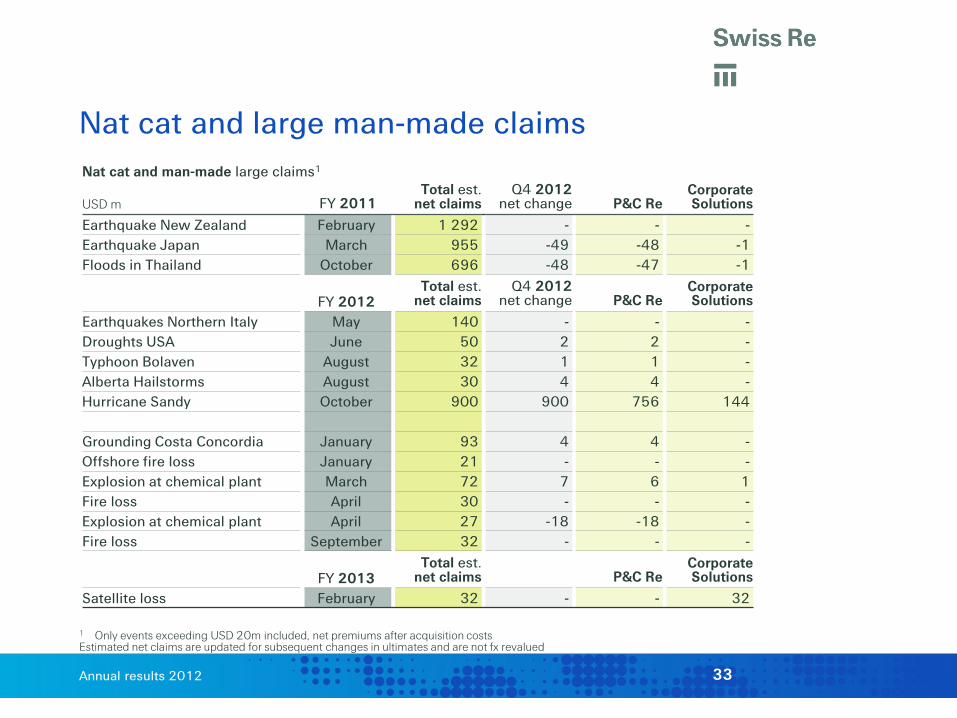
1 Only events exceeding USD 20m included, net premiums after acquisition costs Estimated net claims are updated for subsequent changes in ultimates and are not fx revalued
Expected nat cat premiums and claims Nat cat premiums and claims1
P&C Re Corporate Solutions USD m FY 2012
Expected net premiums 2 530
2 290 240
Expected net claims 1 280 1 160 120
Actual net nat cat claims 1 152 985 167
USD m Est.
FY 2013 P&C Re Corporate Solutions
Expected net premiums 3 400 3 080 320
Expected net claims 1 750 1 580 170
32
Annual results 2012
1 Only events exceeding USD 20m included, net premiums after acquisition costs Estimated net claims are updated for subsequent changes in ultimates and are not fx revalued
Nat cat and large man-made claims Nat cat and man-made large claims1
USD m FY 2011 Total est.
net claims Q4 2012
net change P&C Re Corporate Solutions
Earthquake New Zealand February 1 292 - - - Earthquake Japan March 955 -49 -48 -1 Floods in Thailand October 696 -48 -47 -1
FY 2012
Total est. net claims
Q4 2012 net change P&C Re
Corporate Solutions
Earthquakes Northern Italy May 140 - - - Droughts USA June 50 2 2 - Typhoon Bolaven August 32 1 1 - Alberta Hailstorms August 30 4 4 - Hurricane Sandy October 900 900 756 144
Grounding Costa Concordia January 93 4 4 - Offshore fire loss January 21 - - - Explosion at chemical plant March 72 7 6 1 Fire loss April 30 - - - Explosion at chemical plant April 27 -18 -18 - Fire loss September 32 - - -
FY 2013
Total est. net claims P&C Re
Corporate Solutions
Satellite loss February 32 - - 32
33
Annual results 2012
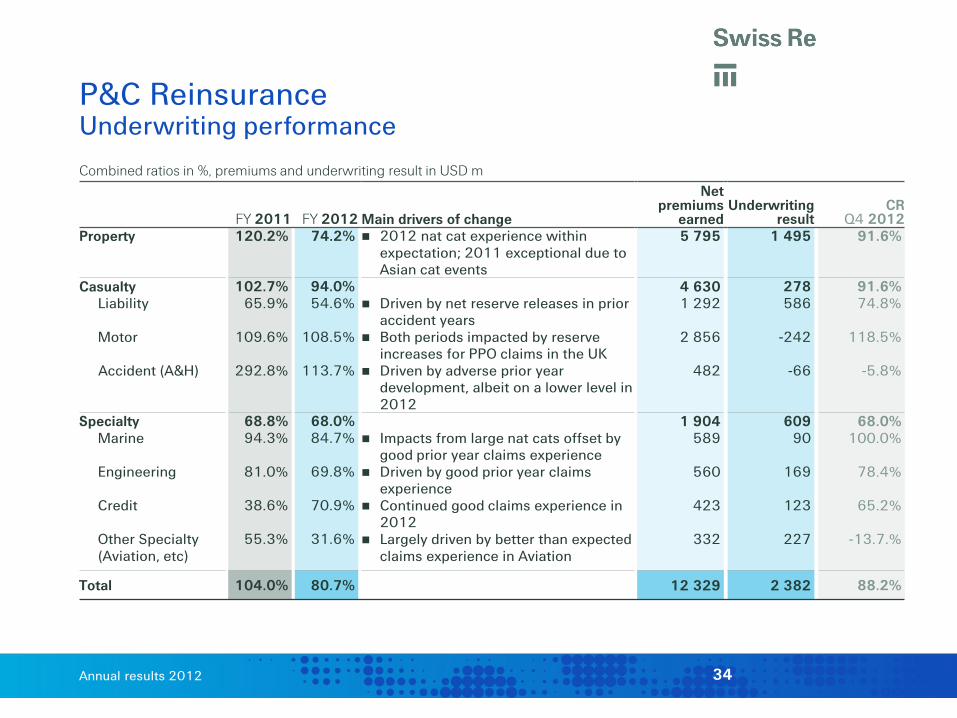
Combined ratios in %, premiums and underwriting result in USD m
FY 2011 FY 2012 Main drivers of change
Net premiums
earned Underwriting
result CR
Q4 2012 Property 120.2% 74.2% 2012 nat cat experience within
expectation; 2011 exceptional due to Asian cat events
5 795 1 495 91.6%
Casualty Liability Motor Accident (A&H)
102.7% 65.9%
109.6%
292.8%
94.0% 54.6%
108.5%
113.7%
Driven by net reserve releases in prior
accident years Both periods impacted by reserve
increases for PPO claims in the UK Driven by adverse prior year
development, albeit on a lower level in 2012
4 630 1 292
2 856
482
278 586
-242
-66
91.6% 74.8%
118.5%
-5.8%
Specialty Marine
Engineering Credit Other Specialty (Aviation, etc)
68.8% 94.3%
81.0%
38.6%
55.3%
68.0% 84.7%
69.8%
70.9%
31.6%
Impacts from large nat cats offset by
good prior year claims experience Driven by good prior year claims
experience Continued good claims experience in
2012 Largely driven by better than expected
claims experience in Aviation
1 904 589
560
423
332
609 90
169
123
227
68.0% 100.0%
78.4%
65.2%
-13.7.%
Total 104.0% 80.7% 12 329 2 382 88.2%
P&C Reinsurance Underwriting performance
34
Annual results 2012
L&H Re Income break-down
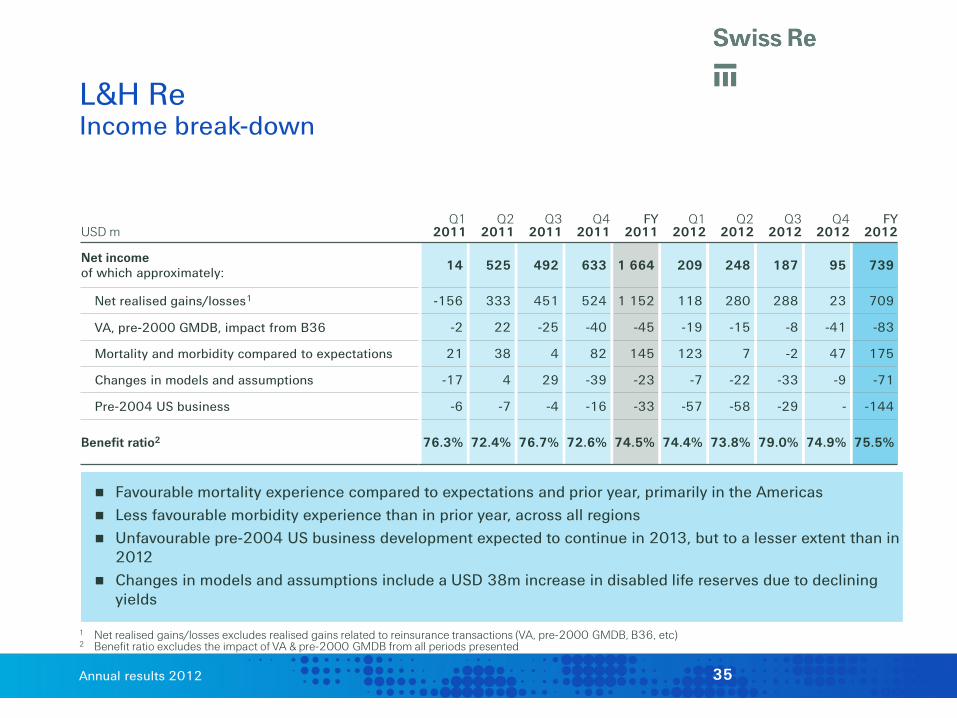
1 Net realised gains/losses excludes realised gains related to reinsurance transactions (VA, pre-2000 GMDB, B36, etc) 2 Benefit ratio excludes the impact of VA & pre-2000 GMDB from all periods presented
Favourable mortality experience compared to expectations and prior year, primarily in the Americas Less favourable morbidity experience than in prior year, across all regions Unfavourable pre-2004 US business development expected to continue in 2013, but to a lesser extent than in
2012 Changes in models and assumptions include a USD 38m increase in disabled life reserves due to declining
yields
USD m Q1
2011 Q2
2011 Q3
2011 Q4
2011 FY
2011 Q1
2012 Q2
2012 Q3
2012 Q4
2012 FY
2012
Net income of which approximately: 14 525 492 633 1 664 209 248 187 95 739
Net realised gains/losses1 -156 333 451 524 1 152 118 280 288 23 709
VA, pre-2000 GMDB, impact from B36 -2 22 -25 -40 -45 -19 -15 -8 -41 -83
Mortality and morbidity compared to expectations 21 38 4 82 145 123 7 -2 47 175
Changes in models and assumptions -17 4 29 -39 -23 -7 -22 -33 -9 -71
Pre-2004 US business -6 -7 -4 -16 -33 -57 -58 -29 - -144
Benefit ratio2 76.3% 72.4% 76.7% 72.6% 74.5% 74.4% 73.8% 79.0% 74.9% 75.5%
35
Annual results 2012
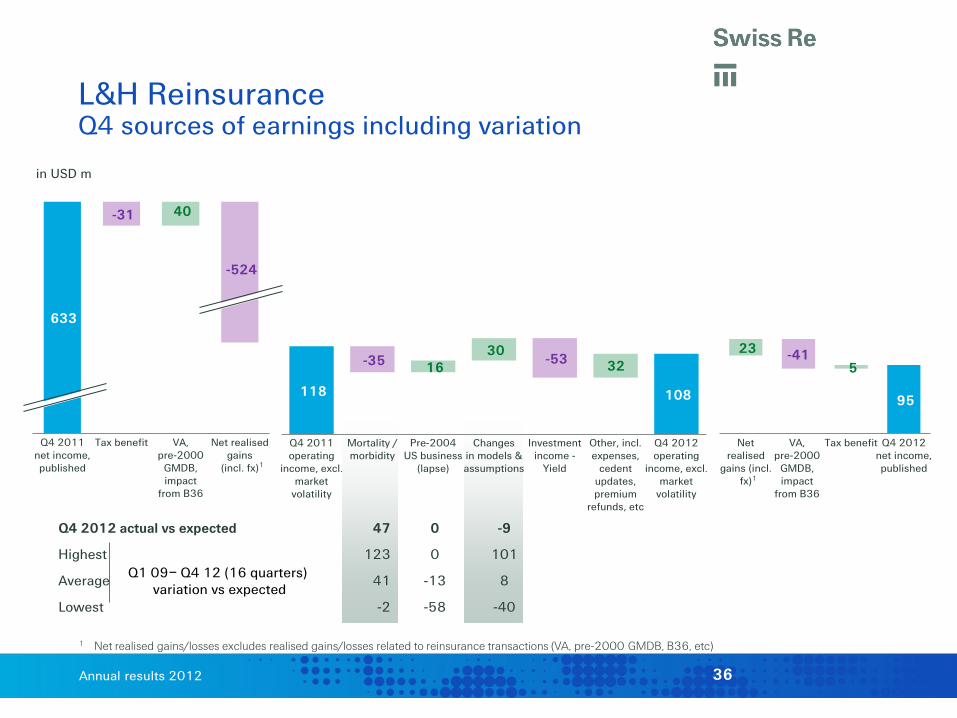
Q4 2012 actual vs expected 47 0 -9
Highest 123 0 101
Average 41 -13 8
Lowest -2 -58 -40
L&H Reinsurance Q4 sources of earnings including variation
1 Net realised gains/losses excludes realised gains/losses related to reinsurance transactions (VA, pre-2000 GMDB, B36, etc)
633
-31
-524
40
Q4 2011net income,published
Tax benefit VA,pre-2000
GMDB,impact
from B36
Net realisedgains
(incl. fx)
36
-41 23 5
95
Netrealised
gains (incl.fx)
VA,pre-2000
GMDB,impact
from B36
Tax benefit Q4 2012net income,published
in USD m
-35 -53 16
30 32
118 108
Q4 2011operating
income, excl.market
volatility
Mortality /morbidity
Pre-2004US business
(lapse)
Changesin models &assumptions
Investmentincome -
Yield
Other, incl.expenses,
cedentupdates,premium
refunds, etc
Q4 2012operating
income, excl.market
volatility
1
Q1 09– Q4 12 (16 quarters) variation vs expected
1
Annual results 2012
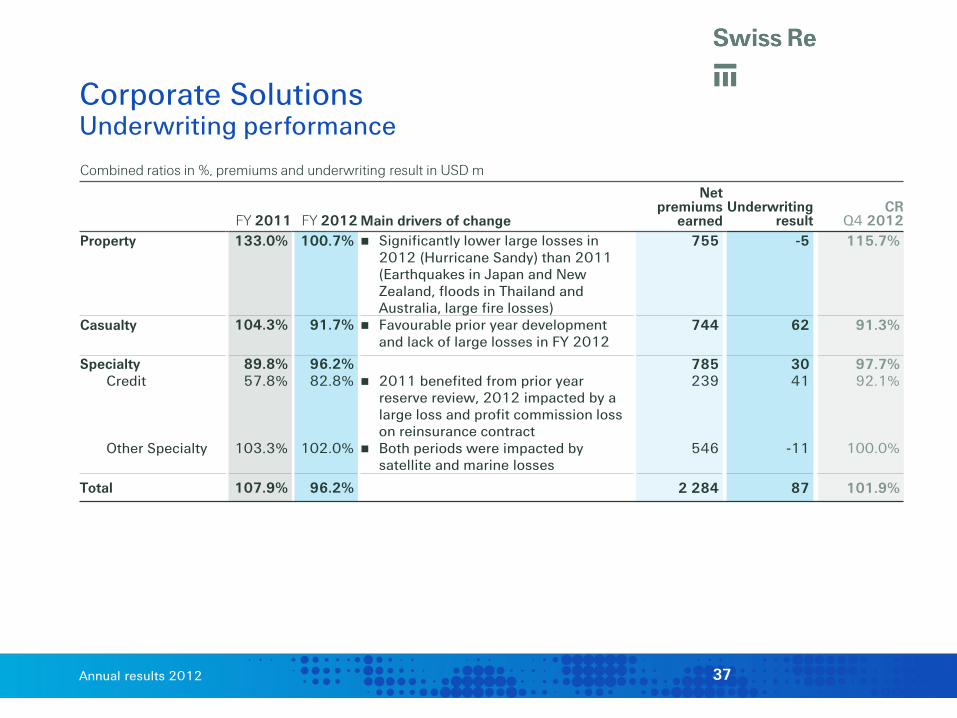
Corporate Solutions Underwriting performance
Combined ratios in %, premiums and underwriting result in USD m
FY 2011 FY 2012 Main drivers of change
Net premiums
earned Underwriting
result CR
Q4 2012 Property 133.0% 100.7% Significantly lower large losses in
2012 (Hurricane Sandy) than 2011 (Earthquakes in Japan and New Zealand, floods in Thailand and Australia, large fire losses)
755 -5 115.7%
Casualty 104.3% 91.7% Favourable prior year development and lack of large losses in FY 2012
744 62 91.3%
Specialty Credit Other Specialty
89.8% 57.8%
103.3%
96.2% 82.8%
102.0%
2011 benefited from prior year
reserve review, 2012 impacted by a large loss and profit commission loss on reinsurance contract
Both periods were impacted by satellite and marine losses
785 239
546
30 41
-11
97.7% 92.1%
100.0%
Total 107.9% 96.2% 2 284 87 101.9%
37
Annual results 2012
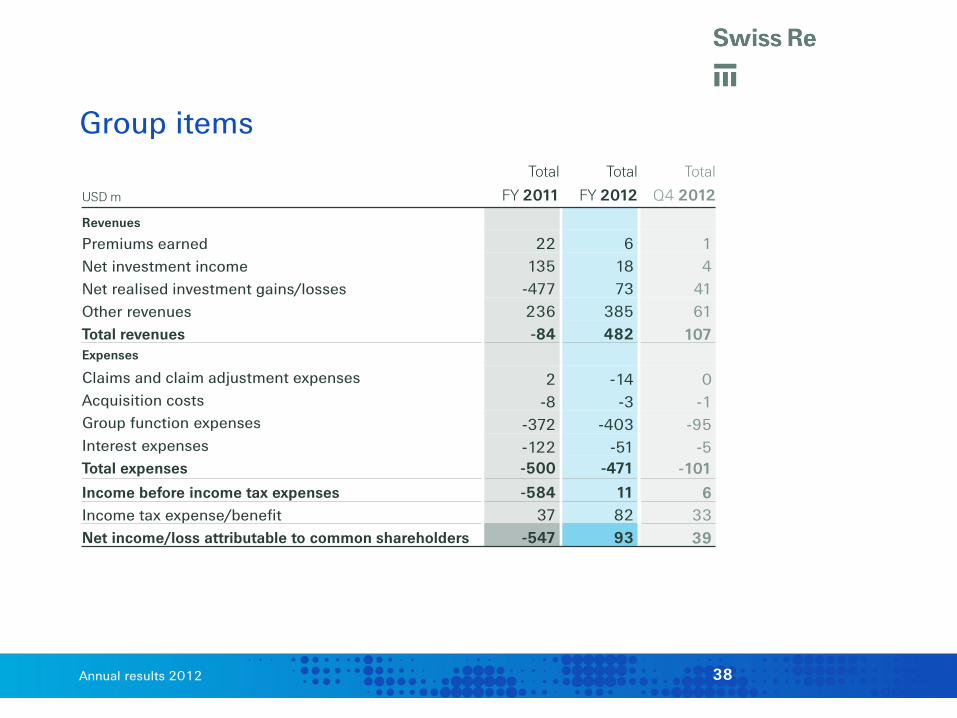
Group items
USD m
Total
FY 2011
Total
FY 2012
Total
Q4 2012
Revenues
Premiums earned 22 6 1 Net investment income 135 18 4 Net realised investment gains/losses -477 73 41 Other revenues 236 385 61 Total revenues -84 482 107 Expenses
Claims and claim adjustment expenses 2 -14 0 Acquisition costs -8 -3 -1 Group function expenses -372 -403 -95 Interest expenses -122 -51 -5 Total expenses -500 -471 -101
Income before income tax expenses -584 11 6 Income tax expense/benefit 37 82 33 Net income/loss attributable to common shareholders -547 93 39
38
Annual results 2012
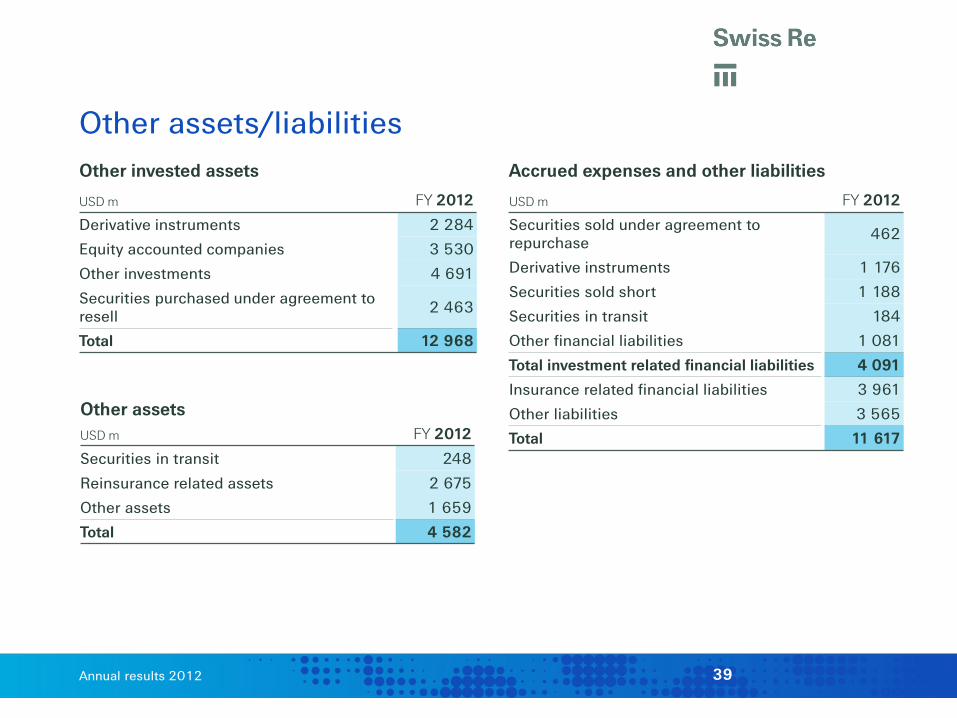
Other assets/liabilities Other invested assets
USD m FY 2012
Derivative instruments 2 284
Equity accounted companies 3 530
Other investments 4 691
Securities purchased under agreement to resell 2 463
Total 12 968
Accrued expenses and other liabilities
USD m FY 2012
Securities sold under agreement to repurchase 462
Derivative instruments 1 176
Securities sold short 1 188
Securities in transit 184
Other financial liabilities 1 081
Total investment related financial liabilities 4 091
Insurance related financial liabilities 3 961
Other liabilities 3 565
Total 11 617
Other assets USD m FY 2012
Securities in transit 248
Reinsurance related assets 2 675
Other assets 1 659
Total 4 582
39
Annual results 2012
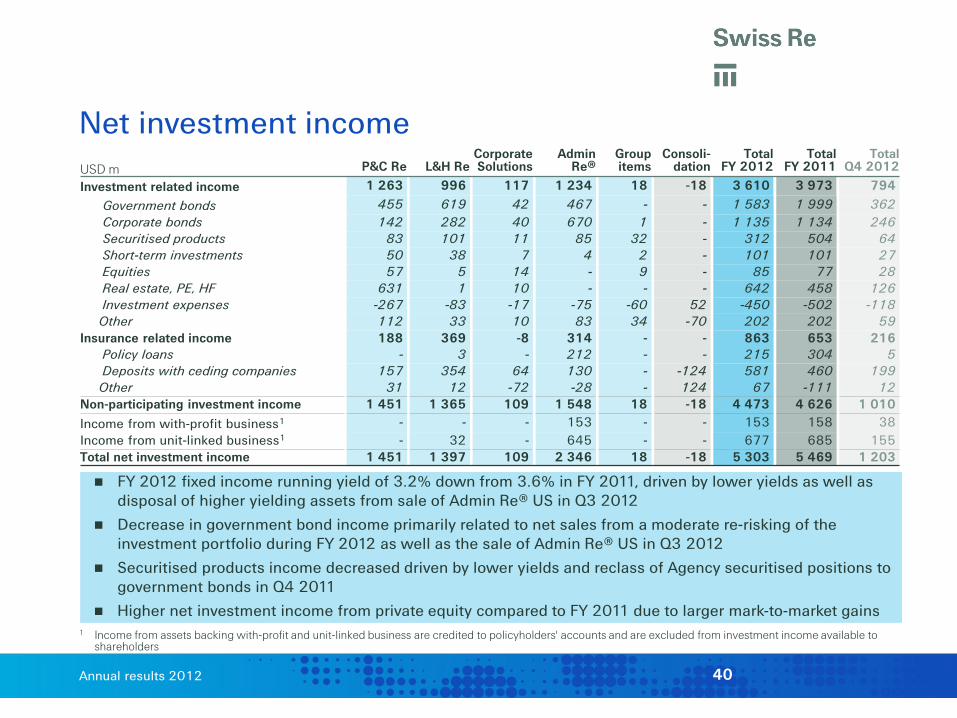
Net investment income
FY 2012 fixed income running yield of 3.2% down from 3.6% in FY 2011, driven by lower yields as well as disposal of higher yielding assets from sale of Admin Re® US in Q3 2012
Decrease in government bond income primarily related to net sales from a moderate re-risking of the investment portfolio during FY 2012 as well as the sale of Admin Re® US in Q3 2012
Securitised products income decreased driven by lower yields and reclass of Agency securitised positions to government bonds in Q4 2011
Higher net investment income from private equity compared to FY 2011 due to larger mark-to-market gains 1 Income from assets backing with-profit and unit-linked business are credited to policyholders' accounts and are excluded from investment income available to
shareholders
USD m P&C Re L&H Re Corporate Solutions
Admin Re®
Group items
Consoli-dation
Total FY 2012
Total FY 2011
Total Q4 2012
Investment related income 1 263 996 117 1 234 18 -18 3 610 3 973 794
Government bonds 455 619 42 467 - - 1 583 1 999 362 Corporate bonds 142 282 40 670 1 - 1 135 1 134 246 Securitised products 83 101 11 85 32 - 312 504 64
Short-term investments 50 38 7 4 2 - 101 101 27 Equities 57 5 14 - 9 - 85 77 28 Real estate, PE, HF 631 1 10 - - - 642 458 126 Investment expenses -267 -83 -17 -75 -60 52 -450 -502 -118 Other 112 33 10 83 34 -70 202 202 59
Insurance related income 188 369 -8 314 - - 863 653 216 Policy loans - 3 - 212 - - 215 304 5 Deposits with ceding companies 157 354 64 130 - -124 581 460 199 Other 31 12 -72 -28 - 124 67 -111 12
Non-participating investment income 1 451 1 365 109 1 548 18 -18 4 473 4 626 1 010 Income from with-profit business1 - - - 153 - - 153 158 38 Income from unit-linked business1 - 32 - 645 - - 677 685 155 Total net investment income 1 451 1 397 109 2 346 18 -18 5 303 5 469 1 203
40
Annual results 2012
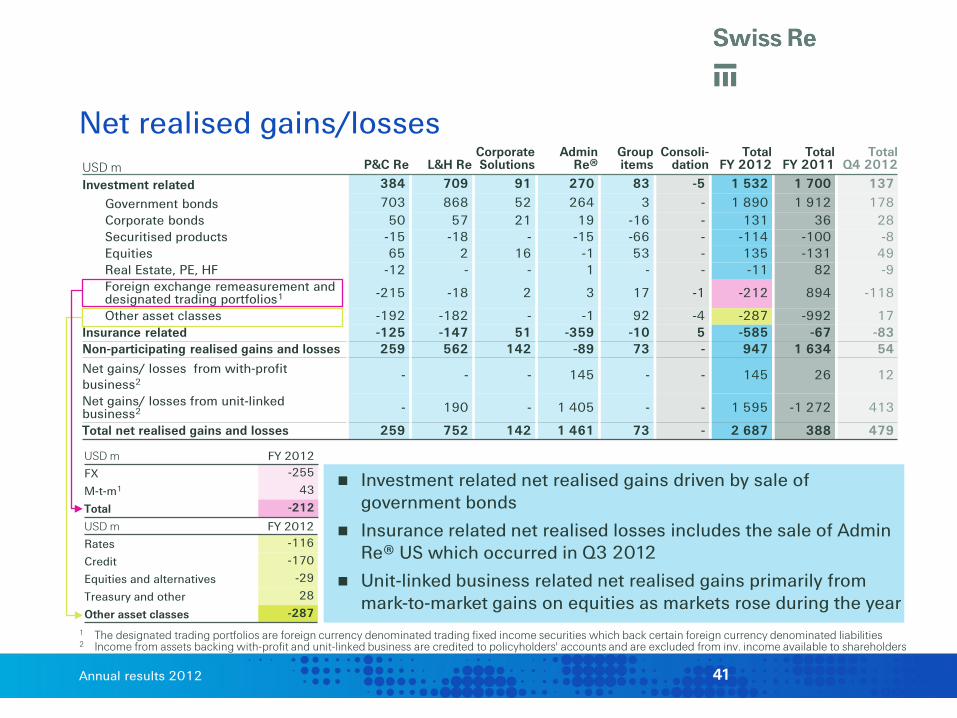
Net realised gains/losses
Investment related net realised gains driven by sale of government bonds
Insurance related net realised losses includes the sale of Admin Re® US which occurred in Q3 2012
Unit-linked business related net realised gains primarily from mark-to-market gains on equities as markets rose during the year
USD m P&C Re L&H Re Corporate Solutions
Admin Re®
Group items
Consoli-dation
Total FY 2012
Total FY 2011
Total Q4 2012
Investment related 384 709 91 270 83 -5 1 532 1 700 137
Government bonds 703 868 52 264 3 - 1 890 1 912 178 Corporate bonds 50 57 21 19 -16 - 131 36 28 Securitised products -15 -18 - -15 -66 - -114 -100 -8 Equities 65 2 16 -1 53 - 135 -131 49 Real Estate, PE, HF -12 - - 1 - - -11 82 -9 Foreign exchange remeasurement and designated trading portfolios1 -215 -18 2 3 17 -1 -212 894 -118
Other asset classes -192 -182 - -1 92 -4 -287 -992 17 Insurance related -125 -147 51 -359 -10 5 -585 -67 -83 Non-participating realised gains and losses 259 562 142 -89 73 - 947 1 634 54 Net gains/ losses from with-profit business2
- - - 145 - - 145 26 12
Net gains/ losses from unit-linked business2 - 190 - 1 405 - - 1 595 -1 272 413
Total net realised gains and losses 259 752 142 1 461 73 - 2 687 388 479
USD m FY 2012 Rates -116
Credit -170
Equities and alternatives -29
Treasury and other 28
Other asset classes -287
USD m FY 2012 FX -255
M-t-m1 43
Total -212
1 The designated trading portfolios are foreign currency denominated trading fixed income securities which back certain foreign currency denominated liabilities 2 Income from assets backing with-profit and unit-linked business are credited to policyholders' accounts and are excluded from inv. income available to shareholders
41
Annual results 2012
USD m P&C Re L&H Re Corporate Solutions
Admin Re®1 Group items
Total FY 2012
Total FY 2011
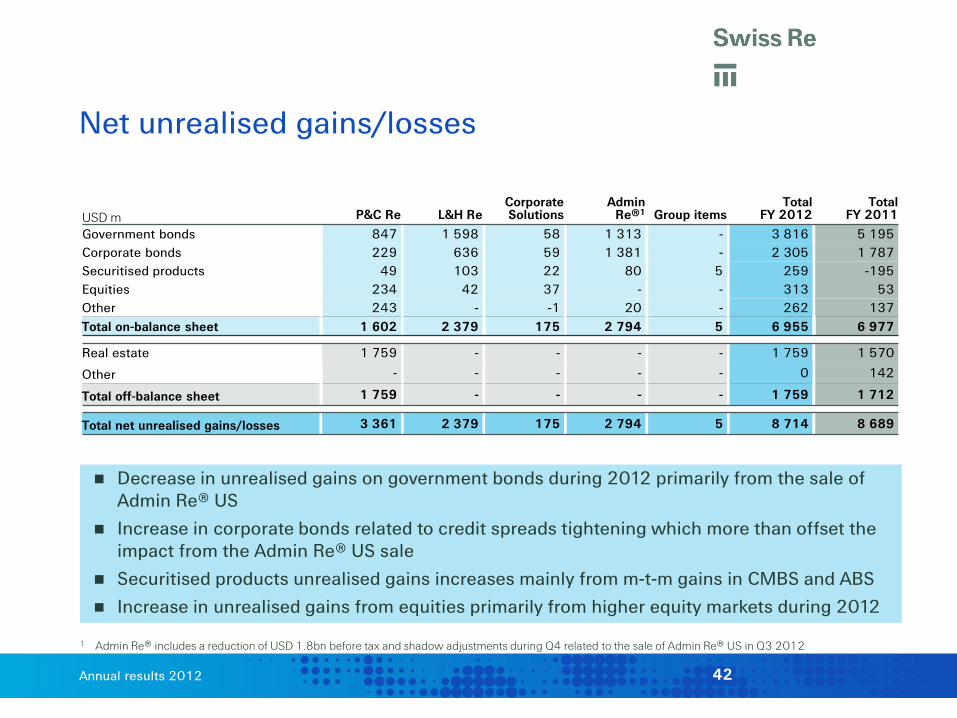
Government bonds 847 1 598 58 1 313 - 3 816 5 195 Corporate bonds 229 636 59 1 381 - 2 305 1 787 Securitised products 49 103 22 80 5 259 -195 Equities 234 42 37 - - 313 53 Other 243 - -1 20 - 262 137 Total on-balance sheet 1 602 2 379 175 2 794 5 6 955 6 977
Real estate 1 759 - - - - 1 759 1 570
Other - - - - - 0 142
Total off-balance sheet 1 759 - - - - 1 759 1 712
Total net unrealised gains/losses 3 361 2 379 175 2 794 5 8 714 8 689
Net unrealised gains/losses
Decrease in unrealised gains on government bonds during 2012 primarily from the sale of Admin Re® US
Increase in corporate bonds related to credit spreads tightening which more than offset the impact from the Admin Re® US sale
Securitised products unrealised gains increases mainly from m-t-m gains in CMBS and ABS
Increase in unrealised gains from equities primarily from higher equity markets during 2012
1 Admin Re® includes a reduction of USD 1.8bn before tax and shadow adjustments during Q4 related to the sale of Admin Re® US in Q3 2012
42

Annual results 2012
Return on investments basis
USD bn FY 20111 FY 2012 Where to find?
Total investment portfolio 173.6 163.7 Slide 45
Unit-linked investments With-profit business
-19.7 -3.3
-22.7 -3.6
Slide 45 Slide 45
Total (excl. unit-linked and with-profit) 150.6 137.4 Slide 45
Cash and cash equivalents Policy loans Other – insurance related Securities in transit Subtract investment related financial liabilities Minority interest in private equity Other assets backing insurance
-10.8 -3.7 -1.5
+1.4 -10.0
-1.3 -0.8
-10.0 -0.3 -1.3
+0.2 -4.1 -0.0 -0.7
Slide 45 Slide 45 Slide 45 Slide 39 Slide 39 n/a Various items (including cat bonds)
Total 123.9 121.2
Investments included in the RoI calculation
1 Return on investments calculation methodology has changed: The scope now includes the Group's entire investment portfolio (incl. Asset Mgmt, Treasury and former Legacy)
43
Annual results 2012
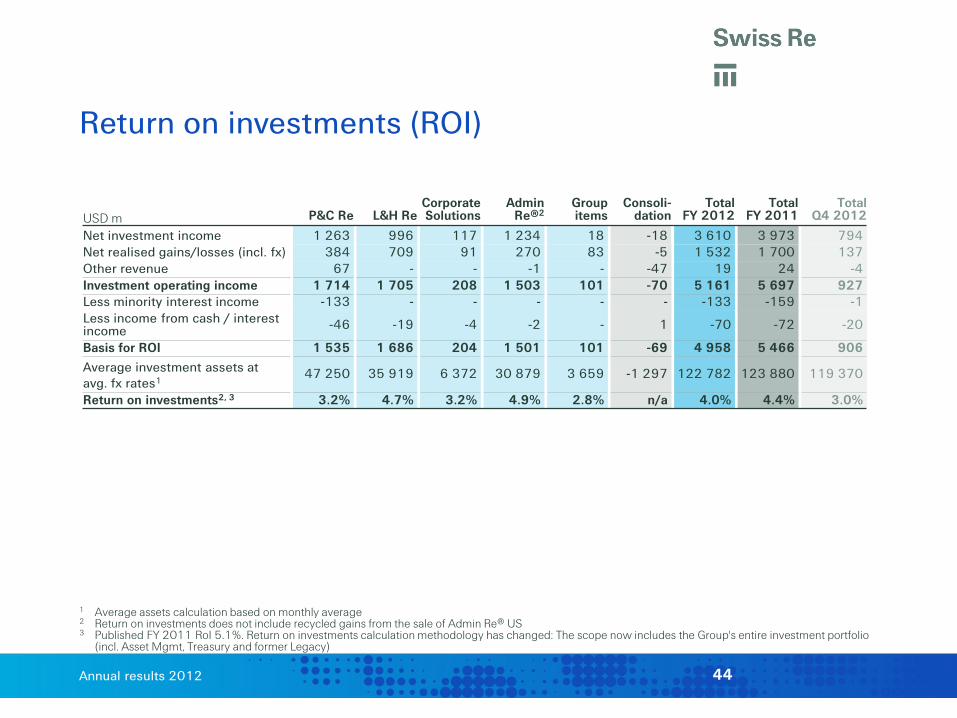
Return on investments (ROI)
USD m P&C Re L&H Re Corporate Solutions
Admin Re®2
Group items
Consoli-dation
Total FY 2012
Total FY 2011
Total Q4 2012
Net investment income 1 263 996 117 1 234 18 -18 3 610 3 973 794 Net realised gains/losses (incl. fx) 384 709 91 270 83 -5 1 532 1 700 137 Other revenue 67 - - -1 - -47 19 24 -4 Investment operating income 1 714 1 705 208 1 503 101 -70 5 161 5 697 927 Less minority interest income -133 - - - - - -133 -159 -1 Less income from cash / interest income -46 -19 -4 -2 - 1 -70 -72 -20
Basis for ROI 1 535 1 686 204 1 501 101 -69 4 958 5 466 906 Average investment assets at avg. fx rates1
47 250 35 919 6 372 30 879 3 659 -1 297 122 782 123 880 119 370
Return on investments2, 3 3.2% 4.7% 3.2% 4.9% 2.8% n/a 4.0% 4.4% 3.0%
1 Average assets calculation based on monthly average 2 Return on investments does not include recycled gains from the sale of Admin Re® US 3 Published FY 2011 RoI 5.1%. Return on investments calculation methodology has changed: The scope now includes the Group's entire investment portfolio
(incl. Asset Mgmt, Treasury and former Legacy)
44
Annual results 2012
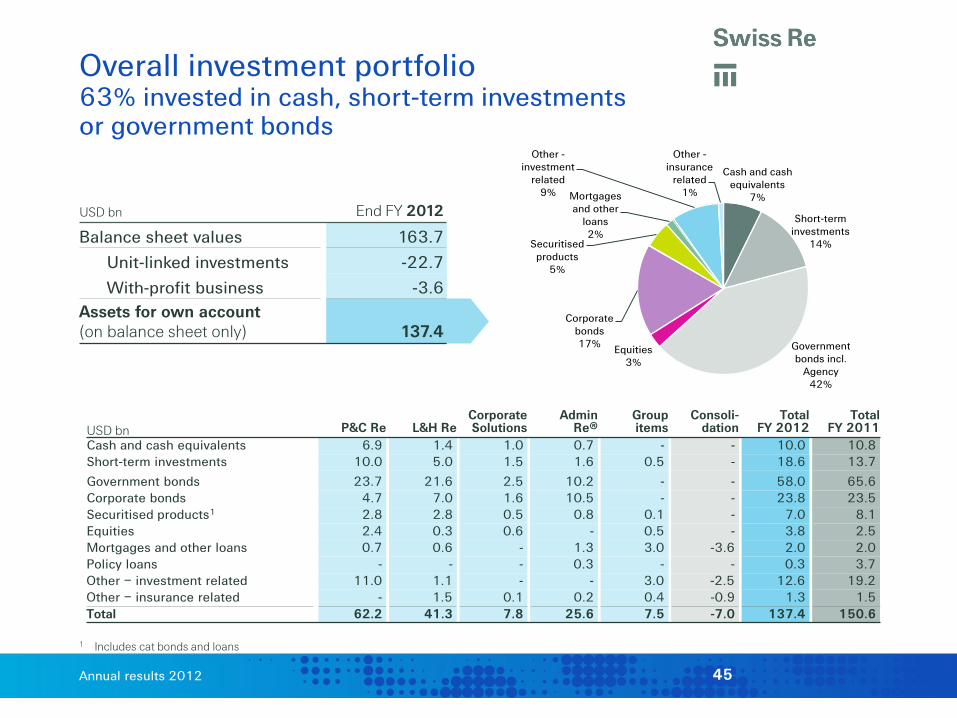
Overall investment portfolio 63% invested in cash, short-term investments or government bonds
Cash and cash equivalents
7%
Short-term investments
14%
Government bonds incl.
Agency 42%
Equities 3%
Corporate bonds 17%
Securitised products
5%
Mortgages and other
loans 2%
Other - investment
related 9%
Other - insurance
related 1%
USD bn End FY 2012
Balance sheet values 163.7
Unit-linked investments -22.7
With-profit business -3.6 Assets for own account (on balance sheet only) 137.4
USD bn P&C Re L&H Re Corporate Solutions
Admin Re®
Group items
Consoli-dation
Total FY 2012
Total FY 2011
Cash and cash equivalents 6.9 1.4 1.0 0.7 - - 10.0 10.8 Short-term investments 10.0 5.0 1.5 1.6 0.5 - 18.6 13.7
Government bonds 23.7 21.6 2.5 10.2 - - 58.0 65.6 Corporate bonds 4.7 7.0 1.6 10.5 - - 23.8 23.5 Securitised products1 2.8 2.8 0.5 0.8 0.1 - 7.0 8.1 Equities 2.4 0.3 0.6 - 0.5 - 3.8 2.5 Mortgages and other loans 0.7 0.6 - 1.3 3.0 -3.6 2.0 2.0 Policy loans - - - 0.3 - - 0.3 3.7 Other – investment related 11.0 1.1 - - 3.0 -2.5 12.6 19.2 Other – insurance related - 1.5 0.1 0.2 0.4 -0.9 1.3 1.5 Total 62.2 41.3 7.8 25.6 7.5 -7.0 137.4 150.6
1 Includes cat bonds and loans
45

Annual results 2012
23.5 23.8
End FY 2011 End FY 2012
Fixed income securities
Government bonds1 Corporate bonds2 Securitised products3
USD bn End FY 2011 End FY 2012 Balance sheet values 101.3 93.5 Unit-linked investments -2.4 -2.6 With-profit business -1.7 -2.1 Balance sheet values (excl. unit-linked and with-profit business) 97.2 88.8
Mark-to-market gains and fx partially offset by net sales and maturities of USD 1.4bn (driven by sale of Admin Re® US of USD 5.5bn and net purchases of USD 4.1bn from moderate re-risking)
65.6 58.0
End FY 2011 End FY 2012
7.6 6.7
End FY 2011 End FY 2012
1 Includes Agency securitised products 2 Includes Pfandbriefe / covered bonds 3 Includes invested assets and off balance sheet investment exposures, excludes cat bonds and loans
Net sales and maturities of USD 9.6bn (driven by sale of Admin Re® US of USD 4.8bn) partially offset by mark-to-market gains and fx
Net sales and maturities of USD 1.8bn (driven by sale of Admin Re® US of USD 1.1bn) partially offset by mark-to market gains and fx
46
Annual results 2012
Austria 46%
EIB (European Investment
Bank) 43%
EEC/EU super-
sovereign 3% Other
8%
Eurozone other: USD 1 224
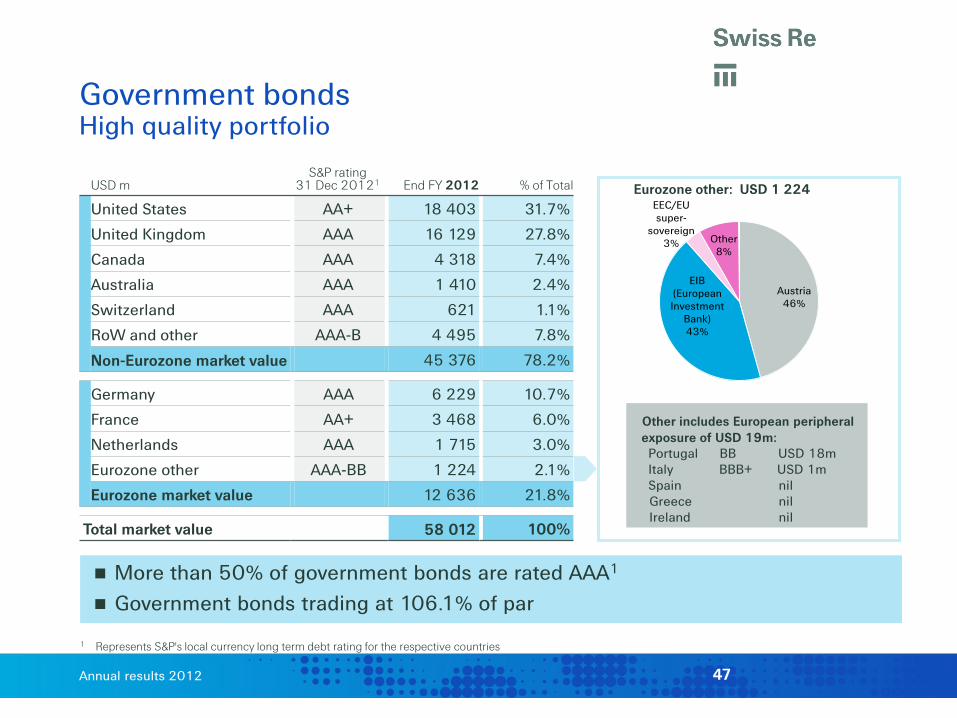
Government bonds High quality portfolio
More than 50% of government bonds are rated AAA1
Government bonds trading at 106.1% of par
USD m S&P rating
31 Dec 20121 End FY 2012 % of Total
United States AA+ 18 403 31.7%
United Kingdom AAA 16 129 27.8%
Canada AAA 4 318 7.4%
Australia AAA 1 410 2.4%
Switzerland AAA 621 1.1%
RoW and other AAA-B 4 495 7.8%
Non-Eurozone market value 45 376 78.2%
Germany AAA 6 229 10.7%
France AA+ 3 468 6.0%
Netherlands AAA 1 715 3.0%
Eurozone other AAA-BB 1 224 2.1%
Eurozone market value 12 636 21.8%
Total market value 58 012 100%
1 Represents S&P's local currency long term debt rating for the respective countries
Other includes European peripheral exposure of USD 19m: Portugal BB USD 18m Italy BBB+ USD 1m Spain nil Greece nil Ireland nil
47
Annual results 2012
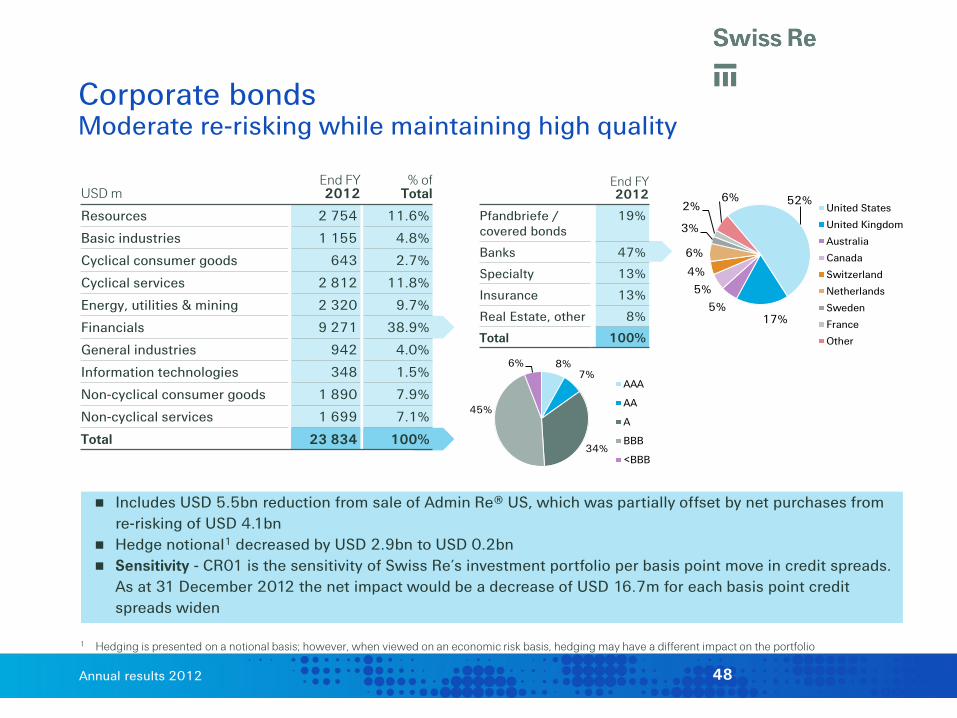
Corporate bonds Moderate re-risking while maintaining high quality
1 Hedging is presented on a notional basis; however, when viewed on an economic risk basis, hedging may have a different impact on the portfolio
USD m End FY 2012
% of Total
Resources 2 754 11.6%
Basic industries 1 155 4.8%
Cyclical consumer goods 643 2.7%
Cyclical services 2 812 11.8%
Energy, utilities & mining 2 320 9.7%
Financials 9 271 38.9%
General industries 942 4.0%
Information technologies 348 1.5%
Non-cyclical consumer goods 1 890 7.9%
Non-cyclical services 1 699 7.1%
Total 23 834 100%
8% 7%
34%
45%
6%
AAA
AA
A
BBB
<BBB
End FY 2012
Pfandbriefe / covered bonds
19%
Banks 47%
Specialty 13%
Insurance 13%
Real Estate, other 8%
Total 100%
52%
17% 5%
5%
4%
6%
3%
2% 6%
United States
United Kingdom
Australia
Canada
Switzerland
Netherlands
Sweden
France
Other
Includes USD 5.5bn reduction from sale of Admin Re® US, which was partially offset by net purchases from re-risking of USD 4.1bn
Hedge notional1 decreased by USD 2.9bn to USD 0.2bn Sensitivity - CR01 is the sensitivity of Swiss Re’s investment portfolio per basis point move in credit spreads.
As at 31 December 2012 the net impact would be a decrease of USD 16.7m for each basis point credit spreads widen
48
Annual results 2012
48%
36%
15% 1%
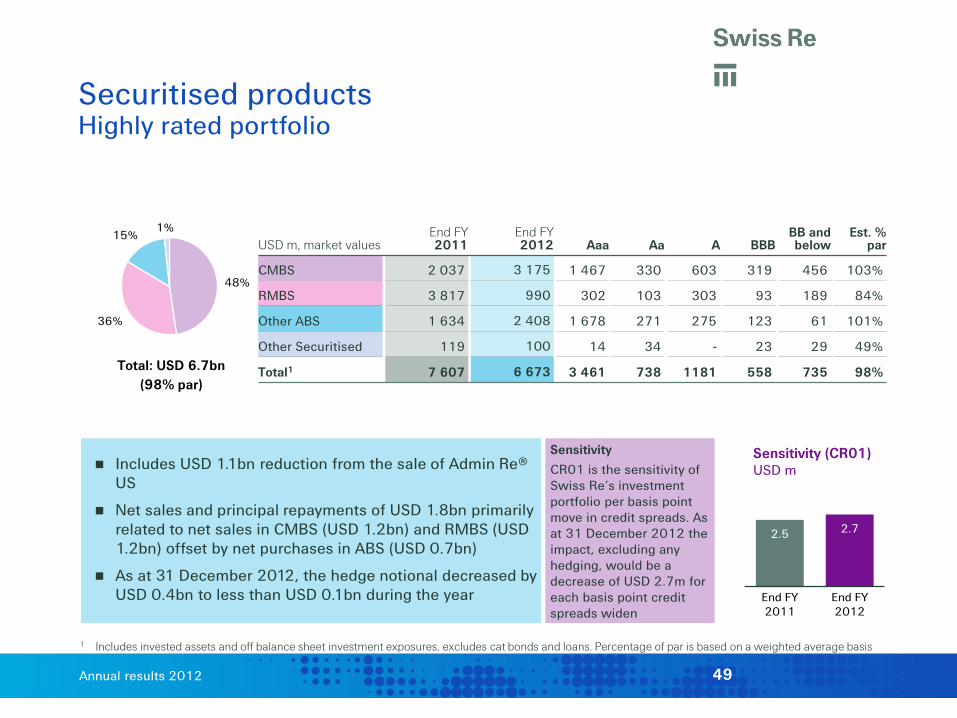
Securitised products Highly rated portfolio
1 Includes invested assets and off balance sheet investment exposures, excludes cat bonds and loans. Percentage of par is based on a weighted average basis
Includes USD 1.1bn reduction from the sale of Admin Re® US
Net sales and principal repayments of USD 1.8bn primarily related to net sales in CMBS (USD 1.2bn) and RMBS (USD 1.2bn) offset by net purchases in ABS (USD 0.7bn)
As at 31 December 2012, the hedge notional decreased by USD 0.4bn to less than USD 0.1bn during the year
USD m, market values End FY 2011
End FY 2012 Aaa Aa A BBB
BB and below
Est. % par
CMBS 2 037 3 175 1 467 330 603 319 456 103%
RMBS 3 817 990 302 103 303 93 189 84%
Other ABS 1 634 2 408 1 678 271 275 123 61 101%
Other Securitised 119 100 14 34 - 23 29 49%
Total1 7 607 6 673 3 461 738 1181 558 735 98% Total: USD 6.7bn (98% par)
2.5 2.7
End FY2011
End FY2012
Sensitivity (CR01) USD m
Sensitivity
CR01 is the sensitivity of Swiss Re’s investment portfolio per basis point move in credit spreads. As at 31 December 2012 the impact, excluding any hedging, would be a decrease of USD 2.7m for each basis point credit spreads widen
49
Annual results 2012
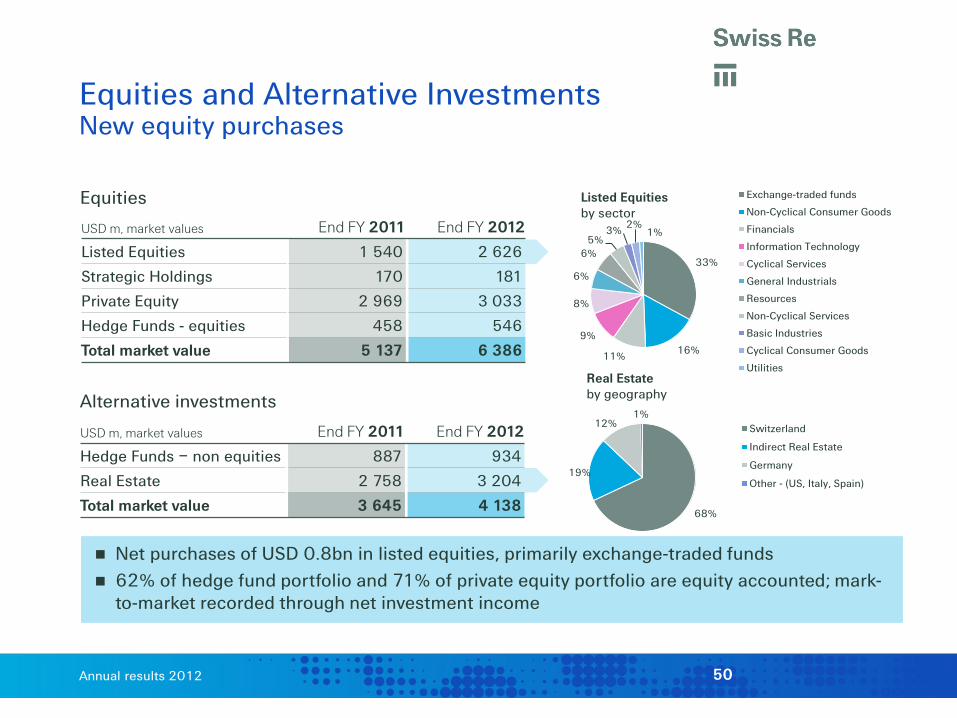
Equities and Alternative Investments New equity purchases
USD m, market values End FY 2011 End FY 2012
Listed Equities 1 540 2 626
Strategic Holdings 170 181
Private Equity 2 969 3 033
Hedge Funds - equities 458 546
Total market value 5 137 6 386
USD m, market values End FY 2011 End FY 2012
Hedge Funds – non equities 887 934
Real Estate 2 758 3 204
Total market value 3 645 4 138
Equities
Alternative investments
Net purchases of USD 0.8bn in listed equities, primarily exchange-traded funds 62% of hedge fund portfolio and 71% of private equity portfolio are equity accounted; mark-
to-market recorded through net investment income
33%
16% 11%
9%
8%
6%
6% 5%
3% 2% 1%
Listed Equities by sector
Exchange-traded funds
Non-Cyclical Consumer Goods
Financials
Information Technology
Cyclical Services
General Industrials
Resources
Non-Cyclical Services
Basic Industries
Cyclical Consumer Goods
Utilities
68%
19%
12% 1%
Real Estate by geography
Switzerland
Indirect Real Estate
Germany
Other - (US, Italy, Spain)
50
Annual results 2012
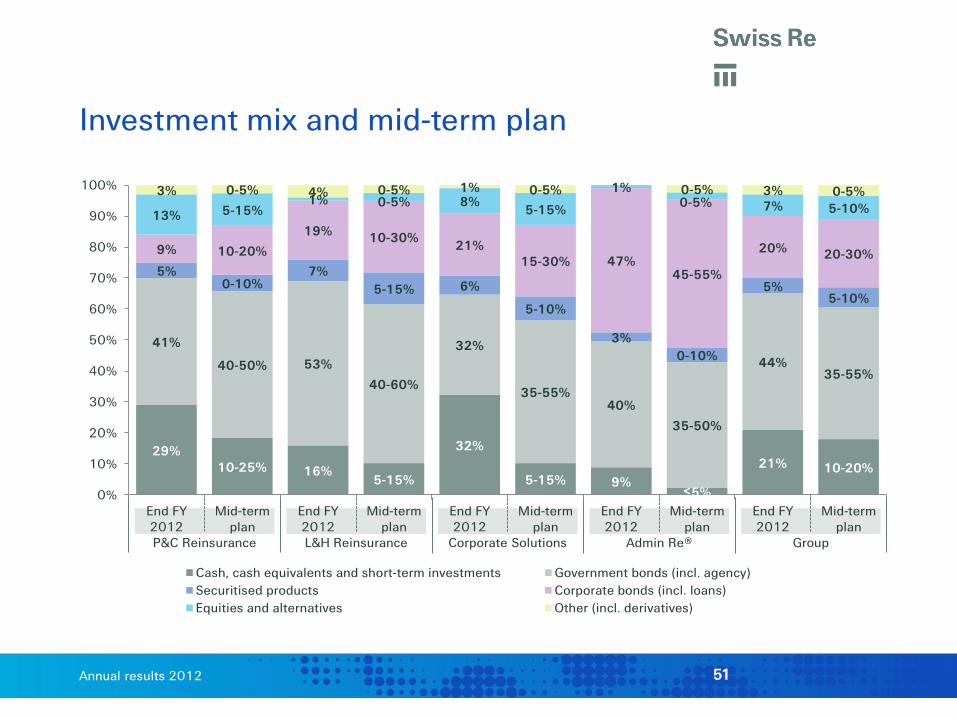
P&C Reinsurance L&H Reinsurance Corporate Solutions Admin Re® Group
Investment mix and mid-term plan
51
29% 10-25% 16%
5-15%
32%
5-15% 9% ≤5%
21% 10-20%
41%
40-50% 53%
40-60%
32%
35-55% 40%
35-50%
44% 35-55%
5% 0-10%
7% 5-15% 6%
5-10%
3% 0-10%
5% 5-10%
9% 10-20%
19% 10-30% 21% 15-30% 47%
45-55%
20% 20-30%
13% 5-15% 1% 0-5% 8%
5-15%
1% 0-5% 7% 5-10%
3% 0-5% 4% 0-5% 1% 0-5% 0-5% 3% 0-5%
0%
10%
20%
30%
40%
50%
60%
70%
80%
90%
100%
End FY2012
Mid-termplan
End FY2012
Mid-termplan
End FY2012
Mid-termplan
End FY2012
Mid-termplan
End FY2012
Mid-termplan
Cash, cash equivalents and short-term investments Government bonds (incl. agency)Securitised products Corporate bonds (incl. loans)Equities and alternatives Other (incl. derivatives)

Annual results 2012
USD m Scenario
Estimated impact on shareholders’
equity
Estimated impact on economic available
capital
Listed equity investments Fall in market values of 25% -657 -657
Private equity investments1 Fall in market values of 25% -804 -804
Hedge Funds investments Fall in market values of 25% -370 -370
Government bonds Rise in interest rates of 100 bps -5 268 -79
Corporate bonds Increase in spreads of 100 bps -1 672
net: -1 670 -1 672
net: -1 670
Securitised products Increase in spreads of 100 bps -265
net: -262 -265
net: -262
Sensitivities
1 Includes strategic holdings Net is net of hedging impact All sensitivities are assumed to take effect on 31 December 2012 and no management actions are included in this analysis. Results are pre-tax and estimated as mutually exclusive events and reflect the estimated impact on the Group of given economic outcomes
52
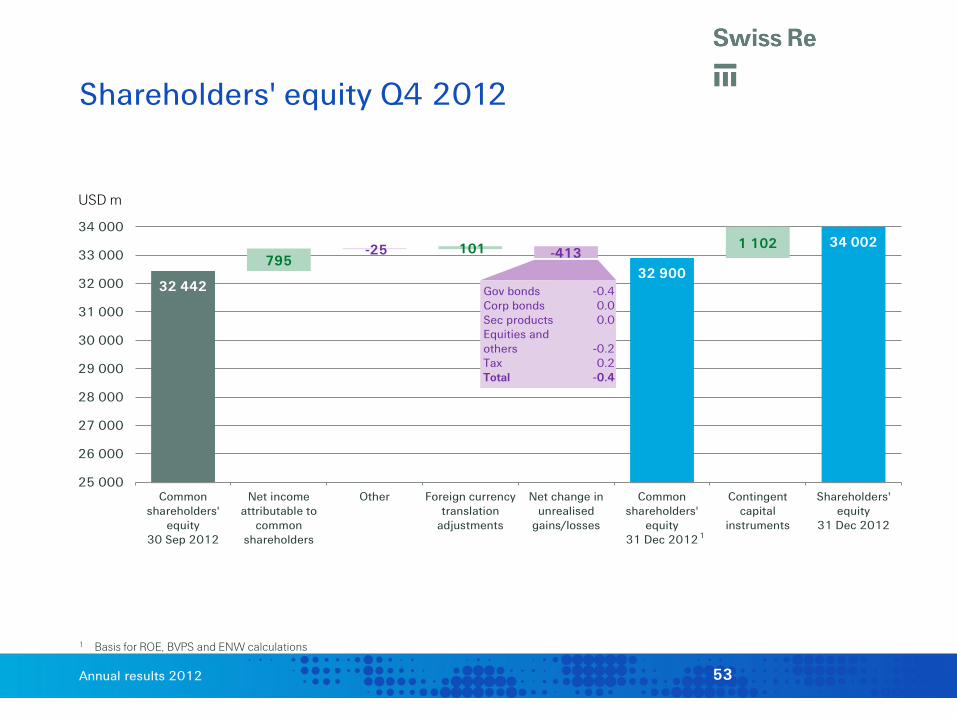
Annual results 2012
32 442
-25 -413 795 101 1 102
32 900
34 002
25 000
26 000
27 000
28 000
29 000
30 000
31 000
32 000
33 000
34 000
Commonshareholders'
equity30 Sep 2012
Net incomeattributable to
commonshareholders
Other Foreign currencytranslation
adjustments
Net change inunrealised
gains/losses
Commonshareholders'
equity31 Dec 2012
Contingentcapital
instruments
Shareholders'equity
31 Dec 2012
USD m
1
1 Basis for ROE, BVPS and ENW calculations
Shareholders' equity Q4 2012
Gov bonds -0.4 Corp bonds 0.0 Sec products 0.0 Equities and others -0.2 Tax 0.2 Total -0.4
53
Annual results 2012
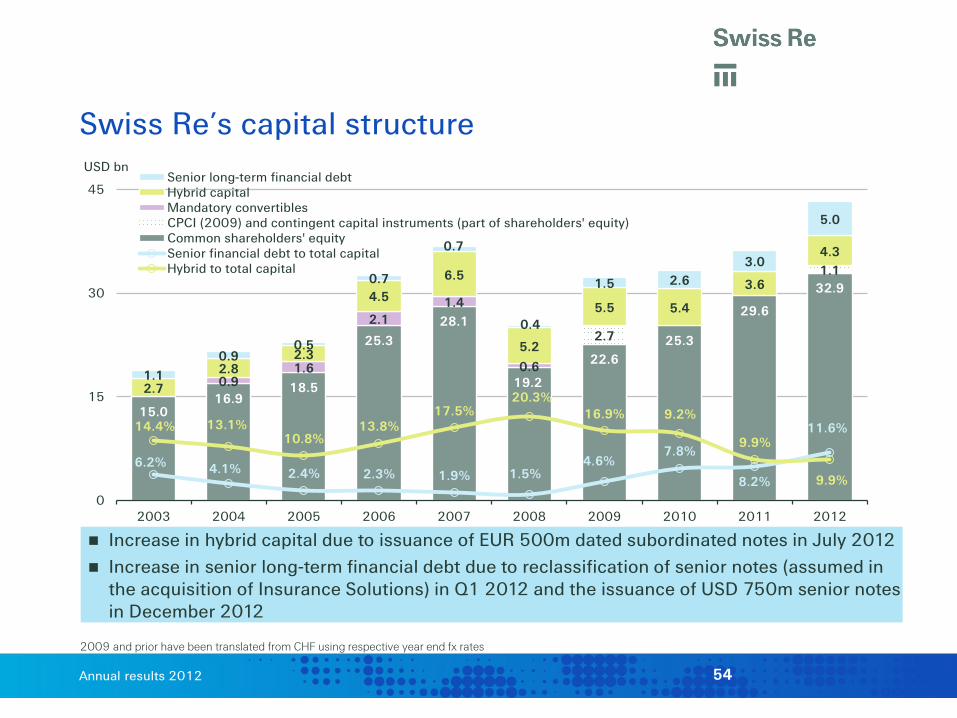
Swiss Re’s capital structure USD bn
2009 and prior have been translated from CHF using respective year end fx rates
15.0 16.9
18.5
25.3 28.1
19.2
22.6 25.3
29.6
32.9
2.7
1.1
0.9 1.6
2.1 1.4
0.6
2.7
2.8 2.3
4.5
6.5
5.2
5.5 5.4
3.6
4.3
1.1 0.9
0.5
0.7
0.7
0.4
1.5 2.6 3.0
5.0
6.2% 4.1% 2.4% 2.3% 1.9% 1.5% 4.6%
7.8%
8.2%
11.6% 14.4% 13.1% 10.8%
13.8% 17.5%
20.3% 16.9% 9.2%
9.9%
9.9%
0%
25%
50%
75%
0
15
30
45
2003 2004 2005 2006 2007 2008 2009 2010 2011 2012
Senior long-term financial debtHybrid capitalMandatory convertiblesCPCI (2009) and contingent capital instruments (part of shareholders' equity)Common shareholders' equitySenior financial debt to total capitalHybrid to total capital
Increase in hybrid capital due to issuance of EUR 500m dated subordinated notes in July 2012 Increase in senior long-term financial debt due to reclassification of senior notes (assumed in
the acquisition of Insurance Solutions) in Q1 2012 and the issuance of USD 750m senior notes in December 2012
54

Annual results 2012
Increase regular dividend to CHF 3.50 per share and pay out a special dividend of CHF 4.00 per share
– Both dividends to be paid in the form of withholding tax exempt distributions of legal reserves from capital contributions; such reserves totalling CHF 7.8bn as at 31 December 2012 (as confirmed by the Swiss Federal Tax Authority)
Authorised capital – Renew existing authorised capital (up to 85 million shares with a sublimit of 35 million
shares where Board of Directors may limit or withdraw subscription rights of existing shareholders); new proposed expiry date 10 April 2015
– Cancel authorised capital for the exchange of shares
Conditional capital – No changes in conditional capital for equity-linked financing instruments of up to 50 million
shares
– Adjust the limit of total shares issued from authorised and conditional capital without subscription rights of existing shareholders from 74.14 million to 74 million shares for formal reasons, with alignment of the expiry date of the limitation provision with the expiry date of the authorised capital (10 April 2015)
Proposed capital motions for AGM 2013
55
Annual results 2012
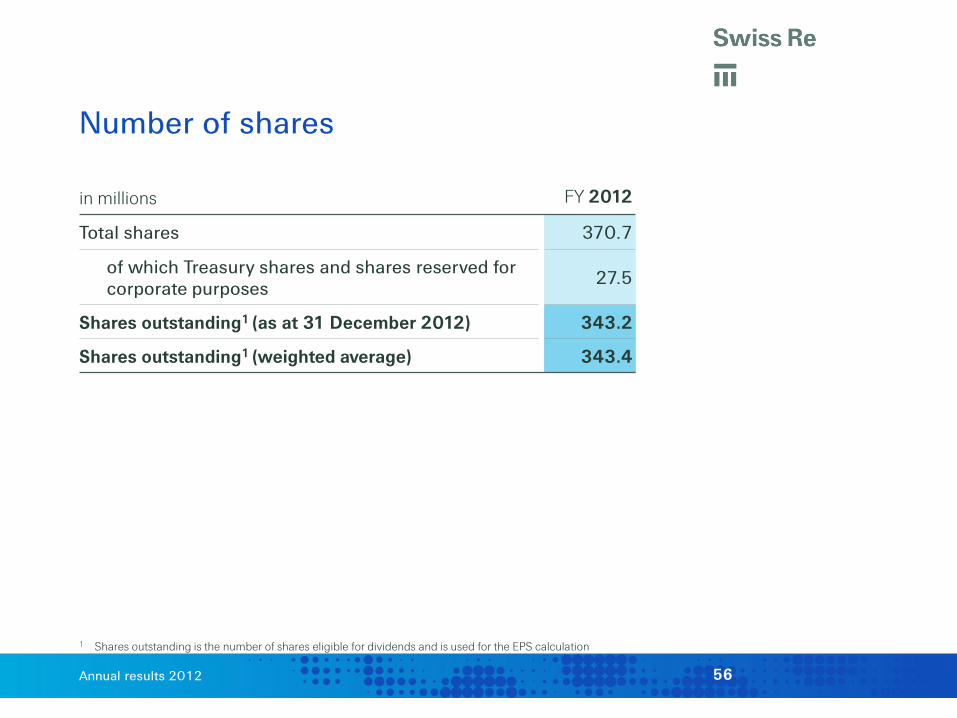
Number of shares
1 Shares outstanding is the number of shares eligible for dividends and is used for the EPS calculation
in millions FY 2012
Total shares 370.7
of which Treasury shares and shares reserved for corporate purposes 27.5
Shares outstanding1 (as at 31 December 2012) 343.2
Shares outstanding1 (weighted average) 343.4
56

Annual results 2012
Premiums by country
USD m Life&Health Non-Life Total
FY 2012 USA
4 554 6 743 11 297 UK 1 598 1 907 3 505 France 198 2 151 2 349 China 92 2 009 2 101 Australia 1 020 885 1 905 Canada 927 544 1 471 Germany 191 1 076 1 267 Japan 207 1 023 1 230 Ireland 701 70 771 Netherlands 106 413 519 Switzerland 73 374 447 Italy 122 305 427 Spain 31 391 422 Bermuda 0 341 341 South Africa 141 142 283 Republic of Korea 57 203 260 Israel 141 86 227 Mexico 23 191 214 India 30 148 178 Other 704 2 590 3 294 Total 10 916 21 592 32 508 1 Country split based on the country where the premium was generated or an approximation thereof
2012 Gross premiums written and fees assessed against policyholders by country1
57
Annual results 2012
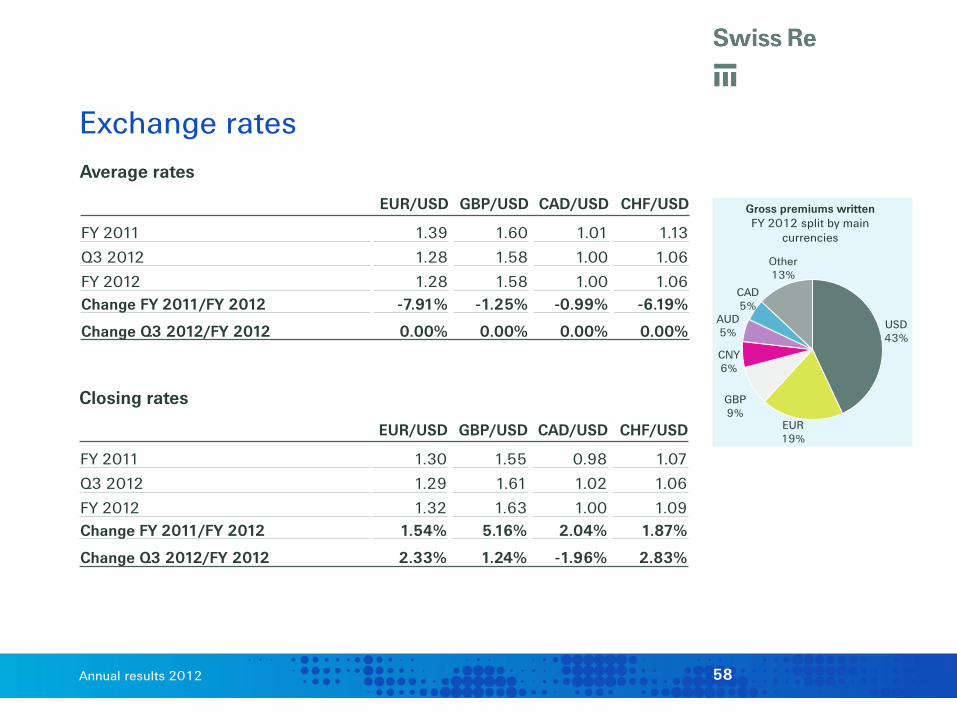
Exchange rates
Closing rates
EUR/USD GBP/USD CAD/USD CHF/USD
FY 2011 1.30 1.55 0.98 1.07
Q3 2012 1.29 1.61 1.02 1.06
FY 2012 1.32 1.63 1.00 1.09 Change FY 2011/FY 2012 1.54% 5.16% 2.04% 1.87%
Change Q3 2012/FY 2012 2.33% 1.24% -1.96% 2.83%
Average rates
EUR/USD GBP/USD CAD/USD CHF/USD
FY 2011 1.39 1.60 1.01 1.13
Q3 2012 1.28 1.58 1.00 1.06
FY 2012 1.28 1.58 1.00 1.06 Change FY 2011/FY 2012 -7.91% -1.25% -0.99% -6.19%
Change Q3 2012/FY 2012 0.00% 0.00% 0.00% 0.00% USD 43%
EUR 19%
GBP 9%
CNY 6%
AUD 5%
CAD 5%
Other 13%
Gross premiums written FY 2012 split by main
currencies
58
Annual results 2012
Investor Relations contacts Hotline E-mail +41 43 285 4444 [email protected] Eric Schuh Ross Walker Chris Menth +41 43 285 4708 +41 43 285 2243 +41 43 285 3878
Simone Lieberherr Simone Fessler +41 43 285 4190 +41 43 285 7299
Corporate calendar 15 March 2013 Publication of Annual Report 2012 and EVM 2012 18 March 2013 AGM Briefing Call Conference call 10 April 2013 149th Annual General Meeting Zurich 02 May 2013 First Quarter 2013 results Conference call 24 June 2013 Investors' Day Zurich 08 August 2013 Second Quarter 2013 results Conference call 07 November 2013 Third Quarter 2013 results Conference call
Corporate calendar & contacts
59
Annual results 2012
Cautionary note on forward-looking statements Certain statements and illustrations contained herein are forward-looking. These statements (including as to plans objectives, targets and trends) and illustrations provide current expectations of future events based on certain assumptions and include any statement that does not directly relate to a historical fact or current fact. Forward-looking statements typically are identified by words or phrases such as “anticipate“, “assume“, “believe“, “continue“, “estimate“, “expect“, “foresee“, “intend“, “may increase“ and “may fluctuate“ and similar expressions or by future or conditional verbs such as “will“, “should“, “would“ and “could“. These forward-looking statements involve known and unknown risks, uncertainties and other factors, which may cause Swiss Re’s actual results of operations, financial condition, solvency ratios, liquidity position or prospects to be materially different from any future results of operations, financial condition, solvency ratios, liquidity position or prospects expressed or implied by such statements or cause Swiss Re to not achieve its published targets. Such factors include, among others:
further instability affecting the global financial system and developments related thereto, including as a result of concerns over, or adverse developments relating to, sovereign debt of euro area countries;
further deterioration in global economic conditions; Swiss Re’s ability to maintain sufficient liquidity and access to capital markets,
including sufficient liquidity to cover potential recapture of reinsurance agreements, early calls of debt or debt-like arrangements and collateral calls due to actual or perceived deterioration of Swiss Re’s financial strength or otherwise;
the effect of market conditions, including the global equity and credit markets, and the level and volatility of equity prices, interest rates, credit spreads, currency values and other market indices, on Swiss Re’s investment assets;
changes in Swiss Re’s investment result as a result of changes in its investment policy or the changed composition of its investment assets, and the impact of the timing of any such changes relative to changes in market conditions;
uncertainties in valuing credit default swaps and other credit-related instruments; possible inability to realise amounts on sales of securities on Swiss Re’s balance
sheet equivalent to their mark-to-market values recorded for accounting purposes; the outcome of tax audits, the ability to realise tax loss carryforwards and the
ability to realise deferred tax assets (including by reason of the mix of earnings in a jurisdiction or deemed change of control), which could negatively impact future earnings;
the possibility that Swiss Re’s hedging arrangements may not be effective; the lowering or loss of one of the financial strength or other ratings of one or more
Swiss Re companies, and developments adversely affecting Swiss Re’s ability to achieve improved ratings;
the cyclicality of the reinsurance industry; uncertainties in estimating reserves; uncertainties in estimating future claims for purposes of financial reporting,
particularly with respect to large natural catastrophes, as significant uncertainties may be involved in estimating losses from such events and preliminary estimates may be subject to change as new information becomes available;
the frequency, severity and development of insured claim events; acts of terrorism and acts of war; mortality, morbidity and longevity experience; policy renewal and lapse rates; extraordinary events affecting Swiss Re’s clients and other counterparties, such
as bankruptcies, liquidations and other credit-related events; current, pending and future legislation and regulation affecting Swiss Re or its
ceding companies, and the interpretations of legislation or regulations by regulators;
legal actions or regulatory investigations or actions, including those in respect of industry requirements or business conduct rules of general applicability;
changes in accounting standards; significant investments, acquisitions or dispositions, and any delays,
unexpected costs or other issues experienced in connection with any such transactions;
changing levels of competition; and operational factors, including the efficacy of risk management and other internal
procedures in managing the foregoing risks.
These factors are not exhaustive. Swiss Re operates in a continually changing environment and new risks emerge continually. Readers are cautioned not to place undue reliance on forward-looking statements. Swiss Re undertakes no obligation to publicly revise or update any forward-looking statements, whether as a result of new information, future events or otherwise. This communication is not intended to be a recommendation to buy, sell or hold securities and does not constitute an offer for the sale of, or the solicitation of an offer to buy, securities in any jurisdiction, including the United States. Any such offer will only be made by means of a prospectus or offering memorandum, and in compliance with applicable securities laws.
60