Embed Size (px)
Citation preview

European Political Economy Review ISSN 1742-5697 Vol. 3, No. 2 (Winter 2005-2006), pp. 53-86 www.eper.org
Financial Liberalization, Stock Markets and Growth in Economies with Underde-veloped Financial Markets Elisabeth Springler* Abstract In the 1990s numerous developed as well as underdeveloped economies suffered from banking crises after following the advice of financial market liberalization theory and liberalized the banking sector as well as the stock exchange. Despite of these evidences theoretical arguments of financial liberalization theorists are still undoubted and proposals for restructuring international financial markets to increase stability, act in the tradition of financial market liberalization. Aiming to analyse the causalities of financial market liberalization theory for developments on national stock exchanges and the impacts for economic growth this paper discusses the evolu-tion of the Athens Stock Exchange as best case scenario. Keywords: economic development, stock exchanges, wealth ef-
fects, consumption * Dr. Elisabeth Springler, BFI College, Vienna, Austria

54 European Political Economy Review
1. Introduction In the last decade many articles (among others Levine and King 1993a, Levine and King 1993b, Levine and Zervos 1998, Levine 1997, Pagano 1993, Singh 1997) have analyzed the link between fi-nancial market development and growth effects in less developed countries using models of endogenous growth theory. As a result contributors asked for financial market liberalization to boost eco-nomic development. But neither these studies nor the basic theoreti-cal background of financial market liberalization of McKinnon and Shaw (both 1973) provide us with an analysis of economic devel-opment arising from wealth effects as result of changes in asset prices. A second aspect that has hardly ever been touched is the role of the stock exchange in the liberalization process (see as an excep-tion Atje and Jovanovic 1993). This paper therefore tries to combine these two neglected aspects and analyses wealth effects arising from changes in asset prices in national stock exchanges under the assumption of consumption changes due to wealth effects. Developments are implemented into an macroeconomic setting, which lead to the analysis of possible growth effects – changes in GNP – as a result of financial market liberalization, focusing on the national stock exchange. Greece will serve as a case study, since it suffered from a less developed finan-cial market during the period of banking sector and capital market liberalization. Banking regulation was heavy centralized and in-cluded severe qualitative and quantitative restrictions till the early 90s. Starting from the mid 1980s the banking sector as well as the stock exchange has gradually been liberalized. First deregulations concentrated in reducing the control of the state, later on, in the mid 90s the basic aim was to implement the guidelines of the European Union. Therefore the period observed, covers the mid 80s till the end of the century. To discuss the outcomes critically, results are compared with evidences from Italy and Spain, economies with similar macroeconomic developments. As it regards the methodical approach, this paper follows the argu-mentation of financial liberalization theorists in the 70s, which used a partial comparative statistical analysis to show the interdepend-ence of specific variables. Although the author is aware of the fact,

Springler: Financial Liberalization, Stock Markets and Growth 55
that important external influences cannot be analyzed that way, this methodical approach seems to be the best alternative given the in-capability of econometric approaches, as discussed below, to show any valuable results when analysing the wealth and asset price ef-fects. Additionally a close connection to the argumentation of fi-nancial liberalization theorists is given, when choosing this me-thodical approach. The paper will proceed as follows: Section two will show the argu-mentation of financial liberalization and the critiques on the theo-retical arguments as a starting point; furthermore Greece will be presented as a critical case study. Theoretical arguments for the linkage between developments of the stock exchange and the fol-lowing changes in asset prices as well as the interrelation of increas-ing economic development (GNP development) and changes of as-set prices are discussed in section three. Section four shows the em-pirical evidence for Greece by analyzing developments on the Ath-ens Stock Exchange (ASE). 2. Starting Point: The Story of Financial Liberalization and
Greece as Case Study The regulation of the financial markets, which implies among other measures: interest ceilings, high reserve ratios and implicit credit programs, leads to lower investment ratios and has furthermore a negative impact on growth, according to financial liberalization theorists. The roots of a clear formulated liberalization theory for financial markets traces back to the works of McKinnon (1973) and Shaw (1973), which aimed to explain persisting growth disparities between countries. The crucial factor for the poor performance of less developed countries or ‘fragmented economies’, as McKinnon calls those countries due to their special structure of economic in-terdependence of firms, households and the state, was found in the role of the state on domestic financial markets. Especially methods like interest ceilings and the administratively guided allocation of loans in certain industrial areas, seem to cause ‘financial repres-sion’ which leads to qualitative and quantitative distortions in in-vestment; further on these distortions cause economic inefficiencies and repress economic development in less developed countries.
56 European Political Economy Review
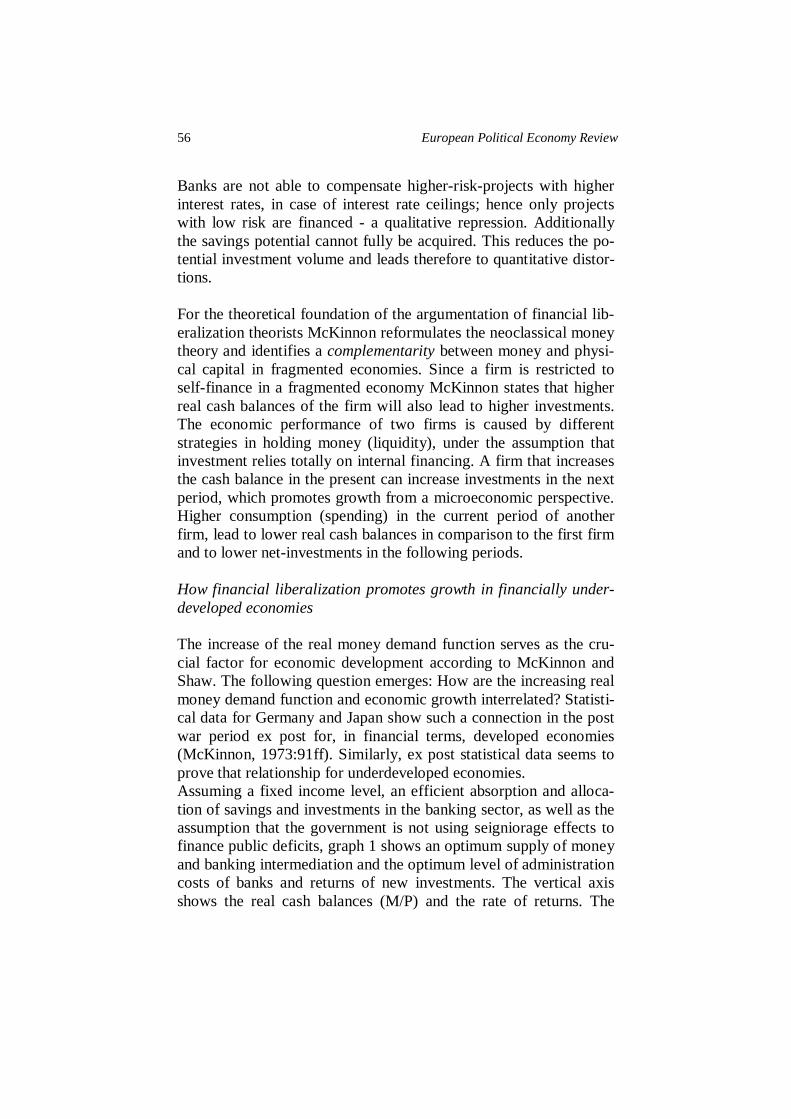
Banks are not able to compensate higher-risk-projects with higher interest rates, in case of interest rate ceilings; hence only projects with low risk are financed - a qualitative repression. Additionally the savings potential cannot fully be acquired. This reduces the po-tential investment volume and leads therefore to quantitative distor-tions. For the theoretical foundation of the argumentation of financial lib-eralization theorists McKinnon reformulates the neoclassical money theory and identifies a complementarity between money and physi-cal capital in fragmented economies. Since a firm is restricted to self-finance in a fragmented economy McKinnon states that higher real cash balances of the firm will also lead to higher investments. The economic performance of two firms is caused by different strategies in holding money (liquidity), under the assumption that investment relies totally on internal financing. A firm that increases the cash balance in the present can increase investments in the next period, which promotes growth from a microeconomic perspective. Higher consumption (spending) in the current period of another firm, lead to lower real cash balances in comparison to the first firm and to lower net-investments in the following periods. How financial liberalization promotes growth in financially under-developed economies The increase of the real money demand function serves as the cru-cial factor for economic development according to McKinnon and Shaw. The following question emerges: How are the increasing real money demand function and economic growth interrelated? Statisti-cal data for Germany and Japan show such a connection in the post war period ex post for, in financial terms, developed economies (McKinnon, 1973:91ff). Similarly, ex post statistical data seems to prove that relationship for underdeveloped economies. Assuming a fixed income level, an efficient absorption and alloca-tion of savings and investments in the banking sector, as well as the assumption that the government is not using seigniorage effects to finance public deficits, graph 1 shows an optimum supply of money and banking intermediation and the optimum level of administration costs of banks and returns of new investments. The vertical axis shows the real cash balances (M/P) and the rate of returns. The

Springler: Financial Liberalization, Stock Markets and Growth 57
curve CD stands for the real rate of return of cash balances (d-P). The line AB shows the increasing and in the following decreasing marginal rate of returns of investments.
Graph 1 Optimum supply of money at a fixed income-level
Source: McKinnon, 1973: 120
At the level AE is the average marginal return of investments in-creasing. The indivisibility of investments is set off, according to McKinnon (1973: 121), during the rise of financial systems, when the real returns are raising (up to a certain level of new capital ac-cumulation). Therefore, the dotted area, which surrounds the AB line, shows decreasing differences between real returns on invest-ment projects; these differences characterize an underdeveloped fragmented economy. Increasing banking efficiency is demon-strated by the line NN’ – the marginal costs of banking intermedia-tion – and the downward sloping QR line, which symbolizes the seigniorage effects. In the course of development, the banking sec-
G
Q
N
A
Real Returns on cash balances
F
R
L J
Seigniorage
Marginal Returns on Investment
N’ Marginal costs of banking intermediation
Real cash balances, M/P
Returns
B
E
58 European Political Economy Review
tor’s marginal costs remain constant, since innovation of new bank-ing products hamper the decrease of marginal costs of banking products. The optimum is shown in point J in graph 1. Real returns on cash balances including the marginal costs of banking interme-diation equal the marginal returns on investment in this point, since JR equals GF. Although an enlargement of the banking sector be-yond this point would further decrease differences in revenues – till point L is reached – but the costs of the banking sector are not fa-vorable. To find an answer to the question whether financial liber-alization could promote economic growth and employment, the theoretical argumentation of McKinnon and Shaw has to be imple-mented into causal chains, which are empirically testable. Financial liberalization theorists concentrate on partial analysis which enable detailed ex post analysis of the potential causal arguments for the interrelation between financial liberalization and economic growth. Three steps have to be clarified: First the interrelation between in-terest rates and savings has to be settled. Secondly the positive rela-tionship between investment-level and the possibility of taking loans has to be clarified. Thirdly improvements in the efficiencies of investments are supposed to increase the quality of investment-project (in terms of comparing the level of risk and potential return). These improvement can be achieved with a rise in efficiency, so that not only quantitative but also qualitative distortions can be off-set. Several empirically studies (Fry, 1988, 1978; Voridis, 1993; Dutta and Polemarchakis, 1988) seem to prove these interrelations. Apart from partial analyses, Gupta and Lensink (1996) also unite the three aspects described above in a single model, which consist of three sectors – the private sector, the banking sector and the public sector. According to this model a positive relationship between financial liberalization and economic growth cannot be found, the results not determined. Empirical evidence and ‘new’ liberalization theorists In the 80s and 90s empirical evidence has shown a different sce-nario than the proposed argumentation of McKinnon and Shaw. Many economies, which have followed the advice of liberalization theorists and have deregulated their financial markets, faced heavy

Springler: Financial Liberalization, Stock Markets and Growth 59
financial crises followed by a breakdown of growth rates, raising in-flation and increasing unemployment rates. Often mentioned exam-ples in this respect are the banking crises of Japan, Argentina and Mexico in the 90s. Also many European countries faced increasing banking instability in this period, although the economic costs of fi-nancial instability have been much lower than in emerging markets (Demirgüc-Kunt and Detragiache 1998a). Owing to those effects, economists - especially Post-Keynesian economists like Arestis and Demetriades (1999), Wolfson (1993), have been heavily criticizing the basic assumptions of perfect competition and perfect informa-tion among market participants as well as the institutional-free analyses of liberalization theory in the 70s. They come to the con-clusion that the liberalization process has negative impacts on out-put and economic growth and promotes financial instability. As a reaction to these critiques ‘new’ liberalization theorists tried to incorporate a new set of preconditions, which must be fulfilled to enable financial market liberalization can be successful. Apart from a stable macroeconomic situation, that includes low inflation, no economic recession and fiscal stability, this framework incorporates as well institutional indicators (Hutchison 1999, Demirgüc-Kunt and Detragiache 1998b, 1999). These institutional indicators cover advice in handling deposit insurance systems in the banking sector as well as proposal for the position of the national central banks. Conversely to what have might been assumed, new liberalization theory did not fundamentally alter the argumentation of McKinnon and Shaw but added minimum criteria of macroeconomic stability and strict solutions for weak institutional intervention on financial markets. Therefore, it can be concluded that according to new liber-alization theorists financial fragility will only occur, if monetary au-thorities do not follow properly the advice given. (Fry, 1978, 1988, 1997) Given this background of financial liberalization theory Greece will serve as case study for the best potential scenario in this paper. The reasons for choosing Greece as case study can be split up into three lines of argumentation: (1) First, the Greek financial market is regarded as a less developed market and although economists often state that industrialized
60 European Political Economy Review
economies cannot be regarded as emerging markets the Greek fi-nancial market before the Liberalization of the 80s fulfils the crite-ria of emerging markets mentioned by Posner and Coleman (1998). According to Posner and Coleman (1998: 5f) an emerging financial market can be classified using four indicators. First, gross national product per head is far below of the average of an developed econ-omy. As a reference the definition of Stanley Morgan Capital Inter-national is given, which computes an average of 3,100$ GNP per head in an emerging market compared to an average of 20,535$ GNP per head in a developed economy. Secondly, restrictions for foreign investors and restrictions in capital mobility apply in these economies. The third indicator covers the risk situation of the econ-omy, which is higher in an emerging market due to higher instabil-ity in political and macroeconomic terms. The forth indicators marks the annual growth rate of the economy, which are supposed to be higher in emerging markets compared to developed economies.
Since financial liberalization theory deals with less developed coun-tries and emerging markets, the arguments of liberalization theorists should apply for Greece. (2) Second, discussing the methods of banking regulation, that were introduced by the Greek monetary authority it cannot be ne-glected, that all measures, that should, according to McKinnon and Shaw, cause ’financial repression’ were also implemented on the Greek banking sector. As mentioned above, the main argument for financial liberalization theorists against banking regulation were in-terest rate ceilings. Additionally credit allocation systems are sup-posed to hamper financial development by allocating loans in inef-ficient industries or branches of the economy. The Greek banking regulation system was established in the 50s to stabilize the economy after seven years of civil war. The measures concentrated mainly on three areas. Administratively fixed interest rates, a loan allocation system and additional restrictions to special banking institutions, like investment banks or the agricultural bank (Mannasakis 1986, Hein, Katsioupis and Thiess 1984). The loan al-location system covered three measures: Banks had to undertake compulsory investments in interest bearing treasury bills, compul-sory deposits at the central bank, which exceeded normal reserve

Springler: Financial Liberalization, Stock Markets and Growth 61
rates at the central bank and had to give additional rebate ratios on lending. Those ratios were depending on the industrial sector that the loan was given to. With those three measures the currency committee (the administrative monetary authority during that pe-riod) wanted to direct investments from ‘unproductive’ to more ’productive’ industrial sectors (Gortsos 1998, Gotis 1989). Therefore massive qualitative and quantitative distortions could be expected, following McKinnon and Shaw. Therefore, economic ac-tivity and growth should increase once these measure were abol-ished. Table1: Methods of Banking regulation in Greece and the proc-
ess of liberalization Areas of financial repression
Methods in Greece
Phase 1 (1982-1986)
Phase 2 (1987-1991) Karatzas Report
Phase 3 (1992-now)
Interest rate ceil-ings
Administrative fixed interest rates on loans and deposits
Reestablish-ment of positive real interest rates on loans and deposits. (1987) Market deter-mination of in-terest rate lev-els.
Loan allo-cation
Loan allocation in favoured sec-tors. Higher reserve rates and non-interest deposits at the central bank for loans to un-favoured sectors
Abandoning of all measures of public loan al-location. (1993) Abandoning of reserve rates depending on loans for differ-ent industries. (1993)
General aim: independent monetary pol-icy
General aim: reduction of re-strictions in the banking sector
General aim: implementation of guidelines of the European Union
62 European Political Economy Review
Table 1 gives an overview of the methods of banking regulation in Greece and shows the three phases of the liberalization process. The distinction into three phases of banking regulation follows the analysis of Gortsos (1998: 8f). As observable in table 1, the main part of banking regulation was done from 1987-1993, following the so-called “Karatzas” Report of 1986, in which proposals for a quick and sustainable banking regulation were laid down. The first phase of liberalization does not include any severe changes in the methods of banking regulation, but aims to set up an independent monetary policy and independent central bank. Since the most repressive parts of the banking regulation – interest rate ceilings – were abandoned in 1987, this year is often mentioned as end of banking regulation in Greece, although the second main area of banking regulation – loan allocation mechanisms – were completely abandoned only in 1993 (Panagopoulos and Spiliotis, 1998). The period after (1993-now) is counted as third part of banking liberalization, were guidelines of the European Union were implemented and aimed to increase com-petition and profitability in the banking sector. (3) Thirdly, it is important to note that Greece did not suffer from banking instability and banking crises like other less developed countries after deregulation of the banking sector. Positive growth effects after banking deregulation? Although Greece can serve as a critical case study and best case scenario, it can be shown, that economic growth rates were not di-rectly positively affected, when concentrating on the liberalization of the banking sector (Dutta and Polemarchakis 1989, Gibson and Tsakalotos, 1992). First the Greek story followed the forecasts: McKinnon and Shaw stated that the increase in the real return on holding money - due to the abolishing of interest ceilings - would lead to an increase of the ratio of money supply M2 ,which includes apart from the money in circulation also savings and time deposits, and GNP. Graph 2 shows the empirical evidences for these arguments for Greece. It can be seen, that the real return on holding money increased after liberaliz-ing interest rates; also seemed the money supply M2 to follow the argumentation of financial liberalization theory. Between 1980 and

Springler: Financial Liberalization, Stock Markets and Growth 63
1985 the ratio of M2 to GNP increased from 0.619 to 0.810, such a sharp increase in a 5-years period could neither be observed before nor after. Graph 2 shows the real return on holding money on the right axis and the ration M2 to GNP on the left vertical axis. In the period 1960-1987 heavy regulations accompanied with negative real1 returns on money could be observed, which means that only increases in the M2/GNP ratio after the liberalization of interest rates in 1987 would be in line with the argumentation of financial liberalization theory. Comparing the development between the M2/GNP ratio and the real return on holding money in the 70s it be-comes evident that the ratio M2/GNP follows the trend in real re-turns on holding money. Graph 2: Ratio M2/GNP and the Real return on holding money
0,20,30,40,50,60,70,80,9
1960
1963
1966
1969
1972
1975
1978
1981
1984
1987
1990
1993
1996
1999
-25-20-15-10-5051015
M2/GNP Dep.r./WPI
Data source: OECD, Economic Surveys, Greece, various Issues, IMF Database
Despite of this weak evidence for the argumentation of the increase of M2/GNP ratio due to financial market liberalization the fore-casted process stopped at the following causality completely: Due to increases in M2 also the quantity of private investment should rise, since interest ceilings operate as a financial constraint and hinder the development of private investment.
1 adjusted by the whole sale price index due to data availability

64 European Political Economy Review
As graph 3 indicates, no evidence can be found, that the quantity of investment increased due to the liberalization of interest rates. Nei-ther credit financed private investment, nor the real return on hold-ing money increased during the 80s. Facing this empirical evidence it can be concluded that Greece did not hold its’ promises from the view of liberalisation theorists. Although the banking sector is of major importance for the Greek economy. Concluding now that fi-nancial market liberalization did not lead to positive growth effects - not even in the best case scenario - would leave apart the devel-opment of the stock exchange, which indeed might have a positive impact on economic growth. To analyze these causalities the paper investigates in the following the developments of the stock ex-change as a missing aspect of liberalization theory.
Graph 3: Private Investment and Financial Constraints
00,10,20,30,40,50,6
1961
1964
1967
1970
1973
1976
1979
1982
1985
1988
1991
1994
1997
2000
-30-20-1001020
credit financed private investmentreal return on holding money / WPIaverage real return on holding moneyaverage credit financed priv. inv.
Data source: OECD, Economic Surveys, Greece, various issues IMF Database
3. Theoretical Arguments: Stock Exchange, Wealth and
Growth Especially in the mid 90s, stock exchanges of liberalized financial markets have been characterized by increased market capitalization and an even stronger rise of secondary market volume (Huffschmid, 1999). Due to this development also changes in asset prices become more important.

Springler: Financial Liberalization, Stock Markets and Growth 65
Numerous econometric studies, which are summarized by Altissimo, et. al. (2005), have tried to capture the interrelation between asset price changes and economic growth via consumption and invest-ment developments. Despite of clearly formulated theoretical back-grounds (see Altissimo et. al. 2005: part 2 and 4), unfortunately no empirical results can be presented that might serve as overall con-clusion. In general, four channels can be distinguished depending on the actor (firm or household) affected by the change of asset prices (compare graph 4): First the wealth effect states that current consumption of households (consumers) is proportional to the total wealth of households under the assumption of maximizing in-tertemporal utility under a lifetime resource constraint (among oth-ers Poterba 2000: 103). The second effect deals with the interrela-tion of asset prices and investment and states, that changes in equity prices might affect corporate sector investment (firms) by influenc-ing the cost of capital, which has be formalized by Tobin’s Q (Al-tissimo et. al 2005; Chatelain et al. 2001). Effects on residential in-vestment (households) are of minor importance in this respect (econometric studies) due to markedly variations in the results across countries (Altissimo et. al. 2005: 34). For the other two channels, empirical evidence is even harder to find as for the Tobin’s Q channel (see Altissimo et al. 2005: 4) and are therefore excluded from graph 4. One of these channels is the balance-sheet channel dealing with the need of a firm to increase its net worth to reduce its external finance premium (Chatelain et al. 2001). Changes in the net worth directly reflect changes in the financial position of the firm. The forth channels concentrates on the poten-tial effect of changes in confidence in markets and intermediaries due to changes in asset prices. A decrease in asset prices might therefore lower the confidence in the market and lead in the follow-ing to lower investment and consumption (Altissimo et al. 2005: Appendix 3)

66 European Political Economy Review
Graph 4: Channels of asset price effects on economic activity (measured by GNP)
Taking this theoretical background as a starting point, it turns out that, in contradiction to the argumentation of financial liberalization theorists described in section 1 and 2, the analysis has to focus pri-marily on effects on consumption and not investment, since empiri-cal evidence presented in Poterba (2000) and Altissimo et al. (2005) shows, that consumption effects are observable in all economies us-ing econometric analysis, whereas investment effect also depend on the financial structure and are therefore very weak in bank based economies. Since the Greek financial sector can also be classified as a bank based financial system, expected effects are supposed to be small. As Greek households increased their holdings of shares sub-stantially in the late 90s (especially from 1998-2000), when house-holds held in 2000 41 billion EURO worth of equities and 23.2 bil-lion EURO worth of debt securities, which equalled 36.2% and 20.5% of GDP, concentrating on the consumption channel (wealth effect) seems to be reasonable and in line with the focus on Greece as best case scenario. Similarly to the analysis in section 2 of this paper, discussing the in-terrelation between asset price changes and economic development will follow on the one hand a similar methodical approach as finan-cial liberalization theorists by using a step by step ex post compara-tive statistical analysis – bearing in mind that this will not show a full picture of macroeconomic linkages - and will establish on the
Changes in as-set prices
Households
Firms
State
Consumption Wealth effect Investment: Tobin’s Q Ef-fect (Taxes, Ex-penditure)
Aggregate demand
Growth

Springler: Financial Liberalization, Stock Markets and Growth 67
other hand a best case scenario by relaying on the potential con-sumption effects in Greece. Concentrating on potential wealth effects for households several general assumptions have to be made: Whenever stock prices in-crease more than the consumer price index this real changes are re-garded as an increase in wealth. How far these changes effect con-sumption depend on the rationality of households. If households act completely rational, these gains from share price changes will affect consumption immediately regardless whether gains are realized or not. If they do not act rational, not realized gains at the stock ex-change will not count as wealth increase, since individuals fear the loss of those gains in the short run. To keep the argumentation in the following more simple, households are therefore regarded as acting rational. Furthermore for the following analysis fixed interest rate securities are not taken into account, since gains from changes in prices cannot be analysed independently from changes in interest rates. Basing on these assumptions, the reaction of households to changes in asset prices can be derived from the savings and consumption function. As Jäckle (1991: 40) shows, households can take three dif-ferent positions: seller, buyer and ‘hold on’. It can be shown, that the position of the seller has a bigger effect on consumption deci-sions, than the position of the buyer (Jäckle 1991: 56). If shares are bought to sell them again in the future and are not meant to serve as savings, the contradictional effect of a wealth reduction because of buying shares will be small. The position of ’holding on’ has the same effect as the position of the seller, since it is assumed that in-dividuals react rational and give the same importance to realized and not realized gains from changes in asset prices. Similarly, gains from changes in asset prices also affect consumption decisions in the ‘hold on’ position. Therefore, the main point in deriving possi-ble reactions of households is to identify several scenarios for households in ‘seller’ and ‘hold on’ position. As the following table 2 shows four possible cases can be distinguished.

68 European Political Economy Review
Table 2: Households – position: seller
Cases Reactions to gains from asset prices changes
High wealth/ large financial as-sets
Consumption unchanged
High wealth / small financial as-sets
Consumption increase
Low wealth / large financial as. Consumption increase Low wealth /small financial as. Consumption increase
Source: Jäckle (1991: 63)
�
Under the assumption that households with high wealth hold a small fraction of their wealth in financial assets, gains from asset price changes will only have a minor effect on consumption and are therefore neglectable. All three other cases presented in table 2 offer a stronger reaction to these developments. Out of the remaining three scenarios, the total effect on consump-tion in the case of low wealth combined with a high amount of fi-nancial assets will be small, since this combination does not seem very likely. The existence of the combination low wealth and small financial assets can be derived from the fact, that firms give com-pany-shares to their employees as part of their income. Therefore also households can accumulate a small fraction of financial assets, although their income derived from labour might not be high enough to generate financial assets out of savings and their wealth is still low. In this case gains from asset price changes are again quoted as immediate changes in wealth and create a consumption effect. The combination of high wealth and low financial assets can be argued with of risk adversity of higher income classes. Here a higher savings ratio can be identified as stronger reliance on savings accounts – setting up financial wealth - than on participation of households on shares, stakes and investment certificates (market denominated assets). The hypothesis, that can be derived is, that the biggest effect will arise when financial assets are distributed widely between middle class households. Therefore, the existence of a middle class accumulating wealth via financial assets becomes an important factor.
Springler: Financial Liberalization, Stock Markets and Growth 69
Growth effects can be manifested by deriving Keynesian multiplier effects out of an adapted consumption function, which integrates the changes in consumption that might occur due to changes in asset prices, as shown in function (1). Autonomous consumption is not included in the following functions.
YcYcC wy ∗+∗= (1)
�
yc marginal propensity to consume from current income Y current income, which consists of current income from labour and current income from wealth (asset price changes)
wc marginal propensity to consume from asset price change The new consumption function consists of consumption based on current income and of consumption based on asset price changes. Therefore, assuming investments and government expenditure to be constant, the following aggregate demand function can be derived (2).
( ) ( )wy ccGIY −−+= 1/ (2) I � Investment�G � government spending�Y � aggregate demand
�
This modified aggregate demand function also leads to a modifica-tion in the investment or expenditure multiplier ( wm ) (3). ( ) wwy mcc =−−1/1 � � (3)
�
In this case, the multiplier effect is bigger compared to the normal investment multiplier, which consists of a different numerator. Al-though cw is not only smaller than one but also smaller than the marginal propensity to consume from current labour income, the to-tal multiplier effect will be bigger than without including wealth ef-fects. Marginal propensity to save diminishes as part of savings are put into financial assets, which in turn lead to higher consumption
70 European Political Economy Review
via realized gains in asset price changes and increase current in-come as a sum from labour income and income from changes in as-set prices.2 But can those theoretical arguments give insights into the develop-ment of the Greek economy? � 4. Evidence for Greece Firstly, the development of the Greek stock exchange is presented and discussed in relation to other Southern European Countries, which undertook similar structural changes in financial markets, to see whether changes follow cyclical and overall macroeconomic developments or if they are individually determined by the Greek economy. Secondly, wealth effects are discussed in Greece and other Southern European Countries. Are changes in share prices observable? Only if changes in share prices can be observed, the causal argu-mentation of the financial liberalization theory can be discussed. In contrast to the stock exchange of Thessalonica, that was founded in 1996 and because of its minor importance is not included in the fol-lowing analysis, the Athens stock exchange has a long tradition. However, till the mid 80s the stock exchange suffered from a small market size in tradable shares and bonds (Psalits 1996: 35, Euro-money 1996: 2). At the same time (1988) when remarkable changes in the banking sector took place, also institutional and legal changes affected the Athens Stock exchange - also called ’Sophokleos’ - and helped to create a modern stock exchange. In the 90s further legal reforms improved transparency and regulation at Sophokleos. These reforms led to the establishment of a market for derivates in 1999 (Athener Zeitung 1999: 9/1). Indeed, the importance of the Athens
2 Additional effects on the multiplier seem to be likely, when firms and changes
in their investment functions due to stock exchange effects would be taken into account as well – see the discussion of wealth channels above. Jäckle (1991) shows, that in this case the total effect on the multiplier would be even bigger.
Springler: Financial Liberalization, Stock Markets and Growth 71
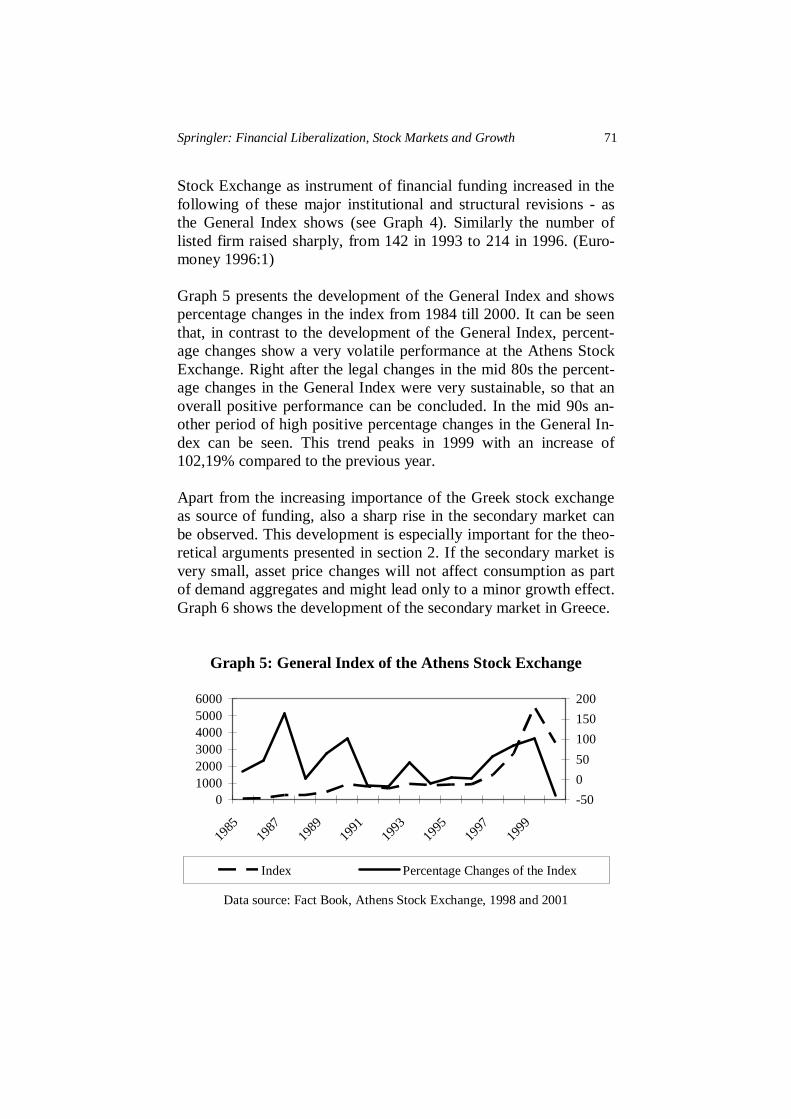
Stock Exchange as instrument of financial funding increased in the following of these major institutional and structural revisions - as the General Index shows (see Graph 4). Similarly the number of listed firm raised sharply, from 142 in 1993 to 214 in 1996. (Euro-money 1996:1) Graph 5 presents the development of the General Index and shows percentage changes in the index from 1984 till 2000. It can be seen that, in contrast to the development of the General Index, percent-age changes show a very volatile performance at the Athens Stock Exchange. Right after the legal changes in the mid 80s the percent-age changes in the General Index were very sustainable, so that an overall positive performance can be concluded. In the mid 90s an-other period of high positive percentage changes in the General In-dex can be seen. This trend peaks in 1999 with an increase of 102,19% compared to the previous year. Apart from the increasing importance of the Greek stock exchange as source of funding, also a sharp rise in the secondary market can be observed. This development is especially important for the theo-retical arguments presented in section 2. If the secondary market is very small, asset price changes will not affect consumption as part of demand aggregates and might lead only to a minor growth effect. Graph 6 shows the development of the secondary market in Greece.
Graph 5: General Index of the Athens Stock Exchange
0100020003000400050006000
1985
1987
1989
1991
1993
1995
1997
1999
-50
0
50
100
150
200
Index Percentage Changes of the Index
Data source: Fact Book, Athens Stock Exchange, 1998 and 2001

72 European Political Economy Review
Graph 6: Comparison secondary market to primary market at the Athens Stock Exchange (Millions of Drachmae)
01000000020000000300000004000000050000000600000007000000080000000
1988
1989
1990
1991
1992
1993
1994
1995
1996
1997
1998
1999
2000
shares/turnover shares/market capitalisation
Data source: Fact Book, Athens Stock Exchange, 1998 and 2001 The reason for comparing Greece with the development of other Southern European economies is to show, that the Greek develop-ment of the stock exchange does hardly show any difference from other countries. But there are differences in volatility. Italy and Spain have been chosen for the comparison because all three coun-tries are members in the European Union and faced the same diffi-culties of high unemployment and inflation rates in the period of observation. Although there are national differences, the Southern European Re-gion suffered basically from the same economic problems. By in-troducing similar economies, which are affected by macroeconomic developments in the same way, does not fully offset the methodical weaknesses of the ex-post comparative statistical analysis, but helps to control for macroeconomic shocks. Graph 7 shows the development of the Index and the percentage changes in the Index of the Stock Exchanges in Italy and Spain (Madrid). The Index is increasing from the early 80s till the end of the century in both countries. In the mid 80s (1986/87) a short de-cline is visible, which becomes more obvious by looking at the per-

Springler: Financial Liberalization, Stock Markets and Growth 73
centage changes in the Index. In Italy a decline in the Index of 32% in 1987 could be observed. A similar development can be seen in Spain. In this case did not manifest in a decline of Index, but in weaker growth rates (9% in 1987) of the Index after the peak of 108% in 1986. Those changes are similar to the developments at the Greek Stock Exchange although Greece faced a higher volatility of the Index. This trend proceeded also in the 90s.
Graph 7: Development of the Index of the Stock Exchange in Italy and Spain (Madrid)
a. Italy
05000
100001500020000250003000035000
1981
1983
1985
1987
1989
1991
1993
1995
1997
1999-50
0
50
100
150
General Index % Change in Index
Data Source: Italian Stock Exchange, Fact Book 2001
b. Spain
0200400600800
10001200
1986
1987
1988
1989
1990
1991
1992
1993
1994
1995
1996
1997
1998
1999
2000
-50
0
50
100
150
General Index Percentage Change of the Index
Data Source: Madrid Stock Exchange, Fact Book 2002

74 European Political Economy Review
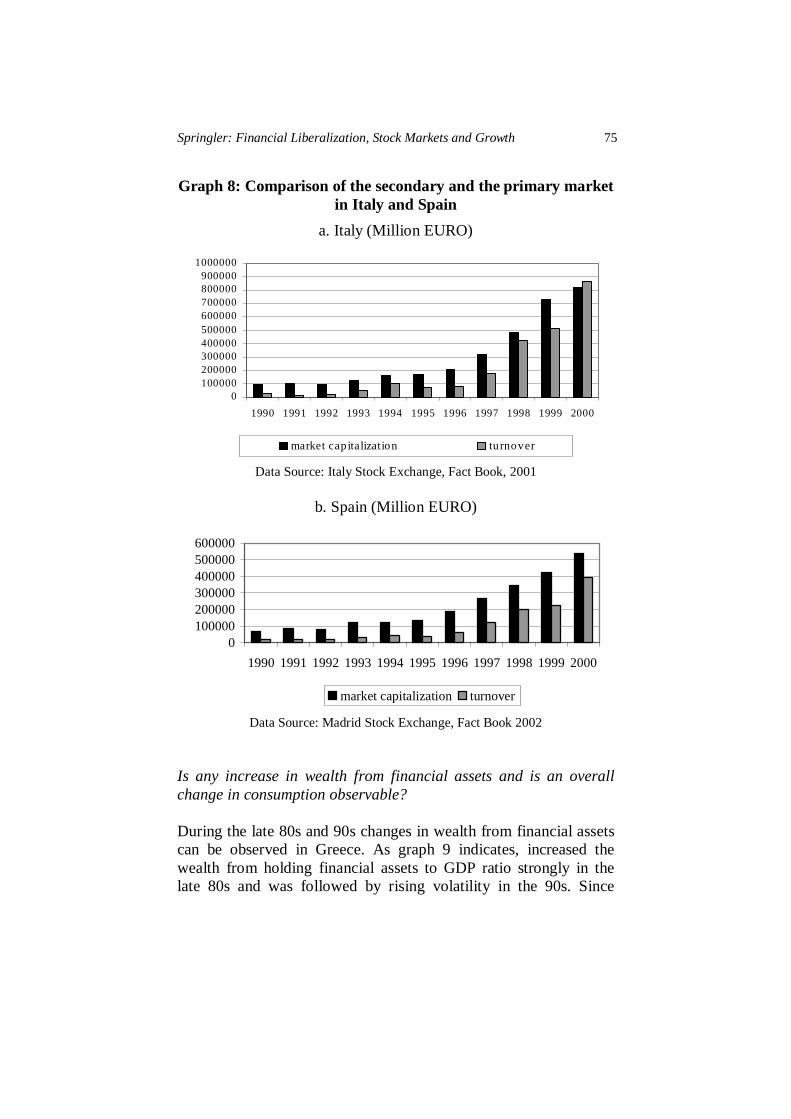
Comparing those three southern European Countries, Greece, Italy and Spain, another aspect of financial markets development be-comes inevitable. At the Greek Stock Exchange a much stronger rise in the Index can be seen than in the other countries. From 1985 to 2000 the Index of the Athens Stock Exchange climbed up from 70.95 to 3388.86 points and reached a peak 1999 at 5535.09 points. Compared to this, the Index of the Italian Stock Exchange increased from 2935 points in 1985 to 29681 points in 2000 and the Index of the Stock Exchange in Madrid rose from 280.3 points in 1986 to 880.7 points in 2000. The highest increase can therefore be ob-served in Greece with a 4776% rise in the Index of the Athens Stock Exchange in the respective period, followed by the Index of the Italian Stock Exchange, that showed an increase of 1011% and the Madrid Stock Exchange Index with an increase of 314% . In Southern European Countries similar conclusions, regarding the development of national stock exchanges, can be drawn by looking at capitalization and turnover of the stock exchanges. Graph 8 shows the primary and secondary markets in Italy and Spain as a comparison to the Greek development. Again Greece faced the strongest percentage increase. In all three economies secondary market turnover was increasing stronger than market capitalization and even exceeded market capitalization in Italy in 2000. The ques-tion asked above, whether asset prices changes occurred, can be an-swered positively, since market capitalization and trading, as well as volatility increased in Greece after financial liberalization. Therefore, the analysis proceeds with the discussion of the causali-ties implied in the argumentation of financial liberalization theory. Basically, the discussion ranks around two questions: Is there any increase in wealth from financial assets and is an overall change in consumption observable? If a change in consumption can be ob-served, can this fact be linked to the development of share prices?
Springler: Financial Liberalization, Stock Markets and Growth 75
Graph 8: Comparison of the secondary and the primary market in Italy and Spain
a. Italy (Million EURO)
0100000200000300000400000500000600000700000800000900000
1000000
1990 1991 1992 1993 1994 1995 1996 1997 1998 1999 2000
market capitalization turnover
Data Source: Italy Stock Exchange, Fact Book, 2001
b. Spain (Million EURO)
0100000200000300000400000500000600000
1990 1991 1992 1993 1994 1995 1996 1997 1998 1999 2000
market capitalization turnover
Data Source: Madrid Stock Exchange, Fact Book 2002 Is any increase in wealth from financial assets and is an overall change in consumption observable? During the late 80s and 90s changes in wealth from financial assets can be observed in Greece. As graph 9 indicates, increased the wealth from holding financial assets to GDP ratio strongly in the late 80s and was followed by rising volatility in the 90s. Since

76 European Political Economy Review
wealth accumulation from financial assts was not increasing con-tinuously, the general effect of asset price changes on consumption and growth can be regarded as rather small. Nevertheless, it is worth looking at potential effects to see whether the causal argu-mentation of the financial liberalization theory holds, no matter how big the effects are.
Graph 9: Percentage changes in consumption and percentage changes of financial assets to GDP ratio
-20
-10
0
10
20
30
40
50
60
1982
1983
1984
1985
1986
1987
1988
1989
1990
1991
1992
1993
1994
1995
Percentage changes in consumptionPercentage changes in ratio property income to GDP
Data source: OECD, Economic Surveys, Greece, various Issues
�
Graph 9 also gives insights in the relationship between changes in consumption and wealth from financial assets. As stated in section two, an increase in wealth from financial assets would lead to changes in consumption, although these changes are smaller due to a smaller marginal rate of propensity for wealth changes arising from financial asset price changes than for wage income (compare equations 2 and 3). The relationship is also valid for Greece as graph 9 shows. Developments in wealth from financial assets are combined with smaller percentage changes in consumption follow-ing the same trend. The question that arises now, is whether changes in wealth from financial assets can be related to the devel-opment of the stock exchange and do not reflect increased income from entrepreneurship.
Springler: Financial Liberalization, Stock Markets and Growth 77
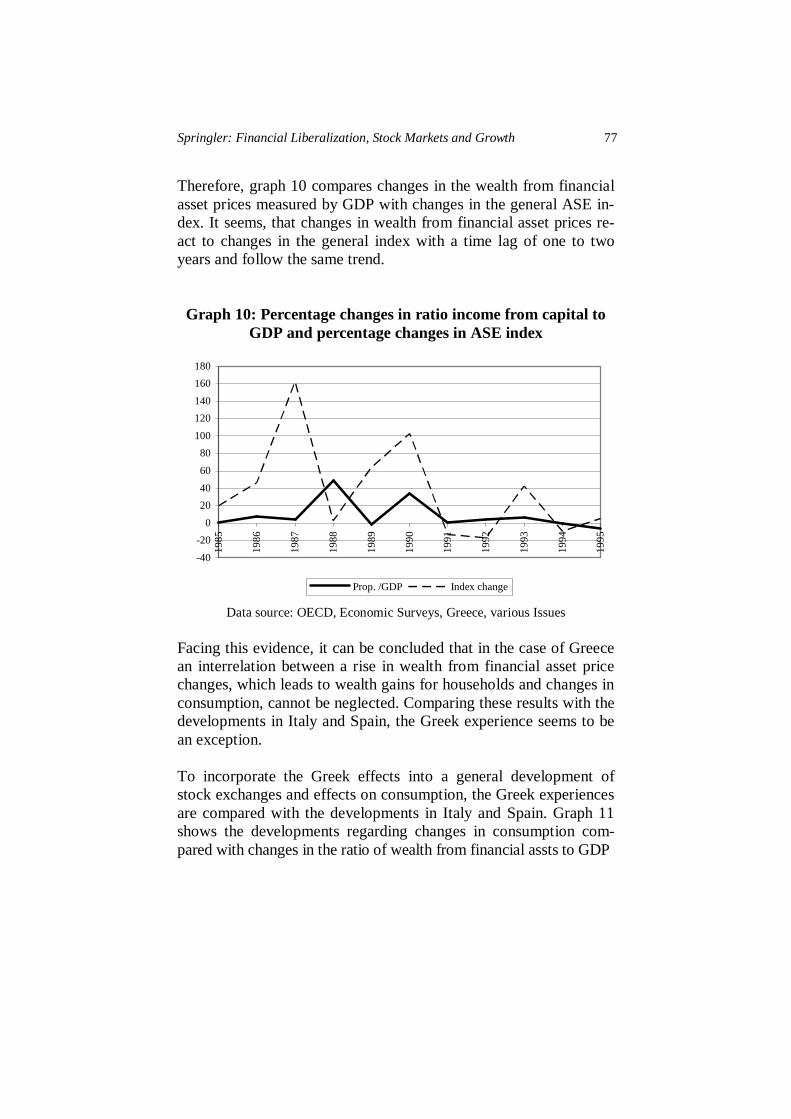
Therefore, graph 10 compares changes in the wealth from financial asset prices measured by GDP with changes in the general ASE in-dex. It seems, that changes in wealth from financial asset prices re-act to changes in the general index with a time lag of one to two years and follow the same trend.
Graph 10: Percentage changes in ratio income from capital to GDP and percentage changes in ASE index
-40
-20
0
20
40
60
80
100
120
140
160
180
1985
1986
1987
1988
1989
1990
1991
1992
1993
1994
1995
Prop. /GDP Index change
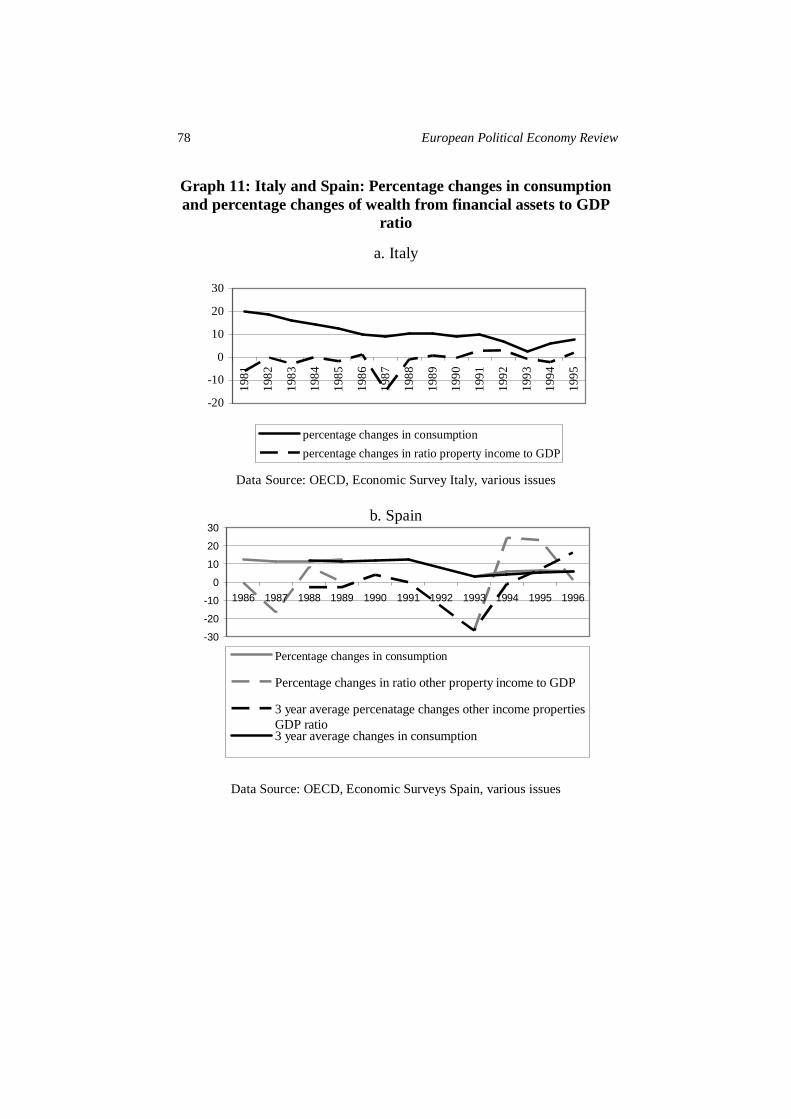
Data source: OECD, Economic Surveys, Greece, various Issues Facing this evidence, it can be concluded that in the case of Greece an interrelation between a rise in wealth from financial asset price changes, which leads to wealth gains for households and changes in consumption, cannot be neglected. Comparing these results with the developments in Italy and Spain, the Greek experience seems to be an exception. To incorporate the Greek effects into a general development of stock exchanges and effects on consumption, the Greek experiences are compared with the developments in Italy and Spain. Graph 11 shows the developments regarding changes in consumption com-pared with changes in the ratio of wealth from financial assts to GDP
78 European Political Economy Review
Graph 11: Italy and Spain: Percentage changes in consumption and percentage changes of wealth from financial assets to GDP
ratio
a. Italy
-20
-10
0
10
20
30
1981
1982
1983
1984
1985
1986
1987
1988
1989
1990
1991
1992
1993
1994
1995
percentage changes in consumption
percentage changes in ratio property income to GDP
Data Source: OECD, Economic Survey Italy, various issues
b. Spain �
Data Source: OECD, Economic Surveys Spain, various issues
-30
-20
-10
0
10
20
30
1986 1987 1988 1989 1990 1991 1992 1993 1994 1995 1996
Percentage changes in consumption
Percentage changes in ratio other property income to GDP
3 year average percenatage changes other income propertiesGDP ratio3 year average changes in consumption
Springler: Financial Liberalization, Stock Markets and Growth 79
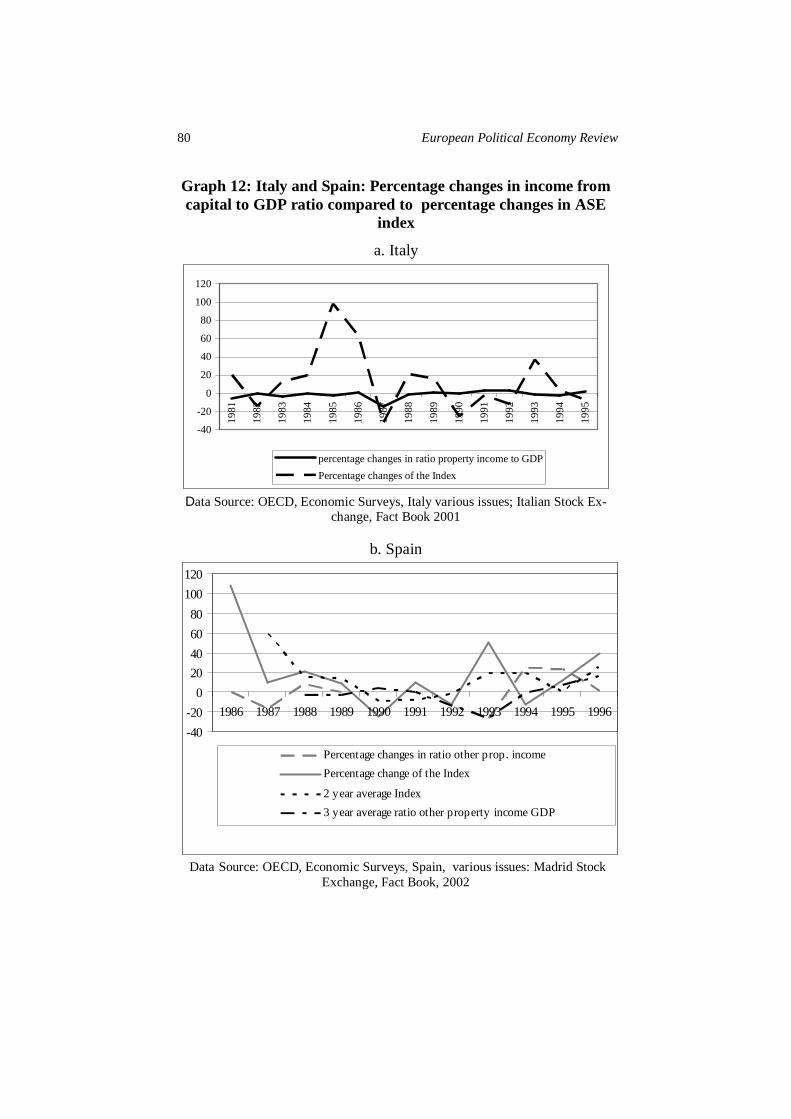
for Italy and Spain.3 Regarding the changes in consumption Italy and Spain follow the same development, although the percentage changes are constantly stronger in Italy than in Spain. Comparing these results with the evidence for Greece (graph 9), it can be con-cluded that changes in consumption as well as volatility are higher in Greece than in the other two economies. This argument gains further evidence when taking the ratio of per-centage changes of wealth from financial assets to GDP into ac-count and comparing these results with changes in consumption (graph 12). In Greece a strong correlation between changes in con-sumption and changes in the ratio of wealth from financial assets to GDP can be observed, whereas such a relation is not obvious nei-ther for Italy nor for Spain. (comparing graph 12 a, b with graph 10) Therefore, an overall effect of the development of the stock ex-change to increase consumption and increasing GDP by multiplier effects does not seem to be likely. The development of changes in the index of the national stock exchange in comparison to changes in wealth from financial assets is in line with this argument. Neither in Italy nor in Spain a correlation between those variables is visible according to the data above. Although the potential effects for eco-nomic growth can be assumed to be rather small in Greece and ne-glectable in other Southern European Countries it has to be asked, whether the distribution of financial assets contributes to the as-sumption made in section two and promotes the consumption of households.
3 In the case of Spain OECD data distinguishes between ‘property and entrepre-
neurial income’ and ‘other property income’, which is unfortunately not clearly defined. Both variables follow the same trend over the years (trend line for 3 years) although the variable ‘other property income’ shows a higher volatility. It seems plausible that ‘other property income’ summarizes interest rate income and property income arising from owning real estate, whereas property and en-trepreneurial income concentrates on income from independent work. Follow-ing this argumentation the analysis proceeds by concentrating on changes of ‘other property income’ – wealth from financial asset price changes are in-cluded here.
80 European Political Economy Review
Graph 12: Italy and Spain: Percentage changes in income from capital to GDP ratio compared to percentage changes in ASE
index �
a. Italy
-40
-20
0
20
40
60
80
100
120
1981
1982
1983
1984
1985
1986
1987
1988
1989
1990
1991
1992
1993
1994
1995
percentage changes in ratio property income to GDP
Percentage changes of the Index
Data Source: OECD, Economic Surveys, Italy various issues; Italian Stock Ex-change, Fact Book 2001
b. Spain
-40
-20
0
2040
60
80
100
120
1986 1987 1988 1989 1990 1991 1992 1993 1994 1995 1996
Percentage changes in ratio other prop. income
Percentage change of the Index
2 year average Index
3 year average ratio other property income GDP
Data Source: OECD, Economic Surveys, Spain, various issues: Madrid Stock Exchange, Fact Book, 2002
Springler: Financial Liberalization, Stock Markets and Growth 81
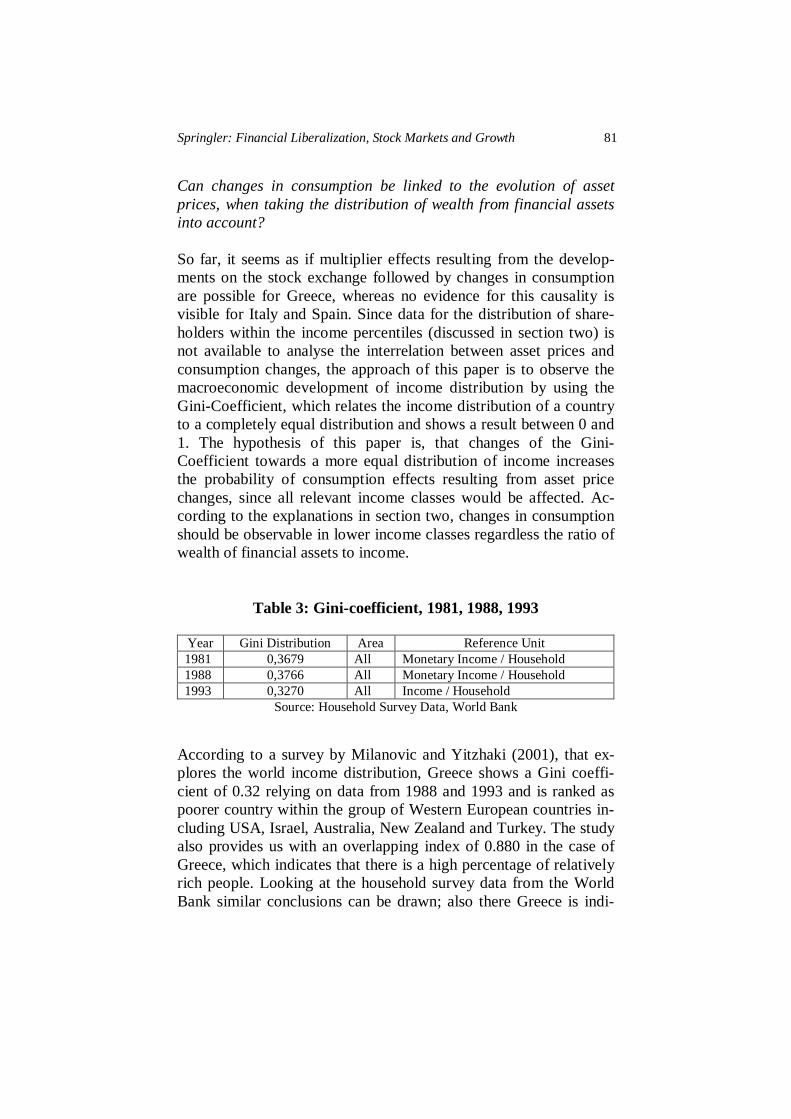
Can changes in consumption be linked to the evolution of asset prices, when taking the distribution of wealth from financial assets into account? So far, it seems as if multiplier effects resulting from the develop-ments on the stock exchange followed by changes in consumption are possible for Greece, whereas no evidence for this causality is visible for Italy and Spain. Since data for the distribution of share-holders within the income percentiles (discussed in section two) is not available to analyse the interrelation between asset prices and consumption changes, the approach of this paper is to observe the macroeconomic development of income distribution by using the Gini-Coefficient, which relates the income distribution of a country to a completely equal distribution and shows a result between 0 and 1. The hypothesis of this paper is, that changes of the Gini-Coefficient towards a more equal distribution of income increases the probability of consumption effects resulting from asset price changes, since all relevant income classes would be affected. Ac-cording to the explanations in section two, changes in consumption should be observable in lower income classes regardless the ratio of wealth of financial assets to income.
Table 3: Gini-coefficient, 1981, 1988, 1993
Year Gini Distribution Area Reference Unit 1981 0,3679 All Monetary Income / Household 1988 0,3766 All Monetary Income / Household 1993 0,3270 All Income / Household
Source: Household Survey Data, World Bank
According to a survey by Milanovic and Yitzhaki (2001), that ex-plores the world income distribution, Greece shows a Gini coeffi-cient of 0.32 relying on data from 1988 and 1993 and is ranked as poorer country within the group of Western European countries in-cluding USA, Israel, Australia, New Zealand and Turkey. The study also provides us with an overlapping index of 0.880 in the case of Greece, which indicates that there is a high percentage of relatively rich people. Looking at the household survey data from the World Bank similar conclusions can be drawn; also there Greece is indi-

82 European Political Economy Review
cated with a Gini-Coefficient of 0.327 in the year 1993 (table 3). Although the Gini-Coefficient does not provide us with data which people are holding shares, it can be stated, that income distribution in Greece became more equal since the Gini-Coefficient decreased between 1988 and 1993 from 0.36 to 0.32. Therefore it can be concluded, that consumption effects due to the development on the stock exchange seem to be likely although their quantitative effect can be regarded as small. This argument still holds, although it is not clear how many people are exactly holding shares and shareholding might be concentrated among few people. Conclusions In the short run, positive evidence regarding the influence of posi-tive wealth changes, arising from financial asset price changes, to consumption and growth can be found. On the other hand it has to be noted, that data indicates that increases in the stock exchange are connected with simultaneously increasing volatility. This shows, that it is very important to incorporate the linkages between the stock exchange and wealth effects into critical arguments regarding financial liberalization theory. Conversely any positive effect to GNP growth has to be doubted in the long run, since in the short run households can increase their wealth and increase consumption, whereas for a long term overall positive effect also potential losses in wealth and its strong negative effects on GNP growth have to be taken into account. Therefore, the argumentation of financial liber-alization theory does not seem to lead to the theoretically expected outcome – not even in the “best case” scenario. The case of Greece seems exactly to reflect this conclusion, al-though the microeconomic distribution of shareholding within in-come classes is still missing. There is a reaction of wealth from fi-nancial assets to changes in the general index of the Athens Stock Exchange; also consumption seems to react with a time lag to changes in wealth from financial assets and will therefore have an multiplier effect on GDP. It has to be taken into account, that in-come distribution becomes more equal and therefore the probability increases, that asset price changes affect consumption. Since
Springler: Financial Liberalization, Stock Markets and Growth 83
changes in wealth from financial assets do not reflect a trend through the last decades but seem to react very volatile and a rise in wealth from financial assets are followed by a decrease, the total ef-fect on GDP will be small. Further on the conclusion can be drawn, that the Greek example does not reflect the overall development as the comparison with Italy and Spain showed. Therefore the overall conclusion is, that there is no strong connec-tion between financial development and GNP growth via multiplier effects. Although no evidence could be found that the causal argu-mentation of financial liberalization theory is implausible the poten-tial positive effects are neglectable small. Since the Greek case showed an optimum basis for the analysis and suggested the best possible outcome the general effect of the liberalization of stock markets for growth has to be doubted. References ALTISSIMO Filippo, Evaggelia GEORGIOU, Teresa SASTRE, Maria Teresa
VALDERRAMA, Gabriel STERNE, Marc STOCKER, Mark WETH, Karl WHELAN and Alpo WILLMAN (2005), “Wealth and Asset Price on Eco-nomic Growth”, ECB Occasional Paper Series, No.29.
ANONYMOUS (1988), “Athens’ Big Bang”, The Banker, May. �
�
ANONYMOUS (1996), “Capital markets”, Euromoney, September.
�
ANONYMOUS (1999), “Obligationsmarkt nervös - Derivatenbörse startet“, A-thener Zeitung, 280, p.9/1.
ARESTIS Philip and Panicos DEMETRIADES (1999), ”Financial Liberalization:
The experience of developing countries”, Eastern Economic Journal, 25(4), pp.441-458.
ATHENS STOCK EXCHANGE: Fact Book, 1998, 2001. ATJE Raymond and Boyan JOVANOVOIC (1993), ”Stock markets and devel-
opment”, European Economic Review, 37, pp.632-640. DEMIRGÜC-KUNT Asli and Enrica DETRAGIACHE (1998a), ”The Determi-
nants of Banking Crises in Developing and Developed Countries”, IMF Staff Papers, 45(1).
84 European Political Economy Review
DEMIRGÜC-KUNT Asli and Enrica DETRAGIACHE (1998b), ”Financial Lib-
eralization and Financial Fragility”, IMF Working Paper, WP/98/83. DEMIRGÜC-KUNT Asli and Enrica DETRAGIACHE (1999), ”Does Deposit
Insurance increase Banking System Stability? An Empirical Investigation”, World Bank Working Paper, 2247.
DUTTA Jayasri and Heraklis POLEMARCHAKIS (1989), ”Credit Constraints
and Investment Finance: Some Evidence from Greece”, in: Mario Monti (ed.), Fiscal policy, Economic Adjustment and Financial Market, Washington, In-ternational Monetary Fund.
�
FRY Maxwell (1988), Money, Interest and Banking in Economic Development, Baltimore (Md.), Johns Hopkins University Press.
FRY Maxwell (1997), “In Favour for Liberalization”, The Economic Journal, 107,
pp.754-770. FRY Maxwell (1978), “Money and Capital or Financial Deepening in Economic
Development?” Journal of Money, Credit and Banking , 10(4), pp.464-475. GIBSON Heather and Euclid TSAKALOTOS (1992), “Economic Theory and the
Limits to Financial liberalization: Domestic Financial Liberalization in Greece, Portugal and Spain” in: Gibson, Tskalotos (ed.): Economic Integration and Financial Liberalization, Prospects of Southern Europe, Oxford, MacMillan Press.
CHATELAIN Jean-Bernard, Andrea GENERALE, I. HERNANDO, Ulf von
KALCKREUTH and Philip VERMEULEN (2001). „Firm Investment and Monetary Transmission in the Euro Area”, ECB Working Paper No.112.
GORTSOS Christos (1998), The Greek Banking System, Athens, Association of
Hellenic Banks. GOTIS Ch. (1989), “Regulierung und Deregulierung im Bankenwesen – der Fall
Griechenland” Bank Archiv, 37. GUPTA Kanhaya and Robert LENSINK (1996), Financial Liberalization and In-
vestment, London, Routledge. HEIN Manfred KATSIOUPIS Pavlos and Erich THIESS (1984), Struktur des
Bankwesens in Griechenland, Knapp. HUFFSCHMID Jörg (1999), Die politische Ökonomie der Finanzmärkte, Ham-
burg, VSA Verlag.

Springler: Financial Liberalization, Stock Markets and Growth 85
HUTCHISON Michael and Kathleen MCDILL (1999), “Are All Banking Crises Alike? The Japanese Experience in International Comparison”, NBER Work-ing Paper, No. 7253.
�
ITALIAN STOCK EXCHANGE (various years), Fact Book. JÄCKLE Joachim (1991), Nachfrage- und Verteilungswirkungen von Wertpa-
pierschwankungen, Pfaffenweiler, Centaurus Verl Ges.. KING Robert and Ross LEVINE (1993a), “Finance, Entrepreneurship and
growth”, Journal of Monetary Economics, 32, pp.513-542. KING Robert and Ross LEVINE (1993b), “Finance and Growth. Schumpeter
might be right”, The Quarterly journal of Economics, 108 (3), pp.717-737. LEVINE Ross (1997), “Financial Development and Economic Growth: Views
and Agenda”, Journal of Economic Literature, 35, pp.688-726.�
�
LEVINE Ross and Sara ZERVOS (1998), “Stock Markets, Banks and Economic Growth”, The American Economic Review, 88(3), pp.537-558.
MADRID STOCK EXCHANGE (various years), Fact Book. MANASSAKIS N. (1986), Private Behaviour and Monetary and Fiscal Policy in
Greece, Dissertation University of Oxford.�
�
MCKINNON Ronald (1973), Money and Capital in Economic Development, Washington, Brookings Inst..
MILANOVIC Branko and Shlomo YITZHAKI (2001), “Decomposing World In-
come Distribution: Does the World have a Middle Class?” Research Depart-ment World Bank.
�
OECD (various issues) “Greece” Economic Surveys.
�
OECD (various issues) “Italy” Economic Surveys.
�
OECD (various issues) “Spain” Economic Surveys. PAGANO Marco (1993), “Financial markets and growth: An Overview”, Euro-
pean Economic Review, 37 (2/3), pp. 613-622.
�

86 European Political Economy Review
PANAGOPOULOS Yannis and Aristotelis SPILIOTIS (1998), “The determi-nants of Commercial Bank’s lending behaviour”, Journal of Post-Keynesian Economics, 20(4), pp.649-672.
POSNER Mitchell and Ellen COLEMAN (1998), Profiting from emerging mar-
ket stocks, Prentice Hall Press.�
�
POTERBA James M. (2000), “Stock Market Wealth and Consumption”, Journal of Economic Perspectives, 14 (2), pp.99-118.
PSALITS Vassilios (1996), Strategien der großen hellenischen Universalbanken
vor dem Hintergrund relevanter Veränderungen ihres Umfeldes, Bamberg, Difo Druck.
SHAW Edward (1973), Financial Deepening in Economic Development, New
York, Oxford University Press.�
�
SINGH Ajit (1997), “Financial Liberalisation, stock markets and economic de-velopment”, The Economic Journal, 107, pp.771-782.
VORIDIS Hercules (1993), “Ceilings on Interest rates and Investment: The Ex-
ample of Greece”, The Review of Economics and Statistics, LXXV (2), pp.276-283.
WOLFSON Martin (1993), “The Evolution of the Financial System and the pos-
sibilities for Reform”, Transforming the U.S. Financial System Dymski, Gary, Gerald Epstein and Robert Pollin (eds.), Armonk New York., M.E. Sharpe.
WORLD BANK, Household Survey, Data Base.�
�