Embed Size (px)
Citation preview

Financial Levees: Capital Inflows, Financial Market Structure,
and Banking Crises
Mark S. Copelovitch Department of Political Science & La Follette School of Public Affairs University of Wisconsin – Madison
David Andrew Singer Department of Political Science

What Causes Banking Crises?
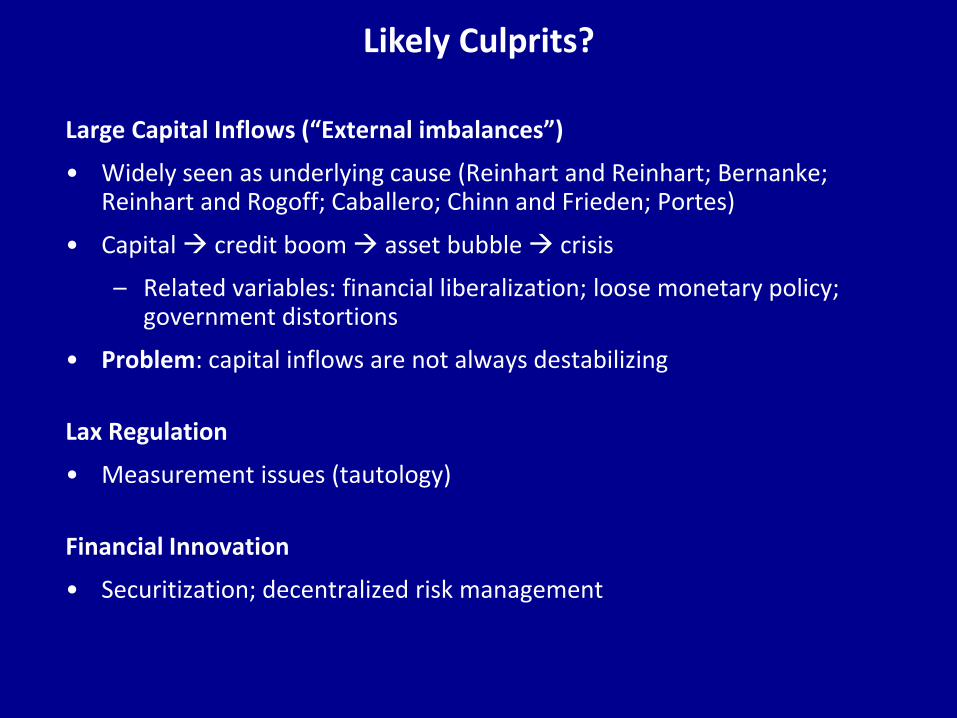
Likely Culprits?
Large Capital Inflows (“External imbalances”)
• Widely seen as underlying cause (Reinhart and Reinhart; Bernanke; Reinhart and Rogoff; Caballero; Chinn and Frieden; Portes)
• Capital credit boom asset bubble crisis
– Related variables: financial liberalization; loose monetary policy; government distortions
• Problem: capital inflows are not always destabilizing
Lax Regulation
• Measurement issues (tautology)
Financial Innovation
• Securitization; decentralized risk management
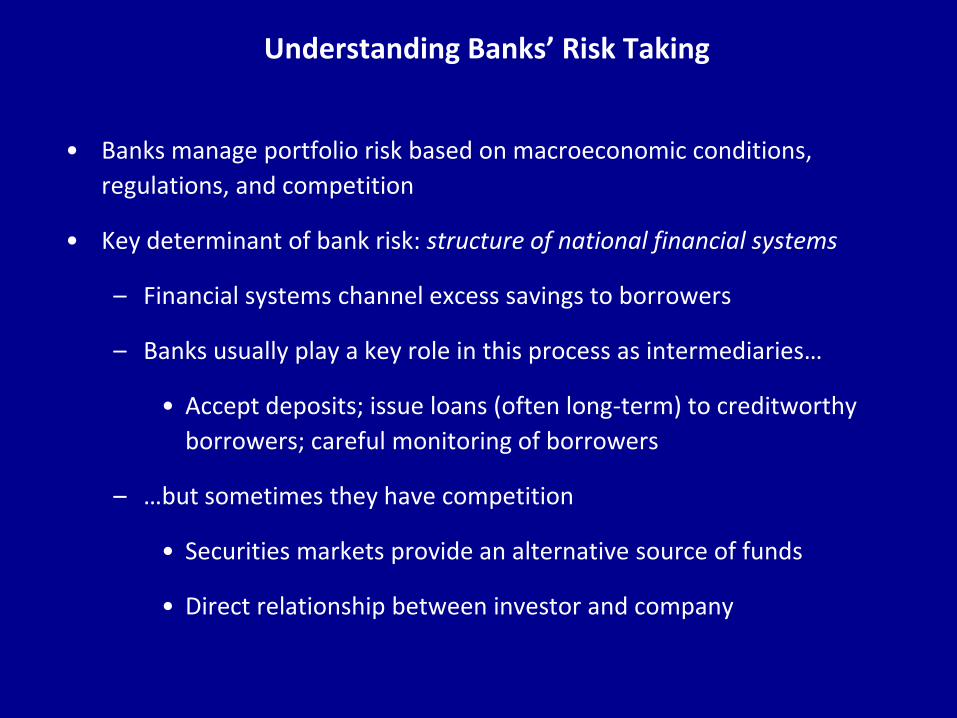
Understanding Banks’ Risk Taking
• Banks manage portfolio risk based on macroeconomic conditions,
regulations, and competition
• Key determinant of bank risk: structure of national financial systems
– Financial systems channel excess savings to borrowers
– Banks usually play a key role in this process as intermediaries…
• Accept deposits; issue loans (often long-term) to creditworthy
borrowers; careful monitoring of borrowers
– …but sometimes they have competition
• Securities markets provide an alternative source of funds
• Direct relationship between investor and company

Banks, Securities Markets, and Risk: A Stylized View
Banks in isolation
• Illiquid assets create incentives for conservative lending, careful
monitoring
– Borrowers likely to have solid balance sheets, competent managers,
low-risk business plans
Securities markets in isolation
• Highly liquid markets imply fewer incentives to monitor
– Ease of exit implies myopic risk-acceptant investors
– Monitoring is decentralized

Banks in a Financial System with Prominent Securities Markets
• Companies can choose between banks and markets for financing
• Increased competition incentivizes banks to take on more risk to
compete with markets
– Banks’ conservative bias erodes
• Creates incentives for banks to avail themselves of financial market
innovations (e.g., asset securitization)
– Banks become riskier

Our Argument
Interaction between capital inflows and market structure
• Banking crises are more likely when large capital inflows meet a financial system with prominent securities markets.
– The flood of capital intensifies and concentrates risk in the banking system
• The dangers of capital inflows are attenuated by “traditional” bank-dominated financial systems with less extensive securities markets.
– Conservative banking systems as “levees” against the flood of foreign capital

Empirical Analysis
Data and models
• 33-69 countries, 1981-2011, N=599-1704
• Event history models: conditional logit with controls for duration dependence
• Explanatory variables measured as 5-year, lagged moving averages
Dependent variables
• Banking crisis = 1 if country i experiences a banking crisis in year t
• Two measures of banking crises (correlation = 0.57)
– All crises (Reinhart and Rogoff): N=348 (20.9%), 1981-2009
– Systemic crises (Laeven and Valencia/World Bank): N=342 (15.8%), 1981-2011
Specification
• Crisisit = 0 + 1 Current Account Deficit + 2 Market Structure + 3 CurrAcct*Mkt Structure + 4
Regime type + 5 GDP per capita + 6 GDP growth + 7 Inflation + 8 OECD average growth + 9
Commodity prices + 10 US real interest rate + 11 (Last crisis) + 12 (Last crisis)2 + 13 (Last crisis)3 +

Measuring Financial Market Structure
No single, ideal measure
• Relative size of banking sector to securities markets
• Absolute size of non-bank financial markets
• Regulatory environment
Five independent variables
• Market/bank ratio: stock market volume traded / domestic bank credit
• Stock market volume traded (% GDP)
• Stock + private bond market capitalization (% GDP)
• Domestic credit by non-bank institutions (% GDP)
• Regulatory measure of depth/liberalization (IMF/Abiad et. al. 2008)
– Has a country taken measures to develop securities markets (0/3)?

Market/Bank Ratio (Stock Market Volume/Bank Credit), Selected Countries, 2011
0.0
0.5
1.0
1.5
2.0
2.5
3.0
3.5
4.0
4.5
Vene
zu
ela
Lu
xe
mbo
urg
Ecu
ado
r
Slo
vak R
epub
lic
Slo
ven
ia
Esto
nia
Gha
na
Cro
atia
Icela
nd
Bots
wan
a
Irela
nd
Ukra
ine
Arg
entina
Port
ug
al
Nig
eri
a
Kenya
Gre
ece
Peru
Om
an
Mo
rocco
Ita
ly
Pakis
tan
Qata
r
Ch
ile
Ne
therl
and
s
Ma
laysia
Germ
any
Spain
Fra
nce
Me
xic
o
Isra
el
Fin
land
Indon
esia
Un
ite
d K
ing
dom
Tha
iland
Bra
zil
Japa
n
Austr
alia
Sw
itzerl
and
Ch
ina
India
Sin
gapo
re
Saud
i A
rabia
Turk
ey
Ru
ssia
South
Afr
ica
Kore
a
Un
ite
d S
tate
s

Stock Market (Total Volume Traded, % GDP), Selected Countries, 2011
0
50
100
150
200
250
Vene
zu
ela
Slo
vak R
epub
lic
Lu
xe
mbo
urg
Gha
na
Arg
entina
Slo
ven
ia
Bots
wan
a
Cro
atia
Nig
eri
a
Ukra
ine
Icela
nd
Kenya
Pakis
tan
Czech R
epu
blic
Co
lom
bia
Irela
nd
Me
xic
o
Qata
r
Gre
ece
Indon
esia
Hu
nga
ry
Pola
nd
Kuw
ait
Ch
ile
Ita
ly
Bra
zil
Ma
laysia
Saud
i A
rabia
Germ
any
No
rwa
y
De
nm
ark
India
Isra
el
Tu
rkey
Ru
ssia
Fin
land
Fra
nce
Tha
iland
Ne
therl
and
s
Japa
n
Ca
nad
a
South
Afr
ica
Sw
ede
n
Austr
alia
Spain
Ch
ina
Sin
gapo
re
Un
ite
d K
ing
dom
Sw
itzerl
and
Kore
a
Un
ite
d S
tate
s


Conditional Logit Models – Banking Crises
Model 1 2 3 4 5 6 7 8 9 10
Dependent variable
(banking crisis
classification)
Reinhart-
Rogoff
Laeven-
Valencia
Reinhart-
Rogoff
Laeven-
Valencia
Reinhart-
Rogoff
Laeven-
Valencia
Reinhart-
Rogoff
Laeven-
Valencia
Reinhart-
Rogoff
Laeven-
Valencia
Financial market
structure variable
Market-bank
ratio (log)
Market-bank
ratio (log)
Stock market
total shares
traded (%
GDP, log)
Stock market
total shares
traded (%
GDP, log)
Stock + bond
market
capitalization
(% GDP, log)
Stock + bond
market
capitalization
(% GDP, log)
Non-bank
credit (%
GDP, log)
Non-bank
credit (%
GDP, log)
Securities
Market
Development
Index (Abiad)
Securities
Market
Development
Index (Abiad)
Current account deficit 0.372 0.187 0.047 0.000 0.304 0.430 0.187 0.224 -0.024 0.021
[0.106]*** [0.092]** [0.145] [0.184] [0.435] [0.623] [0.067]*** [0.064]*** [0.073] [0.066]
Financial market structure -0.593 -0.215 0.135 0.412 0.585 1.261 -0.172 -0.223 -0.363 -0.126
[0.303]* [0.225] [0.352] [0.300] [0.518] [0.661]* [0.092]* [0.095]** [0.280] [0.292]Current account*market structure 0.058 0.042 0.066 0.049 0.011 -0.014 0.016 0.045 0.100 0.023
[0.030]* [0.032] [0.047] [0.045] [0.103] [0.143] [0.014] [0.015]*** [0.041]** [0.053]
Polity score -0.125 -0.076 -0.172 -0.132 -0.153 -0.191 -0.014 -0.058 -0.034 -0.052
[0.131] [0.111] [0.104]* [0.124] [0.138] [0.213] [0.027] [0.037] [0.033] [0.036]GDP per capita (constant $2005) 2.850 5.204 0.828 4.527 -0.525 1.008 0.509 3.172 1.063 2.981
[1.599]* [1.435]*** [1.646] [1.602]*** [1.732] [2.526] [0.543] [0.812]*** [0.723] [0.767]***GDP growth (constant $2005) -0.053 -0.083 -0.108 -0.100 -0.229 -0.339 -0.069 -0.042 -0.072 -0.030
[0.104] [0.113] [0.092] [0.120] [0.104]** [0.103]*** [0.054] [0.044] [0.064] [0.054]
Inflation (annual % log) 0.378 1.014 0.586 1.208 0.859 2.228 0.267 0.198 0.301 0.304
[0.647] [0.683] [0.627] [0.682]* [0.753] [1.083]** [0.447] [0.517] [0.516] [0.611]
Non-farm commodity prices 0.037 0.054 0.040 0.052 0.054 0.069 0.033 0.049 0.034 0.048
[0.010]*** [0.011]*** [0.009]*** [0.011]*** [0.012]*** [0.014]*** [0.007]*** [0.008]*** [0.007]*** [0.008]***OECD average growth rate (%) -0.486 -0.333 -0.558 -0.295 -0.502 -0.345 -0.207 -0.295 -0.298 -0.317
[0.192]** [0.064]*** [0.189]*** [0.066]*** [0.235]** [0.092]*** [0.117]* [0.071]*** [0.111]*** [0.138]**
Real US interest rate (%) 0.499 0.515 0.500 0.479 0.487 0.577 0.214 0.312 0.280 0.312
[0.177]*** [0.124]*** [0.173]*** [0.128]*** [0.200]** [0.174]*** [0.089]** [0.093]*** [0.083]*** [0.120]***
Years since last crisis -0.739 -1.007 -0.800 -1.028 -0.809 -0.877 -0.818 -1.020 -0.824 -0.911
[0.115]*** [0.149]*** [0.122]*** [0.161]*** [0.176]*** [0.202]*** [0.074]*** [0.097]*** [0.078]*** [0.101]***
Years since last crisis2 0.038 0.046 0.043 0.048 0.044 0.039 0.047 0.050 0.047 0.045
[0.007]*** [0.008]*** [0.007]*** [0.008]*** [0.011]*** [0.010]*** [0.005]*** [0.005]*** [0.005]*** [0.005]***
Years since last crisis3 0.000 -0.001 -0.001 -0.001 -0.001 0.000 -0.001 -0.001 -0.001 -0.001
[0.000]*** [0.000]*** [0.000]*** [0.000]*** [0.000]*** [0.000]*** [0.000]*** [0.000]*** [0.000]*** [0.000]***
Log-likelihood -220.04 -182.62 -224.63 -183.48 -142.13 -100.14 -456.59 -404.71 -421.56 -332.14
Pseudo R-squared 0.41 0.55 0.41 0.55 0.45 0.62 0.33 0.46 0.35 0.39
Number of countries 50 54 50 54 34 33 64 84 58 69
Number of observations 887 1,021 893 1,028 599 642 1,663 2,164 1,533 1,704
Years in sample 1990-2009 1990-2011 1990-2009 1990-2011 1991-2009 1991-2011 1981-2009 1981-2011 1981-2009 1981-2011
* p<0.1; ** p<0.05; *** p<0.01
Conditional (fixed effects) logit models; robust standard errors clustered on country

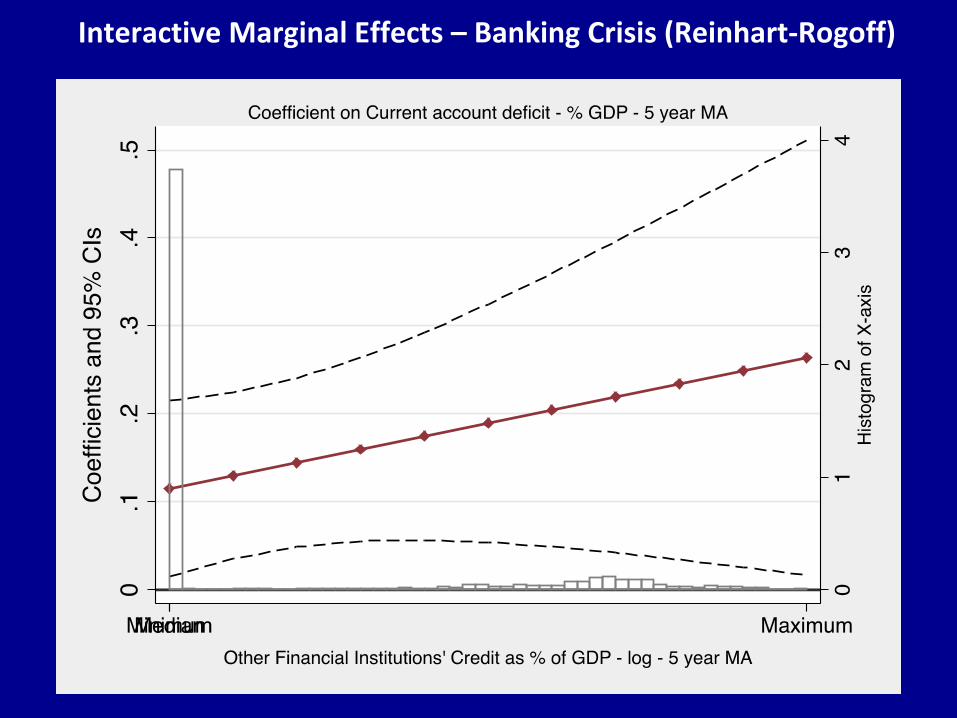
Interactive Marginal Effects – Banking Crisis (Reinhart-Rogoff)

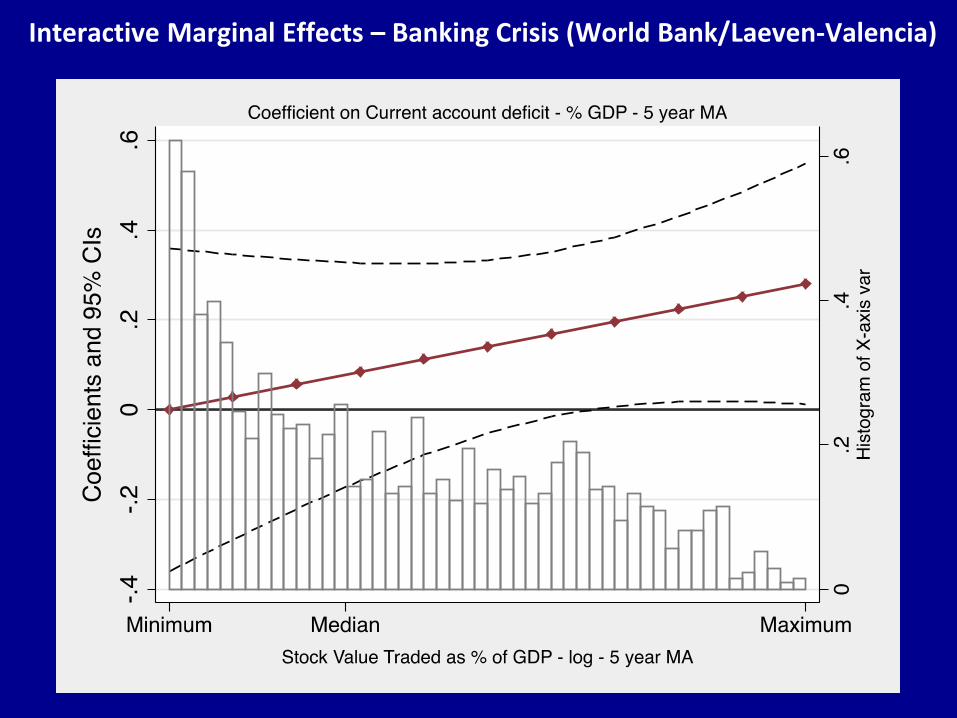
Interactive Marginal Effects – Banking Crisis (World Bank/Laeven-Valencia)

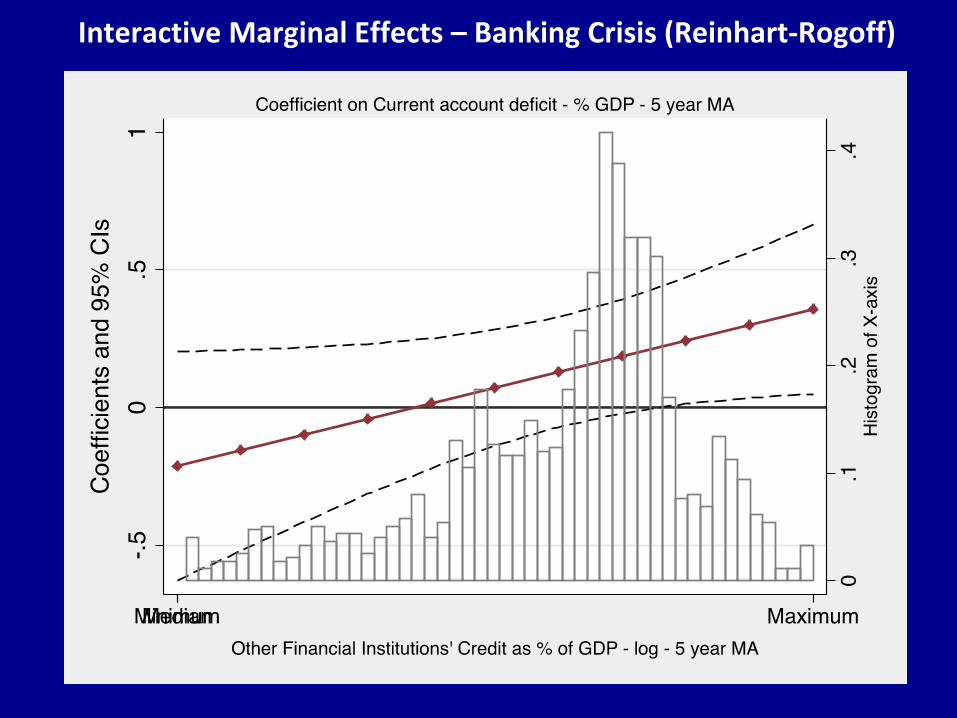
Interactive Marginal Effects – Banking Crisis (Reinhart-Rogoff)
Interactive Marginal Effects – Banking Crisis (World Bank/Laeven-Valencia)

Interactive Marginal Effects – Banking Crisis (Reinhart-Rogoff)

Interactive Marginal Effects – Banking Crisis (World Bank/Laeven-Valencia)
Interactive Marginal Effects – Banking Crisis (Reinhart-Rogoff)

Interactive Marginal Effects – Banking Crisis (World Bank/Laeven-Valencia)
Interactive Marginal Effects – Banking Crisis (Reinhart-Rogoff)

Interactive Marginal Effects – Banking Crisis (World Bank/Laeven-Valencia)

Interactive Marginal Effects – Banking Crisis (Reinhart-Rogoff)

Interactive Marginal Effects – Banking Crisis (World Bank/Laeven-Valencia)

Findings and Implications
Main result
• Banking crises are more likely when large capital inflows meet a financial system with prominent securities markets
• Robust empirical evidence across a broad sample of countries/variables over the last three decades
Implication
• The dangers of capital inflows are attenuated by “traditional” bank-dominated financial systems with less extensive securities markets.
– Conservative banking systems as “levees” against the potentially destabilizing flood of foreign capital

Next Steps
Refine measurements of banks and markets
• Better metrics/data for absolute/relative market size and regulation
Test for causal mechanisms
• Micro-level analysis of bank risk
• Capital and leverage ratios; other measures?
• Currently gathering bank-level data from US, Spain, and Denmark
Case studies
• Explain the political origins of variation in financial market structure
• Key cases: US, UK, Germany, Canada

Domestic Credit by Non-Bank Institutions (% GDP), Select Countries, 2011
0
20
40
60
80
100
120
140
160
Esto
nia
India
Slo
vak R
epub
lic
Ch
ina
Spain
Fra
nce
Bang
lad
esh
Germ
any
Ita
ly
Sw
itzerl
and
Turk
ey
Irela
nd
Kenya
Bots
wan
a
Isra
el
Gre
ece
Qata
r
Nig
eri
a
Ma
laysia
Fin
land
Kore
a
Ne
therl
and
s
Pakis
tan
Icela
nd
Gha
na
Un
ite
d K
ing
dom
Vene
zu
ela
Arg
entina
Ru
ssia
Ukra
ine
Sin
gapo
re
Indon
esia
Kuw
ait
Seych
elle
s
Ro
man
ia
Me
xic
o
Guyan
a
Bra
zil
Austr
alia
Bosnia
-Herz
.
Co
lom
bia
Saud
i A
rabia
Fiji
Ch
ile
Tha
iland
Japa
n
South
Afr
ica
Un
ite
d S
tate
s

Stock + Bond Market Capitalization (% GDP), Select Countries, 2009
0
50
100
150
200
250

Securities Market Development Index (IMF), 2005, Selected Countries
Scale Selected countries
0=no securities markets exist Albania
1=Introduction of auctioning of T-bills and/or establishment of a securities commission
Algeria, Azerbaijan, Bulgaria, Cameroon, Costa Rica, Cote D'Ivoire, Nicaragua, Senegal, Uganda, Ukraine
2=Further measures to develop securities markets: tax exemptions; medium/long-term governments bonds; policies to develop corporate bonds/equity markets; and/or introduction of primary dealer to development government bond markets
Bangladesh, Brazil, China, Colombia, Ecuador, Egypt, Ghana, Indonesia, Kazakhstan, Kenya, Morocco, Pakistan, Peru, Philippines, South Africa, Thailand, Turkey, Uruguay, Vietnam
3=Further policies: measures to develop derivatives markets; deregulation of portfolio investment/pension funds; full deregulation of stock exchanges
Argentina, Australia, Canada, Chile, Czech Republic, Denmark, Finland, France, Germany, Greece, Hungary, India, Ireland, Israel, Italy, Japan, Korea, Malaysia, Mexico, Netherlands, New Zealand, Nigeria, Norway, Poland, Russia, Singapore, Spain, Sweden, Switzerland, Tunisia, United Kingdom, United States


![TRANSICIONALES.ppt [Modo de compatibilidad] environments.pdf · with larger scale sedimentary structures •• Subaqueous levees grading upward into interdistriSubaqueous levees](https://img.dokumen.tips/doc/110x75/5abe003c7f8b9a8e3f8c7d16/modo-de-compatibilidad-environmentspdfwith-larger-scale-sedimentary-structures.jpg)