Embed Size (px)
Citation preview

Financial Leadership
Presenter
This program supports implementation of the Standards for Excellence® Code

Standards for Excellence® Code
Financial Accountability
1. A nonprofit should operate in accordance with an annual budget that has been approved by the board of directors
2. A nonprofit should create and maintain financial reports on a timely basis that accurately reflect the financial activity of the organization. Internal financial statements should be prepared at least quarterly, should be provided to the board of directors, and should identify and explain and material variation between actual and budgeted revenues and expenses.
3. For nonprofits with annual revenue in excess of $500,000, the financial reports should be subject to audit by a Certified Public Accountant.
4. Organizations should have written financial policies adequate for the size and complexity of their organization governing: (a) investment of the assets of the organization, (b) internal control procedures, (c) purchasing practices, (d) unrestricted current net assets.

Agenda
Introductions What is “financial leadership” Financial concepts you needs to know Financial planning Financial Reporting Internal Controls Financial Communication

Be Realistic, Not Idealistic
“Profit” (or positive Net Assets) is Not Bad You Need $$$ to Pursue Mission Revenue Takes Work Cash Flow Pays the Bills Bookkeeping & Accounting are Professions Errors might be an oversight, but bad
recordkeeping & fraud are negligence

Financial Leadership
Ensure Accuracy
Assess
Communicate
Plan

Financial Leadership
Be Financially Literate NOT A Financial Scholar View as a Management Tool not a Necessary Evil Know What’s Involved
Accounting Budgeting Reporting Controlling
Use the Right People

Financial Leadership
Move beyond mission-vs-money Cultivate financial leadership Programs are interdependent Strong infrastructure supports strong
programs Set strong accountability and transparency
tone
Man
agem
ent
Too
l

Key Concepts
Types of Funds (Donor Intent) Unrestricted Temporarily Restricted Permanently Restricted
Accounting Principles Cash vs Accrual Capitalization & Depreciation Common Costs Allocation
Value of Different Reports
No
np
rofi
t A
cco
un
tin
g 1
01

Know What’s Involved
Recognizing grant revenue Accts Receivable / Payable Employee Time (FTE) Journal Entries
Double-entry bookkeeping
Acc
ou
nti
ng

Key Concepts
Assets (+) vs Liabilities (-)
Credits vs Debits
Acc
ou
nti
ng
()
(-)

Double-Entry Bookkeeping
Two Sides to Every Story
Assets (+) Liabilities (-)
Debit (+) Account Credit(-) Debit(-) Account Credit(+)
Cash $ 2,000.00 Salaries
$ 2,200.00 $ 200.00 Payroll Taxes
Acc
ou
nti
ng
The Budget
Annual Predictions(Best Guess)
Income Based (Realistic) Comprehensive Aligns with 990 Board Approved
Bu
dg
etin
g Annual Budget
REVENUEProgram Services 3,600,000 Fundraising 900,000 Miscellaneous 160,000
TOTAL REVENUE 4,660,000
EXPENSESSalaries 3,028,800 Payroll taxes 302,880 Employee benefits 302,880 Consultants 30,000 Legal/Audit 15,000 Contracted services 36,000 Program supplies 490,000 Vehicle expenses 18,000 Equipment leases 24,000 Rent 288,000 Utilities 36,000 Property insurance 24,000 Depreciation 60,000
TOTAL EXPENSES 4,655,560
SURPLUS 4,440

Reporting
Statement of Activities Statement of Position Cash Flow 990 Audit
Rep
ort
ing

Statement of Activities(aka Profit & Loss)
Rep
ort
ing
XYZ Nonprofit Organization
Sample Statement of Activities
April 2009 through January 2010
Actual Actual Actual Act % Bud Budget Forecast Actual Actual
Jan 10 Jan 09 Apr 09-Jan 10 (target 83%) FY10 FY10 Apr 08- Jan 09 FY09
Revenue
GRANTS & CONTRIB-RESTRICTED 25,625 307,235 330,000 341,500 291,873 291,873
NEWSLETTER ADS 2,400 2,880 44% 6,500 3,005 2,736 2,736
SEMINARS AND WORKSHOPS 11,080 19,749 119,891 57% 211,905 138,772 113,896 125,010
FOUNDATIONS 10,000 2,455 110,273 115% 96,000 110,034 104,759 110,273
INDIVIDUAL GIVING 15,925 32,850 36,222 65% 56,090 41,222 34,411 45,992
CORPORATE CONTRIBUTIONS 16,046 15,005 125,000 89% 140,000 140,000 118,750 125,000
INVESTMENT INCOME
ANNUAL GALA 2,000 2,000 23,250 93% 25,000 24,230 22,088 25,250
Total Income 83,076 72,059 724,751 84% 865,495 798,763 688,513 726,134
Expense
SALARIES & WAGES 36,333 26,666 266,667 83% 320,000 267,483 253,334 380,000
BENEFITS & PAYROLL TAX 6,420 6,500 64,200 83% 77,035 85,490 60,990 75,000
SEMINARS AND WORKSHOPS 2,000 2,000 244,400 98% 250,095 250,000 240,000 250,000
PROFESSIONAL DEVELOPMENT 2,200 3,109 4,300 86% 5,000 5,000 4,085 5,000
SUPPLIES & OFFICE EXP 7,500 330 11,115 111% 10,000 3,773 10,559 12,000
OCCUPANCY 15,918 14,512 30,000 83% 36,000 37,000 28,500 30,000
POSTAGE 4,460 1,324 20% 6,500 3,168 1,258 1,522
PRINTING 62 12,089 33,092 35% 95,158 39,158 31,438 33,092
TRAVEL 1,880 2,452 26,287 75% 35,000 33,500 24,972 27,650
DEPRECIATION 1,190 4,770 87% 5,500 4,770 4,531 5,000
ANNUAL GALA EXPENSE 140 3,003 7,224 103% 7,000 7,224 6,863 6,400
Total Expense 73,642 75,121 693,379 82% 847,288 736,566 666,530 825,664
Net Income 9,434 (3,062) 31,372 172% 18,207 62,197 21,983 (99,530)
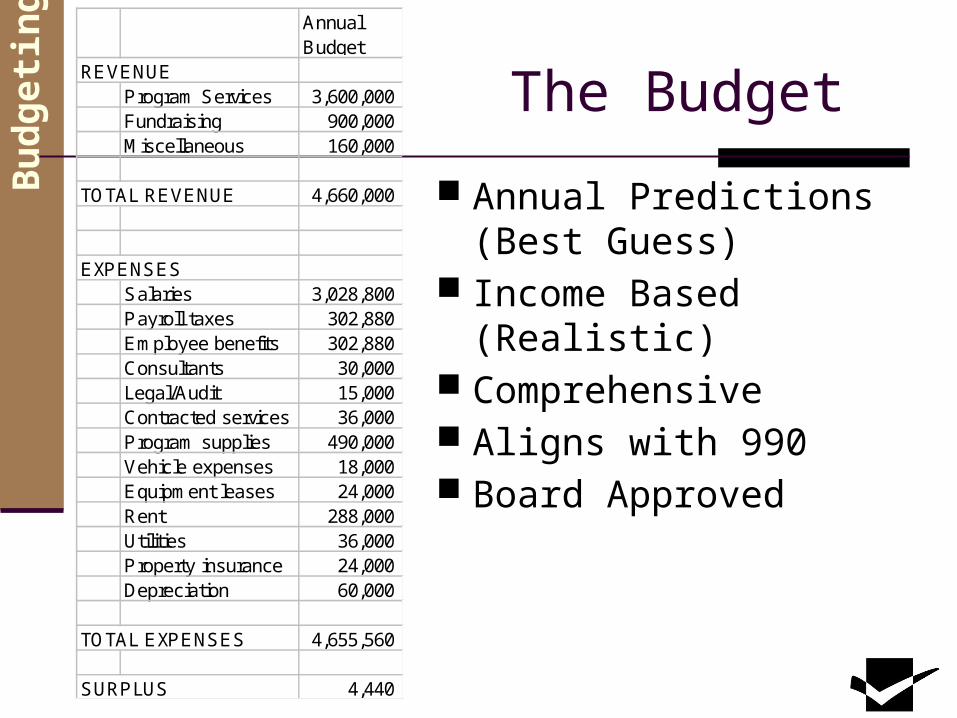
Statement of Position(aka Balance Sheet)
Rep
ort
ing
Exhibit 5 Balance Sheet as of 12/31/xx
Insert
Last Day Prior Fiscal Year
Insert Last Day of Fiscal Year
Assets
Cash 45,368 80,411
Accounts Receivable 125,153 178,235
Prepaids 5,323 5,866
Plant & Equipment 324,225 342,336
Less Accumulated Depreciation (259,380) (256,752)
Total Assets 240,689 350,096
Liabilities and Equity
Liabilities - Accounts Payable 68,233 28,223
Total Liabilities 68,233 28,223
Equity
Net Assets 172,456 321,873
Total Equity 172,456 321,873
Total Liabilities and Equity 240,689 350,096

Cash Flow
“I know what I’m worth, but can I write a check?”
Revenues may be reported but not collected Expenses are incurred but not yet paid Some expenses are not actually cash going
out the door
Rep
ort
ing

Cash Flow12 Generic Months
Annual Budget Jan Feb Mar Apr May Jun Jul Aug Sept OctCASH IN
Program Services 3,600,000 300,000 300,000 300,000 300,000 300,000 300,000 300,000 300,000 300,000 300,000 Fundraising 900,000 75,000 75,000 75,000 75,000 75,000 75,000 75,000 75,000 75,000 75,000 Miscellaneous 160,000 13,333 13,333 13,333 13,333 13,333 13,333 13,333 13,333 13,333 13,333
TOTAL IN 4,660,000 388,333 388,333 388,333 388,333 388,333 388,333 388,333 388,333 388,333 388,333
CASH OUTSalaries 3,028,800 252,400 252,400 252,400 252,400 252,400 252,400 252,400 252,400 252,400 252,400 Payroll taxes 302,880 25,240 25,240 25,240 25,240 25,240 25,240 25,240 25,240 25,240 25,240 Employee benefits 302,880 25,240 25,240 25,240 25,240 25,240 25,240 25,240 25,240 25,240 25,240 Consultants 30,000 2,500 2,500 2,500 2,500 2,500 2,500 2,500 2,500 2,500 2,500 Legal/Audit 15,000 1,250 1,250 1,250 1,250 1,250 1,250 1,250 1,250 1,250 1,250 Contracted services 36,000 3,000 3,000 3,000 3,000 3,000 3,000 3,000 3,000 3,000 3,000 Program supplies 490,000 40,833 40,833 40,833 40,833 40,833 40,833 40,833 40,833 40,833 40,833 Vehicle expenses 18,000 1,500 1,500 1,500 1,500 1,500 1,500 1,500 1,500 1,500 1,500 Equipment leases 24,000 2,000 2,000 2,000 2,000 2,000 2,000 2,000 2,000 2,000 2,000 Rent 288,000 24,000 24,000 24,000 24,000 24,000 24,000 24,000 24,000 24,000 24,000 Utilities 36,000 3,000 3,000 3,000 3,000 3,000 3,000 3,000 3,000 3,000 3,000 Property insurance 24,000 2,000 2,000 2,000 2,000 2,000 2,000 2,000 2,000 2,000 2,000 Depreciation 60,000 5,000 5,000 5,000 5,000 5,000 5,000 5,000 5,000 5,000 5,000
TOTAL OUT 4,655,560 387,963 387,963 387,963 387,963 387,963 387,963 387,963 387,963 387,963 387,963
NET INFLOW (OUTFLOW) 4,440 370 370 370 370 370 370 370 370 370 370 BEGINNING BALANCE 10,000 10,000 10,370 10,740 11,110 11,480 11,850 12,220 12,590 12,960 13,330 ENDING BALANCE 14,440 10,370 10,740 11,110 11,480 11,850 12,220 12,590 12,960 13,330 13,700
Rep
ort
ing

Cash Flow12 Real Months
Rep
ort
ing
Annual Budget Jan Feb Mar Apr May Jun Jul Aug Sept Oct Nov Dec
CASH INProgram Services 3,600,000 300,000 300,000 300,000 300,000 300,000 200,000 150,000 150,000 300,000 450,000 450,000 400,000 Fundraising 900,000 50,000 50,000 75,000 50,000 50,000 50,000 50,000 50,000 50,000 250,000 75,000 100,000 Miscellaneous 160,000 13,333 13,333 13,333 13,333 13,333 13,333 13,333 13,333 13,333 13,333 13,333 13,333
TOTAL IN 4,660,000 363,333 363,333 388,333 363,333 363,333 263,333 213,333 213,333 363,333 713,333 538,333 513,333
CASH OUTSalaries 3,028,800 232,985 232,985 349,477 232,985 232,985 232,985 232,985 232,985 349,477 232,985 232,985 232,985 Payroll taxes 302,880 23,298 23,298 34,948 23,298 23,298 23,298 23,298 23,298 34,948 23,298 23,298 23,298 Employee benefits 302,880 25,240 25,240 25,240 25,240 25,240 25,240 25,240 25,240 25,240 25,240 25,240 25,240 Consultants 30,000 2,500 5,000 7,500 7,500 7,500 Legal/Audit 15,000 1,000 2,000 2,000 2,500 2,500 2,500 2,500 Contracted services 36,000 3,000 3,000 3,000 3,000 3,000 3,000 3,000 3,000 3,000 3,000 3,000 3,000 Program supplies 490,000 42,000 42,000 42,000 42,000 32,000 24,000 42,000 42,000 42,000 49,000 49,000 42,000 Vehicle expenses 18,000 1,500 1,500 1,500 1,500 1,500 1,500 1,500 1,500 1,500 1,500 1,500 1,500 Equipment leases 24,000 2,000 2,000 2,000 2,000 2,000 2,000 2,000 2,000 2,000 2,000 2,000 2,000 Rent 288,000 24,000 24,000 24,000 24,000 24,000 24,000 24,000 24,000 24,000 24,000 24,000 24,000 Utilities 36,000 3,000 3,000 3,000 3,000 3,000 3,000 3,000 3,000 3,000 3,000 3,000 3,000 Property insurance 24,000 24,000 Depreciation 60,000
TOTAL OUT 4,655,560 357,023 357,023 485,165 382,023 351,523 341,023 359,523 359,523 492,665 374,023 371,523 364,523
NET INFLOW (OUTFLOW) 4,440 6,310 6,310 (96,832) (18,690) 11,810 (77,690) (146,190) (146,190) (129,332) 339,310 166,810 148,810 BEGINNING BALANCE 10,000 10,000 16,310 22,621 (74,211) (92,901) (81,090) (158,780) (304,970) (451,159) (580,491) (241,181) (74,370) ENDING BALANCE 14,440 16,310 22,621 (74,211) (92,901) (81,090) (158,780) (304,970) (451,159) (580,491) (241,181) (74,370) 74,440

Cash Flow
Year 1 Year 2 Year 3Contributions 100,000 100,000 100,000 Special Grant 100,000 100,000 100,000
Total Revenue 200,000 200,000 200,000
Salaries 150,000 150,000 150,000 All Other 40,000 40,000 40,000
Total Expenses 190,000 190,000 190,000
Surplus (Deficit) 10,000 10,000 10,000
Year 1 Year 2 Year 3Contributions 100,000 100,000 100,000 Special Grant 300,000
Total Revenue 400,000 100,000 100,000
Salaries 150,000 150,000 150,000 All Other 40,000 40,000 40,000
Total Expenses 190,000 190,000 190,000
Surplus (Deficit) 210,000 (90,000) (90,000)
Expense/Revenue vs. Cash Flow
Expense/Revenue
Rep
ort
ing

Cash In/Out CumulativeJune Awarded a contract for $240,000July Expenses (20,000.00) (20,000.00) Beginning of August Invoice State for JulyAugust Expenses (20,000.00) (40,000.00) Beginning of Sept Invoice State for AugustSeptember Expenses (20,000.00) (60,000.00) September State pays for July 20,000.00 (40,000.00) Beginning of Oct Invoice State for SeptemberOctober Expenses (20,000.00) (60,000.00) October State pays for August 20,000.00 (40,000.00)
Cash In/Out CumulativeJune Awarded a contract for $120,000July Expenses (10,000.00) (10,000.00) Beginning of August Invoice State for JulyAugust Expenses (10,000.00) (20,000.00) Beginning of Sept Invoice State for AugustSeptember Expenses (10,000.00) (30,000.00) September State pays for July 10,000.00 (20,000.00) Beginning of Oct Invoice State for SeptemberOctober Expenses (10,000.00) (30,000.00) October State pays for August 10,000.00 (20,000.00)
Cash FlowGovernment Help?
Rep
ort
ing

Audit
Are Your Books In Order? (to a CPA that is)
Review of accounts, controls, reports Official Opinion Issued (Management Letter)
Unqualified Qualified Adverse Going Concern
$500 MD Threshold Funders/Contractors may require
Rep
ort
ing

990
“Tax-Exempt” Not “Tax Form Exempt” Everyone Files Now! Public Record New Questions
Number of volunteers Number of voting members of governing board Material diversion of assets Documentation of meetings and actions Governing body review of the 990 Conflict of interest policy Annual Disclosure of Interests Whistle blower and document retention policies
Rep
ort
ing

990R
epo
rtin
g

Internal Controls
Policies / Procedures Source Documents (3 years) Double-entry Bookkeeping Signature Authority Contracting Authority Segregating Duties Documentation (accounting and physical) Regular Reconciliation Insurance (liability, fidelity, etc) Whistleblowers
Co
ntr
olli
ng

Financial Leadership
The Questions You Should Be Asking
Is there anything we don’t know the cost of? What are the immediate financial
strengths and weaknesses? What are the long-term financial
strengths and weaknesses? Are we efficient and effective?

Financial Leadership
Communications & Using The Tools
Are the reports helpful to making decisions?
Does my staff understand the numbers? Does my board understand the numbers? What do I share with funders / public?

Financial Leadership
Q & A
This program supports implementation of the Standards for Excellence® Code