Embed Size (px)
Citation preview

AU
DITOR OF STATE
W
A S H I N G T O NNOV 11, 1889
Washington State Auditor’s OfficeLocal Government Performance Center
Financial Intelligence Tool Handbook:Helping local governments get FIT
The Local Government Performance Center has developed an online application – known as FIT, for Financial Intelligence Tool – to help local governments monitor their financial health. FIT provides information and guidance to local government officials to help them regularly review their financial data without waiting for an audit to alert them to potential problems. FIT is now available to most local governments. Excluded are housing authorities, insurance risk pools, and government associations. FIT is an easy to use tool that displays financial trends, provides access to underlying data filed with the State Auditor, demonstrates whether or not the government meets recommended guidelines and assists with financial planning.
FIT will help identify problems sooner and more easily All local governments file annual financial reports to the State Auditor’s Office. As this financial information is reported and audited, it creates a reliable and accurate historical database. FIT is built on top of this database. It allows users to easily compare their governments with peer governments, and to conduct other types of analysis. FIT will:
• Give local government officials a tool to help them respond to financial pressures
• Use current and historical financial data that is reported to the State Auditor’s Office annually
• Identify guidelines calculated from well-established financial indicators used by auditors
• Display clear and easy-to-understand graphs, charts and summary analysis
• Allow governments to monitor and identify some potential threats to financial health without waiting for an audit
This handbook will introduce you to FIT, the data it uses, and how it can help your local government make sound financial decisions.
What’s in this handbookWhat is FIT? 2Who should use FIT? 2What does FIT actually calculate? 2Where does the data come from? 2Data limitations to be aware of 4How to get started with FIT 5How to get the most out of FIT 6About the FIT indicators 7Data details that generate the results and graphs in the workbook 7Other factors to consider when evaluating financial condition 11Contact us with your suggestions 11
Use this QR code to go right to the Online Services log-in screen.
Financial Intelligence Tool Handbook 2016 | 2
What is FIT?FIT is a reliable and easy-to-use look at important financial indicators and their underlying data. FIT is designed as a diagnostic tool, not a scorecard. Use it to identify potential financial concerns and to have conversations about how to stay financially healthy.
Who should use FIT?FIT is designed to be useful for:
• Elected and appointed officials who want to improve their understanding of their organization’s financial health
• Managers and staff responsible for helping to guide fiscal planning and budget development for local governments
• Other local government leaders who need to manage fiscal challenges
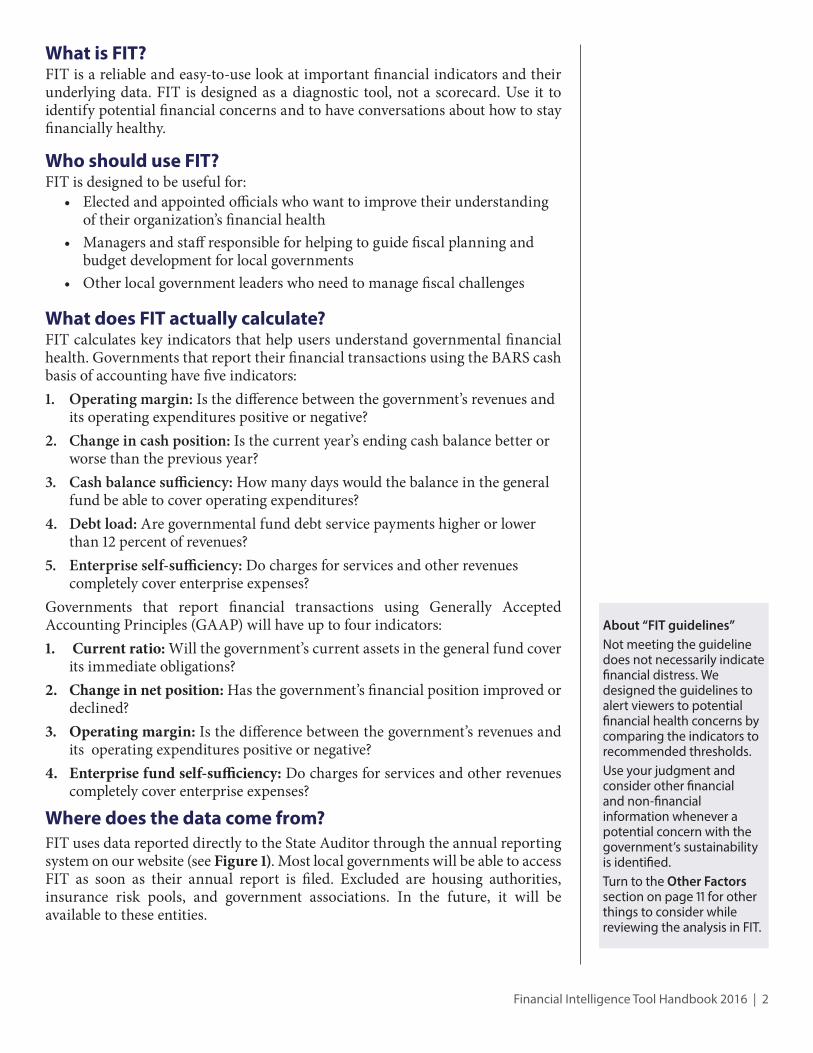
What does FIT actually calculate?FIT calculates key indicators that help users understand governmental financial health. Governments that report their financial transactions using the BARS cash basis of accounting have five indicators:1. Operating margin: Is the difference between the government’s revenues and
its operating expenditures positive or negative?2. Change in cash position: Is the current year’s ending cash balance better or
worse than the previous year?3. Cash balance sufficiency: How many days would the balance in the general
fund be able to cover operating expenditures?4. Debt load: Are governmental fund debt service payments higher or lower
than 12 percent of revenues?5. Enterprise self-sufficiency: Do charges for services and other revenues
completely cover enterprise expenses?Governments that report financial transactions using Generally Accepted Accounting Principles (GAAP) will have up to four indicators:1. Current ratio: Will the government’s current assets in the general fund cover
its immediate obligations? 2. Change in net position: Has the government’s financial position improved or
declined?3. Operating margin: Is the difference between the government’s revenues and
its operating expenditures positive or negative?4. Enterprise fund self-sufficiency: Do charges for services and other revenues
completely cover enterprise expenses?
Where does the data come from?FIT uses data reported directly to the State Auditor through the annual reporting system on our website (see Figure 1). Most local governments will be able to access FIT as soon as their annual report is filed. Excluded are housing authorities, insurance risk pools, and government associations. In the future, it will be available to these entities.
About “FIT guidelines”Not meeting the guideline does not necessarily indicate financial distress. We designed the guidelines to alert viewers to potential financial health concerns by comparing the indicators to recommended thresholds. Use your judgment and consider other financial and non-financial information whenever a potential concern with the government’s sustainability is identified. Turn to the Other Factors section on page 11 for other things to consider while reviewing the analysis in FIT.

Financial Intelligence Tool Handbook 2016 | 3
What are the differences in FIT between cash and GAAP?1. Cash users: For governments using the BARS cash basis of accounting, FIT
automatically calculates each ratio and presents the most recent five years of data in a graph (see Figure 2).
2. GAAP users: Initially, only your 2015 data will be avaliable on your screen.To add 2013 and 2014 data, instructions within the FIT application will tell you how to request it. Adding earlier years of data isn’t mandatory, but it can increase the usefulness of FIT. Once we assemble your 2013 and 2014 data, you’ll be asked to complete a verification step. Once verified, we will upload this data to FIT and you will have three years of data available to study.
Figure 2 – Cash users calculations are automatically displayed in a graph
Figure 1 – A screenshot of the online services system
Figure 3 – GAAP users initially see only one year

Financial Intelligence Tool Handbook 2016 | 4
Data limitations to be aware ofFIT is designed to calculate and present various financial indicators based on the annual report data submitted to the State Auditor’s Office by local governments. It includes unaudited data for these local governments. Each government is responsible for ensuring the accuracy of the information filed in its annual report.
Data limitationsData for the current year is subject to change as local government entities finalize reported data. This release of data includes the following funds: General Fund, Special Revenue Funds, Debt Service Fund, Capital Project Fund, and Enterprise Fund. Missing data may exist due to non-reporting of data or incorporations. All local governments are required to report annually, however not all have done so. Large variances from year to year may be a result of annexations and incorporations of local governments.
DisclaimerAny and all information presented on this site is provided directly by the local governments as directed by state statute. Neither the State of Washington nor any of its agencies, officers or employees warrants the accuracy, reliability or timeliness of this information and shall not be liable for any losses caused by such reliance on the accuracy, reliability, or timeliness of such information. The published information is not audited.

Financial Intelligence Tool Handbook 2016 | 5
How to get started with FITFIT is available through your government’s account in online services at the State Auditor’s Office website. 1. Begin by logging in to your government’s account at
https://portal.sao.wa.gov/saoportal/Login.aspx.
2. Navigate to the FIT start page by clicking on the “FIT” tab (illustrated in Figure 4).
3. Click the Launch FIT button to begin.Once launched, there is an online tutorial library that will help you use FIT; you can also browse this FIT Handbook.You can make changes to your government’s annual report data before it is audited through the Online Annual Reporting System (www.sao.wa.gov/local/Pages/LocalFile.aspx). If you need help understanding financial terms used in FIT, refer to the FIT Glossary, available in the “About FIT” tab at the top of the screen or online at http://www.sao.wa.gov/local/Documents/FIT_Glossary.pdf
What if I don’t have an account?If you do not already have an account that gives you access to your government’s reports, follow the instructions at the Online Services log-in webpage to create a new account. The system will automatically send a message to your government’s audit liaison, asking him or her to approve access to your government’s reports.
Figure 4 – A screenshot of the FIT page on our website

Financial Intelligence Tool Handbook 2016 | 6
How to get the most out of the Financial Intelligence ToolTake advantage of a library of short tutorials, including some videos (Figure 5), to walk you through key features in FIT. In the full screen view of each financial indicator, click on the FIT Tutorials tab at the bottom of the screen (Figure 6) to see various topics such as adjustments, peer benchmarking, budgeting/forecasting and FIT guidelines.
Get smart: Three questions to ask as you review FIT resultsWhen an indicator shows something unexpected, dig deeper to find the cause. Ask questions and start conversations about issues like these:
1. Are there any past errors or data quality problems that need to be fixed?2. If an indicator does not meet its guideline, is this due to a one-time
variance or a long-term issue that requires action?3. Look at how the results change from year to year. Are the changes caused
by important shifts in your revenues or expenditures?
If you have problems using FIT and need assistance, please email us at [email protected] or call us at (360) 725-5552
Figure 5 – The FIT welcome tutorial
Figure 6 – The FIT Tutorials library
Financial Intelligence Tool Handbook 2016 | 7
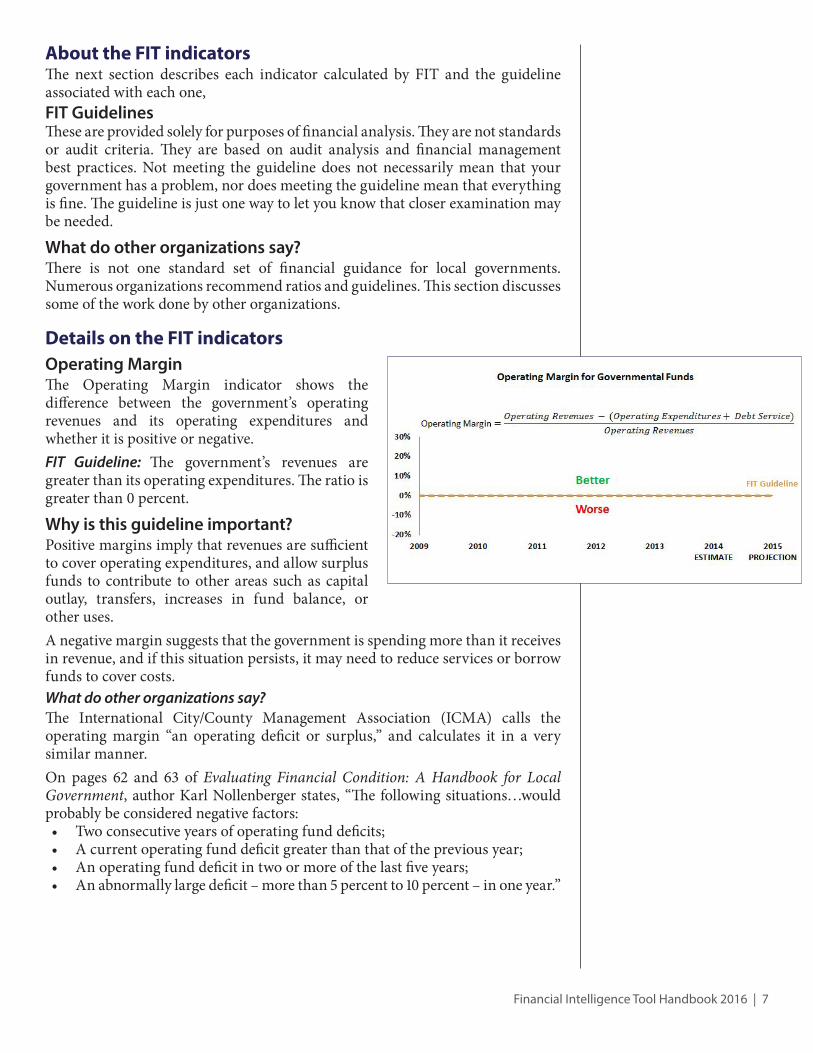
Operating MarginThe Operating Margin indicator shows the difference between the government’s operating revenues and its operating expenditures and whether it is positive or negative.FIT Guideline: The government’s revenues are greater than its operating expenditures. The ratio is greater than 0 percent.
Why is this guideline important?Positive margins imply that revenues are sufficient to cover operating expenditures, and allow surplus funds to contribute to other areas such as capital outlay, transfers, increases in fund balance, or other uses. A negative margin suggests that the government is spending more than it receives in revenue, and if this situation persists, it may need to reduce services or borrow funds to cover costs. What do other organizations say?The International City/County Management Association (ICMA) calls the operating margin “an operating deficit or surplus,” and calculates it in a very similar manner. On pages 62 and 63 of Evaluating Financial Condition: A Handbook for Local Government, author Karl Nollenberger states, “The following situations…would probably be considered negative factors: • Two consecutive years of operating fund deficits; • A current operating fund deficit greater than that of the previous year; • An operating fund deficit in two or more of the last five years; • An abnormally large deficit – more than 5 percent to 10 percent – in one year.”
Details on the FIT indicators
About the FIT indicatorsThe next section describes each indicator calculated by FIT and the guideline associated with each one,FIT GuidelinesThese are provided solely for purposes of financial analysis. They are not standards or audit criteria. They are based on audit analysis and financial management best practices. Not meeting the guideline does not necessarily mean that your government has a problem, nor does meeting the guideline mean that everything is fine. The guideline is just one way to let you know that closer examination may be needed.
What do other organizations say?There is not one standard set of financial guidance for local governments. Numerous organizations recommend ratios and guidelines. This section discusses some of the work done by other organizations.

Financial Intelligence Tool Handbook 2016 | 8
Change in Cash Position The Change in Cash Position indicator shows the current year’s ending cash balance and how it has changed from the previous year.FIT Guideline: The current year’s ending cash balance has increased from the previous year (ratio is greater than 0%).Why is this guideline important?Change in cash position evaluates the percent change in ending cash for all governmental funds combined compared to the previous year including activity for capital outlays and other financing sources and uses. An understanding of the major causes of a change in cash position will aid in identifying a potential shortfall. What do other organizations say?ICMA calls the change in cash position “declining unreserved fund balances”. Evaluating Financial Condition A Handbook for Local Government by Karl Nollenberger states on page 68, “In states that allow it, jurisdictions usually try to operate each year at a small surplus to maintain positive fund balances and thus maintain adequate reserves.”
Cash Balance Sufficiency The Cash Balance Sufficiency indicator shows, at a point in time, how many days the balance in the general fund would be able to cover operating expenditures.FIT Guideline: The general fund should be able to cover operating expenditures for at least 60 days.Why is this guideline important?The ending general fund cash and investments balance is the government’s “savings account” that can be drawn on in times of need or shortfall. This ratio shows the number of days that the general fund could operate on its ending cash and investments balance. What do other organizations say?The Government Finance Officers Association (GFOA) applies the 60 day guideline. The GFOA Best Practice, “Determining the Appropriate Level of Unrestricted Fund Balance in the General Fund” recommends, at a minimum, that general-purpose governments, regardless of size, maintain unrestricted fund balance in their general fund of no less than two months of regular general fund operating revenues or regular general fund operating expenditures.

Financial Intelligence Tool Handbook 2016 | 9
Debt LoadThe Debt Load ratio shows governmental fund debt service payments compared to revenues.FIT Guideline: Governmental fund debt service payments are less than 12% of revenues.Why is this guideline important?Debt service represents money that has already been spent. The higher this ratio, the less flexibility a government has for future spending needs or opportunities. It is important to understand the nature of the debt, maturity and payment structure. What do other organizations say?ICMA uses net direct debt service which is the amount of principal and interest a government owes annually on direct bonded long-term debt plus interest on direct short-term debt. The debt service ratio formula calculates net direct debt service divided by net operating revenues. Evaluating Financial Condition A Handbook for Local Government by Karl Nollenberger states on page 83, “Debt service on net direct debt exceeding 20 percent of operating revenues is considered a potential problem. Ten percent is considered acceptable.” The Municipal Research and Services Center website provides information on the statutory limits on general obligation (GO) debt and permitted uses of local government debt: http://mrsc.org/home/explore-topics/finance/debt/general-obligation-debt-limits.aspx
Enterprise Self-SufficiencyThe Enterprise Self-Sufficiency indicator shows how well charges for services and other revenues cover enterprise expenses.FIT Guideline: Charges for services and other revenues collected by the enterprise fund should be greater than its expenses.Why is this guideline important?Enterprise funds are expected to recover their own costs through charges for services or other revenues. An example of this type of fund is a golf course or utility. A ratio of more than zero percent indicates that the expenses of the enterprise are paid for entirely from its own revenue. A ratio of less than zero percent indicates that the enterprise had to borrow money or be subsidized by another governmental fund through transfers. What do other organizations say?The National Advisory Council on State and Local Budgeting Practice states in Principle 2, Element 4.2.1, “A government should adopt policies that identify the manner in which fees and charges are set and the extent to which they cover the cost of the service provided.
Financial Intelligence Tool Handbook 2016 | 10
ICMA uses enterprise operating position, which has the option to use “…operating income before depreciation (enterprise profits or losses excluding non-operating income and expense such as interest expense, interest income and property taxes) as the measurement of financial condition.” On page 66 of Evaluating Financial Condition, A Handbook for Local Government, author Karl Nollenberger suggests a policy statement such as: “All fees and charges for each enterprise fund will be set at a level that fully supports the direct and indirect cost of the activity.”
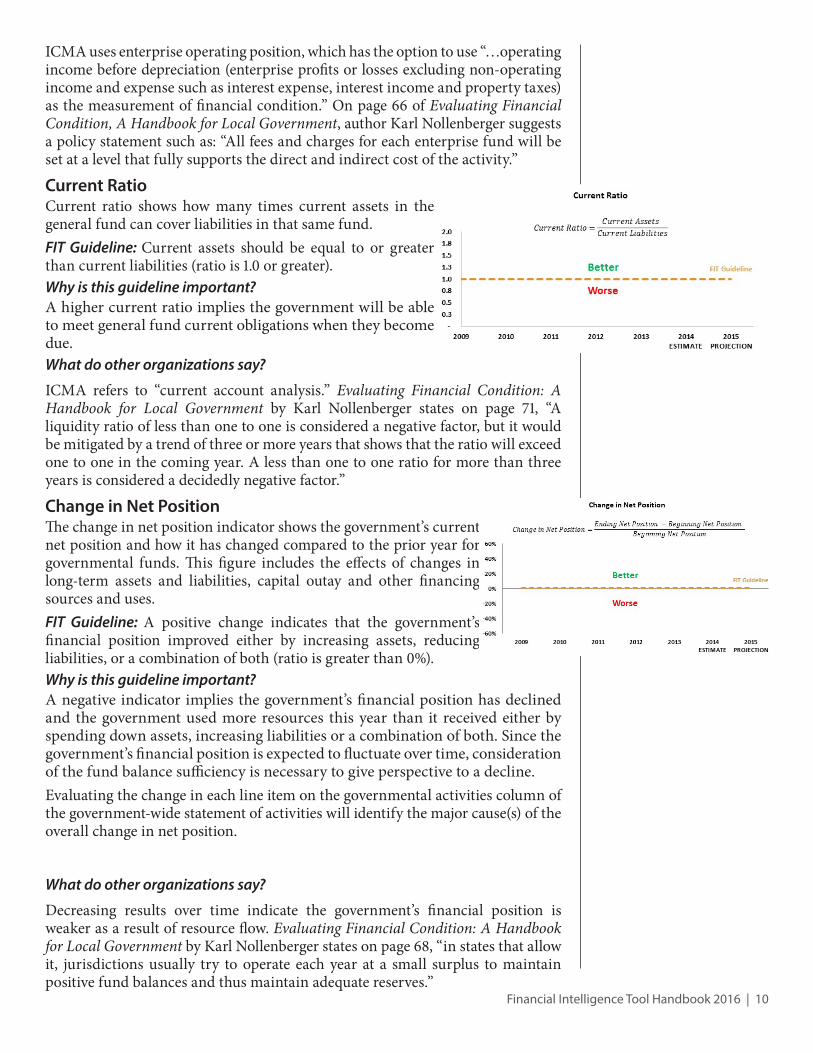
Current RatioCurrent ratio shows how many times current assets in the general fund can cover liabilities in that same fund.FIT Guideline: Current assets should be equal to or greater than current liabilities (ratio is 1.0 or greater).Why is this guideline important?A higher current ratio implies the government will be able to meet general fund current obligations when they become due.What do other organizations say?
ICMA refers to “current account analysis.” Evaluating Financial Condition: A Handbook for Local Government by Karl Nollenberger states on page 71, “A liquidity ratio of less than one to one is considered a negative factor, but it would be mitigated by a trend of three or more years that shows that the ratio will exceed one to one in the coming year. A less than one to one ratio for more than three years is considered a decidedly negative factor.”
Change in Net PositionThe change in net position indicator shows the government’s current net position and how it has changed compared to the prior year for governmental funds. This figure includes the effects of changes in long-term assets and liabilities, capital outay and other financing sources and uses. FIT Guideline: A positive change indicates that the government’s financial position improved either by increasing assets, reducing liabilities, or a combination of both (ratio is greater than 0%).Why is this guideline important?A negative indicator implies the government’s financial position has declined and the government used more resources this year than it received either by spending down assets, increasing liabilities or a combination of both. Since the government’s financial position is expected to fluctuate over time, consideration of the fund balance sufficiency is necessary to give perspective to a decline.Evaluating the change in each line item on the governmental activities column of the government-wide statement of activities will identify the major cause(s) of the overall change in net position.
What do other organizations say?
Decreasing results over time indicate the government’s financial position is weaker as a result of resource flow. Evaluating Financial Condition: A Handbook for Local Government by Karl Nollenberger states on page 68, “in states that allow it, jurisdictions usually try to operate each year at a small surplus to maintain positive fund balances and thus maintain adequate reserves.”

Financial Intelligence Tool Handbook 2016 | 11
Contact us with your suggestionsWe will continue to refine the Financial Intelligence Tool. We want to know what would make it more useful to elected and appointed officials as well as staff and managers from your local government. Please email your comments and suggestions to [email protected] or call the Local Government Performance Center at 360-725-5552.
Special thanks to...The State Auditor’s Office has worked with local government officials and experts in the field of financial management to develop the financial intelligence tool.
Other factors to consider when evaluating financial conditionThe following non-financial information provides essential context to understanding the results of financial measures:
• Knownorpotentialchangesinfunding. Is the government anticipating changes in funding levels or formulas, for example due to changing regulation, grant programs or economic factors?
• Knownorpotentialfuturecostincreases.Is the government anticipating new or increased costs?
• Businessrisks. What is the government’s exposure to property, casualty, legal, regulatory and other business risks?
• Resourcesinotherfunds.Are there unrestricted resources in other funds that are potentially available to pay for or mitigate costs that the General Fund is currently bearing?
• Nature,lengthandtimingofdebtservice.Is outstanding debt voted or non-voted? Was outstanding debt issued for operating or capital purposes? How long will the current level of debt service continue? Does debt include any significant balloon payments or back-loaded principal payments?
• Contingencies. Would any significant contingency, lawsuit, guarantee or other obligation or uncertainty threaten the government’s financial condition if realized?
• Capitalplanning. Are land holdings, rights-of-way, infrastructure and building capacity sufficient to meet projected future service demand, or will new acquisitions need to be made?
• Capitalassetcondition.How much useful life is left in the government’s equipment and facilities?
• Revenueflexibility.To what extent is the government able to increase taxes, assessments, fines, fees or other revenue sources as needed?
• Spendingflexibility.What activities or expenses could be eliminated or reduced if needed?
Note that governments reporting on a cash basis will have less ability to gauge their financial position and results of operations because they do not report non-cash assets and liabilities.