Embed Size (px)
Citation preview

1
Financial innovation in bankingF. Arnaboldi*, B. RossignoliDepartment of Law “Cesare Beccaria”, University of Milan and Centre for Research in Banking andFinance, University of Modena and Reggio Emilia
AbstractWe study the determinants of financial innovation in 81 listed commercial banks in Europe and
in the United States from 2005 to 2008. We use annual reports to identify six broad innovationcategories, from the launch of a new product, to the implementation of a new organizationalstructure. We then investigate the impact of bank- and country-specific features on innovation.When banks hold higher market share in less concentrated and more efficient banking systems,innovation is stronger. In addition, banks with less volatile returns and a lower quality of loanportfolio exhibit a significantly higher level of innovation. The impact of the market share oninnovation is higher for banks incorporated in the US, while lower quality of loan portfolioincreases the incentive for European banks to innovate. When the financial crisis hits less riskybanks take the lead on innovation.
JEL codes: G21, G28, O31, F36Keywords: banks; financial innovation; regulation; international finance
‘The only thing useful banks have invented in 20 years is the ATM’ (P. Volcker)
1. IntroductionInnovation has been a core topic for scholars, because of its important contribution to economic
growth and to the stability of financial systems (Levine, 1997; IMF, 2006; Lerner and Tufano,2011). New financial products, such as the securitisation of assets, were believed to havetremendous potential for the diversification and efficient management of risk (Merton, 1992;Mendoza et al., 2009; Trichet, 2009). The financial crisis that started in 2007 changed those beliefs,as excessive risk taking in some specialized innovating products has brought down the financialsystem and produced the deepest and most prolonged economic crisis since the Great Depression.Recent studies now blame excessive growth of financial economy as detrimental to the growth ofthe real economy (Levine, 2005; Rajan, 2005; Piazza, 2010; Shin, 2010; Johnson and Kwak, 2012).Innovation is a double edged-sword: the right kind of innovation and favourable conditions thatmay spur banks to invest in new technologies would help the financial system fulfill its functionsand, as a consequence, deliver growth; but too much of innovation or innovation which is notproperly used can have serious consequences on the overall economy (Stiglitz, 2010; Beck et al.,2012).
The features of innovation in the banking sector are quite different from the characteristicsusually encountered in other sectors. First, and in contrast to innovation in the manufacturing sector,financial innovation is hard to define. For Frame and White (2004) financial innovation is defined
* Corresponding author: Francesca Arnaboldi, Department of Law “Cesare Beccaria”, University of Milan, Via Festadel Perdono 7, 20122 Milan, Italy, email: [email protected].

2
as product and organizational innovation, which allows cost or risk reduction for the single bankand/or an improvement of the services for the financial system as a whole. Second, banks are notthe only developer of financial innovation. The banking sector is also an end user of innovationsdeveloped in other sectors. Sometimes banks jointly develop innovation with non-financial firms,such as software houses or specialized technology firms. Very often, innovation happens thanks tothe interaction with clients, and so is spread over departments.
Because of these features, the measurement of financial innovation is quite a challenge. Studiesof manufacturing innovation traditionally focus on research and development (R&D) spending.However, R&D is unlikely to be a satisfactory measure in banking, since banks do not usually havea R&D department that launches new products and services. Most new services are developed in anincremental way, often through “trial and error” and in all parts of the business.
A count based on the listings of new securities is not satisfactory either, since much of theinnovation in financial services is not related to publicly traded securities, such as insurance andbanking products (Lerner and Tufano, 2011). Furthermore, new securities are often minor variantsof existing securities, issued by banks to differentiate themselves from competitors (Tufano, 2003).
Lerner (2006) develops a measure of financial innovation based on news items in the Wall StreetJournal related to new financial products, services, or institutions. However, some innovation maynot be reported in newspapers because it has no direct appeal to the reader. Some studies oninnovation in the banking industry attempt to catalogue one particular type of innovation, such ascredit default swaps or securitization (Tufano, 2003). However these results cannot be easilygeneralized to other products.
A recent suggestion is to consider patents by financial institutions (Hall et al. 2009; Hunt, 2008)but Boldrin and Levine (2013) point out that academic studies have typically failed to find much ofa connection between patents, innovation and productivity growth.
In this paper we supplement existing research with an alternative measure for financialinnovation based on bank’s annual reports. The annual report is the main official document a firmhas to communicate to the general public and offers broad information on bank’s business.Following recent scandals, regulators and external auditors pay closer attention to the quality ofinformation provided.1 The accounting authorities have changed accounting rules in an attempt toprovide investors with a more accurate picture of the firm (Lehnert, 2014).
We analyze more than 450 annual reports of 81 banks listed on the New York Stock Exchange(NYSE), on the London Stock Exchange (LSE), on Borsa Italiana, and on Euronext from 2005 to2008, in search of innovations. In 2014, the total market capitalization is €25.2 trillion, of whichabout seven per cent comes from the banking industry. The banks comprised in the dataset, whoseprimary business is deposit-taking and loan-making, account for 85 per cent of total assets and 75per cent of market capitalization of banks listed on the above mentioned stock exchanges and withsimilar specialisation.
We transform qualitative information on various innovations, from the launch of a new product,to the implementation of a new organizational structure, into a quantitative database thatcharacterizes innovation in banking. Following Lerner (2006), we then browse news in the financialpress and on the banks’ websites, to capture innovations that might not have been mentioned in the
1 Sarbanes-Oxley Act, passed in 2002, enhanced financial disclosure by US public firms. Similar legislation has beenenacted in various European countries, such as Legge 262/2005 in Italy or Loi sur la Sécurité Financière in France in2003.

3
annual reports. We provide significant descriptive traits characterizing banks which are more activein innovation.
Then we examine the determinants of innovation in a regression framework. When banks have ahigher market share in less concentrated and more efficient banking systems, innovation is stronger.In addition, less volatile returns and a lower quality of loan portfolio are positively related toinnovation. The impact of the market share on innovation is higher for banks incorporated in the US.Similar evidence is found for the impact of the quality of loan portfolio on innovation, which issignificantly different between European and US banks. In particular, lower quality of loanportfolio increases the incentive for European banks to innovate, whereas it reduces innovation forUS banks. If in normal times riskier banks innovate more, when the crisis hits less risky banks takethe lead on innovation.
Two limitations should be acknowledged at the outset. The period covered in this study isrelatively limited, but this protects from strong shifts in the demand for financial innovation andfrom the impact of the global financial crisis on all aspects of banks’ business. In addition, from2008 the supply for financial innovations dramatically dropped, since all major banks were highlyconcerned about solvency, liquidity, cost and capital adequacy, and adopted a conservativeapproach to innovation. The second limitations relates to the methodology employed. Since aunique definition of financial innovation is hard to find, we prefer to pursue a relatively simplemethod to identify financial innovation and to analyze its determinants.
2. Definition of financial innovationIn the literature financial innovation has been variously defined.2 According to the European
Central Bank (ECB 2003), financial innovation is primarily a product and organizationalinnovation, which allows cost or risk reduction for banks and/or a service improvement for thefinancial industry as a whole. Similar considerations can be found in Frame and White (2004) andin Tufano (2003), who define innovation employing a few key concepts, such as the completion ofincomplete markets, the overcoming of agency problems and information asymmetries, thereduction of transaction, research, or marketing costs, the response to taxation and regulationchanges and the link to globalization, risks and technological shocks. Financial innovation comesfrom the combination of two or more of the above-mentioned factors.
From the point of view of the impact on the industry, innovation may be radical, revolutionary orincremental (Gardner, 2009). Radical innovation changed the whole industry, but it has occurredfrom time to time in banking. Revolutionary innovation tend to be less risky than breakthroughs butalso less profitable. Incremental innovation consists of a minor improvement of something alreadyexisting, has relatively lower risk and positive payback. It is far more common than radical andrevolutionary one. Financial innovation can also be defined investigating its origins and it is usuallyconsidered as the bank’s response to external economic forces (Llewellyn, 2009; Silber, 1983).
Against this background, to identify financial innovation in bank’s annual report we focus onthree features that have to be present simultaneously: strong discontinuity with the past, actualimprovement of the service for clients, and profit enhancement. We exclude innovation promoted
2 For a comprehensive review on financial innovation, see, among others, Frame and White (2004), and Lerner andTufano (2011).

4
by changes in regulation or legal provisions, since usually it affects the banking system as a whole.3
This choice skims the dataset from redundant observations.Finally, in labour intensive industry, such as the banking sector, the innovation process is
dominated by “providers” (Pavitt, 1984). This industry grants a minor direct contribution toinnovation. Most innovations are produced in other industries and then transferred into the bankingsector, particularly as far as technology is concerned. This is the case, for example, of a bankimplementing an internet platform for distribution of online services, thanks to new processorsprovided by software houses. The bank’s innovation depends on a technological innovationproduced by the supplier. In fact, banks do not simply copy suppliers’ innovation but add financialcontents to them. A major driver in financial innovation is the development of financial technologybroadly defined (Frame and White, 2012; Wall, 2014). Advances in technology have been criticalnot only in retail banking (e.g. automatic teller machine), but also to obtain, store and process datarequired to estimate statistical models (e.g. valuation and risk management). Therefore, we includetechnological innovation as reported by banks in our investigation.
3. Data and methodsTo select our sample we consider all domestic banks listed on the New York Stock Exchange,
the London Stock Exchange, Borsa Italiana, and Euronext which were active at the end of 2008(107 banks). Since we are interested in institutions that can be fairly referred to as deposit takingand loan making institutions, we drop those banks which are not classified as commercial banks,cooperative banks, Islamic banks, bank holding and holding companies in Bankscope.4 Given ourfocus on bank characteristics that determine financial innovation, concentrating ing on banks thatwere continuously operating is all the more important. If banks merged during the period ofobservation we aggregate their financial statements and treat them as a single composite bank forthe entire period (Casu et al. 2013). Table 1 presents 2008 figures on the final sample of 81 banksclassified accordingly to the stock exchange where they are listed.
Twenty per cent of the sample is formed by banks listed on Euronext, 37 per cent on LondonStock Exchange and Borsa Italiana (LSE), and 43 per cent on the New York Stock Exchange(NYSE). As for the average size, Euronext banks are larger per total assets but smaller in terms ofmarket capitalization. However data are quite dispersed, since total assets span from 0.2 to morethan 2,500 billion euro and market capitalization from 59 to 120,000 million euro. In 2008,profitability, measured by return on equity, has been negative on average for all banks, particularlyfor those listed on Euronext (-11 per cent). Banks listed on LSE have been more cost efficient thantheir peers on Euronext and NYSE (71 per cent versus 84 and 86 per cent cost to income ratio,respectively). On average, banks listed on NYSE have 64 per cent of their assets tied up in loans,
3 For instance, the Single Euro Payments Area (SEPA) abolishes the distinction between national and cross-borderpayments within the Euro area (Directive 2007/64/EC). The new system has been generally adopted, becoming astandard (systemic innovation).4 According to Bankscope classification, commercial banks are mainly active in a combination of retail banking(individuals, SMEs), wholesale banking (large corporates) and private banking (not belonging to groups of savingbanks, co-operative banks). Cooperative banks have a cooperative ownership structure and are mainly active in retailbanking (individuals, SMEs). An "Islamic bank is an institution that mobilises financial resources and invests them inan attempt to achieve predetermined islamically-acceptable social and financial objectives. Both mobilisation andinvestment of funds should be conducted in accordance with the principles of Islamic Shari'a". Bank holdings andholding companies are typically holding companies of bank groups. We are aware of differences among these groups,but for the sake of readability, we refer to them as commercial banks in the remaining of the paper.

5
compared to 55 per cent of institutions listed on LSE and 52 per cent on Euronext. This ratio couldspot banks following the traditional business model of loan making and deposit taking.
Coding guidelinesThe data were coded according to the content analysis methodology (Schwartz-Ziv and
Weisbach, 2013; Krippendorff, 2004; Lieblich et al., 1998). The content analysis methodology is a“systematic replicable technique for comprising many words of text into fewer content categories,based on explicit rules of coding” (Stemler, 2001). This methodology involves constructing aquantitative database by categorizing or coding different aspects of qualitative information. We didall coding manually because the coding guidelines we define require a comprehensiveunderstanding of the content of the annual reports to detect the three features mentioned in Section2. The coding guidelines are as follows: (1) group organizational model: we include in this categoryinnovating changes in the group structure, such as the acquisition of an asset-management companyor a leasing company by a banking group not yet operating in the asset management or leasingbusinesses. The group may start the new business through an already existing subsidiary ordivision, or establishing a new, legally separated firm; (2) organizational structure: this categoryincludes innovating organizational changes implying a new structure for the bank, but without anydirect impact at group level; (3) operating systems: this category includes innovations in operatingsystems, processes, and internal controls, provided they are not tied to regulation changes; (4)information and communication technology (ICT): this category includes innovations with aprimarily technological content, like, for example, new voice recognition software for telephonebanking. While technological innovation can span over the different categories, it is included in thiscategory only if the technology is clearly identifiable and prevalent; (5) delivery channel: thiscategory includes innovation in delivery channels, like the launch of electronic banking in a bankwhich previously had only physical branches; (6) product: this category includes all new productslaunched by banks, such as the introduction of a new mortgage.
We coded data on innovation from bank’s consolidated and unconsolidated annual reports,bank’s websites and financial press, namely The Wall Street Journal, The Financial Times, Il Sole24 Ore, The Economist, and Bloomberg Businessweek. If a bank and its holding are both listed, weinvestigate all reports and control for double counting of innovation. Innovation is thus a scorevariable ranging from zero to six per bank per year, depending upon the number of categories inwhich each bank innovates.5
We are aware that the score variable measures the range of innovation and not its intensity, but itis a good proxy of innovating activity. Indeed it is interesting to point out that different innovationcategories have different “life cycles”. Product innovation, which can be easily imitated bycompetitors, has a relatively short life cycle. It can be repeated over multiple periods, also over ashort time horizon. Following Gardner (2009) it is typically an incremental innovation. Otherinnovations, including those referring to the organizational structure, have a longer life cycle andcan hardly be repeated continuously. Some innovations are more recurrent in combination withparticular events, including aggregations that characterized the banking industry since 2005. Thuswe prefer to focus on banks innovating in various areas of their business and structure, rather thanon those launching for instance 20 new bank accounts with slightly different features.
5 If all 81 banks in the sample would innovate in all categories, the total score would have been 486 innovation per year,1944 innovation over the four-year period.
6
Innovation featuresAnalyzing data on innovation obtained through the above-described coding guidelines, banks
cover 783 innovation categories or areas (INN) over the four-year period (Table 2). On averageeach bank innovates in 2.4 categories per year. In fact, innovation decreases from 225 in 2005 to165 in 2008. This reduction is explained not only by the lower number of innovation categories perbank (2.8 in 2005 vs. 2.0 in 2008, per bank on average) but also by the lower number of bankswhich innovate (86 percent in 2005 vs. 82 percent in 2008 of banks in the sample).
Among all categories, product innovation prevails (26 percent of total), followed by ICTinnovation (18 percent of total). Group organizational model, operating systems and organizationalstructure are all about 15 percent, while innovation in delivery channel scores 11 percent of total.
If we now compare innovation promoted by European and US banks (46 versus 35 banks),product innovation prevails in both geographical areas and in all countries but Belgium. However,in the US innovation in group organizational model closely follows while delivery channel is at thebottom of the ranking.6 In the European Union (EU) ICT innovation is the second area by numberand operation systems is the last one.
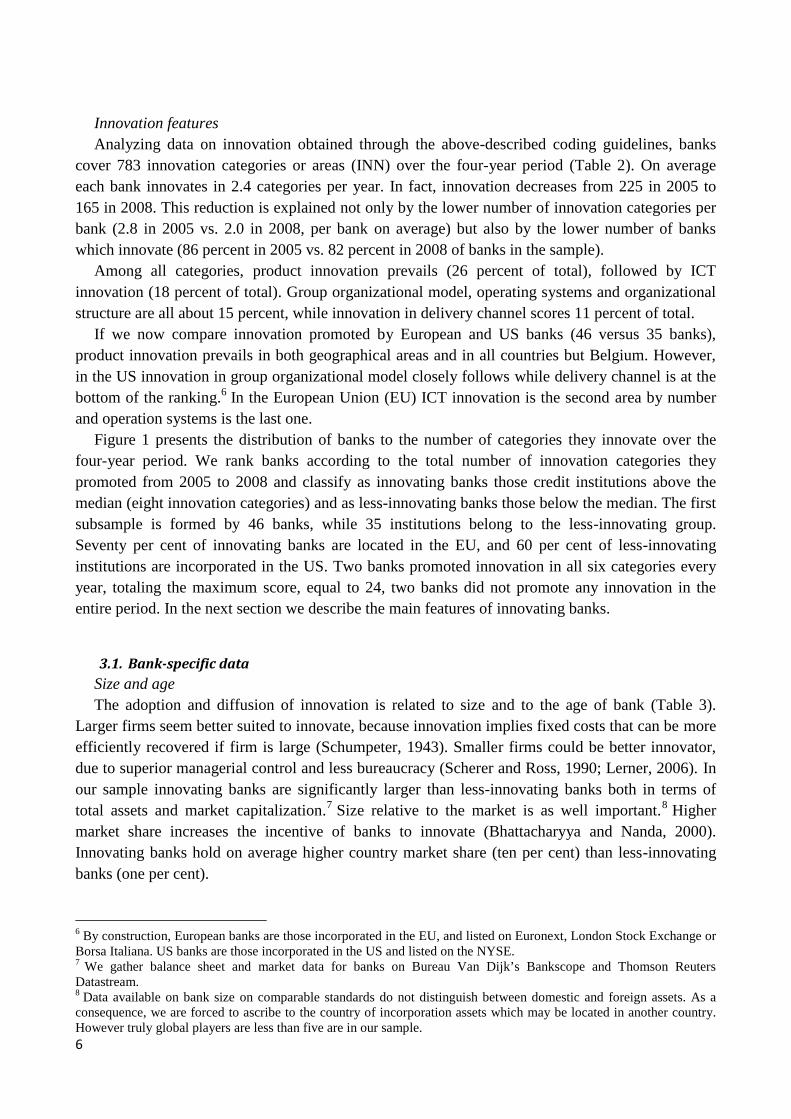
Figure 1 presents the distribution of banks to the number of categories they innovate over thefour-year period. We rank banks according to the total number of innovation categories theypromoted from 2005 to 2008 and classify as innovating banks those credit institutions above themedian (eight innovation categories) and as less-innovating banks those below the median. The firstsubsample is formed by 46 banks, while 35 institutions belong to the less-innovating group.Seventy per cent of innovating banks are located in the EU, and 60 per cent of less-innovatinginstitutions are incorporated in the US. Two banks promoted innovation in all six categories everyyear, totaling the maximum score, equal to 24, two banks did not promote any innovation in theentire period. In the next section we describe the main features of innovating banks.
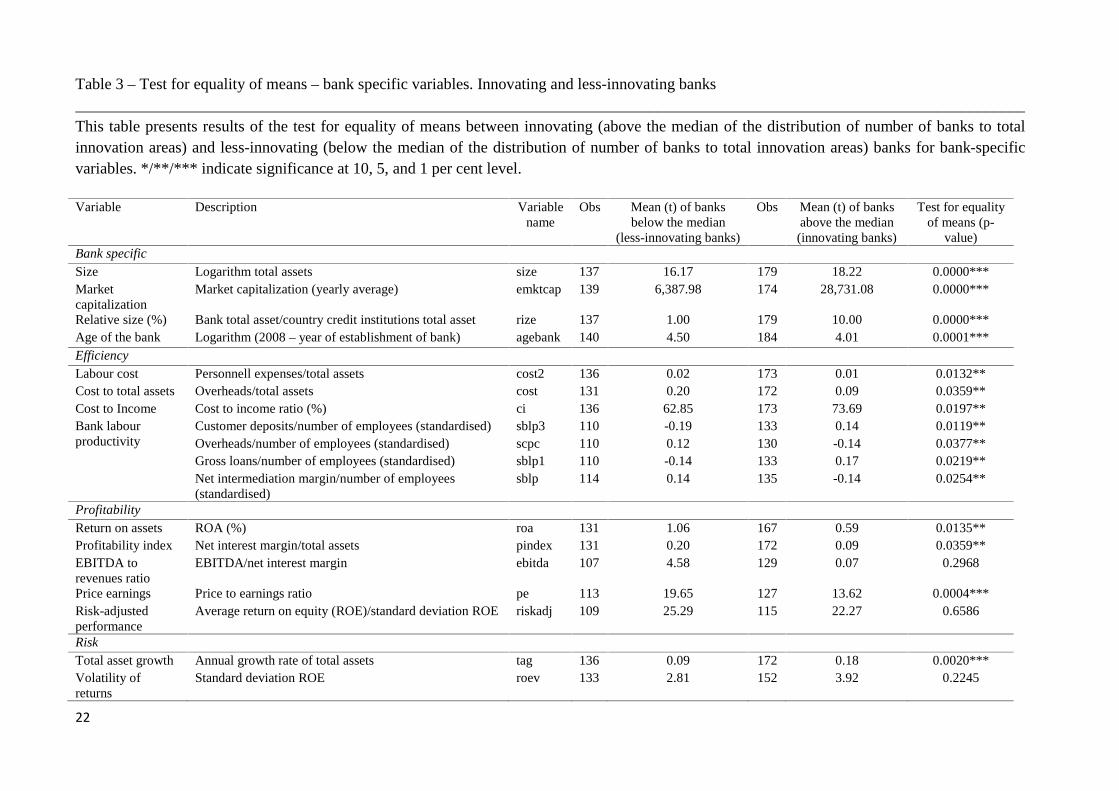
3.1. Bank-specific dataSize and ageThe adoption and diffusion of innovation is related to size and to the age of bank (Table 3).
Larger firms seem better suited to innovate, because innovation implies fixed costs that can be moreefficiently recovered if firm is large (Schumpeter, 1943). Smaller firms could be better innovator,due to superior managerial control and less bureaucracy (Scherer and Ross, 1990; Lerner, 2006). Inour sample innovating banks are significantly larger than less-innovating banks both in terms oftotal assets and market capitalization.7 Size relative to the market is as well important.8 Highermarket share increases the incentive of banks to innovate (Bhattacharyya and Nanda, 2000).Innovating banks hold on average higher country market share (ten per cent) than less-innovatingbanks (one per cent).
6 By construction, European banks are those incorporated in the EU, and listed on Euronext, London Stock Exchange orBorsa Italiana. US banks are those incorporated in the US and listed on the NYSE.7 We gather balance sheet and market data for banks on Bureau Van Dijk’s Bankscope and Thomson ReutersDatastream.8 Data available on bank size on comparable standards do not distinguish between domestic and foreign assets. As aconsequence, we are forced to ascribe to the country of incorporation assets which may be located in another country.However truly global players are less than five are in our sample.

7
Older firms seem better placed at extending existing product lines than at creating new ones.Nevertheless their advantage of experience stimulate innovation (Lerner, 2006; Prusa and Schmitz,1994; Arrow, 1962). However literature typically suggests that younger firms are more likely toinnovate, since they have long term horizon to recover from the initial investment, a lower chanceof cannibalization of existing products or services, and fewer scope diseconomies (Aaron andLazear, 1990). Indeed, innovating banks are younger than their less-innovating peers.
EfficiencyInnovations are not easy or cheap to develop and diffuse. Banks retain many highly
compensated-highly skilled employees to design new products and services (Lerner and Tufano,2011). Internal human capital is a key for any innovation policy (Mohen and Roeller, 2005). Inaddition, the distribution of new products requires considerable resources invested in marketing,sales and delivery channels. In fact, personnel expenses and overheads are lower in innovatingbanks, but cost to income ratio (CI) is higher. The cost to income ratio, which shows the ability ofthe institution to generate gross profits from a given revenue stream, is considered one of the mostimportant efficiency based indicators (ECB, 2010).
To understand different level of cost-efficiency, the major element of which is usually thepersonnel expenses, it is useful to investigate bank labour productivity. Core deposits are theprimary funding source for most banks and, as a result, have a significant effect on a bank’sliquidity. Banks place great significance on deposits because favourable operating results depend, inpart, on a core deposit base. Therefore, banks try to retain and prudently expand the deposit base(The Federal Reserve Board, 2013). As reported in Table 3, the customer deposits per worker ratiois higher in innovating banks, indicating a higher efficiency in managing the deposit base. Inaddition, cost per employee is lower in innovating banks. Banks use deposits in a variety of ways,primarily to fund loans and investments. Innovating banks’ employees generate more gross loansper worker, but lower net intermediation margin, which in part could be explained by lower qualityof loan portfolio.
ProfitabilityThe impact of innovation on profitability is thus cumbersome. If investing in financial
innovation is a rational response to a lagging competitive position, it is not surprising that lessprofitable firms tend to be innovators (Silber, 1983; Lerner, 2006). However, considering the highinitial investment, more profitable firms seem to be better placed at innovating. In fact, ourpreliminary analysis confirms that more innovating banks are less profitable. We test the mean ofvarious profitability measures but only few of them significantly differ between the two groups.Return on assets (ROA) compare bank net income to its assets. Innovating banks underperformless-innovating banks (0,59 per cent versus 1,06 per cent). 9 We wish to capture a measure ofrelative profitability which is not affected by capital structure choices, thus we measure the netinterest margin to total asset ratio. The lower profitability of innovating banks is confirmed also bya broader ratio, the net intermediation margin to total asset ratio. Following Lerner (2006) we alsotest the ratio of earnings before interest, debt, taxes, depreciation, and amortization (EBITDA) to
9 Traditionally, ROA is considered a more reliable profitability indicator than ROE, in terms of efficiency performance,since it is adjusted for the leverage effect. However, this ratio is quite flat across time (ECB, 2010).

8
revenues. We measure revenues both in terms of net interest margin and net intermediation margin,but none of these ratios shows significant differences among the two groups.
The significant market measure of profitability is price to earnings ratio (P/E). Less-innovatingbanks seems overpriced (19,65 P/E versus 13,62). However a higher ratio may also suggest lowerbank risk. Earnings per share (EPS), price to book value (PBV) and stock abnormal return do notsignificantly differ among the two groups.10
The financial crisis has highlighted the relevance of risk when investigating banks’ performance.Therefore, simple performance measures, such as return on equity (ROE), are limited because theyare not risk-sensitive. Return on equity failed to discriminate the best performing banks from theothers in terms of sustainability of their results during the crisis (ECB, 2010). One possiblerefinement to our performance analysis would be to rely on risk-adjusted returns instead of plainreturns. Indicators could be related to the total return of an investment, the most popular one beingeconomic value added (EVA), or to the underlying level of risk associated with banks’ activity,such as the risk-adjusted return on capital (RAROC). However, it is difficult to calculate theseindicators without having access to banks’ internal data, this being out of the scope of the presentwork. We therefore use a proxy and compute the ratio of return on equity to its volatility for eachbank over the sample period. The test for equality of means is not significant.
RiskA recent strand of literature argues that banks particularly active in innovation have been riskier
than their less innovating peers (Diamond and Rajan, 2009, and Bebchuk and Spamann, 2010).Risk-adverse firms are often reluctant to invest in innovating projects, even if these projects arevalue-enhancing (Xiao and Zhao, 2012). Therefore, we would expect the innovating banks to beriskier than the less-innovating ones.
We first measure risk computing banks’ total asset growth. Asset growth should be funded by acommensurate amount of additional capital. Persistently high growth of assets can be an alarmingsignal. Excessive asset growth can imply excessive risk-taking and a build-up of vulnerabilities,which would eventually jeopardise sustainable growth (ECB, 2010). In particular, microeconomicevidence from large international banks suggests that loan growth represents an important driver ofrisk (Altunbas et al., 2011; Foos et al., 2010; Laeven and Majnoni, 2003; Keeton, 1999). Indeedinnovating banks experiment a faster total asset growth. High volatility of returns can be a secondsignal of bank instability and risk. We then test the volatility of return on equity but differenceamong the two groups of banks is not significant.
The crisis has highlighted the crucial importance of banks’ liquidity and funding capacity(Demirguc-Kunt et al., 2010; Shleifer and Vishny, 2010; Beltratti and Stultz, 2012). Thederegulation and financial innovation developments led banks to increase their dependence onmarkets for their funding (Altunbas et al., 2011). As a third measure for risk, we include theinterbank ratio, which is the money lent to other banks divided by the money borrowed from otherbanks. Once more, innovating banks show a significant higher risk, and lower liquidity. On thecontrary, less-innovating banks are net placer of funds in the market place, and therefore moreliquid (the ratio is greater than 100).11
10 To compute stock abnormal returns we use historical betas, computed using monthly returns on a 5-year rollingwindow.11 Data are available only for EU banks.

9
The primary function of equity is to support the bank’s operations, act as a cushion to absorbunanticipated losses and declines in asset values that could otherwise cause a bank to fail (TheFederal Reserve Board, 2013). A bank’s solvency promotes public confidence in the bank and thebanking system as a whole by providing continued assurance that the bank will honor its obligationsand provide banking services. By exposing stockholders to a larger percentage of any potential loss,higher equity levels also reduce the subsidy provided to banks by deposit insurance and otherelements of the safety net. Innovating banks equity to total asset ratio is lower than their less-innovating peers, thus suggesting lower capital adequacy and higher risk.
Business mixAlternative approaches to measuring banks’ risk-adjusted performance may require a deeper
analysis of the way in which banks run their business. We thus investigate the quality of loanportfolio, measured as the ratio of loan loss reserves to gross loans, which indicates how much oftotal portfolio has been provided but not charged off. It is a reserve for losses expressed aspercentage of gross loans. Given a similar charge-off policy, the higher the ratio the poorer thequality of the loan portfolio will be, but differences are not statistically significant between the twogroups of banks.12
The existing product mix influences bank’s strategic innovation, in particular product innovation.Specialisation is proved to enhance the probability of innovation in the financial sector (Boot andThakor, 1997). Bank business model typically suggest that bank assets can be invested in lending,and in securities. If investment in lending prevails, usually banks follow the traditional deposit-taking and loan-making business model. We investigate what percentage of assets of the bank areinvested in loans computing the gross-loans-to-total-assets ratio. Less-innovating banks invest ahigher percentage of assets (60 per cent) in loans than their innovating peers (55 per cent). Incontrast, differences in securities investment are not significant between the two groups.13
Geographical areaFirms located in regions with more financial innovations innovate more (Krugman, 1991;
Lerner, 2006). Knowledge spillovers are likely to be concentrated geographically, also becausefinancial innovation can be easily copied. We test whether European and US banks statisticallydiffer.14 European banks are on average younger, larger and less profitable than their US peers.They are more cost-efficient and enjoy a higher labour productivity. The lower quality of loanportfolio and larger total asset growth suggest that EU banks are riskier. They invest less in loans
12 We also test the net loans-to-total-asset ratio, which indicates the relevance of the loan portfolio as a percentage ofbank’s total asset or, alternatively, the percentage of total assets tied up in loans, and the loan loss provisions on netinterest margin, which is the relationship between provisions in the profit and loss account and the interest income overthe same period. Ideally this ratio should be as low as possible and in a well-run bank if the lending book is higher riskthis should be reflected by higher interest margins. None of these ratios seem to provide significant information.13 Bankscope data definitions identify the asset side of bank balance sheet into loans, other earning assets and non-earning assets. Loans include residential mortgage loans, other mortgage loans, other consumer/retail loans, corporateand commercial loans and other loans. Other earning assets include reverse repos and cash collateral, trading securities,derivatives, available for sale securities, held to maturity securities, at-equity investments, and other securities. Non-earning assets include cash and due from banks, fixed assets, goodwill and other intangibles.14 We do not perform single country t-test since the number of banks belonging to innovating and to less-innovatinggroups is too low to infer statistically meaningful results. The only exceptions are Italy and the US.

10
but more in securities than US banks. European banks thus show features which are typical of theinnovating group.15
3.2. Country-specific dataWe investigate additional set of factors specific to each banking system and to each country,
which is expected to affect the capacity of banks to innovate. Table 4 shows the result of the test formean differences.16
Banking systemLower concentration in the banking system should enhance the likelihood to innovate, as banks,
which compete harvest to retain customer base and get new clients, are pushed to launch newproduct, or to be more efficient through process innovation. Nevertheless, innovation may arise inhigher concentrated markets. There is a time lag between the moment of investing in innovation andthe payback. This gap disconnects the innovation effort from the actual business outcome (Gardner,2009). Banks in higher concentrated markets may have more money to invest, thank to rentsderiving from a dominant position, and lower pressure to positive outcome, which might conveyinnovations in the end. Both the Herfindahl-Hirschman Index, which refers the size of the bank inrelation to the industry, and the market share of the five largest banks, suggest that innovating bankswork in highly concentrated markets.17
We complement this information investigating the size of the banking system, which is oftenused as an indicator of potential development and helps to explain the likelihood of innovation inthe countries under scrutiny (Dermine, 2006). We measure the total assets of all credit institutions-to-gross domestic product (GDP), and the number of bank employees to the number of banks ratioper year per country. These measures indicate that innovating banks are located in smaller andoverstaffed banking systems, thus being the big fish in the smaller (and highly concentrated) pond.Such preeminent position might be beneficial in terms of innovation and lead to greater investment.
Country-specificInnovation can be spurred by a higher level of education and a higher rate of participation to the
workforce (Nickerson and Sullivan, 2003; Kroll and Stahlecker, 2009). Higher education makesclients more receptive to innovation, while at the same time, it boosts the education level of thelabour force, so raising productivity. In fact, innovating banks are located in countries with lowertertiary education participation rate and lower employment rate. This is consistent with banks notusually having a research and development department and sometimes using innovations developedin other sectors. The place where innovation is applied does not necessarily coincide with the placewhere research is performed.
We finally include a set of controls. The GDP growth and long-term yield are often used asindicators of potential development of the financial sector. We investigate the country ofincorporation of banks using dummies, which aim at capturing country specificity, as in reporting.
15 Results of the test for equality of means are available from the authors.16 Data are gathered from Eurostat, the European Central Bank Structural Indicators, the International Monetary FundWorld Economic Outlook database, the Federal Deposit Insurance Corporation and the Bureau for Labour Statistics.17 Both ratios are computed at country level, thus all banks incorporated in the same country show the same ratio peryear.

11
Portuguese banks’ annual reports are clear and comprehensive, whereas other countries providemore concise reports. Since we coded data starting from information available on annual reports,their clarity and length may affect our analysis. Alternatively, we use a dummy of the main stockexchange on which bank is listed, since transparency and accountability of annual reports may beenhanced by specific market regulation.
We use a trend variable to check whether innovation may be growing or shrinking over time forreasons essentially unrelated to our set of explanatory variables. We also control for a financialcrisis effect, which would reduce innovation, using a dummy.
4. Research designWe previously investigate financial innovation on an anecdotal level (Table 2 and Figure 1). To
better understand the drivers leading banks to innovate, we construct a score dependent variable oninnovation (INN) which ranges from zero to six according to the number of categories where bank iinnovates in country j, in year t. We identify the determinants of innovation adoption by bank i inmarket j at some point in time (INNi,j,t) by bank’s profitability, efficiency, risk and product mixvariables (Xi,t), presented in the previous section and summarized in Table 3. The idea is to seewhether, in the aggregate, the decision to innovate is linked to some specific characteristics of thebank. Equation (1) below recognizes that, for both temporal and business reasons, innovation wouldnot immediately result from changes in bank’s variables. Thus, we allow some bank’s variable toaffect INN with an annual lag (Xi,t-1).
18
We control for a set of banking system (Yj, t) and country-specific (Zj, t) variables as summarizedin Table 4.
Table 5 reports correlation among bank-specific variables of interest. Our variable correlationsare within the conventional limits and, as a consequence, we continue to include them in our fullmodel.
We would like to estimate the following model:
INNi,j,t = αi + βi Xi,t + ẟi Xi,t-1 + σj Yj,t + τj Zj,t + εi,t (1)
We estimate (1) by random effects since we have reason to believe that differences across bankshave some influence on the degree of innovation. Using random effects we may include time-constant controls among the explanatory variables or slow changing variables over time.19 Thisspecification requires that bank’s characteristics which may or may not influence the independentvariables are clearly identified. The problem with this is that some variables may not be available,
18 Having lagged explanatory variables however reduces the number of observations to 169 and the number of banksunder scrutiny to 54.19 We report theta (θ) to check whether the random effects estimator is biased and rho (ρ) to control whether the randomeffects estimates are close to the pooled OLS estimates. As θ goes to one, the bias term goes to zero and, as aconsequence, the random effects estimator tends to the fixed effects estimator. If theta is close to zero, a larger fractionof the unobserved effect is left in the error term and the random effect estimator is biased and identical with the pooledOLS estimator. We compute the Hausman test which fails to reject the null hypothesis, meaning that the random effectsand fixed effects estimates are sufficiently close so that it does not matter which one is used (Wooldridge, 2009).Focusing on rho, if it is close to zero the random effects estimates are closed to the pooled OLS estimates. We thencompute the Breusch-Pagan Lagrange multiplier, which helps to decide between a random effects regression and asimple OLS regression, and we reject the null, finding that random effects regression is appropriate.

12
therefore leading to omitted variables bias in the specification. We compute the Ramsey’s test foromitted variables and results indicate that our specifications have no omitted variables.
Considering Equation (1), in which innovation is the dependent variable and bank characteristicsare the independent variables, we could face an additional problem. Banks with low profits wouldspend relatively little on innovations, and the variations across such banks would be small. Formore profitable or larger banks the amount of discretionary investments would be higher. Theaverage amount spent on innovation would be higher, and there would also be greater variabilityamong such banks, resulting in heteroskedasticity (HS). We use both Breusch-Pagan and White’stests for HS and since we fail to reject the null hypothesis of homoskedasticity at any reasonablelevel of significance, HS does not appear to be a problem.
We finally compute variance inflation factors (VIFs) of our regression coefficients. They are allbelow conventional thresholds which would indicate a problem with multicollinearity (Neter et al.,1989).
4.1 ResultsThe results from estimating equation (1) are presented in Table 6. Column 1 reports the findings
of the baseline model which investigates the bank-specific determinants of innovation. The mainvariable of interest is bank size relative to the market. We find that bank market share is significantwith a positive sign. Holding other variables fixed, if a bank increases its market share by one percent, innovation increases by five per cent. Our result shows that a larger market share allows theinnovating commercial bank to derive greater margins from a given innovation and, as aconsequence, gives it greater incentives to engage in innovating activity. This is consistent withprevious evidence on investment banks.
Contrary to expectations the age of the bank, its efficiency or profitability are not related toinnovation. Among bank risk variables, total asset growth and the volatility of returns appear withone lag in our regression framework. Both variables are significant at 10 per cent level. As for theannual rate of growth of bank’s total assets, if it increases from 10 to 11 per cent (+10 per cent),innovation increases immediately by 7.2 per cent, then after one year, by 8.9 per cent. The decisionto innovate is positively linked to the percentage variation of total assets, since fast growing banksincreases their market share relative to competitors, thus enjoying greater benefits from a giveninnovation.
Banks showing higher volatility of actual (i.e. accounting) profits are also those accumulatingless innovation. The practical effect on innovation is however modest, since one per cent increase inthe standard deviation of ROE immediately reduces innovation by 0.04 per cent, whereas the firstlag variable has no significance impact on innovation. In an industry where funds are scarce, bankswith a stable pattern of returns may devote more resources to innovation. Consistent with thisinterpretation, we find that risk adverse banks innovate more.
When we investigate equity to total asset ratio, we do not find any relation of this risk measurewith innovation. The level of equity cannot be easily reshuffled on a short-term horizon, thus beingunrelated to the decision to innovate.
We test the quality of loan portfolio measured by the reserves for impaired loans to gross loans.The relation is significantly positive at five per cent level with a lag and the magnitude of thecoefficient gives an idea of the economic importance: if the ratio increases from 10 to 11 per cent(+10 per cent), innovation increases by 390 per cent after one year. If reserves for impaired loans

13
increase more than gross loans, either the bank covers loan losses adequately, and, if margins aresatisfactory, can sustain the cost of innovating; or has a lower quality of loan portfolio, and decideto pursue innovation trying to reduce impaired loans, for example launching new products, orchanging its organizational structure or technology.
When we add banking system variables (Table 6, Column 2), results hold, but the immediaterelation of total asset growth with innovation. Concentration in the banking system, as measured bythe HHI, is negatively related to innovation at 5 per cent significance level. Banks located in lessconcentrated markets compete harvest to retain customer base and get new clients, and, as aconsequence, have stronger incentives to launch new product, or to be more efficient throughprocess innovation. The economic impact is however modest. As in the case of Belgium, whenbanking system concentration decreases by 10 per cent from 2007 to 2008, innovation increases by0.014 per cent.
Another variable of interest is the average number of bank employees, computed using countrylevel data. A higher number of employees is usually related to traditional banking systems whereclients still prefer bank branches and physical interaction, or, because of generally higher personnelexpenses, to banking system which are less cost efficient. Consistent with this latter interpretation,we find that the average number of bank employees is negatively related to innovation at 5 per centsignificance. One per cent increase in the average number of bank employees decreases innovationby 0.001 per cent. When banks have a higher market share and grow faster in less concentrated andmore efficient banking systems, they enjoy a preeminent position which leads to innovation.
In Table 6, Column 3 we include a set of controls for the economic cycle and the level of interestyield.20 We find that the equity to total asset ratio is negatively related with innovation at ten percent significance level. Holding all other variables fixed, if a bank increases equity ratio by one percent, thus increasing the protection afforded to the bank by the equity invested in it, innovation fallsby 5.6 per cent. Riskier banks are the best candidate to innovation, since they try to reduce riskthrough innovation.
Finally, in Table 6, Column 4 we control for the phenomenon of finding a relationship betweentwo or more trending variables simply because each is growing over time (Wooldridge, 2009).Allowing for a time trend in Equation (1) explicitly recognizes that innovation may be growing orshrinking over time for reasons essentially unrelated to the explanatory variables.21 The story isquite the same but for total asset growth, which is not statistically significant anymore. The timetrend is statistically significant at 5 per cent level and its coefficient implies an approximate 0.2 percent decrease in innovation per year, on average. Previous results show a spurious relationshipbetween innovation and total asset growth due to the fact that both are trending downward overtime.
4.2 Additional testsAs reported in Table 6 we have a main sample of 54 banks and 169 observations. In Table 7 we
repeat the same exercise on three different sub-samples to assess the robustness of our results.
20 R-squared between is larger omitting Agebank, which therefore has been dropped.21 For instance, total asset growth may have a trend. If we regress total asset growth on trend, we obtain a coefficient onthe trend equal to -0.003. Although the standard errors on the trend coefficient are not necessarily reliable, thecoefficient estimate reveals a downward trend. The joint significance test between Agebank and trend is not significantand R-squared between is larger if Agebank is dropped.

14
Recalling Figure 1, which presents the distribution of banks to the number of categories theyinnovate over the four-year period, we rank banks according to the total number of innovationcategories they promoted from 2005 to 2008 and we drop less-innovating banks according tovarious thresholds. First, in Column 1 to 4 we drop banks belonging to the 1st decile of innovationdistribution, and we estimate Equation (1) on a reduced sample of 47 banks and 145 observations.Then we drop banks that have not innovated in any categories over the four-year period underscrutiny (Column 5 to 8), and, as a consequence, the sub-sample is formed by 46 banks and 141observations. Finally, we exclude banks up to the 1st quartile of innovation distribution (Column 9and 10) and report results on a sub-sample of 42 banks and 125 observations.22
Our results remain unchanged in the specifications with banking system and trend variables forall sub-samples (Columns 2, 4, 6, 8, 9 and 10). In the baseline model (Column 1 and 5) total assetgrowth has still a positive effect on innovation but significant only at 11 per cent level. When weadd the set of country-specific control variables (Column 3 and 7), both volatility of returns andequity to total asset ratio have negative signs but are no more significant at the usual levels.
4.3 Geographical and financial crisis effectOur finding of Section 4.1 is that banks with larger market share, a lower volatility of returns and
quality of loan portfolio innovate more. In Section 3 we pointed out that geographical effectencouraging innovation may exist. Financial innovation can be easily copied by competitors andpeer pressure pushes innovating banks to innovate more to keep their leading position. Thus it is notunlikely that banks located in regions with more financial innovation innovate more.
We also observe that innovation is trending downward over time. In an industry where funds arescarce, banks feel the need to be more liquid, and reducing innovation is a possible response to thisneed. Consistent with this interpretation, the number of innovation categories dramatically droppedfrom 2008.
We try to capture the geographical effect interacting a dummy for bank incorporated in the USwith selected independent variables (Table 8, Column 1).23 The idea is that significant independentvariables might have a different effect for banks who are incorporated in the United States ratherthan in the EU. We are interested in the effects of bank market share, quality of loan portfolio andvolatility of returns on innovation. The estimated impact of the market share on innovation for EUbanks is 7.01, for US banks it is 20.02, holding other variables fixed. The difference (+13) iseconomically large and statistically significant. Thus we conclude that there is evidence against thehypothesis that the impact of the market share on innovation is the same for EU and US banks.Indeed, the impact of the market share on innovation is lower for banks incorporated in the EU.Similar evidence is found for the impact of the quality of loan portfolio on innovation, which issignificantly different between European and US banks. In particular, lower quality of loanportfolio increases the incentive for European banks to innovate, whereas it reduces innovation forUS banks. When we look at the volatility of returns we do not find any significant difference in theimpact on innovation among banks incorporated in the EU or in the US.
22 We could not test the baseline model and the model with country-specific variables on this last sub-sample because ofheteroskedasticity (the sub-sample is too small). The same issue apply to a sub-sample formed by banks above themedian of the innovation distribution.23 We could not use a geographical dummy for each country under scrutiny because of the paucity of data.

15
We finally investigate the financial crisis effect interacting a year dummy for 2008 with marketsshare and equity to total asset ratio (Table 8, Column 2).24 The coefficient of the year dummy isnegatively significant and explains the difference in innovation between the crisis and the pre-crisisperiod, holding other variables fixed. Thus, not surprisingly, the coefficient of the year dummydetermine that, for the same level of other factors, during the financial crisis banks innovated lessthan the pre-crisis period. All major banks were highly concerned about the turmoil and adopted aconservative approach to innovation As for banks market share, the difference between the twoperiods is economically large (-35 per cent) but not statistically significant at the usual levels. Wethen interact the financial crisis effect with equity to total asset ratio. As a measure for bank risk,this ratio should be affected by the financial turmoil. Indeed the pre-crisis impact of equity to totalasset on innovation is -8.75, whereas in 2008 it is +0.28 (or about 30 per cent). The differencebetween the two periods is large (+9) and statistically significant, and it means that before thefinancial crisis riskier banks innovate more, but when the crisis hits less risky banks take the lead oninnovation. Riskier banks were more deeply affected by the crisis, and as a consequence, were lessfocused on innovating activity.
5. ConclusionWe propose an alternative measure for financial innovation, based on bank’s annual reports. To
identify financial innovation we focus on three features that have to be present simultaneously:strong discontinuity with the past, actual improvement of the service for clients, and profitenhancement. This is the kind of innovation which should be encouraged by regulators, since itenhances the functions of the banking system, and, as a consequence, leads to the growth of the realeconomy. We find that product innovation prevails both in Europe and in the US, but innovationfalls from 2005. Not only banks innovate in less categories, but also less banks engage ininnovation.
Using test of equality of means we show that innovating banks hold on average a larger marketshare, are younger, more cost-efficient but less profitable than less-innovating peers. Bank risk, asmeasured by various ratios, is higher for innovating banks, which invest a lower percentage of theirassets in traditional lending activity. These results are partly consistent with the previous literatureon financial innovation.
We then study the drivers of innovation in a regression framework and find that when bankshave a higher market share in less concentrated and more efficient banking systems, they enjoy apreeminent position which leads to innovation. A stable pattern of returns allows banks to devotemore resources to innovation. In addition a lower quality of loan portfolio increases the incentivefor the bank to invest in innovation. This may derive by a more adequate coverage of loan losses,which once again allow banks to invest in innovation; or by the need to improve quality of portfoliothorough innovative products and processes.
The impact of the market share on innovation is higher for banks incorporated in the US. Similarevidence is found for the impact of the quality of loan portfolio on innovation, which issignificantly different between European and US banks. In particular, lower quality of loanportfolio increases the incentive for European banks to innovate, whereas it reduces innovation for
24 We do not include time trend since it is correlated with the year dummy.

16
US banks. As a final remark if in normal times riskier banks innovate more, when the crisis hits lessrisky banks take the lead on innovation.

17
ReferencesAltunbas, Y., Manganelli S., Marques-Ibanez D. (2011) Bank Risk during the Financial Crisis. Do Business
Models Matter? ECB Working Paper Series No 1394, November.Arrow K.J. (1962) Economic welfare and the allocation of resources for innovation, in Nelson R.R. (ed),
The rate and direction of inventive activity: economic and social factors, Princeton University Press,Princeton, 609-625.
Bhattacharyya S., Nanda V.K. (2000) Client discretion, switching costs and financial innovation, Review ofFinancial Studies 13, 1101-1127.
Bebchuk, L., Spamann, H. (2010) Regulating banker’s pay, Georgetown Law Review 98, 247–287.Beck, T., Chen, T., Lin, C. and Song, F. (2012) Financial Innovation: The Bright and the Dark Sides,
Working Papers 052012, Hong Kong Institute for Monetary Research.Beltratti, A., Stulz, R. M. (2012) The credit crisis around the globe: Why did some banks perform better?,
Journal of Financial Economics.Boldrin, M., Levine D.K. (2013) The Case Against Patents, Journal of Economic Perspectives 27 (1), 3–22.Boot A.W.A., Thakor A.V. (1997) Banking scope and financial innovation, The Review of Financial
Studies 10(4), 1099-1131.Casu B., Ferrari A., Zhao T. (2013) Regulatory Reform and Productivity Change in Indian Banking, The
Review of Economics and Statistics 95(3), 1066-1077.Demirguc-Kunt, A., Detragiache E., Merrouche O. (2010) Bank Capital: Lessons from the Financial Crisis,
The World Bank Policy Research Working Paper Series 5473.Dermine J. (2006) European Banking Integration: Don't Put the Cart before the Horse, Financial Markets,
Institutions and Instruments 15(2), 57-106.Diamond, D.W., Rajan, R.G. (2009) The credit crisis: conjectures about causes and remedies, American
Economic Review 99, 606–610.ECB (2003) Structural change and growth prospects in Asia – challenges to central banking, Speech by
Solans E.D., Member of the governing council and of the executive board of the European CentralBank, delivered at the 38th SEACEN governors conference and 22nd meeting of the SEACEN board ofgovernors, Manila, Philippines, http://www.ecb.europa.eu/press/key/date/2003/html/sp030213.en.html
ECB (2010) Beyond ROE – How to measure bank performance, Appendix to the report on EU bankingstructures, September.
Foos D., Norden L., Weber M. (2010) Loan Growth and Riskiness of Banks, Journal of Banking andFinance 34, (12), 2929-2940.
Frame W.S., White L.J. (2004) Empirical studies of financial innovation: lots of talk, little action?, Journalof Economic Literature 42, 116-144.
Frame W.S., White L.J. (2012) Technological change, financial innovation and diffusion in banking, inBerger A.N., Molyneux P. and Wilson J.O.S. (eds), The Oxford Handbook of banking.
GardnerJ.A. (2009) Innovation and the Future Proof Bank: A Practical Guide to Doing Different Business-as-Usual, August, John Wiley & Sons.
Hall B. H., Thoma G., Torrisi S. (2009) Financial patenting in Europe, European Management Review 6(1),45-63
Hunt R. (2008) Ten Years After: What Are the Effects of Business Method Patents in Financial Services?,Business Review Q3 2008, 21-34.
Johnson S., Kwak J. (2012) Is Financial Innovation Good For The Economy?, in Lerner J., Stern S. (eds),Innovation Policy and the Economy, Volume 12, 1-15, University of Chicago Press,http://www.nber.org/chapters/c12450
Keeton W. (1999) Does Faster Loan Growth Lead to Higher Loan Losses, Federal Reserve Bank of KansasCity, Economic Review 1999 (2), 57-75.
Krippendorff, K., 2004. Content Analysis: An Introduction to Its Methodology. Sage Publications,Thousand Oaks, CA.
Kroll H., Stahlecker T. (2009) Europe’s regional research systems: current trends and structures, EuropeanCommission – Directorate-General for Research.
Krugman P. (1991) Geography and trade, MIT Press, Cambridge, MA.IMF (2006) Global Financial Stability Report, Market Developments and Issues, World Economic and
Financial Surveys, April, http://www.imf.org/external/pubs/ft/GFSR/2006/01/

18
Laeven L., Majnoni G. (2003) Loan Loss Provisioning and Economic Slowdowns: Too Much, Too Late?,Journal of Financial Intermediation 12, pp. 178-197.
Lehnert A. (2014) Information needs of macroprudential policymaking, Federal Reserve Bank of Atlanta,2014 Financial Markets Conference, April 16.
Lerner, J. (2006) The New New Financial Thing: The Origins of Financial Innovations, Journal of FinancialEconomics 79, 233-55.
Lerner J., Tufano P. (2011) The Consequences of Financial Innovation: A Counterfactual Research Agenda,NBER Working Paper 16780, February.
Levine, R. (1997) Financial development and economic growth, Journal of Economic Perspectives 35, 688–726.
Levine, R. (2005) Finance and Growth: Theory and Evidence. In: P. Aghion and S. Durlauf, Handbook ofEconomic Growth, Elsevier.
Lieblich, A., Tuval-Mashiach, R., Zilber, T., 1998. Narrative Research: Reading, Analysis, andInterpretation. Sage Publications, Thousand Oaks, CA.
Llewellyn D.T. (2009) Financial innovation and the economics of banking and the financial system, inAnderloni L., Llewellyn D.T., Schmidt R. (eds), Financial innovation in retail and corporate finance,Edward Elgar, UK
Mendoza E., Quadrini V., Rìos-Rull V. (2009) Financial Integration, Financial Development, and GlobalImbalances, Journal of Political Economy 117(3), University of Chicago Press, 371-416.
Merton R. (1992) Financial innovation and economic performance, Journal of applied corporate finance 4,12-22.
Mohnen P., Roller L.H. (2005) Complementarities in innovation policy. European Economic Review 49,1431-1450.
Neter J., Wasserman W., Kutner M.H. (1989) Applied linear statistical models, Homewood, Irwin.Nickerson D., Sullivan R. (2003) Financial Innovation, Strategic Real Options and Endogenous
Competition: Theory and an Application to internet Banking, Federal Reserve Bank of Kansas City,Payments System Research Working Paper 1.
Pavitt K. (1984) Sectoral patterns of technical change: towards a taxonomy and a theory, Research Policy13, 343-373.
Piazza R. (2010) Financial innovation and risk, the role of information, IMF Working Paper, WP/10/266.Prusa T.J., Schmitz Jr J.A. (1994) Can companies maintain their initial innovation thrust? A study of the PC
software industry, Review of Economics and Statistics 76(3), 523-540.Rajan R. (2005) Has financial development made the world riskier?, Proceedings - Economic Policy
Symposium - Jackson Hole, Federal Reserve Bank of Kansas City, August, 313-369.Scherer F.M., Ross D. (1990) Industrial Market Structure and Economic Performance, University of Illinois
at Urbana-Champaign's Academy for Entrepreneurial Leadership Historical Research Reference inEntrepreneurship.
Schumpeter J. (1943) Capitalism, Socialism and Democracy, Unwin University Books, London.Schwartz-Ziv M., Weisbach M.S. (2013) What do boards really do? Evidence from minutes of board
meetings, Journal of Financial Economics 108, 349–366Shleifer, A., Vishny R.W. (2010) Unstable Banking, Journal of Financial Economics 97(3), 306-318.Silber W. (1983) The process of financial innovation, American Economic Review 73, 89-95.Shin H.S. (2010) Financial intermediation and the post crisis financial system, BIS Working papers, 304,
March.Stemler, S., 2001. An overview of content analysis. Practical Assessment, Research and Evaluation 7(17).Stiglitz J.E. (2010) Financial innovation, The Economist debates, http://www.economist.com/
debate/days/view/471The Federal Reserve Board (2013) Commercial Bank Examination Manual, Section 3000, Liabilities and
Capital, http://www.federalreserve.gov/boarddocs/supmanual/cbem/3000.pdfTrichet J.C. (2009) The financial crisis and the ECB's response so far, Keynote address by Mr Jean-Claude
Trichet, President of the European Central Bank, at the Chatham House Global Financial Forum, NewYork, 27 April, BIS Review 51/2009.
Tufano, P. (2003) Financial Innovation, in G.M. Constantines, M. Harris, and R. Stulz, eds. Handbook ofthe Economics of Finance, Vol. 1a: Corporate Finance, Amsterdam, Elsevier.
Wall L.D. (2014) Two drivers of financial innovation, Notes from the vault, Center for Financial Innovationand Stability, The Federal Reserve Bank of Atlanta, February.

19
Wooldridge J.M. (2009) Introductory econometrics, a modern approach, fourth edition, South-WesternCengage Learning, Canada.
Xiao S., Zhao S. (2012) Financial development, government ownership of banks, and firm innovation,Journal of International Money and Finance 31, 880-906.

20
Table 1 – Summary statistics for banks (year 2008)________________________________________________________________________________This table provides descriptive statistics for key bank-specific features at the end of 2008. Banks aregrouped by the stock exchange they are listed on.
StockExchanges
Numberof banks
Total assets (bn euro) Average market capitalisation (mn euro)
Mean Min Max St. dev. Mean Min Max St. dev.Euronext 16 467.1 2.3 2,075.6 654.3 12,641.3 197.7 3,213.2 15,375.6LSE 30 348.0 0.2 2,515.7 670.4 14,659.7 58.5 120,260.1 25,585.8NYSE 35 179.9 1.5 1,478.8 406.7 14,205.9 81.6 97,068.9 27,217.8Total 81 299.8 0.2 2,515.7 573.0 14,061.3 58.5 120,260.1 24,358.4
Return on equity (%) Cost to income ratio (%)Mean Min Max St. dev. Mean Min Max St. dev.
Euronext 16 -11.0 -134.9 13.3 37.1 84.2 52.6 185.4 32.7LSE 30 -7.2 -111.8 15.9 29.2 70.9 30.5 214.3 31.2NYSE 35 -2.4 -47.7 24.9 17.9 86.1 51.0 386.4 59.6Total 81 -5.9 -134.9 24.9 26.7 80.1 30.5 386.4 46.0
Net loans to total assets ratio (%)Mean Min Max St. dev.
Euronext 16 52.0 2.7 82.5 26.8LSE 30 55.3 4.4 90.5 24.6NYSE 35 63.9 18.1 82.3 13.9Total 81 58.3 2.7 90.5 21.5

21
Table 2 – Innovation areas per year (all banks)________________________________________________________________________________This table describes the coding guidelines for innovation areas (INN), defined as a score variablewhich ranges from zero to six according to the number of categories where bank i innovates in yeart.
Year Innovation areas (INN) INN perbank per
year (avg)Group
organisationalmodel (1)
Organisationalstructure (2)
Operatingsystems
(3)
Informationand
communicationtechnology (4)
Deliverychannel
(5)
Product(6)
Total
2005 32 34 40 39 28 52 225 2.82006 34 35 29 43 23 50 214 2.62007 29 22 23 36 19 50 179 2.22008 28 26 19 25 19 48 165 2.0Total 123 117 111 143 89 200 783 2.4(%) 16% 15% 14% 18% 11% 26%
Figure 1 – Distribution of number of banks to total innovation areas (all years)________________________________________________________________________________This table shows the distribution of the number of banks to total number of areas where theyinnovate over the four-year period. Asterisk (*) indicates the median of the distribution.
0
1
2
3
4
5
6
7
8
9
0 1 2 3 4 5 6 7 8* 9 10 11 12 13 14 15 16 17 18 19 21 24
Num
ber
of b
anks
Total innovation areas
22
Table 3 – Test for equality of means – bank specific variables. Innovating and less-innovating banks_______________________________________________________________________________________________________________________This table presents results of the test for equality of means between innovating (above the median of the distribution of number of banks to totalinnovation areas) and less-innovating (below the median of the distribution of number of banks to total innovation areas) banks for bank-specificvariables. */**/*** indicate significance at 10, 5, and 1 per cent level.
Variable Description Variablename
Obs Mean (t) of banksbelow the median
(less-innovating banks)
Obs Mean (t) of banksabove the median(innovating banks)
Test for equalityof means (p-
value)Bank specificSize Logarithm total assets size 137 16.17 179 18.22 0.0000***Marketcapitalization
Market capitalization (yearly average) emktcap 139 6,387.98 174 28,731.08 0.0000***
Relative size (%) Bank total asset/country credit institutions total asset rize 137 1.00 179 10.00 0.0000***Age of the bank Logarithm (2008 – year of establishment of bank) agebank 140 4.50 184 4.01 0.0001***EfficiencyLabour cost Personnell expenses/total assets cost2 136 0.02 173 0.01 0.0132**Cost to total assets Overheads/total assets cost 131 0.20 172 0.09 0.0359**Cost to Income Cost to income ratio (%) ci 136 62.85 173 73.69 0.0197**Bank labourproductivity
Customer deposits/number of employees (standardised) sblp3 110 -0.19 133 0.14 0.0119**Overheads/number of employees (standardised) scpc 110 0.12 130 -0.14 0.0377**Gross loans/number of employees (standardised) sblp1 110 -0.14 133 0.17 0.0219**Net intermediation margin/number of employees(standardised)
sblp 114 0.14 135 -0.14 0.0254**
ProfitabilityReturn on assets ROA (%) roa 131 1.06 167 0.59 0.0135**Profitability index Net interest margin/total assets pindex 131 0.20 172 0.09 0.0359**EBITDA torevenues ratio
EBITDA/net interest margin ebitda 107 4.58 129 0.07 0.2968
Price earnings Price to earnings ratio pe 113 19.65 127 13.62 0.0004***Risk-adjustedperformance
Average return on equity (ROE)/standard deviation ROE riskadj 109 25.29 115 22.27 0.6586
RiskTotal asset growth Annual growth rate of total assets tag 136 0.09 172 0.18 0.0020***Volatility ofreturns
Standard deviation ROE roev 133 2.81 152 3.92 0.2245

23
Liquidity risk Interbank ratio (%) (only for EU banks) liq 48 125.32 116 87.18 0.0064***Equity Equity to total asset ratio capital 137 0.13 175 0.07 0.0000***Business mixQuality of loanportfolio
Reserves for impaired loans/gross loans loq3 119 0.02 164 0.02 0.6008Net loans/total assets (%) loq 132 57.95 176 57.35 0.7987Loan loss provisions/net interest margin loq2 131 0.14 175 0.13 0.8820
Investment in loans Gross loans/total assets mix2 131 0.60 177 0.55 0.0227**Investment insecurities
Other earning assets/total assets mix 136 0.356 177 0.355 0.9488
Table 4 – Test for equality of means – banking system and country specific variables. Innovating and less-innovating banks_______________________________________________________________________________________________________________________This table presents results of the test for equality of means between innovating (above the median of the distribution of number of banks to totalinnovation areas) and less-innovating (below the median of the distribution of number of banks to total innovation areas) banks for banking systemand country-specific variables. */**/*** indicate significance at 10, 5, and 1 per cent level.
Variable Description Variablename
Obs Mean (t) of banksbelow the median(less-innovatingbanks)
Obs Mean (t) of banksabove the median(innovating banks)
Test for equalityof means (p-value)
Banking systemConcentration of the banking system Herfindahl-Hirschman index hhi 140 249.99 184 564.25 0.0000***
Share of the five largest banks (%) c5 140 25.72 184 39.68 0.0000***Size of the banking system Total assets of all credit institutions
(standardised) scta 140 0.31 184 -0.21 0.0000***Number of employees/number of banks nenb 140 441.70 184 506.70 0.0266**
Country specificEducation Tertiary education participation rate (%) edr 140 4.94 184 4.25 0.0000***Employment Total employment rate (%) emr 140 45.23 184 44.29 0.0566*Macroeconomic GDP growth ggdp 140 1.55 184 1.36 0.0000***
Long term yield yrate 140 4.48 184 4.39 0.1824

24
Table 5 – Correlation matrix________________________________________________________________________________This table reports correlation coefficients and their significance between selected bank specificvariables of interest; */**/*** indicate p<0.05, p<0.01 and p<0.001 respectively. Variables are asthose described in Table 3.
1 2 3 4 5 6 7 8
1 Age 1
2 Relative size -0.138** 1
3 EBITDA torevenues
0.154* 0.021 1
4 Cost income -0.216*** -0.051 -0.050 1
5 Reserves forimpaired to grossloans
-0.104 -0.038 -0.006 0.158** 1
6 Equity to totalasset
-0.144** -0.274*** 0.057 0.127* 0.396*** 1
7 Total asset growth -0.021 0.144** -0.010 -0.030 0.000 -0.035 1
8 Volatility of ROE -0.141** 0.068 -0.073 0.252*** 0.225*** 0.028 -0.003 1

25
Table 6 – Bank-specific, banking system and country-specific determinants of innovation
________________________________________________________________________________This table reports results from a panel random effects model of INN (defined as a score variablewhich ranges from zero to six according to the number of categories where bank i innovates in yeart) on a baseline vector of bank characteristics (Column 1), banking system variables (Column 2),country-specific variables (Column 3), and a model including a time trend (Column 4). Panel modelstandard errors are reported between brackets. Asterisks indicate significance at 1 per cent (***), 5per cent (**) and 10 per cent (*) levels. Column 3 and 4 present heteroskedasticity robust standarderrors.
(1) (2) (3) (4)Independent variables Baseline model with banking
systemwith country-
specificwith trend
Constant 0.61 2.96** 1.68 2.89***[1.044] [1.249] [1.182] [0.574]
Age 0.22 -0.08[0.182] [0.198]
Relative size 4.97*** 9.26*** 8.95*** 9.11***[1.808] [2.419] [2.459] [2.509]
Cost income -0.00 -0.00 -0.00 -0.00[0.004] [0.004] [0.002] [0.002]
EBITDA to revenues 0.00 -0.00 -0.00 -0.00[0.013] [0.012] [0.005] [0.005]
Total asset growth 0.72* 0.68 0.79* 0.57[0.423] [0.428] [0.467] [0.395]
Total asset growth (lag) 0.89* 0.83* 0.69 0.45[0.474] [0.487] [0.534] [0.553]
Volatility of ROE -0.04* -0.04* -0.03** -0.03**[0.022] [0.022] [0.017] [0.015]
Volatility of ROE (lag) 0.01 0.01 0.02 0.02[0.056] [0.055] [0.048] [0.049]
Equity to total assets -4.14 -5.38 -5.61* -5.29[4.038] [3.875] [3.246] [3.250]
Reserves for impaired to gross loans -4.95 -2.99 -3.49 -2.69[8.771] [8.426] [5.550] [5.460]
Reserves for impaired to gross loans (lag) 39.04** 44.77*** 49.52** 45.47**[17.884] [17.056] [20.190] [19.692]
HHI -0.00** -0.00* -0.00*[0.001] [0.001] [0.001]
Number of employees to number of banks ratio -0.00** -0.00*** -0.00**[0.001] [0.001] [0.000]
GDP growth 0.08[0.075]
Long term yield 0.14[0.268]
Time trend -0.19**[0.082]
Observations (bank) 169 (54) 169 (54) 169 (54) 169 (54)
R-squared between 0.48 0.58 0.59 0.58
Ramsey's test (Prob>F) 0.2624 0.3252 0.1173 0.1082

26
Theta (median) 0.55 0.49 0.48 0.50
Rho 0.50 0.42 0.41 0.43
White's test (Prob>chi2) 0.1922 0.3127 0.7381 0.8914
Mean VIF 1.93 2.26 2.15 2.14

27
Table 7 – Robustness test_______________________________________________________________________________________________________________________This table reports results from a panel random effects model of INN (defined as a score variable which ranges from zero to six according to thenumber of categories where bank i innovates in year t) on a baseline vector of bank characteristics (Column 1 and 5), banking system variables(Column 2, 6 and 9), country-specific variables (Column 3 and 7), and a model including a time trend (Column 4, 8 and 10). Column 1 to 4 reportresults on a sub-sample where banks up to the 1st decile of innovation distribution have been dropped. Column 5 to 8, report results on a sub-sampleformed by banks which innovate at least in one category over the four-year period under scrutiny. Column 9 and 10 report results on a sub-samplewhere banks up to the 1st quartile of innovation distribution have been dropped. Panel model standard errors are reported between brackets.Asterisks indicate significance at 1 per cent (***), 5 per cent (**) and 10 per cent (*) levels. Column 3, 4, 7, 8 and 10 present heteroskedasticityrobust standard errors.
Dropped banks up to 1st decile of innovation Dropped banks with zero innovation over the 4-year period
Dropped banks up to 1stquartile of innovation
(1) (2) (3) (4) (5) (6) (7) (8) (9) (10)Independent variables Baseline
modelwith
bankingsystem
withcountry-specific
with trend Baselinemodel
withbankingsystem
withcountry-specific
with trend withbankingsystem
with trend
Constant 1.11 4.18*** 1.21 3.43*** 1.06 4.14*** 1.32 3.51*** 4.70*** 4.11***[1.102] [1.260] [1.336] [0.628] [1.104] [1.259] [1.339] [0.641] [1.238] [0.734]
Age 0.14 -0.23 0.15 -0.21 -0.19[0.188] [0.193] [0.188] [0.193] [0.185]
Relative size 4.59** 9.77*** 8.88*** 9.02*** 4.59** 9.72*** 8.90*** 9.01*** 9.01*** 8.44***[1.903] [2.357] [2.227] [2.447] [1.909] [2.356] [2.220] [2.426] [2.276] [2.341]
Cost income -0.00 -0.00 -0.00 -0.00 -0.00 -0.00 -0.00 -0.00 -0.00 -0.00[0.004] [0.004] [0.004] [0.002] [0.004] [0.004] [0.004] [0.002] [0.004] [0.002]
EBITDA to revenues 0.00 -0.01 -0.01 -0.00 0.00 -0.01 -0.01 -0.00 -0.01 -0.01[0.013] [0.012] [0.011] [0.005] [0.013] [0.012] [0.011] [0.005] [0.011] [0.006]
Total asset growth 0.75 0.69 0.91* 0.58 0.76 0.70 0.90* 0.58 0.35 0.27[0.467] [0.467] [0.485] [0.434] [0.471] [0.472] [0.489] [0.443] [0.477] [0.391]
Total asset growth (lag) 1.17** 1.13** 0.91 0.62 1.07** 1.04* 0.83 0.55 1.02* 0.66[0.537] [0.545] [0.553] [0.537] [0.543] [0.550] [0.557] [0.535] [0.557] [0.532]
Volatility of ROE -0.05* -0.05** -0.04 -0.04** -0.05* -0.05** -0.04 -0.04** -0.06** -0.05***[0.026] [0.025] [0.026] [0.018] [0.026] [0.025] [0.027] [0.018] [0.025] [0.018]

28
Volatility of ROE (lag) 0.01 0.00 0.02 0.02 -0.00 -0.00 0.02 0.01 -0.01 0.00[0.061] [0.059] [0.059] [0.058] [0.062] [0.059] [0.059] [0.058] [0.058] [0.058]
Equity to total assets -0.52 -3.49 -5.09 -4.42 -0.28 -3.42 -5.09 -4.45 -6.31 -7.31[5.240] [4.873] [4.712] [4.285] [5.255] [4.875] [4.700] [4.329] [4.841] [4.501]
Reserves for impaired togross loans -7.38 -3.25 -2.91 -2.03 -7.22 -2.97 -2.66 -1.86 1.62 2.66
[9.826] [9.171] [8.936] [6.282] [9.844] [9.174] [8.922] [6.339] [9.070] [5.979]Reserves for impaired togross loans (lag) 36.17* 40.87** 48.27*** 40.92** 35.58* 40.02** 47.32*** 40.29** 30.62* 31.17*
[19.459] [17.775] [17.716] [18.992] [19.520] [17.806] [17.717] [18.873] [17.587] [17.288]HHI -0.00*** -0.00** -0.00** -0.00*** -0.00** -0.00** -0.00*** -0.00**
[0.001] [0.001] [0.001] [0.001] [0.001] [0.001] [0.001] [0.001]Number of employees tonumber of banks ratio -0.00*** -0.00*** -0.00*** -0.00*** -0.00*** -0.00*** -0.00*** -0.00***
[0.001] [0.001] [0.001] [0.001] [0.001] [0.001] [0.001] [0.001]GDP growth 0.14* 0.14*
[0.075] [0.076]Long term yield 0.30 0.30
[0.261] [0.262]Time trend -0.26*** -0.26*** -0.20**
[0.074] [0.076] [0.085]Observations (bank) 145 (47) 145 (47) 145 (47) 145 (47) 141 (46) 141 (46) 141 (46) 141 (46) 125 (42) 125 (42)R-squared between 0.44 0.60 0.62 0.60 0.43 0.60 0.62 0.61 0.64 0.65

29
Table 8 – Geographical and financial crisis effects on innovation_______________________________________________________________________________________________________________________This table reports results from a panel random effects model of INN (defined as a score variable which ranges from zero to six according to thenumber of categories where bank i innovates in year t) on a vector of bank characteristics, banking system variables and interaction effect betweenselected significant variables and a geographical dummy for bank incorporated in the US (Column 1); and a year dummy for 2008 (Column 2).Panel model standard errors are reported between brackets. Asterisks indicate significance at 1 per cent (***), 5 per cent (**) and 10 per cent (*)levels.
(1) (2)Independent variables geographical effect standard error financial crisis effect standard errorConstant 3.43*** [0.920] 3.29** [1.287]Age -0.09 [0.203]Relative size 7.01*** [2.493] 9.65*** [2.651]Cost income -0.00 [0.005] -0.00 [0.004]EBITDA to revenues -0.01 [0.014] -0.00 [0.012]Total asset growth 0.51 [0.425] 0.82* [0.429]Total asset growth (lag) 0.27 [0.528] 0.72 [0.485]Volatility of ROE -0.03 [0.026] -0.02 [0.024]Volatility of ROE (lag) 0.03 [0.056] 0.02 [0.055]Equity to total assets -6.51* [3.861] -8.75** [4.203]Reserves for impaired to gross loans -0.39 [8.467] -10.71 [9.052]Reserves for impaired to gross loans (lag) 36.49* [19.657] 54.09*** [17.398]HHI -0.00 [0.001] -0.00** [0.001]Number of employees to number of banks ratio -0.00** [0.001] -0.00** [0.001]Time trend -0.17* [0.089]Geographical effect (dummy US) -0.05 [0.613]
interaction with relative size 13.01** [5.482]interaction with reserves for impaired to gross loans -44.47* [23.390]
interaction with volatility of ROE 0.03 [0.045]Financial crisis effect (dummy year 2008) -1.10** [0.513]
interaction with relative size -0.35 [1.997]interaction with equity to total asset 9.03* [4.642]
Observations (bank) 169 (54) 169 (54)R-squared between 0.61 0.59

30