Embed Size (px)
Citation preview
investimeVOL XI ISSUE 08 August 2014 R30
Finance and Opportunity in India | PG-05
Treatment of Losses while Filing Tax Return | PG-38
Stock of the month – CCL Products Ltd | PG-44
Financial Inclusion: Empowering Indians in their journey to prosperity


AUGUST 2014 Investime 03
Editorial
Our nation is engaged in a relentless fight against poverty and unemployment. A sizeable segment of the population still lives below the poverty line. At the same time, we have been following a path of economic reforms and liberalisation in the last two decades which has resulted in significant achievements helpful for the long-term economic growth. But it is equally important that the fruits of economic advancement reach all the people. That may not happen on its own as it would require deliberate human intervention. If benefits do not reach all the people, it may lead to social unrest and sociological problems and issues. There are many ways in which we can achieve social equality and income redistribution. One of the most effective tools is financial inclusion, something which the present government has set out to implement in right earnest by launching the Jan-Dhan Yojana. This scheme intends to give a bank account to all those who have not been covered by this facility because they were poor. Jan-Dhan comes with an insurance cover, too. This makes banking or financial services available to a much larger set of people who would be able to bring about qualitative changes in their lives. The World Bank has developed a Global Findex which is a global financial inclusion index and the Gallup Survey conducted for South Asia (2011) indicated that the lowest 21 per cent do not have any formal financial services access or coverage, about 30 per cent may be sporadically using services and the top 51 per cent may be almost all right. For a large country like India, the bottom of the pyramid will definitely be a larger percentage of the population. One of the most significant findings of this Survey was that there exists a strong correlation between inequality in the use of formal bank accounts and general income inequality.Why haven’t they been provided with banking facilities so far and why did the government have to step in? There were issues of availability. There is a strong correlation between inequality in the use of formal bank accounts and general income inequality, accessibility and sustainability. Banking coverage of rural areas has been poor except for the services of some public sector banks. And people have been averse to go to a bank for different reasons — they had too little money to find it necessary to go to a bank, they might have felt maintaining a bank account was an expensive affair while some others might have felt that the bank was there today and might not be there tomorrow. With nothing much to pledge, there would have been no support coming from a bank by way of financing or credit, which also holds out as a disincentive for the rural folk. Jan-Dhan ensures availability and accessibility, and we need to work a little more on accessibility as well as sustainability. This will free poor people from the clutches of unscrupulous moneylenders, an admirable thing in the path to higher social development. In the current issue, we bring to you the text of an important lecture delivered by the RBI Governor, Dr. Raghuram Rajan, on the same theme. He has clearly outlined some of the things that we need to do to attain a meaningful financial inclusion. I am sure you will enjoy going through the lecture. Apart from this, we have also included a couple of articles on financial planning and planning for contingencies. This is an area that we as individuals and corporates tend to ignore as we take so many things for granted. As part of our efforts to create awareness about the need for financial planning and the imperativeness of scientific organisation of the investment plans, every year we organise financial planning clinics at corporates and institutions where individual employees get an opportunity to speak to financial planners and investment advisors. You could call us directly or mail us about any such requirement that you may have as an individual investor or for your colleagues at your place of work . The earlier we start planning, the better it is.
Happy Investing.
Joseph Thomas
The Gallup Survey of South Asia (2011) observed a strong correlation between the inequality in the use of formal bank accounts and general income inequality. The launch of Jan-Dhan Yojana is aimed at tackling this disparity

05 Finance and Opportunity in India A key mechanism to improve public services, especially those targeted at the poor, is through Financial Inclusion, which is going to be an important part of the government and the RBI’s plans in the coming years
Cover Page
CONTENTS
10 Balanced Funds: An investment opportunity Balanced funds are recommended to investors who are new entrants in the investment field and to those who are happy with moderate returns, but would want downside protection as well for the next 3-5 years
12 Financial Planning: A Bird’s-eye ViewFinancial Planning is the process by which one’s goals and objectives are met through the proper management and planning of one’s finances, in a systematic and scientific manner. Each financial decision made is part of the overall aim of fulfilling one’s short-term and long-term goals
38 Treatment of Losses while Filing Tax ReturnReduce your net tax liability with the help of the Income Tax Act that allows the taxpayer, under certain conditions, to set off loss against income. And the balance, if any, can even be carried forward for set off in the future years thus optimizing your tax return
Printed, published and edited by Mr. K. Joseph Thomas on behalf of Aditya Birla Money Mart Limited, One India Bulls Centre, Tower 1, 14th Floor, Jupiter Mill Compound, 841, Senapati Bapat Marg, Elphinstone Road, Mumbai 400 013. Tel no: 91-22-4356 8300 Fax no: 91-22-4356 8310, www.adityabirlamoney.com, Corporate Identity Number (CIN): U61190GJ1997PLC062406.Tel no: 91-22-4356 8300 Fax no: 91-22-4356 8310 and printed at Spenta Multimedia, Peninsula Spenta, Mathuradas Mill Compound, N. M. Joshi Marg, Lower Parel (W), Mumbai - 400 013. Tel. : 2481 1010.www.spentamultimedia.comDesigned and printed at Spenta Multimedia | Photo: www.dreamstime.com & www.shutterstock.comFor advertisement contact: Mridul Shukla, Email: [email protected] Aditya Birla MoneyAditya Birla Money is a single brand offering the combined products and services of Aditya Birla Money Limited and Aditya Birla Money Mart Limited.Aditya Birla Money Limited is a broking and distribution player, offering equity and derivative trading through NSE and BSE and currency derivative on MCX-SX. It is registered as Depository Participant with both NSDL and CDSL and also provides commodity trading on MCX and NCDEX through its subsidiary company.Aditya Birla Money Mart Limited is a wealth management and distribution player, offering third party products like company deposits, mutual funds, insurance, structured products, alternate investments, property services and has a premier wealth management service arm to cater to HNI customers.These offerings are delivered through a strong pan India distribution network of about 800 own and franchisee branches, a robust online and offline model with a strong technology backbone to a large customer base, in excess of 4 Lakhs.DISCLAIMER CLAUSEThe information published is as per the data provided by various Mutual Funds. While utmost care has been taken to maintain accuracy in the data, the company does not hold any responsibility for errors in the same. The views/opinions expressed in the various articles are that of the author and the company may not subscribe to the same either in part or in full. Any person investing on the basis of the data published in Investime will be doing so at their own risk and are advised to consult your certified financial planner before taking any investment decision.
40 Is your emergency fund ready? Our goals and other financial dreams are important — but when an adversity hits us, we tend to put out our savings into action to handle the emergency at the cost of our goals
42 Mutual Fund Advisory Higher returns come with higher risk in the normal course. So, a part of the portfolio as a strategy for higher returns and also as a measure of making the portfolio more tax efficient, equity or hybrid funds may be considered
05
12
Financial Inclusion: Empowering Indians in their journey to prosperity
10
38
40

Feature
A key mechanism to improve public services, especially those targeted at the poor, is through Financial Inclusion, which is going to be an important part of the government and the RBI’s plans in the coming years
The late Mr. Lalit Doshi was an IAS officer who passed away at the young age of 52 in
1994. He had a distinguished official career even though it was cruelly cut short. Lalit Doshi was one of those bureaucrats who have constituted the steel frame of this country. It was said of him: “He always had a smile on his face irrespective of the magnitude and the tension of work.” In these days where work seems perpetual and overwhelming, he sounds like someone who it would have been a pleasure working with. He was just a little older than I am now, and I can well imagine the deep shock his family experienced. His brother,
FINANCE AND OPPORTUNITY in India
Lecture by Dr. Raghuram Rajan
Bharat Doshi, has been tireless in his efforts to honour Lalit’s memory, and I thank him for inviting me to give today’s lecture.
We are approaching the 67th anniversary of our Independence. Sixty-seven years is a long time in the life of man – indeed, it is about the average Indian’s life expectancy today. Since life expectancy was shorter at the time of Independence, it is safe to say that most Indians born just after independence are now no more. It is useful to take stock at such a time. Did we achieve the dreams of our founding fathers for freedom’s first children? Or have we fallen woefully short? What more do we need to do?
A text of the lecture by the RBI Governor Dr. Raghuram Rajan at the Twentieth Lalit Doshi Memorial Lecture on August 11, 2014 at Mumbai
Clearly, our founding fathers wanted political freedom for the people of India – freedom to determine who we would be governed by, as well as freedom of thought, expression, belief, faith, and worship. They wanted justice and equality, of status and opportunity. And they wanted us to be free from poverty.
We have made substantial progress in achieving political freedom. Our democracy has matured, with people confidently choosing to vote out governments that lose touch with their needs. Our institutions protecting the freedom to vote have grown stronger, with the Election Commission and the forces of law and order ensuring free
AUGUST 2014 Investime 05

and largely fair elections throughout the country. Political parties, NGOs, the press, and individuals exert checks and balances on public policy. And the judiciary has taken important steps to protect individual freedom.
Our economy is also far richer than it was at the time of independence and poverty has come down substantially. Of course, some countries like South Korea that were in a similar situation then are far better off today but many others have done far worse. Indeed, one of the advantages of a vibrant democracy is that it gives people an eject button which prevents governance from getting too bad. Democracy has probably ensured more stable and equitable economic
growth than an authoritarian regime might have.
Yet a dispassionate view of both our democracy and our economy would suggest some concerns. Even as our democracy and our economy have become more vibrant, an important issue in the recent election was whether we had substituted the crony socialism of the past with crony capitalism, where the rich and the influential are alleged to have received land, natural resources and spectrum in return for payoffs to venal politicians. By killing transparency and competition, crony capitalism is harmful to free enterprise, opportunity, and economic growth. And by substituting special interests for the public interest, it is harmful to democratic expression. If there is some truth to these perceptions of crony capitalism, a natural question is why
people tolerate it. Why do they vote for the venal politician who perpetuates it?
A hypothesis on the persistence of crony capitalismOne widely held hypothesis is that our country suffers from want of a “few good men” in politics. This view is unfair to the many upstanding people in politics. But even assuming it is true, every so often we see the emergence of a group, usually upper middle class professionals, who want to clean up politics. But when these “good” people stand for election, they tend to lose their deposits. Does the electorate really not want squeaky clean government?
Apart from the conceit that high
morals lie only with the upper middle class, the error in this hypothesis may be in believing that problems stem from individual ethics rather than the system we have. In a speech I made before the Bombay Chamber of Commerce in 2008, I argued that the tolerance for the venal politician is because he is the crutch that helps the poor and underprivileged navigate a system that gives them so little access1. This may be why he survives.
Let me explain. Our provision of public goods is unfortunately biased against access by the poor. In a number of states, ration shops do not supply what is due, even if one has a ration card – and too many amongst the poor do not have a ration card or a BPL card; Teachers do not show up at schools to teach; The police do not register crimes, or encroachments, especially if committed by the rich and powerful;
“ “
Public hospitals are not adequately staffed and ostensibly free medicines are not available at the dispensary; …I can go on, but you know the all-too-familiar picture.
This is where the crooked but savvy politician fits in. While the poor do not have the money to “purchase” public services that are their right, they have a vote that the politician wants. The politician does a little bit to make life a little more tolerable for his poor constituents – a government job here, an FIR registered there, a land right honoured somewhere else. For this, he gets the gratitude of his voters, and more important, their vote.
Of course, there are many politicians who are honest and
genuinely want to improve the lot of their voters. But perhaps the system tolerates corruption because the street-smart politician is better at making the wheels of the bureaucracy creak, however slowly, in favour of his constituents. And such a system is self-sustaining. An idealist who is unwilling to “work” the system can promise to reform it, but the voters know there is little one person can do. Moreover, who will provide the patronage while the idealist is fighting the system? So why not stay with the fixer you know even if it means the reformist loses his deposit?
So the circle is complete. The poor and the under-privileged need the politician to help them get jobs and public services. The crooked politician needs the businessman to provide the funds that allow him to supply patronage to the poor and fight
BY KILLING TRANSPARENCY AND COMPETITION, CRONY CAPITALISM IS HARMFUL TO FREE ENTERPRISE, OPPORTUNITY, AND
ECONOMIC GROWTH. AND BY SUBSTITUTING SPECIAL INTERESTS FOR THE PUBLIC INTEREST, IT IS HARMFUL TO DEMOCRATIC EXPRESSION
06 Investime AUGUST 2014

elections. The corrupt businessman needs the crooked politician to get public resources and contracts cheaply. And the politician needs the votes of the poor and the underprivileged. Every constituency is tied to the other in a cycle of dependence, which ensures that the status quo prevails.
Well-meaning political leaders and governments have tried, and are trying, to break this vicious cycle. How do we get more politicians to move from “fixing” the system to reforming the system? The obvious answer is to either improve the quality of public services or reduce the public’s dependence on them. Both approaches are necessary.
But then how does one improve the quality of public services? The
typical answer has been to increase the resources devoted to the service, and to change how it is managed. A number of worthwhile efforts are underway to improve the quality of public education and healthcare. But if resources leak or public servants are not motivated, which is likely in the worst governed states, these interventions are not very effective.
Some have argued that making a public service a right can change delivery. It is hard to imagine that simply legislating rights and creating a public expectation of delivery will, in fact, ensure delivery. After all, is there not an expectation that a ration card holder will get decent grain from the fair price shop, yet all too frequently grain is not available or is of poor quality.
Information decentralization can help. Knowing how many medicines the
local public dispensary received, or how much money the local school is getting for midday meals, can help the public monitor delivery and alert higher-ups when the benefits are not delivered. But the public delivery system is usually most apathetic where the public is poorly educated, of low social status, and disorganized, so monitoring by the poor is also unlikely to be effective.
Some argue that this is why the middle class should enjoy public benefits along with the poor, so that the former can protest against poor delivery, which will ensure high quality for all. But making benefits universal is costly, and may still lead to indifferent delivery for the poor. The middle class may live in different areas from the poor. Indeed, even when located in the same area, the poor may not even patronize facilities frequented by the middle class because
they feel out of place. And even when all patronize the same facility, providers may be able to discriminate between the voluble middle class and the uncomplaining poor.
So if more resources or better management are inadequate answers, what might work? The answer may partly lie in reducing the public’s dependence on government-provided jobs or public services. A good private sector job, for example, may give a household the money to get private healthcare, education, and supplies, and reduce their need for public services. Income could increase an individual’s status and increase the respect they are accorded by the teacher, the policeman or the bureaucrat.
But how does a poor man get a good job if he has not benefited from good healthcare and education in the first place? In this modern world where good skills are critical to a good job, the unskilled have little recourse but to take a poorly-paying job or to look for the patronage that will get them a good job. So do we not arrive at a contradiction: the good delivery of public services is essential to escape the dependence on bad public services?
Money liberates and empowers...We need to go back to the drawing board. There is a way out of this contradiction, developing the idea that money liberates. Could we not give poor households cash instead of promising them public services? A poor household with cash can patronize whomsoever it wants, and not just the monopolistic government provider. Because the poor
“ “HOW DO WE GET MORE POLITICIANS TO MOVE FROM “FIXING” THE SYSTEM TO REFORMING THE SYSTEM? THE OBVIOUS ANSWER IS TO EITHER
IMPROVE THE QUALITY OF PUBLIC SERVICES OR REDUCE THE PUBLIC’S DEPENDENCE ON THEM. BOTH APPROACHES ARE NECESSARY
AUGUST 2014 Investime 07

can pay for their medicines or their food, they will command respect from the private provider. Not only will a corrupt fair price shop owner not be able to divert the grain he gets since he has to sell at market price, but because he has to compete with the shop across the street, he cannot afford to be surly or lazy. The government can add to the effects of empowering the poor by instilling a genuine cost to being uncompetitive – by shutting down parts of the public delivery systems that do not generate enough custom.Much of what we need to do is already possible. The government intends to announce a scheme for full financial inclusion on Independence Day. It includes identifying the poor, creating
unique biometric identifiers for them, opening linked bank accounts, and making government transfers into those accounts. When fully rolled out, I believe it will give the poor the choice and respect as well as the services they had to beg for in the past. It can break the link between poor public service, patronage, and corruption that is growing more worrisome over time.
Undoubtedly, cash transfers will not resolve every problem, nor are they uncontroversial. A constant refrain from paternalistic social workers is that the poor will simply drink away any transfers. In fact, studies by NGOs like SEWA indicate this is not true. Moreover, one could experiment with sending transfers to women, who may be better spenders. Some argue that attaching conditions to cash transfers – for example, they will be made provided the recipient’s children
attend school regularly – may improve the usage of the cash. The danger of attaching conditionality is that if the monitor is corrupt or inefficient, the whole process of direct benefits transfer can be vitiated. Nevertheless, it will be useful to monitor usage carefully where automation is possible, and automatically attach further benefits to responsible usage.
A related concern is whether cash transfers will become addictive – whether they become millstones keeping the poor in poverty rather than stepping stones out of it. This is an important concern. Cash transfers work best when they build capabilities through education and healthcare, thus expanding opportunity, rather
than when they are used solely for inessential consumption. The vast majority amongst the poor will seize opportunities, especially for their children, with both hands. Nevertheless, if there is evidence that cash transfers are being misspent – and we should let data rather than pre-conceived notions drive policy – some portion could be given in the form of electronic coupons that can be spent by the specified recipient only on food, education or healthcare2.
Another set of concerns has to do with whether private providers will bother to provide services in remote areas. Clearly, if people in remote areas have the cash to buy, private providers will find their way there. Indeed, a particularly desirable outcome will be if some of the poor find work providing services that hitherto used to be provided by public servants. Moreover,
implementing cash transfers does not mean dismantling the system of public delivery wherever it is effective – it only means that the poor will pay when they use the public service.
The broader takeaway is that financial inclusion and direct benefits transfer can be a way of liberating the poor from dependency on indifferently delivered public services, and thus indirectly from the venal but effective politician. It is not a cure-all but will help the poor out of poverty and towards true political independence. But financial inclusion can do more; by liberating the poor and the marginalized from the clutches of the moneylender, by providing credit and advice to the entrepreneurial amongst
the poor, and by giving households the ability to save and insure against accidents, it can set them on the road to economic independence, thus strengthening the political freedom that good public services will bring. This is why financial inclusion is so important.
Five Ps of Financial InclusionLet me end with a vision of how the RBI can speed up and enhance financial inclusion of the kind I have just outlined. Financial inclusion in my view is about getting five things right: Product, Place, Price, Protection, and Profit.
If we are to draw in the poor, we need products that address their needs; a safe place to save, a reliable way to send and receive money, a quick way to borrow in times of need or to escape the clutches of the moneylender, easy-to-understand
“ “THE GOVERNMENT SCHEME FOR FULL FINANCIAL INCLUSION
CAN BREAK THE LINK BETWEEN POOR PUBLIC SERVICE, PATRONAGE, AND CORRUPTION THAT IS GROWING WORRISOME OVER TIME
08 Investime AUGUST 2014

accident, life and health insurance, and an avenue to engage in saving for old age. Simplicity and reliability are key – what one thinks one is paying for is what one should get, without hidden clauses or opt-outs to trip one up. The RBI is going to nudge banks to offer a basic suite of Products to address financial needs.
Two other attributes of products are very important. They should be easy to access at low transactions cost. In the past, this meant that the Place of delivery, that is the bank branch, had to be close to the customer. So a key element of the inclusion programme was to expand bank branching in unbanked areas. Today, with various other means of reaching the customer
such as the mobile phone or the business correspondent, we can be more agnostic about the means by which the customer is reached. In other words, ‘Place’ today need not mean physical proximity, it can mean electronic proximity, or proximity via correspondents. Towards this end, we have liberalized the regulations on bank business correspondents, encouraged banks and mobile companies to form alliances, and started the process of licensing payment banks.
The transactions costs of obtaining the product, including the Price and the intermediary charges, should be low. Since every unbanked individual likely
consumes low volumes of financial services to begin with, the provider should automate transactions as far as possible to reduce costs, and use employees that are local and are commensurately paid. Furthermore, any regulatory burden should be minimal. With these objectives in mind, the RBI has started the process of licensing small local banks, and is re-examining KYC norms with a view to simplifying them. Last month, we removed a major hurdle in the way of migrant workers and people living in makeshift structures obtaining a bank account, that of providing proof of current address.
New and inexperienced customers will require Protection. The RBI is
beefing up the Consumer Protection Code, emphasizing the need for suitable products that are simple and easy to understand. We are also working with the government on expanding financial literacy. Teaching the poor the intricacies of finance has to move beyond literacy camps and into schools. Banks that lend to the entrepreneurial poor should find ways to advise them on business management too, or find ways to engage NGOs and organizations like NABARD in the process. We are also strengthening the customer grievance redressal mechanism, while looking to expand supervision, market intelligence, and coordination with law
and order to reduce the proliferation of fly-by-night operators.
Finally, while mandated targets are useful in indicating ambition (and allowing banks to anticipate a large enough scale so as to make investments), financial inclusion cannot be achieved without it being Profitable. So the last ‘P’ is that there should be profits at the bottom of the pyramid. For instance, the government should be willing to pay reasonable commissions punctually for benefits transfers, and bankers should be able to charge reasonable and transparent fees or interest rates for offering services to the poor.
Let me conclude. One of the greatest dangers to the growth of
developing countries is the middle income trap, where crony capitalism creates oligarchies that slow down growth. If the debate during the elections is any pointer, this is a very real concern of the public in India today. To avoid this trap, and to strengthen the independent democracy our leaders won for us sixty-seven years ago, we have to improve public services, especially those targeted at the poor. A key mechanism to improve these services is through Financial Inclusion, which is going to be an important part of the government and the RBI’s plans in the coming years. I hope many of you in this audience will join in ensuring we are successful. Thank you.
(Reproduced with due permission from the Public Relations Department of the Reserve Bank of India)
1. This idea was inspired from those in Richard Hofstadter’s seminal book ‘The Age of Reform’ on the difficulties of reform in the United States around the early twentieth century.
2. Eventually, we will have to find a way to wean those who start earning significant amounts from receiving such transfers. How to do this without providing disincentives to working and earning is a future problem born of success which is best left for another day. The United States has dealt with the disincentive effects of getting off welfare with programmes like the earned income tax credit.
“ “IF THERE IS EVIDENCE THAT CASH TRANSFERS ARE BEING MISSPENT, SOME PORTION COULD BE GIVEN IN THE FORM OF
ELECTRONIC COUPONS THAT CAN BE SPENT BY THE SPECIFIED RECIPIENT ONLY ON FOOD, EDUCATION OR HEALTHCARE
AUGUST 2014 Investime 09

Feature
Balanced funds are recommended to investors who are new entrants in the investment field and to those who are happy with moderate returns, but would want downside protection as well for the next 3-5 years
It is not possible to have the best of both worlds”, is a line often used, to drive home the old thinking that
it may not be possible to have it good all the time. As you try to balance one thing, something else goes off-balance. This holds true for investment decisions too. It puts us in a very tight trade-off between extra returns and extra risk.
In today’s scenario, choosing the best option to park your funds is an important decision and the basic fears surrounding such a crucial decision
are the associated risks and rewards. Though the entire nation has gradually moved from conservative traditional investments such as fixed deposits and savings accounts to bolder instruments such as equities and mutual funds, lack of knowledge, expertise and a fear of losing money has kept investors away from such options.
Mutual & Balanced Funds: an overall view Mutual funds cater to varied objectives of investors, be it capital appreciation, capital preservation or regular income. A prudent investor can select mutual funds as per his needs and suitability. He can invest in liquid funds and ultra short-term funds for absolute safety. Those seeking higher returns can
invest in equity mutual funds, which predominately invest in large, mid and small cap stocks. But, something that captures the best of both worlds is balanced funds.
A balanced fund invests in both debt and equities and is best suited for a new class of investors who are ready to invest in equities, but are sceptical or worried about excessive volatility in the market. A balanced fund combines the advantages of both the asset classes while simultaneously mitigating excessive variations, by keeping each other under check. It is a fund that provides meaningful diversification, by investing in both stocks (for growth) and debts (for stability).They also provide tax benefit to the investors in the same way as a pure equity mutual fund, provided the fund invests a minimum of 65% in equities. Despite a debt component, they are treated at par with pure equity funds for tax purposes. The current pattern of allocation is given in Table 1.
Balanced funds optimise returns by providing flexibility to the fund manager to increase or decrease the proportion of equity and debt allocation in the fund’s investments according to economic and market conditions. It has been seen that balanced funds provide returns more or less similar to equity funds
10 Investime AUGUST 2014
BALANCED FUNDS An investment opportunity
Akanksha Mehta, ABMML Research

ParticularsScheme Name Benchmark
Birla SL’ 95 Fund(G) FT India Balanced Fund(G)
HDFC Balanced Fund(G)
ICICI Pru Balanced Fund-Reg(G) Tata Balanced Fund(G) Crisil Balanced
Fund Index
Fund Manager Mahesh Patil & Prasad Dhondo
Anil Prabhudas & Anand Radhakrichnan
Chirag Setalvad & Rakesh Vyas
Yoges Bhatt & Manish Banthia
Atul Bhole & S. Raghupathi Archarya -
Quarterly AAUM (R Crs) June -2014 736 235 1,503 777 649 -
CAGR(%)June 30, 2013 to June 30, 2014 37.46 30.39 49.27 40.96 39.77 20.99June 30, 2012 to June 30, 2013 10.99 11.38 4.25 13.62 11.23 10.91June 30, 2011 to June 30, 2012 -3.14 -0.76 1.10 2.21 2.36 -0.98Since Inception till June 30, 2014 21.90 14.44 17.32 15.02 16.79 -Value of Investment of INR 10,000 if invested fromJune 30, 2013 to June 30, 2014 13,746 13,039 14,927 14,096 13,977 12,099June 30, 2012 to June 30, 2013 11,099 11,138 10,425 11,362 11,123 11,091June 30, 2011 to June 30, 2012 9,686 9,925 10,110 10,221 10,236 9,902Since Inception till June 30, 2014 4,66,017 71,314 90,771 77,860 1,83,171 -Inception Date 10-Feb-95 10-Dec-99 11-Sep-00 3-Nov-99 8-Oct-95 -
Exit Load 1% on or before 1Y, Nil on or after 1Y 1% on or before 1Y 1% on or before
18M, Nil after 18M1% on or before
12M, Nil after 12M1% on or before 540D,
Nil after 540D -
Exposure (%)Debt 19.73 10.68 26.24 20.21 23.69Equity 72.77 72.22 69.21 69.38 74.97Cash & Equivalent 7.50 17.09 4.55 10.41 1.35Source: Ace MF
but with lower volatility (standard deviation). These funds effectively combine the benefits of growth and safety and provide both, income and capital appreciation while ensuring optimal risk. In 2008, when markets fell by 51 per cent and equity mutual funds fell in line with the market,
balanced funds, due to their asset allocation strategy, managed to outperform the market. The Table 2 is a graphical representation of past performance of balanced funds, diversified equity vis-a-vis to benchmarks viz. CNX Nifty, Crisil balanced fund and S&P BSE Sensex.
The balanced mutual funds which have done well are those which are actively managed. One must understand the strategy of the fund manager managing such a fund. It is also important to know where the fund invests—whether it is related to stocks or debt instruments. A good balanced fund survives the changes in the economic conditions by managing its asset allocation
AUGUST 2014 Investime 11
“ “to optimise returns while providing a cushion on the downside. Asset allocation strategy and the fund manager’s approach are important aspects that need to be considered while investing. Performance should not be the only criterion for investing in such funds; risk parameters associated with investments also need to be analyzed.
Balanced mutual funds may not offer high returns like equity funds, but they also do not carry the associated high risk of capital erosion as in the case of pure stock funds. Balanced funds are recommended to investors who are new entrants in the investment field and to those who are happy with moderate returns, but would want downside protection as well for the next 3-5 years.
0.00
-10.00
-20.00
-30.00
-40.00
-50.00
-60.00
-40.59
CategoryAverage -Balanced
Funds
CategoryAverage -
DiversifiedEquity
CNX NiftyIndex
CrisilBalanced
Fund Index
S&P BSESENSEX
-48.92-51.70
-34.34
-52.35
Source: AceMF
Table 1
Table 2
PERFORMANCE SHOULD NOT BE THE ONLY CRITERION FOR INVESTING IN SUCH FUNDS; RISK PARAMETERS ASSOCIATED
WITH INVESTMENTS ALSO NEED TO BE ANALYZED

Feature
Financial Planning is the process by which one’s goals and objectives are met through the proper management and planning of one’s finances, in a systematic and scientific manner. Each financial decision made is part of the overall aim of fulfilling one’s short-term and long-term goals
12 Investime AUGUST 2014
Rajneet Singh
FINANCIAL PLANNING: A Bird’s-eye View
In the current economic and market conditions, which are becoming increasingly complex, managing
finances for the future too has become extremely difficult. With the rising cost of living due to inflation, planning one’s finances must be given very high importance. Retirement planning has become all the more essential to ensure that one is able to maintain one’s current standard of living after regular income inflow stops, while insurance planning helps safeguard against any unforeseen event. A complete financial plan is able to answer all the difficult questions and assist in managing the finances better.
Financial Planning is the process by which one’s goals and objectives are met through the proper management and planning of one’s finances, in a systematic and scientific manner. Each financial decision made is part of the overall aim of fulfilling one’s short-term and long-term goals. It also provides individuals with a very important comfort — life when planned is easier and relaxed, and you can approach events with greater confidence.
A Comprehensive ViewFinancial planning is actually a comprehensive view of one’s financial needs and goals. It is possible to have a
single-purpose view or a multi-purpose view. In a single-purpose view, we identify a single issue or problem and provide a product or solution. A very good example is looking at what a stockbroker does. In a multi-purpose view, multiple needs and multiple products are provided. A very good example is an insurance agent who sells life, health and general insurance. But in a comprehensive view, a product that is an answer to all financial needs and problems is provided. A scientific analysis is conducted and a complete view is provided.
Some strong reasons that make financial planning necessary for all, is summarised as follows:
Risk-taking ability, or the risk appetite of each individual, is different, and therefore, it is imperative that risk profiling of investors is done before any recommendations are given on products and allocations. The starting point of financial planning is risk profiling. Large number of investment products are available in the market. Each one of these products comes with a different level of risks attached to it. For example, an investment in direct equity will have far more risk compared to investing in a bank fixed deposit. So a financial plan helps to understand the risk profile of the investor first, before making any investment decisions for the individual.

Financial Planning - StagesThe different stages which a proper financial planning exercise should follow has been very clearly enumerated by the FPSB. These stages are as follows:
Step 1 Establishing client-planner relationship
Step 2 Gathering client data and determining goals and expectations
Step 3 Analysing and evaluating the client’s financial status
Step 4 Developing and presenting the financial plan
Step 5 Implementing the financial plan
Step 6 Monitoring the financial plan
The Wealth Cycle Generally, the life of a person can be divided into three phases: the accumulation phase, the preservation phase and the distribution phase. In the accumulation phase, one accumulates wealth and multiplies it. This is that phase of one’s life when one works and earns or runs a business and makes dividends from it. As you get your income, you invest the surplus and create wealth systematically. During this period the investments and the portfolio constructed will have a relatively higher aggressive positioning. The period from the age of 25 years to 55 years, is considered to be the accumulation phase. The second phase is called the preservation phase. This is
Financial planning helps in diversifying investment portfolios over different asset classes, thereby balancing the risk and return trade-off. Investments must be spread over different asset classes, in order to mitigate the concentration risk. However, the allocation of investment to each asset class will also depend on factors like age, dependants, time horizon, etc. For example, it is not advisable for an investor to put all his investments into real estate. This will lead to lack of liquidity during an emergency situation, in addition to the concentration risk on the portfolio.
Merely investing is not enough to ensure the fulfilment of a financial goal. For any financial goal, like buying a house, or investing for your child’s
education, we need to do the following:
and prioritise them
the fulfilment of the goals
achieve the goal, and
The asset allocation required to fulfil the goal, without taking undue risk. A planned investment not only
helps in making an informed decision, but also in prioritising the investment for other goals. For example, if an individual wants to buy a house worth R1 crore in the next three years, and if his cash flows are not supporting the required goal amount, then he may postpone the purchase of the home for 3-5 years, in order to build the desired corpus.
AUGUST 2014 Investime 13
“ “
Changes in the financial situation of an individual or market scenario can be incorporated in the plan, and may be implemented on an immediate basis. For example, if a person receives additional income by way of a bonus, then that amount may be earmarked for fulfilling the goal amount, earlier than planned. Financial plans provide a holistic view which assists in understanding the impact of each goal on cash flows, in the present and the future. It also brings to our attention any shortfall in cash flow, and makes it possible to make an informed decision to bridge the gap.
The outcome of this process is to have a financial plan that will manage your investments, income and expenditure efficiently and effectively,
so that you can maintain a desired lifestyle. Building a sound financial base is essential to achieve one’s goals in life, and this requires financial planning.
Life Cycle StagesAlpha Stage Young, single,
childless, independent of parents
Bravo Stage Married but still childless
Charlie Stage
Dependent children who are in school
Delta Stage Dependent children, past their schooling
Echo Stage Pre-retirement stage, empty nest stage
Foxtrot Stage
Retirement stage
THE BENEFIT OF HAVING A FINANCIAL PLAN IS THAT IT WILL MANAGE YOUR INVESTMENTS, INCOME AND EXPENDITURE EFFICIENTLY AND
EFFECTIVELY, SO THAT YOU CAN MAINTAIN A DESIRED LIFESTYLE
the time when the wealth accumulated should provide reasonable growth and accumulation with preservation as the main objective or overriding principle. The portfolio positioning in this phase would be more balanced in nature and would be conservative to moderately aggressive. In the third and final stage, the wealth is distributed to the progeny and this distribution itself is something that needs to be taken care of well as it has not only financial implications but also legal and taxation implications. While financial planning is devised, it takes into consideration the three phases and the peculiarities and the challenges which these three phases present. This is also relevant while preparing investment plans as the risk profile and suitability of the products should match or should be congruent with the individual
investor’s risk profile. This is exactly why, in standard financial planning and investment planning, as you move towards the actual deployment of funds, alternative assets are to be avoided as you enter the preservation phase; such products are also not offered to those who are above a certain age.
Some Popular StrategiesLong Term Investments, especially investments that carry a higher risk, quite often yield better results when they are held for longer time horizons. So it is a good strategy to acquire assets as a long term investment strategy. Another name
for this strategy is buy and hold. In this strategy you may buy assets but with the purpose of holding it till maturity or till it reaches a critical level of growth during its uptrend. In both these approaches, one gets rid of the pains that day to day movements in the markets would inflict on the portfolio from time to time. This would also leave the investor with enormous amount of peace of mind and a sense of confidence and stability.
It is of utmost importance that an investor should have realistic expectations from the investments that he makes. This rules out any kind of abnormal or supra normal returns from investments. Such returns, if seen at some point, may not be sustainable at all. This would anchor the expectations on more realistic grounds. These expectations would
undergo changes with passage of time. In favourable cycles, equity and debt would produce better than expected returns and in unfavourable conditions especially when there is sluggishness in economic activity the returns would also vary. Asset allocation is very important in this context. You may go in for a fixed or flexible allocation. Even within this allocation there could be strategic and tactical allocation. It is for the planner to take the investor through all the options available and finally hammer out the most appropriate positioning for the portfolio to produce the dividends which are required to achieve the goals. Two very common principles followed are to start investing early
and to invest regularly. If you start early enough, you have more time on your side and the distance you need to cover, to achieve some of the objectives, could be shorter. This also brings in the advantages of compounding as far as investments are concerned. Another way to go about investing which is followed quite commonly is the practice of value averaging. To safeguard the value of the portfolio and to ensure that we generate net positive returns against the play of the excessively high price level, one may also need to look at inflation-indexed products.
Reviewing the Financial PlanOnce the blueprint is ready and allocation is made and investments are done, one enters the more serious part of the financial planning activity.
The plan needs to be monitored and reviewed from time to time. At least on an annual basis the plan should be reviewed. The review will help us highlight the course corrections required and also portfolio realignments, if any, required. If a plan is put in place and if it is never reviewed, it is as good as no plan having been done. In a dynamic and complex economic environment and financial market, the review becomes imperative to ensure that the portfolio works for the investor and helps him in reaching goals as early as possible.
(The author is a member of the ABMML Advisory Team)
14 Investime AUGUST 2014
TO SAFEGUARD THE VALUE OF THE PORTFOLIO AND TO ENSURE THAT WE GENERATE NET POSITIVE RETURNS AGAINST THE PLAY OF
THE EXCESSIVELY HIGH PRICE LEVEL, ONE MAY ALSO NEED TO LOOK AT INFLATION-INDEXED PRODUCTS
““

Pension Nourish Growth EnrichInception Date 12-Mar-03 18-Mar-03 12-Mar-03
Fund Return BM Fund Return BM Fund Return BMLast 1 Year 11.52% 11.01% 15.35% 13.30% 18.61% 16.44%Last 2 Year 8.67% 8.39% 10.84% 9.64% 12.01% 11.20%Last 3 Year 8.18% 8.03% 9.16% 8.41% 9.23% 8.65%Last 4 Year 7.23% 7.20% 7.88% 7.35% 7.69% 7.26%Last 5 Year 7.10% 6.87% 8.12% 7.22% 8.52% 7.40%Since Inception 8.10% 6.10% 10.28% 7.16% 11.86% 8.56%Asset Held (R in Crores) 13 38 169
Fund Performance
Birla Sun LifeINSURANCE
Fund Performance as on 31st July 2014
Indivivual Titanium I Titanium II Titanium IIIInception Date 16-Dec-09 16-Mar-10 16-Jun-10
Fund Return BM Fund Return BM Fund Return BMLast 1 Year 29.75% - 29.37% - 24.20% -Last 2 Year 17.86% - 17.61% - 14.98% -Last 3 Year 10.20% - 10.35% - 9.61% -Last 4 Year 9.04% - 9.06% - 6.62% -Since Inception 9.05% - 9.01% - 6.58% -Asset Held (R in Crores) 49 14 9
Indivivual Platinum Plus I Platinum Plus II Platinum Plus III Platinum Plus IVInception Date 17-Mar-08 8-Sep-08 15-May-09 15-Sep-09
Fund Return BM Fund Return BM Fund Return BM Fund Return BMLast 1 Year 27.19% - 29.19% - 29.42% - 30.51% -Last 2 Year 16.27% - 17.17% - 18.04% - 18.12% -Last 3 Year 8.67% - 8.90% - 9.47% - 9.30% -Last 4 Year 7.31% - 7.91% - 8.16% - 8.45% -Last 5 Year 8.68% - 9.26% - 9.18% - - -Since Inception 6.62% - 13.99% - 10.39% - 8.63% -Asset Held (R in Crores) 327 592 700 529
Indivivual Balancer Enhancer Creator Magnifier Value MomentumInception Date 18-Jul-05 22-Mar-01 23-Feb-04 12-Aug-04 9-Mar-12
Fund Return BM Fund Return BM Fund Return BM Fund Return BM Fund Return BMLast 1 Year 17.02% 14.13% 16.56% 15.28% 23.19% 19.96% 34.88% 29.49% 60.65% 31.90%Last 2 Year 11.68% 9.96% 11.31% 10.58% 14.47% 13.05% 20.31% 17.97% 22.05% 19.07%Last 3 Year 9.78% 8.30% 9.06% 8.48% 10.04% 9.13% 11.15% 10.13% - -Last 4 Year 8.41% 7.14% 7.48% 7.20% 8.06% 7.39% 8.18% 7.53% - -Last 5 Year 8.50% 7.09% 7.98% 7.25% 9.38% 7.81% 10.50% 8.59% - -Since Inception 10.15% 7.04% 11.74% 8.26% 12.85% 10.21% 14.22% 6.97% 18.03% 16.18%Asset Held (R in Crores) 32 6809 389 1076 22Indivivual Maximiser Multiplier Super 20 Liquid Plus Pure EquityInception Date 12-Jun-07 30-Oct-07 6-Jul-09 9-Mar-12 9-Mar-12
Fund Return BM Fund Return BM Fund Return BM Fund Return BM Fund Return BMLast 1 Year 40.57% 31.90% 63.39% 50.07% 35.81% 29.45% 8.80% 8.96% 42.57% 8.96%Last 2 Year 20.89% 19.08% 25.27% 19.83% 21.97% 19.46% 8.45% 7.99% 26.52% 7.99%Last 3 Year 10.09% 10.28% 14.03% 8.91% 13.77% 10.58% - 0.00% - 0.00%Last 4 Year 6.84% 7.42% 9.11% 5.32% 10.92% 8.14% - 0.00% - 0.00%Last 5 Year 8.85% 8.70% 13.94% 10.71% 12.09% 8.81% - 0.00% - 0.00%Since Inception 9.51% 7.67% 8.78% 4.62% 13.89% 10.81% 8.07% 8.03% 22.82% 8.03%Asset Held (R in Crores) 2261 413 467 37 8
Indivivual Assure Income Advantage Protector BuilderInception Date 12-Sep-05 22-Aug-08 22-Mar-01 22-Mar-01
Fund Return BM Fund Return BM Fund Return BM Fund Return BMLast 1 Year 9.97% 9.45% 8.55% 8.75% 11.94% 11.01% 15.03% 13.30%Last 2 Year 9.32% 8.04% 7.73% 7.14% 8.90% 8.39% 11.06% 9.64%Last 3 Year 9.33% 8.17% 8.51% 7.63% 8.43% 8.03% 9.45% 8.41%Last 4 Year 8.75% 7.61% 7.98% 7.02% 7.47% 7.20% 8.07% 7.35%Last 5 Year 8.47% 6.90% 7.93% 6.51% 7.35% 6.87% 8.38% 7.22%Since Inception 9.32% 7.35% 10.55% 7.30% 8.36% 6.10% 10.31% 7.16%Asset Held (R in Crores) 169 466 413 281
Indivivual Platinum Premier Platinum Advantage Foresight 5 Pay Foresight Single PayInception Date 15-Feb-10 20-Sep-10 22-Feb-11 22-Feb-11
Fund Return BM Fund Return BM Fund Return BM Fund Return BMLast 1 Year 31.62% - 34.93% - 24.20% - 33.12% -Last 2 Year 19.07% - 20.96% - 15.60% - 20.95% -Last 3 Year 9.98% - 12.36% - 8.74% - 12.39% -Last 4 Year 8.42% - - - - - - -Since Inception 9.46% - 7.49% - 7.72% - 10.78% -Asset Held (R in Crores) 902 1042 1631 90
AUGUST 2014 Investime 15

PRIME NUMBERSInvestimeSnap shots
Source: Reuters
EQUITY PERFORMANCE
Index Name 31 July 14 30 June 14 Absolute (%)INDIAN INDICES
EQUITYCNX Midcap 10,838.20 11,096.90 -2.33
CNX Nifty Index 7,721.30 7,611.35 1.44
CNX Nifty Junior 16,285.70 16,486.20 -1.22
S&P BSE Mid-Cap 9,188.19 9,378.95 -2.03
S&P BSE Sensex 25,894.97 25,413.78 1.89
S&P BSE Small-Cap 9,989.42 10,203.19 -2.10
S&P BSE 100 7,799.72 7,742.66 0.74
S&P BSE 200 3,144.77 3,124.40 0.65
S&P BSE 500 9,831.51 9,791.34 0.41SECTORAL INDICES
S&P BSE AUTO Index 15,490.71 15,249.29 1.58
S&P BSE Bankex 17,485.61 17,475.08 0.06
S&P BSE Capital Goods 14,651.63 16,200.21 -9.56
S&P BSE Consumer Durables 8,556.87 8,870.04 -3.53
S&P BSE FMCG 7,169.75 6,676.19 7.39
S&P BSE Health Care 12,341.28 11,462.23 7.67
S&P BSE IT 9,742.34 9,346.10 4.24
S&P BSE METAL Index 13,064.27 13,099.95 -0.27
S&P BSE OIL & GAS Index 10,749.83 11,150.89 -3.60
S&P BSE Power Index 2,133.55 2,318.72 -7.99
S&P BSE PSU 8,012.05 8,633.61 -7.20
S&P BSE Realty Index 1,893.03 2,077.13 -8.86
S&P BSE TECk Index 5,488.13 5,266.36 4.21
WORLD INDICESCAC 40 4,246.14 4,422.84 -4.00DAX 9,407.48 9,833.07 -4.33Dow Jones 16,563.30 16,826.60 -1.56FTSE 100 6,730.10 6,743.90 -0.20Hang Seng 24,756.85 23,190.72 6.75Nasdaq 4,369.77 4,408.18 -0.87Nikkei 225 15,620.77 15,162.10 3.03Straits Times 3,374.06 3,255.67 3.64Taiwan Weighted 9,315.85 9,393.07 -0.82
INDUSTRY QUARTERLY AVERAGE AUM (R Crores)Fund House June-14 March-14 Change % Change
AUM above 30,000 Crs.HDFC Mutual Fund 130,387 113,354 17,033 15.03ICICI Prudential Mutual Fund 118,163 106,941 11,222 10.49Reliance Mutual Fund 114,428 105,293 9,135 8.68Birla Sun Life Mutual Fund 98,635 89,136 9,499 10.66UTI Mutual Fund 79,441 74,233 5,208 7.02SBI Mutual Fund 69,948 66,311 3,637 5.48Franklin Templeton Mutual Fund 51,929 46,406 5,522 11.90IDFC Mutual Fund 43,808 41,454 2,354 5.68Kotak Mahindra Mutual Fund 35,885 33,502 2,383 7.11DSP Blackrock Mutual Fund 33,998 31,966 2,032 6.36
AUM BETWEEN 10,000 TO 30,000 Crs.TATA Mutual Fund 23,022 21,954 1,068 4.87Deutsche Mutual Fund 20,878 18,795 2,083 11.08Axis Mutual Fund 20,385 16,285 4,101 25.18L&T Mutual Fund 19,894 18,255 1,639 8.98Sundaram Mutual Fund 17,673 16,422 1,251 7.62Religare Invesco Mutual Fund 16,164 14,521 1,643 11.32JP Morgan Mutual Fund 14,544 16,248 -1,704 -10.49
AUM UPTO 10,000 Crs.LIC Mutual Fund 9,489 10,584 -1,095 -10.35HSBC Mutual Fund 8,588 7,659 930 12.14Baroda Pioneer Mutual Fund 8,176 8,106 70 0.87JM Financial Mutual Fund 6,957 6,046 911 15.07IDBI Mutual Fund 6,824 6,018 807 13.40Canara Robeco Mutual Fund 6,635 6,660 -25 -0.37Goldman Sachs Mutual Fund 6,179 3,764 2,415 64.16Principal PNB Mutual Fund 4,848 4,134 714 17.27Taurus Mutual Fund 4,083 3,532 550 15.58BNP Mutual Fund 3,661 3,446 216 6.26Union KBC Mutual Fund 3,531 2,847 685 24.06Peerless Mutual Fund 3,509 4,046 -536 -13.26BOI AXA Mutual Fund 2,378 1,991 387 19.44Pramerica Mutual Fund 1,909 2,411 -502 -20.82Indiabulls Mutual Fund 1,424 1,097 326 29.76Mirae Mutual Fund 937 692 245 35.35Motilal Oswal Mutual Fund 758 489 269 55.04ING Mutual Fund 752 794 -42 -5.34IL&FS Infra Mutual Fund 717 - - -PineBridge Mutual Fund 636 649 -13 -2.00PPFAS Mutual Fund 443 340 103 30.41Quantum Mutual Fund 432 372 60 16.00IIFCL Mutual Fund 307 - - -Escorts Mutual Fund 264 269 -5 -1.92Edelweiss Mutual Fund 212 169 42 25.08India Infoline Mutual Fund 210 234 -24 -10.29Sahara Mutual Fund 165 191 -25 -13.29Shriram Mutual Fund 26 24 2 6.72Average Total 993,234 907,640 85,593 9.43
16 Investime AUGUST 2014

Precious MetalsGold prices witnessed selling pressure during last month following positive US data, rally in stock markets and dollar strength. Comex gold prices fell 3 per cent and Comex silver fell 2.8 per cent. At MCX, however, we saw gold and silver prices finding support mainly due to rupee weakness. This resulted in a flat close in the Indian markets on a monthly basis as indicated by a change of 0.15 per cent in prices, also on a monthly basis.
The US Federal Reserve meeting outcome was in line with expectations. The central bank trimmed the size of their monthly purchases of treasuries and mortgage-related assets to $25 billion per month from the previous $35 billion. Fed Chairwoman Janet Yellen has said the programme is likely to end in October. On the dovish side, the statement said labour market conditions had improved while on hawkish side, the bank said that likelihood of inflation below 2 per cent has diminished somewhat. It did not signal any intent to hike interest rates. Looking at rising interest rate scenario in US as indicated by rise in US 10-year inflation bond yields from 0.2 per cent to 0.3 per cent, stronger dollar and improving US jobs market, gold prices are likely to remain under pressure.
The US non-farm payroll report came below expectations. The US economy added 2,09,000 jobs against expectations of 2,30,000 and below 2,88,000 jobs added last month. The unemployment rate also moved up to 6.2 per cent from 6.1 per cent dampening bets that US Fed will increase interest rates sooner than expected.
Furthermore, the geopolitical risk related demand seems to have been factored into prices and we expect that until the situation deteriorates further, additional demand is unlikely. We believe that now Asian demand will remain a key driver for gold prices.
Overall fundamentals are indicating a bearish move for gold but in case we see any strong revival of physical demand, we may see a short-term upside. Monthly trend is looking sideways. Prices are expected to trade in a range of $1,280-$1,330 at Comex. At MCX, price range is expected to be R27,700-28,500. Breach of $1,280 is crucial to take prices down. At MCX, prices needs to close above R28,500 to take it up while a close below R27,700 is crucial to initiate selling.
Base Metals OutlookBase metal futures continued their previous month’s positive momentum by starting with strong gains, supported by positive economic reports from the U.S., while a continuous decline in inventory levels and concerns over near-term supply deficit in some of the metals added further support to the rally.
Copper prices although had a positive start to the month, were seen trading in a range for most part of the trading sessions, followed by a sharp rally and then again a consolidation phase. In short, prices had a mixed to positive trading sessions. Although prices have closed in positive for the month, major gains were capped by rising inventory levels at Shanghai and LME warehouses, decline in copper imports by China while positive economic reports from U.S., China and Japan were supportive to prices.
China’s June copper imports fell to the lowest since April 2013, as banks reduced lending for metal imports following
COMMODITIES
InvestimeExpert’s view
an investigation into alleged fraudulent metals financing at Qingdao port. Arrivals of copper anode, refined metal, alloy and semi-finished copper products stood at 3,50,000 tons in June, their lowest level since April 2013. However, in the first half of 2014, imports rose 25.9 per cent to 2.52mn tons.
Aluminium futures traded positively throughout the month after prices breached 114 levels and rose more than 8 per cent in Indian markets, by following cues from a rally in aluminium prices in the international market. LME aluminium prices continued to gain support from a sharp fall in inventory levels at LME and Shanghai warehouses, while rising crude prices and concerns over supply-deficit outside China added further support.
Aluminium stocks at LME warehouse are sufficient enough to fulfil the near-term demand, but since most of the stocks are tied up in financing deals, supply is restricted in the market, underpinning the metal prices.
Nickel prices rose to their highest level in 6 weeks at the beginning of the month on concerns over supply-deficit in the market, as Indonesia continues to hold their ban on export of nickel ore and after the release of positive economic reports. However, prices after that have declined steadily forming lower lows and lower highs on weekly basis. The recent decline in nickel prices was only due to rising of nickel inventories to record levels at LME, which has eased supply concerns over Indonesia’s ore export ban. Nickel inventories rose to a record high of 3,17,628 tons up to August 1, 2014.
Zinc prices too maintained their positive momentum last month, starting with strong gains and sustaining the same on a weekly basis. Also prices rose to their highest level in almost 3 years, on concerns over falling mine supply and a continuous decline in inventory levels at LME warehouses. In the CY2014 so far, zinc inventories tracked by the LME have tumbled 30 per cent to their lowest level since December 2010.
Century mine, the world’s second largest zinc mine is scheduled to run dry in 3 years. It yielded 1,05,279 tons of zinc in the first quarter, down 31 per cent from the previous quarter and 21 per cent from a year ago, as per market reports.
Lead prices had a steady start to the month, as they were seen consolidating in a range and fluctuated between gains and losses in the first-half of the month, but maintained their positive momentum by forming higher highs and higher lows on a weekly basis. However, prices rallied sharply in the second- half as they played the catch-up game with other metals, after trading steady to positive for more than a month.
The outlook for the base metals complex still looks positive and we expect prices to maintain their strength with every correction seen as a buying opportunity. On the fundamental side, apart from the supply-demand equation, prices are likely to gain support from rising/declining inventory levels at global warehouses, while economic reports from across the globe is likely to give further direction to the base metals.
Copper prices are expected to trade in the range of R420-455, aluminium prices are expected to trade in the range of R115-130, while nickel prices are expected to continue their consolidation phase and trade in the range of R1,060-1,175. Zinc prices are expected to continue their positive momentum and trade in the range of R135-155, while lead prices are expected to trade in the range of R130-150, with a positive bias.
AUGUST 2014 Investime 17
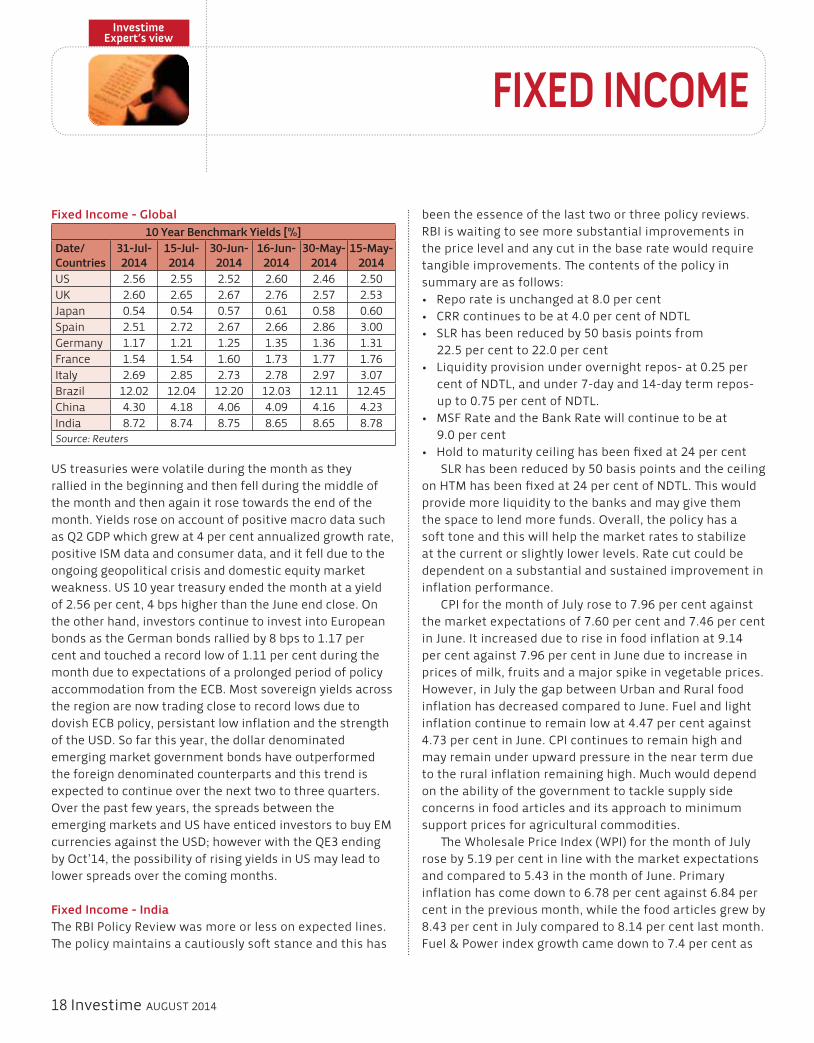
Fixed Income - Global
US treasuries were volatile during the month as they rallied in the beginning and then fell during the middle of the month and then again it rose towards the end of the month. Yields rose on account of positive macro data such as Q2 GDP which grew at 4 per cent annualized growth rate, positive ISM data and consumer data, and it fell due to the ongoing geopolitical crisis and domestic equity market weakness. US 10 year treasury ended the month at a yield of 2.56 per cent, 4 bps higher than the June end close. On the other hand, investors continue to invest into European bonds as the German bonds rallied by 8 bps to 1.17 per cent and touched a record low of 1.11 per cent during the month due to expectations of a prolonged period of policy accommodation from the ECB. Most sovereign yields across the region are now trading close to record lows due to dovish ECB policy, persistant low inflation and the strength of the USD. So far this year, the dollar denominated emerging market government bonds have outperformed the foreign denominated counterparts and this trend is expected to continue over the next two to three quarters. Over the past few years, the spreads between the emerging markets and US have enticed investors to buy EM currencies against the USD; however with the QE3 ending by Oct’14, the possibility of rising yields in US may lead to lower spreads over the coming months.
Fixed Income - IndiaThe RBI Policy Review was more or less on expected lines. The policy maintains a cautiously soft stance and this has
18 Investime AUGUST 2014
InvestimeExpert’s view
FIXED INCOME
been the essence of the last two or three policy reviews. RBI is waiting to see more substantial improvements in the price level and any cut in the base rate would require tangible improvements. The contents of the policy in summary are as follows:
22.5 per cent to 22.0 per cent
9.0 per cent
provide more liquidity to the banks and may give them the space to lend more funds. Overall, the policy has a soft tone and this will help the market rates to stabilize at the current or slightly lower levels. Rate cut could be dependent on a substantial and sustained improvement in inflation performance.
CPI for the month of July rose to 7.96 per cent against the market expectations of 7.60 per cent and 7.46 per cent in June. It increased due to rise in food inflation at 9.14 per cent against 7.96 per cent in June due to increase in prices of milk, fruits and a major spike in vegetable prices.
inflation continue to remain low at 4.47 per cent against 4.73 per cent in June. CPI continues to remain high and may remain under upward pressure in the near term due to the rural inflation remaining high. Much would depend on the ability of the government to tackle supply side concerns in food articles and its approach to minimum support prices for agricultural commodities.
The Wholesale Price Index (WPI) for the month of July rose by 5.19 per cent in line with the market expectations and compared to 5.43 in the month of June. Primary inflation has come down to 6.78 per cent against 6.84 per cent in the previous month, while the food articles grew by 8.43 per cent in July compared to 8.14 per cent last month.
10 Year Benchmark Yields [%]Date/ Countries
31-Jul-2014
15-Jul-2014
30-Jun-2014
16-Jun-2014
30-May-2014
15-May-2014
US 2.56 2.55 2.52 2.60 2.46 2.50UK 2.60 2.65 2.67 2.76 2.57 2.53Japan 0.54 0.54 0.57 0.61 0.58 0.60Spain 2.51 2.72 2.67 2.66 2.86 3.00Germany 1.17 1.21 1.25 1.35 1.36 1.31
1.54 1.54 1.60 1.73 1.77 1.76Italy 2.69 2.85 2.73 2.78 2.97 3.07Brazil 12.02 12.04 12.20 12.03 12.11 12.45China 4.30 4.18 4.06 4.09 4.16 4.23India 8.72 8.74 8.75 8.65 8.65 8.78Source: Reuters

AUGUST 2014 Investime 19
against 9.04 per cent in the previous month. Manufactured products inflation was at 3.67 per cent compared to 3.61 per cent in June.
The Index of Industrial Production (IIP) for the month of July 14 saw a growth of 3.4 per cent against the market expectations of 5.80 per cent. The IIP grew by 5.0 per cent in June which was the highest in 19 months. Core sector growth for June 14 grew at 7.25 per cent against 2.35 per cent in May 14.
Mining sector grew by 4.29 per cent in June compared to 2.86 per cent in May; the growth in mining sector was the highest seen in the last 30 months. The Manufacturing sector growth came down to 1.83 per cent against 5.08 per cent in May. Electricity Sector showed a strong growth of 15.67 per cent as compared to 6.67 per cent in the previous month. Consumer Goods number was very weak at -9.99 per cent compared to positive growth of 4.24 per cent in June. Fall in consumer durables continue to remain high as it contracted 23.4 per cent against expansion of 3.39 per cent in May. Consumer non-durables sector remained flat with a growth of 0.07 per cent. However, both Basic Goods and Capital Goods had robust growth in the month of June. While the Basic Goods Sector grew by 8.96 per cent compared to 6.43 per cent in May, Capital Goods rose by 23.04 per cent for the month of June.
FIIs investment in July has increased to USD 5.5bn against 4.5bn in June. Equities have seen USD 1.93bn and debt has seen strong inflows of USD 3.5bn. FII limit
for debt has been increased to USD 25 bn from USD 20bn earlier and it is within the USD 30bn limit only. FII inflows are expected to be steady as India is better placed among the emerging markets on account of stable government, reforms being initiated etc.
The long end of the curve has shown some tendency to come down due to improving macro economic factors and liquidity. Upside risks from delayed / deficient monsoon, geo-political tensions, and uncertainties surrounding the setting of administered prices appear at this stage to be balanced by the possibility of stronger Government action on food supply and better fiscal consolidation as well as the pass through of recent exchange rate appreciation.
We continue to recommend Accrual funds as the preferred investment avenue for fixed income investors at the current juncture. Further, Arbitrage funds may also be considered for a time horizon of 3-6 months as an alternative, more tax efficient product in comparison to money market funds. The long end yields, with the old 10 year benchmark at 8.75 per cent and new 10 year at 8.55 per cent looks attractive for initiating selective exposure (10-15 per cent of the overall portfolio) in a phased manner with an investment horizon of three years and above.
CPI Rural, Urban and Combined (in %)Rural Urban Combined
Jul-14 Jun-14 Jul-14 Jun-14 Jul-14 Jun-14 WeightFood, beverages & tobacco 9.56 8.59 8.32 6.63 9.14 7.96 49.71Fuel & light 5.18 5.45 3.24 3.41 4.47 4.73 9.49Clothing, bedding & footwear 9.53 9.39 7.21 7.32 8.73 8.65 4.73Housing - - 8.94 9.15 8.94 9.15 9.77Miscellaneous 6.80 6.77 6.16 6.23 6.56 6.54 26.31Headline 8.45 7.87 7.42 6.82 7.96 7.46 100.00Source: CMIE
IIP- Sector Wise Growth Rate (%)Categories Jun-14 May-14 Jun-13 WeightSector-WiseMining 4.29 2.70 (4.59) 14.16%Manufacturing 1.83 4.79 (1.74) 75.53%Electricity 15.67 6.26 0.00 10.32%Use based classification 100.00%
Basic goods 8.96 6.30 (1.85) 45.68%Capital goods 23.04 4.52 (6.55) 8.83%Intermediate goods 2.72 2.66 1.31 15.69%Consumer goods (9.99) 3.66 (1.45) 29.81%Consumer durables (23.40) 3.23 (10.12) 8.46%Consumer non-durables 0.07 3.90 6.17 21.35%
IIP 3.40 4.70 (1.85) 100.00%Source: CMIE

Equity - Global
In the month of July, emerging markets beat developed markets with China, Brazil, Indonesia and India being the top gainers among emerging markets and Japan the top performer among the developed markets with 3 per cent gains. Within Europe, most developed countries like Germany, UK and France fell during the month due to a spate of poor data and worries about the sluggish economic growth. In the Asia Pacific region, India, China, South Korea and Indonesia posted stellar gains as FIIs have come back into the emerging markets due to the attractive valuation discount compared to the developed markets coupled with political stability in the region. Chinese equities were the top gainer with 7.5 per cent returns as the economic indicators have improved and with property prices cooling off, investors have started to enter the markets slowly. India and Indonesia continued with their good run due to a decisive political mandate and the expected reforms accompanying a new regime.
US MarketsUS equities fell during the month despite positive economic data as investors weighed on when the US Fed will increase the interest rates, coupled with the crisis in Ukraine, Iraq and the Argentine sovereign debt default. This led to investors booking profits in US equities.
All the three major indices fell during the month despite S&P 500 reaching an all time high during the month. Markets
saw a sell off during the last week of the month after the crisis in Ukraine and Iraq escalated, there were some earnings disappointments from major corporates and fear of US Fed rising interest rates earlier than expected. One of the major catalysts for the fall was the rise in employment cost index, which rose an unexpected 0.7 per cent in Q2 which clearly indicates rising wages spurring inflation fears when the job growth continues to gain ground.
According to Bloomberg, the Q2 results on an average are beating expectations. Till now 75 per cent of the S&P 500 companies have reported their results; 76 per cent of the reported companies have beaten earnings estimates, while 65 per cent have beaten revenue forecasts. Overall earnings are up 10 per cent compared to the Q2 of last year and this should support equities going ahead. Out of the ten major sectors, only three have posted gains in July mainly the defensives like Telecom, Healthcare and Technology, while the utilities, Industrials and Energy sectors were the top losers.
US equities going ahead will be more data dependent as the earnings season come to an end and may be largely range bound if the political crisis continues in the Middle East. Investors will be watching the US Fed statement closely and the economic data coming out.
Equity - IndiaRBI’s policy was neutral to marginally hawkish and largely a non-event. Benchmark rates were left unchanged while SLR was cut by 50 bps to 22 per cent. RBI emphasized on the inflation target of 6 per cent by January 2016 (The last reading was 7.96 per cent). On the monsoon front good monsoon progress over the last four weeks has helped the deficit for the season to come down to ~17 per cent. Weather experts are expecting the trend in positive rainfall to spill over into the current month as well. Monsoon progress and global cues will be keenly watched going forward. Brent Crude is trending downwards led by a supply glut in spite of geopolitical tension in the Middle East. Focus has now shifted on how the Iraq and Russia crisis shape up and how fast they are resolved. Benefit of the reforms, infrastructure boost and business friendly environment will help support uptick in the GDP which has slipped to a decade low, helping attract long-term money in India. We believe that there is lot of global money on the sidelines waiting to buy the dip Indian markets have witnessed recently and will come in as soon as more clarity over the global crisis emerge. Investors with medium to long term horizon should take a plunge and buy stocks in Auto, Infrastructure, Financials and Cement - key beneficiaries going forward.
20 Investime AUGUST 2014
EQUITY MARKETS
InvestimeExpert’s view
Indices Abosolute Returns (%) CAGR (%)1 Month YTD 1 Year
BEL-20 (Belgium) (0.91) 5.98 16.38Bovespa (Brazil) 5.00 8.39 15.75CAC 40 (France) (4.00) (1.16) 6.35CNX Nifty Index (India) 1.44 22.48 34.47DAX (Germany) (4.33) (1.51) 13.67Dow Jones (USA) (1.56) (0.08) 6.86FTSE 100 (UK) (0.20) (0.28) 1.65Hang Seng (Hong Kong) 6.75 6.22 13.13Jakarta Composite (Indonesia) 4.31 19.06 10.56KLSE Composite (Malaysia) (0.60) 0.24 5.57Madrid General (Spain) (2.08) 7.99 28.22MerVal (Argentina) 3.81 51.88 143.85Nasdaq (USA) (0.87) 4.63 20.50Nikkei 225 (Japan) 3.03 (4.12) 14.28S&P BSE SENSEX (India) 1.89 22.32 33.85Seoul Composite (S.Korea) 3.69 3.22 8.47Shanghai Composite (China) 7.48 4.04 10.42Straits Times (Singapore) 3.64 6.52 4.72Swiss Market (Switzerland) (1.69) 2.53 7.54Taiwan Weighted (Taiwan) (0.82) 8.18 14.90Source: ACE MF Performance as on 31st July 2014

AUGUST 2014 Investime 21
Sectoral OutlookAuto: Earnings for the sector are expected to improve in 2HFY15 on back of gradual recovery of the economy leading to improvement in volume. Favorable currency and likely revival of consumer demand in developed and other emerging countries will boost exports. Any fall in the interest rates will also benefit the sector as major portion of PV and CV is sold on consumer finance. PV is already seeing signs of revival and CV’s are likely to revive in 2HFY15. Maruti, Eicher Motors, Tata Motor and M & M are expected to benefit on account of revival in consumer sentiments. Investors can also look at a few auto-ancillary names like Gabriel India, Munjal Showa, Ceat Tyres, Mahindra CIE etc, which benefit from export as well as revival in domestic market.
Capital Goods/Infra: The results of the companies were disappointing but the management commentary however is upbeat. Companies are expecting an uptick in 2HFY15 on the order intake front. Execution is still on the lower end and is likely to be sluggish as situation on ground has not improved much and payment cycle is still stretched. Turnaround will be visible FY16 onwards as execution picks up. Operating leverage and lower interest cost will further boost profitability. Companies have been trying to deleverage the balance sheet. We can expect pick up in the M&A activity. Material pick up in the investment climate in the second half of FY15 would be the key to the improvement in the earnings for the sector probably in FY16. We prefer L&T, Crompton, Voltas, GPPL, Blue Star, Va Tech Wabag and ITNL.
Consumer: The sector will continue to grow at CAGR of 12-15 per cent over FY14-17, led by rise in disposable income of middle and bottom of the pyramid population. In short to medium term, we believe discretionary/consumer cyclical players will do well, led by likely revival in consumer sentiments. Despite rich valuations, money making opportunities remain in select niche businesses with strong pricing power, strong distribution network and brand franchisees. Our top picks are ITC, Dabur, Pidilite, Asian Paints and Titan.
Financials: Q1FY15 results of private sector banks were marginally subdued but shall continue to deliver steady earnings growth trajectory of ~15 per cent in long term. Most of these private sector banks have NNPA ratio of less than 1 per cent and restructured book of ~2 per cent as they have high retail exposure which is not under much stress. Hence, we do not foresee any major incremental benefit to these banks from government reformist policies. For PSU banks, slippages and NPA level continued to deteriorate in Q1FY15. Most managements have guided that the pace of slippages shall trend south only from Q3FY15 onwards. Owing to persistent high inflation, interest rates are not expected to come down soon. Recent RBI policy allowing banks to raise long-term bonds for infrastructure finance and affordable housing shall augur well for banking industry from long-term perspective. Among PSU banks, one should stick to frontline names like SBI, BOB and BOI in order to play the economic recovery cycle. Within private banks, we prefer Indusind Bank and Axis Bank on the back of their steady earnings trajectory. Bajaj Finance and Dewan Housing Finance can also be looked at on the back of their steady earnings and presence in low stressed segments.
Pharma: US market will continue to provide significant growth opportunities for Indian Pharma companies as huge number of ANDA filings are pending for approvals which also include complex generics (high margin and low competition drugs). Industry will benefit from pick up in the domestic growth on account of low base and price increase (inflation adjustment) allowed this year on NLEM products. Issue between pharma companies and distributors in relation to trade margins on NLEM drugs has been resolved – yet another positive for the sector. Companies with large ANDA pipeline pending with USFDA tend to perform better in the short to medium term.
Power: The sector is likely to benefit from the increased clarity on the regulatory hurdle front and reforms undertaken by the centre. Revenue de-growth seems to have bottomed out and is likely to gradually pick up as benefits of structural and regulatory reforms play out. E-auction of coal mines and coal linkages will play a vital role going forward. Tata Power, Torrent Power and CESC are our preferred picks.
Indices 30-Jun-14 30-May-14 (%) ChngCNX Nifty Index 7,721.30 7,611.35 1.44S&P BSE 100 7,799.72 7,742.66 0.74S&P BSE 200 3,144.77 3,124.40 0.65S&P BSE 500 9,831.51 9,791.34 0.41S&P BSE AUTO Index 15,490.71 15,249.29 1.58S&P BSE BANKEX 17,485.61 17,475.08 0.06S&P BSE Capital Goods 14,651.63 16,200.21 (9.56)S&P BSE Consumer Durables 8,556.87 8,870.04 (3.53)S&P BSE FMCG 7,169.75 6,676.19 7.39S&P BSE Health Care 12,341.28 11,462.23 7.67S&P BSE IT 9,742.34 9,346.10 4.24S&P BSE METAL Index 13,064.27 13,099.95 (0.27)S&P BSE Mid-Cap 9,188.19 9,378.95 (2.03)S&P BSE OIL & GAS Index 10,749.83 11,150.89 (3.60)S&P BSE Power Index 2,133.55 2,318.72 (7.99)S&P BSE PSU 8,012.05 8,633.61 (7.20)S&P BSE Realty Index 1,893.03 2,077.13 (8.86)S&P BSE SENSEX 25,894.97 25,413.78 1.89S&P BSE Small-Cap 9,989.42 10,203.19 (2.10)S&P BSE TECk Index 5,488.13 5,266.36 4.21Source : ACE MF

CURRENCY
InvestimeExpert’s view
Currency markets during the month were driven by investor flows into emerging markets due to the attractive spreads, geopolitical crisis in Ukraine and
Iraq and increasing fears of interest rate hike in US much earlier than expected due to improvement in job growth and other economic indicators.
USD has started to show some strength against most currencies and the trend is expected to continue going ahead supported by an improving economic outlook coupled with firming inflation and labor market indicators. US Fed is expected to end its QE3 by Oct 14 and may hike the interest rate by April 15 rather than middle of next year. Q2 GDP came in four per cent annualized growth surprising most economists and investors and has led to a revision of growth upwards for next year.
Europe continues to face low growth and low inflation worries and the economic indicators don’t indicate any strong rebound in the next two to three quarters. EUR should have ideally depreciated in this period but the strong financial flows into the region have supported the currency and slowed the pace of depreciation. ECB continues to remain dovish and may launch a QE if required which will support the currency. According to the latest CFTC data, bearish bets against the EUR increased as the total net short position stood at USD 18.3bn, almost an increase of USD 4.1bn compared to the previous week. During the month, EUR broke below its two year uptrend and is expected to end 2014 at 1.30-1.31 levels.
Japanese yen finally broke out of the range during the month as it declined by 2 per cent clearly indicating a renewed focus on fundamentals. It has been stuck in a very tight range since March due to geopolitical concerns and waning bearish sentiments. Bank of Japan and the government is very much committed to boost growth and may launch more monetary expansion policies. According to the latest CFTC data, bearish bets on the JPY have increased to USD 9.3bn which may lead JPY to cross 104.3 in the next few months.
Rupee fell 1.5 per cent during the month despite the improvement in its trade deficit, strong FII inflows and the commitment to cap the fiscal deficit at 4.1 per cent of the GDP. Rupee weakness has been consistent with the higher US yields which to some degree has been offset by strong inflows into debt. FIIs have invested USD 5.5bn into Indian equities and debt combined in July bringing the YTD total to USD 25bn. Rupee is expected to remain in a range of 59.2 to 61.5 for the next six months. The two main risks which the rupee faces is a sudden spike in crude prices and FIIs exiting suddenly.
Currencies 31-Mar 14 30-Apr 14 30-May 14 30-Jun 14 31-Jul 14INR 59.91 60.31 59.10 60.17 60.55Euro 1.38 1.39 1.36 1.37 1.34JPY 103.19 102.24 101.78 101.30 102.79GBP 1.67 1.69 1.68 1.71 1.69CHF 0.88 0.88 0.89 0.89 0.91AUD 0.93 0.93 0.93 0.94 0.93
22 Investime AUGUST 2014
Source: Reuters Source: Reuters

DebtMutual Fund Schemes
Investime Top Picks
Note: Colour code for different schemes indicating the level of risk is given on Pg. No. 45, along with other risk related information.
Benchmark IndexAverage AUMTotal (R Cr)June 2014
Average Maturity in Days
Amount Invested
(R)
1 Year 3 Years 5 YearsCurrent
Value (R)CAGR (%)
Current Value (R)
CAGR (%)
Current Value (R)
CAGR (%)
Short Term FundsAxis Short Term Fund(G) Crisil Short Term Bond Fund Index 807 518 10000 11046.76 10.47 12909.42 8.86Birla SL Short Term Fund(G) Crisil Short Term Bond Fund Index 4568 - 10000 11086.77 10.87 13181.96 9.62 14839.18 8.21Birla SL ST Opportunities Fund(G) CRISIL AA Short Term Bond Index 3394 - 10000 11119.48 11.19 13471.52 10.41 15489.68 9.14DWS Short Maturity Fund(G) Crisil Short Term Bond Fund Index 1722 785 10000 11033.93 10.34 13039.68 9.22 14667.03 7.96Franklin India ST Income Plan(G) Crisil Short Term Bond Fund Index 9080 672 10000 11185.30 11.85 13252.51 9.81 15220.01 8.76HDFC STP(G) Crisil Short Term Bond Fund Index 1918 635 10000 11081.91 10.82 12913.73 8.87 14572.25 7.82HSBC Income-Short Term Plan(G) Crisil Short Term Bond Fund Index 812 671 10000 10995.08 9.95 12761.75 8.44 14163.54 7.21ICICI Pru Short Term Plan-Reg(G) Crisil Short Term Bond Fund Index 2881 1,142 10000 11068.30 10.68 12959.74 9.00 14468.89 7.66JPMorgan India ST Income(G) Crisil Short Term Bond Fund Index 533 592 10000 11009.94 10.10 13058.64 9.28Kotak Bond-STP(G) Crisil Short Term Bond Fund Index 1371 865 10000 11025.57 10.26 12878.65 8.77 14296.71 7.41L&T Short Term Opportunities Fund(G) Crisil Short Term Bond Fund Index 245 540 10000 11055.67 10.56PineBridge India Short Term Fund(G) Crisil Short Term Bond Fund Index 291 513 10000 10871.21 8.71 12798.69 8.55 14446.33 7.63Reliance STF(G) Crisil Liquid Fund Index 3320 913 10000 11098.87 10.99 12988.88 9.08 14523.10 7.74Religare Invesco Short Term Fund(G) Crisil Short Term Bond Fund Index 1352 1,079 10000 10898.07 8.98 12979.91 9.06 14382.34 7.53SBI Short Term Debt Fund-Ret(G) Crisil Short Term Bond Fund Index 2744 923 10000 10973.09 9.73 12925.00 8.90 14448.67 7.63Tata ST Bond(G) Crisil Short Term Bond Fund Index 1094 493 10000 11095.45 10.95 13109.28 9.42 14609.18 7.87UTI ST Income-Reg(G) Crisil Short Term Bond Fund Index 2755 394 10000 11119.28 11.19 13251.77 9.81 15154.32 8.66Benchmark Crisil Liquid Fund Index 10000 11018.47 10.18 12901.37 8.85 14342.81 7.48
Crisil Short Term Bond Fund Index 10000 11068.73 10.69 12930.16 8.94 14364.97 7.51Income FundsBirla SL Income Plus(G) Crisil Composite Bond Fund Index 3637 - 10000 10613.48 6.13 12504.49 7.71 13797.95 6.65Canara Rob Income-Reg(G) Crisil Composite Bond Fund Index 162 4,909 10000 10639.78 6.40 12683.77 8.22 14059.03 7.05DSPBR Strategic Bond Fund(G) Crisil Composite Bond Fund Index 37 2,522 10000 10937.35 9.37 12886.67 8.80 14253.99 7.34Franklin India IBA-A(G) Crisil 10 Yr Gilt Index 1415 1,274 10000 10949.76 9.50 13348.84 10.08 15052.47 8.52ICICI Pru Income Opportunities Fund(G) Crisil Composite Bond Fund Index 1042 2,526 10000 11000.16 10.00 12811.64 8.59 14000.95 6.96IDFC SSIF-Invest-Reg(G) Crisil Composite Bond Fund Index 1990 5,022 10000 10566.39 5.66 12799.29 8.55 13885.70 6.78Kotak Bond Fund - Plan A(G) Crisil Composite Bond Fund Index 2970 4,727 10000 10736.49 7.36 12817.17 8.60 14091.58 7.10Reliance Income(G) Crisil Composite Bond Fund Index 1243 4,676 10000 10648.21 6.48 12502.32 7.71 13549.14 6.26SBI Magnum Income(G) Crisil Composite Bond Fund Index 2940 4,150 10000 10512.56 5.13 12798.74 8.55 14171.69 7.22Tata Income Fund(G) Crisil Composite Bond Fund Index 82 1,562 10000 10947.95 9.48 12905.72 8.85 13727.53 6.54UTI Bond Fund(G) Crisil Composite Bond Fund Index 2108 2,190 10000 10674.95 6.75 12888.94 8.80 14590.24 7.84Benchmark Crisil 10 Yr Gilt Index 10000 10271.77 2.72 11829.36 5.75 10271.77 0.54
Crisil Composite Bond Fund Index 10000 10990.52 9.91 12584.47 7.96 13868.73 6.76Gilt FundsBirla SL G-Sec-LT(G) I-Sec Li-BEX 383 - 10000 10607.64 6.08 12739.30 8.38 14899.77 8.30DWS Gilt Fund(G) I-BEX (I-Sec Sovereign Bond Index) 613 3,132 10000 10810.42 8.10 12517.01 7.75 13134.56 5.60HDFC Gilt-Long Term Plan(G) I-Sec Li-BEX 326 6,391 10000 10756.65 7.57 12455.19 7.57 13490.17 6.17ICICI Pru Gilt-Invest-PF-Reg I-Sec Li-BEX 237 4,581 10000 10896.02 8.96 12461.25 7.59 13199.10 5.71ICICI Pru Long Term Gilt Fund-Reg(G) I-BEX (I-Sec Sovereign Bond Index) 647 4,767 10000 10623.96 6.24 12423.94 7.48 13200.61 5.71IDFC G Sec-Invest-Reg(G) I-Sec Composite Gilt Index 417 5,351 10000 10558.05 5.58 13342.62 10.06 14159.70 7.20Kotak Gilt-Invest-Reg(G) I-Sec Composite Gilt Index 484 3,727 10000 10633.35 6.33 12908.20 8.86 14183.95 7.24Reliance Gilt Securities Fund(G) I-Sec Li-BEX 358 4,584 10000 10835.36 8.35 12915.03 8.88 13626.59 6.38SBI Magnum Gilt-LTP-Reg(G) I-Sec Li-BEX 199 5,413 10000 10792.15 7.92 13221.27 9.73 13946.56 6.88UTI Gilt Adv-LTP(G) I-Sec Li-BEX 206 2,708 10000 10753.59 7.54 12808.30 8.58 14091.89 7.10Benchmark I-Sec Composite Gilt Index 10000 10985.84 9.86 12909.26 8.88 14154.73 7.19
I-Sec Li-BEX 10000 10867.50 8.68 12911.77 8.88 14133.99 7.16I-BEX (I-Sec Sovereign Bond Index) 10000 10914.29 9.14 12887.28 8.81 14124.42 7.15
Accrual FundsBirla SL Medium Term Fund(G) CRISIL AA Short Term Bond Index 2958 - 10000 11186.56 11.87 13573.01 10.69 15428.46 9.05DWS Premier Bond Fund(G) Crisil Composite Bond Fund Index 815 945 10000 10947.24 9.47 12642.29 8.11 14078.37 7.08Franklin India Corporate Bond Opportunities Fund(G) Crisil Short Term Bond Fund Index 6224 989 10000 11220.53 12.21 - - - -
Franklin India Income Opportunities Fund(G) Crisil Short Term Bond Fund Index 3992 883 10000 11153.99 11.54 13205.85 9.68 - -HDFC Medium Term Opportunities Fund(G) Crisil Composite Bond Fund Index 2068 774 10000 11132.15 11.32 13068.28 9.30 - -ICICI Pru Corporate Bond Fund-Reg(G) Crisil Short Term Bond Fund Index 2250 1,175 10000 11071.23 10.71 12793.34 8.53 14431.22 7.61ICICI Pru Regular Savings(G) Crisil Composite Bond Fund Index 4336 788 10000 11109.43 11.09 12964.71 9.01 - -JPMorgan India Active Bond Fund(G) Crisil Composite Bond Fund Index 1487 2,549 10000 10887.56 8.88 12280.85 7.07 13408.23 6.04L&T Income Opportunities Fund(G) Crisil Composite Bond Fund Index 556 606 10000 11132.60 11.33 12811.43 8.58 - -Reliance Reg Savings Fund-Debt Plan(G) Crisil Composite Bond Fund Index 4507 664 10000 11061.20 10.61 13031.00 9.20 14769.06 8.11Benchmark Crisil Composite Bond Fund Index 10000 10990.52 9.91 12584.47 7.96 13868.73 6.76
Crisil Short Term Bond Index 10000 11068.73 10.69 12930.16 8.94 14364.97 7.51Performance as on 19th July 2014
AUGUST 2014 Investime 23

EquityMutual Fund Schemes
Investime Top Picks
Source: ACE MF Performance as on 31st July 2014
Note: Colour code for all the above schemes is BROWN. Please refer to Pg. No. 45 for product labels and other risk related information.
Scheme NameAUM
(R Crs)June 2014
Benchmark Index Amount Invested (R)
1 Year 3 Years 5 YearsCurrent
Value (R) CAGR % Current Value (R) CAGR % Current
Value (R)CAGR (%)
Largecap FundsAxis Equity Fund(G) 812 CNX Nifty Index 10000 13676.11 36.76 15552.49 15.81 - -Birla SL Frontline Equity Fund(G) 5039 S&P BSE 200 10000 14607.29 46.07 16015.24 16.95 20475.21 15.40Birla SL Top 100 Fund(G) 491 CNX Nifty Index 10000 15186.90 51.87 16179.33 17.34 20906.60 15.88Canara Rob Eq Diver Fund-Reg(G) 665 S&P BSE 200 10000 13857.43 38.57 14926.44 14.24 20665.67 15.62Franklin India Bluechip Fund (G) 5038 S&P BSE SENSEX 10000 13647.09 36.47 14154.32 12.24 18689.03 13.32Franklin India Prima Plus Fund(G) 2323 CNX 500 Index 10000 14728.21 47.28 15593.74 15.92 20973.97 15.96HDFC Top 200 Fund(G) 1082 S&P BSE SENSEX 10000 15363.51 53.64 14776.54 13.86 19680.79 14.49ICICI Pru Dynamic Plan-Reg(G) 5884 CNX Nifty Index 10000 15548.85 55.49 15917.48 16.71 22547.69 17.65ICICI Pru Focused BlueChip Eq Fund-Reg(G) 617 CNX Nifty Index 10000 14360.27 43.60 15471.58 15.61 21686.44 16.73Kotak Select Focus Fund(G) 528 CNX 200 10000 14558.27 45.58 15663.56 16.09 - -L&T Equity Fund (G) 2123 S&P BSE 200 10000 14548.19 45.48 14705.55 13.68 20374.24 15.29Reliance Focused Large Cap Fund - Reg(G) 1037 CNX Nifty Index 10000 14297.00 42.97 15015.08 14.47 14466.65 7.66SBI BlueChip Fund-Reg(G) 931 S&P BSE 100 10000 14537.29 45.37 16247.35 17.51 18333.33 12.88Tata Pure Equity Fund(G) 661 S&P BSE SENSEX 10000 13410.64 34.11 14773.76 13.85 18490.79 13.07UTI Equity Fund(G) 2904 S&P BSE 100 10000 14256.49 42.56 15615.73 15.97 21396.89 16.42Midcap FundsAxis Midcap Fund(G) 342 S&P BSE Mid-Cap 10000 17458.66 74.59 18747.66 23.23 - -Franklin India Prima Fund(G) 1413 CNX 500 Index 10000 16696.96 66.97 18445.45 22.57 25632.72 20.70Franklin India Smaller Cos Fund(G) 588 CNX Midcap 10000 18945.77 89.46 20658.43 27.28 28160.98 22.99ICICI Pru Value Discovery Fund-Reg(G) 4114 CNX Midcap 10000 18696.98 86.97 18842.30 23.44 29337.58 24.00IDFC Sterling Equity Fund-Reg(G) 1490 CNX Midcap 10000 15409.65 54.10 15325.24 15.25 24115.89 19.22Kotak Midcap Scheme(G) 246 CNX Midcap 10000 16867.89 68.68 15484.20 15.64 22797.64 17.91Reliance Small Cap Fund(G) 566 S&P BSE Small-Cap 10000 21335.85 113.36 18966.44 23.71 - -SBI Emerging Businesses Fund-Reg(G) 1343 S&P BSE 500 10000 15157.20 51.57 16743.71 18.69 29173.08 23.86Sundaram Select Midcap(G) 1963 S&P BSE Mid-Cap 10000 17259.99 72.60 16017.11 16.95 23928.94 19.05UTI Mid Cap Fund(G) 964 CNX Midcap 10000 19240.24 92.40 18125.94 21.86 27942.72 22.80Opportunities FundsDSPBR Opportunities Fund-Reg(G) 516 CNX 500 Index 10000 14322.35 43.22 14297.97 12.62 18868.39 13.53Franklin India Opportunities Fund(G) 287 S&P BSE 200 10000 14857.90 48.58 14401.11 12.89 17103.65 11.32HDFC Mid-Cap Opportunities Fund(G) 4496 CNX Midcap 10000 17598.08 75.98 17583.16 20.64 29555.96 24.19Kotak Opportunities Fund(G) 598 CNX 500 Index 10000 13878.95 38.79 14651.27 13.54 18115.68 12.61Mirae Asset India Opportunities Fund-Reg(G) 483 S&P BSE 200 10000 15316.48 53.16 16288.84 17.61 23817.02 18.94Reliance Equity Opportunities Fund(G) 6162 S&P BSE 100 10000 15904.96 59.05 16543.81 18.22 27353.73 22.28Tata Equity Opportunities Fund(G) 463 S&P BSE 200 10000 14204.53 42.05 15357.88 15.33 19312.11 14.06UTI Opportunities Fund(G) 4101 S&P BSE 100 10000 13803.01 38.03 15387.90 15.40 20875.53 15.85Thematic/Sector FundsBirla SL India GenNext Fund(G) 189 CNX Nifty Index 10000 13269.67 32.70 15807.94 16.44 23369.44 18.49Birla SL Infrastructure Fund(G) 450 CNX Nifty Index 10000 17865.08 78.65 14184.00 12.32 15807.58 9.59Birla SL India MNC Fund(G) 530 CNX MNC 10000 14954.48 49.54 16928.17 19.12 28613.16 23.39HDFC Infrastructure Fund(G) 996 CNX 500 Index 10000 18961.07 89.61 12768.33 8.46 15526.60 9.19ICICI Pru FMCG Fund-Reg(G) 204 CNX FMCG 10000 11310.55 13.11 16685.67 18.55 28599.35 23.37Reliance Banking Fund(G) 1656 CNX Bank 10000 16219.10 62.19 14698.99 13.66 23622.98 18.75Reliance Pharma Fund(G) 809 S&P BSE Health Care 10000 14447.68 44.48 17196.56 19.75 35472.02 28.80SBI Pharma Fund-Reg(D) 216 S&P BSE Health Care 10000 14613.91 46.14 20691.72 27.34 35132.81 28.55Tata Dividend Yield Fund(G) 294 CNX 500 Index 10000 14212.83 42.13 14036.92 11.93 21359.23 16.38UTI Banking Sector Fund(G) 340 CNX Bank 10000 14945.10 49.45 13229.48 9.75 20016.36 14.88UTI Dividend Yield Fund(G) 3044 S&P BSE 100 10000 13880.28 38.80 13369.50 10.13 19041.23 13.74BenchmarkCNX 200 10000 13846.38 38.46 13981.65 11.79 16241.06 10.18CNX 500 Index 10000 14143.71 41.44 14001.76 11.84 16456.66 10.47CNX Bank 10000 15243.59 52.44 14015.14 11.87 20236.73 15.13CNX FMCG 10000 10742.41 7.42 17994.63 21.57 27072.57 22.03CNX Midcap 10000 15769.36 57.69 13518.43 10.54 18214.85 12.73CNX MNC 10000 14174.62 41.75 15655.92 16.07 20031.38 14.90CNX Nifty Index 10000 13447.06 34.47 14084.82 12.06 16653.47 10.73S&P BSE 100 10000 13666.55 36.67 14100.04 12.10 16446.81 10.46S&P BSE 200 10000 13847.94 38.48 13936.62 11.67 16467.95 10.49S&P BSE Health Care 10000 13600.74 36.01 19220.96 24.26 32433.95 26.52S&P BSE Mid-Cap 10000 16575.82 65.76 13286.74 9.91 16492.83 10.52S&P BSE Small-Cap 10000 18808.71 88.09 12027.36 6.33 16096.83 9.98S&P BSE SENSEX 10000 13102.72 33.85 14230.19 12.44 16524.86 10.56
24 Investime AUGUST 2014

Note: The returns are calculated assuming investment in Growth option.
Note: The returns are calculated assuming investment in Growth option. SIP returns are calculated assuming investment of R1,000 done on the first of every month.
Source: ACEMF
The below mentioned table illustrates the yield on monthly Systematic Investment Plan (SIP) and Lumpsum investment for tenures like 1Year, 3Year, 5Year
Source: ACEMF
SIP Performance
The Incredible Power of SYSTEMATIC INVESTMENT PLAN
AUGUST 2014 Investime 25
SIP Investment Returns (% XIRR) Lumpsum Investment Returns (% CAGR)Scheme Benchmark Inception Date NAV as on 19th Aug 14 1 Year 3 Year 5 Year 1 Year 3 Year 5 YearLarge Cap FundsAxis Equity Fund(G) CNX Nifty Index 07-Jan-10 17.11 49.28 26.42 -- 46.95 19.69 --Birla SL Frontline Equity Fund(G) S&P BSE 200 30-Aug-02 141.20 60.05 28.87 18.46 56.30 21.05 15.34Birla SL Top 100 Fund(G) CNX Nifty Index 24-Oct-05 37.48 64.78 30.17 19.53 61.66 21.47 15.79Canara Rob Eq Diver Fund-Reg(G) S&P BSE 200 18-Sep-03 85.09 54.87 24.10 16.50 48.61 17.34 15.10Franklin India Bluechip Fund(G) S&P BSE SENSEX 03-Dec-93 306.47 49.35 21.23 14.35 48.05 15.29 13.36HDFC Top 200 Fund(G) S&P BSE 200 03-Sep-96 318.82 68.65 27.09 16.94 66.01 18.12 14.61ICICI Pru Focused BlueChip Eq Fund-Reg(G) CNX Nifty Index 26-May-08 26.02 55.58 26.54 18.30 51.26 19.88 16.87Kotak 50(G) CNX Nifty Index 05-Feb-03 147.08 51.66 22.08 13.95 50.25 15.17 11.63Kotak Select Focus Fund(G) CNX 200 17-Sep-09 18.69 61.86 28.03 -- 56.51 19.81 --L&T Equity Fund(G) S&P BSE 200 16-May-05 52.59 63.43 25.72 16.56 57.49 16.87 15.35L&T India Large Cap Fund(G) S&P BSE 100 23-Oct-07 17.87 54.64 23.84 15.49 48.46 15.90 14.53Reliance Focused Large Cap Fund(G) CNX Nifty Index 28-Mar-06 20.68 52.16 26.36 14.55 54.40 19.40 7.83SBI BlueChip Fund-Reg(G) S&P BSE 100 17-Feb-06 23.36 61.13 28.55 17.78 57.80 21.34 12.91Tata Pure Equity Fund(G) S&P BSE SENSEX 15-May-98 144.67 47.00 22.85 14.93 42.29 16.95 13.20UTI Equity Fund(G) S&P BSE 100 01-Aug-05 87.90 59.51 26.71 18.05 54.78 19.54 16.12Mid Cap/Multi Cap FundsAxis Midcap Fund(G) S&P BSE Mid-Cap 24-Feb-11 20.31 99.79 38.51 -- 93.95 26.81 --Franklin India Prima Fund(G) CNX 500 Index 01-Dec-93 514.74 91.25 37.73 23.85 86.80 26.03 19.61HDFC Mid-Cap Opportunities Fund(G) CNX Midcap 05-Jul-07 29.91 94.02 36.75 24.95 92.76 24.09 23.50ICICI Pru Value Discovery Fund-Reg(G) CNX Midcap 16-Aug-04 95.00 108.30 41.09 26.06 97.38 28.98 22.44IDFC Premier Equity Fund-Reg(G) S&P BSE 500 28-Sep-05 57.20 75.64 31.66 22.03 72.98 21.15 20.64IDFC Sterling Equity Fund-Reg(G) CNX Midcap 07-Mar-08 29.28 67.94 27.58 18.60 63.64 18.39 18.31Kotak Midcap Scheme(G) CNX Midcap 25-Feb-05 40.65 91.57 30.61 19.13 89.93 19.20 17.10Reliance Equity Opportunities Fund(G) S&P BSE 100 31-Mar-05 61.41 72.43 30.24 21.14 69.24 22.52 21.67SBI Emerging Businesses Fund-Reg(G) S&P BSE 500 12-Oct-04 76.37 77.66 28.45 22.44 65.94 21.02 22.65Sundaram Select Midcap(G) S&P BSE Mid-Cap 30-Jul-02 257.11 94.65 34.56 21.44 88.81 20.56 17.85UTI Mid Cap Fund(G) CNX Midcap 01-Aug-05 61.05 114.96 42.03 25.47 110.35 25.95 20.98Benchmark IndicesCNX 200 58.15 22.84 13.44 43.29 11.93 9.98CNX 500 Index 63.57 23.74 13.83 47.14 12.12 10.34CNX Midcap 99.80 27.88 15.51 72.60 12.08 13.28CNX Nifty Index 49.26 21.37 13.24 36.89 11.78 10.33S&P BSE 100 54.56 22.52 13.53 40.89 12.17 10.21S&P BSE 200 57.90 22.66 13.38 43.33 11.80 10.26S&P BSE 500 62.39 23.17 13.50 46.37 11.61 10.44S&P BSE Mid-Cap 110.84 28.87 14.96 82.12 11.24 10.79S&P BSE SENSEX 47.35 21.78 13.37 35.55 12.04 10.07
Scheme Benchmark Inception Date
NAV as on 19th Aug 14
Total No. of Installments
Total Amount Invested (R)
Present Value (R)
Annualized Yield (%) Fund Manager
Large Cap FundsAxis Equity Fund(G) CNX Nifty Index 07-Jan-10 17.11 55 55000 81516.84 -- Pankaj MurarkaBirla SL Frontline Equity Fund(G) S&P BSE 200 30-Aug-02 141.20 60 60000 93729.73 18.46 Mahesh PatilBirla SL Top 100 Fund(G) CNX Nifty Index 24-Oct-05 37.48 60 60000 96118.93 19.53 Mahesh PatilCanara Rob Eq Diver Fund-Reg(G) S&P BSE 200 18-Sep-03 85.09 60 60000 89453.97 16.50 Ravi GopalakrishnanFranklin India Bluechip Fund(G) S&P BSE SENSEX 03-Dec-93 306.47 60 60000 84987.49 14.35 Anand RadhakrishnanHDFC Top 200 Fund(G) S&P BSE 200 03-Sep-96 318.82 60 60000 90403.87 16.94 Prashant JainICICI Pru Focused BlueChip Eq Fund-Reg(G) CNX Nifty Index 26-May-08 26.02 60 60000 93361.49 18.30 Manish GunwaniKotak 50(G) CNX Nifty Index 05-Feb-03 147.08 60 60000 84172.04 13.95 Harish KrishnanL&T Equity Fund(G) S&P BSE 200 16-May-05 52.59 60 60000 89577.39 16.56 Soumendra Nath LahiriL&T India Large Cap Fund(G) S&P BSE 100 23-Oct-07 17.87 60 60000 87341.63 15.49 Venugopal M.Reliance Focused Large Cap Fund(G) CNX Nifty Index 28-Mar-06 20.68 60 60000 85393.26 14.55 Omprakash KuckianSBI BlueChip Fund-Reg(G) S&P BSE 100 17-Feb-06 23.36 60 60000 92213.33 17.78 Sohini AndaniTata Pure Equity Fund(G) S&P BSE SENSEX 15-May-98 144.67 60 60000 86165.94 14.93 Pradeep GokhaleUTI Equity Fund(G) S&P BSE 100 01-Aug-05 87.90 60 60000 92817.85 18.05 Anoop BhaskarMidcap/Multi Cap FundsFranklin India Prima Fund(G) CNX 500 Index 01-Dec-93 514.74 60 60000 106398.49 23.85 R. JanakiramanHDFC Mid-Cap Opportunities Fund(G) CNX Midcap 05-Jul-07 29.91 60 60000 109169.00 24.95 Chirag SetalvadICICI Pru Value Discovery Fund-Reg(G) CNX Midcap 16-Aug-04 95.00 60 60000 112012.87 26.06 Mrinal SinghIDFC Premier Equity Fund-Reg(G) S&P BSE 500 28-Sep-05 57.20 60 60000 101948.56 22.03 Kenneth AndradeIDFC Sterling Equity Fund-Reg(G) CNX Midcap 07-Mar-08 29.28 60 60000 94040.22 18.60 Aniruddha NahaKotak Midcap Scheme(G) CNX Midcap 25-Feb-05 40.65 60 60000 95213.78 19.13 Pankaj TibrewalReliance Equity Opportunities Fund(G) S&P BSE 100 31-Mar-05 61.41 60 60000 99850.83 21.14 Sailesh Raj BhanSBI Emerging Businesses Fund-Reg(G) S&P BSE 500 12-Oct-04 76.37 60 60000 102939.44 22.44 R. SrinivasanSundaram Select Midcap(G) S&P BSE Mid-Cap 30-Jul-02 257.11 60 60000 100563.62 21.44 S. KrishnakumarUTI Mid Cap Fund(G) CNX Midcap 01-Aug-05 61.05 60 60000 110504.06 25.47 Anoop Bhaskar

26 Investime AUGUST 2014
FIXE
D D
EPO
SITS
& B
ON
DS
AUGU
ST 2
014
FIXE
D D
EPO
SITS
- H
FCH
OU
SIN
G F
INAN
CE
COM
PAN
YM
in. A
mt
Cred
it
Rati
ngIn
t.
Freq
INTE
REST
RAT
ESRe
mar
ks12
M15
M18
M22
M24
M30
M33
M36
M45
M48
M60
M12
-23
M24
-35
M36
-59
M60
-84
M12
0 M
HD
FC R
egul
ar -
Indi
vidu
als
& T
rust
s.
(Bel
ow R
1 cr
ore)
4000
0
FAAA
by
CRIS
IL &
IC
RA
M9.
059.
05 (2
4-35
)8.
95
(36-
60)
Add.
Int.
- 0.
25%
fo
r Sen
ior C
itiz
ens.
D
epos
its
belo
w
R1
Cror
e.
2000
0Q
9.10
9.10
(24-
35)
9.00
(36-
60)
2000
0H
9.20
9.20
(24-
35)
9.10
(36-
60)
2000
0Y
-9.
40 (2
4-35
)9.
30(3
6-60
)
2000
0C
9.40
9.40
9.30
9.30
9.30
HD
FC R
egul
ar -
Indi
vidu
als
& T
rust
s.
(R1
cror
e to
R5
Cror
e)
FAAA
by
CRIS
IL &
IC
RA
M9.
259.
259.
158.
95
For C
unm
mul
ativ
e O
ptio
n, in
tere
st is
co
mpo
nded
ann
ually
Q9.
309.
309.
209.
00
H9.
409.
409.
309.
10
Y_
9.60
9.50
9.30
C9.
609.
609.
509.
30
HD
FC R
egul
ar -
Indi
vidu
als
& T
rust
s.
(R5
cror
e to
R20
Cr
ore)
FAAA
by
CRIS
IL &
IC
RA
M9.
259.
259.
158.
95
For C
unm
mul
ativ
e O
ptio
n, in
tere
st is
co
mpo
nded
ann
ually
Q9.
309.
309.
209.
00
H9.
409.
409.
309.
10
Y_
9.60
9.50
9.30
C9.
609.
609.
509.
30
HD
FC P
lati
num
- In
divi
dual
s &
Tru
sts.
(B
elow
R1
cror
e)
4000
0
FAAA
by
CRIS
IL &
IC
RA
M9.
159.
159.
15
Add.
Int.
- 0.
25%
fo
r Sen
ior C
itiz
ens.
D
epos
its
belo
w
R1
Cror
e
2000
0Q
9.20
9.20
9.20
2000
0H
9.30
9.30
9.30
2000
0Y
_9.
509.
50
2000
0C
9.50
9.50
9.50
LIC
Hou
sing
Fin
ance
Co
Ltd
1000
0FA
AA
(CRI
SIL)
H/C
9.00
9.00
9.25
9.40
9.60
Add.
Int.
- 0.
25%
fo
r Sen
ior C
itiz
ens.
>=
R51
,000
/-. (
Max
Am
t - R
5 Cr
ore)
. Add
. In
t. -
0.10
% fo
r Sen
ior
Citi
zens
. <=
R51
,000
/-. (
Max
Am
t - R
5 Cr
ore)
GRU
H F
inan
ce L
td
2000
0
AAA
(CRI
SIL)
&
MAA
+ (IC
RA)
M8.
508.
759.
00
(36-
59)
8.75
(6
0-95
)8.
50
(96-
120)
Add.
Int.
- 0.
25%
for
Seni
or C
itiz
ens.
&
Trus
ts.
2000
Q8.
759.
009.
25
(36-
59)
9.00
(6
0-95
)8.
75
(96-
120)
2000
A9.
009.
259.
50
(36-
59)
9.25
(6
0-95
)9.
00
(96-
120)
1000
C9.
009.
259.
50
(36-
59)
9.25
(6
0-95
)9.
00
(96-
120)

AUGUST 2014 Investime 27
PNB
Hou
sing
Fin
ance
Lt
d (In
divi
dual
&
Trus
t - le
ss th
an
R10
cro
re)
2000
0FA
AA
(CRI
SIL)
C9.
509.
509.
559.
509.
509.
50
(72&
84)
9.50
Add.
Int.
- 0.2
5% fo
r Se
nior
Citi
zens
. Ap
plic
able
for t
he
inve
stm
ent u
pto
R 1
cror
e20
000
H9.
509.
509.
559.
509.
509.
50
(72&
84)
9.50
FIXE
D D
EPO
SITS
- NBF
CN
ON
BAN
KIN
G
FIN
ANCE
CO
MPA
NY
Min
. Am
tCr
edit
Ra
ting
Int.
Fr
eqIN
TERE
ST R
ATES
Rem
arks
12 M
15 M
18 M
22 M
24 M
30 M
33 M
36 M
45 M
48 M
60 M
12-2
3 M
24-3
5 M
36-5
9 M
60-8
4 M
120
M
Mah
indr
a &
M
ahin
dra
Fina
nce
Co L
td
5000
0CR
ISIL
- FA
AA
Q8.
909.
659.
909.
409.
40Ad
d. In
t. -
0.25
% fo
r Se
nior
Cit
izen
s.25
000
H9.
009.
7510
.00
9.50
9.50
1000
0C
9.25
9.75
10.0
010
.25
9.75
9.75
Shri
ram
Tra
nspo
rt
Fina
nce
Co. L
td.
2500
0“F
AA+/
Stab
le b
y CR
ISIL
” &
“M
AA+/
Stab
le b
y IC
RA”
M8.
889.
3410
.25
10.2
510
.25
Add.
Int.
- 0.
25%
fo
r Sen
ior C
itiz
ens.
M
axim
um A
mou
nt -
R10
Cro
re
2500
0Q
8.95
9.41
10.3
410
.34
10.3
4
2500
0H
9.05
9.52
10.4
710
.47
10.4
7
2500
0Y
9.25
9.75
10.7
510
.75
10.7
5
2500
0C
9.25
9.75
10.7
510
.75
10.7
5
Shri
ram
Cit
y U
nion
Fi
nanc
e Co
. Ltd
.
1000
0Fi
tch
tAA-
(ind
) by
Fit
ch
and
CARE
AA
(FD
) by
CARE
M8.
889.
3410
.25
10.2
510
.25
Add.
Int.
- 0.
25%
for
Seni
or C
itiz
ens.
1000
0Q
8.95
9.41
10.3
410
.34
10.3
4
1000
0H
9.05
9.52
10.4
710
.47
10.4
7
1000
0Y
9.25
9.75
10.7
510
.75
10.7
5
5000
C9.
2510
.23
11.9
412
.60
13.3
2
Baja
j Fin
ance
R1,
50,0
00 fo
r G
reat
er M
umba
i (In
clud
ing
Nav
i M
umba
i and
Than
e )a
nd N
atio
nal C
api-
tal R
egio
n-N
CD.
R1,
00,0
00 fo
r Pun
e,
Bang
alor
e, H
yder
-ab
ad, A
hmed
abad
, Ko
lkat
a &
Che
nnai
an
d R
50,0
00 fo
r Re
st o
f Ind
ia (
BFL
bran
ch p
rese
nce,
as
per
list
.
CRIS
IL-
FAAA
C9.
259.
759.
409.
659.
259.
25
Add.
Int.
- 0.
25%
for
Seni
or C
itiz
ens
M8.
909.
309.
059.
208.
908.
90
Q8.
959.
409.
059.
308.
958.
95
H9.
059.
409.
159.
309.
059.
05
Y9.
259.
759.
409.
659.
259.
25
FIXE
D D
EPO
SITS
- GO
VT IN
STIT
UTI
ON
GO
VT IN
STIT
UTI
ON
Min
. Am
tCr
edit
Ra
ting
Int.
Fr
eqIN
TERE
ST R
ATES
Rem
arks
12 M
15 M
18 M
22 M
24 M
30 M
33 M
36 M
45 M
48 M
60 M
12-2
3 M
24-3
5 M
36-5
9 M
60-8
4 M
120
M
EXIM
Ban
k - U
pto
R 1
Cro
re10
000
CRI
SIL
- FAA
A &
FIT
CH -
TAAA
, ICR
A - M
AAA
H/C
8.75
8.75
(36)
9.00
(3
7-60
)Ad
d. In
t. -
0.50
% fo
r Se
nior
Cit
izen
s EX
IM B
ank
- Abo
ve
R1
Cror
e10
000
H/C
8.00
8.00
(36)
8.25
(3
7-60
)
Nat
iona
l Hou
sing
Ba
nk -U
pto
R99
lacs
5000
0CR
ISIL
- F
AAA/
FI
TCH
- TA
AA
C9.
259.
259.
259.
25Ad
d. In
t. -
0.60
% fo
r Se
nior
Cit
izen
s50
000
H9.
259.
259.
259.
25
HU
DCO
(Ind
ivid
ual/
Trus
t)
5000
0CR
ISIL
-FAA
/IC
RA-M
AA
Q/H
9.15
8.85
8.90
8.75
8.75
Add.
Int.
- 0.
25%
for
Seni
or C
itiz
ens
1000
0Y
9.15
8.85
8.90
8.75
8.75
FIXE
D D
EPO
SITS
- MAN
UFA
CTU
RER
MAN
UFA
CTU
RER
Min
. Am
tCr
edit
Ra
ting
Int.
Fr
eq
INTE
REST
RAT
ESRe
mar
ks12
M15
M18
M22
M24
M30
M33
M36
M45
M48
M60
M12
-23
M24
-35
M36
-59
M60
-84
M12
0 M
God
rej &
Boy
ce25
000
FAA
(Sta
ble)
H9.
50

BON
DS
Bond
sTe
nure
Min
am
tM
ax a
mt
Inte
rest
Rat
esSt
art a
nd
Clos
ing
Dat
esRE
C 54
EC C
apit
al G
ain
Tax
Bond
s36
mon
ths
R10
000
R 5
0 La
cs6.
00%
pay
able
ann
ually
On
Goi
ngN
HAI
54E
C Ca
pita
l Gai
n Ta
x Bo
nds
36 m
onth
sR
1000
0R
50
Lacs
6.00
% p
ayab
le a
nnua
llyO
n G
oing
8% G
ovt o
f Ind
ia S
avin
gs B
onds
72 m
onth
sR
1000
No
Lim
its
8.00
% p
ayab
le a
nnua
llyO
n G
oing
Not
e :
1.
Inte
rest
rate
s off
ered
by
the
com
pani
es a
re s
ubje
ct to
cha
nge
with
or w
ithou
t giv
ing
any
prio
r not
ice.
2.
Fixe
d D
epos
its a
re u
nsec
ured
and
rank
ing
pari
pass
u w
ith o
ther
uns
ecur
ed li
abili
ties.
3.
Thou
gh s
uffici
ent c
are
has
been
take
n, to
pro
vide
the
corr
ect r
ates
, how
ever
ABM
ML
does
not
gur
ante
e th
e ac
cura
cy o
f the
dat
a pr
ovid
ed h
erei
n. A
s a
pote
ntia
l inv
esto
r, yo
u ar
e ad
vise
d to
che
ck th
e up
date
d ra
tes
and
othe
r Ter
ms
& C
ondi
tions
bef
ore
mak
ing
any
inve
stm
ents
.
4.
ABM
ML
and
its e
mpl
oyee
s w
ill n
ot h
ave
any
liabi
lity
of a
ny re
ason
wha
tsoe
ver,
for a
ny in
vest
men
t mad
e ba
sed
on th
is in
tere
st ra
tes
char
t.
5.
Plea
se re
fer t
o th
e re
spec
tive
appl
icat
ion
form
for d
etai
led
term
s &
con
ditio
ns, i
nter
est r
ates
, rul
es a
nd re
gula
tions
gov
erni
ng F
ixed
Dep
osits
bef
ore
inve
stin
g.
6.
For F
ixed
Dep
osits
>=
R1
Cror
e, in
tere
st ra
tes
may
diff
er in
cer
tain
com
pani
es. F
or C
orpo
rate
s de
posi
ts, i
nter
est r
ates
are
diff
eren
t is
cert
ain
com
pani
es. R
eque
st to
to
chec
k th
e up
date
d in
tere
st ra
tes
befo
re s
ubm
ittin
g th
e ap
plic
atio
n.
CUM
ULA
TIVE
SCH
EME
Peri
od in
mon
ths
Dep
osit
< R
25 L
acs
Dep
osit
R25
Lac
s an
d ab
ove
Gen
eral
Cus
tom
erPr
ivile
ge C
usto
mer
Gen
eral
Cus
tom
erPr
ivile
ge C
usto
mer
ROI (
%p.
a.)
Yiel
d (%
p.a.
)RO
I (%
p.a.
)An
nual
Yie
ldRO
I (%
p.a.
)An
nual
Yie
ldRO
I (%
p.a.
)An
nual
Yie
ld12
-120
1010
.25-
16.5
310
.510
.78-
17.8
310
.25
10.5
1-17
.17
10.7
511
.04-
18.4
914
10.5
10.8
811
11.4
210
.75
11.1
511
.25
11.6
940
10.5
11.8
811
12.5
210
.511
.88
1112
.52
18-S
way
amsi
dha
10.6
11.1
711
.111
.73
10.8
511
.45
11.3
512
.01
13-T
rust
Dep
osit
*10
.510
.83
--
10.7
511
.1-
-
NO
N C
UM
ULA
TIVE
SCH
EME
Peri
od in
mon
ths
Dep
osit
< R
25
Lacs
Dep
osit
R 2
5 La
cs a
nd a
bove
Year
lyH
alf Y
earl
yQ
uart
erly
Mon
thly
Year
lyH
alf Y
earl
yQ
uart
erly
Mon
thly
12-1
2010
.25
109.
889.
810
.51
10.2
510
.12
10.0
412
-120
Pri
vile
ge10
.78
10.5
10.3
610
.28
11.0
410
.75
10.6
110
.51
1410
.78
10.5
10.3
610
.28
11.0
410
.75
10.6
110
.51
14 P
rivi
lege
11.3
1110
.85
10.7
511
.57
11.2
511
.09
10.9
940
10.5
10.2
310
.110
.02
10.5
10.2
310
.110
.02
40 P
rivi
lege
1110
.71
10.5
610
.47
1110
.71
10.5
610
.47
18-S
way
amsi
dha
10.8
810
.610
.46
10.3
711
.14
10.8
510
.710
.61
18 S
way
amsi
dha
Priv
ilege
11.4
111
.110
.95
10.8
511
.67
11.3
511
.19
11.0
913
-Tru
st D
epos
it*
10.7
810
.510
.36
10.2
811
.04
10.7
510
.61
10.5
1
DH
FL F
IXED
DEP
OSI
TS
* In
case
of 1
3 m
onth
s (T
rust
dep
osit)
to a
vaila
ble
25 b
ps a
dditi
onal
rate
of i
nter
est,
min
imum
am
ount
is R
1 cr
ore
28 Investime AUGUST 2014
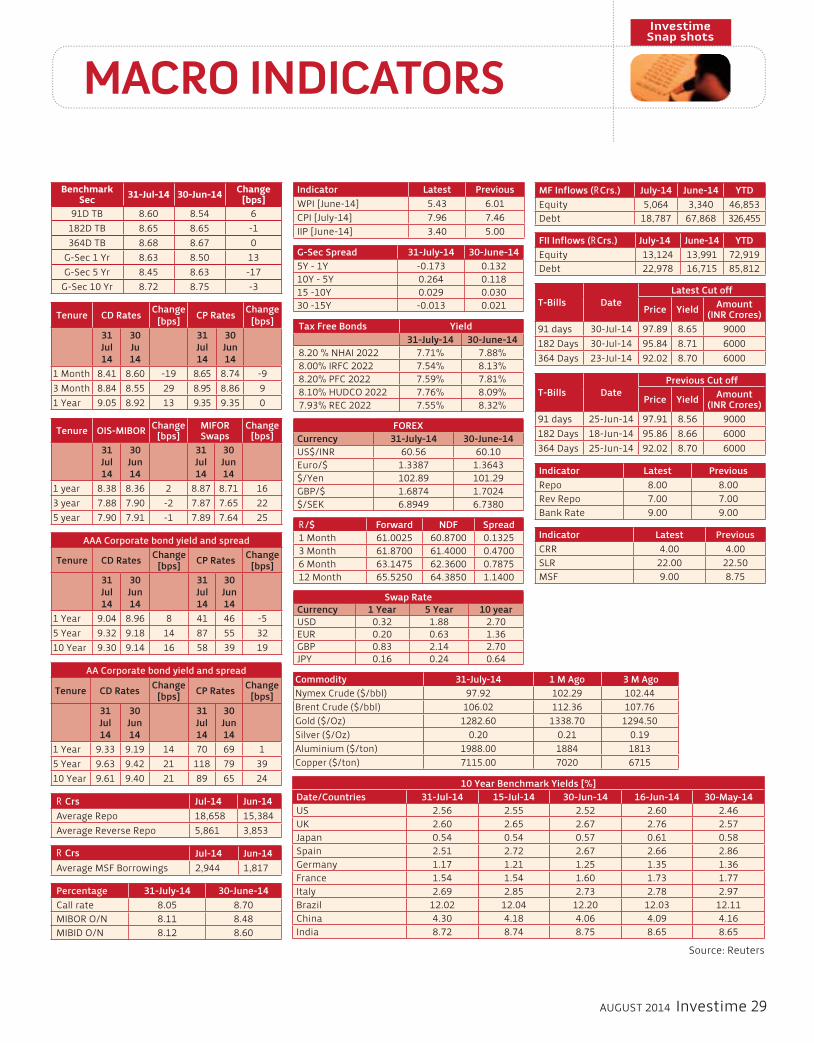
Commodity 31-July-14 1 M Ago 3 M AgoNymex Crude ($/bbl) 97.92 102.29 102.44Brent Crude ($/bbl) 106.02 112.36 107.76Gold ($/Oz) 1282.60 1338.70 1294.50Silver ($/Oz) 0.20 0.21 0.19Aluminium ($/ton) 1988.00 1884 1813Copper ($/ton) 7115.00 7020 6715
MACRO INDICATORS InvestimeSnap shots
AUGUST 2014 Investime 29
Benchmark Sec 31-Jul-14 30-Jun-14 Change
[bps]91D TB 8.60 8.54 6
182D TB 8.65 8.65 -1364D TB 8.68 8.67 0
G-Sec 1 Yr 8.63 8.50 13G-Sec 5 Yr 8.45 8.63 -17
G-Sec 10 Yr 8.72 8.75 -3
Tenure CD Rates Change [bps] CP Rates Change
[bps]31Jul14
30Ju14
31Jul14
30Jun14
1 Month 8.41 8.60 -19 8.65 8.74 -93 Month 8.84 8.55 29 8.95 8.86 91 Year 9.05 8.92 13 9.35 9.35 0
Tenure OIS-MIBOR Change [bps]
MIFOR Swaps
Change [bps]
31Jul14
30Jun14
31Jul14
30Jun14
1 year 8.38 8.36 2 8.87 8.71 163 year 7.88 7.90 -2 7.87 7.65 225 year 7.90 7.91 -1 7.89 7.64 25
AA Corporate bond yield and spread
Tenure CD Rates Change [bps] CP Rates Change
[bps]31Jul14
30Jun14
31Jul14
30Jun14
1 Year 9.33 9.19 14 70 69 15 Year 9.63 9.42 21 118 79 3910 Year 9.61 9.40 21 89 65 24
AAA Corporate bond yield and spread
Tenure CD Rates Change [bps] CP Rates Change
[bps]31Jul14
30Jun14
31Jul14
30Jun14
1 Year 9.04 8.96 8 41 46 -55 Year 9.32 9.18 14 87 55 3210 Year 9.30 9.14 16 58 39 19
R Crs Jul-14 Jun-14Average Repo 18,658 15,384Average Reverse Repo 5,861 3,853
R Crs Jul-14 Jun-14Average MSF Borrowings 2,944 1,817
Percentage 31-July-14 30-June-14Call rate 8.05 8.70MIBOR O/N 8.11 8.48MIBID O/N 8.12 8.60
Indicator Latest PreviousWPI [June-14] 5.43 6.01CPI [July-14] 7.96 7.46IIP [June-14] 3.40 5.00
Tax Free Bonds Yield31-July-14 30-June-14
8.20 % NHAI 2022 7.71% 7.88%8.00% IRFC 2022 7.54% 8.13%8.20% PFC 2022 7.59% 7.81%8.10% HUDCO 2022 7.76% 8.09%7.93% REC 2022 7.55% 8.32%
FOREX Currency 31-July-14 30-June-14US$/INR 60.56 60.10Euro/$ 1.3387 1.3643$/Yen 102.89 101.29GBP/$ 1.6874 1.7024$/SEK 6.8949 6.7380
R/$ Forward NDF Spread1 Month 61.0025 60.8700 0.13253 Month 61.8700 61.4000 0.47006 Month 63.1475 62.3600 0.787512 Month 65.5250 64.3850 1.1400
Swap RateCurrency 1 Year 5 Year 10 yearUSD 0.32 1.88 2.70EUR 0.20 0.63 1.36GBP 0.83 2.14 2.70JPY 0.16 0.24 0.64
MF Inflows (RCrs.) July-14 June-14 YTDEquity 5,064 3,340 46,853Debt 18,787 67,868 326,455
FII Inflows (RCrs.) July-14 June-14 YTDEquity 13,124 13,991 72,919Debt 22,978 16,715 85,812
T-Bills DateLatest Cut off
Price Yield Amount (INR Crores)
91 days 30-Jul-14 97.89 8.65 9000182 Days 30-Jul-14 95.84 8.71 6000364 Days 23-Jul-14 92.02 8.70 6000
T-Bills DatePrevious Cut off
Price Yield Amount (INR Crores)
91 days 25-Jun-14 97.91 8.56 9000182 Days 18-Jun-14 95.86 8.66 6000364 Days 25-Jun-14 92.02 8.70 6000
Indicator Latest PreviousRepo 8.00 8.00Rev Repo 7.00 7.00Bank Rate 9.00 9.00
Indicator Latest PreviousCRR 4.00 4.00SLR 22.00 22.50MSF 9.00 8.75
10 Year Benchmark Yields [%]Date/Countries 31-Jul-14 15-Jul-14 30-Jun-14 16-Jun-14 30-May-14US 2.56 2.55 2.52 2.60 2.46UK 2.60 2.65 2.67 2.76 2.57Japan 0.54 0.54 0.57 0.61 0.58Spain 2.51 2.72 2.67 2.66 2.86Germany 1.17 1.21 1.25 1.35 1.36France 1.54 1.54 1.60 1.73 1.77Italy 2.69 2.85 2.73 2.78 2.97Brazil 12.02 12.04 12.20 12.03 12.11China 4.30 4.18 4.06 4.09 4.16India 8.72 8.74 8.75 8.65 8.65
G-Sec Spread 31-July-14 30-June-145Y - 1Y -0.173 0.13210Y - 5Y 0.264 0.11815 -10Y 0.029 0.03030 -15Y -0.013 0.021
Source: Reuters

Investime Direct Equity
EQUITY MODEL PORTFOLIO
Markets are very near to a lifetime high!! Have you failed to participate in the rally?? What next??Investors should note that, this rally is led by only select 30-40 large cap defensives from the universe of IT, Pharma and FMCG which are at lifetime highs. Excluding these defensive sectors, the market is at trading below the mean P/E multiple of 14x. The broader market is still struggling, with many quality midcaps and small caps trading at distress valuations (EV at 50-70% discount to replacement cost, low P/E, P/BV and decent RoE of 15-20%). To capture this opportunity, we have made following changes in the strategy of “Model Portfolio”.
Growth PortfolioComposition of stocks is around 50:50 for Large Cap : Midcaps/Small caps.This portfolio is recommended for “Aggressive” investors, who seeks high return and high risk. The aim is beat the benchmark index with wide margin with the help of inclusion of quality midcaps and small caps.
Value Portfolio Composition of stocks will be 70-80:30-20 for Large Cap : Midcaps/Small caps. This portfolio is recommended for “Conservative” investors, who seeks low to medium risk and optimum returns. The aim is to outperform the benchmark index.
ABM Model Portfolio - Growth
SrNo Scrip Name Added
DateReco Price
“Reco Price (Wid brok)” Wt. (%) CMP “Gain /
Loss (%)”Wt. Adj. Ret. (%) Beta (%) Wt. Adj.
Beta. (%)Banking & Financials 30.00%
1 ICICI Bank Ltd 1-Jan-14 1,074.40 1,077.10 10.00% 1,475.90 37 3.7 1.5 0.152 South Indian Bank 29-Apr-14 23.3 23.4 10.00% 30.7 31.2 3.1 1.1 0.113 Bank of Baroda 16-Apr-14 751.5 753.4 10.00% 861.6 14.4 1.4 1.7 0.17
FMCG & Media 13.00%4 ITC Ltd 1-Jan-14 316.1 316.9 8.00% 357.1 12.7 1 0.8 0.065 Titan Industries Ltd 1-Jan-14 228.7 229.3 5.00% 332.7 45.1 2.3 1 0.05
CG/Infra/RE/Utility 14.00%6 Larsen & Toubro Ltd 28-Jan-14 995.3 997.8 8.00% 1,656.40 66 5.3 1.5 0.127 Oberoi Realty 18-Mar-14 202.8 203.3 6.00% 262.6 29.1 1.7 1 0.06
Technology 6.00%8 Tech Mahindra Ltd 5-Mar-14 1,910.00 1,914.80 6.00% 2,176.20 13.7 0.8 0.4 0.03
Pharma & Healthcare 5.00%9 Sun Pharmaceutical Industries Ltd 1-Jan-14 572.4 573.8 5.00% 779.3 35.8 1.8 0.4 0.02
Oil and Gas 8.00%10 Cairn India Ltd 1-Jan-14 317.3 318 4.00% 308.9 -2.9 -0.1 0.7 0.0311* Oil & Natural Gas Corp Ltd 1-Jan-14 283.8 284.5 4.00% 400.9 40.9 1.6 1.5 0.06
Auto & Auto Ancl. 18.00%12 Mahindra & Mahindra Ltd 1-Jan-14 933.6 935.9 8.00% 1,206.50 28.9 2.3 0.8 0.0613 Ashok Leyland Ltd 3-Apr-14 23.8 23.9 4.00% 33.3 39.6 1.6 1.2 0.0514 Tata Motors Ltd 6-Feb-14 353 353.9 6.00% 461.9 30.5 1.8 1.1 0.07
Telecom 6.00%15 Bharti Airtel Ltd 1-Jan-14 337.6 338.4 6.00% 354.7 4.8 0.3 1 0.06
Cash & Cash Equalents 0.00%Total 100% MTM Return % 28.7 1.1
Portfolio NAV 164.5BSE 100 NAV 140.9
30 Investime AUGUST 2014
Quarterly Performance Portfolio BSE100 AlphaQtr ending Jun13 (1QFY14) 8.9 4.2 4.7Qtr ending Sept13 (2QFY14) 1 1.5 -0.5Qtr ending Dec13 (3QFY14) 11.9 7.5 4.4Qtr ending Mar14 (4QFY14) 10.7 6 4.7Qtr ending Jun14 (1QFY15) 19 15.4 3.6Since Inception Return 64.5 40.9 23.6
Portfolio Composition Weight Ideal WtLarge Cap 75.00% 50-60%Mid Cap 5.00% 0-40%Small cap 20.00% 0-40%Total 100.00%
Note: * Denotes corporate benefits is adjusted to the Reco price # Adjusted for corporate events

ABM Model Portfolio - Value
SrNo Scrip Name Added
DateReco Price
“Reco Price (Wid brok)” Wt. (%) CMP “Gain /
Loss (%)”Wt. Adj. Ret. (%) Beta (%) Wt. Adj.
Beta. (%)Banking & Financials 26.00%
1 HDFC Bank Ltd 1-Jan-14 658.2 659.8 10.00% 835.5 26.6 2.7 1.1 0.12 Federal Bank Ltd 31-Mar-14 93 93.2 8.00% 118.3 26.8 2.1 1.3 0.13 ING Vysya 1-Jan-14 602.3 603.8 8.00% 602 -0.3 0 1 0.1
FMCG & Media 10.00%4 ITC Ltd 1-Jan-14 316.1 316.9 10.00% 357.1 12.7 1.3 0.8 0.1
CG/Infra/RE/Utility 12.00%5 Power Grid Corp of India Ltd 10-Apr-14 108 108.3 4.00% 134.6 24.3 1 1 06 ITNL 2-Apr-14 121.4 121.7 4.00% 236.1 94 3.8 1.4 0.17 NTPC Ltd 13-May-14 126 126.3 4.00% 149 17.9 0.7 1 0
Technology 7.00%8 Tech Mahindra Ltd 5-Mar-14 1,910.00 1,914.80 7.00% 2,176.20 13.7 1 0.4 0
Pharma & Healthcare 6.00%9 Dr Reddy's Laboratories Ltd 5-Mar-14 2,768.00 2,774.90 6.00% 2,745.90 -1 -0.1 0.4 0
Oil and Gas 15.00%10 Reliance Industries Ltd 1-Jan-14 879.2 881.4 7.00% 1,021.80 15.9 1.1 1.2 0.111 OIL India 2-Jun-14 570 571.4 8.00% 582.4 1.9 0.2 1 0.1
Auto & Auto Ancl. 12.00%12 Maruti Suzuki India Ltd 5-Mar-14 1,626.00 1,630.10 6.00% 2,506.60 53.8 3.2 1.1 0.113 Bajaj Auto Ltd 23-Jan-14 1,890.00 1,894.70 6.00% 2,103.10 11 0.7 0.9 0.1
Metal & Mining 7.00%14 Tata Steel Ltd 28-Jan-14 349.5 350.4 7.00% 557.2 59 4.1 1.2 0.1
Telecom 5.00%15 Bharti Airtel Ltd 1-Jan-14 337.6 338.4 5.00% 354.7 4.8 0.2 1 0
Cash & Cash Equivalents 0.00%Total 100% MTM Return % 21.9 1.0
Portfolio NAV 153.1BSE 100 NAV 140.9
AUGUST 2014 Investime 31
Quarterly Performance Portfolio BSE100 AlphaQtr ending Jun13 (1QFY14) 6.7 4.2 2.5Qtr ending Sept13 (2QFY14) 4.3 1.5 2.8Qtr ending Dec13 (3QFY14) 8.2 7.5 0.7Qtr ending Mar14 (4QFY14) 7.4 6 1.4Qtr ending Jun14 (1QFY15) 16.8 15.4 1.4Since Inception Return 53.1 40.9 12.2
Portfolio Composition Weight Ideal WtLarge Cap 80.00% 70-80%Mid Cap 16.00% 20-30%Small cap 4.00% 20-30%Total 100.0%
Note: * Denotes corporate benefits is adjusted to the Reco price # Adjusted for corporate events

Fund DetailsInception Date: 1st February, 1994Portfolio Manager: Mr. Prashant Jain & Mr. Rakesh VyasQuarterly Avg. AUM (June-14): 5,833.87Benchmark: Crisil Balanced Fund IndexExit Load: 1% on or before 1Y, Nil on or after 1Y
Fund Manager ProfileMr. Prashant JainMr. Mahesh Patil has over 20 years of experience in fund management, equity research and corporate finance. Prior to joining BSLAMC, he has worked with Reliance Infocom Ltd. in Business Strategy
Mr. Rakesh VyasMr. Rakesh Vyas has over 9 years of experience with over 5 years in equity research. He is with HDFC AMC from Oct 2009 till date. He has also worked with Nomura Financial Advisory and Securities Pvt. Ltd., Lehman Brothers Services India Pvt. Ltd., GE Power Controls India Pvt. Ltd., Larsen & Toubro Ltd.
The new tax rules that have been introduced in the Union Budget 2014 for the non-equity mutual funds (holding period extended for long-term capital gains tax to 3 years) must have kept the risk-averse investors in a state of dilemma and confusion on where to invest now and what portion should be allocated to debt segment. Balanced funds provide the opportunity to invest both in debt and equity segments and at the same time enjoy the benefits like that of an equity mutual fund. Also balanced funds are recommended to investors who are new entrants in the investment field and to those who are happy with moderate returns, but would want downside protection as well for the next 3- 5 years. Balanced funds with minimum of 65% equity exposure would be qualified for equity mutual fund tax treatment. Balanced mutual funds has been performing exceptionally well with an average 40.94% 1 year CAGR (as on 31st July’14) while CNX Nifty Index and S&P BSE SENSEX had given 34.47% and 33.85 % respectively over the same period. While equity mutual funds have the potential to provide better returns compared to balanced funds, these funds still would be the preferred option for risk-averse investors. HDFC Prudence fund has been performing well with 59.83% one year CAGR beating its benchmark Crisil Balanced Fund Index which has given 26.47% over the same period as on 31st July’14. Since its inception in 1994 it has provided 18.64% CAGR. So investors can consider investing in HDFC Prudence fund who wish to benefit from both equity and debt segments.
Instruments Indicative Allocation(% of Total Assets) Risk Profile
Minimum MaximumEquities & Equity Related Instruments 40% 75% High
Debt Securities, Money Market Instruments 25% 60% Low to
Medium
Top Ten Company Holdings as on 31st July 14 (%)Company Name (%)
ICICI Bank Ltd. 5.61State Bank of India 4.80Tata Motors - DVR Ordinary 3.26Aurobindo Pharma Ltd. 2.96Procter & Gamble Hygiene & Health Care Ltd. 2.59Larsen & Toubro Ltd. 2.52Crompton Greaves Ltd. 2.28Aarti Industries Ltd. 2.16Info Edge (India) Ltd. 2.06
Investment ObjectiveThe investment objectives of the scheme is to achieve long term capital appreciation by investing predominantly in equity & equity related instruments of mid size companies. The focus of the fund would be to invest in relatively larger companies within this category.The Scheme will aim to generate capital appreciation through an actively managed diversified portfolio of primarily larger midcap companies. Larger mid-cap companies have established track records along with experienced management teams, larger market shares, stronger name recognition and global exposure. The portfolio will be built using a bottom-up approach focusing on appreciation potential of individual stocks from a fundamental perspective. The scheme by investing will be utilizing a holistic risk management strategy with endavour to manage risks associated with investing in equity markets. The scheme will identify the strong growth companies and take advantage of their future appreciation.
32 Investime AUGUST 2014
ProductNote
ABMML Research
FUND SPOTLIGHT
HDFC PRUDENCE FUND (AN OPEN-ENDED BALANCED FUND)
Source: ACEMF
Source: ACEMF

Performance vis-à-vis benchmarkScheme Name HDFC Prudence Fund (G) Crisil Balanced FUnd IndexCAGR (%)June 30, 2013 to June 30, 2014 51.39 20.99June 30, 2012 to June 30, 2013 4.23 10.91June 30, 2011 to June 30, 2012 -1.55 -0.98Since Inception till June 30, 2014 18.82 -Value of Investment of INR 10,000 if invested fromJune 30, 2013 to June 30, 2014 15,139 12,099June 30, 2012 to June 30, 2013 10,423 11,091June 30, 2011 to June 30, 2012 9,845 9,902Since Inception till June 30, 2014 10,000 -
AUGUST 2014 Investime 33
SIP returns if R5,000 is invested every month for
No of Years Total No of Installments
Total Amount Invested
HDFC Prudence Fund (G)
Crisil Balanced Fund Index
1 Year 12 60,000 69,107 78,9822 Year 24 1,20,000 1,44,730 1,67,5953 Year 36 1,80,000 2,29,658 2,64,800
Top Ten Industry Allocation as on 31st July 14 (%)
Risk Suitability
Product Labeling
(BROWN) investors understand that their principal will be at high risk
(BLUE) investors understand that theirprincipal will be at low risk
(YELLOW) investors understand that their principal will be at medium risk
This product is suitable for investors seeking:
Investors should consult their financial advisers if in doubt about whether the product is suitable for them.Note: Risk is represented as:
Engineering - Construction
Unspecified
16.75
14.39
8.19
6.13
4.10
4.01
3.29
3.29
3.26
2.77
Mutual Fund Wealth Guard Wealth Keeper Wealth Builder Wealth Enhancer Wealth MultiplierY Y Y Y Y
Source: ACEMF
Source: ACEMF
Source: ACEMF
Source: ACEMF

RELIANCE SMALL CAP FUND (AN OPEN-ENDED DIVERSIFIED EQUITY FUND)Small Cap funds generally invest in small cap stocks which normally have a faster growth potential; giving a strong competitive advantage over its peers. These funds generally have high beta therefore carry higher volatility high risk. These funds have actively managed portfolios. Fund managers chose those small cap stocks based on their growth potential, macroeconomic factors, respective industry, etc. Small cap funds tend to experience more volatility compared to large cap funds as the churning of the portfolio would be more dynamic. So, small cap funds should be considered by those investors who would be comfortable with the volatility that these funds would bring into their portfolios. 1 year CAGR returns for S&P BSE SMALL-CAP index has been 88.09% whereas S&P BSE MID-CAP, CNX Nifty Index has given 65.76% and 34.47% respectively as on 31st July’14. Reliance Small cap fund has been exceptionally performing well with 113.36% one year CAGR as on 31st July’14. Since its inception in 2010 it has provided 17.82% CAGR. So investors can consider investing in Reliance Small cap fund with an exposure not more than 10% of their investment portfolios and with 4-5 years investment horizon.
Fund DetailsInception Date: 21st Sept, 2010Portfolio Manager: Mr. Sunil SinghaniaQuarterly Avg. AUM (June-14): 5, 66.21(Cr)Benchmark: S&P BSE Small Cap Index Exit Load: 2% on or before 12M,1% after12M but on or before 24M,Nil after 24M.
Fund Manager Profile:Mr. Sunil SinghaniaMr. Sunil Singhania has over 17 years of experience in capital markets. Prior to joining Reliance Capital Asset Management Company, he worked with Advani Share Broker Pvt Ltd as a director Institutional Sales & Research, Equity Derivatives.
Instruments Indicative Allocation Risk ProfileMinimum Maximum
Equities & Equity Related Instruments 65% 100% High
Debt Securities, Money Market Instruments 0% 35% Low
Top Ten Company Holdings as on 31st July 14 (%)Company Name (%)
Andhra Bank 14.82Atul Ltd. 5.63CBLO 3.39Ceat Ltd. 2.84Cyient Ltd. 2.59LG Balakrishnan & Brothers Ltd. 4.59Orient Cement Ltd. 2.79Polyplex Corporation Ltd. 2.53Styrolution ABS (India) Ltd. 2.56TVS Motor Company Ltd. 3.51
Investment ObjectiveThe primary investment objective of the fund is to generate long term capital appreciation by investing predominantly equity and equity related instruments of small cap companies and the secondary objective of the fund is to generate consistent return by investing in debt and money market securities. The fund follows a high risk/ high return strategy. The fund focuses on growth with reasonable size and quality management. It aims to benefit from the changes of management, leadership and government policies. It invests in fundamentally good companies that trade attractive valuation juxtaposed against macroeconomic environment. As a risk diversion the fund has investments in non small cap stocks and maintains well diversified portfolio.Performance vis-à-vis benchmark
Scheme Name HDFC Prudence Fund (G) Crisil Balanced FUnd IndexCAGR (%)June 30, 2013 to June 30, 2014 108.78 80.21June 30, 2012 to June 30, 2013 -1.00 -13.79June 30, 2011 to June 30, 2012 -4.39 -19.77Value of Investment of INR 10,000 if invested fromJune 30, 2013 to June 30, 2014 20,878 8,621June 30, 2012 to June 30, 2013 9,900 8,023June 30, 2011 to June 30, 2012 9,561 10,000
34 Investime AUGUST 2014
Source: ACEMF
Source: ACEMF
Source: ACEMF

Product Labeling
(BROWN) investors understand that their principal will be at high risk
(BLUE) investors understand that theirprincipal will be at low risk
(YELLOW) investors understand that their principal will be at medium risk
This product is suitable for investors seeking:
Investors should consult their financial advisers if in doubt about whether the product is suitable for them.Note: Risk is represented as:
SIP returns if R5,000 is invested every month for
No of Years Total No of Installments
Total Amount Invested
HDFC Prudence Fund (G)
Crisil Balanced Fund Index
1 Year 12 60,000 91,893 87,7202 Year 24 1,20,000 2,06,168 1,81,3083 Year 36 1,80,000 2,06,168 2,72,848
Top Ten Industry Allocation as on 31st July 14 (%)
Risk Suitability
Mutual Fund Wealth Guard Wealth Keeper Wealth Builder Wealth Enhancer Wealth MultiplierY Y Y Y Y
Source: ACEMF
Source: ACEMF
Source: ACEMF

36 Investime AUGUST 2014
Arbi
trag
e Fu
nds
Com
pari
son
( Per
form
ance
det
ails
as
of 3
1st J
uly
2014
)
Sour
ce: A
CEM
F
Sche
me
Nam
eIC
ICI P
ru
Blen
ded-
A-Re
g(G)
ICIC
I Pru
Equ
ity-
Arbi
trag
e Fu
nd-R
eg(G
)
IDFC
Ar
bitr
age
Fund
-Reg
(G)
Kota
k Eq
uity
Ar
bitr
age
Sche
me(
G)
Relia
nce
Arb
itrag
e Ad
vant
age
Fund
(G)
SBI A
rbitr
age
Opp
ortu
nitie
s Fu
nd-
Reg(
G)
Cris
il Li
quid
Fu
nd In
dex
Fund
Man
ager
Kayz
ad E
ghlim
&
Man
ish
Bant
hia
Kayz
ad E
ghlim
&
Man
ish
Bant
hia
Yogi
k Pi
tti
Dee
pak
Gupt
aKr
isha
n D
aga
Nee
raj K
umar
Qua
terly
AAU
M (R
Crs
.)
June
-201
451
955
81,
333
1,09
122
911
4
CAGR
(%)
June
30,
201
3 to
June
30,
20
149.
389.
499.
429.
408.
649.
079.
64
June
30,
201
2 to
June
30,
20
139.
789.
858.
478.
969.
628.
338.
14
June
30,
201
1 to
June
30,
20
128.
768.
259.
168.
829.
369.
418.
68
Sinc
e In
cept
ion
till J
une
30,
2014
7.96
8.15
7.51
7.85
9.18
7.83
-
Valu
e of
Inve
stm
ent o
f IN
R 10
,000
if i
nves
ted
from
June
30,
201
3 to
June
30,
20
1410
,938
10
,949
10
,942
10
,940
10
,864
10
,907
10
,964
June
30,
201
2 to
June
30,
20
1310
,978
10
,985
10
,847
10
,896
10
,962
10
,833
10
,814
June
30,
201
1 to
June
30,
20
1210
,876
10
,825
10
,916
10
,882
10
,936
10
,941
10
,868
Sinc
e In
cept
ion
till J
une
30,
2014
20,0
60
17,9
98
17,2
44
19,3
82
13,8
55
17,8
20
-
Ince
ptio
n D
ate
31-M
ay-0
530
-Dec
-06
21-D
ec-0
629
-Sep
-05
14-O
ct-1
03-
Nov
-06
Exit
Load
0.50
% o
n or
be
fore
3M
0.50
% o
n or
bef
ore
3M0.
25%
on
or
befo
re 3
M0.
50%
on
or
befo
re 9
0D1%
on
or b
efor
e 1M
, N
il af
ter 1
M0.
25%
on
or b
efor
e 7D
, N
il-af
ter 7
D

AUGUST 2014 Investime 37
Bala
nced
Fun
ds C
ompa
riso
n ( P
erfo
rman
ce d
etai
ls a
s of
31s
t Jul
y 20
14 )
Sour
ce: A
CEM
F
BALA
NCE
DPa
rtic
ular
s
Sche
me
Nam
eBe
nchm
ark
Birl
a SL
‘95
Fund
(G)
HD
FC B
alan
ced
Fund
(G)
HD
FC
Prud
ence
Fu
nd(G
)
ICIC
I Pru
Ba
lanc
ed F
und-
Reg(
G)
Relia
nce
Reg
Savi
ngs
Fund
-Bal
ance
d Pl
an(G
)
Tata
Bal
ance
d Fu
nd(G
)Cr
isil
Bala
nced
Fu
nd In
dex
Fund
Man
ager
Mah
esh
Pati
l &
Pras
ad D
hond
eCh
irag
Set
alva
d &
Rak
esh
Vyas
Pras
hant
Jain
&
Rak
esh
Vyas
Yoge
sh B
hatt
&
Man
ish
Bant
hia
Sanj
ay P
arek
h &
Am
it T
ripa
thi
Atul
Bho
le &
S.
Rag
hupa
thi.
Arch
arya
-
Qua
terl
y AA
UM
(RCr
s.) J
une-
2014
736
1,50
35,
834
777
571
649
-
CAG
R (%
)
June
30,
201
3 to
June
30,
201
437
.46
49.2
751
.39
40.9
638
.99
39.7
720
.99
June
30,
201
2 to
June
30,
201
310
.99
4.25
4.23
13.6
27.
3711
.23
10.9
1
June
30,
201
1 to
June
30,
201
2-3
.14
1.10
-1.5
52.
211.
302.
36-0
.98
Sinc
e In
cept
ion
till
June
30,
20
1421
.90
17.3
218
.82
15.0
214
.32
16.7
9-
Valu
e of
Inve
stm
ent o
f IN
R 10
,000
if i
nves
ted
from
June
30,
201
3 to
June
30,
201
413
,746
14
,927
15
,139
14
,096
13
,899
13
,977
12
,099
June
30,
201
2 to
June
30,
201
311
,099
10
,425
10
,423
11
,362
10
,737
11
,123
11
,091
June
30,
201
1 to
June
30,
201
29,
686
10,1
10
9,84
5 10
,221
10
,130
10
,236
9,
902
Sinc
e In
cept
ion
till
June
30,
20
1446
6,01
7 90
,771
33
8,09
4 77
,860
33
,633
18
3,17
1 -
Ince
ptio
n D
ate
10-F
eb-9
511
-Sep
-00
1-Fe
b-94
3-N
ov-9
910
-Jun
-05
8-O
ct-9
5-
Exit
Loa
d1%
on
or b
efor
e 1Y
, Nil
on o
r aft
er
1Y
1% o
n or
bef
ore
18M
, Nil
afte
r 18
M
1% o
n or
be
fore
1Y,
Nil-
Afte
r 1Y
1% o
n or
bef
ore
12M
,Nil
afte
r 12
M
1% O
n or
Bef
ore
1Y,
Nil
Afte
r 1Y
1% o
n or
bef
ore
540D
, Nil
afte
r 54
0D-
Expo
sure
(%)
Deb
t19
.22
25.8
424
.73
23.2
521
.78
22.2
4-
Equi
ty70
.74
67.1
170
.58
70.4
573
.96
73.8
5-
Cash
& E
quiv
alen
t10
.04
7.05
4.69
6.31
4.26
3.91
-

Feature
Reduce your net tax liability with the help of the Income Tax Act that allows the taxpayer, under certain conditions, to set off loss against income. And the balance, if any, can even be carried forward for set off in the future years thus optimizing your tax return
This month’s article examines an important yet often overlooked aspect of the tax return filing
process – the adjustment of losses. The Income Tax Act allows the taxpayer under certain conditions to set off loss against income thereby reducing the net tax liability. If such loss cannot be fully set off, the balance remaining can even be carried forward for set off in the future years. It is necessary for every taxpayer to properly understand and take advantage of the facilities in this regard as this will enable the tax return to be optimized for minimum tax payment.
Inter-Source AdjustmentThere are five heads of income under which any taxpayer can earn income. These are Salary, House Property, Income from Business or Profession, Capital Gains and the residuary Income from Other Sources. Now, by definition, there cannot be a loss from Salary and Income from Other Sources. However, a person could suffer losses from other heads of income. Now the first and foremost rule is that loss under one head of income has to be first adjusted against any income from the same head. This is known as Inter-Source adjustment. For example,
say someone who has two different businesses, one that is loss making and the other one profit making, then the loss from the first one can be set off against the profit from the second one. Or say if you have two properties, one for self-occupation and the other one given out on rent, then the loss from the first property (on account of the mortgage interest) can be set off against the rental income from the second property. The only exception in this regard is to do with long-term capital gains which we shall examine later on in the article.
Inter-Head AdjustmentNow say after setting off the loss as above, there still remains some balance. This balance loss can then be set off against income from other heads. This is known as Inter-Head adjustment. For example, a taxpayer who has a single self-occupied house property bought on mortgage will necessarily show a loss. This is because the Annual Value of a single self-occupied property is taken to be nil and the adjustment of any interest will result in a negative value. Now, such a loss may be adjusted against salary income or say income from business, if any. There are two exceptions to the rule of Inter Head Adjustment:
Losses under Capital Gains cannot
38 Investime AUGUST 2014
TREATMENT OF LOSSES While Filing Tax Return
A N Shanbhag & Sandeep Shanbhag

is exempted. In other words, loss of profits must be a loss of taxable profits.
The following example explains the above provisions
Now, LTCL from shares cannot be set off since the LTCG from this source (in this case R60,000) is exempted. The LTCL from non-equity MFs of R25,000 can only be adjusted against the LTCG from sale of gold. Therefore, only R15,000 can be
adjusted and the balance R10,000 will be non-adjustable. Lastly, the R40,000 STCL from sale of shares can be adjusted against the R50,000 STCG and only the balance R10,000 STCG would be taxable.
Also, please note that for being eligible to carry forward and set-off any loss, it is important to file the tax return by the specified due date. If the loss return is submitted after the due date, the Board may condone the delay only if it is satisfied that it was due to genuine hardship on the part of the taxpayer (Circular No.8/2001 dtd. 16/5/2001).
(This author publishes articles regularly in INVESTIME)
be set off against income from any other head.Loss from business or profession cannot be setoff against salary income.
Carry Forward of LossesAnd last but not the least, any loss that cannot be set off either against the same head or under other heads because of inadequacy of income, may be carried forward to be set off against income of the subsequent year. Such a carry forward exercise may be done for 8 years. After 8 years, if the loss hasn’t yet been fully set off, it has to be written off and cannot be used for tax saving. The important point to note is that for carry-forward losses, only Inter-Source adjustment is available
in the subsequent years and not the Inter-Head one. The following Table encapsulates the above discussion.
Adjustment of Loss under the head Capital GainsThe first and foremost point to note about losses under the head Capital Gains is that they have a boundary i.e. they have to be adjusted against
other capital gain income only and other incomes are not available for the setting off. In other words, the Inter-Head adjustment referred to earlier is not available in the case of capital losses.
The second condition in this regard is that long-term capital loss can only be adjusted against long-term capital gain. Or putting it differently, short-term capital gain may not be used to set off any long-term capital loss. However, short-term capital loss can be set off against any taxable long-term capital gain or short-term capital gain.
In a nutshell, long-term capital loss adjustment can be only done against long-term capital gains whereas short-term capital loss adjustment can
be against any capital gains, long-term or short-term.
Lastly, if the income from a particular source is exempted from tax, loss from such a source cannot be set off. Which means, any long-term loss on sale of shares or equity oriented mutual funds cannot be set off at all as the long-term gain from the sale of these instruments
AUGUST 2014 Investime 39
“ “LOSSES THAT CANNOT BE SET OFF BECAUSE OF INADEQUACY OF INCOME MAY BE CARRIED FORWARD TO BE SET OFF AGAINST INCOME FROM A
SUBSEQUENT YEAR. AFTER 8 YEARS, IF THE LOSS HASN’T YET BEEN FULLY SET OFF, IT HAS TO BE WRITTEN OFF AND CANNOT BE USED FOR TAX SAVING
Type of loss to be carried forward to subsequent year(s)
Income against which carried forward loss can be set
off in next year(s)
For how many years loss can be carried forward
1. House Property Loss Income under the head “Income from house property”
8 years
2. Business Loss Any Business Profit 8 years3. Capital Loss a) Short-term capital loss b) Long-term capital loss
Any taxable income under the head “Capital gains”
Long-term capital gains only
8 years
8 years
LTCL from shares R20,000LTCG from equity MFs R60,000STCL from shares R40,000LTCL from non-equity MFs R25,000STCG from sale of shares R50,000LTCG from sale of gold R15,000

Is your EMERGENCY FUND ready?
Feature
Our goals and other financial dreams are important — but when an adversity hits us, we tend to put out our savings into action to handle the emergency at the cost of our goals
Ananth Sandeep Sundur
generally slip out of our mind when we think of saving.
Our goals and other financial dreams are important — but when an adversity hits us, we tend to put out our savings into action to handle the emergency at the cost of our goals.
We as Indians know how to save — we try and stick to budgets, sacrifice our
current wants for future security. We save for various purposes — children’s education, retirement, children’s marriage, buying a home etc.
To get these savings to work for us, we investigate various investment avenues and meet financial advisors to make our hard earned and saved money work for us. But how many of us save for any emergency requirements? Emergencies
40 Investime AUGUST 2014

certain amount every month, till he reaches the amount (R3,36,000).
But does this mean he should save his entire surplus for emergency requirement. Again the answer is no. He needs to divide this surplus for saving towards various goals, but the concentration should be more of saving for emergencies. Once he attains the required emergency fund as discussed above, he can then concentrate more on other goals.
What about medical emergencies?While emergency fund is critical, insurance is another factor one cannot ignore. When we talk about insurance — it is important to have the priorities right. Medical
insurance is top priority, followed by health insurance and then life insurance. The general conception is to look at life insurance as everything — but think about it. If you can have adequate arrangements to pay for the best medical treatments, your life is much more secure and healthy. Hence, while life insurance is important, focus on medical insurance first, so as to ensure immediate cashless treatment in times of emergency.
What to do with our emergency funds?An emergency fund left idle in a bank account is no better than a normal savings account. Leveraging the emergency funds is what we need to aim for. How about investing it in the right avenues? You say —
“Why an emergency fund, if it is not available?” Let us rephrase — How about investing the emergency fund in avenues which allow one to get it back in a day’s time, without much hassle and no exit loads? Liquid funds, short term FDs and ultra short term funds are some options, wherein getting the investments back can be just a day’s job, ensuring you have the money in any emergency when needed. Liquid Mutual Funds may give better returns than Fixed Deposits and there is always the flexibility of easy withdrawal.
The perfect planHow does one go about streamlining all of the above? You can start with an easy approach.
The day your salary hits your account, have a part of it transferred to an account dedicated to emergency fund, a part to an investment account, and a part to an expenses account.
segregated into three clear compartments, and it is easier to keep a tab on your money and manage it with more ease It is always advisable to be
planned and ready to face any monetary emergency during adverse situations though prudent savings and investments.
(The author is a member of the ABMML Advisory Team)
Worse still, when we run out of these savings, we start piling up the debt burden on us which inevitably puts us into a debt trap.
So, planning for emergency plays an important role and should be in fact the first purpose of saving.
How to plan for emergencies? When one looks at personal finance management, the ideal priority for making the most out of your money should be accumulating emergency fund followed by insurance. An emergency fund is the ready fund available in case of any unforeseen or unexpected situation that demands critical monetary support. Thus it is essential to put a process in place to ensure you have enough for such a scenario.
And how much is enough? The conventional approach is to have about 6 months worth of living expenses saved up in your emergency fund. While there is nothing wrong with this, it is always advisable to keep about six months worth of salary/earning in your emergency fund. While the former strategy takes care of your living expenses, the latter also ensures we do not miss out on other financial obligations such as insurance premiums, investments etc.
Let’s assume Mr. A’s monthly salary is R60,000, with expenses worth R30,000. Taking the six months salary/earning approach, he needs to save R3,36,000, i.e. (six months x R60,000 per month). Having said that, can he save this amount is a single go? Not really. So he needs to keep saving a
“ “AN EMERGENCY FUND LEFT IDLE IN A BANK ACCOUNT IS NO
BETTER THAN A NORMAL SAVINGS ACCOUNT. LEVERAGING THE EMERGENCY FUNDS IS WHAT WE NEED TO AIM FOR
AUGUST 2014 Investime 41

Feature
Higher returns come with higher risk in the normal course. So, a part of the portfolio as a strategy for higher returns and also as a measure of making the portfolio more tax efficient, equity or hybrid funds may be considered
42 Investime AUGUST 2014
MUTUAL FUND ADVISORY
ABMML Research
Debt Investments & Actions Advised (Growth Plans)Category Description Rationale Advised Action
Liquid Funds
Liquid Funds may be invested purely for the purpose of deployment or parking of short-term surplus funds. On account of the higher dividend distribution tax liquid funds have become at par with fixed deposits in terms of the tax status. This is in respect to corporate investors. In case of individual investors falling under the highest tax bracket, there is still a tax advantage of 5.6% on Liquid Fund investments.
Liquid Funds are very convenient to invest in and also redeem as and when fund requirement comes up. This convenience is not available in any other product. So, for short-term parking of funds, Liquid Funds are still preferred.
Liquid Funds may be held on to the extent of the liquidity requirements for the Short-Term. Funds beyond three months may be parked in recommended Arbitrage Funds or Ultra Short-Term Funds. Arbitrage Funds are a tax efficient avenue for investing short-term money. This product may be looked at as an alternative to Liquid Funds to a limited extent.
Ultra Short- Term Funds
Ultra Short-Term Funds are ideal for deployment of short-term surplus funds with time horizon of one to six months. These funds have maturity profile higher than Liquid Funds and may give slightly higher returns than Liquid Funds.
DDT for corporate investors is same as for Liquid Funds. However, in case of individual investors falling under the highest tax bracket, there is still a tax advantage of close to 5.6% on Ultra Short-Term investments. These funds would continue to be relevant as the closest substitute for Liquid Funds with a slightly higher risk-return profile.
Ultra Short-Term Funds may be held on to theextent of the liquidity requirements for the short term. Funds available for three to six months may be parked in recommended Arbitrage Funds as these funds are taxed like Equity Funds but have a risk-return profile of a money market fund.
Arbitrage Funds
Arbitrage Funds may be good for parking temporary surplus for three to six months or a little more. They are tax efficient as they have the same taxation as in case of Equity Funds. So whatever the investor gets in the form of dividend is tax free .
These funds are a good substitute for Liquid Funds but not entirely. These funds have a lock-in of three to six months. Also, by their very nature they may be able to get returns only to the extent where the scope for arbitrage exists, which may be limited.
A third of the Liquid Fund exposure could beshifted to Arbitrage Funds in case of mid-sized portfolios and may be 10% in case of larger portfolios. Arbitrage investments may be held on to till the lock-in period is over and should be continued based on the performance review.
Short-Term Income Funds
Short-Term Income Funds generally tend to invest at the short end of the yield curve (one-to-three year segment). They tend to be volatile in rates and also have a bit of accrual to it.
Short-term rates do move up and come down too in response to the short-term money market conditions. The short-term rates usually peak around the 10 to 10.50% level and the floor has been somewhere close to the 8.50% mark. This presents an opportunity for investors with a liquidity of around six months to a year to move into the money market through short-term funds.
In this case the expectation of softening ofrates within a reasonable time frame and thelikely gains from price movements is the basis of Short-Term Fund exposures. Most Short-Term Funds may now start changing strategy towards relatively higher duration to create alpha which may beat the tax effect. However it is still advisable for investors falling into the lower tax bracket to hold on to their investments to complete the three-year period and benefit from both declining interest rates and indexation of LTCG.
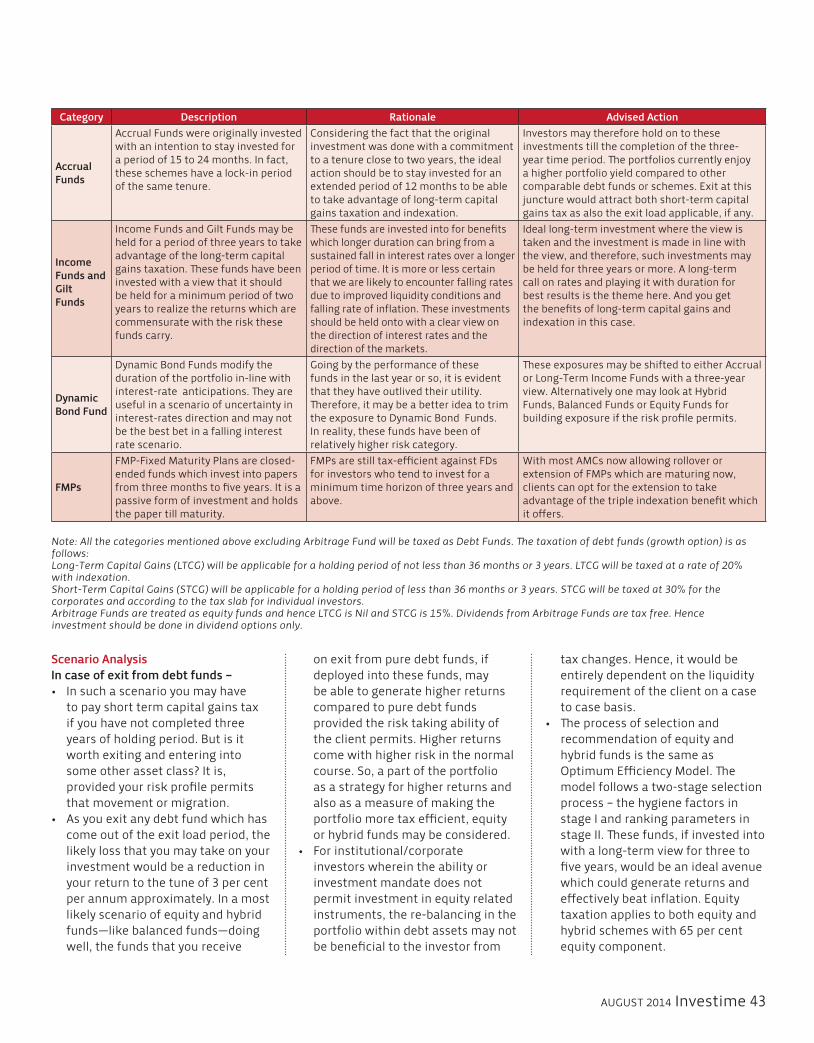
AUGUST 2014 Investime 43
Category Description Rationale Advised Action
Accrual Funds
Accrual Funds were originally invested with an intention to stay invested for a period of 15 to 24 months. In fact, these schemes have a lock-in period of the same tenure.
Considering the fact that the original investment was done with a commitment to a tenure close to two years, the ideal action should be to stay invested for an extended period of 12 months to be able to take advantage of long-term capital gains taxation and indexation.
Investors may therefore hold on to these investments till the completion of the three-year time period. The portfolios currently enjoy a higher portfolio yield compared to other comparable debt funds or schemes. Exit at this juncture would attract both short-term capital gains tax as also the exit load applicable, if any.
Income Funds and GiltFunds
Income Funds and Gilt Funds may be held for a period of three years to take advantage of the long-term capital gains taxation. These funds have been invested with a view that it should be held for a minimum period of two years to realize the returns which are commensurate with the risk these funds carry.
These funds are invested into for benefits which longer duration can bring from a sustained fall in interest rates over a longer period of time. It is more or less certain that we are likely to encounter falling rates due to improved liquidity conditions and falling rate of inflation. These investments should be held onto with a clear view on the direction of interest rates and the direction of the markets.
Ideal long-term investment where the view istaken and the investment is made in line with the view, and therefore, such investments may be held for three years or more. A long-term call on rates and playing it with duration for best results is the theme here. And you get the benefits of long-term capital gains and indexation in this case.
Dynamic Bond Fund
Dynamic Bond Funds modify the duration of the portfolio in-line with interest-rate anticipations. They are useful in a scenario of uncertainty in interest-rates direction and may not be the best bet in a falling interest rate scenario.
Going by the performance of these funds in the last year or so, it is evident that they have outlived their utility. Therefore, it may be a better idea to trim the exposure to Dynamic Bond Funds. In reality, these funds have been of relatively higher risk category.
These exposures may be shifted to either Accrual or Long-Term Income Funds with a three-year view. Alternatively one may look at Hybrid Funds, Balanced Funds or Equity Funds for building exposure if the risk profile permits.
FMPs
FMP-Fixed Maturity Plans are closed-ended funds which invest into papers from three months to five years. It is a passive form of investment and holds the paper till maturity.
FMPs are still tax-efficient against FDs for investors who tend to invest for a minimum time horizon of three years and above.
With most AMCs now allowing rollover or extension of FMPs which are maturing now, clients can opt for the extension to take advantage of the triple indexation benefit which it offers.
Note: All the categories mentioned above excluding Arbitrage Fund will be taxed as Debt Funds. The taxation of debt funds (growth option) is as follows:Long-Term Capital Gains (LTCG) will be applicable for a holding period of not less than 36 months or 3 years. LTCG will be taxed at a rate of 20% with indexation.Short-Term Capital Gains (STCG) will be applicable for a holding period of less than 36 months or 3 years. STCG will be taxed at 30% for the corporates and according to the tax slab for individual investors.Arbitrage Funds are treated as equity funds and hence LTCG is Nil and STCG is 15%. Dividends from Arbitrage Funds are tax free. Hence investment should be done in dividend options only.
Scenario AnalysisIn case of exit from debt funds –
to pay short term capital gains tax if you have not completed three years of holding period. But is it worth exiting and entering into some other asset class? It is, provided your risk profile permits that movement or migration.
come out of the exit load period, the likely loss that you may take on your investment would be a reduction in your return to the tune of 3 per cent per annum approximately. In a most likely scenario of equity and hybrid funds—like balanced funds—doing well, the funds that you receive
on exit from pure debt funds, if deployed into these funds, may be able to generate higher returns compared to pure debt funds provided the risk taking ability of the client permits. Higher returns come with higher risk in the normal course. So, a part of the portfolio as a strategy for higher returns and also as a measure of making the portfolio more tax efficient, equity or hybrid funds may be considered.
investors wherein the ability or investment mandate does not permit investment in equity related instruments, the re-balancing in the portfolio within debt assets may not be beneficial to the investor from
tax changes. Hence, it would be entirely dependent on the liquidity requirement of the client on a case to case basis.
recommendation of equity and hybrid funds is the same as Optimum Efficiency Model. The model follows a two-stage selection process – the hygiene factors in stage I and ranking parameters in stage II. These funds, if invested into with a long-term view for three to five years, would be an ideal avenue which could generate returns and effectively beat inflation. Equity taxation applies to both equity and hybrid schemes with 65 per cent equity component.

Stock of the Month
CCL PRODUCTS LTD
Source: NSE, BSE
Company DataBSE Code 519600NSE Code CCLEquity Capital (r bn) 266Face Value (r) 2Market Cap (r bn) 11.7Avg Daily Volume (Qtly) 742467
52 week H/L (r) 92.2 / 24.1
Source: BSE
Shareholding (%)
Holders Jun 14
Mar 14
Dec 13
Promoters 44.54 44.54 44.52FIIs - - 4.36MFs/Banks & FI’s 9.17 9.60 9.71Public & Others 46.29 45.86 41.41
Source: NSE, ABML Research
Rating CMP Target Upside / Downside%
Buy 91 118 30
Risk Return Matrix
Low
M
ediu
m
Hig
h
Retu
rn
RiskLow Medium High
About Company
tonnes capacity.
Investment Arguments
Vietnam operations will aid in volume growth and margin expansion: CCL Products has commercialised
Foray into branded business in India:
reach R38 Billion by 2017 (Source: Company). Insignificant capex, lean balance sheet and enhancement of utilisation of existing assets will drive
Return ratiosR150-R
R
Negligible risk of volatility in coffee bean prices and currency volatility:
R R2.7 bn. Valuations and Outlook: R
Risk Factor:
and consistent track record.
44 Investime
Chart: CCL vs Sensex
Source: ABML Research, Capitaline

ARBITRAGE FUNDSScheme Name Risk ColourHDFC Arbitrage Fund(G) Medium Risk YellowICICI Prudential Blended - A(G) High Risk BrownICICI Prudential Equity Arbitrage Fund(G) High Risk BrownIDFC Arbitrage Fund(G) Low Risk BlueKotak Equity Arbitrage Scheme(G) Low Risk BlueReliance Arbitrage Advantage Fund(G) Low Risk BlueSBI Arbitrage Opportunties Fund(G) High Risk Brown
INCOME FUNDSScheme Name Risk ColourBirla SL Income Plus(G) Medium Risk YellowCanara Rob Income-Reg(G) Low Risk BlueDSPBR Strategic Bond-Reg(G) Low Risk BlueICICI Pru Income Opportunities Fund(G) Low Risk BlueIDFC SSIF-Invest-Reg(G) Low Risk BlueKotak Bond Fund - Plan A(G) Low Risk BlueReliance Income(G) Low Risk BlueTata Income Fund(G) Medium Risk YellowTempleton India IBA-A(G) Low Risk BlueUTI Bond Fund(G) Low Risk Blue
GILT FUNDSScheme Name Risk ColourBirla SL G-Sec-LT(G) Low Risk BlueDWS Gilt Fund-Reg(G) Low Risk BlueHDFC Gilt-Long Term Plan(G) Low Risk BlueICICI Pru Gilt-Invest-PF-Reg Low Risk BlueICICI Pru Long Term Gilt Fund-Reg(G) Low Risk BlueIDFC G Sec-Invest-Reg(G) Low Risk BlueKotak Gilt-Invest-Reg(G) Low Risk BlueReliance Gilt Securities Fund(G) Low Risk BlueSBI Magnum Gilt-LTP-Reg(G) Low Risk BlueUTI Gilt Adv-LTP(G) Low Risk Blue
PRODUCT LABELLINGInvestimeSnap shots
AUGUST 2014 Investime 45
SHORT TERM FUNDSScheme Name Risk ColourAxis Short Term Fund(G) Low Risk BlueBirla SL Short Term Fund(G) Low Risk BlueBirla SL ST Opportunities Fund(G) Medium Risk YellowDWS Short Maturity Fund(G) Low Risk BlueHDFC STP(G) Low Risk BlueHSBC Income-Short Term Plan(G) Low Risk BlueICICI Pru Short Term Plan-Reg(G) Low Risk BlueJPMorgan India ST Income(G) Low Risk BlueKotak Bond-STP(G) Low Risk BlueL&T Short Term Opportunities Fund(G) Low Risk BluePineBridge India Short Term Fund(G) Low Risk BlueReliance STF(G) Low Risk BlueReligare Invesco Short Term Fund(G) Low Risk BlueSBI Short Term Debt Fund-Ret(G) Low Risk BlueTata ST Bond(G) Medium Risk YellowTempleton India ST Income Plan(G) Low Risk BlueUTI ST Income-Reg(G) Low Risk Blue
Note: Risk is repesented as:(Blue) investors understand that their principal will be at low risk “This product is suitable for investors who are seeking for income with capital growth over short term.”
(Yellow) investors understand that their principal will be at medium risk “This product is suitable for investors who are seeking income with capital growth over medium to long term.”
(Brown) investors understand that their principal will be at high risk “This product is suitable for investors who are seeking long term capital growth.”
*Investors should consult their investment advisors if in doubt about the suitability of the product for their respective risk profiles.
LARGE CAP FUNDSScheme Name Risk ColourAxis Equity Fund(G) High Risk BrownBirla SL Frontline Equity Fund(G) High Risk BrownBirla SL Top 100 Fund(G) High Risk BrownCanara Rob Eq Diver Fund-Reg(G) High Risk BrownFranklin India Bluechip Fund(G) High Risk BrownFranklin India High Growth Cos Fund(G) High Risk BrownHDFC Top 200 Fund(G) High Risk BrownICICI Pru Focused BlueChip Eq Fund-Reg(G) High Risk BrownICICI Pru Top 100 Fund(G) High Risk BrownKotak Select Focus Fund(G) High Risk BrownL&T India Large Cap Fund(G) High Risk BrownReliance Focused Largecap Fund(G) High Risk BrownSBI BlueChip Fund-Reg(G) High Risk BrownTata Pure Equity Fund(G) High Risk BrownUTI Equity Fund(G) High Risk Brown
ACCRUAL FUNDSScheme Name Risk ColourBirla SL Medium Term Fund (G) Medium Risk YellowDWS Premier Bond Fund - Reg (G) Low Risk BlueHDFC Corporate Debt Opportunties Fund (G) Medium Risk YellowHDFC Medium Term Opportunties Fund (G) Low Risk BlueICICI Pru Regular Savings (G) Low Risk BlueKotak Medium Term Fund(G) Low Risk BlueReliance Reg Savings Fund - Debt Plan (G) Low Risk BlueTempleton India Corporate Bond Opportunities Fund (G) Medium Risk YellowTempleton India Income Opportunties Fund (G) Low Risk Blue
BALANCED FUNDSScheme Name Risk ColourBirla SL '95 Fund(G) High Risk BrownFT India Balanced Fund(G) High Risk BrownHDFC Balanced Fund(G) High Risk BrownICICI Pru Balanced Fund-Reg(G) High Risk BrownReliance Reg Savings Fund - Balanced Plan(G) High Risk BrownTata Balanced Fund(G) High Risk BrownELSSScheme Name Risk ColourBirla SL Tax Plan(G) High Risk BrownFranklin India Taxshield(G) High Risk BrownHDFC Long Term Adv Fund(G) High Risk BrownHSBC Tax Saver Equity Fund(G) High Risk BrownICICI Pru Tax Plan(G) High Risk BrownL&T Tax Advt Fund(G) High Risk BrownReliance Tax Saver (ELSS) Fund(G) High Risk BrownUTI LT Adv Fund-II(G) High Risk Brown
THEMATIC/SECTOR FUNDSScheme Name Risk ColourBirla SL Dividend Yield Plus(G) High Risk BrownBirla SL India GenNext Fund(G) High Risk BrownBirla SL MNC Fund(G) High Risk BrownHDFC Infrastructure Fund(G) High Risk BrownICICI Pru FMCG Fund-Reg(G) High Risk BrownReliance Banking Fund(G) High Risk BrownReliance Pharma Fund(G) High Risk BrownSBI Pharma Fund-Reg(D) High Risk BrownTata Dividend Yield Fund(G) High Risk BrownUTI Banking Sector Fund(G) High Risk BrownUTI Dividend Yield Fund(G) High Risk Brown
OPPORTUNITY FUNDSScheme Name Risk ColourDSPBR Opportunities Fund-Reg(G) High Risk BrownFranklin India Opportunities Fund(G) High Risk BrownHDFC Mid-Cap Opportunities Fund(G) High Risk BrownHSBC India Opportunties Fund (G) High Risk BrownKotak Opportunities Fund(G) High Risk BrownMirae Asset India Opportunities Fund-Reg(G) High Risk BrownReliance Equity Opportunities Fund(G) High Risk BrownTata Equity Opportunities Fund(G) High Risk BrownUTI Opportunities Fund(G) High Risk Brown
MID CAP FUNDSScheme Name Risk ColourAxis Midcap Fund(G) High Risk BrownDSPBR Small&Mid-Cap Fund(G) High Risk BrownFranklin India Prima Fund(G) High Risk BrownFranklin India Smaller Cos Fund(G) High Risk BrownICICI Pru Dynamic Plan (G) High Risk BrownICICI Pru Value Discovery Fund-Reg(G) High Risk BrownIDFC Premier Equity Fund-Reg(G) High Risk BrownIDFC Sterling Equity Fund-Reg(G) High Risk BrownKotak Midcap Scheme(G) High Risk BrownReliance SmallCap Fund(G) High Risk BrownSundaram Select Midcap(G) High Risk BrownUTI MidCap Fund(G) High Risk Brown

OUR BRANCHES
ANDHRA PRADESHHyderabad 6-3-649/8, Nalanda Complex 1st Floor, Amruth Estates Somajiguda, Hyderabad - 500082, Andhra Pradesh, IndiaTel: 040-30567000/7001/2/3/4/5KadappaDoor No. 20/366, Ground Floor, Krishna Circle, Mastaovali Street, Kadappa - 516001, Andhra Pradesh, IndiaTel: 08562-301163/301164/65/66/67Manchirial - Kakani Complex7-10 To 7-14, First Floor Kakani Complex, Opp Rx Enterprises, Ganga Reddy Road, Manchirial - 504208, Andhra Pradesh, IndiaTel: 08736-325600, 08736-325605, 08736-325707Nandyal - Nagalakunta Road2-418/B, Nagulakunta Road, Nandyal, Nandyal - 518501, Andhra Pradesh, IndiaTel: 08514-324930, 08514-324931Secunderabad - BegumpetNo. 1-8-449, First Floor, Opp To Police Line, Fibrolite Building, Above Dhl Courier, Begumpet, Secunderabad - 500003, Andhra Pradesh, IndiaTel: 4032511833, 040-30878949/50/51/52 53/54/55/56/57/58/59/60/61/62/63Warangal - Station RoadDoor No. 8-3-99/1, 1st Floor, Near Warangal Chourastha, Station Road, Warangal – 506002, Andhra Pradesh, IndiaTel: 0870-3203110, 9346211354, 0870-3058200/01/02/03/04Markapur - Nehru BazarNo. 7/273, Y. S. R. Complex, 1st Floor, Nehru Bazar, Markapur, Prakasam Dt, Andhra Pradesh – 523 316, IndiaTel: 08596-222610/11 (BSNL)Nellore - Sunday MarketD/No. 16/230, E Block, II Floor, Kaizen Heights, Subrahmanyeswara Swami Temple Road, Sunday Market, Gandhi Nagar, Nellore – 524 001, Andhra Pradesh, India Tel: 0861-3205641/42/43/44,0861-3051000, 0861-3051001, 0861-3051002, 0861-3051003, 0861-3051004Ongole - Kurnool road2nd Floor, Vasu Plaza, near Addanki bus stand, Kurnool road, Ongole – 523002, Andhra Pradesh, IndiaTel: 08592-320730, 08592-324965/66/67Anakapalle - KVR ComplexNo. 12-1-70, KVR Complex, Opp Rama, Chandra Home Appliance Main Road, Anakapalle – 531001, Andhra Pradesh, India Tel: 08924-329978, 08924-326202Gudivada - Eluru RoadNenis Plaza Door No. 11/218, Eluru Road, Opp Gopalakrishna Theatre, Gudivada – 521301, Andhra Pradesh, IndiaTel: 08674-301101/02/03/04/05Kakinada - Jawahar StreetDoor No. 21-1-3, 1st Floor, Above Popular Automobiles, Jawahar Street, Kakinada – 533001, Andhra Pradesh, IndiaTel: 0884-3293835/3294303/3299383Ponnur - Opp Tenali Bus StopD.No. 17-4-4F, Netajinagar, Opp. To Tenali Bus Stop, Main Road Nidubrolu, Ponnur – 522124, Andhra Pradesh, IndiaTel: 0864-3320038/39Rajahmundry - Gangaiah ColonyDr. Gangaiah Colony, Door No. 8-24-122, 1st Floor, Main Road, Rajahmundry – 533101, Andhra Pradesh, India
Tel: 0883-3291124, 0883-3042840/841/842/843/844Vijayawada - Labbipet39-9-1 Sailok Complex, M.G. Road, Labbipet, Vijayawada – 520010, Andhra Pradesh, IndiaTel: 0866-3297565, 0866-3297590,0866-3058230/31/32/33/34Vishakapatnam - Old GajuwakaDoor No. 7-15-19, 1st Floor, Appanna Complex, N H -5 Road, Old Gajuwaka, Vishakapatnam – 530026, Andhra Pradesh, IndiaTel: 0891-3298668, 0891-3299657,0891-3082400/01/02/03/04Vishakapatnam - Siripuram1st Floor Praveen Plaza, Vip Road Near Tycoon Heritage Hotel, C.B.M. Compound Siripuram, Visakhapatnam - 530003, Andhra Pradesh, IndiaTel: 0891-3082450/51/52/53/54Vizianagaram - Mayuri JunctionShop No. G - 1, Sai Durga Commercial Complex, Near Mayuri Junction, Railway Station Road, Vizianagaram - 535002, Andhra Pradesh, IndiaTel: 08922-329486, 08922-329516Secunderabad - S.P Road4th Floor, May Fair Complex, S. P. Road, Secunderabad 500003Tel: 040-44175701-57 -(Airtel)
BIHAR Patna - Boring RoadMaa Sharda Complex, East Boring Canal Road, GPO, Post Office, Patna - 800001, BiharTel: 0612-3203936, 0612-3204633 , 0612-3207230, 0612-3264447, 0612-3265517
CHATTISGARH Bhilai - Civic CentreShop No. 132, New Civic Center, Bhilai, Bhilai - 490006, Chhatisgarh, IndiaTel: 0788-3293223, 0788-3299480, 0788-3299520Bilaspur - Jain PlazaShop No. 319, Jain Plaza, Cmd Chowk Link Road, Bilaspur - 495001, Chhatisgarh, IndiaTel: 07752-326100,07752-326393326399Korba - S. S. PlazaFA - 9, S. S. Plaza, Power House Road, Korba - 495677, Chhatisgarh, IndiaTel: 07759-321990Raipur - Banstal RoadNo. 8 & 9, 3rd Floor, Milliennium Plaza, Banstal Road, Raipur - 492001, Chhatisgarh, IndiaTel: 7713294806, 7713296197/96287/96289
DELHI Delhi - Mayur ViharP-17, I Floor, Pandav Nagar, Mayur Vihar, Phase I, Delhi - 110 091Tel: 011-32227408, 32227411/12/13, 011-30273590/91/92/93/94/95 to 99Delhi-DwarkaT-10, HL Square, Plot No.6, Sec- 5, Dwarka - 110 075Tel: 011-32227418/19011-30273565, 011-30273566/67/68/69 Delhi - Rajindra PalaceNo. 202, 7 - Sethi Bhawan, Rajindra Place, New Delhi - 110008, Delhi, IndiaTel: 011-30273455/56/57/58/59, 011-30273653, 1132553261, 1132094442,1132092888,1132094277
Gurgaon - M. G. RoadNo.403-A, JMD Regent Plaza, M. G. Road, Gurgaon, Delhi, IndiaTel: 0124-4983250 (Airtel PRI Connection)Delhi - Pitampura311, 3rd Floor, A-9, Northex Tower, Pitampura, Delhi -110034Delhi - Defence Colony (1st Floor)A -270, 1st Floor, Defence Colony, New Delhi – 110024Tel: 011-43363500/46204400 - (Airtel)
GUJARAT Ahmedabad - Navrangpura1/B, Ravish Complex, 2nd Floor, Opp. Kiran Motors, Swasthik Cross Road, Navrangpura, Ahmedabad - 380009, Gujarat, IndiaTel: 7932511654,7932513074,7932513290,7932513292,7932513303,7932513325, 079-30487104,079-30487105/06/07 to 16 Ahmedabad - ManinagarFF/ 06 - 07, Shivani Avenue Opp. AMCO Bank, Jawahar Chowk Cross Road Maninagar, Ahmedabad - 380008, Gujarat, India7932205010/11/12,7932204705/06, 7932920390, 7932457469, 7932457470, 7932440035, 7932511654, 079-32204706, 079-32442278, 079-32440035, 079-32528223, 079-32457467Ahmedabad - Vastrapur - Mansi CircleNo. 20, G. F. Sunrise Complex, Mansi Cross Roads, Satellite, Ahmedabad - 380 015Tel: 079-32211259/60Ahmedabad - Arya Arcade 202, 2nd Floor, Aarya Arcade, Next to Crossword, Mithakali Six Road, Navrangpura, Ahmedabad-380009Tel: 7932456419, 079-40276000-30 (Airtel)Anand - Near Grid (Recently Shifted)304 – 305, Madhav Complex, Near Grid Crossing, Anand – 388001Tel: 02692-322033/34/36Baroda - ABS Tower402, 4th Floor, Sakar Buildings, Old Padra Road Opp ABS Tower, Baroda – 390007, Gujarat, IndiaTel: 0265-3951828/29/30/31/32,2653260290, 2653264882,Bhavnagar - Waghawadi RoadNo. 8 - A Gangotri First Floor, Waghawadi Road, Opp. Daxinamurti School, Bhavnagar - 364002, Gujarat, IndiaTel: 0278-3984775/76/77/78/79Jamnagar - Aashirvaad ComplexNo. 105 / 106 Aashirvad Complex, First Floor Near Gurudwara, Paanch Bangla Road, Jamnagar - 361008, Gujarat, IndiaTel: 0288-3201202/03/04Morbi - Vasant PlotNo. 2, First Floor, Kirti Sadan, No. 15 Vasant Plot, Morbi – 363641, Gujarat, IndiaTel: 02822- 226444/22646 (BSNL)Rajkot - Star ChambersNo. 204, Star Chambers, Harihar Chowk, Rajkot-1. Gujarat, IndiaTel: 2813241363/64, 2813295650, 2813297591Surat - Poddar PlazaNo. 202-203, Ground Floor, Poddar Plaza Turning Point, Opp Fire Bridge, Surat – 395007.Tel: 0261-3115298, 0261-3021500 to 5004DahejAditya Birla Money, Main Entrance, Nr. Punching Gate, Post- Dahej, District- Bharuch, Gujarat – 392 130Tel: Vivekanand Kudiyal - 8437322223
HARAYANA Ambala - Nicolason Road6351/14, 1st Floor, Nicolason Road, Ambala Cantt, Ambala – 133001, Haryana, IndiaTel: 1713200113/114/115, 1713248099
JHARKHAND Jamshedpur - Shatabdhi TowerUnit No. 8, 3rd Floor, Shatabdhi Tower, Sakshi, Jamshedpur – 831001, Jharkhand, India Tel: 6573297146, 6573297764/65/66,6573246359, 6573246360, 6573246362Ranchi - TharpakhnaNo. 20, Jail Road East, Tharpakna, Ranchi – 834001 Tel: 6513209752, 6513209757
KARNATAKA Hubli - Koppikar RoadNo. 3002/5, Aar Kay Corner, Ward No. 46, Near Nehru Stadium, Koppikar Road, Hubli – 580020, Karnataka, IndiaTel: 0836-3051750/51/52/53/54 (Airtel) 0836-4254901,0836-4254801,0836-4254701Mangalore - Inland OrnateNo. 206, II Floor, Inland Ornate, Navbharath Circle, Mangalore-575003, Karnataka, India Tel: 8243208424, 8243215314, 8243258742/745/749, 0824-3006500/501/502/503/504Mysore - N. S. RoadAkshaya Mansions, 212 N. S. Road, Near Shantala Theatre, Mysore - 570024, Karnataka, IndiaTel: 0821-3294500/01/05, 0821-3016540/6541/6542/6543/6544Shimoga - Khasif ComplexGround Floor, Kashif Complex, Gopi Circle, Shimoga - 577201, Karnataka, IndiaTel: 08182-308208/09/10/11/11/12Bangalore - Queen’s RoadNo. 15/15/1, First Floor, Above Nissan Motors, Queens Road, Bangalore – 560052, Karnataka, IndiaTel: 080-30801260/1261/1262 to 1278Bangalore - Crown Point #36, 4th Floor, Crown Point, Lavelle Road, Kasturba Cross Road, Bangalore – 560001Tel: 080-42594259, 41473054, 42106015 (Airtel)
KERALA Cochin - PallimukkuUznaz Tower, Opp Medical Trust Office, Church Landing Road Pallimukku, Cochin – 682016, Kerala, IndiaTel: 0484-3957112/113/114/115/116Cochin - PalarivattomNo. 35/1403 C, MKM Buildings, MKM Nagar, Palarivattom, Cochin – 682025, Kerala, IndiaTel: 4913255532, 0484-3957190 to 94Irinjalakuda - City Tower6/465 I, City Tower, Tana 1st Floor, Irinjalakuda – 680125, Kerala, IndiaTel: 0480-3298415, 0480-3292686, 0480-3042600/01/02/03/04Mattanchery - Palace RoadCC -8/1870, Shenoys Building, Palace Road Mattanchery, Cochin – 682002, Kerala, IndiaTel: 0484-3957132/33/34/35Palakkad - Fort ArcadeNo. 18/77, (29, 44), 2nd Floor, Fort

Arcade, Palakkad – 678013, Kerala, India Tel: 4913257909, 4913-260699/260906Trichur - N. P. TowersNo. 40, 1st Floor N. P. Towers, Keralaverma College Stop Guruvayur Road, Post Poothol West Fort, Trichur - 680004, Kerala, IndiaTel: 4873106443/6445, 4873207326/7327Cochin - M. G. Road 2nd Floor, Thekkekara Mansions, M. G. Road, Opp Kavitha Movie House, Cochin – 682035, Kerala, IndiaTel: 0484-2361077, 0484-2352779 (BSNL), 0484-3957193 (Reliance)
MADHYA PRADESH Bhopal - Maharana Pratap Nagar195-A, Zone - 1, 1st Floor, Maharana Pratap Nagar, Bhopal – 462011, Madhya Pradesh, IndiaTel: 0755-3051720/21/22/23/24Gwalior - M. L. B. Road2nd Floor, Shivaji Tower, No. 26/1010, M. L. B. Road, Near Phoolbagh, Lashker, Gwalior – 474002Tel: 0751-3295573,0751-3298068/9533 Indore - R. N. T. Marg106, 1st Floor, Silver Centura, R. N. T. Marg, Indore – 452001, Madhya Pradesh, IndiaTel: 7313220134, 7313228718/19, 7313229323, 0731-3053660/661/662/663/664, 0731-3084597/98/99/00/01,0731-3053675/3053676/3053677Rewa - Vidya BhawanVidya Bhawan, Civil Lines Opp P.K. School, Sirmour Choraha, Rewa – 486001, Madhya Pradesh, IndiaTel: 7662320450, 7662320451, 7662320452, 7662324595, 7662324605, 7662324615Indore - M G Road312-A, City Centre, 570 M. G. Road, Indore – 452001, Madhya Pradesh, IndiaTel: 0731-3249726, 0731-3220134
MAHARASHTRA Mumbai - DadarSwapnabhoomi Ground Floor, 649 Sopakar Estates S K Bole Road, Dadar West, Mumbai - 400028, Maharashtra, IndiaTel: 2231920306/07/08, 2231928807, 2231923810, 2231907950, 2231924603, 022-24316731, 022-24316732/33/34/35 (MTNL)Mumbai - Goregaon EastCello Triumph, Unit No. 501-503, 505 & 401, I. B. Patel Road, Off W. E. Highway,Goregaon (East), Mumbai – 400063.Tel: 61207638, 31924601Mumbai - GhatkoparNo. 102, 1st Floor, RNJ Corporate Situated at Final Plot No.9, Jawahar Road, Ghatkopar (E), Mumbai 400 077Tel: 25018183/84/85/86/87/88/89/90/ 91/92/93/94/95/96/97/98/99, 25018200/201/202/203/204/205/206/207/208/209/210/211/212Akola - Civil Line RoadIIIrd Floor, Harsha Sankul, Opp Rlt College, Civil Line Road, Akola - 444001, Maharashtra, IndiaTel: 0724-3052308/09/10/11/12Amravati - Raka Market1st Floor, Raka Market, Jaistambh Square, Amravati – 444601, Maharashtra, IndiaTel: 7213293082, 7213293089Aurangabad - Jalna RoadEthibiz Towers, CTS No. 12996, Jalna Road, Aurangabad - 431001, Maharashtra, IndiaTel: 0240-3913788/89/90/91/92Jalgaon - Dhake ColonyNo. 18 Dhake Corporate Centre, Hotel Jalmahal Opp To ICICI Bank, Dhake Colony, Jalgaon - 425001, Maharashtra, India
Tel: 2573200102, 2573204141, 0257-3061830/31/32/33/ 34 Kolhapur - Station RoadNo. AF-16-E, Prabhakar Plaza, Station Road, Kolhapur – 416001, Maharashtra, IndiaTel: 0231-3203920,0231-3203924Nagpur - CA RoadABML, No. 13, Central Avenue, Dosar Bhavan Square, Nagpur - 440 018Tel: 7123273070, 7123218889, 7123273052, 7123273053/54, 7123273060, 7123273062, 7123272915/16/17/19, 7123273071/72, 7123273056/3057, 7123273069, 8514324432Nasik - Sharangpur RoadSuyojit Trade Centre, Block No. S2/A, 2nd Floor, 3rd Floor, Opp Rajiv Gandhi, Sharangpur Road, Nasik - 422006, Maharashtra, IndiaTel: 0253-3253034, 0253-3253043 Pune - Shivaji NagarNo. 14, Barway Memorial Complex, JM Road, Shivaji Nagar, Pune - 411005, Maharashtra, IndiaTel: 020-30454300/01/02/03/04Mumbai - KalinaShiel Estate, 2nd Floor, 158, C.S.T Road, Dani Corporate Park, Kalina, Santacruz - East, Mumbai – 400 098Tel: 022- 42333497/496/499 (Airtel)Mumbai - BorivaliAbhilasha Bldg No. 2, Ground Floor, Punjabi Lane, Off. L. T. Road, Borivali (W), Mumbai – 400 092.Tel: 022-42441700/01/02/03/04/05/06/07/08/09/10/11/15/16 – (Airtel )Mumbai- Thane Ghantali RoadGround Floor, Konark Tower, Opp. Saibaba Temple, Ghantali Road, Panchpakhadi, Thane (West) – 400 602Tel: 022 67210222/23/67955457/ 66099767 (TATA), 022 31924302/03/05, 31928068/69 (Reliance)Pune - Koregaon ParkF P No. 333, Business Avenue, 3rd Floor, TPS Sangamwadi lane 6, Koregaon Park, Pune-411001Tel: 020-41031710 -(Airtel)
ORISSA Cuttack - Gajanan Complex2nd Floor, Gajanan Complex, DolmundaI, Near Akbari Hotel Cuttack – 753001 Orissa, IndiaTel: 6713200127, 6713200129, 6713206128, 6713267955, 6713267956,Bhubaneshwar - Lewis Road3rd Floor, Gitanjali Complex, Lewis Road, Bhubaneswar – 751002Tel: 6743262411, 6743274936/37/38/40,TATA - 0674-6080930/31/32/33/34/35
PUNJAB Chandigarh - Madhya MargSCO 118-119, 1st Floor, Sector-8C, Madhya Marg, Chandigarh - 160008, Punjab, IndiaTel: 0172-3051400/01/02/03/04/05/06Hoshiarpur - Sutehri Road2nd Floor, Above ICICI Bank, Sutehri Road, Hoshiarpur – 146001, Punjab, IndiaTel: 0188-2320120, 0188-2320121, 0188-2320122Jalandhar - Gurmit ComplexSCO I, Gurmit Complex, Crystal Plaza Market, Choti Baradari, Jalandhar – 144 001Tel: 0181-3190651/52/53/54/55Kapurthala - Simmi PlazaPlot No 51, 1st Floor Simmi Plaza, Opp. Post Office The Mall Road, Kapurthala – 144601, Punjab, IndiaTel: 01822-325355/56/57Khanna - G T Road1st Floor, Sood Brother Complex, Above PNB Bank GT Road, Khanna – 141401, Punjab, India Tel: 01628-325001/325002, 628322380
Ludhiana - Skyland BuildingSCO -14, 2nd Floor, Sky Land Building, Feroze Gandhi Market, Ludhiana – 141001Tel: 0161-4310000-13 (Airtel)Chandigarh - Madhya MargSCO 145-146, Sector 8-C, Madhya Marg, Chandigarh – 160017Tel: 0172- 4311559Chandigarh - Sector 9DSCO 59-60, 2nd Floor, Sector 9D, Chandigarh – 160009.Tel: 0172-2747971/72/4635423
RAJASTHAN Jodhpur - Upper Chopasani RoadNarayanam, 2nd Floor, Upper Chopasani Road, Near Bombay Motor Circle, Jodhpur (Raj) – 342001Tel: 0291-5151001- 16 (MTS)Jaipur - Ashok Marg305, Shyam Anukampa, Near Ahimsa Circle, Ashok Marg, C Scheme, Jaipur – 302015Tel: 0141-5190103-115 (MTS) TAMIL NADU Chennai - AdyarBasement 1, No. 1, Ceebros Arcade 3rd Cross Road, Kasturibai Nagar Adyar, Chennai – 600020, Tamil Nadu, India Tel: 044-32001016/17,044-30138950/51/52/53/54Chennai - AmbatturOld No. 358, New No. 347, MTH Road, Ambattur, Chennai - 600053, Tamil Nadu, IndiaTel: 044-32954874, 044-32954876Chennai - Anna NagarAC-153, 1st Floor, 6th Main Road, Near Anna Nagar Tower, Anna Nagar, Chennai – 600040 Tel: 044-30585811/12/13, 044-30138334 to 41 Chennai - Greams RoadNo. 55, Ali Towers, Greams Road, Chennai – 600006, Tamil Nadu, IndiaTel: 044-39190055 (Board Number)Coimbatore - Avinashi Road1050, Damodar Centre, Avinashi Road, Coimbatore - 641018, Tamilnadu, IndiaTel: 4223221388, 9381083080,0422-3061300/01/02/03/04/05/06/07Madurai - ChokkikulamNo. 11, 1st Floor, Gokale Road, Chinna Chokkikulam, Madurai - 625002, Tamil Nadu, IndiaTel: 4523277665, 4523277685, 4523273153, 0452-3021051/52/53/54/55Madurai - KRV ArcadeKRV Arcade A R Plaza, C-1, 2nd Floor, 16/17 North Veli Street, Madurai – 625001, Tamil Nadu, IndiaTel: 0452-3013000,0452-3021074/75/76/77/78/79/80/81Salem - Divya TowersNo. 47/48, Divya Towers, Fort Main Road, Salem – 636001, Tamil Nadu, IndiaTel: 4273202234, 4273202735, 4273255520, 0427-3018050, 0427-3018051/52/53/54, 0427-3918151/152/153/54/155Tirunelveli - Lion ArcadeNo. 01, 2nd Floor, Lion Arcade (ICICI Bank Upstairs), Sindupoondurai West Street, Madurai Road, Tirunelveli – 627001Tel: 0462-3292349,0462-3291330Tirupur - Benny Main RoadNo. 53, Selvam Towers, 1st Floor, Benny Main Road, Tirupur, Tirupur – 641601, Tamil Nadu, IndiaTel: 4213208672, 0421-3048146 to 49Trichy - Thillai NagarA-10, Lakshmi Arcade, 2nd Floor, 11th Cross Main Road, Thillai Nagar, Trichy - 620018, Tamil Nadu, IndiaTel: 4313200112, 4313200113, 4313200701, 4313295966, 4313253118/20, 313254098
Coimbatore - R. S. Puram NO. 551-A, 1st Floor, Logamaniya Street, R.S.Puram - West,Coimbatore – 641002Tel: 0422-3061350/51/53/54 (Tel Lines Shifted from Oppanakara Branch)Chennai- Egmore 42, Kuber Towers, Pantheon Road, Egmore, Chennai – 600008Tel: 44-42145711/46467, (Airtel)/044-30138925/26/27/28/29
UTTAR PRADESH Ghaziabad – VaishaliPlot No. 8, 1st Floor, Atlantic Plaza, Sec – 4, Vaishali, Ghaziabad – 201010Tel: 120-3142501/2502/2503Allahabad - S P MargNo. 2, S. P. Marg LDA, Centre, Nawab Yusuf Road, Civil Lines, Allahabad – 211001Tel: 5323292411, 5323292412, 5323292413, 5323295762Kanpur - Krishna TowersNo. 219, Krishna Towers, Civil Lines, Kanpur – 208001, Uttar Pradesh, IndiaTel: 0512-3938100/01/02/03/04Varanasi - Gandhi NagarD - 58 / 12, A - 2 Gandhi Nagar, Sigra, Varanasi – 221010, Uttar Pradesh, IndiaTel: 0542-3255308/309/310Agra - Church Road2nd Floor, Unit No. 9 & 8, C. R. Mall, Church Road Agra (U.P.) – 282002Tel: 0562-3248136/137/138Lucknow - Saran Chamber13 & 14, Ground Floor, Saran Chamber II, Opposite Civil Hospital, Park Road, Lucknow – 226001.Tel: 0522-4154900-914
WEST BENGAL Kolkata - Bidhan NagarP 193/1, Ultadanga Main Road, 3rd Floor CIT Scheme, No VII M Bidhannagar, Kolkata - 700067, West Bengal, IndiaTel: 3332606061, 3332607631, 3332609653, 3332412057Durgapur - City CentreP – 10 Recol Park Ground Floor, Shahid Khudiram Sarani, City Centre, Durgapur – 713216, West Bengal, IndiaTel: 0343-3296400,0343-3298007/08Kolkatta - HazraDevi Darshan No. 83, Shyama Prasad Mukherjee, 3rd Floor, Kolkata – 700026, West Bengal, India Tel: 033-32520287/88, 033-30085755, 033-30085756/57/58/ 59Kolkatta - Commerce HouseRoom 10 & 11, 4th Floor, Commerce House, 2A Ganesh Chandra Avenue, Kolkata – 700013, West Bengal, IndiaTel: 3332622382, 3332622384, 3332627076,3332627078, 3332412058Kolkata - SaltlakeBD - 9, Salt Lake, Sector -1, Kolkata – 700064, West Bengal, IndiaTel:3332590080, 3332597936, 3332597951,3332597952, 3332598165, 3332598167, 3332598184, 3332621666, 3332627607, 3332920896, 3332509705/706/708/709Siliguri - Sevok RoadNanak Complex, Sevok Road, Church Road Junction, Siliguri – 734401, West Bengal, India Tel: 3533290275, 3533290277, 3533290655Kolkata - CICCIC Society, 33-A, Jawaharlal Nehru Road, Kolkata – 700 071, West Bengal, IndiaTel: 3332622270 to 72, 3332625373,3332625374, 3332625375033-30085809, 033-30085810/ 811/812/813Kolkata - AJC Bose Road234/3, FMC Fortuna Building, AJC Bose Road, Kolkata – 700 020, West Bengal, IndiaTel: 033-44040301-333-(Airtel)