Embed Size (px)
Citation preview
MEDIA RELEASE June 8, 2017
Focused on the Future
1
SCOTIA GROUP JAMAICA REPORTS SECOND QUARTER OF FISCAL 2017 RESULTS
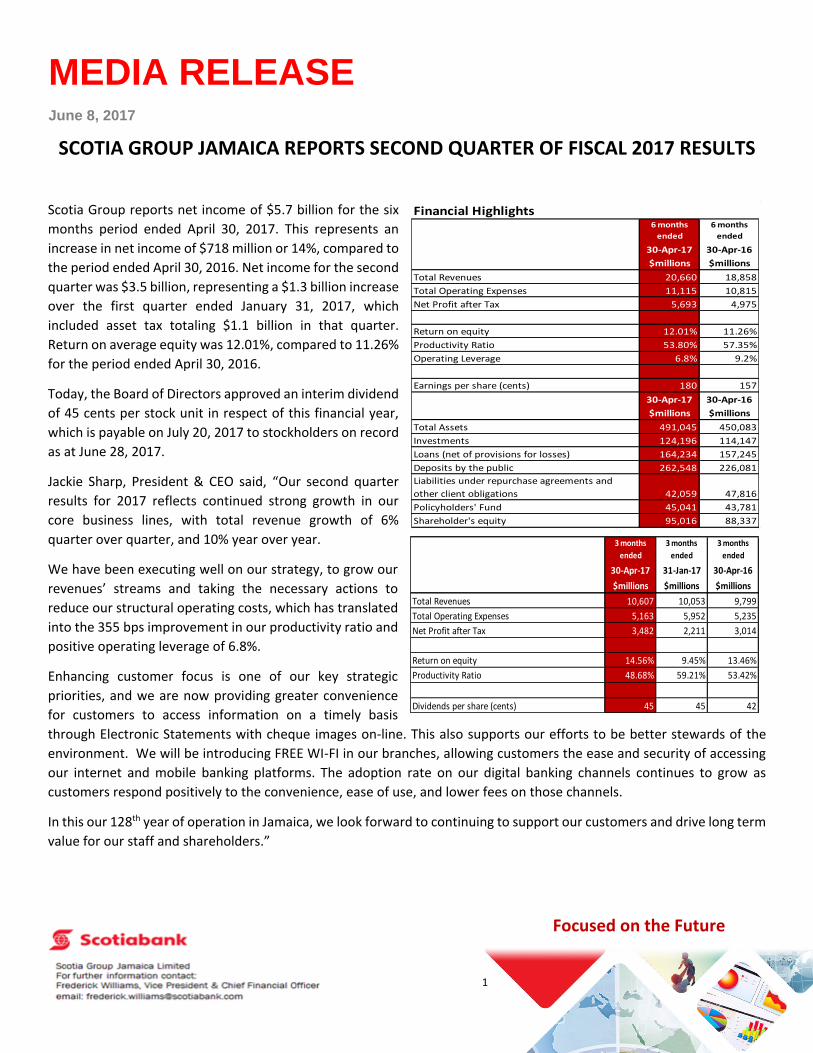
Scotia Group reports net income of $5.7 billion for the six
months period ended April 30, 2017. This represents an
increase in net income of $718 million or 14%, compared to
the period ended April 30, 2016. Net income for the second
quarter was $3.5 billion, representing a $1.3 billion increase
over the first quarter ended January 31, 2017, which
included asset tax totaling $1.1 billion in that quarter.
Return on average equity was 12.01%, compared to 11.26%
for the period ended April 30, 2016.
Today, the Board of Directors approved an interim dividend
of 45 cents per stock unit in respect of this financial year,
which is payable on July 20, 2017 to stockholders on record
as at June 28, 2017.
Jackie Sharp, President & CEO said, “Our second quarter
results for 2017 reflects continued strong growth in our
core business lines, with total revenue growth of 6%
quarter over quarter, and 10% year over year.
We have been executing well on our strategy, to grow our
revenues’ streams and taking the necessary actions to
reduce our structural operating costs, which has translated
into the 355 bps improvement in our productivity ratio and
positive operating leverage of 6.8%.
Enhancing customer focus is one of our key strategic
priorities, and we are now providing greater convenience
for customers to access information on a timely basis
through Electronic Statements with cheque images on-line. This also supports our efforts to be better stewards of the
environment. We will be introducing FREE WI-FI in our branches, allowing customers the ease and security of accessing
our internet and mobile banking platforms. The adoption rate on our digital banking channels continues to grow as
customers respond positively to the convenience, ease of use, and lower fees on those channels.
In this our 128th year of operation in Jamaica, we look forward to continuing to support our customers and drive long term
value for our staff and shareholders.”
Financial Highlights6 months
ended
6 months
ended
30-Apr-17 30-Apr-16
$millions $millions
Total Revenues 20,660 18,858
Total Operating Expenses 11,115 10,815
Net Profit after Tax 5,693 4,975
Return on equity 12.01% 11.26%
Productivity Ratio 53.80% 57.35%
Operating Leverage 6.8% 9.2%
Earnings per share (cents) 180 157
30-Apr-17 30-Apr-16
$millions $millions
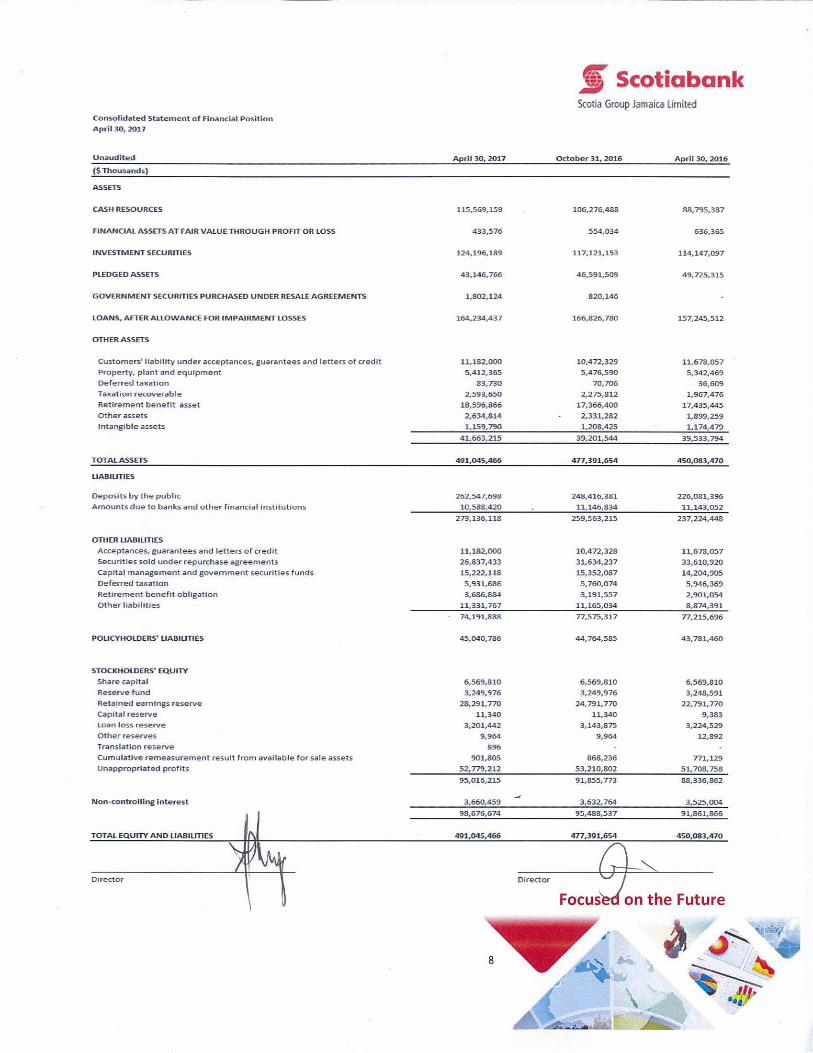
Total Assets 491,045 450,083
Investments 124,196 114,147
Loans (net of provisions for losses) 164,234 157,245
Deposits by the public 262,548 226,081
Liabilities under repurchase agreements and
other client obligations 42,059 47,816
Policyholders' Fund 45,041 43,781
Shareholder's equity 95,016 88,337
3 months
ended
3 months
ended
3 months
ended
30-Apr-17 31-Jan-17 30-Apr-16
$millions $millions $millions
Total Revenues 10,607 10,053 9,799
Total Operating Expenses 5,163 5,952 5,235
Net Profit after Tax 3,482 2,211 3,014
Return on equity 14.56% 9.45% 13.46%
Productivity Ratio 48.68% 59.21% 53.42%
Dividends per share (cents) 45 45 42
2
Focused on the Future
Focused on the Future
GROUP FINANCIAL PERFORMANCE TOTAL REVENUES
Total revenues excluding impairment losses on loans for the six months ended April 30, 2017 was $20.7 billion,
representing an increase of $1.8 billion or 10% above prior year. The positive movement was achieved through increased
loan and transaction volumes across our business lines. Net interest income after impairment losses for the period was
$12.2 billion, $399 million or 3% above the same period in 2016.
We achieved revenue growth y/y in most of our business lines:
Retail (+7%): Loan growth was led by residential mortgages and personal loans.
Commercial (+19%): Reflects growth in both loans and deposits, as well as merchant services revenues.
Insurance Services (+19%): Growth in gross premium income for the individual product lines offered by Scotia Insurance,
and actuarial reserve release from changes in valuation assumptions.
Investment Management (-1%): Solid revenue growth from fund and asset management business line, offset by lower
net interest margins.
Treasury (+12%): Higher revenues from investment portfolios and net gains on financial assets.
OTHER REVENUE
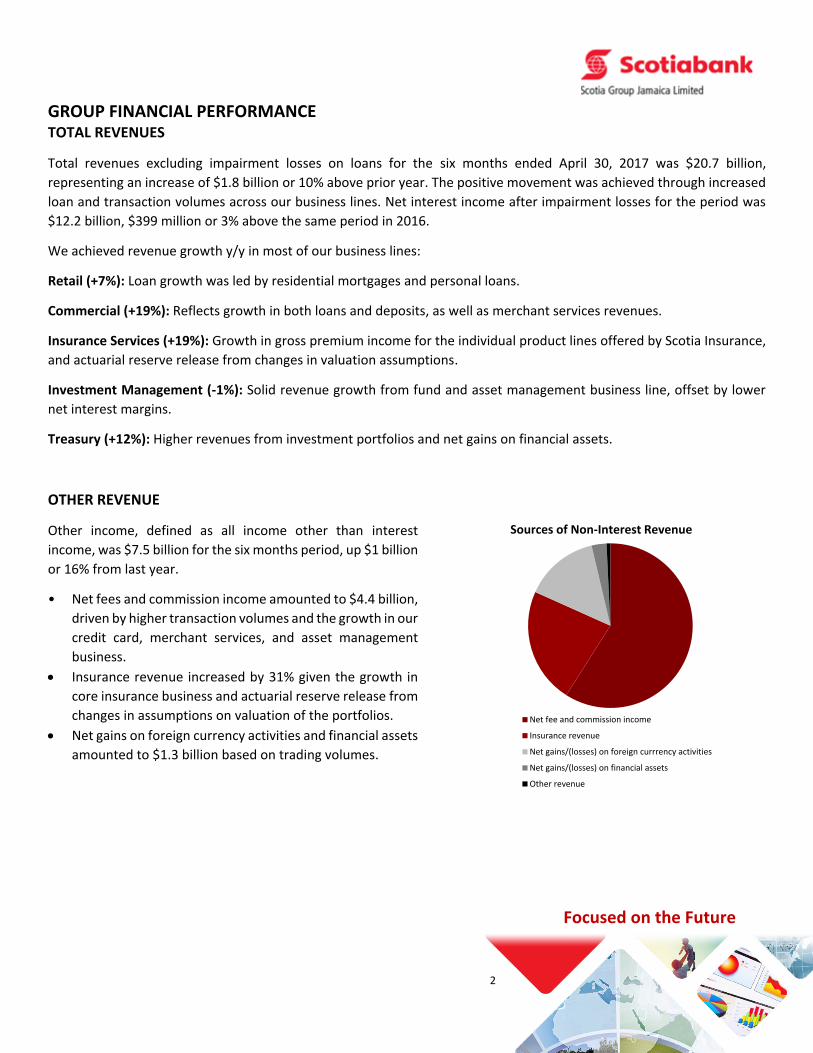
Other income, defined as all income other than interest
income, was $7.5 billion for the six months period, up $1 billion
or 16% from last year.
• Net fees and commission income amounted to $4.4 billion,
driven by higher transaction volumes and the growth in our
credit card, merchant services, and asset management
business.
Insurance revenue increased by 31% given the growth in
core insurance business and actuarial reserve release from
changes in assumptions on valuation of the portfolios.
Net gains on foreign currency activities and financial assets
amounted to $1.3 billion based on trading volumes.
Sources of Non-Interest Revenue
Net fee and commission income
Insurance revenue
Net gains/(losses) on foreign currrency activities
Net gains/(losses) on financial assets
Other revenue
3
Focused on the Future
Focused on the Future
CREDIT QUALITY
Impairment losses on loans was $975 million, up $367 million from last year, as the total loan portfolio grew $7.0 billion
year over year. We experienced higher write-offs on our unsecured retail portfolio, however the overall quality of the loan
portfolio generally improved, with total non-accrual loans (NALs) as at April 30, 2017 being $4.2 billion; compared to $4.5
billion last year. This represented 2.53% of total loans and 0.9% of total assets; compared to 2.83% and 1.0%, respectively
last year. The Group’s NALs as a percentage of Gross Loans continue to remain well below the industry average.
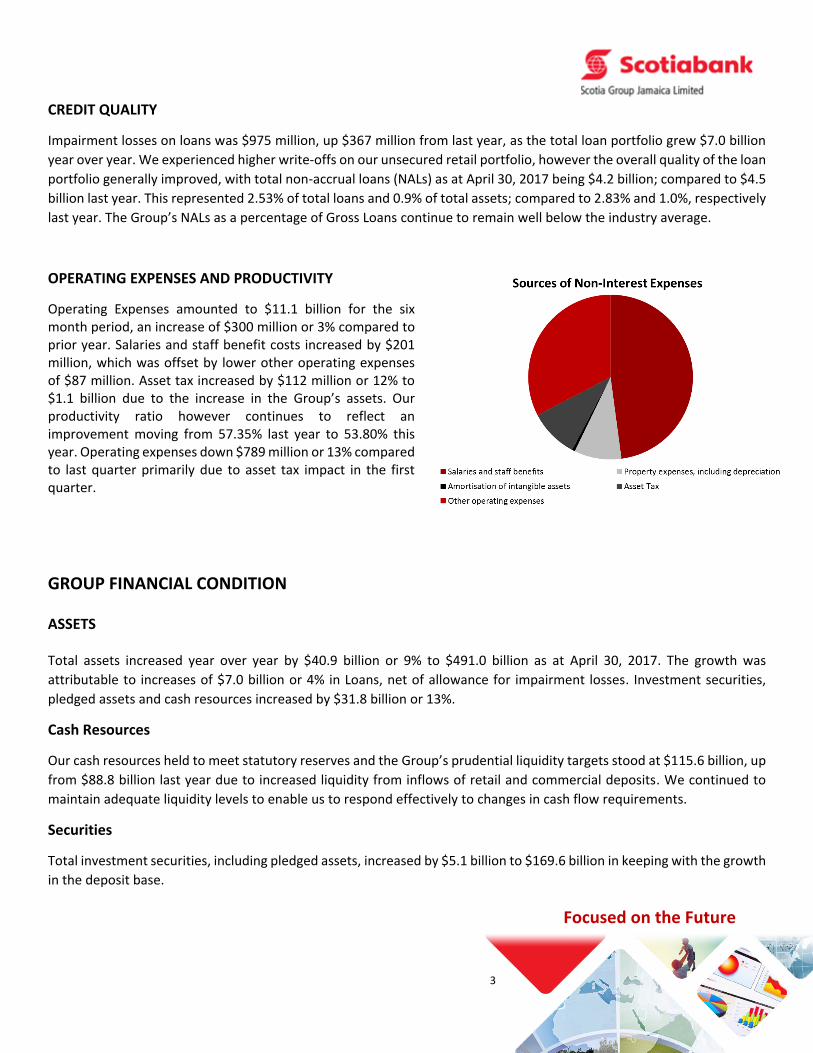
OPERATING EXPENSES AND PRODUCTIVITY
Operating Expenses amounted to $11.1 billion for the six month period, an increase of $300 million or 3% compared to prior year. Salaries and staff benefit costs increased by $201 million, which was offset by lower other operating expenses of $87 million. Asset tax increased by $112 million or 12% to $1.1 billion due to the increase in the Group’s assets. Our productivity ratio however continues to reflect an improvement moving from 57.35% last year to 53.80% this year. Operating expenses down $789 million or 13% compared to last quarter primarily due to asset tax impact in the first quarter.
GROUP FINANCIAL CONDITION ASSETS Total assets increased year over year by $40.9 billion or 9% to $491.0 billion as at April 30, 2017. The growth was
attributable to increases of $7.0 billion or 4% in Loans, net of allowance for impairment losses. Investment securities,
pledged assets and cash resources increased by $31.8 billion or 13%.
Cash Resources
Our cash resources held to meet statutory reserves and the Group’s prudential liquidity targets stood at $115.6 billion, up
from $88.8 billion last year due to increased liquidity from inflows of retail and commercial deposits. We continued to
maintain adequate liquidity levels to enable us to respond effectively to changes in cash flow requirements.
Securities
Total investment securities, including pledged assets, increased by $5.1 billion to $169.6 billion in keeping with the growth
in the deposit base.
4
Focused on the Future
Focused on the Future
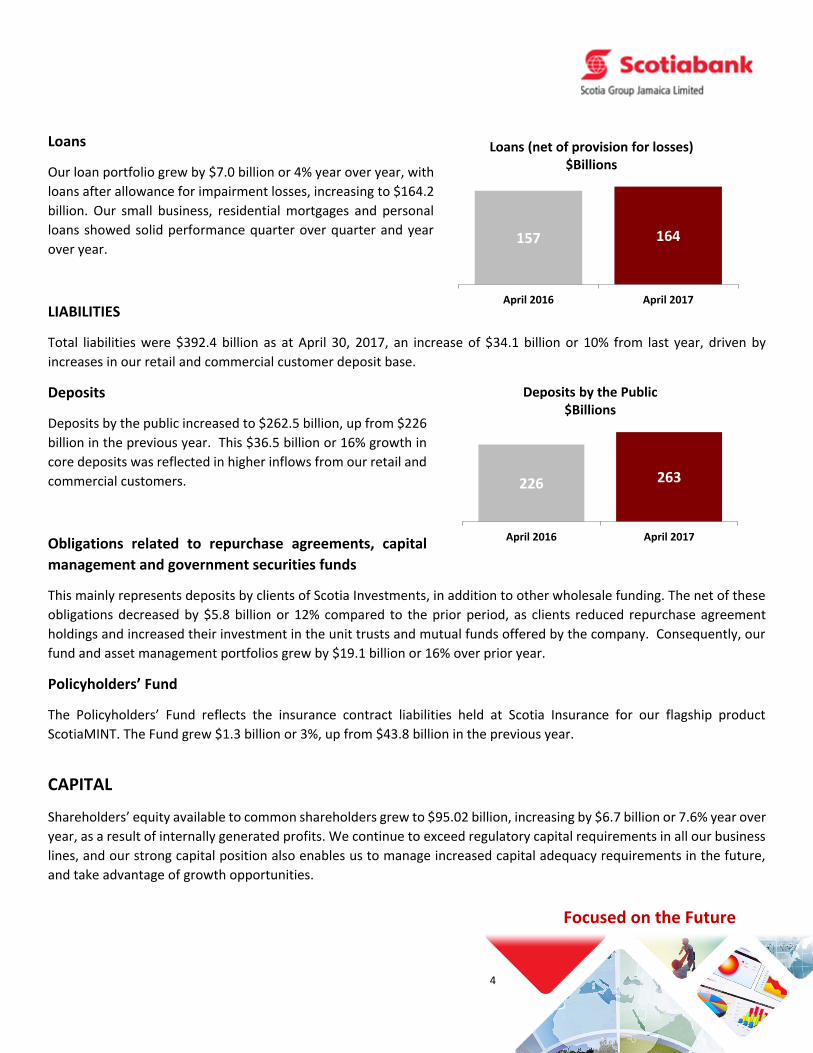
Loans
Our loan portfolio grew by $7.0 billion or 4% year over year, with
loans after allowance for impairment losses, increasing to $164.2
billion. Our small business, residential mortgages and personal
loans showed solid performance quarter over quarter and year
over year.
LIABILITIES
Total liabilities were $392.4 billion as at April 30, 2017, an increase of $34.1 billion or 10% from last year, driven by
increases in our retail and commercial customer deposit base.
Deposits
Deposits by the public increased to $262.5 billion, up from $226
billion in the previous year. This $36.5 billion or 16% growth in
core deposits was reflected in higher inflows from our retail and
commercial customers.
Obligations related to repurchase agreements, capital
management and government securities funds
This mainly represents deposits by clients of Scotia Investments, in addition to other wholesale funding. The net of these
obligations decreased by $5.8 billion or 12% compared to the prior period, as clients reduced repurchase agreement
holdings and increased their investment in the unit trusts and mutual funds offered by the company. Consequently, our
fund and asset management portfolios grew by $19.1 billion or 16% over prior year.
Policyholders’ Fund
The Policyholders’ Fund reflects the insurance contract liabilities held at Scotia Insurance for our flagship product
ScotiaMINT. The Fund grew $1.3 billion or 3%, up from $43.8 billion in the previous year.
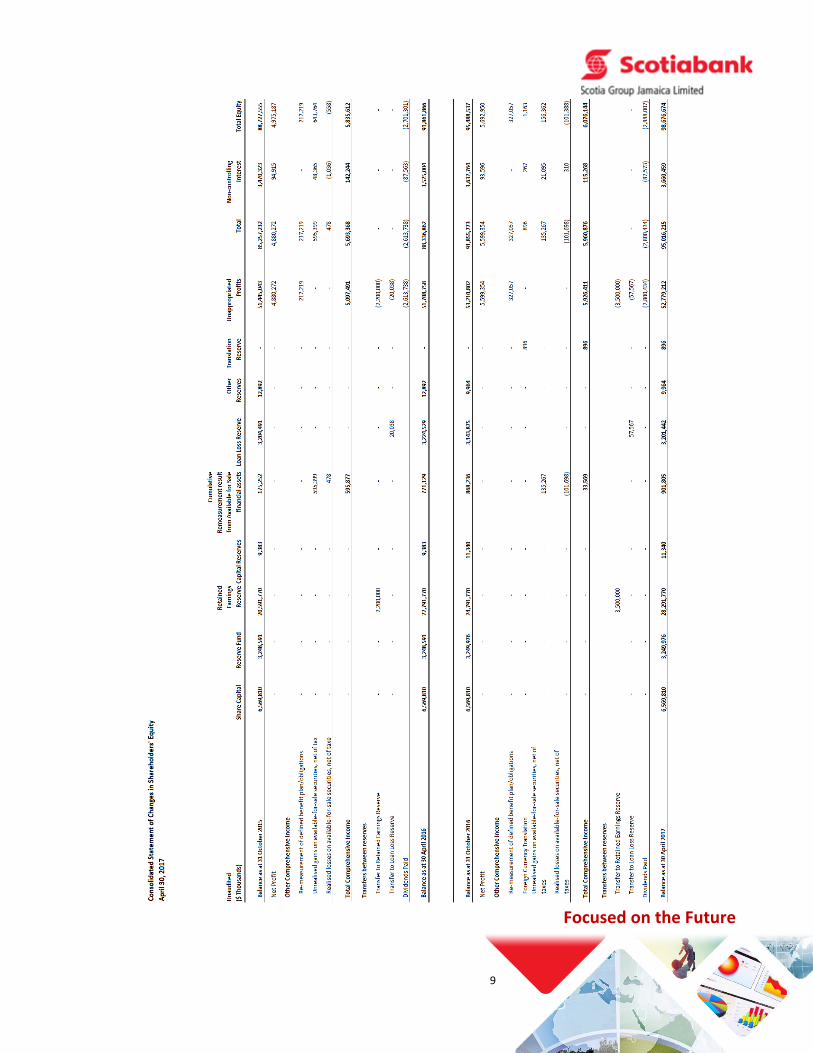
CAPITAL
Shareholders’ equity available to common shareholders grew to $95.02 billion, increasing by $6.7 billion or 7.6% year over
year, as a result of internally generated profits. We continue to exceed regulatory capital requirements in all our business
lines, and our strong capital position also enables us to manage increased capital adequacy requirements in the future,
and take advantage of growth opportunities.
157 164
April 2016 April 2017
Loans (net of provision for losses)$Billions
226 263
April 2016 April 2017
Deposits by the Public$Billions

5
Focused on the Future
Focused on the Future
OUR COMMITMENT TO THE COMMUNITY
During the quarter, Scotia Group continued its corporate social responsibility through various donations totaling $3.9 million. In Community Care, the Bank donated $2.2 million to various organizations including $1.2 million to United Way of Jamaica. In Student Care, the Foundation contributed $1.7 million to seven schools, with a major donation of $1.0 million going to the resurfacing of the playground at the Alpha Primary School in Kingston. Four students were assisted with tuition at Northern Caribbean University, The University of the West Indies and Moneague College. April 2017 was Financial Literacy Month, and ScotiaVolunteers went into nine schools across the island to share on the importance of financial literacy. To support this endeavor the Bank partnered with Junior Achievement Jamaica to present a Financial Education Programme to 8th and 9th grade students in various schools throughout the island. Thanks to staff members, through the Scotia Volunteers, our goal of educating 1,000 students in Financial Literacy was achieved. In March, we sponsored the Girls for ICT Day Hackathon. Over 90 students from high schools and universities took the challenge to create solutions for big issues like domestic abuse, cyber bullying and protecting the environment. The Kiddy Cricket launch of the 2017 programme took place on February 16, 2017, at Sabina Park. Eighteen new schools have been added to the Kiddy Cricket line up, moving the number of participants from 224 up to 242. On Earth Day, April 22, seventy Scotiabank Kiddy Cricketers who gathered at Sabina for the second day of the test match cricket between the West Indies and Pakistan, used the opportunity to plant a symbolic tree in celebration of the occasion. The tree, located in a small triangular green area, to the back of the North Stand, will create a permanent marker that will inspire Kiddy Cricketers in years to come. Scotiabank signed on to a $6.5M partnership with the SportsMax Elite League Football Competition that incorporated top school boy footballers from across the island competing by parish, on a national level. Scotiabank also partnered with the International Women’s Forum and United Way to host “A Talk with Edie Weiner”. Weiner, who is the President and CEO of The Future Hunters, one of the world’s leading futurist consulting firms, gave her perspectives on the future, the emerging trends, and the challenges and opportunities that exist globally. Scotia Group Jamaica Limited takes this opportunity to thank you, our customers, for your continued support and loyalty to allow us to be your financial services provider. To our shareholders, we thank you for the commitment, trust and confidence you continue to show in the management of the Group. Our continued success is built on the great execution.
Students at Gaynstead High had an opportunity
to engage with Jacqueline Sharp, President and
CEO Scotia Group, as she shared with them
during an interactive session on financial
literacy.
Yanique Forbes Patrick assists Scotiabank Kiddy Cricketer, Nathan McKintosh (left), as he shows his gardening abilities while planting the symbolic Kiddy Cricket tree at Sabina Park on Earth Day, April 22.

6
Focused on the Future
Focused on the Future

7
Focused on the Future
Focused on the Future
9
Focused on the Future
Focused on the Future

10
Focused on the Future
Focused on the Future
Focused on the Future
11
12
Focused on the Future
Focused on the Future
Focused on the Future
13
SCOTIA GROUP JAMAICA LIMITED NOTES TO THE CONSOLIDATED FINANCIAL STATEMENTS April 30, 2017 1. Identification
Scotia Group Jamaica Limited (the Company) is a 71.78% subsidiary of Scotiabank Caribbean Holdings Limited, which is incorporated and domiciled in Barbados. The Bank of Nova Scotia, which is incorporated and domiciled in Canada, is the ultimate parent.
The Company is the parent of The Bank of Nova Scotia Jamaica Limited (100%), Scotia Investments Jamaica Limited (77.01%) and Scotia Jamaica Micro Finance Limited (100%). All subsidiaries are incorporated in Jamaica, except for Scotia Asset Management (St. Lucia) Inc.
2. Basis of presentation
The interim condensed consolidated financial statements have been prepared in accordance with IAS 34,
‘Interim financial reporting’. The accounting policies adopted in the preparation of the interim condensed
consolidated financial statements are consistent with those applied in the preparation of the Group’s annual
audited consolidated financial statements for the year ended October 31, 2016, which was prepared in
accordance with International Financial Reporting Standards (IFRS).
Certain new, revised and amended standards and interpretations came into effect during the current financial
year. The Group has assessed them and has adopted those which are relevant to its financial statements.
These financial statements are presented in Jamaican dollars, which is the Group’s functional currency.
Basis of consolidation The consolidated financial statements include the assets, liabilities, and results of operations of the Company and its subsidiaries presented as a single economic entity. Intra-group transactions, balances, and unrealized gains and losses are eliminated in preparing the consolidated financial statements.
3. Financial Assets
The Group classifies its financial assets in the following categories: financial assets at fair value through profit and loss; loans and receivables; held-to-maturity; and available-for-sale financial assets. Management determines the classification of its investments at initial recognition.
Financial Assets at Fair Value through Profit and Loss
This category includes a financial asset acquired principally for the purpose of selling in the short term or if so designated by management.
14
Focused on the Future
Focused on the Future
SCOTIA GROUP JAMAICA LIMITED NOTES TO THE CONSOLIDATED FINANCIAL STATEMENTS April 30, 2017 3. Financial Assets (continued)
Loans and receivables
Loans and receivables are non-derivative financial assets with fixed or determinable payments that are not quoted in an active market. They arise when the Group provides money or services directly to a debtor with no intention of trading the receivable.
Held-to-Maturity
Held-to-maturity investments are non-derivative financial assets with fixed or determinable payments and fixed maturities that the Group’s management has the positive intention and ability to hold to maturity.
Available-for-sale
Available-for-sale investments are those intended to be held for an indefinite period of time, and may be sold in response to needs for liquidity or changes in interest rates or equity prices.
Available-for-sale investments and financial assets at fair value through profit and loss are carried at fair value. Loans and receivables are carried at amortized cost using the effective interest method. Gains and losses arising from changes in the fair value of trading securities are included in the statement of revenue and expenses in the period in which they arise. Gains and losses arising from changes in the fair value of available-for-sale financial assets are recognized directly in the statement of comprehensive income. Interest calculated using the effective interest method is recognized in the statement of revenue and expenses.
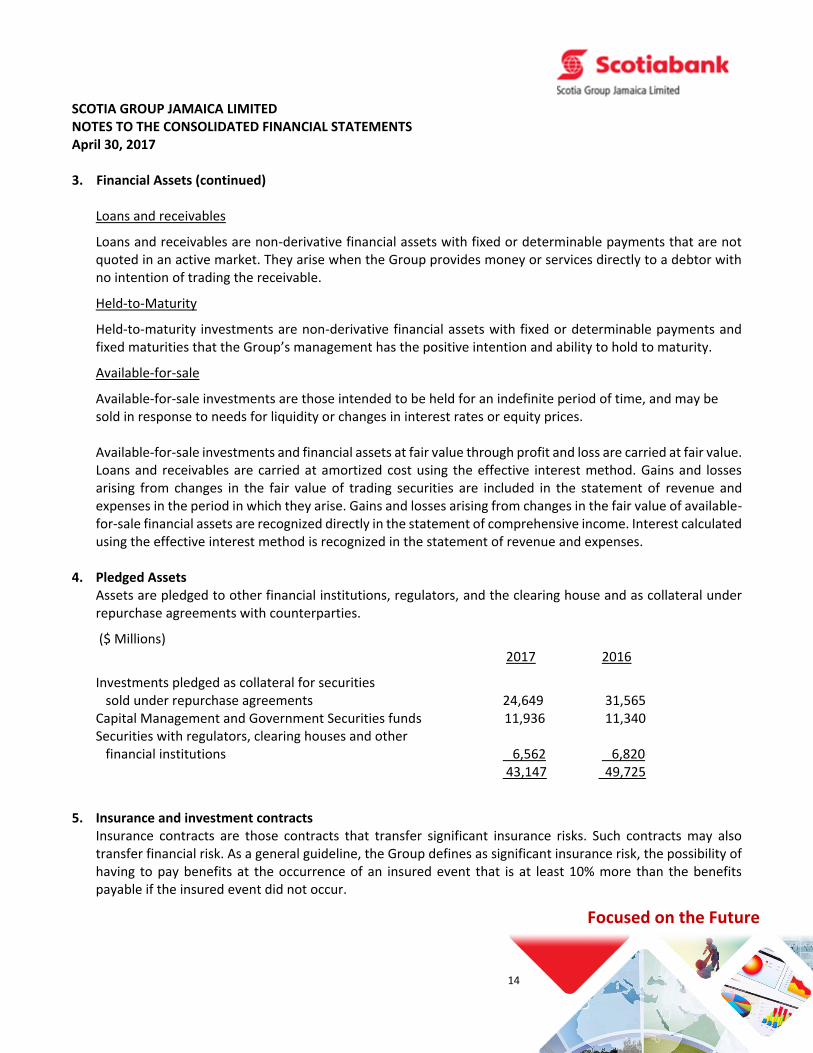
4. Pledged Assets
Assets are pledged to other financial institutions, regulators, and the clearing house and as collateral under repurchase agreements with counterparties.
($ Millions) 2017 2016
Investments pledged as collateral for securities sold under repurchase agreements 24,649 31,565 Capital Management and Government Securities funds 11,936 11,340 Securities with regulators, clearing houses and other financial institutions 6,562 6,820 43,147 49,725
5. Insurance and investment contracts Insurance contracts are those contracts that transfer significant insurance risks. Such contracts may also transfer financial risk. As a general guideline, the Group defines as significant insurance risk, the possibility of having to pay benefits at the occurrence of an insured event that is at least 10% more than the benefits payable if the insured event did not occur.
15
Focused on the Future
Focused on the Future
SCOTIA GROUP JAMAICA LIMITED NOTES TO THE CONSOLIDATED FINANCIAL STATEMENTS April 30, 2017
6. Loan loss provision IFRS loan loss provision is established on the difference between the carrying amount and the recoverable
amount of loans. The recoverable amount being the present value of expected future cash flows, discounted
based on the interest rate at inception or last reprice date of the loan. Regulatory loan loss provisioning
requirements that exceed these amounts are maintained within a loan loss reserve in the equity component
of the statement of financial position.
7. Property, plant and equipment
All property, plant and equipment are stated at cost less accumulated depreciation.
8. Cash and cash equivalents
For the purpose of the cash flow statement, cash and cash equivalents include notes and coins on hand,
unrestricted balances held with Bank of Jamaica, amounts due from other banks, and highly liquid financial
assets with original maturities of less than ninety days, which are readily convertible to known amounts of
cash, and are subject to insignificant risk of changes in their fair value.
9. Employee benefits
The Group operates both defined benefit and defined contribution pension plans. The assets of the plans are
held in separate trustee-administered funds. The pension plans are funded by contributions from employees
and by the relevant group companies, taking into account the recommendations of qualified actuaries.
(i) Defined Benefit Plan The asset or liability in respect of the defined benefit plan is the difference between the present value of the defined benefit obligation at the reporting date and the fair value of plan assets.
Where a pension asset arises, the amount recognized is limited to the present value of any economic benefits
available in the form of refunds from the plan or reduction in future contributions to the plan. The pension
costs are assessed using the Projected Unit Credit Method. Under this method, the cost of providing pensions
is charged as an expense in such a manner as to spread the regular cost over the service lives of the employees
in accordance with the advice of the actuaries, who carry out a full valuation of the plan every year in
accordance with IAS 19. Re-measurements comprising actuarial gains and losses, return on plan assets and
change in the effect of asset ceiling are reported in other comprehensive income The pension obligation is
measured as the present value of the estimated future benefits of employees, in return for service in the
current and prior periods, using estimated discount rates based on market yields on Government securities
which have terms to maturity approximating the terms of the related liability.

16
Focused on the Future
Focused on the Future
SCOTIA GROUP JAMAICA LIMITED NOTES TO THE CONSOLIDATED FINANCIAL STATEMENTS April 30, 2017 9. Employee benefits (continued)
(ii) Other post-retirement obligations The Group also provides supplementary health care and insurance benefits to qualifying employees upon retirement. The entitlement to these benefits is usually based on the completion of a minimum service period and the employee remaining in service up to retirement age. The expected costs of these benefits are accrued over the period of employment, using an accounting methodology similar to that for defined benefit pension plans. These obligations are valued annually by qualified independent actuaries.
(iii) Defined contribution plan Contributions to this plan are charged to the statement of revenue and expenses in the period to which they relate.
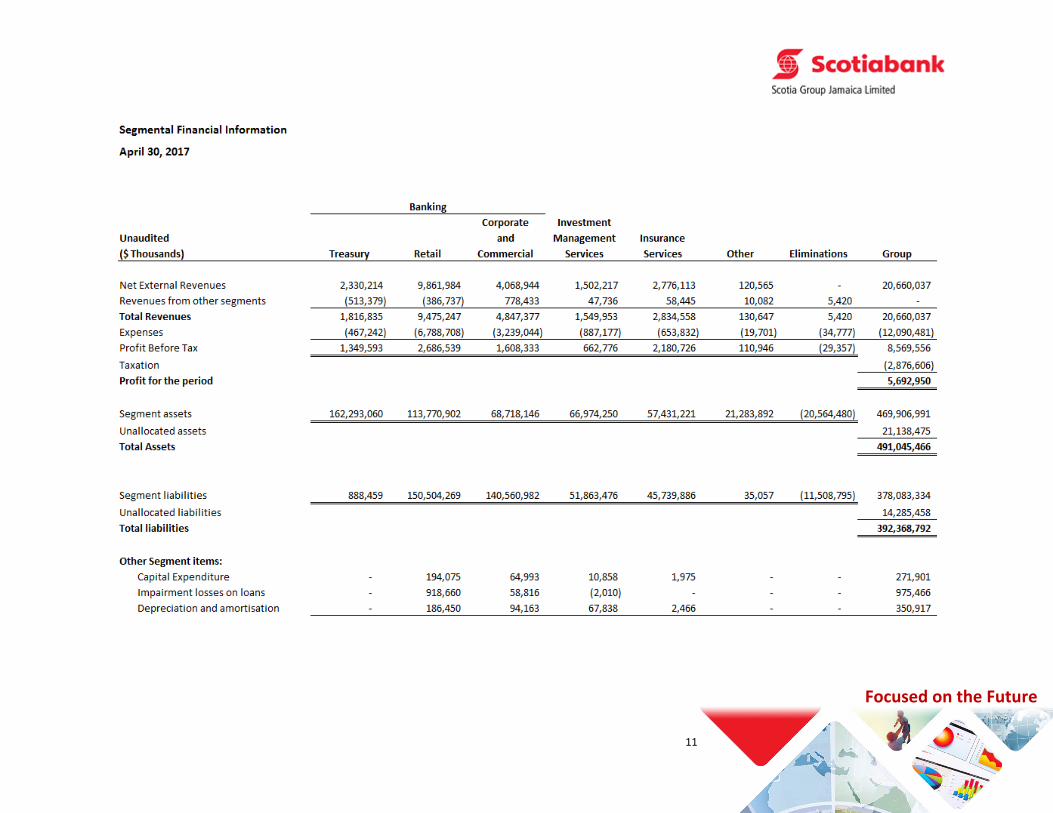
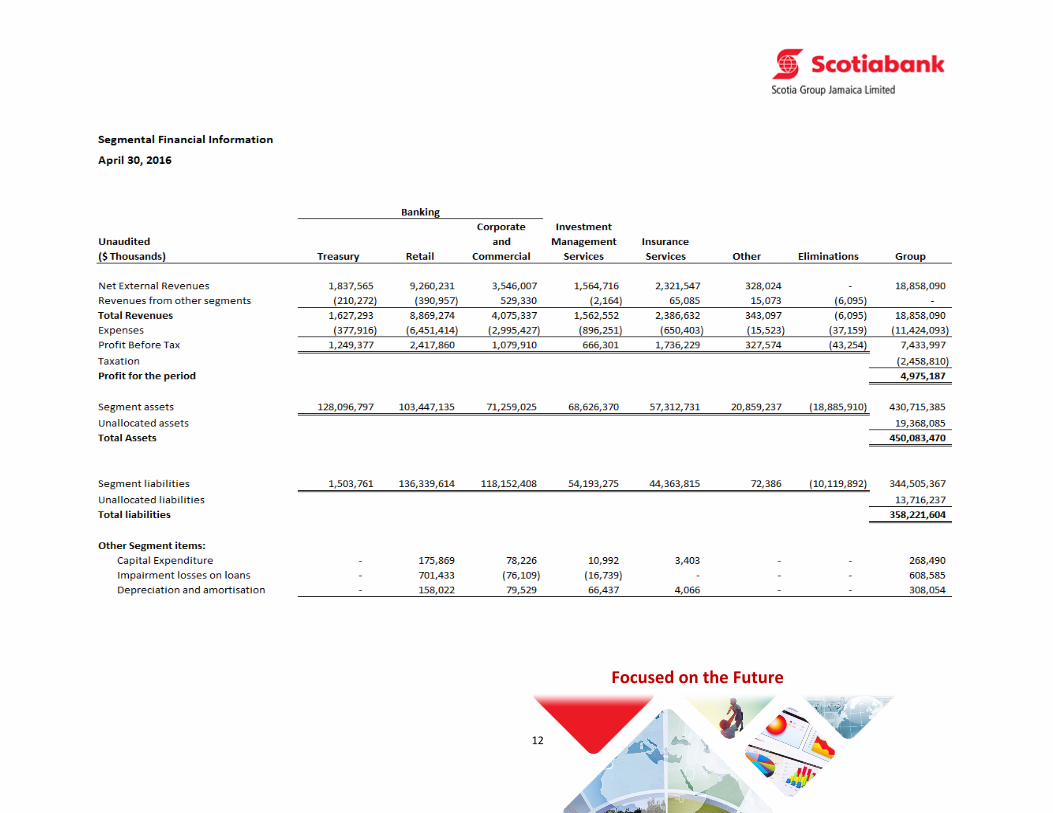
10. Segment reporting
The Group is organized into six main business segments:
Retail Banking – this incorporates personal banking services, personal deposit accounts, credit and debit cards, customer loans, mortgages and microfinance;
Corporate and Commercial Banking – this incorporates non-personal direct debit facilities, current accounts, deposits, overdrafts, loans and other credit facilities;
Treasury – this incorporates the Group’s liquidity and investment management function, management of correspondent bank relationships, as well as foreign currency trading activities;
Investment Management Services- this incorporates investments, unit trusts, pension and other fund management, brokerage and advisory services, and the administration of trust accounts.
Insurance Services – this incorporates the provision of life and medical insurance, individual pension administration and annuities;
Other operations of the Group comprise the parent company.
Transactions between the business segments are on normal commercial terms and conditions.
Segment assets and liabilities comprise operating assets and liabilities, being the majority of items on the
statement of financial position, but exclude items such as taxation, retirement benefits asset and obligation
and borrowings. Eliminations comprise intercompany transactions and balances.
The Group’s operations are located mainly in Jamaica. The operations of subsidiaries located overseas
represent less than 10% of the Group’s operating revenue and assets.
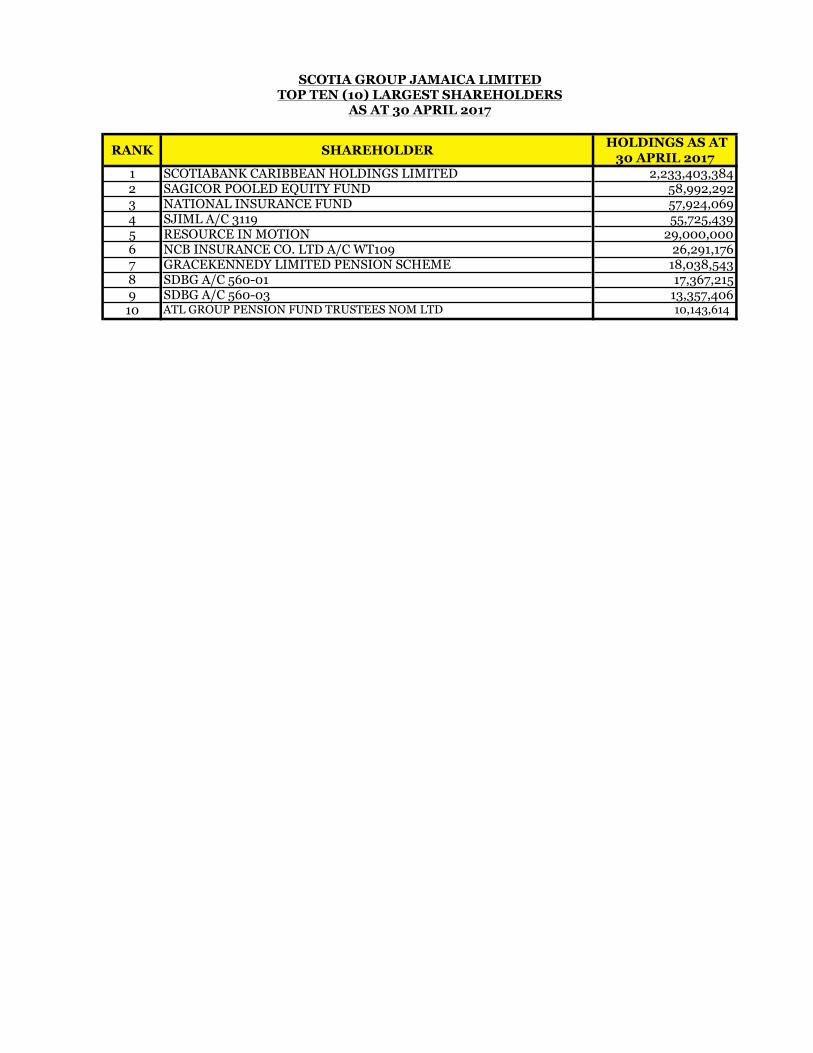
RANK SHAREHOLDER HOLDINGS AS AT 30 APRIL 2017
1 SCOTIABANK CARIBBEAN HOLDINGS LIMITED 2,233,403,3842 SAGICOR POOLED EQUITY FUND 58,992,2923 NATIONAL INSURANCE FUND 57,924,0694 SJIML A/C 3119 55,725,4395 RESOURCE IN MOTION 29,000,0006 NCB INSURANCE CO. LTD A/C WT109 26,291,1767 GRACEKENNEDY LIMITED PENSION SCHEME 18,038,5438 SDBG A/C 560-01 17,367,2159 SDBG A/C 560-03 13,357,40610 ATL GROUP PENSION FUND TRUSTEES NOM LTD 10,143,614
SCOTIA GROUP JAMAICA LIMITEDTOP TEN (10) LARGEST SHAREHOLDERS
AS AT 30 APRIL 2017
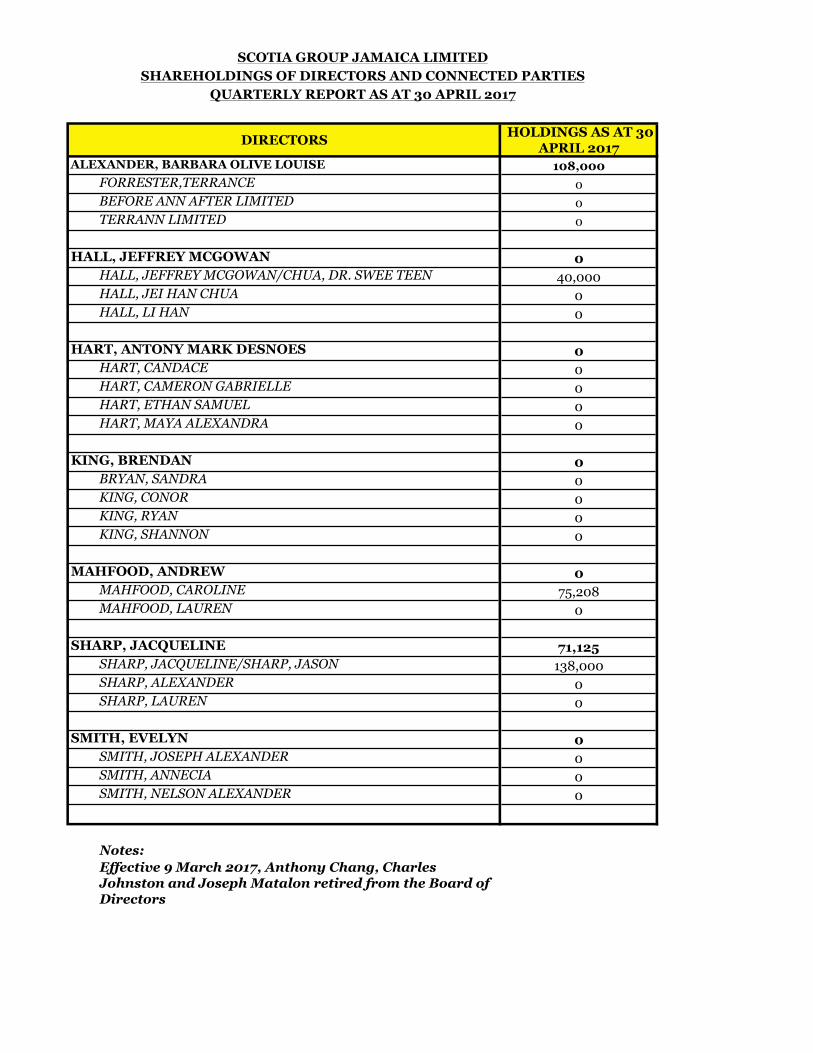
DIRECTORS HOLDINGS AS AT 30 APRIL 2017
ALEXANDER, BARBARA OLIVE LOUISE 108,000FORRESTER,TERRANCE 0BEFORE ANN AFTER LIMITED 0TERRANN LIMITED 0
HALL, JEFFREY MCGOWAN 0HALL, JEFFREY MCGOWAN/CHUA, DR. SWEE TEEN 40,000HALL, JEI HAN CHUA 0HALL, LI HAN 0
HART, ANTONY MARK DESNOES 0HART, CANDACE 0HART, CAMERON GABRIELLE 0HART, ETHAN SAMUEL 0HART, MAYA ALEXANDRA 0
KING, BRENDAN 0BRYAN, SANDRA 0KING, CONOR 0KING, RYAN 0KING, SHANNON 0
MAHFOOD, ANDREW 0MAHFOOD, CAROLINE 75,208MAHFOOD, LAUREN 0
SHARP, JACQUELINE 71,125SHARP, JACQUELINE/SHARP, JASON 138,000SHARP, ALEXANDER 0SHARP, LAUREN 0
SMITH, EVELYN 0SMITH, JOSEPH ALEXANDER 0SMITH, ANNECIA 0SMITH, NELSON ALEXANDER 0
Notes:Effective 9 March 2017, Anthony Chang, Charles Johnston and Joseph Matalon retired from the Board of Directors
SCOTIA GROUP JAMAICA LIMITEDSHAREHOLDINGS OF DIRECTORS AND CONNECTED PARTIES
QUARTERLY REPORT AS AT 30 APRIL 2017
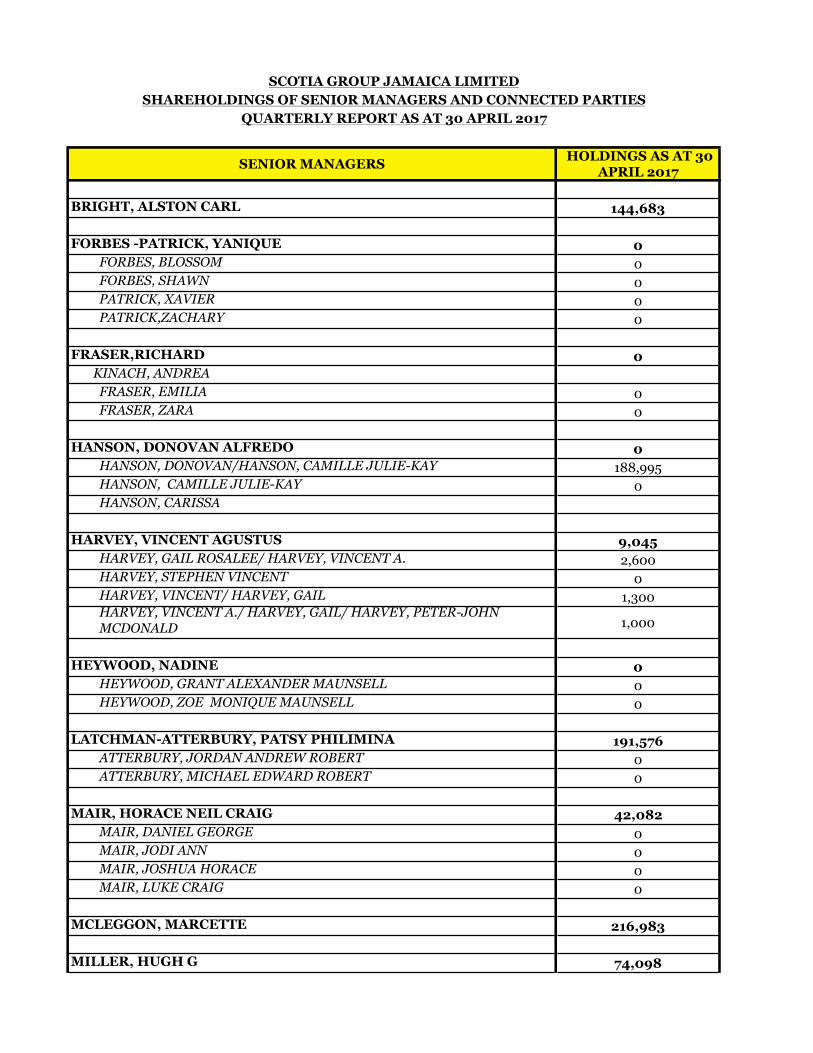
SENIOR MANAGERS HOLDINGS AS AT 30 APRIL 2017
BRIGHT, ALSTON CARL 144,683
FORBES -PATRICK, YANIQUE 0FORBES, BLOSSOM 0FORBES, SHAWN 0PATRICK, XAVIER 0PATRICK,ZACHARY 0
FRASER,RICHARD 0 KINACH, ANDREA
FRASER, EMILIA 0FRASER, ZARA 0
HANSON, DONOVAN ALFREDO 0HANSON, DONOVAN/HANSON, CAMILLE JULIE-KAY 188,995HANSON, CAMILLE JULIE-KAY 0HANSON, CARISSA
HARVEY, VINCENT AGUSTUS 9,045HARVEY, GAIL ROSALEE/ HARVEY, VINCENT A. 2,600HARVEY, STEPHEN VINCENT 0HARVEY, VINCENT/ HARVEY, GAIL 1,300HARVEY, VINCENT A./ HARVEY, GAIL/ HARVEY, PETER-JOHN MCDONALD 1,000
HEYWOOD, NADINE 0HEYWOOD, GRANT ALEXANDER MAUNSELL 0HEYWOOD, ZOE MONIQUE MAUNSELL 0
LATCHMAN-ATTERBURY, PATSY PHILIMINA 191,576ATTERBURY, JORDAN ANDREW ROBERT 0ATTERBURY, MICHAEL EDWARD ROBERT 0
MAIR, HORACE NEIL CRAIG 42,082MAIR, DANIEL GEORGE 0MAIR, JODI ANN 0MAIR, JOSHUA HORACE 0MAIR, LUKE CRAIG 0
MCLEGGON, MARCETTE 216,983
MILLER, HUGH G 74,098
SCOTIA GROUP JAMAICA LIMITEDSHAREHOLDINGS OF SENIOR MANAGERS AND CONNECTED PARTIES
QUARTERLY REPORT AS AT 30 APRIL 2017
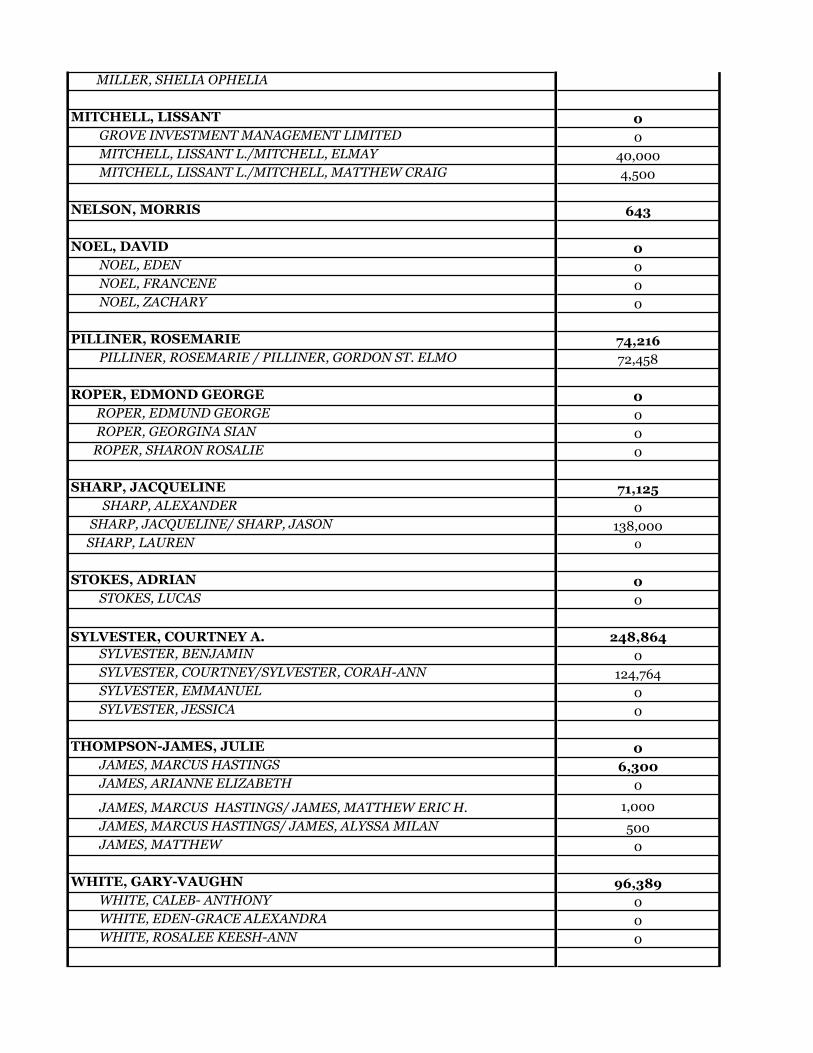
MILLER, SHELIA OPHELIA
MITCHELL, LISSANT 0GROVE INVESTMENT MANAGEMENT LIMITED 0MITCHELL, LISSANT L./MITCHELL, ELMAY 40,000MITCHELL, LISSANT L./MITCHELL, MATTHEW CRAIG 4,500
NELSON, MORRIS 643
NOEL, DAVID 0NOEL, EDEN 0NOEL, FRANCENE 0NOEL, ZACHARY 0
PILLINER, ROSEMARIE 74,216PILLINER, ROSEMARIE / PILLINER, GORDON ST. ELMO 72,458
ROPER, EDMOND GEORGE 0 ROPER, EDMUND GEORGE 0 ROPER, GEORGINA SIAN 0 ROPER, SHARON ROSALIE 0
SHARP, JACQUELINE 71,125 SHARP, ALEXANDER 0
SHARP, JACQUELINE/ SHARP, JASON 138,000 SHARP, LAUREN 0
STOKES, ADRIAN 0STOKES, LUCAS 0
SYLVESTER, COURTNEY A. 248,864SYLVESTER, BENJAMIN 0SYLVESTER, COURTNEY/SYLVESTER, CORAH-ANN 124,764SYLVESTER, EMMANUEL 0SYLVESTER, JESSICA 0
THOMPSON-JAMES, JULIE 0JAMES, MARCUS HASTINGS 6,300JAMES, ARIANNE ELIZABETH 0
JAMES, MARCUS HASTINGS/ JAMES, MATTHEW ERIC H. 1,000
JAMES, MARCUS HASTINGS/ JAMES, ALYSSA MILAN 500JAMES, MATTHEW 0
WHITE, GARY-VAUGHN 96,389WHITE, CALEB- ANTHONY 0WHITE, EDEN-GRACE ALEXANDRA 0WHITE, ROSALEE KEESH-ANN 0
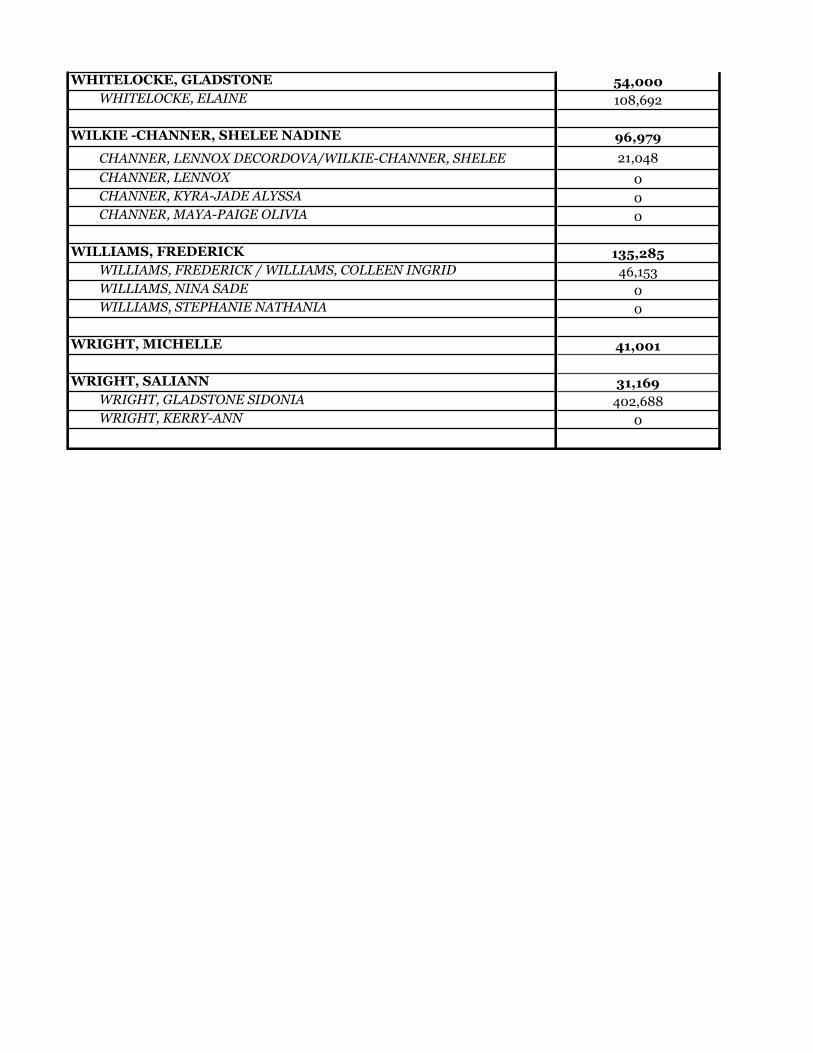
WHITELOCKE, GLADSTONE 54,000WHITELOCKE, ELAINE 108,692
WILKIE -CHANNER, SHELEE NADINE 96,979CHANNER, LENNOX DECORDOVA/WILKIE-CHANNER, SHELEE 21,048
CHANNER, LENNOX 0CHANNER, KYRA-JADE ALYSSA 0CHANNER, MAYA-PAIGE OLIVIA 0
WILLIAMS, FREDERICK 135,285WILLIAMS, FREDERICK / WILLIAMS, COLLEEN INGRID 46,153WILLIAMS, NINA SADE 0WILLIAMS, STEPHANIE NATHANIA 0
WRIGHT, MICHELLE 41,001
WRIGHT, SALIANN 31,169WRIGHT, GLADSTONE SIDONIA 402,688WRIGHT, KERRY-ANN 0