Embed Size (px)
Citation preview

(Unaudited translation of ‘Kessan Tanshin’, provided for reference only)April 27, 2018
Financial Highlights: Fiscal Year 2017 Ended March 31, 2018
1. Consolidated Financial Highlights ( from April 1, 2017 to March 31, 2018)
(All financial information has been prepared in accordance with accounting principles generally accepted in Japan)
(1) Operating Results
Revenues
Operating profit
Ordinary profit
Profit attributable to owners of parent
Net income (loss) per share
Diluted net income per share
Return to shareholders' equityReturn to shareholders' equityReturn to shareholders' equityReturn to shareholders' equity
Rate of ordinary income on assetsRate of ordinary income on assetsRate of ordinary income on assetsRate of ordinary income on assets
Operating profit ratioOperating profit ratioOperating profit ratioOperating profit ratio
*The Company consolidated its common shares on the basis of one (1) unit for every ten (10) shares effective October 1, 2017.
Accordingly, net income per share and diluted net income per share are calculated on the assumption that the consolidation
of shares was conducted at the beginning of the previous fiscal year ended March 31, 2017.
(2) Financial Position
Total assets
Total net assets
Shareholders' equity / Total assets
Shareholders' equity per share
* Shareholders' equity is defined as follows.
Shareholders' equity = Total net assets - ( Share subscription rights + Non-controlling interests )
* Shareholder's equity per share is calculated on the assumption that the consolidation of shares was conducted at the
beginning of the previous fiscal year ended March 31, 2017.
2. Dividends(¥) (¥Million)
Dividend per share
Q1 Q2 Q3 Year end Total
FY2016
FY2017
FY2018 (Forecast)
* The year-end dividend per share for the fiscal year ended March 31, 2018 represents the amount with impacts
from the consolidation of shares taken into consideration and the total annual dividend is indicated as “-.”
The total annual dividend per share is ¥20.00 for the fiscal year ended March 31, 2017 and ¥20.00 for the fiscal
year ended March, 2018, which are calculated on the assumption that the consolidation of shares was conducted
at the beginning of the previous fiscal year ended March 31, 2017.
3. Forecast for the Fiscal Year Ending March 31, 2019
* Underlying Assumption for FY2018 Forecast.
The above forecast is made assuming the exchange rate and the bunker price for FY2018 will be as follows.
Exchange Rate 1US$=¥105.00 Bunker Price US$ 400/MT
( Translation of foreign currencies )
The Japanese yen amounts for FY2018 have been translated into U.S. dollars using the prevailing exchange rate at March 31, 2018, which was ¥106.24 to U.S. $1.00,
solely for the convenience of readers.
(The convenience translations should not be construed as representations that the Japanese yen amounts have been, could have been, or could in the future be, converted into U.S. dollars at this or any other rate of exchange.)
FY2017
1,652,393 1,504,373
22,684
15,553,398
213,517
296,244
(445,971)(47,380)
(US$ )
(3.729)
―
43.95
FY2016 FY2017
FY2018FY2018
(US$ Thousand)
(US$ Thousand)
(¥Million)
(¥Million)
2,558
25,426
FY2017
―
25.8%
(¥Million)
20,949,134
5,911,559
40.237
―
(¥) (US$ )
―2.00―
Dividend ratio to
shareholders'
equity
50.00 19.9%
2.00 2,392 45.5% 0.4%
2,392 ― 0.4%
Dividend
pay-out ration
Total
dividends paid
10.00
30.00―
0.00
2.389
285,714
380,952
―
FY2018 FY2018
1,130,000
23,000
40,000
30,000
219,048
10,761,905
(¥) (US$ )
250.84
1.00 ―
20.00
Net income per share
Revenues
Operating profit
Ordinary profit
Profit attributable to owners of parent
(US$ Thousand)
FY2017 FY2016
4,782.254,274.81
23.0%
2,225,636
628,044
2,217,528
40.61
683,621
―
5,257
(¥)
(8.7%) 0.9%
1.4% 1.1%
1.4% 0.2%
31,473
(396.16)
- 1 -

(Unaudited translation of ‘Kessan Tanshin’, provided for reference only)April 27 , 2018
(Reference)(Reference)(Reference)(Reference)1. Non-Consolidated Financial Highlights 1. Non-Consolidated Financial Highlights 1. Non-Consolidated Financial Highlights 1. Non-Consolidated Financial Highlights ( from April 1, 2017 to March 31, 2018 )( from April 1, 2017 to March 31, 2018 )( from April 1, 2017 to March 31, 2018 )( from April 1, 2017 to March 31, 2018 )
(All financial information has been prepared in accordance with accounting principles generally accepted in Japan)
(1) Operational Results (1) Operational Results (1) Operational Results (1) Operational Results
(¥Million) (US$ Thousand)
FY2017
RevenuesRevenuesRevenuesRevenues 11,507,662
Operating profit (loss)Operating profit (loss)Operating profit (loss)Operating profit (loss) 26,619
Ordinary profitOrdinary profitOrdinary profitOrdinary profit 167,018
Net lossNet lossNet lossNet loss (620,633)
(¥) (US$ )
Net loss per shareNet loss per shareNet loss per shareNet loss per share (5.189)
Diluted net income per shareDiluted net income per shareDiluted net income per shareDiluted net income per share -(2) Financial Position(2) Financial Position(2) Financial Position(2) Financial Position
(¥Million) (US$ Thousand)
FY2017
Total assetsTotal assetsTotal assetsTotal assets 10,002,363
Total net assetsTotal net assetsTotal net assetsTotal net assets 1,625,311
Shareholders' equity / Total assets Shareholders' equity / Total assets Shareholders' equity / Total assets Shareholders' equity / Total assets
(¥) (US$ )
FY2017
Shareholders' equity per shareShareholders' equity per shareShareholders' equity per shareShareholders' equity per share 13.430
( Translation of foreign currencies )
The Japanese yen amounts for FY2018 have been translated into U.S. dollars using the prevailing exchange rate at March 31, 2018,
which was ¥106.24 to U.S. $1.00, solely for the convenience of readers.
(The convenience translations should not be construed as representations that the Japanese yen amounts have been,
could have been, or could in the future be, converted into U.S. dollars at this or any other rate of exchange.)
FY2017 FY2016
1,222,574 1,052,200
2,828 (27,450)
17,744 13,119
(65,936) (9,950)
(551.30) (83.19)- -FY2017 FY2016
1,062,651 1,055,752
1,426.85 1,995.75
172,673 236,370
16.1% 22.2%
FY2017 FY2016
- 2 -

(Unaudited translation of ‘Kessan Tanshin’, provided for reference only) April 27, 2018
- 3 -
4. Business Performance and Financial Position
(1) Analysis of Operating Results [Financial Highlights] (Billions of Yen)
FY2016 FY2017 Year-on-year comparison (variance)
From Apr. 1, 2016 to Mar. 31, 2017
From Apr. 1, 2017 to Mar. 31, 2018
Revenue 1,504.3 1,652.3 148.0 / 9.8%
Operating profit (loss) 2.5 22.6 20.1 / 786.7%
Ordinary profit (loss) 25.4 31.4 6.0 / 23.8%
Profit/(loss) attributable to owners of parent
5.2 (47.3) (52.6) / -%
Exchange rate ¥108.57/US$ ¥111.08/US$ ¥2.51/US$
Bunker price US$284/MT US$354/MT US$70/MT
In the global economy during the fiscal year under review, overall, a trend of stable expansion seen in the last
year continued to prevail. In the U.S. economy, there was ongoing recovery in personal consumption amid
favorable employment and income environments, the corporate sector continued to recover in production and
exports and a trend of expansion was maintained. In the European economy, personal consumption was firm
amid improvement in the employment environment and a moderate recovery continued. The Chinese
economy continued firmly with personal consumption expanding stably on the back of favorable
employment and income environments, and exports also expanding on the tailwind of a recovering global
economy. In Japan, economic recovery continued, with ongoing favorable employment and income
environments and a continuing moderate recovery of personal consumption, along with a recovery in
demand in the corporate sector both in Japan and overseas.
Looking at the maritime shipping market conditions, the dry bulker market proceeded firmly at a
considerably higher level compared with the previous fiscal year, supported by strong cargo movements of
iron ore, grain cargo from the east coast of South America, and coal, which is one of mainstay cargos. The
very large crude oil carrier (VLCC) market, without a significant rise over the winter demand season,
dropped below the previous fiscal year’s levels even for the entire full year, against a backdrop of a surplus
of vessels brought about by factors such as a vessel supply increase, delays in the progress of the retirement
of aged vessels, and permeating adverse effects of decisions by OPEC countries to reduce oil production. In
the containership freight market, there were observable improvements in the supply and demand
environment on Asia-North America, Asia-Europe and Asia-South America routes, which facilitated a
recovery in the spot freight rates. In particular, on the Asia-East Coast of South America routes, cargo
volumes recovered sharply as the Brazilian economy showed signs of pickup, and spot freight rates began
sharply rising from the beginning of spring and stayed strong throughout the fiscal year.
The average exchange rate of Japanese yen against the U.S. dollar during the fiscal year depreciated by ¥2.51
year on year to ¥111.08. The average bunker price during the same period rose by US$70/MT year on year to
US$354/MT.

(Unaudited translation of ‘Kessan Tanshin’, provided for reference only) April 27, 2018
- 4 -
The Company established a joint-venture company to integrate the container shipping business, Ocean
Network Express Pte. Ltd. (ONE). In relation to the business integration, losses related to the charter-out of
vessels to ONE, losses on liquidation of the Company’s agencies, and others are projected to be incurred
from FY2018 and afterwards. Therefore, the company has recorded a loss as “loss related to business
restructuring”, the majority of which is provisions for the above-mentioned future integration-related loss.
As a result of the above, although revenue of ¥1,652.3 billion, operating profit of ¥22.6 billion, and ordinary
profit of ¥31.4 billion all were higher compared with the previous fiscal year, loss attributable to owners of
parent was ¥(47.3) billion.
The following is a summary of business conditions including revenue and ordinary profit/loss per business
segment.
Upper: Revenue, Lower: Segment Profit (Loss) (Ordinary Profit (Loss)) (Billions of Yen)
FY2016 FY2017 Year-on-year comparison (variance)
From Apr. 1, 2016 to Mar. 31, 2017
From Apr. 1, 2017 to Mar. 31, 2018
Dry Bulk Business 267.8 272.9 5.0 / 1.9%
11.9 15.4 3.4 / 28.7%
Energy Transport Business 266.2 270.9 4.7 / 1.8%
26.4 13.6 (12.8) / (48.6)%
Product Transport Business
Containerships 622.5 751.6 129.0 / 20.7%
(32.8) (10.6) 22.1 / – %
Car Carriers, Ferries and Coastal RoRo Ships
250.8 261.4 10.5 / 4.2%
4.8 4.3 (0.4) / (9.8)%
Associated Businesses 117.5 118.4 0.9 / 0.8%
12.3 12.6 0.3 / 2.6%
Others 23.9 22.5 (1.4) / (6.0)%
2.0 2.6 0.5 / 26.8%
Note: Revenue includes internal sales or transfers among segments.
(A) Dry Bulk Business
In the Capsize bulker market, although the market continued to fall for the first half of the fiscal year due to
the prolonged impact of a cyclone in eastern Australia, it began rising together with freight rates for cargoes
loaded in Brazil, which started rebounding from the summer. From November onward the market has
proceeded firmly, as cargo volume of iron ore began to increase and the market rose further, and then in
mid-December the Capsize bulker market rate reached US$30,000 per day for the first time in four years.
The Panamax market had risen to US$12,000 per day in mid-April but thereafter been stagnant until
mid-June, and repeatedly rose and fell after mid-June. However, from late July onward, it proceeded firmly
with a tight balance between supply and demand due to the strong cargo movements of grain from the east
coast of South America and coal which is one of mainstay cargos. In accordance with the pick-up in the
overall dry bulker market, the markets for the Handymax and smaller-sized bulkers also proceeded firmly,
boosted by the energized trade cargo volume, improved supply and demand balance and a series of urgent
vessel chartering activities caused by port congestion and climate conditions. Facing such market conditions,

(Unaudited translation of ‘Kessan Tanshin’, provided for reference only) April 27, 2018
- 5 -
the dry bulk business increased its ordinary profit year on year due to the continued effect of the business
structural reforms and efforts to cut costs.
(B) Energy Transport Business
<Tankers>
The very large crude oil carrier (VLCC) market did not rise over the winter demand period and dropped
below the previous fiscal year’s levels, even for the entire full year against a backdrop of a surplus of vessels
brought about by factors such as a steady pace of new vessel deliveries, delays in the progress of the
retirement of aged vessels, and permeating adverse effects of decisions by OPEC countries to reduce oil
production. The product tanker market proceeded weakly due to factors such as a slowdown in cargo
movements between East and West along with increased pressures of supply arising from new vessel
deliveries, despite a brief surge in the market caused by hurricanes striking the U.S. in the summer. Even in
the winter, despite cold snaps in the U.S. and Europe, the effect of this on boosting the market was limited
and overall, the product tanker market remained weak compared with the previous fiscal year. As for the
LPG carrier market, the market followed a downward trend in the first half of the fiscal year with a reduction
of arbitrage-trading from the U.S. to Asia due to diminishing LPG price variations between regions. On the
other hand, during the period from autumn through winter, the market trended upwards owing to firm LPG
shipments mainly from the U.S., despite temporary fluctuations due to changing circumstances in the vessel
supply and demand balance. As a result, LPG carrier market for the entire full year was roughly the same
level as the previous fiscal year. Operating in such a business environment, the tanker division experienced a
profit decrease year on year, but nevertheless achieved a certain profit for the fiscal year as a result of stable
fulfilment of long-term contracts, such as charter contracts, and the steady implementation of contract
extensions, as well as ceaseless efforts to improve operating efficiency through pool operations and cost
reduction.
<LNG Carriers/Offshore business>
The LNG carrier division, benefiting from stable revenues from long-term contracts, was able to secure a
profitable operation overall. During the fiscal year, the division received delivery of five new vessels,
including one for the world’s first ice-breaking LNG carrier project. The offshore business division also
continued its performance of the previous fiscal year and recorded a stable ordinary profit, brought about by
operations of one new FPSO and one new FSRU during the fiscal year in addition to the existing projects.
(C) Product Transport Business
<Containerships>
The spot freight market on the Asia-North America routes, although slumping in the first quarter, rose over
the summer period with cargo volumes for this fiscal year proceeding at a record high pace. Over winter, the
increased pressures of vessel supply caused market weakness, but the market once again began rising during
the busy period before the Chinese New Year in February. On the Asia-Europe routes, although there was a

(Unaudited translation of ‘Kessan Tanshin’, provided for reference only) April 27, 2018
- 6 -
significant recovery in cargo volume, this rise was picked up by new deployments of large-sized vessels at
each liner company, causing the spot freight rates to remain relatively stable over the entire year. There was
also a notable increase in backhaul cargo volumes to Asia. On the Asia-East Coast of South America routes,
cargo volumes recovered sharply as a result of a pick-up in the Brazilian economy, and spot freight rates,
which sharply rose from the beginning of spring and sometimes spiked largely, made a significant
contribution to improving profitability. Needing to make use of the increased space provided by the launches
of large containerships, the division energetically secured annual contracts in the beginning of spring,
thereby limiting the amount of profits received from spot freight rates, which had risen from summer onward.
Although the Company recorded the costs related to a containership joint-venture company (Ocean Network
Express Pte. Ltd.) established in July 2017 as equity in losses of affiliated companies, the ordinary loss in the
containership business overall was improved year on year by reducing slot cost due to the launches of large
containerships, and also the ongoing effects of cost reduction.
<Car Carriers> Although the transportation volume of completed cars continued to be firm to North America, Asia and
Oceania, there are no prospects of a full-fledged recovery to the resource-producing countries under the
current climate of sluggish resource prices. Ordinary profit was up from the previous fiscal year due to
ongoing efforts to reduce the number of ships and to improve operation efficiency in response to changes in
the trade patterns.
<Ferries and Coastal RoRo Ships>
In the business of ferries and coastal RoRo ships, the cargo volume was firm as a result of further accelerated
modal shift, which reflects changes in the trucking labor situation such as shortage and aging of the
workforce, and tighter labor controls. The MOL Group has solidly captured the flow of business, such as the
firm cargo volume, and carried out promotion activities selling the concept of casual cruises to increase
passengers. As a result, operations proceeded firmly, particularly for the Western Japan routes. Nevertheless,
due to factors such as a delay in new ferry delivery and higher bunker prices, ordinary profit was down year
on year for the business of ferries and coastal RoRo ships overall.
(D) Associated Businesses
The cruise ship business recorded a year-on-year decrease in ordinary profit due mainly to the effect of
cruise cancellations because of the impact of typhoons, despite healthy passenger sales for the Nippon Maru.
In the real estate business, ordinary profit increased year on year owing mainly to Daibiru Corporation, the
core company in the MOL Group’s real estate business, increasing its sales on the back of the firm office
leasing market, centered on the Tokyo metropolitan area. Other associated businesses, such as the tugboat
and trading businesses, also showed firm performances overall. Consequently, ordinary profit of the
associated businesses segment increased on a year-on-year basis.

(Unaudited translation of ‘Kessan Tanshin’, provided for reference only) April 27, 2018
- 7 -
(E) Others
Other businesses, which are mainly cost centers, include ship operations, ship management, ship chartering,
financing, and shipbuilding. Ordinary profit in this segment increased year on year.
(2) Outlook for FY2018
[For FY2018] (Billions of Yen)
FY2017 From Apr. 1, 2017 to Mar. 31, 2018
Outlook for FY2018 From Apr. 1, 2018 to Mar. 31, 2019
Year-on-year comparison (variance)
Revenue 1,652.3 1,130.0 (522.3) / (31.6)%
Operating profit (loss) 22.6 23.0 0.3 / 1.4 %
Ordinary profit (loss) 31.4 40.0 8.5 / 27.1 %
Profit (loss) attributable to owners of parent
(47.3) 30.0 77.3 / -%
Exchange rate ¥111.08/US$ ¥105.00/US$ ¥(6.08)/US$
Bunker price US$354/MT US$400/MT US$46/MT
(Assumption for FY2018)
We anticipate that the world economy will continue its expansionary trend and proceed firmly in the next
fiscal year. However, we also recognize the need to closely monitor monetary policies of the U.S. and Europe,
trend toward trade friction centered on the U.S., and geopolitical risk in East Asia. In the developed countries,
we anticipate that firm economic recovery will continue, particularly in the U.S., where the economy is
growing under tax reforms and financial stimulus measures. In the economies of emerging countries, we
anticipate stable expansion of the economy, as although the pace of economic growth in China is expected to
slowly moderate, the economies of India and ASEAN are expected to maintain firm growth. The level of the
dry bulker market is expected to remain higher than the current fiscal year due to a certain level of the vessel
demand being supported by an increase in cargo volumes due to firm demand of iron ore from China, and an
increase in grain shipments from South America, and other factors. With respect to the very large crude oil
carrier (VLCC) market, although crude oil cargo volumes are expected to be flat from the Middle East
stemming from prolonged OPEC production reductions, we expect a small increase in the seaborne crude oil
cargo volume overall as we anticipate that the increase in exports of crude oil produced in the Atlantic Ocean,
such as North-American produced shale oil, will provide growth for crude oil demand. Meanwhile, in terms
of vessel supply, while we expect the number of new vessels coming into operation at the same high level as
the previous fiscal year, we expect that the VLCC market will remain in an adjustment phase for the medium
term, taking into account that the number of aged ships being scrapped is continuing at a high level due to
firm scrapping prices. As for the product tanker market, although we anticipate trade to be invigorated due to
a continuing trend of increasing exports of petroleum products from countries such as India and China, and
increased demand for petroleum products in emerging countries, we expect the market to remain weak
because we don’t expect any sudden growth in the number of vessels getting scrapped despite the continuing
delivery of new vessels. With respect to the containership business, Ocean Network Express Pte. Ltd. (ONE),

(Unaudited translation of ‘Kessan Tanshin’, provided for reference only) April 27, 2018
- 8 -
a company established through the integration of the containership businesses of MOL, Kawasaki Kisen
Kaisha, Ltd. and Nippon Yusen Kabushiki Kaisha, took over MOL’s pre-existing operations and started
services in April this year. ONE’s operations combine the best practices cultivated by the respective
containership businesses of MOL, Kawasaki Kisen Kaisha, Ltd., and Nippon Yusen Kabushiki Kaisha, and
utilize the merit of scale of the business achieved by the integration in order to strengthen profitability.
In consideration of these prospects, for the full year, we project revenue of ¥1,130.0 billion, operating profit
of ¥23.0 billion, ordinary profit of ¥40.0 billion and profit attributable to owners of parent of ¥30.0 billion.
5. Financial Position
Total assets as of March 31, 2018 increased by ¥ 8.1billion compared to the balance as of the end of the
previous fiscal year, to ¥ 2,225.6billion. This was primarily due to the increase in Investment securities.
Total liabilities as of March 31, 2018 increased by ¥ 63.6billion compared to the balance as of the end of the
previous fiscal year, to ¥ 1,597.5billion. This was primarily due to the increase in Short-term bank loans.
Total net assets as of March 31, 2018 decreased by ¥ 55.5billion compared to the balance as of the end of the
previous fiscal year, to ¥ 628billion. This was primarily due to the decrease in Retained earnings.
As a result, shareholders’ equity ratio decreased by 2.8% compared to the ratio as of the end of the previous
Fiscal year, to 23.0%.
6. Cash Flow
Cash and cash equivalents (hereinafter called “cash”) as of the end of FY2017 was ¥ 189.5billion, an
increase of ¥ 2.7billion compared to the balance as of the end of the previous fiscal year. Cash flows on each
activity are as follows.
Net cash provided by operating activities during FY2017 was ¥ 98.3billion (while net cash provided by
FY2016 was ¥ 17.6billion), mainly due to Depreciation and amortization ¥ 86.6billion, partially offset by
Loss before income taxes and non-controlling interests (¥ 28.7billion).
Net cash used in investing activities during FY2017 was ¥ 100.8billion (while net cash used in FY2016 was
¥ 73.9billion), mainly due to Purchase and proceeds from sale of vessels and other non-current assets .
Net cash provided by financing activities during FY2017 was ¥ 9.2billion (while net cash provided by
FY2016 was ¥ 87.1billion), mainly due to Proceeds from long-term bank loans.
7. Basic policy on profit sharing and dividends
Our key management policies are to enhance corporate value with proactive capital investment and to
directly return profits to shareholders through dividend. Utilizing our internal capital reserves, we work to
reinforce corporate strength and strive to further raise our per-share corporate value. In the coming terms,
with a 20% dividend payout ratio as a guideline, we will pay dividends linked with business performance,
and we will address the need to increase the ratio as a medium- and long-term management issue.

(Unaudited translation of ‘Kessan Tanshin’, provided for reference only) April 27, 2018
- 9 -
As for the fiscal year under review, we will distribute dividends of surplus (a year-end dividend) at ¥10.00
per share for the fiscal year under review. We will pay an annual dividend of ¥20.00 per share including the
interim dividend of ¥10.00 per share (*)
(*) With an effective date of October 1, 2017, a 10:1 share consolidation of common stock was implemented.
The interim dividend for the fiscal year under review is presented assuming that the shares were consolidated
at the beginning of the fiscal year under review. The interim dividend without factoring in the consolidation
of shares would be ¥1.00.
As for dividends of surplus for the next fiscal year, we plan to pay an annual dividend of ¥50.00 per share,
comprising an interim dividend of ¥20.00 per share and a year-end dividend of ¥30.00 per share on the
assumption that we secure the income described in our outlook for the next fiscal year.

(Unaudited translation of ‘Kessan Tanshin’, provided for reference only) April 27, 2018
- 10 -
8. Consolidated Financial Statements (All financial information has been prepared in accordance with accounting principles generally accepted in Japan)
(1) Consolidated Balance Sheets
(¥Million)
As of March 31, 2017 As of March 31, 2018
Assets
Current assets
Cash and deposits 177,145 192,797
Trade receivables 130,420 125,851
Marketable securities 12,800 500
Inventories 36,358 38,679
Deferred and prepaid expenses 60,888 61,918
Deferred tax assets 1,273 1,334
Other current assets 63,020 59,357
Allowance for doubtful accounts (428) (401)
Total current assets 481,477 480,036
Fixed assets
Tangible fixed assets
Vessels 756,930 776,554
Buildings and structures 153,767 148,598
Equipment and others 26,630 31,581
Furniture and fixtures 5,366 4,137
Land 221,342 221,045
Construction in progress 156,935 106,128
Other tangible fixed assets 2,693 2,884
Total tangible fixed assets 1,323,665 1,290,929
Intangible fixed assets 31,287 30,163
Investments and other assets
Investment securities 231,978 274,527
Long-term loans receivable 62,796 73,403
Long-term prepaid expenses 6,824 6,388
Net defined benefit asset 15,390 18,811
Deferred tax assets 3,535 3,212
Other investments and other assets 62,661 50,583
Allowance for doubtful accounts (2,089) (2,421)
Total investments and other assets 381,097 424,506
Total fixed assets 1,736,051 1,745,599
Total assets 2,217,528 2,225,636

(Unaudited translation of ‘Kessan Tanshin’, provided for reference only) April 27, 2018
- 11 -
(¥Million)
As of March 31, 2017 As of March 31, 2018
Liabilities
Current liabilities
Trade payables 125,118 131,405
Short-term bonds 20,000 31,872
Short-term bank loans 133,155 180,539
Commercial papers - 5,000
Accrued income taxes 6,642 6,395
Advances received 32,258 34,409
Deferred tax liabilities 1,188 590
Allowance for bonuses 4,402 4,567
Allowance for directors' bonuses 153 186
Other current liabilities 60,537 83,320
Total current liabilities 383,456 478,287
Fixed liabilities
Bonds 210,595 175,748
Long-term bank loans 738,163 706,944
Lease obligations 18,371 15,977
Deferred tax liabilities 56,678 55,225
Net defined benefit liabilities 12,445 12,909
Directors' and corporate auditors' retirement
benefits 1,459 1,487
Reserve for periodic drydocking 18,566 20,647
Other fixed liabilities 94,171 130,364
Total fixed liabilities 1,150,450 1,119,304
Total liabilities 1,533,907 1,597,591
Net assets
Owners' equity
Common stock 65,400 65,400
Capital surplus 45,382 45,385
Retained earnings 355,263 306,642
Treasury stock (6,820) (6,807)
Total owners' equity 459,226 410,620
Accumulated other comprehensive income
Unrealized holding gains on available-for-sale
securities, net of tax 28,353 33,400
Unrealized gains on hedging derivatives, net of
tax 54,326 37,873
Foreign currency translation adjustments 27,178 23,442
Remeasurements of defined benefit plans, net of
tax 2,898 5,905
Total accumulated other comprehensive income 112,757 100,621
Share subscription rights 2,447 2,026
Non-controlling interests 109,190 114,776
Total net assets 683,621 628,044
Total liabilities and net assets 2,217,528 2,225,636

(Unaudited translation of ‘Kessan Tanshin’, provided for reference only) April 27, 2018
- 12 -
(2) Consolidated Statements of Income
(¥Million)
FY2016
(Apr.1,2016-Mar 31, 2017) FY2017
(Apr.1,2017-Mar 31, 2018)
Shipping and other revenues 1,504,373 1,652,393
Shipping and other expenses 1,388,264 1,513,736
Gross operating income 116,109 138,656
Selling, general and administrative expenses 113,551 115,972
Operating profit 2,558 22,684
Non-operating income
Interest income 5,918 7,976
Dividend income 6,021 6,661
Equity in earnings of affiliated companies 5,543 -
Foreign exchange gains 24,179 16,834
Others 3,875 3,930
Total non-operating income 45,538 35,402
Non-operating expenses
Interest expense 19,037 20,413
Equity in losses of affiliated companies - 3,428
Others 3,633 2,771
Total non-operating expenses 22,670 26,613
Ordinary profit 25,426 31,473
Extraordinary income
Gain on sale of fixed assets 6,125 16,979
Others 29,080 4,587
Total extraordinary income 35,206 21,566
Extraordinary losses
Loss on sale of fixed assets 1,259 1,310
Loss related to business restructuring - 73,476
Impairment loss 22,273 -
Others 13,795 6,962
Total extraordinary losses 37,328 81,748
Income (loss) before income taxes and non-cotrolling
interests 23,303 (28,709)
Income taxes - current 13,323 10,729
Income taxes - deferred (625) 2,002
Total income taxes 12,698 12,731
Net income (loss) 10,605 (41,440)
Profit attributable to non-controlling interests 5,348 5,939
Profit (loss) attributable to owners of parent 5,257 (47,380)

(Unaudited translation of ‘Kessan Tanshin’, provided for reference only) April 27, 2018
- 13 -
(3) Consolidated Statements of Comprehensive Income
(¥Million)
FY2016
(Apr.1,2016-Mar.31, 2017) FY2017
(Apr.1,2017-Mar.31, 2018)
Net income (loss) 10,605 (41,440)
Other comprehensive income
Unrealized holding gains on available-for-sale
securities, net of tax 8,768 5,839
Unrealized gains on hedging derivatives, net of tax 13,070 (22,402)
Foreign currency translation adjustments 2,463 (773)
Remeasurements of defined benefit plans, net of tax 2,944 3,007
Share of other comprehensive income of associates
accounted for using equity method 4,100 3,501
Total other comprehensive income 31,347 (10,828)
Comprehensive income 41,952 (52,268)
(Breakdown)
Comprehensive income attributable to owners of
parent 35,183 (59,516)
Comprehensive income attributable to non-
controlling interests 6,769 7,247

(Unaudited translation of ‘Kessan Tanshin’, provided for reference only) April 27, 2018
- 14 -
(4) Consolidated Statement of Changes in Net assets
FY2017 (April 1, 2017 – March 31, 2018)
(¥Million)
Shareholders' equity
Common stock Capital surplus Retained earnings Treasury shares Total owners' equity
Balance at Mar, 2017 65,400 45,382 355,263 (6,820) 459,226
Issuance of new shares - exercise of share acquisition rights
12 12
Dividends of surplus (1,196) (1,196)
Loss attributable to owners of parent (47,380) (47,380)
Change of scope of consolidation 3 3
Purchase of treasury shares (98) (98)
Disposal of treasury shares (47) 98 51
Purchase of shares of consolidated subsidiaries 2 2
Net changes of items other than shareholders' equity -
Total changes of items during period - 2 (48,620) 13 (48,605)
Balance at Mar, 2018 65,400 45,385 306,642 (6,807) 410,620
Accumulated other comprehensive income
Share subscription rights
Non-controlling
interests
Total net assets
Unrealized holding gains on
available-for-sale
securities, net of tax
Unrealized gains on hedging
derivatives, net of tax
Foreign currency
translation adjustments
Remeasurements of defined benefit
plans, net of tax
Total accumul
ated other
comprehensive income
Balance at Mar, 2017 28,353 54,326 27,178 2,898 112,757 2,447 109,190 683,621
Issuance of new shares - exercise of share acquisition rights
(12) -
Dividends of surplus (1,196)
Loss attributable to owners of parent (47,380)
Change of scope of consolidation 3
Purchase of treasury shares (98)
Disposal of treasury shares 51
Purchase of shares of consolidated subsidiaries 2
Net changes of items other than shareholders' equity
5,046 (16,453) (3,735) 3,006 (12,135) (408) 5,585 (6,959)
Total changes of items during period
5,046 (16,453) (3,735) 3,006 (12,135) (420) 5,585 (55,576)
Balance at Mar, 2018 33,400 37,873 23,442 5,905 100,621 2,026 114,776 628,044

(Unaudited translation of ‘Kessan Tanshin’, provided for reference only) April 27, 2018
- 15 -
(5) Consolidated Statements of Cash flows
(¥Million)
FY2016
(Apr.1,2016-Mar 31, 2017) FY2017
(Apr.1,2017-Mar 31, 2018)
Cash flows from operating activities
Income (loss) before income taxes and non-
cotrolling interests 23,303 (28,709)
Depreciation and amortization 87,190 86,629
Impairment loss 22,273 -
Loss related to business restructuring - 73,476
Equity in losses (earnings) of affiliated companies (5,543) 3,428
Various provisions (reversals) (20,053) 1,021
Decrease (increase) in net defined benefit asset 1,996 785
Increase (Decrease) in net defined benefit liabilities (755) 539
Interest and dividend income (11,939) (14,637)
Interest expense 19,037 20,413
Loss (gain) on sales and retirement of non-current
assets (3,938) (13,471)
Foreign exchange loss (gain), net (25,818) (17,480)
Decrease (Increase) in trade receivables (1,683) 4,690
Decrease (Increase) in inventories (8,691) (2,423)
Increase (Decrease) in trade payables (573) 6,218
Others, net (45,200) (6,549)
Sub total 29,602 113,934
Interest and dividend income received 15,351 18,662
Interest expenses paid (18,778) (21,208)
Income taxes paid (8,551) (13,007)
Net cash provided by (used in) operating activities 17,623 98,380
Cash flows from investing activities
Purchase of investment securities (14,533) (41,288)
Proceeds from sale and redemption of investment
securities 27,738 2,029
Purchase of vessels and other non-current assets (143,177) (142,570)
Proceeds from sale of vessels and other
non-current assets 71,350 89,446
Net decrease (increase) in short-term loans
receivables (6,652) (28)
Disbursements for long-term loans receivables (21,374) (29,866)
Collection of long-term loans receivables 9,832 22,092
Others, net 2,876 (666)
Net cash provided by (used in) investing activities (73,941) (100,851)
(Unaudited translation of ‘Kessan Tanshin’, provided for reference only) April 27, 2018
- 16 -
(¥Million)
FY2016
(Apr.1,2016-Mar 31, 2017) FY2017
(Apr.1,2017-Mar 31, 2018)
Cash flows from financing activities
Net increase (decrease) in short-term bank loans 9,907 60,125
Net increase (decrease) in commercial paper - 5,000
Proceeds from long-term bank loans 239,075 96,812
Repayments of long-term bank loans (119,252) (127,272)
Proceeds from issuance of bonds 10,000 -
Redemption of bonds (45,000) (20,000)
Cash dividends paid by the company (4,258) (1,214)
Cash dividends paid to non-controlling interests (1,018) (1,450)
Others, net (2,323) (2,757)
Net cash provided by (used in) financing activities 87,129 9,243
Effect of foreign exchange rate changes on cash and
cash equivalents (3,454) (4,025)
Net increase (decrease) in cash and cash equivalents 27,357 2,746
Cash and cash equivalents at beginning of year 159,449 186,844
Net cash increase from new consolidation/de-
consolidation of subsidiaries 37 -
Cash and cash equivalents at end of period 186,844 189,591
(Unaudited translation of ‘Kessan Tanshin’, provided for reference only) April 27, 2018
- 17 -
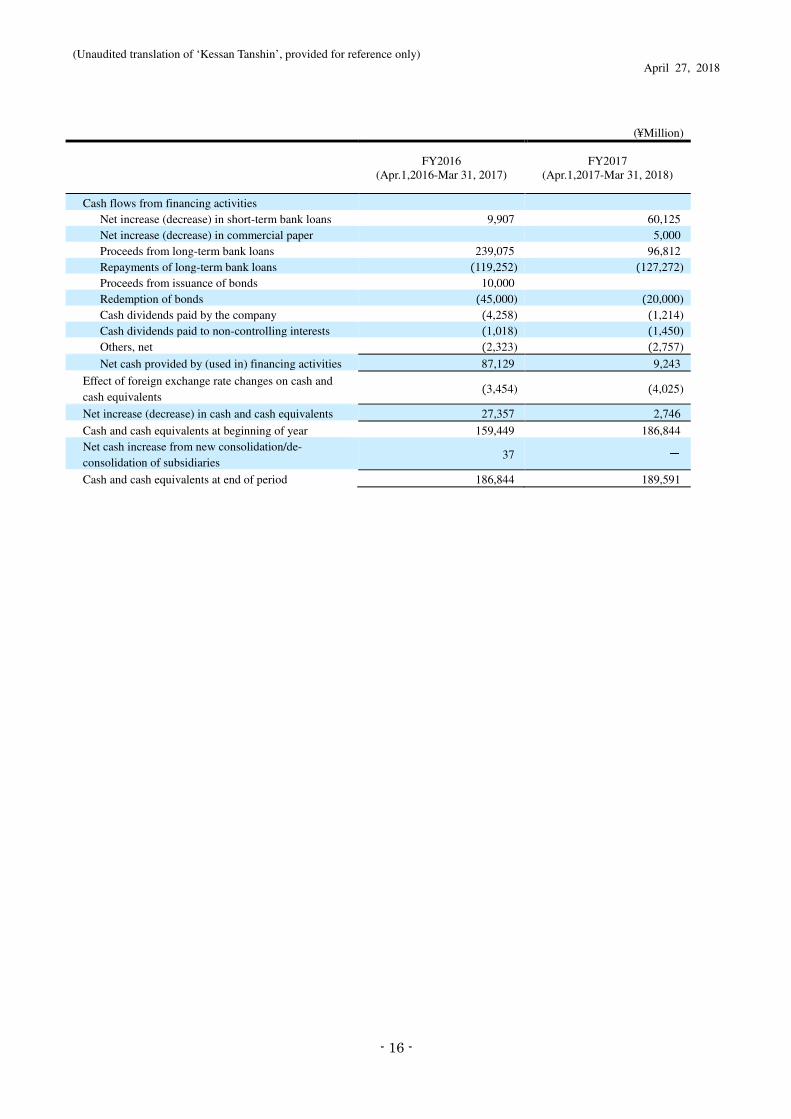
Notice of Establishment of Holding Company and Operating Company for New
Integrated Container Shipping Business
Mitsui O.S.K. Lines, Ltd., Kawasaki Kisen Kaisha, Ltd., and Nippon Yusen Kabushiki Kaisha have
announced the establishment of the below holding company and operating company, based on the business
integration contract and the shareholders agreement on October 31, 2016 to integrate the container shipping
businesses (including worldwide terminal operation businesses outside Japan) of all three companies.
The new operating company started operations on April 1, 2018.
Overview of New Companies
(1) Holding Company
Company name Ocean Network Express Holdings, Ltd.
Amount of Capital 50 Million JPY
Shareholders/
Contribution Ratio
Kawasaki Kisen Kaisha, Ltd. 31%
Nippon Yusen Kabushiki Kaisha 38%
Mitsui O.S.K. Lines, Ltd. 31%
Location Tokyo
Date of Establishment July 7, 2017
(2) Operating Company
Company name Ocean Network Express Pte. Ltd.
Amount of Capital 800 Million USD
Shareholders/
Contribution Ratio
Kawasaki Kisen Kaisha, Ltd. 31% (including indirect investment)
Nippon Yusen Kabushiki Kaisha 38% (including indirect investment)
Mitsui O.S.K. Lines, Ltd. 31% (including indirect investment)
Location Singapore
Date of Establishment July 7, 2017

(Unaudited translation of ‘Kessan Tanshin’, provided for reference only)
April 27, 2018
(6) Segment Information
Business segment information:
(¥Million)
Dry Bulk
Business
Energy
Transport
Business
Container
ships
Car Carries,
Ferries and
Coastal
RoRo ships
Associated
BusinessesSub Total
Revenues
1.Revenues from
external customers267,864 257,834 620,714 250,648 90,025 1,487,087 17,286 1,504,373 - 1,504,373
2.Inter-segment
revenues14 8,378 1,816 181 27,518 37,909 6,658 44,568 (44,568) -
Total Revenues 267,879 266,212 622,531 250,830 117,543 1,524,997 23,944 1,548,941 (44,568) 1,504,373
Segment profit (loss) 11,977 26,499 (32,864) 4,839 12,337 22,789 2,051 24,840 585 25,426
Segment assets 371,411 845,984 388,029 265,906 415,399 2,286,731 371,328 2,658,060 (440,531) 2,217,528
Others
Depreciation and amortization 12,994 36,958 12,130 14,134 9,395 85,564 433 85,997 1,192 87,910
Amortization of goodwill - 21 0 - 164 185 0 186 - 186
Interest income 846 3,295 895 36 43 5,117 2,119 7,236 (1,318) 5,918
Interest expenses 3,163 11,589 1,728 1,279 1,436 19,197 1,076 20,274 (1,237) 19,037
Equity in earnings (losses) of affiliates (4,550) 10,341 (4) 360 226 6,373 (829) 5,543 - 5,543
Investment in affiliates 19,053 75,474 12,635 2,448 2,139 111,750 1,049 112,799 - 112,799
Increase of tangible / intangible fixed
assets13,709 63,617 28,307 30,011 4,937 140,584 253 140,838 955 141,793
* 1. "Others" primarily consists of business segments that are not included in reportable segments, such as the ship operations
business, the ship management business, the ship chartering business, the financing business and the shipbuilding business.
* 2.
(1) Adjustment in Segment income (loss) of \ 585 million include the following:
\ -4,578 million of corporate profit which is not allocated to segments, \ 6,312 million of adjustment for
management accounting and \ -1,148 million of inter-segment transaction elimination.
(2) Adjustment in Segment assets of \ -440,531 million include the following:
\ 14,715 million of assets which are not allocated to segments and \ -455,246 million of inter-segment
transaction elimination.
(3) Adjustment in Depreciation and amortization of \ 1,192 million include the following:
\ 1,192 million of depreciation of assets which are not allocated to segments.
(4) Adjustment in Interest income of \ -1,318 million include the following:
\ 2,522 million of interest income which is not allocated to segments and \ -3,840 million of inter-segment
transaction elimination.
(5) Adjustment in Interest expenses of \ -1,237 million include the following:
\ 5,604 million yen of interest expenses which are not allocated to segments, \ -2,999 million of adjustment for
management accounting and \ -3,842 million of inter-segment transaction elimination.
(6) Adjustment in Increase of tangible / intangible fixed assets of \ 955 million is acquisition cost of tangible / intangible
fixed assets which are not allocated to segments.
* 3. Management has decided not to allocate liabilities to segments. Therefore segment information regarding liabilities is not disclosed.
* 4. Segment income (loss) corresponds to Ordinary profit in the consolidated statements of income.
Consoli-
dated
Product Transport Business
FY2016
(Apr.1,2016 - Mar.31, 2017)
Reportable Segment
Others
*1Total
Adjust-
ment
*2
- 18 -

(Unaudited translation of ‘Kessan Tanshin’, provided for reference only)
April 27, 2018
(¥Million)
Dry Bulk
Business
Energy
Transport
Business
Container
ships
Car Carries,
Ferries and
Coastal
RoRo ships
Associated
BusinessesSub Total
Revenues
1.Revenues from
external customers272,956 262,245 749,714 261,171 90,095 1,636,184 16,208 1,652,393 - 1,652,393
2.Inter-segment
revenues3 8,712 1,909 234 28,366 39,226 6,305 45,531 (45,531) -
Total Revenues 272,960 270,957 751,624 261,406 118,462 1,675,410 22,514 1,697,925 (45,531) 1,652,393Segment profit (loss) 15,414 13,633 (10,691) 4,363 12,657 35,378 2,601 37,980 (6,506) 31,473Segment assets 341,638 866,429 384,612 263,983 422,008 2,278,672 347,336 2,626,008 (400,372) 2,225,636 Others
Depreciation and amortization 11,749 37,105 11,525 15,758 9,143 85,282 361 85,644 985 86,629
Amortization of goodwill - 22 0 - 159 182 - 182 - 182
Interest income 1,152 4,565 1,126 116 44 7,005 2,928 9,933 (1,957) 7,976
Interest expenses 2,863 13,190 1,581 1,221 1,331 20,189 1,951 22,141 (1,727) 20,413
Equity in earnings (losses) of affiliates (4,507) 8,240 (6,808) 377 277 (2,421) (1,007) (3,428) - (3,428)
Investment in affiliates 15,784 84,547 35,751 2,776 2,218 141,078 369 141,448 - 141,448
Increase of tangible / intangible fixed
assets5,912 87,430 21,735 26,773 5,967 147,819 763 148,582 612 149,195
* 1. "Others" primarily consists of business segments that are not included in reportable segments, such as the ship operations
business, the ship management business, the ship chartering business, the financing business and the shipbuilding business.
* 2.
(1) Adjustment in Segment income (loss) of \ -6,506 million include the following:
\ -11,610 million of corporate profit which is not allocated to segments, \ 5,998 million of adjustment for
management accounting and \ -895 million of inter-segment transaction elimination.
(2) Adjustment in Segment assets of \-400,372 million include the following:
\ 12,378 million of assets which are not allocated to segments and \ -412,750 million of inter-segment
transaction elimination.
(3) Adjustment in Depreciation and amortization of \ 985 million include the following:
\ 985 million of depreciation of assets which are not allocated to segments.
(4) Adjustment in Interest income of \ -1,957 million include the following:
\ 3,263 million of interest income which is not allocated to segments and \ -5,221 million of inter-segment
transaction elimination.
(5) Adjustment in Interest expenses of \ -1,727 million include the following:
\ 7,270 million of interest expenses which are not allocated to segments, \ -3,773 million of adjustment for
management accounting and \ -5,223 million of inter-segment transaction elimination.
(6) Adjustment in Increase of tangible / intangible fixed assets of \ 612 million is acquisition cost of tangible / intangible
fixed assets which are not allocated to segments.
* 3. Management has decided not to allocate liabilities to segments. Therefore segment information regarding liabilities is not disclosed.
* 4. Segment income (loss) corresponds to Ordinary profit in the consolidated statements of income.
Consoli-
dated
Product Transport Business
FY2017
(Apr.1,2017 - Mar.31, 2018)
Reportable Segment
Others
*1Total
Adjust-
ment
*2
- 19 -
(Unaudited translation of ‘Kessan Tanshin’, provided for reference only)April 27, 2017
(¥Million)
Dry Bulk
Business
Energy
Transport
Business
Container
ships
Car Carries,
Ferries and
Coastal
RoRo ships
Associated
BusinessesSub Total
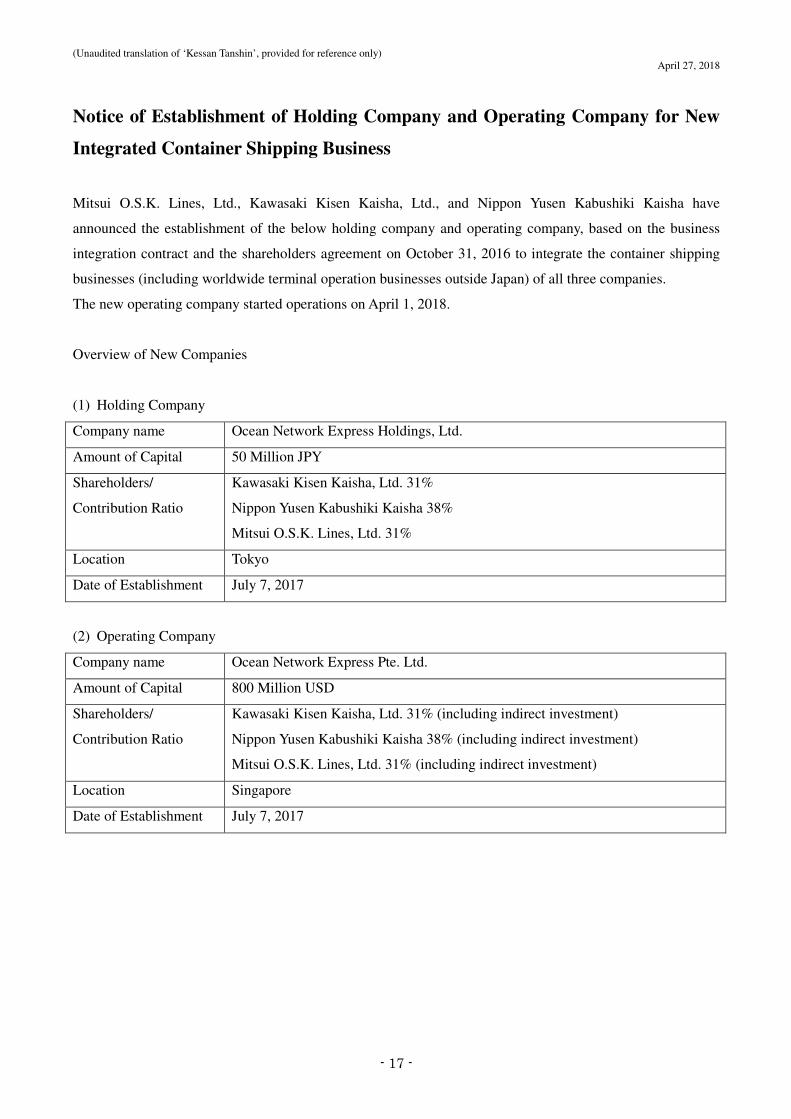
Goodwill - 44 - - 1,845 1,890 - - 1,890
* 5. There were no impairment loss.
* 6. Amortization of goodwill is disclosed in business segment information.
* 7. There were no gains from negative goodwill.
Geographical segment information: (¥Million)
FY2017
(Apr.1,2017 - Mar.31, 2018)Japan
North
AmericaEurope Asia Others Total
Revenues 1,442,585 31,806 39,369 136,530 2,101 1,652,393
Tangible fixed assets 984,611 45,382 2,995 219,260 38,720 1,290,929
(Major subsequent event)
Company name
Shareholders/
Contribution Ratio
Location
Date of Establishment
2. Details of additional investments
Amount of
additional investments
Amount of Capital
after additional investments
Execution date of
additional investments
As initially planned , the Company contributed an additional amount of capital to its equity-method affiliate Ocean
Network Express Pte. Ltd. on April 2, 2018.
1. Overview of the equity-method affiliate of the Company
[REFERENCE PURPOSE ONLY]
Please note that this document has been translated from the Japanese original for reference purposes
only and the financial statements contained is unaudited.
In case of any discrepancy or inconsistency between this document and the Japanese original, the latter
shall prevail.
OthersAdjust-ment
Consoli-dated
As of March 31, 2018
Reportable SegmentProduct Transport Business
Amount of Capital
(Additional investments in an equity-method affiliate of the Company)
US$2,200,000,000
US$3,000,000,000
April 2, 2018
additional contribution of capital.
Ocean Network Express Pte. Ltd.
There has been no change in contribution ratios between before and after the
Singapore
July 7, 2017
(before additional investments) US$ 800,000,000
(after additional investments) US$ 3,000,000,000
Kawasaki Kisen Kaisha, Ltd. 31% (including indirect investment)
Nippon Yusen Kabushiki Kaisha 38% (including indirect investment)
Mitsui O.S.K. Lines, Ltd. 31% (including indirect investment)
- 20 -

(Unaudited translation of 'Kessan Tanshin', provided for reference only)
1. Review of Quarterly Results
Q1 Q2 Q3 Q4Apr-Jun, 2017 Jul-Sep, 2017 Oct-Dec, 2017 Jan-Mar, 2018
Revenues [¥ Millions] 403,284 415,617 420,760 412,732
Operating profit (loss) 1,147 9,999 13,218 (1,680)
Ordinary profit (loss) 5,885 11,462 17,217 (3,091)
Income (Loss) before income taxes 9,150 11,284 20,507 (69,650)
Profit (Loss) attributable to owners of parent 5,251 7,872 16,106 (76,609)
Net income (loss)* per share [¥] 43.91 65.81 134.68 (640.56)
Total Assets [¥ Millions] 2,198,561 2,188,391 2,251,848 2,225,636
Total Net Assets 679,362 687,223 714,061 628,044
*Profit (Loss) attributable to owners of parent
Q1 Q2 Q3 Q4
Apr-Jun, 2016 Jul-Sep, 2016 Oct-Dec, 2016 Jan-Mar, 2017
Revenues [¥ Millions] 360,079 353,481 367,880 422,933
Operating profit (loss) (3,573) 1,553 (58) 4,636
Ordinary profit (loss) 733 4,765 8,313 11,615
Income (Loss) before income taxes 5,160 24,493 5,639 2,036
Profit (Loss) attributable to owners of parent 1,401 14,657 2,968 (13,769)
Net income (loss)* per share [¥] 11.72 122.54 24.82 (115.13)
Total Assets [¥ Millions] 2,183,555 2,103,167 2,191,309 2,217,528
Total Net Assets 619,006 603,685 629,444 683,621
*Profit (Loss) attributable to owners of parent
Note: The Company consolidated its common shares on the basis of one (1) unit for every ten (10) shares effective
October 1, 2017. Accordingly, net income per share is calculated on the assumption that the consolidation of shares
was conducted at the beginning of the previous fiscal year ended March 31, 2017.
April 27, 2018
[ Supplement ]
<FY 2017>
<FY 2016>
Note: The Company consolidated its common shares on the basis of one (1) unit for every ten (10) shares effective
October 1, 2017. Accordingly, net income per share is calculated on the assumption that the consolidation of shares
was conducted at the beginning of the previous fiscal year ended March 31, 2017.
- 21 -

(Unaudited translation of 'Kessan Tanshin', provided for reference only)
2. Depreciation and Amortization(¥ Millions) (¥ Millions)
Vessels
Others
Total
3. Interest-bearing Debt(¥ Millions) (¥ Millions)
Bank loans
Bonds
Total
4. Fleet Capacity (MOL and consolidated subsidiaries)
No.of ships 1,000MT No.of ships 1,000MT No.of ships 1,000MT No.of ships 1,000MT No.of ships 1,000MT
58 5,579 77 10,319 29 2,301 49 808 14 1,106
279 24,840 79 3,626 7 429 70 1,196 77 6,367
- - 7 328 2 143 - - - -
337 30,420 163 14,273 38 2,873 119 2,004 91 7,474
337 30,669 159 14,375 37 2,730 120 2,042 91 6,947
No.of ships 1,000MT No.of ships 1,000MT No.of ships 1,000MT No.of ships 1,000MT
11 60 1 5 6 33 245 20,212
3 19 - - 25 75 540 36,551
- - - - 1 1 10 472
14 79 1 5 32 109 795 57,235
14 78 1 5 31 106 790 56,952
*including coastal ships (excluding coastal RoRo ships)
5. Exchange Rates
¥2.51 [2.3%]
¥5.95 [5.3%]
Remark:
<Overseas subsidiaries>
¥3.49 [3.0%]
6. Average Bunker Prices
887,484
FY2016 FY2017 Increase / Decrease
65,894
86,629 (560) 87,190
65,894
87,190
As of Mar.31, 2017 Increase / Decrease
207,620
FY2016
21,296 22,093 797 21,296
(1,357)
230,595 (22,975)
As of Dec.31, 2016
871,318 16,165
64,536
As of Mar.31, 2018
870,984
232,745
1,122,355
Others
Commercial paper
17,985 (2,501)
(4,310)
18,625
-
1,122,400
20,487
1,118,089
5,000 5,000
Owned
Chartered
Dry bulkers Tankers
As of Mar.31, 2017
Owned
¥112.19
Average rates ¥108.57 ¥111.08
FY2017 FY2016
Purchase Prices US$284/MT US$354/MT US$+70/MT
¥116.49
Increase / DecreaseFY2016 FY2017
Term-end rates ¥116.49 ¥113.00 JPY Appreciated
April 27, 2018
Chartered
Others
As of Mar.31, 2018
Ferries &
Coastal RoRo ShipsPassenger ships Others* Total
-
LNG carriers
Others
As of Mar.31, 2018
As of Mar.31, 2017
Car carriers Containerships
Change
Change
¥108.57
TTM on Dec/31/2016
Term-end rates ¥112.19 ¥106.24
TTM on Dec/31/2016 TTM on Dec/31/2017
"Average rates" are average of monthly corporate rates in each term, while "term-end rates" are TTM rates on the last day of each term.
JPY Appreciated
JPY Depreciated
FY2016
- 22 -

(Unaudited translation of 'Kessan Tanshin', provided for reference only)
7....Market Information
(1) Dry Bulker Market (Baltic Dry Index) Source : Bloomberg
Jan Feb Mar Apr May Jun Jul Aug Sep Oct Nov Dec
386 307 383 607 620 608 707 673 828 868 1,072 1,050
907 759 1,141 1,222 973 860 906 1,142 1,364 1,484 1,454 1,619
1,242 1,125 1,154
(2) Tanker Market (Daily Earnings) : VLCC AG/Japan tradeSource : Clarksons Research
Jan Feb Mar Apr May Jun Jul Aug Sep Oct Nov Dec
69,483 46,099 58,287 48,850 42,633 34,337 22,167 17,719 13,777 39,902 45,857 57,280
40,905 31,822 17,051 26,966 18,646 17,212 17,002 9,510 9,673 26,812 24,727 13,743
11,148 7,357 8,739
(3) Containership Market (China Containerized Freight Index) Source : Shanghai Shipping Exchange
Note: CCFI reflects the freight rate trend for container exports from China only, which does not always match the overall trend for container exports from Asia.
2017
2018
Monthly Average
9,081
21,172
Average
2016 41,366
April 27, 2018
1,174
1,153
Average
2017
Monthly Average
2016
2018
676
(January 1985 = 1,000)
- 23 -


![LARSEN & TOUBRO INFOTECH LIMITED - kotak.com · for cash at a price of ` [ ] per equity share (including a share premium of ` [ ] per equity share) aggregating up to ` [ ] million](https://img.dokumen.tips/doc/110x75/5b94a42e09d3f2e5688d49c5/larsen-toubro-infotech-limited-kotak-for-cash-at-a-price-of-per-equity.jpg)