Embed Size (px)
Citation preview
1
FINANCIAL FEASIBILITY REPORT
FOR
AMENDED LAKE DISTRICT URBAN RENEWAL PLAN AMENDED RIVER DISTRICT URBAN RENEWAL PLAN ATLAS DISTRICT URBAN RENEWAL PLAN
SUBMITTED TO IGNITE CDA
OCTOBER 2018 © 2018 Welch, Comer and Associates, Inc.
FINANCIAL FEASIBILITY REPORTAMENDED LAKE DISTRICT URBAN RENEWAL PLANAMENDED RIVER DISTRICT URBAN RENEWAL PLAN
ATLAS DISTRICT URBAN RENEWAL PLAN
PROJECT NO. 41292. 03
SUBMITTED TO:
ignite cda
OCTOBER 2018
PREPARED BY:
WELCH-COMeR^ENGINEERS I SURVEYORS
350 E. Kathleen Avenue
Coeurd'Alene, ID83815208-664-9382 . 208-664-5946 Fax
E-Mail: [email protected]
HEARTLAND1301 First Avenue, Ste. 200
Seattle, WA 98101(206) 682-2500

TABLE OF CONTENTS
1 EXECUTIVE SUMMARY 1 2 INTRODUCTION 3 3 REAL-ESTATE ANALYSIS 5
3.1 MARKET ASSESSMENT 5
3.1.1 Value of Development 5 3.1.2 Assumed Profit 5 3.1.3 Project Cost 5 3.1.4 RLV analysis 6
3.2 LAND DEVELOPMENT OPTIONS 6
3.2.1 Phasing 6 3.2.2 Rivers Edge Property 8 3.2.3 Absorption 9
3.3 FINANCIAL ANALYSIS 9
3.3.1 Total Project Sources 9 3.3.2 Total Project Uses 10 3.3.3 Annual Timeline 11
4 DEVELOPMENT IMPLEMENTATION STRATEGY 12
4.1 FINANCING/URD 12
4.1.1 Cashflow by URD 13
4.2 TRANSACTION STRUCTURES 13
4.2.1 Evaluation of Implementation Strategies 13 4.2.2 Flow of Initial Transactions 15
4.3 PROPERTY DISPOSITION 15 4.4 SITE IMPROVEMENTS 15 4.5 PUBLIC SPACE 18
4.5.1 Riverfront Public Space 18 4.5.2 Mt. Hink Nature Area Public Space 18 4.5.3 Rivers Edge Public Space 18
5 RECOMMENDED IMPLEMENTATION STRATEGY 19
5.1 ORGANIZATION 19 5.2 RFP/MARKETING 20
5.2.1 Development Standards 20 5.2.2 Roles/Responsibilities 21
6 APPENDICES 22

1
1 EXECUTIVE SUMMARY
The Stimson Mill Site, located adjacent to the Spokane River, was used for lumber mill operations for more than 100 years (See Figure 1). In 2005, Stimson Lumber closed. The Stimson Mill Site was acquired by Blackrock Development in 2006, foreclosed by Washington Trust Bank in 2013 and later sold in three large parcels. The 21-acre parcel (“Rivers Edge”) and 3.8-acre parcel (“Triangle Piece”) were acquired by Douglass Properties and are still owned by Douglass entities (See Figure 2). The City is in discussions with Douglass to trade the City parcel that crosses the Rivers Edge parcel for the Triangle Piece and a 40-foot waterfront public easement. The third 45-acre parcel (“Atlas Site”) changed ownership several times and numerous private developers evaluated the Atlas Site for development, but passed because of the site’s unique and complicated characteristics, including the City owned 4-acre former railroad right of way that crosses the site.
In 2017, the City of Coeur d’Alene recognized the opportunity to, in collaboration with the City’s urban renewal agency, ignite cda, to achieve two major community objectives:
1. Preserve waterfront property for the community. 2. Stimulate private development in a blighted portion of the City’s area
of impact.
Figure 1: The Stimson Mill Site Circa 1998
Figure 2: Stimson Mill Site circa 2017 with Parcel Ownership
2
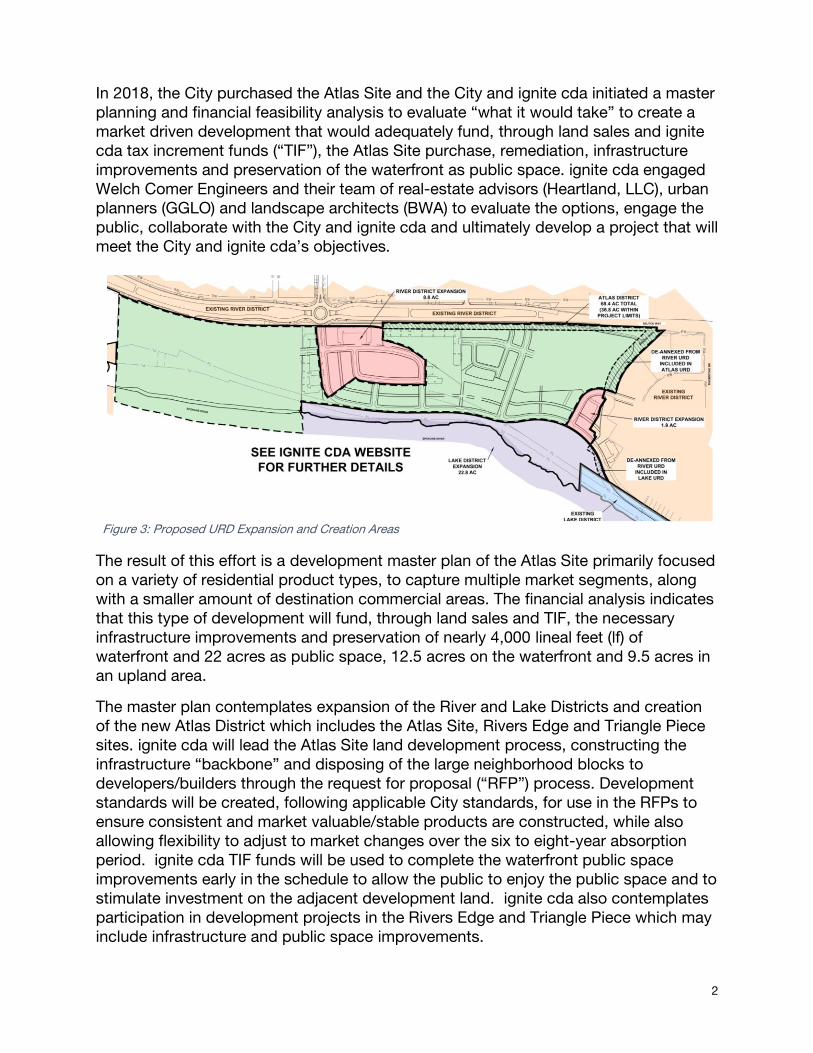
In 2018, the City purchased the Atlas Site and the City and ignite cda initiated a master planning and financial feasibility analysis to evaluate “what it would take” to create a market driven development that would adequately fund, through land sales and ignite cda tax increment funds (“TIF”), the Atlas Site purchase, remediation, infrastructure improvements and preservation of the waterfront as public space. ignite cda engaged Welch Comer Engineers and their team of real-estate advisors (Heartland, LLC), urban planners (GGLO) and landscape architects (BWA) to evaluate the options, engage the public, collaborate with the City and ignite cda and ultimately develop a project that will meet the City and ignite cda’s objectives.
The result of this effort is a development master plan of the Atlas Site primarily focused on a variety of residential product types, to capture multiple market segments, along with a smaller amount of destination commercial areas. The financial analysis indicates that this type of development will fund, through land sales and TIF, the necessary infrastructure improvements and preservation of nearly 4,000 lineal feet (lf) of waterfront and 22 acres as public space, 12.5 acres on the waterfront and 9.5 acres in an upland area.
The master plan contemplates expansion of the River and Lake Districts and creation of the new Atlas District which includes the Atlas Site, Rivers Edge and Triangle Piece sites. ignite cda will lead the Atlas Site land development process, constructing the infrastructure “backbone” and disposing of the large neighborhood blocks to developers/builders through the request for proposal (“RFP”) process. Development standards will be created, following applicable City standards, for use in the RFPs to ensure consistent and market valuable/stable products are constructed, while also allowing flexibility to adjust to market changes over the six to eight-year absorption period. ignite cda TIF funds will be used to complete the waterfront public space improvements early in the schedule to allow the public to enjoy the public space and to stimulate investment on the adjacent development land. ignite cda also contemplates participation in development projects in the Rivers Edge and Triangle Piece which may include infrastructure and public space improvements.
Figure 3: Proposed URD Expansion and Creation Areas
3
The Atlas Site Financial Feasibility model demonstrates that, based on estimated costs and revenues, the Atlas Site can be redeveloped and achieve the City and ignite cda objectives. The financial feasibility model also demonstrates that TIF would be available to aid redevelopment of other parcels in the Stimson Mill Site area.
The Atlas Site development implementation plan anticipates change will occur due to market conditions and this reality will be woven into the process and products developed for development implementation to increase the opportunity for success.
2 INTRODUCTION
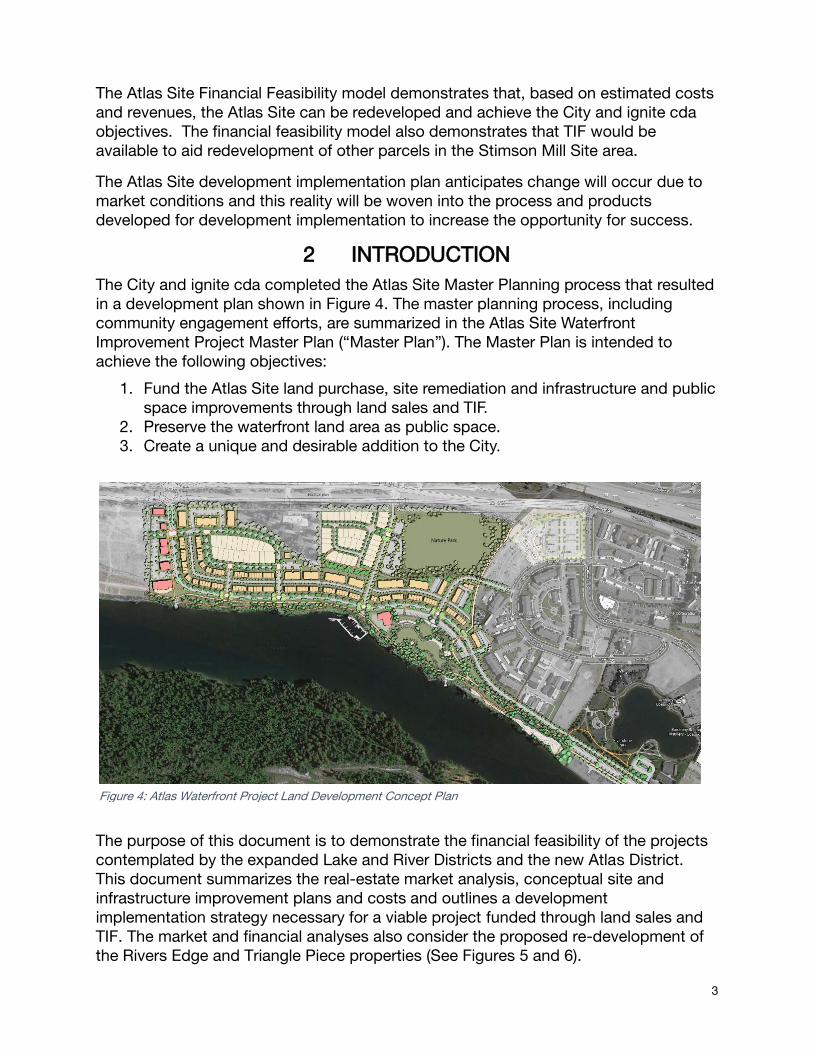
The City and ignite cda completed the Atlas Site Master Planning process that resulted in a development plan shown in Figure 4. The master planning process, including community engagement efforts, are summarized in the Atlas Site Waterfront Improvement Project Master Plan (“Master Plan”). The Master Plan is intended to achieve the following objectives:
1. Fund the Atlas Site land purchase, site remediation and infrastructure and public space improvements through land sales and TIF.
2. Preserve the waterfront land area as public space. 3. Create a unique and desirable addition to the City.
The purpose of this document is to demonstrate the financial feasibility of the projects contemplated by the expanded Lake and River Districts and the new Atlas District. This document summarizes the real-estate market analysis, conceptual site and infrastructure improvement plans and costs and outlines a development implementation strategy necessary for a viable project funded through land sales and TIF. The market and financial analyses also consider the proposed re-development of the Rivers Edge and Triangle Piece properties (See Figures 5 and 6).
Figure 4: Atlas Waterfront Project Land Development Concept Plan

4
Figure 5: Rivers Edge Development Proposal
Figure 6: Triangle Piece Conceptual Development Options
5
3 REAL-ESTATE ANALYSIS
3.1 MARKET ASSESSMENT
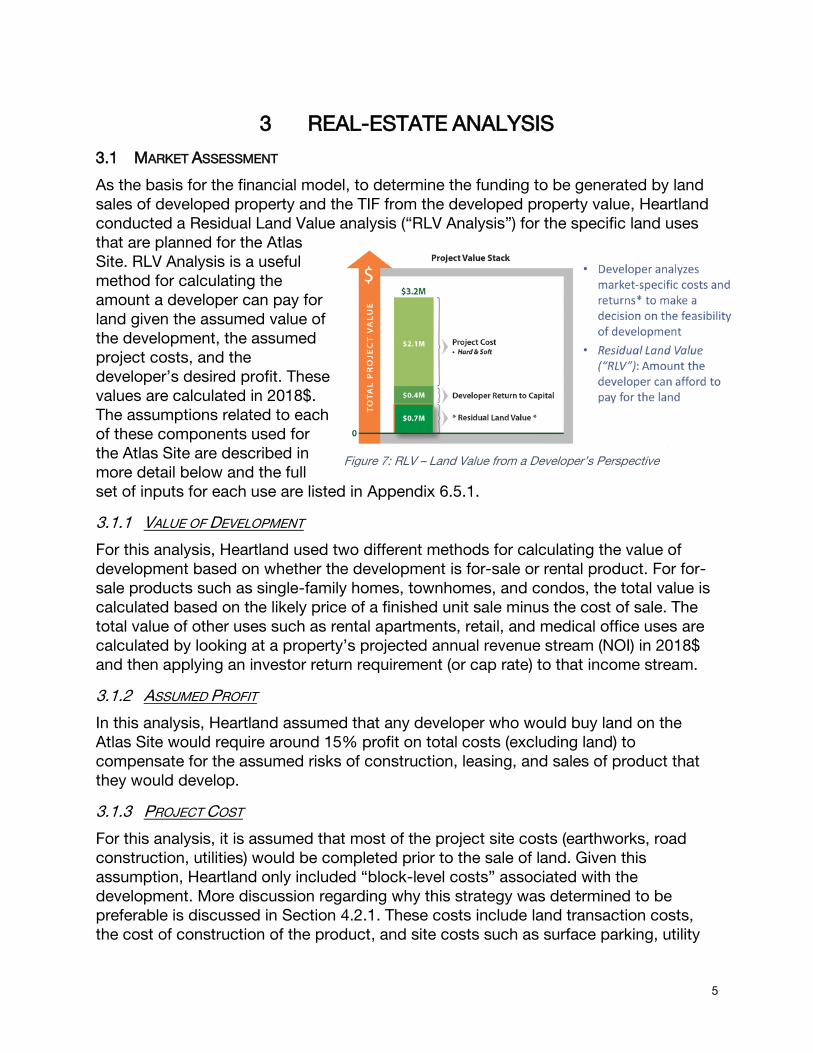
As the basis for the financial model, to determine the funding to be generated by land sales of developed property and the TIF from the developed property value, Heartland conducted a Residual Land Value analysis (“RLV Analysis”) for the specific land uses that are planned for the Atlas Site. RLV Analysis is a useful method for calculating the amount a developer can pay for land given the assumed value of the development, the assumed project costs, and the developer’s desired profit. These values are calculated in 2018$. The assumptions related to each of these components used for the Atlas Site are described in more detail below and the full set of inputs for each use are listed in Appendix 6.5.1.
3.1.1 VALUE OF DEVELOPMENT
For this analysis, Heartland used two different methods for calculating the value of development based on whether the development is for-sale or rental product. For for-sale products such as single-family homes, townhomes, and condos, the total value is calculated based on the likely price of a finished unit sale minus the cost of sale. The total value of other uses such as rental apartments, retail, and medical office uses are calculated by looking at a property’s projected annual revenue stream (NOI) in 2018$ and then applying an investor return requirement (or cap rate) to that income stream.
3.1.2 ASSUMED PROFIT
In this analysis, Heartland assumed that any developer who would buy land on the Atlas Site would require around 15% profit on total costs (excluding land) to compensate for the assumed risks of construction, leasing, and sales of product that they would develop.
3.1.3 PROJECT COST
For this analysis, it is assumed that most of the project site costs (earthworks, road construction, utilities) would be completed prior to the sale of land. Given this assumption, Heartland only included “block-level costs” associated with the development. More discussion regarding why this strategy was determined to be preferable is discussed in Section 4.2.1. These costs include land transaction costs, the cost of construction of the product, and site costs such as surface parking, utility
Figure 7: RLV – Land Value from a Developer’s Perspective

6
hookups, and alley constructions. The summary of these projected costs and profit are shown in Appendix 6.5.
3.1.4 RLV ANALYSIS
Based on the assumptions and the resulting RLV outputs, Heartland calculated land value for each of the types of land-uses based both on a $/land SF, $/unit for the residential uses, and $/gross square footage area (GFA) for the non-residential uses. A summary of the results and the basic programmatic assumption for each use are discussed below:
These estimated land values in (2018$) provide rough order magnitude revenue assumptions in which to determine how much ignite cda could achieve with future land sales once basic site development has been completed.
3.2 LAND DEVELOPMENT OPTIONS
Based on the RLV analysis, the Consultant Team worked together to develop a development/phasing strategy for the Atlas Site that would be designed to provide a diversity of uses as well as ensure that the projected revenue generated from land sales and TIF is enough to cover the projected project costs. This phasing strategy is based on the phasing map shown in Figure 8.
3.2.1 PHASING
The Atlas Site is planned to be developed in four phases. In each phase, lands sales for development will help to offset infrastructure costs associated with that phase and public space development costs. If there is a surplus of revenue compared to the costs, this surplus will be rolled over in the next phase to offset additional infrastructure/public space development costs. The key components of this phasing strategy are documented as follows:
Land Uses Land Value/SF Land Value per Lot/Unit
Single Family $20 $112,000
Condo $17 $18,000
Townhome $13 $30,000
Low-rise MF $6 $6,000
Non-Residential Uses Land Value/SF Value per GFA
Retail $7 $300
Medical Office $7 $400 Table 1: Estimated Residual Land Value by Product Type
Figure 8: Development Concept Plan and Phasing

7
Phase 1 Development: Phase 1 comprises around 35 acres of land, or 55% of the entire site, and includes 10 acres of the expanded Lake District, 13.5 acres of the expanded River District, and 11 acres in the new Atlas District. Phase 1 includes all six land-use types (Single-family homes, townhomes, condos, low-rise rental apartments, retail, and medical office). The assumed development sequencing for Phase 1 consists of the following:
Triangle Piece: The Triangle Piece is a 3.85-acre parcel currently owned by Atlas Mill Development Corporation. The parcel is located on Seltice Way in the proposed Atlas District. The City and Triangle Piece property owner are in the process of exchanging a parcel of City land, also in the Atlas District, for the Triangle Piece and a waterfront public access easement across the Rivers Edge parcel to the west of the Atlas Site, also within the Atlas District. Provided the land exchange occurs, the Triangle Piece could be sold quickly as the land requires minimal earthwork and site development costs. Initial analysis indicates this property would work well for medical office. For this analysis, the parcel is projected to close in Q1 2020 at a price of $1.1M and is projected to take to take two years to fully develop. The faster this parcel can be sold, the quicker the proceeds from the sale as well as the tax increment from development will be available to help pay for the site development costs for the rest of the Atlas District.
Phase 1 Atlas District Other Uses: Land for other parts of Phase 1 of the Atlas District are projected to be sold after site development is completed for Phase 1 in Q3 2020. These blocks are assumed to be developed with retail and townhome product and expected to take two years to fully build out with construction set to be completed in Q1 2023 and TIF starting in Q2 2022 from the Triangle Piece development.
Phase 1 Lake District: Construction of the public space along the river is projected to start in Q2 2019 and take three quarters to be completed in Q1 2020 prior to the start of construction for all the development outside of the Triangle Parcel.
Phase 1 River District: River District land is projected to be sold after site development is completed for Phase 1 in Q3 2020. These blocks are assumed to be developed with single-family homes, townhomes, rental housing, and condos and are expected to take two years to fully build out with construction
Figure 9: Timeline Showing the Absorption Advantage for Mixed Use Product Type Compared to a Single Product Type

8
set to be completed in Q1 2023 and tax increment revenue starting in Q2 2021 and ending in Q4 2028.
Phase 2 Development: Phase 2 comprises around 5.6 acres of land entirely within the proposed Atlas District and includes the construction of the main feeder road from Seltice Way to the new road along the waterfront public space. Phase 2 land is expected to sell, after this new road has been completed, in Q3 2021 and the projected townhome and condo product is estimated to take two years to fully build out with construction set to be completed in Q1 2024 with tax increment revenue starting in Q3 2022.
Phase 3 Development (Atlas): Phase 3 comprises around 15.3 acres of land and includes the construction of the public space off Seltice way as well as adjacent townhome, rental apartment and condo development. Phase 3 land is expected to sell after public space and other site development is complete in Q1 2023 and the projected residential development is estimated to take two years to fully build out with construction completing in Q2 2025 with tax increment revenue starting in Q4 2023.
Phase 4 Development (Atlas): Phase 4 comprises around 5.8 acres of land expected to be a single-family development. Phase 4 finished lots are expected to sell after site development is complete in Q2 2024 and the lots are estimated to sell in two years by Q3 2026 with tax increment revenue starting in Q1 2025.
3.2.2 RIVERS EDGE PROPERTY
In addition to the land revenue and TIF generated from the development of the Atlas Site, TIF from the 25.7-acre adjacent Rivers Edge and Triangle Piece parcels are projected to create funding that may be used for the site development costs on the Atlas Site. It is assumed that around 800 rental apartments would be constructed on
Figure 10: Atlas Site Product Type by Phase

9
the property starting in 2022 and would take ten years to fully build out. TIF funds would be available to assist with redevelopment of the Rivers Edge and the Triangle Piece. As noted in the executive summary, the City and Douglass are in the process of completing a land trade that would also include a 40-foot public waterfront easement along the Rivers Edge parcel. TIF funds may be available to assist with constructing public improvements in this corridor.
3.2.3 ABSORPTION
Based on the development sequencing discussed above, the estimated absorption by quarter for each phase is as follows:
Table 2: Estimated Product Absorption by Phase
3.3 FINANCIAL ANALYSIS
Based on the RLV analysis and the Development Phasing Timeline, site development costs, and programmatic assumptions, the consultant team worked to develop a financial model that would show on a quarterly basis that projected revenue for the redevelopment of the Atlas Site would cover the projected site development costs, including the public space. The financial model framework is shown in Appendix 6.4 and the annual cashflow model is shown in Appendix 6.6. In this model both costs, and revenues are escalated at 2% per year to account for projected land specialization and cost inflation.
3.3.1 TOTAL PROJECT SOURCES
The total project sources are funds that are being used to purchase the land, develop the public space, and complete all site development and remediation costs for the Atlas Site. These sources can be divided into 4 categories, ignite cda sources, City funding, TIF, and Real Estate Land Sales. As can be seen Table 3, the Total Sources used to fund the project is around $109M. Over 40% or $43.8M of the funds for the redevelopment are TIF with the majority ($39.7M) of the TIF coming from the newly created Atlas District. The estimated TIF is based on estimated future property values (using a 2% annual growth rate) and the 2017 tax levy rate held constant.
Unit Absorption by Phase by Product per quarter
Phase Townhome Condo Low-rise MF Single Family TOTAL Absorption Time (Yrs.)
1 9.5 5.0 7.5 2.9 25 3
2 1.8 13.5 0.0 0.0 15 2
3 2.5 0.0 7.5 0.0 10 2
4 0.0 0.0 0.0 4.5 5 2
Rivers Edge 20 20 10
10
3.3.2 TOTAL PROJECT USES
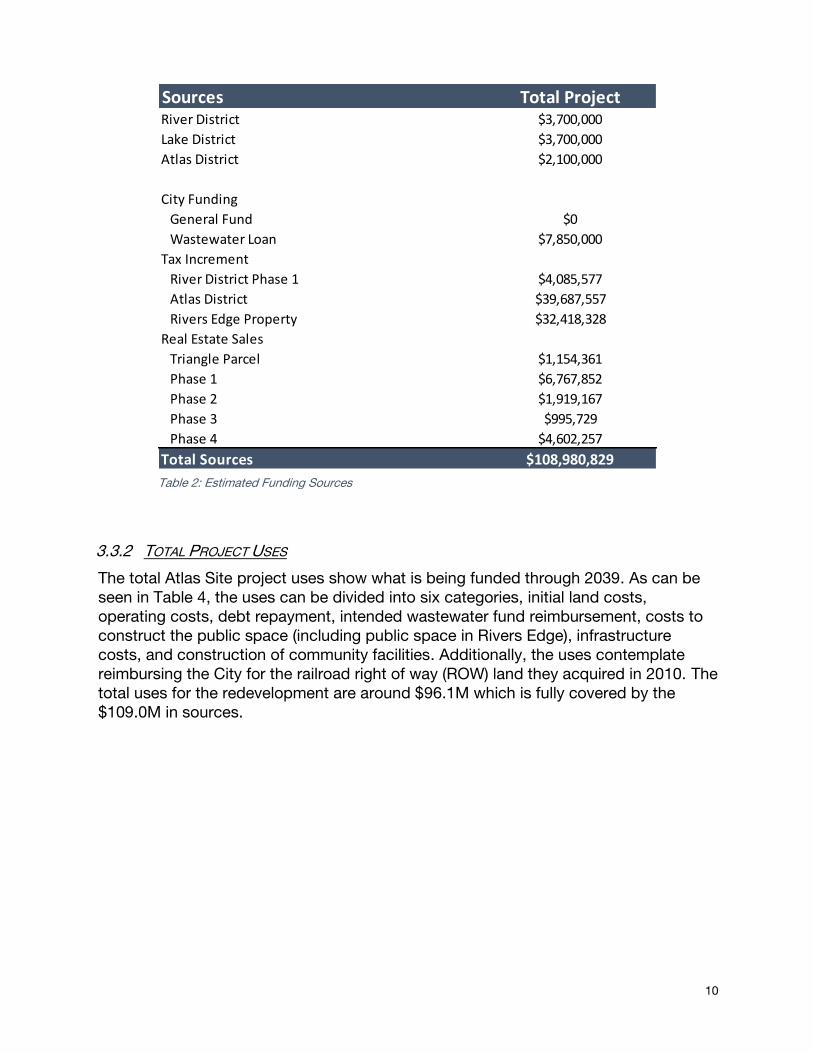
The total Atlas Site project uses show what is being funded through 2039. As can be seen in Table 4, the uses can be divided into six categories, initial land costs, operating costs, debt repayment, intended wastewater fund reimbursement, costs to construct the public space (including public space in Rivers Edge), infrastructure costs, and construction of community facilities. Additionally, the uses contemplate reimbursing the City for the railroad right of way (ROW) land they acquired in 2010. The total uses for the redevelopment are around $96.1M which is fully covered by the $109.0M in sources.
Sources Total ProjectRiver District $3,700,000
Lake District $3,700,000
Atlas District $2,100,000
City Funding
General Fund $0
Wastewater Loan $7,850,000
Tax Increment
River District Phase 1 $4,085,577
Atlas District $39,687,557
Rivers Edge Property $32,418,328
Real Estate Sales
Triangle Parcel $1,154,361
Phase 1 $6,767,852
Phase 2 $1,919,167
Phase 3 $995,729
Phase 4 $4,602,257
Total Sources $108,980,829
Table 2: Estimated Funding Sources

11
3.3.3 ANNUAL TIMELINE
The annual breakdown of these sources and uses through 2039 are graphically summarized below and are shown in more detail in Appendix 6.6. In the initial years 2018-2024, site development costs are offset by land sales and initial sources from ignite cda. After 2024, tax increment revenue from Atlas District (through 2039) and from River District (through 2028) are used to pay for construction of over $45M in community facilities.
Uses Total $ (2018$)Land Acquistion -$7,850,000
Operating Costs (Atlas District) -$7,283,551
Intended Reimbursement
Wastewater Fund (Lake District) for land acquisition -$193,454
Wastewater Fund (River District) for land acquisition -$2,018,165
Wastewater Fund (Atlas District) for land acquisition -$6,700,886
Atlas District ROW Repay to City for land acquisition -$557,328
Debt
Atlas District Repay to River District -$2,213,490
Public Space Development
Public Space Improvement* -$2,500,000
Phase 1 -$2,825,400
Phase 2 $0
Phase 3 -$2,141,917
Infrastructure
Phase 1 -$7,190,796
Phase 2 -$2,005,683
Phase 3 -$1,883,432
Phase 4 -$4,865,022
Community Facilities
Cultural Center -$7,750,000
Educational Facility -$3,250,000
Multi Purpose Athletic / Perf. Facilities -$10,500,000
Other Public Facilities ** -$17,600,000
Medical Facility -$6,750,000
Total Uses -$96,079,124
Surplus/Gap $12,901,705Table 4: Estimated Funding Uses
* could include public infrastructure (streets, water, sewer) sidewalks, site remediation, site preparation, parking, parks, ped/bike trails, riverfront access, docks in the Atlas Site, Rivers Edge and Triangle Piece. ** could include facilities such as museums, convention center, community centers, public safety building.

12
4 DEVELOPMENT IMPLEMENTATION STRATEGY
4.1 FINANCING/URD
To ensure that the funding sources cover all the projected costs during the duration of the project cashflows were developed on a quarterly basis for the project and for each of the urban renewal districts. The annual project cashflows as well as each of the district cashflows can be found in Appendices 6.6 - 6.8.
Figure 11: Annual Sources and Uses
Figure 12: Net Cashflows by district

13
As shown by the summary chart in Figure 12, the total proceeds generated by the project is sufficient to cover the project costs on a yearly basis with 2024 estimated to be the point when the cumulative net cashflow is the lowest. $9.5M in URD funds will pay for the initial public space and infrastructure construction costs necessary to sell land. These initial funds coupled with real estate land sales in years 2019-2023 are projected to cover the estimated $20.9M estimated total site development and public space construction costs. After Atlas Site development projects have been completed and the districts begin to generate tax increment revenue on the project post 2023, the project will generate proceeds that are planned to be utilized for construction of public space through the Stimson Mill Site.
4.1.1 Cashflow by URD
Cashflows by District: Each of the districts will have positive net cashflows through the end of their life, although each district will generate cashflows for different durations. The dynamics of each of the district cashflows is discussed below:
Atlas District : The Atlas District will start with around $2.1M in funds loaned from the River District and will generate revenue from land sales in 2020 (Triangle Piece), 2021, 2022, and 2024. These funds will cover the roughly $13M in estimated site development costs and then may be used to reimburse the City wastewater fund and the Atlas District loan to the River District, as well as reimburse the City for the railroad ROW purchase. After 2021, the district will start to accrue tax increment revenue as development is constructed and this yearly revenue stream is estimated to reach $2.8M for the Atlas Site and $3.0M for the Rivers Edge property by 2038.
Lake District: Assuming existing Lake District funds of $5.2M are available, they will be enough to cover the $2.8M in estimated public space development cost and $0.8M in estimated site development costs and potentially prepay its proportional share of the City wastewater fund reimbursement.
River District: Land sales in the River District of $3.8M along with around $3.7M from existing River District Funds are estimated to be enough to cover the $4.2M in estimated site development costs. In 2021, the River District is set to reimburse its proportional share of the City wastewater fund. Funds generated in the later years of the expanded River District are estimated to be able to fund community facilities and public improvements.
4.2 TRANSACTION STRUCTURES
4.2.1 EVALUATION OF IMPLEMENTATION STRATEGIES
The City took the first step in implementing the redevelopment of the Atlas Site by purchasing the property in 2018 for $7.85M. Now that the land is owned publicly, there are many ways in which the property could be developed that would impact the risk and returns associated with the repayment of the initial acquisition capital. The range of strategies that were evaluated and the considerations associated with each of these strategies are listed in Table 5.

14
Implementation
Strategy Public Risk
Interest from
Developers Revenue to City
Quality of
Development
Sell unimproved
land to one private
developer
Low:
Risk that property
stays vacant
Low:
• Hard to access
capital/debt
• Few developers with
capital to purchase
Negative:
• Developer will pay
less money than
City paid for land
Development will be
integrated but may
come across as
homogenous/sterile
Sell unimproved
land to multiple
private developers
Low:
Risk that
development lacks
continuity and lack of
integration and less
profitable elements of
development would
be vacant or poorly
developed
Med/Low:
• Hard to access
capital/debt
• Limited # of
developers with
capital to purchase
• Still requires
extensive upfront
site development
and remediation
Neutral:
• Developer will pay
about the same
price as the City
paid for land
Lack of integration.
Public amenity
components of project
may be poorly
developed
Ground lease to
private development
Med/Low:
Medium risk through
construction and very
low risk after
construction is
complete
Low:
• Developers reluctant
to ground-lease
especially when so
much fee-simple
vacant land is
available nearby
Positive:
• Ground-lease
payments should
be high enough to
pay interest on
current debt
Minimal control
regarding the quality
and type of
development.
Fee Development High:
City accepts all
development risk
Unknown:
• Depends on
development fee
Variable:
• Could be very
successful or fail
considerably
• Access low-cost
debt financing
Full control and
management of quality
of development and
level of finish for public
amenities
Sell blocks to
multiple private
developer
Medium:
Risk that City
overspends on site
development and
public space
development
High:
• Multiple
national/local
developers able to
purchase and
develop blocks
based on range of
uses.
High:
• City maximizes
the value of
blocks by
minimizing upfront
site development
risks for
developers
• Access low-cost
debt financing
Allows a level of
quality and form of
development while for
also providing some
flexibility in terms of
programmatic mix
Sell finished lots to
builders/developers.
Medium/High:
Risk that City
overspends on site
development and
limits programmatic
alternative
High:
• Multiple
national/local
developers would be
interested
depending on use
High:
• Selling individual
could achieve the
highest value of
land revenue
• Access low-cost
debt financing
Significant control for
the level of quality,
form and uses within
the master plan but
provides minimal
flexibility if market
changes.
Table 5: Implementation Strategty Evaluation
15
4.2.2 FLOW OF INITIAL TRANSACTIONS
The sequence of funds to capitalize the project started with the City’s purchase of the land in 2018. Moving forward, existing funds from the Lake District and River District as well as a loan from the River District to the Atlas District totaling $9.5M are projected to be capitalized in Q1 2019 which will fund the waterfront public space development and initial site development. Revenue from land sales starting in Q1 2020 and continuing through the end of 2024 will fund the remainder of the public space costs and Atlas Site development. TIF from the Rivers Edge property is projected to accruing in 2023 and TIF for Atlas District and River District is projected to start to accrue in Q1 and Q2 of 2021, respectively. TIF will generate sufficient funds to cover debt repayment between districts and reimbursement to City funds for land acquisition as well as fund the construction of community facilities and public infrastructure improvements until the Atlas District closes in 2039.
4.3 PROPERTY DISPOSITION
Based on the project plan, an estimated 20 development blocks can be sold to developers/builders starting with the sale of the Triangle parcel and continuing based on the phasing strategy identified above. These blocks could be sold individually, or multiple blocks could be sold to an interested party depending on market interest. The disposition process for the sale of these blocks (or groups of blocks) will occur by phase. Prior to soliciting interest, it is envisioned that ignite cda would complete pre-market preparation and then solicit interest through a formal RFP process. Proposals from interested parties responding to the RFP would then be evaluated and ignite cda would begin negotiations prior to signing a disposition and development agreement (“DDA”). After a DDA is signed, the Board would need to approve the sale and interested party would complete feasibility. Closing for the property could either occur after waiver of feasibility and/or entitlement depending on the terms of the DDA. The estimated time from pre-market prep to closing for each block is estimated to take 12-18 months to close.
4.4 SITE IMPROVEMENTS
The Atlas Site has no internal utilities, highly varied topography and large areas with structurally un-suitable soils. These site characteristics have made development very challenging because of the high infrastructure and site improvement costs. The proposed land use plan was developed to minimize site grading requirements and maximize views to the Spokane River.
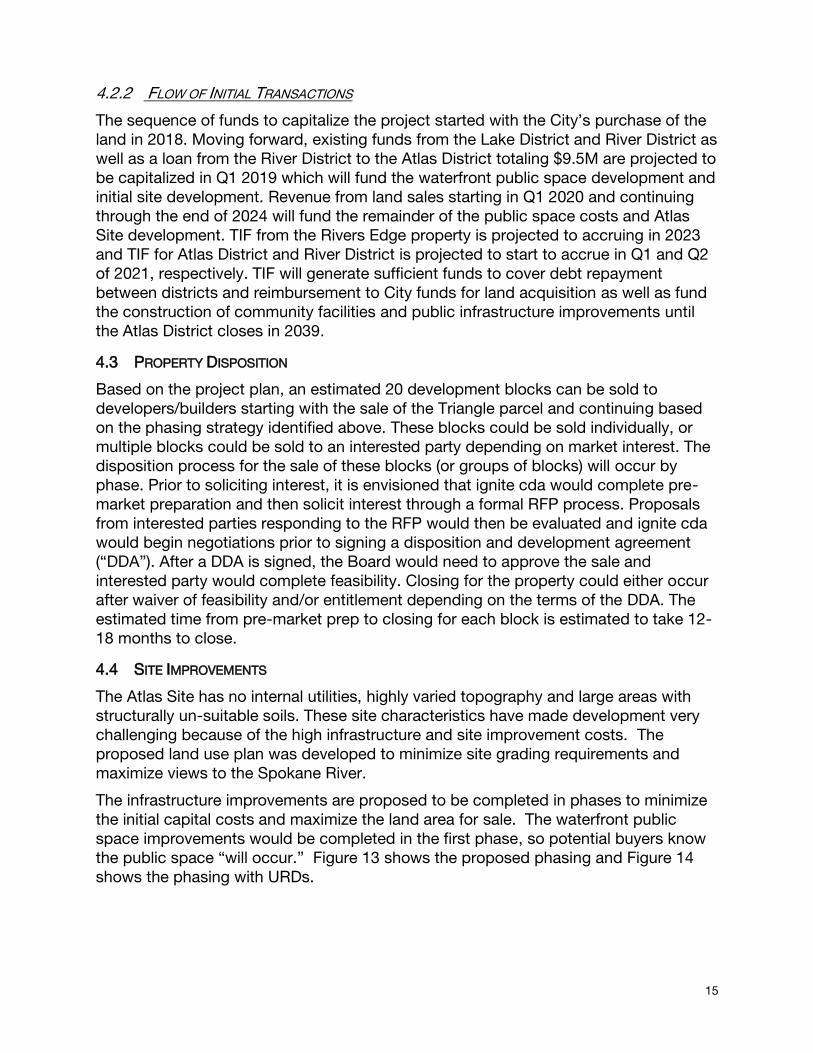
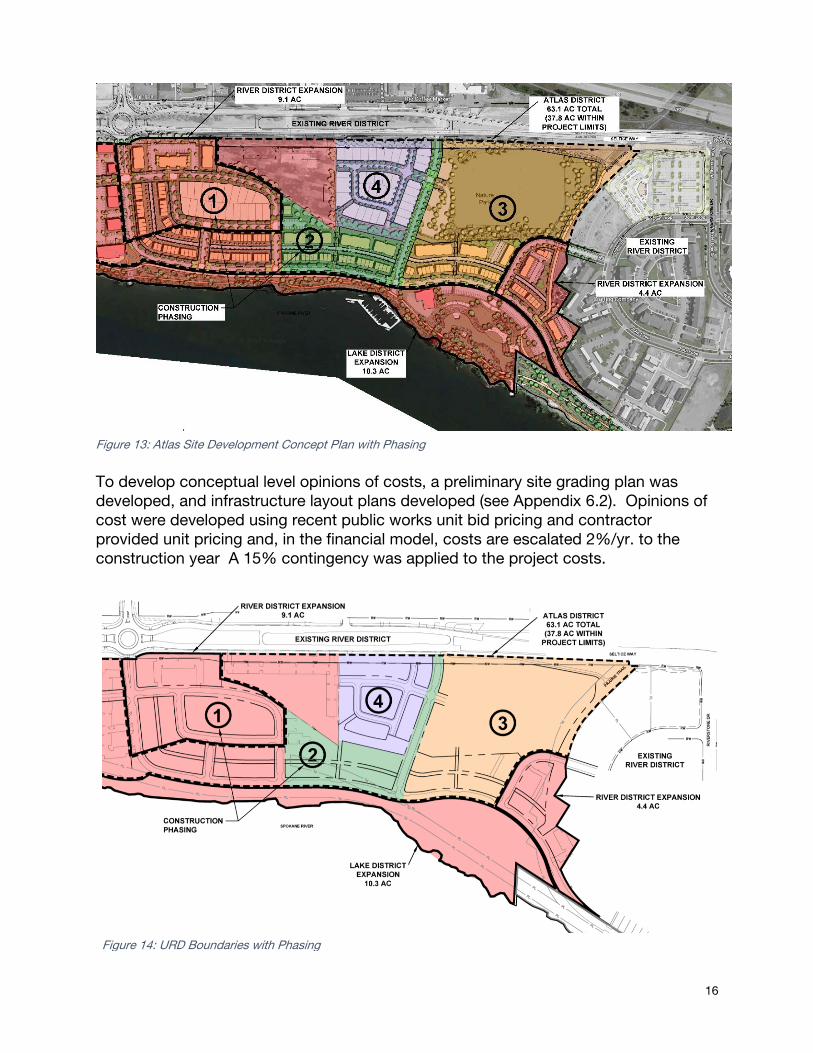
The infrastructure improvements are proposed to be completed in phases to minimize the initial capital costs and maximize the land area for sale. The waterfront public space improvements would be completed in the first phase, so potential buyers know the public space “will occur.” Figure 13 shows the proposed phasing and Figure 14 shows the phasing with URDs.
16
To develop conceptual level opinions of costs, a preliminary site grading plan was developed, and infrastructure layout plans developed (see Appendix 6.2). Opinions of cost were developed using recent public works unit bid pricing and contractor provided unit pricing and, in the financial model, costs are escalated 2%/yr. to the construction year A 15% contingency was applied to the project costs.
Figure 13: Atlas Site Development Concept Plan with Phasing
Figure 14: URD Boundaries with Phasing

17
Tables 6 through 9 summarize the site development opinions of cost by phase and by district in 2018$. This information was used in financial model.
Phase 1 Atlas District River District Lake District Total
Roadway & Stormwater Improvements 1,180,000$ 2,850,000$ -$ $ 4,030,000
Site Grading & Retaining Walls 460,000$ 560,000$ 420,000$ $ 1,440,000
Non-Structural Soil Remediation -$ -$ -$ $ -
Public Space Improvements -$ -$ $ 2,770,000 $ 2,770,000
Shoreline Stabilization -$ -$ 250,000$ $ 250,000
Water System Infrastructure 110,000$ 320,000$ -$ $ 430,000
Wastewater Infrastructure 370,000$ 270,000$ -$ $ 640,000
Legal, Planning, Permitting 40,000$ 80,000$ 70,000$ $ 190,000
Total 2,160,000$ 4,080,000$ 3,510,000$ 9,750,000$
URD Summary - Phase 1
Table 6: URD Summary Phase 1
Atlas District River District Lake District Total
Roadway & Stormwater Improvements 1,370,000$ -$ -$ $ 1,370,000
Site Grading & Retaining Walls 230,000$ -$ -$ $ 230,000
Non-Structural Soil Remediation -$ -$ -$ $ -
Public Space Improvements -$ -$ $ - $ -
Shoreline Stabilization -$ -$ -$ $ -
Water System Infrastructure 130,000$ -$ -$ $ 130,000
Wastewater Infrastructure 120,000$ -$ -$ $ 120,000
Legal, Planning, Permitting 40,000$ -$ -$ $ 40,000
Total 1,890,000$ -$ -$ $ 1,890,000
URD Summary - Phase 2
Table 7: URD Summary Phase 2
Atlas District River District Lake District Total
Roadway & Stormwater Improvements 550,000$ -$ -$ $ 550,000
Site Grading & Retaining Walls 630,000$ -$ -$ $ 630,000
Non-Structural Soil Remediation 390,000$ -$ -$ $ 390,000
Public Space Improvements $ 1,940,000 -$ $ 1,940,000
Shoreline Stabilization -$ -$ -$ $ -
Water System Infrastructure 30,000$ -$ -$ $ 30,000
Wastewater Infrastructure 70,000$ -$ -$ $ 70,000
Legal, Planning, Permitting 70,000$ -$ -$ $ 70,000
Total 3,680,000$ -$ -$ 3,680,000$
URD Summary - Phase 3
Table 8: URD Summary Phase 3

18
4.5 PUBLIC SPACE
A primary project objective was to create substantial public space with open areas, water access, and bicycle and pedestrian trails. The proposed land use plan includes an extensive pedestrian connection network that links the upland and waterfront public spaces with the neighborhoods, Seltice Way and areas to the west and east.
4.5.1 RIVERFRONT PUBLIC SPACE
Following the shoreline for nearly 4,000 lineal feet, the proposed 12.5-acre Riverfront public space will provide a public green space that links the Atlas development to the Spokane River and provides connectivity to public spaces to the west and east. The current concept design features turf landscaping, a paved bicycle trail, and a gravel walking path along the water. In addition, a restroom facility, parking lot and structured water accesses are currently proposed within the public space improvements.
4.5.2 MT. HINK NATURE AREA PUBLIC SPACE
The existing steep topography in the northeast section of the development (named “Mt. Hink”) is a result of removing structural un-suitable soils from the south part of the site and stockpiling them in this area. Based on limited geotechnical investigations and historical photographs, the subsoils in this area are also non-structural. The cost to remediate the site to a buildable condition is more than the site could be sold for. At this time, it appears most feasible to simply re-shape the piles into a desirable 9.5-acre nature park configuration with gravel trails and native plantings. Re-shaping the land in this manner provides a unique public space experience with excellent views to the river and surrounding areas.
4.5.3 RIVERS EDGE PUBLIC SPACE
The proposed Rivers Edge development will include a 40-foot public waterfront corridor and Spokane River access. Public improvements in this corridor may include, among other items, a multi-use trail, landscaping, lighting, and retaining walls. This corridor will be “the final link” in connecting the City’s westernmost park, Johnson Mill River Park, with the City’s other waterfront parks.
Atlas District River District Lake District Total
Roadway & Stormwater Improvements 1,030,000$ -$ -$ $ 1,030,000
Site Grading & Retaining Walls 240,000$ -$ -$ $ 240,000
Non-Structural Soil Remediation 2,550,000$ -$ -$ $ 2,550,000
Public Space Improvements -$ -$ $ - $ -
Shoreline Stabilization -$ -$ -$ $ -
Water System Infrastructure 220,000$ -$ -$ $ 220,000
Wastewater Infrastructure 200,000$ -$ -$ $ 200,000
Legal, Planning, Permitting 80,000$ -$ -$ $ 80,000
Total 4,320,000$ -$ -$ 4,320,000$
URD Summary - Phase 4
Table 9: URD Summary Phase 4
19
5 RECOMMENDED IMPLEMENTATION STRATEGY
5.1 ORGANIZATION
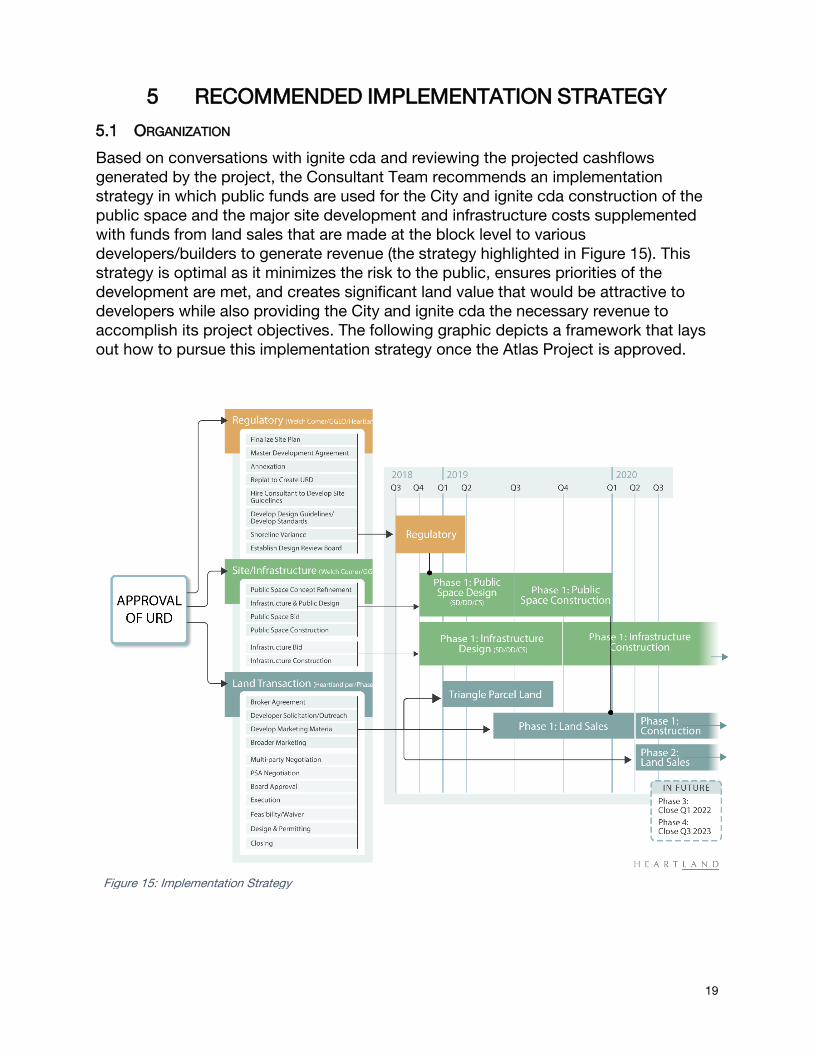
Based on conversations with ignite cda and reviewing the projected cashflows generated by the project, the Consultant Team recommends an implementation strategy in which public funds are used for the City and ignite cda construction of the public space and the major site development and infrastructure costs supplemented with funds from land sales that are made at the block level to various developers/builders to generate revenue (the strategy highlighted in Figure 15). This strategy is optimal as it minimizes the risk to the public, ensures priorities of the development are met, and creates significant land value that would be attractive to developers while also providing the City and ignite cda the necessary revenue to accomplish its project objectives. The following graphic depicts a framework that lays out how to pursue this implementation strategy once the Atlas Project is approved.
Figure 15: Implementation Strategy

20
5.2 RFP/MARKETING
As discussed in the Property Disposition Section, it is envisioned that ignite cda would solicit interest from private developers/builders to buy blocks or groups of blocks through a formal RFP Process based on the staggered timing for each phase. This approach allows the flexibility of multiple developers/builders developing different blocks for each phase which generates revenue sooner. The estimated time from pre-market prep to closing for each transaction is estimated to take 12-18 months staggered from the beginning of 2019 until the end of 2024. The steps for this process are as follows:
1. Pre-Marketing Prep: This would include collection of due-diligence material, informal developer outreach and soft-marketing.
2. Formal RFP Solicitation: An RFP would be created and widely marketed to both local and national developers/builders. This RFP could include the following elements:
a. Summary of the Overall Redevelopment Plan
b. High-level market analysis
c. Rough massing study by block
d. Evaluation Criteria
e. Timing (offer contingent on building permits)
f. Approval process as set out in design guidelines
g. Key terms required for submittal
3. Offer Evaluation: Once offers are received, they will be evaluated, and one developer will be selected for each block or block(s). ignite CDA will negotiate terms with the selected developer as part of the Disposition and Development Agreement (DDA). The developer evaluation and selection will include evaluation of developer proposed project’s consistency with the Atlas Site Development Standards, the terms and price of each offer, as well as a summary of interested parties track record, financial capacity and references.
4. DDA Signing and Closing: The last step of the process is signing a DDA with a single party for each block(s) and closing on the property after waiver of feasibility and/or entitlement.
5.2.1 DEVELOPMENT STANDARDS
The Atlas Site development is unique because it will be led by the City/ignite cda,
whose objectives are not solely focused on the short-term bottom line, but rather on
both the short-term (land sales) and long-term (tax increment) bottom line and the
long-term neighborhood character and community benefit. Additionally, multiple
developers/builders may be involved in purchasing blocks or groups of blocks, which
require a higher level of architectural coordination amongst the buyers. To address the
project characteristics, a robust set of development standards should be developed to
establish the neighborhood character, maintain a consistent quality, and promote long
term value.

21
The development standards may include:
1. Generally defining acceptable residential and commercial building character, but
also creating a list of building evaluation criteria to promote developer/builder
creativity.
2. Establishing building relationships to streets, trails, parks and the public realm in
general.
3. Vehicular access and parking
4. Street design
5. Pocket parks, plazas, trails and public stairs (outdoor areas associated with
private development, not large public land areas such as the waterfront and
upland landscape park)
The development standards could be developed in collaboration with the City planning
department and attached to the property through a PUD. Exploring different
approaches to development standards, based on examples from similar projects will
help determine which approach holds the most promise for Atlas Mill.
5.2.2 ROLES/RESPONSIBILITIES
As depicted in Figure 15, the implementation strategy divides the roles and responsibilities of the subconsultant into three tracks:
• Regulatory: After approval of the district there are several regulatory steps still needed to occur prior to solicitating an RFP. Welch Comer, working with GGLO and Heartland, would work with ignite cda to finalize the regulatory conditions needed to implement the site plan, these tasks could include but are not limited to: finalizing the site plan; defining a master plan agreement; pursuing annexation; re-platting; developing site and design guidelines; approving a shoreline variance; and establishing a design review board.
• Site/Infrastructure: Welch Comer along with GGLO will work to continue to design public space enhancements, infrastructure and roads and assist ignite cda with solicitating bids and managing the public space and infrastructure construction.
• Land Transactions: As part of the land transaction process, Heartland will assist ignite cda with soliciting a formal RFP and assisting with the selection and negotiation with developers/builders as discussed in more detail in the RFP/Marketing section.

22
6 APPENDICES
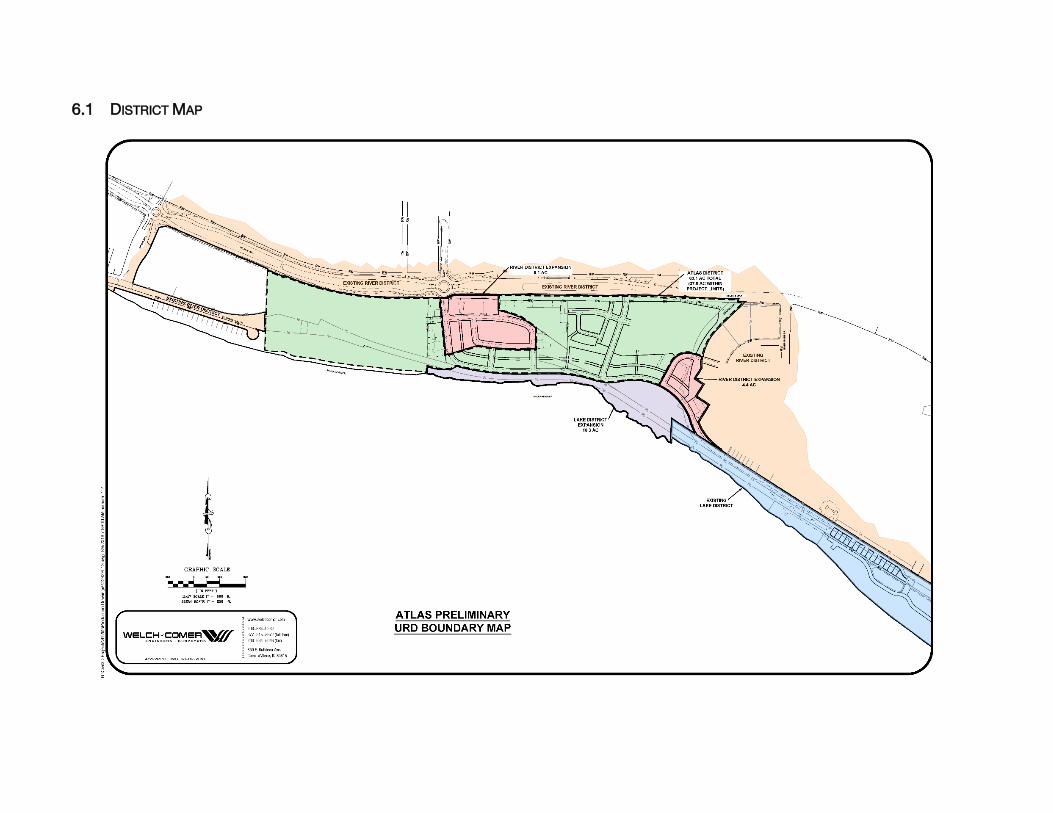
6.1 DISTRICT MAP

6.2 INFRASTRUCTURE CONCEPTS


6.3 BLOCK MAP
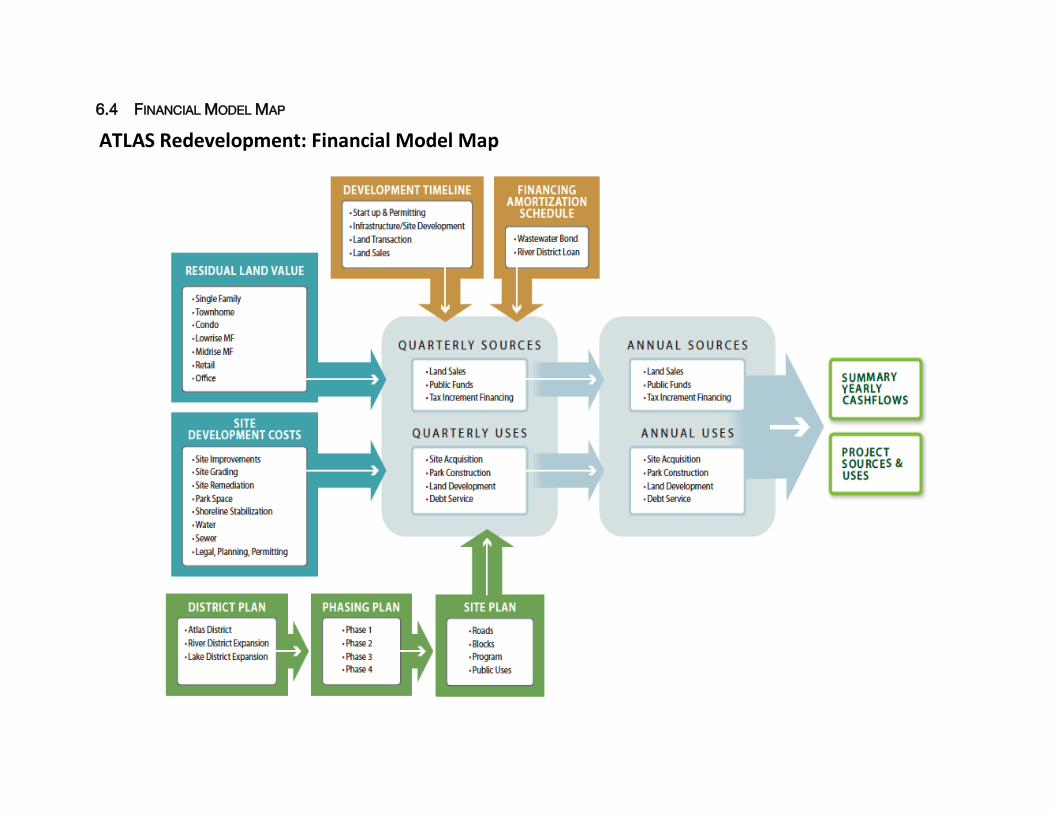
ATLAS Redevelopment: Financial Model Map
6.4 FINANCIAL MODEL MAP

1 2 3 4 7 8
RLV PSF $20.12 $12.81 $16.90 $5.65 $8.49 $6.68
RLV /Unit $111,777 $29,893 $18,399 $5,591 $307 $399
Units/Acre 8 19 40 44 0.6 1.2
GFA Per Unit 2,300 2,000 1,412 1,059 1 1
$/ GFA 300 265 370 242 307 399
Land Use Single Family Townhome Condo Lowrise MF Retail Medical Office
Space Program
Pad Size 43,560 43,560 43,560 43,560 43,560 43,560 Land SF
Net Developable Area 90% 75% 43% 54% 50% 60% % Pad
FAR NA NA 3.0 2.0 0.6 1.2
Average Lot Size 5,000 1,750 -- -- -- --
Average Unit Size 2,300 2,000 1,200 900 -- --
Parking Type Surface Surface Surface Surface Surface Surface
Efficiency -- -- 85% 85% 90% 90%
Building Area 18,034 37,337 56,192 47,045 13,068 31,363 SF
Rentable Area -- -- 47,764 39,988 11,761 28,227 SF
Units 8 19 40 44 -- --
Parking
Minimums 2 2 2 1.25 200 300 Per Unit/SF Min
Spaces 16 37 80 55 59 94
Parking Check 0.89 0.75 0.54 0.68 0.66 0.46
Revenue
Sale
Sales Price $300 $265 $370 -- -- --
Sale Price Per Unit $690,000 $530,000 $444,000 -- -- --
Less: Sales Costs -$18 -$16 -$22 -- -- --
Net Sales Revenue $282 $249 $348 -- -- --
Total Sale Revenue $5,085,588 $9,300,647 $19,543,717 -- -- --
Rent -- -- -- $1.60 $27 $33.8
Occupancy -- -- -- 94% 90% 92%
Operating Expenses
Operating Expense Type -- -- -- FSG NNN NNN
Expense Ratio -- -- -- 25% 0% 0%
Total Net Operating Income -- -- -- $541,279 $280,505 $876,445
Cap Rate 5.60% 7.0% 7.00%
Total Value $5,085,588 $9,300,647 $19,543,717 $9,665,690 $4,007,209 $12,520,637
$306.64 $399.21
Cost
Hard Costs $2,885,440 $5,973,920 $11,800,404 $5,880,600 $2,090,880 $7,527,168
Alley Infrastructure $73,023 $153,035 $87,193
Parking $80,000 $185,000 $400,000 $275,000 $295,000 $470,000
Hard Cost Contingency $144,272 $298,696 $590,020 $294,030 $104,544 $376,358
Soft Costs (Excluding Financing) $318,273 $661,065 $2,575,523 $1,289,926 $498,085 $1,674,705
Financing $159,137 $330,533 $901,433 $451,474 $174,330 $586,147
Developer Profit $549,022 $1,140,337 $2,453,186 $1,228,655 $474,426 $1,595,157
Total Project Costs $4,209,167 $8,742,586 $18,807,760 $9,419,685 $3,637,264 $12,229,535
$389.93
Residual Land Value $876,421 $558,061 $735,957 $246,006 $369,945 $291,102
Land Value Per SF $20 $13 $17 $6 $8.5 $6.7
Land Value Per Unit $111,777 $29,893 $18,399 $5,591 -- --
6.5 RLV BY PRODUCT TYPE

6.5.1 RLV COST BY PRODUCT TYPE
Land Use Single Family Townhome Condo Low-Rise Retail Medical OfficeHard Costs
PSF $160 $160 $210 $125 $160 $240 PBSF
Site Development Costs $4.05 $4.10 $1.55 $0.00
Hard Cost Contingency 5% 5% 5% 5% 5% 5% % Total
Parking
Cost/Stall $5,000 $5,000 $5,000 $5,000 $5,000 $5,000 Per Stall
Soft Costs
Soft Costs (Includes Financing) 10% 10% 20% 20% 20% 20% % of Hard Costs
Financing Costs 5% 5% 7% 7% 7% 7%
Developer Profit 15% 15% 15% 15% 15% 15%
Sales Costs
Sale Costs 6% 6% 6% -- -- -- % of Sales Price

ATLAS Redevelopment Annual Cashflow Baseline Change
Include Rivers Edge Property Y Min Cash Buffer 1,120,992$ 1,237,246$
Cost (+/- base) 0% Year of Min Cash buffer 2,027$ 2023
Revenue (+/- base) 0%
Development Delay 0%
SOURCES 2018 2019 2020 2021 2022 2023 2024 2025 2026 2027 2028 2029 2030 2031 2032 2033 2034 2035 2036 2037 2038 2039
Land Sales
Triangle 1,154,361$ -$ -$ 1,154,361$ -$ -$ -$ -$ -$ -$ -$ -$ -$ -$ -$ -$ -$ -$ -$ -$ -$ -$ -$
Phase 1 (Atlas) 2,693,330$ -$ -$ -$ 2,693,330$ -$ -$ -$ -$ -$ -$ -$ -$ -$ -$ -$ -$ -$ -$ -$ -$ -$ -$
Phase 1 (River) 3,880,187$ -$ -$ 3,880,187$ -$ -$ -$ -$ -$ -$ -$ -$ -$ -$ -$ -$ -$ -$ -$ -$ -$ -$ -$
Phase 1 (Lake) 194,335$ -$ -$ 194,335$ -$ -$ -$ -$ -$ -$ -$ -$ -$ -$ -$ -$ -$ -$ -$ -$ -$ -$ -$
Phase 2 1,919,167$ -$ -$ -$ 1,919,167$ -$ -$ -$ -$ -$ -$ -$ -$ -$ -$ -$ -$ -$ -$ -$ -$ -$ -$
Phase 3 995,729$ -$ -$ -$ -$ 995,729$ -$ -$ -$ -$ -$ -$ -$ -$ -$ -$ -$ -$ -$ -$ -$ -$ -$
Phase 4 4,602,257$ -$ -$ -$ -$ -$ -$ 4,602,257$ -$ -$ -$ -$ -$ -$ -$ -$ -$ -$ -$ -$ -$ -$ -$
Phase 5 -$ -$ -$ -$ -$ -$ -$ -$ -$ -$ -$ -$ -$ -$ -$ -$ -$ -$ -$ -$ -$ -$ -$
Land Sales Total 15,439,366$ -$ -$ 5,228,883$ 4,612,497$ 995,729$ -$ 4,602,257$ -$ -$ -$ -$ -$ -$ -$ -$ -$ -$ -$ -$ -$ -$ -$
City
General Fund -$ -$ -$ -$ -$ -$ -$ -$ -$ -$ -$ -$ -$ -$ -$ -$ -$ -$ -$ -$ -$ -$ -$
Wastewater 7,850,000$ 7,850,000$ -$ -$ -$ -$ -$ -$ -$ -$ -$ -$ -$ -$ -$ -$ -$ -$ -$ -$ -$ -$ -$
-$
Ignite CDA -$
Shoreline Stabilization -$ -$ -$ -$ -$ -$ -$ -$ -$ -$ -$ -$ -$ -$ -$ -$ -$ -$ -$ -$ -$ -$ -$
Lake District 3,700,000$ -$ 3,700,000$ -$ -$ -$ -$ -$ -$ -$ -$ -$ -$ -$ -$ -$ -$ -$ -$ -$ -$ -$ -$
River District 3,700,000$ -$ 3,700,000$ -$ -$ -$ -$ -$ -$ -$ -$ -$ -$ -$ -$ -$ -$ -$ -$ -$ -$ -$ -$
Estimated Property Valuation -$ -$ -$ 9,314,597$ 34,464,009$ 55,900,623$ 59,308,350$ 60,494,517$ 61,704,407$ 62,938,496$ 64,197,266$ -$ -$ -$ -$ -$ -$ -$ -$ -$ -$ -$
2017 Levy Rate 1.00058% 1.00058% 1.00058% 1.00058% 1.00058% 1.00058% 1.00058% 1.00058% 1.00058% 1.00058% 1.00058% 1.00058% 1.00058% 1.00058% 1.00058% 1.00058% 1.00058% 1.00058% 1.00058% 1.00058% 1.00058% 1.00058%
River District Tax Increment 4,085,577$ -$ -$ -$ 93,200$ 344,839$ 559,329$ 593,425$ 605,294$ 617,400$ 629,748$ 642,343$ -$ -$ -$ -$ -$ -$ -$ -$ -$ -$ -$
Atlas District 2,100,000$ -$ 2,100,000$ -$ -$ -$ -$ -$ -$ -$ -$ -$ -$ -$ -$ -$ -$ -$ -$ -$ -$ -$ -$
Estimated Atlas Project Property Valuation -$ -$ -$ 4,707,215$ 28,324,677$ 91,108,999$ 155,665,752$ 189,212,619$ 211,143,190$ 223,678,137$ 228,348,313$ 232,915,280$ 237,573,585$ 242,325,057$ 247,171,558$ 252,114,989$ 257,157,289$ 262,300,435$ 267,546,443$ 272,897,372$ 278,355,320$ 283,922,426$
2017 Levy Rate 1.00058% 1.00058% 1.00058% 1.00058% 1.00058% 1.00058% 1.00058% 1.00058% 1.00058% 1.00058% 1.00058% 1.00058% 1.00058% 1.00058% 1.00058% 1.00058% 1.00058% 1.00058% 1.00058% 1.00058% 1.00058% 1.00058%
Atlas District Tax Increment 39,687,557$ -$ -$ -$ 47,099$ 283,410$ 911,615$ 1,557,555$ 1,893,217$ 2,112,649$ 2,238,071$ 2,284,800$ 2,330,496$ 2,377,106$ 2,424,648$ 2,473,141$ 2,522,604$ 2,573,056$ 2,624,517$ 2,677,007$ 2,730,547$ 2,785,158$ 2,840,861$
Estimated Rivers Edge Project Property Valuation -$ -$ -$ -$ -$ 13,783,925$ 36,113,883$ 58,890,441$ 82,122,530$ 105,819,260$ 129,989,925$ 154,644,004$ 179,791,164$ 205,441,267$ 231,604,372$ 268,723,395$ 281,072,682$ 286,694,136$ 292,428,018$ 298,276,579$ 304,242,110$ 310,326,952$
2017 Levy Rate 1.00058% 1.00058% 1.00058% 1.00058% 1.00058% 1.00058% 1.00058% 1.00058% 1.00058% 1.00058% 1.00058% 1.00058% 1.00058% 1.00058% 1.00058% 1.00058% 1.00058% 1.00058% 1.00058% 1.00058% 1.00058% 1.00058%
Rivers Edge Property Tax Increment 32,418,328$ -$ -$ -$ -$ -$ 137,919$ 361,347$ 589,244$ 821,699$ 1,058,803$ 1,300,649$ 1,547,332$ 1,798,948$ 2,055,597$ 2,317,379$ 2,688,783$ 2,812,347$ 2,868,594$ 2,925,966$ 2,984,486$ 3,044,175$ 3,105,059$
Ignite CDA Total 85,691,462$ 0$ 9,500,000$ 0$ 14,162,112$ 63,416,935$ 162,402,410$ 253,600,313$ 311,685,332$ 358,521,876$ 396,362,514$ 426,763,296$ 391,437,111$ 421,540,803$ 452,246,569$ 483,566,450$ 526,049,772$ 543,615,374$ 554,487,682$ 565,577,435$ 576,888,984$ 588,426,764$ 600,195,299$
Total Sources Per Year 108,980,829$ 7,850,000$ 9,500,000$ 5,228,883$ 4,752,796$ 1,623,978$ 1,608,863$ 7,114,585$ 3,087,755$ 3,551,748$ 3,926,622$ 4,227,791$ 3,877,828$ 4,176,054$ 4,480,245$ 4,790,520$ 5,211,387$ 5,385,403$ 5,493,111$ 5,602,973$ 5,715,033$ 5,829,334$ 5,945,920$
Cumulative SourCLs 7,850,000$ 17,350,000$ 22,578,883$ 27,331,679$ 28,955,657$ 30,564,520$ 37,679,104$ 40,766,860$ 44,318,608$ 48,245,229$ 52,473,021$ 56,350,848$ 60,526,902$ 65,007,147$ 69,797,667$ 75,009,054$ 80,394,457$ 85,887,569$ 91,490,542$ 97,205,575$ 103,034,908$ 108,980,829$
USES 2018 2019 2020 2021 2022 2023 2024 2025 2026 2027 2028 2029 2030 2031 2032 2033 2034 2035 2036 2037 2038 2039
Site Acquisition 7,850,000-$ 7,850,000-$ -$ -$ -$ -$ -$ -$ -$ -$ -$ -$ -$ -$ -$ -$ -$ -$ -$ -$ -$ -$ -$
Operating Costs 7,283,551-$ -$ 151,129-$ 154,174-$ 157,281-$ 207,537-$ 354,397-$ 361,538-$ 368,823-$ 376,255-$ 383,837-$ 391,572-$ 399,462-$ 407,511-$ 415,723-$ 424,100-$ 432,646-$ 441,364-$ 450,257-$ 459,330-$ 468,586-$ 478,028-$ -$
Public Space -$
Future Public Space Improvements * 2,500,000-$ -$ -$ 500,000-$ -$ -$ -$ -$ -$ -$ -$ -$ 1,000,000-$ 1,000,000-$ -$ -$ -$ -$ -$ -$ -$ -$ -$
Phase 1 2,825,400-$ -$ 2,825,400-$ -$ -$ -$ -$ -$ -$ -$ -$ -$ -$ -$ -$ -$ -$ -$ -$ -$ -$ -$ -$
Phase 2 -$ -$ -$ -$ -$ -$ -$ -$ -$ -$ -$ -$ -$ -$ -$ -$ -$ -$ -$ -$ -$ -$ -$
Phase 3 2,141,917-$ -$ -$ -$ -$ -$ 2,141,917-$ -$ -$ -$ -$ -$ -$ -$ -$ -$ -$ -$ -$ -$ -$ -$ -$
Land Development
Phase 1 7,190,796-$ -$ 3,559,800-$ 3,630,996-$ -$ -$ -$ -$ -$ -$ -$ -$ -$ -$ -$ -$ -$ -$ -$ -$ -$ -$ -$
Phase 2 2,005,683-$ -$ -$ -$ 2,005,683-$ -$ -$ -$ -$ -$ -$ -$ -$ -$ -$ -$ -$ -$ -$ -$ -$ -$ -$
Phase 3 1,883,432-$ -$ -$ -$ -$ 1,883,432-$ -$ -$ -$ -$ -$ -$ -$ -$ -$ -$ -$ -$ -$ -$ -$ -$ -$
Phase 4 4,865,022-$ -$ -$ -$ -$ -$ -$ 4,865,022-$ -$ -$ -$ -$ -$ -$ -$ -$ -$ -$ -$ -$ -$ -$ -$
Debt Service
Atlas District Loan Repay to River District 2,213,490-$ -$ -$ -$ 316,213-$ 316,213-$ 316,213-$ 316,213-$ 316,213-$ 316,213-$ 316,213-$ -$ -$ -$ -$ -$ -$ -$ -$ -$ -$ -$ -$
Reimbursement
Atlas District ROW Repayment to City 557,328-$ -$ -$ -$ -$ -$ -$ -$ 557,328-$ -$ -$ -$ -$ -$ -$ -$ -$ -$ -$ -$ -$ -$ -$
Wastewater Repayment (Atlas Districts) 6,700,886-$ -$ -$ -$ -$ -$ -$ -$ -$ 2,234,849-$ 3,296,874-$ 1,169,163-$ -$ -$ -$ -$ -$ -$ -$ -$ -$ -$ -$
Wastewater Repayment (Lake District) 193,454-$ -$ -$ -$ 193,454-$ -$ -$ -$ -$ -$ -$ -$ -$ -$ -$ -$ -$ -$ -$ -$ -$ -$ -$
Wastewater Repayment (River District) 2,018,165-$ -$ -$ -$ -$ 204,107-$ 559,329-$ 593,425-$ 47,966-$ 613,338-$ -$ -$ -$ -$ -$ -$ -$ -$ -$ -$ -$ -$ -$
Community Facilities
Cultural Center 7,750,000-$ -$ -$ -$ -$ -$ -$ 750,000-$ -$ -$ -$ -$ -$ -$ -$ -$ -$ -$ -$ -$ 4,000,000-$ 3,000,000-$ -$
Educational Facility 3,250,000-$ -$ -$ -$ -$ -$ 750,000-$ -$ -$ -$ -$ -$ -$ 1,000,000-$ 1,500,000-$ -$ -$ -$ -$ -$ -$ -$ -$
Multi Purpose Athletic / Perf. Facilities 10,500,000-$ -$ -$ -$ -$ -$ -$ -$ -$ 500,000-$ -$ -$ -$ -$ -$ -$ 5,000,000-$ 5,000,000-$ -$ -$ -$ -$ -$
Other Public Facilities ** 17,600,000-$ -$ -$ -$ 500,000-$ -$ -$ -$ -$ -$ 600,000-$ -$ -$ -$ -$ -$ -$ -$ 5,000,000-$ 5,000,000-$ -$ 6,500,000-$ -$
Public Medical Facility 6,750,000-$ -$ -$ -$ 750,000-$ -$ -$ -$ -$ -$ -$ -$ -$ -$ 3,000,000-$ 3,000,000-$ -$ -$ -$ -$ -$ -$ -$ 45,850,000-$
Total Use Per Year 96,079,124-$ 7,850,000-$ 6,536,329-$ 4,285,170-$ 3,922,631-$ 2,611,289-$ 4,121,855-$ 6,886,198-$ 1,290,330-$ 4,040,655-$ 4,596,924-$ 1,560,735-$ 1,399,462-$ 2,407,511-$ 4,915,723-$ 3,424,100-$ 5,432,646-$ 5,441,364-$ 5,450,257-$ 5,459,330-$ 4,468,586-$ 9,978,028-$ -$
Cumulative Uses 7,850,000-$ 14,386,329-$ 18,671,499-$ 22,594,129-$ 25,205,419-$ 29,327,274-$ 36,213,472-$ 37,503,802-$ 41,544,457-$ 46,141,381-$ 47,702,116-$ 49,101,578-$ 51,509,089-$ 56,424,812-$ 59,848,912-$ 65,281,558-$ 70,722,922-$ 76,173,179-$ 81,632,510-$ 86,101,096-$ 96,079,124-$ 96,079,124-$
* = could include public infrastrucutre (streets, water sewer), sidewalks, site remediation, site preparation, parking, parks, ped/bike trails, riverfront access, docks.
** could include facilities such as museums, convention center, community centers, public saftety buildings.
NET PROCEEDS 2018 2019 2020 2021 2022 2023 2024 2025 2026 2027 2028 2029 2030 2031 2032 2033 2034 2035 2036 2037 2038 2039
6,462,156$ Cumulative Proceeds ) 2,963,671$ 3,907,384$ 4,737,550$ 3,750,239$ 1,237,246$ 1,465,633$ 3,263,058$ 2,774,150$ 2,103,848$ 4,770,905$ 7,249,270$ 9,017,813$ 8,582,335$ 9,948,755$ 9,727,496$ 9,671,536$ 9,714,389$ 9,858,032$ 11,104,479$ 6,955,784$ 12,901,705$
Annual Proceeds 12,901,705$ -$ 2,963,671$ 943,713$ 830,165$ 987,311-$ 2,512,992-$ 228,386$ 1,797,425$ 488,907-$ 670,302-$ 2,667,056$ 2,478,366$ 1,768,543$ 435,478-$ 1,366,420$ 221,259-$ 55,961-$ 42,854$ 143,643$ 1,246,447$ 4,148,695-$ 5,945,920$
$0
$2
$4
$6
$8
$10
$12
2018 2019 2020 2021 2022 2023 2024 2025 2026 2027 2028 2029 2030 2031 2032 2033 2034 2035 2036
Mil
lio
ns
Net Cashflows
-$10
-$8
-$6
-$4
-$2
$0
$2
$4
$6
$8
$10
2018 2019 2020 2021 2022 2023 2024 2025 2026 2027 2028 2029 2030 2031 2032 2033 2034 2035 2036 2037 2038 2039
Mil
lio
ns
Annual Sources & Uses
6.6 ANNUAL PROJECT-BASED CF

ATLAS District Annual Cashflow
SOURCES 2018 2019 2020 2021 2022 2023 2024 2025 2026 2027 2028 2029 2030 2031 2032 2033 2034 2035 2036 2037 2038 2039
Land Sales
Triangle 1,154,361$ -$ -$ 1,154,361$ -$ -$ -$ -$ -$ -$ -$ -$ -$ -$ -$ -$ -$ -$ -$ -$ -$ -$ -$
Phase 1 2,693,330$ -$ -$ -$ 2,693,330$ -$ -$ -$ -$ -$ -$ -$ -$ -$ -$ -$ -$ -$ -$ -$ -$ -$ -$
Phase 2 1,919,167$ -$ -$ -$ 1,919,167$ -$ -$ -$ -$ -$ -$ -$ -$ -$ -$ -$ -$ -$ -$ -$ -$ -$ -$
Phase 3 995,729$ -$ -$ -$ -$ 995,729$ -$ -$ -$ -$ -$ -$ -$ -$ -$ -$ -$ -$ -$ -$ -$ -$ -$
Phase 4 4,602,257$ -$ -$ -$ -$ -$ -$ 4,602,257$ -$ -$ -$ -$ -$ -$ -$ -$ -$ -$ -$ -$ -$ -$ -$
Land Sales Total 11,364,844$ -$ -$ 1,154,361$ 4,612,497$ 995,729$ -$ 4,602,257$ -$ -$ -$ -$ -$ -$ -$ -$ -$ -$ -$ -$ -$ -$ -$
City
General Fund -$ -$ -$ -$ -$ -$ -$ -$ -$ -$ -$ -$ -$ -$ -$ -$ -$ -$ -$ -$ -$ -$ -$
61% Wastewater 4,817,045$ 4,817,045$ -$ -$ -$ -$ -$ -$ -$ -$ -$ -$ -$ -$ -$ -$ -$ -$ -$ -$ -$ -$ -$
Ignite CDA
Atlas District 2,100,000$ -$ 2,100,000$ -$ -$ -$ -$ -$ -$ -$ -$ -$ -$ -$ -$ -$ -$ -$ -$ -$ -$ -$ -$
Atlas District Tax Increment 39,687,557$ -$ -$ -$ 47,099$ 283,410$ 911,615$ 1,557,555$ 1,893,217$ 2,112,649$ 2,238,071$ 2,284,800$ 2,330,496$ 2,377,106$ 2,424,648$ 2,473,141$ 2,522,604$ 2,573,056$ 2,624,517$ 2,677,007$ 2,730,547$ 2,785,158$ 2,840,861$
Rivers Edge Property Tax Increment 29,313,269$ -$ -$ -$ -$ -$ 137,919$ 361,347$ 589,244$ 821,699$ 1,058,803$ 1,300,649$ 1,547,332$ 1,798,948$ 2,055,597$ 2,317,379$ 2,688,783$ 2,812,347$ 2,868,594$ 2,925,966$ 2,984,486$ 3,044,175$ -$
Ignite CDA Total 71,100,826$ -$ 2,100,000$ -$ 47,099$ 283,410$ 1,049,534$ 1,918,902$ 2,482,461$ 2,934,348$ 3,296,874$ 3,585,449$ 3,877,828$ 4,176,054$ 4,480,245$ 4,790,520$ 5,211,387$ 5,385,403$ 5,493,111$ 5,602,973$ 5,715,033$ 5,829,334$ 2,840,861$
Total Source Per Year 72,897,488$ 4,817,045$ 2,100,000$ 1,154,361$ 4,659,596$ 1,279,139$ 1,049,534$ 6,521,159$ 2,482,461$ 2,934,348$ 3,296,874$ 3,585,449$ 3,877,828$ 4,176,054$ 4,480,245$ 4,790,520$ 5,211,387$ 5,385,403$ 5,493,111$ 5,602,973$ 5,715,033$ 5,829,334$ 2,840,861$
Cumulative Sources 4,817,045$ 6,917,045$ 8,071,407$ 12,731,003$ 14,010,142$ 15,059,676$ 21,580,835$ 24,063,297$ 26,997,645$ 30,294,519$ 33,879,967$ 37,757,795$ 41,933,849$ 46,414,094$ 51,204,614$ 56,416,001$ 61,801,404$ 67,294,515$ 72,897,488$ 78,612,521$ 84,441,855$ 87,282,716$
USES 2018 2019 2020 2021 2022 2023 2024 2025 2026 2027 2028 2029 2030 2031 2032 2033 2034 2035 2036 2037 2038 2039
61% Site Acquisition 4,817,045-$ 4,817,045-$ -$ -$ -$ -$ -$ -$ -$ -$ -$ -$ -$ -$ -$ -$ -$ -$ -$ -$ -$ -$ -$
Operating Costs 7,283,551-$ -$ 151,129-$ 154,174-$ 157,281-$ 207,537-$ 354,397-$ 361,538-$ 368,823-$ 376,255-$ 383,837-$ 391,572-$ 399,462-$ 407,511-$ 415,723-$ 424,100-$ 432,646-$ 441,364-$ 450,257-$ 459,330-$ 468,586-$ 478,028-$ -$
Future Public Space Improvements * 2,000,000-$ -$ -$ -$ -$ -$ -$ -$ -$ -$ -$ -$ 1,000,000-$ 1,000,000-$ -$ -$ -$ -$ -$ -$ -$ -$ -$
Phase 3 2,141,917-$ -$ -$ -$ -$ -$ 2,141,917-$ -$ -$ -$ -$ -$ -$ -$ -$ -$ -$ -$ -$ -$ -$
Land Development -$
31% Phase 1 2,225,232-$ -$ 1,101,600-$ 1,123,632-$ -$ -$ -$ -$ -$ -$ -$ -$ -$ -$ -$ -$ -$ -$ -$ -$ -$ -$ -$
100% Phase 2 2,005,683-$ -$ -$ -$ 2,005,683-$ -$ -$ -$ -$ -$ -$ -$ -$ -$ -$ -$ -$ -$ -$ -$ -$ -$ -$
100% Phase 3 1,883,432-$ -$ -$ -$ -$ 1,883,432-$ -$ -$ -$ -$ -$ -$ -$ -$ -$ -$ -$ -$ -$ -$ -$ -$ -$
Phase 4 4,865,022-$ -$ -$ -$ -$ -$ -$ 4,865,022-$ -$ -$ -$ -$ -$ -$ -$ -$ -$ -$ -$ -$ -$ -$ -$
Debt Service
Atlas District Loan Repay to River District 2,213,490-$ -$ -$ -$ 316,213-$ 316,213-$ 316,213-$ 316,213-$ 316,213-$ 316,213-$ 316,213-$ -$ -$ -$ -$ -$ -$ -$ -$ -$ -$ -$ -$
Reimbursement
Atlas District ROW Repayment to City 557,328-$ -$ -$ -$ -$ -$ -$ -$ 557,328-$ -$ -$ -$ -$ -$ -$ -$ -$ -$ -$ -$ -$ -$ -$
Wastewater Repayment 6,700,886-$ -$ -$ -$ -$ -$ -$ -$ -$ 2,234,849-$ 3,296,874-$ 1,169,163-$ -$ -$ -$ -$ -$ -$ -$ -$ -$ -$ -$
Community Facilities
Cultural Center 7,000,000-$ -$ -$ -$ -$ -$ -$ -$ -$ -$ -$ -$ -$ -$ -$ -$ -$ -$ -$ -$ 4,000,000-$ 3,000,000-$ -$
Educational Facilities 2,500,000-$ -$ -$ -$ -$ -$ -$ -$ -$ -$ -$ -$ -$ 1,000,000-$ 1,500,000-$ -$ -$ -$ -$ -$ -$ -$ -$
Multi Purpose Athletic / Perf. Facilities 10,000,000-$ -$ -$ -$ -$ -$ -$ -$ -$ -$ -$ -$ -$ -$ -$ -$ 5,000,000-$ 5,000,000-$ -$ -$ -$ -$ -$
Other Public Facilities ** 16,500,000-$ -$ -$ -$ -$ -$ -$ -$ -$ -$ -$ -$ -$ -$ -$ -$ -$ -$ 5,000,000-$ 5,000,000-$ -$ 6,500,000-$ -$
Public Medical Facilities 6,000,000-$ -$ -$ -$ -$ -$ -$ -$ -$ -$ -$ -$ -$ -$ 3,000,000-$ 3,000,000-$ -$ -$ -$ -$ -$ -$ -$ 42,000,000-$
Total Use Per Year 78,693,586-$ 4,817,045-$ 1,252,729-$ 1,277,806-$ 2,479,177-$ 2,407,182-$ 2,812,527-$ 5,542,773-$ 1,242,365-$ 2,927,317-$ 3,996,924-$ 1,560,735-$ 1,399,462-$ 2,407,511-$ 4,915,723-$ 3,424,100-$ 5,432,646-$ 5,441,364-$ 5,450,257-$ 5,459,330-$ 4,468,586-$ 9,978,028-$ -$
Cumulative Uses 4,817,045-$ 6,069,774-$ 7,347,580-$ 9,826,757-$ 12,233,939-$ 15,046,465-$ 20,589,238-$ 21,831,603-$ 24,758,920-$ 28,755,844-$ 30,316,579-$ 31,716,041-$ 34,123,552-$ 39,039,275-$ 42,463,375-$ 47,896,020-$ 53,337,384-$ 58,787,642-$ 64,246,972-$ 68,715,558-$ 78,693,586-$ 78,693,586-$
13,121,285-$
* = could include public infrastrucutre (streets, water sewer), sidewalks, site remediation, site preparation, parking, parks, ped/bike trails, riverfront access, docks.
** = could include facilities such as museums, convention center, community centers, public saftety buildings.
NET PROCEEDS 2018 2019 2020 2021 2022 2023 2024 2025 2026 2027 2028 2029 2030 2031 2032 2033 2034 2035 2036 2037 2038 2039
Cumulative Proceeds -$ 847,271$ 723,826$ 2,904,246$ 1,776,204$ 13,211$ 991,597$ 2,231,694$ 2,238,725$ 1,538,675$ 3,563,389$ 6,041,754$ 7,810,297$ 7,374,819$ 8,741,239$ 8,519,980$ 8,464,020$ 8,506,873$ 8,650,516$ 9,896,963$ 5,748,268$ 8,589,130$
Annual Proceeds 5,796,098-$ -$ 847,271$ 123,445-$ 2,180,420$ 1,128,043-$ 1,762,992-$ 978,386$ 1,240,096$ 7,031$ 700,050-$ 2,024,714$ 2,478,366$ 1,768,543$ 435,478-$ 1,366,420$ 221,259-$ 55,961-$ 42,854$ 143,643$ 1,246,447$ 4,148,695-$ 2,840,861$
$0
$2
$4
$6
$8
$10
$12
2018 2019 2020 2021 2022 2023 2024 2025 2026 2027 2028 2029 2030 2031 2032 2033 2034 2035 2036 2037 2038 2039
Mil
lio
ns
Net Cashflows
-$10
-$8
-$6
-$4
-$2
$0
$2
$4
$6
$8
$10
2018 2019 2020 2021 2022 2023 2024 2025 2026 2027 2028 2029 2030 2031 2032 2033 2034 2035 2036 2037 2038 2039
Mil
lio
ns
Annual Sources & Uses
6.7 ANNUAL CASHFLOWS (ATLAS DISTRICT)

River District Annual Cashflow
SOURCES 2018 2019 2020 2021 2022 2023 2024 2025 2026 2027 2028 2029 2030 2031 2032 2033 2034 2035 2036 2037 2038
Land Sales
Phase 1 3,880,187$ -$ -$ 3,880,187$ -$ -$ -$ -$ -$ -$ -$ -$ -$ -$ -$ -$ -$ -$ -$ -$ -$ -$
Land Sales Total 3,880,187$ -$ -$ 3,880,187$ -$ -$ -$ -$ -$ -$ -$ -$ -$ -$ -$ -$ -$ -$ -$ -$ -$ -$
City
General Fund -$ -$ -$ -$ -$ -$ -$ -$ -$ -$ -$ -$ -$ -$ -$ -$ -$ -$ -$ -$ -$ -$
22% Wastewater 1,720,373$ 1,720,373$ -$ -$ -$ -$ -$ -$ -$ -$ -$ -$ -$ -$ -$ -$ -$ -$ -$ -$ -$ -$
Ignite CDA
River District 3,700,000$ -$ 3,700,000$ -$ -$ -$ -$ -$ -$ -$ -$ -$ -$ -$ -$ -$ -$ -$ -$ -$ -$ -$
River District Tax Increment 4,085,577$ -$ -$ -$ 93,200$ 344,839$ 559,329$ 593,425$ 605,294$ 617,400$ 629,748$ 642,343$ -$ -$ -$ -$ -$ -$ -$ -$ -$ -$
Ignite CDA Total 7,785,577$ -$ 3,700,000$ -$ 93,200$ 344,839$ 559,329$ 593,425$ 605,294$ 617,400$ 629,748$ 642,343$ -$ -$ -$ -$ -$ -$ -$ -$ -$ -$
Total Source Per Year 13,386,138$ 1,720,373$ 3,700,000$ 3,880,187$ 93,200$ 344,839$ 559,329$ 593,425$ 605,294$ 617,400$ 629,748$ 642,343$ -$ -$ -$ -$ -$ -$ -$ -$ -$ -$
Cumulative Sources 1,720,373$ 5,420,373$ 9,300,561$ 9,393,760$ 9,738,599$ 10,297,928$ 10,891,353$ 11,496,647$ 12,114,047$ 12,743,795$ 13,386,138$ 13,386,138$ 13,386,138$ 13,386,138$ 13,386,138$ 13,386,138$ 13,386,138$ 13,386,138$ 13,386,138$ 13,386,138$ #######
USES 2018 2019 2020 2021 2022 2023 2024 2025 2026 2027 2028 2029 2030 2031 2032 2033 2034 2035 2036 2037 2038
22% Site Acquisition 1,720,373-$ 1,720,373-$ -$ -$ -$ -$ -$ -$ -$ -$ -$ -$ -$ -$ -$ -$ -$ -$ -$ -$ -$ -$
Land Development
58% Phase 1 4,203,216-$ -$ 2,080,800-$ 2,122,416-$ -$ -$ -$ -$ -$ -$ -$ -$ -$ -$ -$ -$ -$ -$ -$ -$ -$ -$
0% Phase 2 -$ -$ -$ -$ -$ -$ -$ -$ -$ -$ -$ -$ -$ -$ -$ -$ -$ -$ -$ -$ -$ -$
0% Phase 3 -$ -$ -$ -$ -$ -$ -$ -$ -$ -$ -$ -$ -$ -$ -$ -$ -$ -$ -$ -$ -$ -$
Reimbursement
Wastewater Repayment 2,018,165-$ -$ -$ -$ -$ 204,107-$ 559,329-$ 593,425-$ 47,966-$ 613,338-$ -$ -$ -$ -$ -$ -$ -$ -$ -$ -$ -$ -$
Public Space Improvements * 500,000-$ -$ -$ 500,000-$ -$ -$ -$ -$ -$ -$ -$ -$ -$ -$ -$ -$ -$ -$ -$ -$ -$ -$
Public Facilities
Cultural Center 750,000-$ -$ -$ -$ -$ -$ -$ 750,000-$ -$ -$ -$ -$ -$ -$ -$ -$ -$ -$ -$ -$ -$ -$
Educational Facilities 750,000-$ -$ -$ -$ -$ -$ 750,000-$ -$ -$ -$ -$ -$ -$ -$ -$ -$ -$ -$ -$ -$ -$ -$
Multi Purpose Athletic / Perf. Facilities 500,000-$ -$ -$ -$ -$ -$ -$ -$ -$ 500,000-$ -$ -$ -$ -$ -$ -$ -$ -$ -$ -$ -$ -$
Other Public Facilities ** 1,100,000-$ -$ -$ -$ 500,000-$ -$ -$ -$ -$ -$ 600,000-$ -$ -$ -$ -$ -$ -$ -$ -$ -$ -$ -$
Medical Facilities 750,000-$ -$ -$ -$ 750,000-$ -$ -$ -$ -$ -$ -$ -$ -$ -$ -$ -$ -$ -$ -$ -$ -$ -$
Total Use Per Year 12,291,755-$ 1,720,373-$ 2,080,800-$ 2,622,416-$ 1,250,000-$ 204,107-$ 1,309,329-$ 1,343,425-$ 47,966-$ 1,113,338-$ 600,000-$ -$
Cumulative Uses 1,720,373-$ 3,801,173-$ 6,423,589-$ 7,673,589-$ 7,877,697-$ 9,187,025-$ 10,530,451-$ 10,578,416-$ 11,691,755-$ 12,291,755-$ 12,291,755-$
* = could include public infrastrucutre (streets, water sewer), sidewalks, site remediation, site preparation, parking, parks, ped/bike trails, riverfront access, docks.
** = could include facilities such as museums, convention center, community centers, public saftety buildings.
NET PROCEEDS 2018 2019 2020 2021 2022 2023 2024 2025 2026 2027 2028 2029 2030 2031 2032 2033 2034 2035 2036 2037 2038
Cumulative Proceeds -$ 1,619,200$ 2,876,971$ 1,720,171$ 1,860,903$ 1,110,903$ 360,903$ 918,231$ 422,292$ 452,040$ 1,094,383$
Annual Proceeds 1,094,383$ -$ 1,619,200$ 1,257,771$ 1,156,800-$ 140,732$ 750,000-$ 750,000-$ 557,328$ 495,938-$ 29,748$ 642,343$
$0
$1
$1
$2
$2
$3
$3
$4
2018 2019 2020 2021 2022 2023 2024 2025 2026 2027 2028 2029 2030 2031 2032 2033 2034 2035 2036
Mil
lio
ns
Net Cashflows
-$10
-$8
-$6
-$4
-$2
$0
$2
$4
$6
$8
$10
2018 2019 2020 2021 2022 2023 2024 2025 2026 2027 2028 2029 2030 2031 2032 2033 2034 2035 2036
Mil
lio
ns
Annual Sources & Uses
6.8 ANNUAL CASHFLOWS (RIVER DISTRICT)

6.9 ANNUAL CASHFLOWS (LAKE DISTRICT)
Lake District Annual Cashflow
SOURCES 2018 2019 2020 2021 2022 2023 2024 2025 2026 2027 2028 2029 2030 2031 2032 2033 2034 2035 2036 2037 2038
Land Sales
Phase 1 194,335$ -$ -$ 194,335$ -$ -$ -$ -$ -$ -$ -$ -$ -$ -$ -$ -$ -$ -$ -$ -$ -$ -$
Phase 5 -$ -$ -$ -$ -$ -$ -$ -$ -$ -$ -$ -$ -$ -$ -$ -$ -$ -$ -$ -$ -$ -$
Land Sales Total 194,335$ -$ -$ 194,335$ -$ -$ -$ -$ -$ -$ -$ -$ -$ -$ -$ -$ -$ -$ -$ -$ -$ -$
City
General Fund -$ -$ -$ -$ -$ -$ -$ -$ -$ -$ -$ -$ -$ -$ -$ -$ -$ -$ -$ -$ -$ -$
17% Wastewater 1,312,581$ 1,312,581$ -$ -$ -$ -$ -$ -$ -$ -$ -$ -$ -$ -$ -$ -$ -$ -$ -$ -$ -$ -$
Ignite CDA
Shoreline Stabilization -$ -$ -$ -$ -$ -$ -$ -$ -$ -$ -$ -$ -$ -$ -$ -$ -$ -$ -$ -$ -$ -$
Lake District 3,700,000$ -$ 3,700,000$ -$ -$ -$ -$ -$ -$ -$ -$ -$ -$ -$ -$ -$ -$ -$ -$ -$ -$ -$
Total Source Per Year 5,206,916$ 1,312,581$ 3,700,000$ 194,335$ -$ -$ -$ -$ -$ -$ -$ -$ -$ -$ -$ -$ -$ -$ -$ -$ -$ -$
Cumulative Sources 1,312,581$ 5,012,581$ 5,206,916$ -$ -$ -$ -$ -$ -$ -$ -$ -$ -$ -$ -$ -$ -$ -$ -$ -$ -$
USES 2018 2019 2020 2021 2022 2023 2024 2025 2026 2027 2028 2029 2030 2031 2032 2033 2034 2035 2036 2037 2038
17% Site Acquisition 1,312,581-$ 1,312,581-$ -$ -$ -$ -$ -$ -$ -$ -$ -$ -$ -$ -$ -$ -$ -$ -$ -$ -$ -$ -$
Public Space
Phase 1 2,825,400-$ -$ 2,825,400-$ -$ -$ -$ -$ -$ -$ -$ -$ -$ -$ -$ -$ -$ -$ -$ -$ -$ -$ -$
Phase 2 -$ -$ -$ -$ -$ -$ -$ -$ -$ -$ -$ -$ -$ -$ -$ -$ -$ -$ -$ -$ -$ -$
Land Development
11% Phase 1 762,348-$ -$ 377,400-$ 384,948-$ -$ -$ -$ -$ -$ -$ -$ -$ -$ -$ -$ -$ -$ -$ -$ -$ -$ -$
0% Phase 2 -$ -$ -$ -$ -$ -$ -$ -$ -$ -$ -$ -$ -$ -$ -$ -$ -$ -$ -$ -$ -$ -$
0% Phase 3 -$ -$ -$ -$ -$ -$ -$ -$ -$ -$ -$ -$ -$ -$ -$ -$ -$ -$ -$ -$ -$ -$
0% Phase 4 -$ -$ -$ -$ -$ -$ -$ -$ -$ -$ -$ -$ -$ -$ -$ -$ -$ -$ -$ -$ -$ -$
Reimbursement
2% Wastewater Repayment 193,454-$ -$ -$ -$ 193,454-$ -$ -$ -$ -$ -$ -$ -$ -$ -$ -$ -$ -$ -$ -$ -$ -$ -$
Total Use Per Year 5,093,783-$ 1,312,581-$ 3,202,800-$ 384,948-$ 193,454-$ -$ -$ -$ -$ -$ -$ -$ -$ -$ -$ -$ -$ -$ -$ -$ -$
Cumulative Uses 1,312,581-$ 4,515,381-$ 4,900,329-$ 5,093,783-$ -$ -$ -$ -$ -$ -$ -$ -$ -$ -$ -$ -$ -$ -$ -$ -$
7,190,796-$
NET PROCEEDS 2018 2019 2020 2021 2022 2023 2024 2025 2026 2027 2028 2029 2030 2031 2032 2033 2034 2035 2036 2037 2038
Cumulative Proceeds -$ 497,200$ 306,587$ 113,133$ -$ -$ -$ -$ -$ -$ -$ -$ -$ -$ -$ -$ -$ -$ -$ -$ -$
Annual Proceeds 113,133$ -$ 497,200$ 190,613-$ 193,454-$ -$ -$ -$ -$ -$ -$ -$ -$ -$ -$ -$ -$ -$ -$ -$ -$ -$
$0
$0
$0
$0
$0
$1
$1
2018 2019 2020 2021 2022 2023 2024 2025 2026 2027 2028 2029 2030 2031 2032 2033 2034 2035 2036
Mil
lio
ns
Net Cashflows
-$10
-$8
-$6
-$4
-$2
$0
$2
$4
$6
$8
$10
2018 2019 2020 2021 2022 2023 2024 2025 2026 2027 2028 2029 2030 2031 2032 2033 2034 2035 2036
Mil
lio
ns
Annual Sources & Uses

Sources Total ProjectRiver District $3,700,000
Lake District $3,700,000
Atlas District $2,100,000
City Funding
General Fund $0
Wastewater Loan $7,850,000
Tax Increment
River District Phase 1 $4,085,577
Atlas District $39,687,557
Rivers Edge Property $32,418,328
Real Estate Sales
Triangle Parcel $1,154,361
Phase 1 $6,767,852
Phase 2 $1,919,167
Phase 3 $995,729
Phase 4 $4,602,257
Total Sources $108,980,829
Uses Total $ (2018$)
Land Acquistion -$7,850,000
Operating Costs (Atlas District) -$7,283,551
Intended Reimbursement
Wastewater Fund (Lake District) for land acquisition -$193,454
Wastewater Fund (River District) for land acquisition -$2,018,165
Wastewater Fund (Atlas District) for land acquisition -$6,700,886
Atlas District ROW Repay to City for land acquisition -$557,328
Debt
Atlas District Repay to River District -$2,213,490
Public Space Development
Public Space Improvement* -$2,500,000
Phase 1 -$2,825,400
Phase 2 $0
Phase 3 -$2,141,917
Infrastructure
Phase 1 -$7,190,796
Phase 2 -$2,005,683
Phase 3 -$1,883,432
Phase 4 -$4,865,022
Community Facilities
Cultural Center -$7,750,000
Educational Facility -$3,250,000
Multi Purpose Athletic / Perf. Facilities -$10,500,000
Other Public Facilities ** -$17,600,000
Medical Facility -$6,750,000
Total Uses -$96,079,124
Surplus/Gap $12,901,705
6.10 STATIC SOURCES AND USES