Embed Size (px)
Citation preview
Financial Exchange Rates and International CurrencyExposures
By Philip R. Lane and Jay C. Shambaugh ∗
In order to gain a better empirical understanding of the internationalfinancial implications of currency movements, we construct a databaseof international currency exposures for a large panel of countries over1990-2004. We show that trade-weighted exchange rate indices are in-sufficient to understand the financial impact of currency movements andthat our currency measures have high explanatory power for the valua-tion term in net foreign asset dynamics. Exchange rate valuation shocksare sizable, not quickly reversed and may entail substantial wealth re-distributions. Further, we show that many developing countries havesubstantially reduced their negative foreign currency positions over thelast decade.JEL: F31, F32, F36.Keywords: exchange rates, net foreign asset position
A recent wave of research has emphasized that exchange rate movements operatethrough a valuation channel, in addition to their traditional impact on real variablessuch as the trade balance. The valuation channel refers to the impact of capital gainsand losses on the international balance sheet. While such valuation effects have alwaysbeen present, their quantitative significance has grown in recent years in line with therapid growth in the scale of cross-border financial holdings (Lane and Gian Milesi-Ferretti2007a). Since currency movements are an important contributor to capital gains andlosses on foreign assets and liabilities, the goal of our project is to gain a better empiricalunderstanding of the international financial impact of shifts in exchange rates.1
This effect varies across countries based on the scale of the international balance sheet,the net value of the position and the currency composition of foreign assets and liabilities.For instance, authors such as Tille (2003), Gourinchas and Rey (2007a, 2007b) andLane and Milesi-Ferretti (2005, 2007b) have highlighted that the foreign liabilities of theUnited States are mostly denominated in dollars while there is a substantial non-dollarcomponent in its foreign assets. Accordingly, unanticipated dollar depreciation improvesthe net international investment position of the United States by increasing the dollar
∗ Lane: Institute for International Integration Studies, Department of Economics, Trinity College,Dublin 2, Ireland, and Center for Economic Policy Research, [email protected]. Shambaugh: EconomicsDepartment, Dartmouth College, 309 Rockefeller Hall, Hanover, NH 03755, and National Bureau ofEconomic Research, [email protected]. We thank the referees, Patrick Honohan, PhilippeMartin, Frank Warnock, Roberto Rigobon, Ted Truman, Pinar Yesin and the participants in conferencesand seminars including CGFS-BIS, CEPR, NBER IFM Lunch Group, Bank of England, DartmouthCollege, ECB, Federal Reserve Board, Georgetown, Pompeu Fabra, MIT, NBER IFM, UC Davis, UCSanta Cruz, Siena and Wisconsin. We are grateful to Philippe Mesny and Dennis Petre for the provisionof data from the BIS and Ted Truman for generously sharing his data on reserves. Agustın Benetrix,Vahagn Galstyan and Barbara Pels provided excellent research assistance. Lane’s work on this paperis supported by the HEA-PRTLI grant to the IIIS. This work began while Shambaugh was a visitingscholar at the IIIS and his work on this paper is supported by the Rockefeller Center at Dartmouth.
1Pierre-Olivier Gourinchas and Helene Rey (2007a, 2007b) and Cedric Tille (2003) have made studiesof the valuation channel for the United States, while Lane and Milesi-Ferretti (2001, 2005, 2007a, 2007b)have examined valuation effects for a large panel of countries in a variety of settings.
1
2 THE AMERICAN ECONOMIC REVIEW MARCH 2009
value of its foreign assets relative to its foreign liabilities. In contrast, many emergingmarkets have historically issued significant amounts of foreign-currency debt – for thesecountries, an extensive literature has highlighted that currency depreciation has inducedadverse balance sheet effects.2
Remarkably little is known about the currency composition of the foreign assets and lia-bilities of most countries: a major contribution of our project is to address this data deficitby building an empirical profile of the international currency exposures of a large num-ber of countries. We then exploit the estimated currency positions to create financially-weighted exchange rate indices, while the interaction of the financial exchange rate indicesand the gross scale of the international balance sheet allows us to capture the valuationimpact of currency movements on net foreign asset positions. In addition, the currencyexposure data may be useful in evaluating the new wave of global macroeconomic modelsthat endogenize the composition of international portfolios and analyzing the ‘wealth’channel of monetary policy in open economies. Accordingly, the analysis of currency ex-posure data may provide new insights on the interaction between financial globalizationand macroeconomic behavior.
Our analysis yields three important findings. First, we compare asset- and liability-weighted exchange rate indices to the conventional trade-weighted exchange rate index.While we find that there are on average high correlations across the indices, we alsohighlight that these indices can diverge in important ways. This is especially true for theliability-weighted index, in view of the importance of domestic-currency liabilities whichare extensive for advanced economies and growing rapidly for developing and emergingeconomies. Second, we combine the asset- and liability-weighted indices to create a netfinancial index that attaches a positive weight to currencies in which a country holds along position and a negative weight to currencies in which it is short. Accordingly, thenet financial index captures the directional exposure of a country’s international balancesheet to exchange rate movements. We find that there is tremendous heterogeneity inthe comovement between the trade-weighted index and the net financial index. While 20percent of countries have a strong positive correlation (above 0.7) most countries (63 per-cent) show a negative correlation: for these countries, depreciation of the trade-weightedindex may boost net exports but is associated with a decline in the net financial indexthat damages the external balance sheet through a negative valuation effect. Moreover,we quantify the scale of these currency-induced valuation shocks and find that theseshocks can be substantial, are not quickly reversed and explain a significant fraction ofaggregate valuation shocks, especially for developing countries.
Third, we construct a summary measure of aggregate foreign currency exposure thatcaptures the sensitivity of the external balance sheet to a uniform exchange rate movementagainst all foreign currencies. We find that the majority of countries have a net negativeexposure, where they have more foreign currency liabilities than foreign currency assets.These net negative positions are quite large in many cases and leave countries exposedto substantial valuation losses in the event of a uniform depreciation. However, we alsofind that, over the last decade, many countries have shifted their exposure to foreigncurrencies in a positive direction, with a shift to equity-type liabilities and large increasesin reserves playing a more important role than any change in the currency denominationof external debt.
Our analysis is partial equilibrium in nature, since we effectively treat exchange ratemovements as exogenous. That said, the empirical insights in the paper have impli-cations for the design of dynamic stochastic general equilibrium models that featureendogenously-determined international portfolios and seek to incorporate the wealth ef-
2See the contributions to Barry Eichengreen and Ricardo Hausmann (2005) and Michael B. Devereux,Lane and Juanyi Xu (2006).

VOL. 99 NO. 1 EXCHANGE RATES AND CURRENCY EXPOSURES 3
fects of exchange rate changes that feed back into the economy. Understanding why theexchange rate changes does not affect the positive aspects of our work - the examinationof the wealth effects - but it does have implications in terms of the optimal compositionof international portfolios.3
Our work is related to several previous empirical contributions on international cur-rency exposures. Along one strand, Eichengreen, Hausmann and Ugo Panizza (2003)compiled data on the currency composition of the external debts of developing countries,while Morris Goldstein and Philip Turner (2004) extend their analysis by constructingestimates of net foreign-currency debt assets. However, these contributions did not takeinto account the portfolio equity and FDI components of the international balance sheet.Tille (2003) calculates the foreign currency composition of the international balance sheetof the United States, while Lane and Milesi-Ferretti (2007b) calculate dollar exposuresfor China, Japan and a set of European countries. Relative to these contributions, weprovide greatly-expanded coverage for a large number of countries and estimate the fullcurrency composition of the international balance sheet.
While our work represents a dramatic improvement relative to the status quo, it isimportant to be clear about its limitations. In particular, we have made many assump-tions in constructing our estimated international currency exposures. Moreover, in somecases, we infer values for missing data by modelling the relation between known countrycharacteristics and international financial holdings. Obviously, estimated data will notbe perfectly accurate, nor will every assumption made fit every country perfectly. Wemake every effort to cross-check our data where possible and we detail and defend thechoices made in the appendix describing our data methods.
After describing the conceptual basis of the valuation channel in the next section,Section 3 provides a brief outline of the methods employed to construct the currencyposition data; the online appendix provides a detailed description of the methods bywhich we construct our data set on currency exposures and a discussion of our keyassumptions, the empirical model that generates values where data are missing and therobustness of these estimates. We turn in Section 4 to the construction of financialexchange rate indices. Section 5 reports the main results of our empirical analysis. Someconclusions are offered in Section 6.
I. Conceptual Framework
Traditionally, the main focus of attention in analyzing the role of the exchange rate inthe international adjustment process has been its impact on variables such as the tradebalance. However, in recent years, there has been a resurgence in interest in the balancesheet impact of currency movements. While this valuation channel was recognized in theportfolio balance literature that developed during the 1970s, the increase in the scale ofgross holding of foreign assets and liabilities means that its quantitative importance hasgrown.
At a general level, the role of the valuation channel in the dynamics of the externalposition can be expressed using the following accounting framework. The change in thenet foreign asset position between periods t− 1 and t can be written as
(1) NFAt −NFAt−1 = CAt + V ALt
3There has been a flurry of recent theoretical work that seeks to calculate optimal internationalportfolios within the framework of dynamic stochastic general equilibrium macroeconomic models (in-cluding Charles Engel and Akito Matsumoto 2005, Devereux and Makoto Saito 2006, Devereux and AlanSutherland 2006, Tille and Eric van Wincoop 2007).
4 THE AMERICAN ECONOMIC REVIEW MARCH 2009
where CAt is the current account surplus and V ALt is net capital gain on the exist-ing holdings of foreign assets and liabilities. Although the relation between currencymovements and the current account has been much studied, there is less empirical ev-idence on the role of the exchange rate in influencing net capital gains. To make suchcalculations, it is necessary to establish the currency composition of both sides of theinternational balance sheet. While the literature cited above has emphasized the splitbetween domestic- and foreign-currency in the international balance sheet, very little isknown in terms of the composition of the foreign-currency element across the differentcurrencies. In particular, Tille (2003) and Lane and Milesi-Ferretti (2007b) have em-phasized that the ‘finance’ currency weights for the United States are quite different tothe ‘trade’ currency weights, with European currencies much more heavily representedin the former. Accordingly, we seek to gain a more comprehensive understanding of thedistribution of currency exposures for a large set of countries.
To create these currency composition weights, we combine a number of data sets, aug-mented by model-generated imputed data. The details of these procedures are reportedbelow. Before we address the details, we consider two broad concerns regarding whethercurrency weights based on the currency denomination of foreign assets and liabilitiesaccurately represent the currency risk exposure a country faces.
First, local-currency asset prices or the interest/dividend payments on these assetscould be negatively correlated with the exchange rate, such that investor-currency returnsmight be insulated from currency movements. To see this, we can also write the changein the net foreign asset position as
(2) NFAt −NFAt−1 = TBt + FCt = TBt +NETINV INCt + V ALMVt + V ALXR
t
where TBt is the trade balance and FCt is the aggregate net financial return on the ex-ternal investment position (since, ignoring transfers and cross-border labor income, thecurrent account is just the sum of the trade balance and net investment income). In turn,the FCt term is the sum of net investment income (NETINV INCt), the component ofnet capital gains that relates to shifts in local-currency asset prices (V ALMV
t ) and thecomponent of net capital gains that relates to currency movements (V ALXR
t ).4 Accord-ingly, an increase in V ALXR
t may have no impact on the overall net financial return, if itis offset by a decline in local-currency asset prices or a decline in net investment income.Indeed, if all foreign assets were single-period foreign-currency bonds and all foreign lia-bilities were single-period domestic-currency bonds, uncovered interest rate parity wouldmean that all predictable movements in exchange rates would be exactly offset by shiftsin net investment income. However, the general failure of uncovered interest parity, plusthe fact that most countries have few domestic-currency foreign debt liabilities, meansthat this polar case is not empirically relevant.
More generally, there is a wealth of evidence suggesting that currency movementsdo matter for investor-currency returns (Lane and Milesi-Ferretti 2005). For instance,the failure of uncovered interest parity and success of financial trades such as the carrytrade shows that returns do not counter exchange rate movements in bond markets butinstead often reinforce them (Craig Burnside et al 2006). In relation to portfolio eq-uity and FDI positions, a depreciation of the foreign currency could be accompanied byan improvement in export performance, boosting the local-currency returns on holdings
4The measurement of the valuation terms is subject to measurement error, since stock positions andflows are typically measured from different sources. For instance, see Lane and Milesi-Ferretti (2009) foran analysis of measurement problems in the US data. Since V ALXR
t is calculated directly and V ALMVt
is a residual, these errors or revisions will be included in V ALMVt
VOL. 99 NO. 1 EXCHANGE RATES AND CURRENCY EXPOSURES 5
in export-orientated firms. However, in the other direction, a depreciation is also fre-quently accompanied by a slowing of the economy, such that local-currency returns ondomestically-orientated assets are negatively affected. These conflicting forces may resultin a weak average correlation between currency movements and local-currency returnson portfolio equity and FDI. In related fashion, Anna Pavlova and Roberto Rigobon(2007) show that the co-movement between asset prices and exchange rates depends onthe relative importance of productivity shocks versus demand shocks: in their model,a positive productivity shock boosts the domestic stock market and induces exchangerate depreciation, while a positive demand shock also boosts equity returns but leads toexchange rate appreciation.
Furthermore, bank loans and deposits, reserves, and other assets or liabilities that arenot marked to market do not have price valuation effects, only currency-based valuationeffects, so there is no offset for these asset classes. In summary, while one would expectexchange rate returns and local-currency asset returns to cancel one another out in someways, in practice there is considerable ‘pass through’ from exchange rate movements toinvestor-currency returns. While there is some evidence that exchange rate and equityreturns negatively covary at high frequencies for industrial countries (Harald Hau and Rey2006), there is no evidence of this correlation in annual data such that a depreciation of theforeign currency reduces the home currency value of an equity investment in the foreigncountry (Lane and Milesi-Ferretti 2005). We return to these issues in the analysis section,where we find that V ALXR is positively correlated with V AL and has a significant impacton the direction of V AL as well as on the aggregate net financial return on the externalinvestment position.
Second, if domestic agents hedge all currency exposure by buying insurance from for-eign agents, they will receive offsetting gains on their derivative positions against anyspot exchange rate losses. Lack of data means that the extent of cross-border currencyhedging is difficult to assess; while the volume of currency-related derivative trade is verylarge, much of this is between domestic residents, which does not alter the aggregate netexposure of the economy.5 6 Hau and Rey (2006) estimate that only 10 percent of foreignequity positions are hedged, often due to institutional restrictions on the use of deriva-tive contracts. Furthermore, as noted above, if the counterparty in derivative contractis another domestic resident, the currency risk still resides within the same country. Inaddition, any hedging that comes through balancing of assets and liability exposure (e.g.simultaneously holding dollar assets and liabilities) is captured in our weights: it is onlythe more complex derivative contracts that will be missed. Finally, it is not clear thatan optimizing agent would hedge out all currency risk, depending on the correlation ofparticular currencies with the entire portfolio of assets and liabilities and consumptiongrowth in the investor’s country (see John Y. Campbell et al 2006 for a discussion).
II. Data
We follow a two-step procedure in estimating currency positions. First, we determinethe currency composition of assets and liabilities within individual categories, using avariety of methods and data sources. Second, we weight the categories by their sharesin the international balance sheet in order to construct aggregate currency exposures.
5However, seeChris Becker and Daniel Fabbro (2006) for an extensive study of hedging in Australiathat shows that Australia is a net purchaser of currency insurance from foreign investors.
6In some cases, cross-border hedging can exacerbate overall exposures. In particular, suppose thathedging is mostly carried out by holders of foreign-currency liabilities. For countries such as the UnitedStates that are net long in foreign currencies, this form of hedging raises the aggregate net currencyposition.
6 THE AMERICAN ECONOMIC REVIEW MARCH 2009
Since there are considerable data gaps for some countries, the construction of currencycomposition weights is not entirely mechanical – inference procedures are required tointerpolate some of the missing data. We then rely on recent advances in the modellingof the geographical distribution of international financial portfolios to generate predictionsfor asset holdings that allow us to fill in missing observations (Lane and Milesi-Ferretti2008).
Our sample includes 117 countries and we generate estimated currency positions forthe years 1990 to 2004. In constructing financially-weighted exchange rate indices, weeliminate hyperinflation episodes due to their status as outliers, and start a country’sdata after the conclusion of a hyperinflation (countries with hyperinflations late in thesample are dropped). Many results examine the change in positions from 1994 to 2004.These results use a smaller 102 country sample that has full data from 1994 through2004.7 The online appendix provides a detailed description of the methods employed toconstruct estimates of the currency composition of international balance sheets.
A. Foreign Assets
The asset side of a country’s international balance sheet is divided into five categories:portfolio equity, direct investment, portfolio debt, other debt (generally bank-related),and reserves.
Since 2001, the International Monetary Fund’s (IMF) Coordinated Portfolio InvestmentSurvey (CPIS) data set annually provides the geographical location of portfolio equityasset holdings for 68 reporter countries across 220 host countries.8 In order to provideestimates for country pairs that are missing from the data set, we employ a gravity-based model of bilateral equity holdings to construct estimated positions in these cases.9We make the key assumption that equity issued by country j carries exposure to thecurrency of country j. While there is no automatic relation between equity returns andcurrency movements, it is reasonable to assume that currency-related equity exposuresare correlated with the geographical pattern in portfolio equity holdings. (See also thediscussion in section 2 regarding the lack of correlation between returns and exchangerate changes). Accordingly, we generate the currency composition of equity holdings bycombining the actual and synthetic data on the geography of equity positions togetherwith the currency arrangements for each destination country. For non-reporter countries,we use synthetic data for their weights. As it turns out, these do not play a major rolein our overall index creation, since countries that are not CPIS reporters typically holdfairly small equity portfolios.10
7When a gap in years is present, we average across adjacent years to fill in the missing weights.8We also make use of the 1997 CPIS trial survey which included a smaller set of reporting countries
(27 countries). Since the geographical pattern of portfolio investment is highly persistent, we alsouse the 1997 weights for the years 1990 through 1996. However, we note that this risks overweightingcurrencies in the earlier years that subsequently appreciated, to the extent that portfolio rebalancingacross currencies did not take place.
9See Philippe Martin and Rey (2004) and Lane and Milesi-Ferretti (2008) for theoretical and empiricalsupport for such a procedure. Following Lane and Milesi-Ferretti (2008), we eliminate holdings listedin offshore financial centers. Countries report very large holdings in these offshore centers (such asLuxembourg) but these holdings really represent claims on assets in other final destinations. By excludingthese holdings, we implicitly assume that the holdings in offshore centers eventually wind up in the samepattern as those that go directly to other countries. After eliminating offshore centers, we are left with 50reporting countries and 180 hosts. We follow Lane and Milesi-Ferretti (2008) and primarily use the IMFBackground Paper, “Offshore Financial Centers” (2000), as our guide to labelling countries as offshorecenters.
10In fact, the External Wealth of Nations data compiled by Lane and Milesi-Ferretti (2007a) show thathalf of the non-reporters have no equity assets and non-reporters only have an average of 2 to 3 percent
VOL. 99 NO. 1 EXCHANGE RATES AND CURRENCY EXPOSURES 7
For direct investment, we use the UNCTAD database on stocks of bilateral directinvestment assets and liabilities. These data give us both outward and inward stocks ofdirect investment for 73 reporting countries vis-a-vis up to 196 partner countries over1970-2004. Since we have both inward and outward data, we can infer the bilateral directinvestment assets of many non-reporting countries from the bilateral direct investmentliabilities of the reporters. Since most major destinations are reporters, this process givesus a reasonable gauge of the currency distribution of the non-reporter countries. Wefollow our process for portfolio equity and assume that direct investment in country jcarries exposure to the currency of the host country.11
As in the case of portfolio equity, the CPIS dataset provides information on the geo-graphical patterns in bilateral portfolio bond holdings. We again employ a gravity modelto fill out the geographical information for missing country pairs (where we have thesame number of countries and use the same data as in the equity regressions). However,since many countries issue foreign-currency debt, estimating the currency composition offoreign debt assets requires additional steps. We begin with the international securitiesdataset maintained by the BIS.12 This dataset contains information on the currency de-nomination of international bonds for 113 issuing countries.13 For some countries (suchas the United States), international bonds are issued mainly in domestic currency. Forother countries, international bonds are typically denominated in foreign currency, withthe relative importance of the major international financial currencies (dollar, euro, yen,Swiss franc, Sterling) varying across countries and over time.
Investors from countries whose currencies are popular choices for foreign-currency bondissues are apt to disproportionately hold their own currencies when purchasing interna-tional debt securities issued by other countries (a tendency seen in the data used fromthe US Treasury, Bank of Japan and the European Central Bank). In order to allowfor this currency bias, we follow Lane and Milesi-Ferretti (2007c) in exploiting the dataprovided by the United States Treasury, the European Central Bank and the Bank ofJapan regarding the currency composition of the foreign assets of these regions to allocatea higher portion of major currency denominated debt to investors from each currency’scountry.
In relation to other non-portfolio debt assets, we obtained BIS data on the breakdownbetween ‘domestic currency’ and ‘foreign currency’ components for the bilateral foreignassets and liabilities of the banks residents in twenty reporter countries vis-a -vis a largenumber of counterpart countries (on a locational basis).14The reporters are the dominantbanking centers and, despite the small number, capture the bulk of world bank holdings.
Finally, the IMF tracks the currency composition of reserves for its member coun-
of their foreign assets in equity. For this reason, in an overall index, our derived currency compositionof their equity assets plays a small role.
11The direct investment stocks are valued at book value or historical cost. While it may be preferable tomeasure direct investment stocks at market value, this limitation has only limited relevance in establishingthe weights for an FDI exchange rate index, since the geographical composition of the stock is the keyfactor.
12The construction of this dataset is described in BIS (2003).13Where the BIS data set lacks data on the currency of issue for a country, we rely on the World Bank’s
GFD database of the currency composition of external debt. This is an imperfect measure because itincludes non portfolio long term debt (such as bank loans), but the countries which are missing BIS datamake up a small fraction of internationally held debt assets. Our dataset focuses on international bondissues - while foreign investors have become active in the domestic bonds markets of developing countriesin very recent years, the international bond issues are more important for the vast bulk of our sampleperiod.
14Although the foreign assets and liabilities of the banking sector include portfolio items, the currencycomposition of the aggregate should be a good proxy for the predominant non-portfolio debt component.See also BIS (2003, 2006).
8 THE AMERICAN ECONOMIC REVIEW MARCH 2009
tries, in its COFER (Currency Composition of Official Foreign Exchange Reserves )database. However, for confidentiality reasons, the only reported COFER data are formajor aggregates (world, industrial country group, developing country group). However,the country-level data have been used on a few occasions in research by IMF-affiliatedeconomists to analyze the determinants of cross-country and time series variation in thecurrency composition of reserves. We exploit the results from these papers, especiallyEichengreen and Donald Mathieson (2000), to model currency composition. We takethe coefficients from these regressions and use them to predict the share for each of themajor currencies (the dollar, the DM (euro after 1999), the Swiss Franc, the Yen, andthe Pound). Once we have predicted values for each currency, we impose an adding upconstraint and re-normalize the results, so that each country has totals that add up to100 percent.
We merge this generated data with actual data on reserves for 2000-2004 for twentycountries from Edwin M. Truman and Anna Wong (2006) and Wong (2007). For anycountry for which we have actual data, we use actual data for those years. Before 2000,we use data from central banks where available (US, Canada, UK) and blend our modelgenerated data with 2000 actual data. We can further confirm that our predictionsare sensible by drawing on two additional sources of information. First, some countriesoccasionally report their reserves shares in announcements or media interviews. Relyingon news reports of these currency shares, we compare predicted with actual (or at leastreported, since there is no verification) reserves shares. Our results perform quite wellon this measure. Second, Ewe-Ghee Lim (2006) studies the changing international roleof the euro and dollar and gives some regional information on the currency compositionof reserves.
B. Foreign Liabilities
The liability side of the international balance sheet is divided into four groups: portfolioequity, direct investment, portfolio debt, and other debt. In many cases, the sourceinformation for portfolio and other debt are combined, so we do not try to disaggregatethem. Consistent with our treatment on the assets side, portfolio equity and directinvestment liabilities are assumed to carry exposure to the domestic currency, such thatno foreign-currency exposure is generated by equity-type liabilities.
All debt liabilities are processed in tandem due to data restrictions. We have data fromthe BIS banking statistics database on banking liabilities for 20 countries (and the impliedliabilities to the 20 reporters based on reporters’ assets for the remaining countries). Inaddition, we know the currency composition of portfolio debt liabilities, based on issuancedata from the BIS international securities database for 113 reporting countries.
However, neither database includes information on the currency composition of debtowed to official creditors (bilateral or multilateral official debt), which is a prominentsource of debt for many developing countries. The World Bank’s Global DevelopmentFinance database shows that debt to official creditors ranges from 35 percent to 53 percentof total developing country debt over the time period 1990-2004. The World Bank doesreport the currency composition of aggregate external debt which merges bank, bondand official debt data. Due to the importance of the official debt composition, we usethis World Bank source for all countries where it is available (it is not available for anyindustrial country and is missing for a small number of developing countries).15 For theremaining countries, we create bond-based weights using the currency composition fromBIS issuance data and weights for other debt from the BIS banking data.
15For the handful of developing countries that show domestic currency international issuance in theBIS database, we adjust the World Bank currency shares to include the domestic currency issuances.
VOL. 99 NO. 1 EXCHANGE RATES AND CURRENCY EXPOSURES 9
III. Index Creation
The dataset allows us to build a number of ‘financially-weighted’ effective exchangerate indices for a large number of countries. While the same foreign currencies tend to beinvolved in most weights, the crucial result from our work is to identify for each countrythe relative shares of domestic and foreign currencies in foreign assets and liabilitiesand the relative importance of different international currencies in the foreign currencycomponent of the international balance sheet.
A. Asset, Liability, and Trade Indices
Once we have the currency composition data for each asset class within assets andliabilities, we can combine these asset classes to create aggregate weights, using datafrom the ‘External Wealth of Nations’ database constructed by Lane and Milesi-Ferretti(2007a). This dataset reports the levels of foreign assets and liabilities for 145 countriesover 1970-2004, together with the composition of each side of the international balancesheet between portfolio equity, direct investment, reserves and debt. This is importantsince two countries could have similar currency exposures within individual asset classesbut different aggregate exposures, due to differences in the relative importance of differentinvestment categories across the two countries. Moreover, the structure of internationalbalance sheets has been shifting over time: even if currency exposures were stable forindividual asset classes, aggregate exposures could change due to this composition effect.This gives us the currency composition weights for individual asset classes as well as a setof aggregate weights that would take into account differences in the relative importanceof the different investment categories across countries and over time. We calculate anaggregate finance-weighted index as well as asset- and liability-weighted indices.
Accordingly, the weights are given by the formulae
(3) ωAijt =
k=N∑k=1
λAkit ∗ ωAk
ijt ; ωLijt =
k=N∑k=1
λLkit ∗ ωLk
ijt
where ωAijt, ω
Lijt are the weights for currency j in period t in country i’s assets- and
liabilities- exchange rate indices, λAkit , λ
Lkit are the relative importance of category k
(portfolio equity, FDI, debt, reserves) in country i’s assets and liabilities in period tand ωAk
ijt , ωLkijt are the weights for currency j in period t in category k for country i’s
assets and liabilities respectively. Accordingly, the aggregate weights are a function ofthe weights for currency j in period t for a particular k asset-class of country i’s assetsor liabilities, and the weights across the k asset classes (represented by λk
it).Our indices use these weights to average the percentage changes of bilateral exchange
rates. Since the currency weights are based on end-of-year data, we use the period tvalues to weight the changes in bilateral exchange rates during period t+ 1. Accordingly,the index formulae are given by
(4) IAit+1 = IA
it ∗(
1 +∑
ωAijt ∗ %∆Eijt+1
); IL
it+1 = ILit ∗
(1 +
∑ωL
ijt ∗ %∆Eijt+1
)where IA
it+1 and IAit+1 are the asset- and liability-weighted indices for country i, ωA
ijt andωL
ijt are the asset and liability weights attached to currency j in period t and %∆Eijt+1
10 THE AMERICAN ECONOMIC REVIEW MARCH 2009
is the percentage change in the end-of-period nominal exchange between i and j duringperiod t+ 1. Trade indices are made in the same manner using weights that add exportsand imports together. Since our currency position data runs from 1990 to 2004, we canuse these weights to create exchange rate indices for 1991 to 2005.
Our index is an approximation of a geometric average that focuses on the percentagechange versus each currency in a given time period as the relevant information, not thelevel.16 It will move similarly to a portfolio that uses these weights to define shares ofthe portfolio.17 We define the exchange rate in the standard manner, the home priceof foreign currency, such that a negative movement represents an appreciation of thehome currency. This assumption means that, if a trading partner experiences a majordepreciation due to a hyperinflation or some other crisis, that partner’s exchange rate inthe index will decrease rapidly towards zero – not explode towards infinity. In this way, ifthe only change in the various bilateral exchange rates were a collapse of a rate towardszero, our index will simply drop by the amount of the weight. This is the equivalent ofsome portion of a portfolio becoming worthless and thus fits our needs well.18
B. Net Indices and Valuation Effects
It is also useful to define aggregate net financial weights
(5) ωFijt = ωA
ijtsAit − ωL
ijtsLit
where sAit = Ait/(Ait + Lit) and sL
it = Lit/(Ait + Lit) are the shares of foreign assetsand foreign liabilities in total cross-border holdings. These weights indicate the directionof the valuation impact of a movement in currency j. If the net foreign asset positionis zero, this reduces to simply subtracting the liability weights from the asset weights.Conceptually, an index crafted with these weights will capture the directional effect of aset of bilateral exchange rate changes on the net external position.
We define the aggregate net financial index by19
(6) IFit+1 = IF
it ∗(1 + %∆IA
it+1 ∗ sAit − %∆IL
it+1 ∗ sLit
)(The index could equivalently be written in the same form as the asset and liability in-
dices using the net financial weights defined in equation (5).) This net financial exchangerate index is conceptually different from a trade-weighted index since it has currencies en-tering both positively and negatively. More importantly, the weights do not need to addup to one. In the extreme, if net positions and currency compositions are balanced, there
16Note that the log of a geometric average is the weight times log(E) for each currency and thus theapproximation of the percentage change of the geometric average would simply be the sum of the changein log(E), or roughly the percentage change. See Lane and Shambaugh (2007) for more details on theindex method.
17A pure geometric index will not move like a portfolio and thus could not be tracked by a portfolioassembled using its weights.
18In many settings, when calculating an index and changing the weights over time, one must worrythat a change in the weight with no change in the value of the item in question will lead to a changein the index. In our case, if the exchange rate for all countries were constant, and the weights change,our index is unchanged, since the index combines percentage changes in the exchange rate. Accordingly,more complex chain weighting is not necessary; we can simply employ new weights whenever they areavailable.
19The index could equivalently be written in the same form as the asset and liability indices using thenet financial weights.
VOL. 99 NO. 1 EXCHANGE RATES AND CURRENCY EXPOSURES 11
is no movement in the index regardless of bilateral exchange rate movements. Thus,movements in this index can tell us about the impact of currency movements on thebalance sheet, but it is not a typical exchange rate index.
In turn, this allows us to write
(7) V ALXRit+1 = %∆IF
it+1 ∗ IFIit
where the superscript XR indicates currency-induced valuation changes and the grossscale of the international balance sheet is measured by IFIit = Ait + Lit. Equation(7) highlights that the magnitude of currency-related valuation effects depends on twofactors: (i) the movement in the financially-weighted exchange rate index; and (ii) thegross scale of the international balance sheet.
IV. Analysis
The weights and indices described open a variety of avenues for analysis that werepreviously unavailable due to a lack of data. Our analysis proceeds along three lines.First, we examine the various indices described in Section 4. Next, we look at the roleplayed by financial-weighted exchange rate indices in driving the valuation component ofthe dynamics of net foreign asset positions. Finally, we explore the variation in aggregateforeign currency exposures across countries and over time.
A. Case Studies
It is useful to begin with some case studies. We show a selection of four countriesin Figures 1a-1d. The most striking feature of Figure 1a is that the liability index forthe United States is essentially flat, since (as is well established) the foreign-currencycomponent in its external liabilities is very low. While the asset- and trade-weightedindices are qualitatively similar, Figure 1a also highlights that the asset-weighted indexhas depreciated more sharply than the trade-weighted index since 2001. This is consistentwith the findings of Tille (2003) and others: the asset index gives a higher weight toEuropean currencies (against which the dollar has fallen sharply), while the trade indexplaces a substantial weighting on Asian countries that track the dollar, are important astrading partners but are not major destinations for US outward investment.
We show the Brazilian indices in Figure 1b as representative of the typical emergingmarket economy. While the asset, liability and trade indices show a high degree ofcomovement, the liability index is substantially less volatile (especially in the latter partof the sample period), which reflects the importance of the domestic-currency componentin total liabilities.
China and Benin present interesting contrasts in Figures 1c and 1d of countries thatfollowed pegged exchange rate regimes during the sample period. The Chinese peg tothe dollar stabilized its financially-weighted indices but its trade index was quite volatile,since industrial countries that float against the dollar are important trading partners forChina. In contrast, the trade index for Benin is much less volatile than its financialindices. As a member of the CFA zone that pegged to the French Franc during the 1990s(with a one-off step devaluation in 1994) and subsequently to the euro, Benin’s exchangerate has been relatively stable against its major European and regional trading partners.In contrast, Benin has significant dollar financial liabilities and fluctuations in the euro-dollar rate map into volatile financial indices for Benin. Moreover, the sharp fluctuationsin the franc/euro against the dollar has meant that Benin’s trade and financial indiceshave moved in opposite directions for much of the post-1994 period.

12 THE AMERICAN ECONOMIC REVIEW MARCH 2009
In summary, the message from Figures 1a-1d is that there is a diverse range of patternsin the behavior of financially-weighted exchange rates, with the trade index not generallyinformative about the financial impact of currency movements.
B. Comparison of Exchange Rate Indices
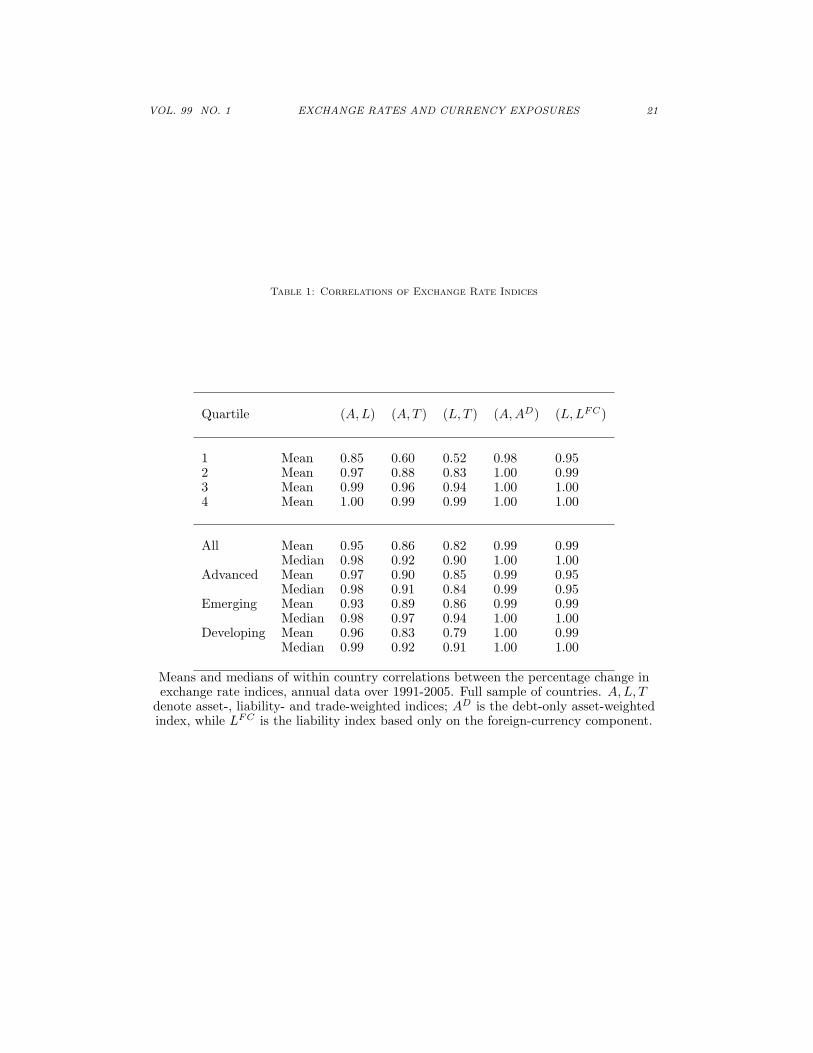
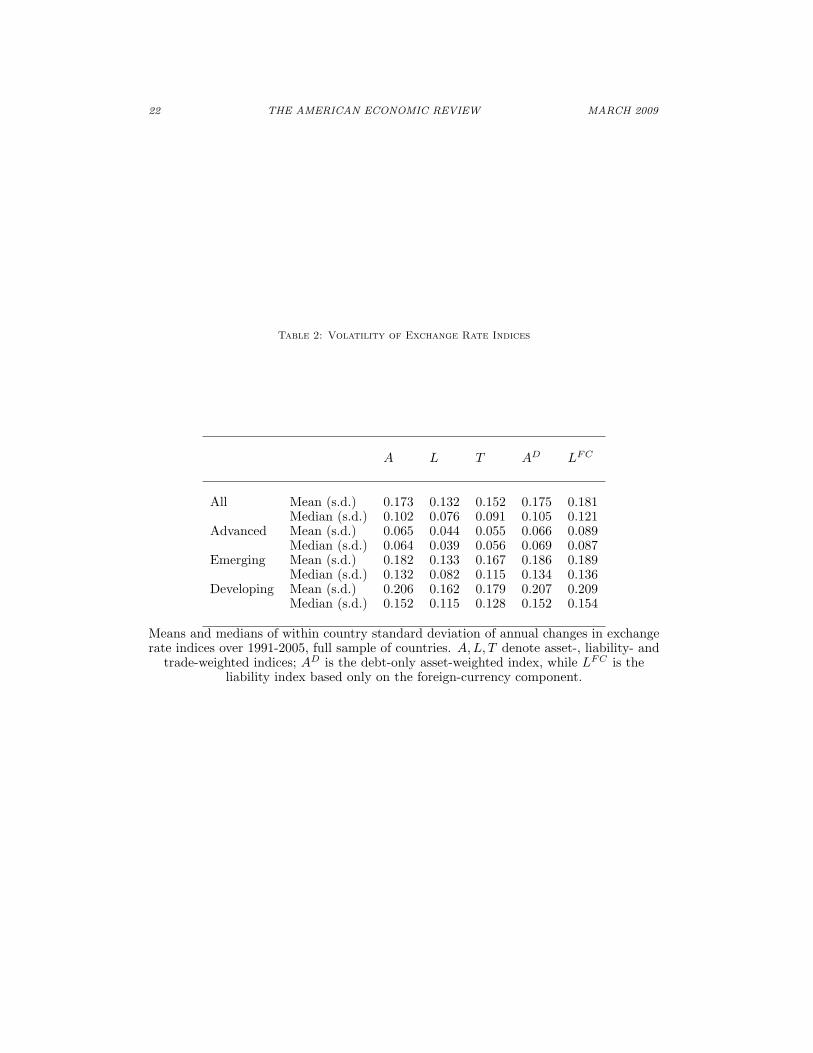
We turn to a quantitative comparison of exchange rate indices in Tables 1 and 2. Tables1 reports the the mean and median within-country correlation of the annual percentagechanges in different indices as well as the mean within quartiles, while Table 2 reports thesecond moments. 20 The asset- and liability-indices show a high pairwise correlation. Inaddition, both are individually correlated with the trade index, although the correlationis a bit weaker for the liability index (largely reflecting the importance of domestic-currency liabilities). In relation to the correlations between the financial indices and thetrade index, the mean and median correlations are high but there are many cases inwhich the correlations are much lower. In particular, the mean correlation between theasset-weighted and trade-weighted indices is only 0.60 for the first quartile of countries,while the correlation between the liability-weighted and the trade-weighted indices is only0.52 for the first quartile.
Table 2 shows that the liability index is much more stable than the asset index, es-pecially for industrial countries. This again reflects the greater share of the domesticcurrency in liability indices. The leader in this regard is the United States, where over90 percent of liabilities are in dollars and as a result the liability index has a volatilityof less than 1 percent a year. Since the liability index is so much more stable than theasset index, even if the two move directionally together and are highly correlated, theamplitude of the asset index is greater. In turn, this implies that currency movementsmay generate valuation effects, even for countries with zero net foreign asset positions.
We also examine a number of alternatives to the main indices. First, we examine anasset index that looks only at the debt portion of the balance sheet, and it behaves verysimilarly to the general asset index. We also examine only the foreign currency portion ofthe external portfolios. While a large domestic currency share of liabilities may stabilizethat index, it is also interesting to see to what extent excluding those liabilities changesthe index. We see from columns (5) of Table 1 that the impact is negligible. The directionof the index is not altered by including the domestic-currency portions of the balance sheetin the weights. Likewise, Table 2 shows the exclusion of domestic-currency componentsleads to more volatile indices, especially for the liabilities of industrial countries.
C. The Net Financial Index
The net financial index captures the directional sensitivity of the external balancesheet to currency movements. While a depreciation of the domestic currency againstsome currency j should over time improve net exports by raising exports and reducingimports, the valuation impact depends on whether the country is long or short in currencyj and currency j’s relative importance in the aggregate external portfolio.21 Aggregatingacross all bilateral currency movements, a country will enjoy a valuation gain if there is
20This table, and many others, breaks countries into advanced, emerging, and developing groups.The advanced countries are the group typically known as industrialized countries (ifs code less than 199except Turkey). The emerging sample is the group of countries in the Morgan Stanley emerging marketindex with some additional eastern European countries. The developing sample is all other countries.
21Since a depreciation boosts net exports by both increasing exports and reducing imports, it is ap-propriate that the trade-weighted index sums across exports and imports. However, the financial impactof a depreciation is ambiguous since the boost to the domestic-currency value of foreign-currency assetsmay be offset by the increase in the domestic-currency value of foreign-currency liabilities. Accordingly,
VOL. 99 NO. 1 EXCHANGE RATES AND CURRENCY EXPOSURES 13
an increase in its net financial index and a valuation loss if the net financial index falls.Accordingly, a country receives a double boost to its external position if it experiencesa simultaneous improvement in its trade-weighted index (where an improvement meansa depreciation) and in its net financial index, since both the current account and thevaluation term will improve. In contrast, there will be an ambiguous response of theexternal position in the case of a country that sees its trade-weighted index and its netfinancial index move in opposite directions, since an improvement in the trade balancemay be offset by the negative valuation impact. Accordingly, it is interesting to considerthe comovement between these indices.
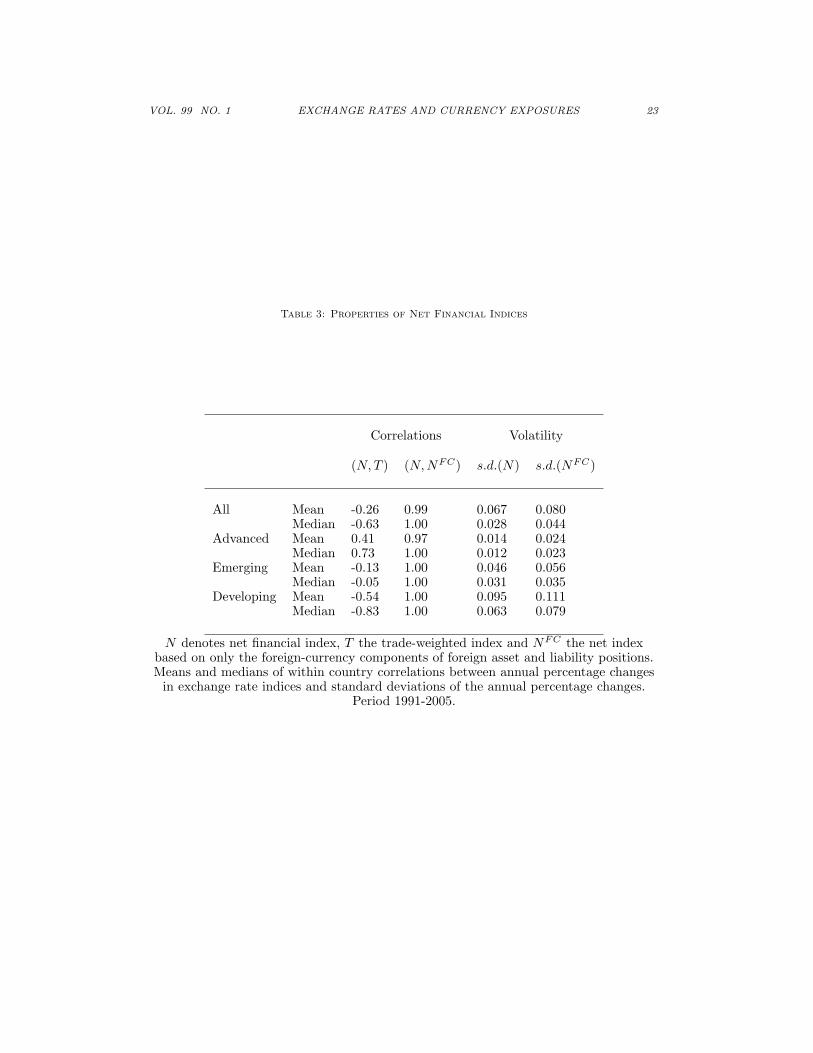
Figure 2 shows the cross-country distribution of this correlation. Just over 60 percentof countries show a negative correlation, with a cluster of countries concentrated nearminus 1: these countries typically had very large depreciations at some point duringthe sample period, while maintaining negative foreign-currency positions. There is con-siderable heterogeneity even among the advanced economies (marked by their countryabbreviation), even if most of these countries show a positive correlation. Table 3 showsa strongly negative average correlation between the net financial index and the trade-weighted index for emerging and developing economies. When compared to the results inTable 2, Table 3 also shows that net financial indices are far more stable than any otherindex for all types of countries.22 This again represents that the net valuation impact ofcurrency movements is limited by the offsetting effects on the value of foreign-currencyassets and foreign-currency liabilities. However, especially for developing countries, thereis a fair degree of volatility in this index.23
D. Valuation Effects
As noted in section 4, the net financial index tells us the directional impact of currencymovements on the external position, but to know the total impact on the economy, weneed to combine this information with the scale of the international balance sheet. Thetotal effect, V ALXR
it becomes the object of interest. We consider three aspects of thisterm. First, the extent to which exchange rate based valuation effects drive the overallvaluation term, the persistence of these terms, and finally the size.
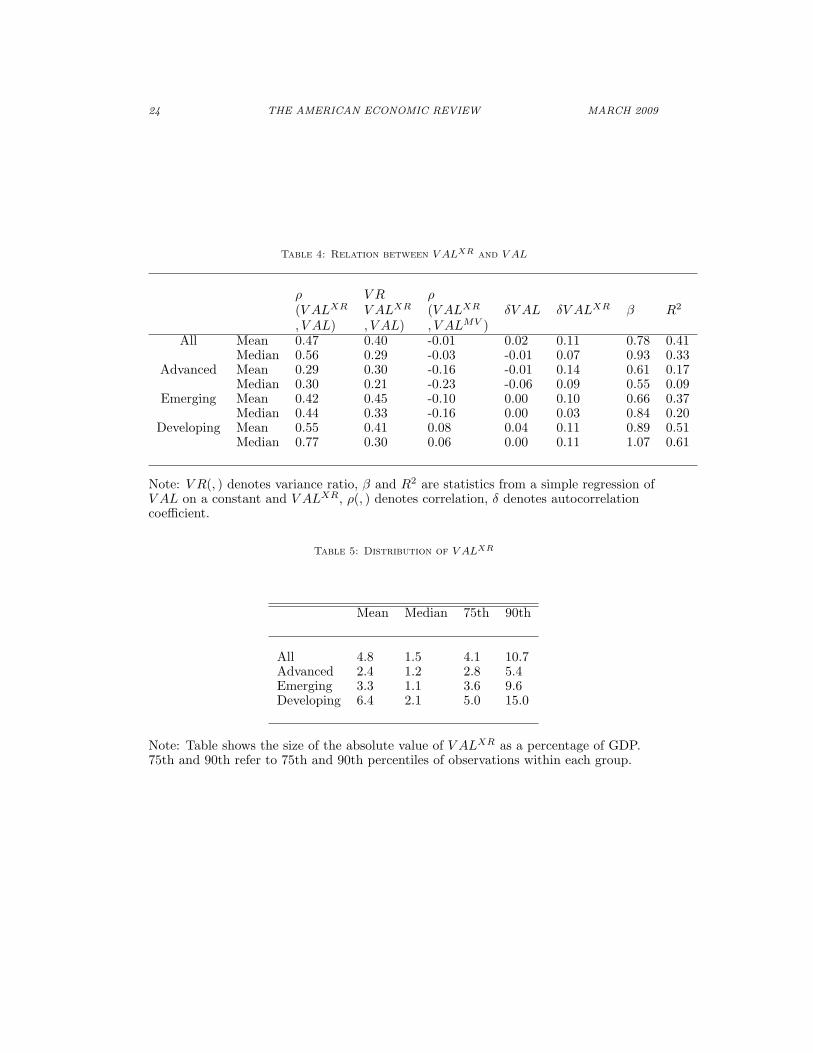
All three results are shown in Tables 4 and 5. We report indicators of the impact ofthe exchange rate on the overall valuation term. where V ALit is the aggregate valuationterm defined in equation (1) and V ALXR
it is the currency valuation term defined inequation (7), with both scaled by GDP. Since V ALXR
it and V ALMVit are not orthogonal,
we cannot do a pure variance decomposition. Instead, we rely on a series of statisticsthat demonstrate the importance of V ALXR
it for the overall valuation term. On the mostbasic level, Table 4 shows that the two are positively correlated: the mean and medianwithin-country correlations are 0.47 and 0.56 respectively. The advanced sample has aweaker connection, but it is still positive. When V ALXR
it moves, V ALit tends to movein the same direction.
foreign-currency assets enter positively into the net financial index but foreign-currency liabilities enternegatively.
22We can also examine a foreign currency only net index. Just as the percentage change in the netindex shows the change in the external balance sheet, the percentage change in a net foreign currencyindex would tell us about the change in the foreign currency portion of the balance sheet. The two willalways move almost perfectly together because all movement comes from the foreign currency portion,but the overall net index’s movements may be dampened by sizeable portions of domestic currency assetsor liabilities. As Table 3 shows, the foreign currency only index is slightly more volatile, but the two arenearly indistinguishable.
23The pattern is the same if one instead examines the average absolute value of the percentage changeof the index instead of the standard deviation of the changes.
14 THE AMERICAN ECONOMIC REVIEW MARCH 2009
Next we show that V ALXRit has sufficient variance to be an important part of V ALit.
The mean country variance ratio is 0.40. Furthermore, the movements in V ALXRit are not
simply offset by changes in V ALMVit . There is only a mildly negative correlation between
V ALXRit and V ALMV
it for the advanced countries, while the correlation is close to zerofor the full sample and weakly positive for developing countries. In order to provide anadditional quantitative measure of the comovement between the currency valuation termand the overall valuation term, Table 4 also reports the β and R2 from a simple regressionof V ALit on V ALXR
it . If movements in the net financial exchange rate index (interactedwith the gross scale of international financial integration) were fully offset by shifts inlocal-currency returns, then we would expect β = 0. In contrast, a non-zero value of βindicates that exchange rate movements exert a valuation impact, whether directly orindirectly (through simultaneous movements in local-currency returns).
The results show an important role for the currency valuation term in explaining thatthe overall valuation effect. For developing or emerging countries, the ‘pass through’ isapproximately one-to-one: a currency related gain of 1 percentage point of GDP (accord-ing to our measure) is associated with a 1 percentage point aggregate net capital gain.Moreover, the regression has considerable explanatory power for these groups of countries(between 0.2 and 0.6). The pattern is quite different for the advanced countries. Whilethe currency valuation term is significant in the pooled sample, the explanatory powerof the regression is much lower at 0.09 − 0.17. The estimated β is also much lower atroughly 0.6, which again suggests that there is some degree of offset by which capitalgains via currency movements are partially cancelled out by lower foreign-currency re-turns. The differences between the advanced and other country groups are quite intuitive:the larger equity positions of the former group mean that price valuation shocks play amore important role.
Importantly, these wealth shocks are not reversed quickly. Table 4 also shows theaverage within country autocorrelation coefficients for V ALXR
it and V ALit are nearlyzero. Individual country coefficients are noisy, but only a handful have point estimateslower than -0.2 (suggesting some reversals) for the exchange rate valuation shocks. Thus,the wealth gains or losses from V ALXR are persistent, reinforcing the potential impacton the real economy.
Table 5 shows the size relative to GDP of a number of components. The first twocolumns demonstrate that these currency-induced wealth effects are non-trivial. Thetable shows means and medians across the sample. The 75th percentile of absolutemovements in V ALXR
it is 2.8 percent of GDP for advanced countries, 3.6 percent foremerging countries, and 5.0 percent for developing countries. These effects are sizableenough to dominate current account balances in some years and, depending on the marketcapitalization of a country, may rival the wealth effects of stock market booms and busts.24In addition, since these represent cross-border wealth transfers, these may matter more forthe international transmission mechanism than price shifts that also cause large transfersacross agents within an economy.
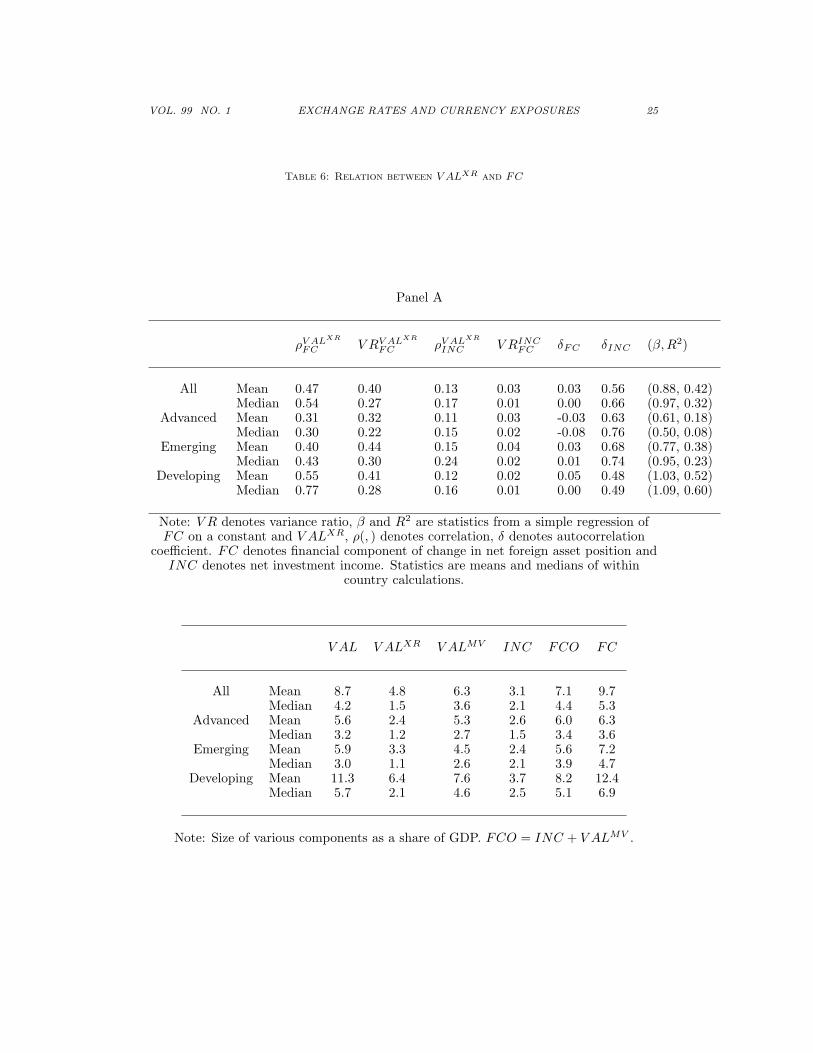
As noted in section 2, we may also worry that V ALXR is simply offsetting expectedreturns and the total financial impact on NFA (valuation plus investment income) is notmaterially affected by V ALXR. Table 6 demonstrates that, while an important theoreticalconcern, this is not the empirically relevant scenario. Columns (1) through (5) examinethe extent to which V ALXR contributes to movements in the financial component FCthat was defined in equation (2). We see very similar results to those in Table 4. V ALXR
24World stock market capitalization was roughly 100 percent of world GDP in 2005 (Reuters, 2007).Across major countries, capitalizations range from 50 to 200 percent of GDP meaning a change of 10percent in the stock market would generate wealth shocks in the range of 5 to 20 percent of GDP.

VOL. 99 NO. 1 EXCHANGE RATES AND CURRENCY EXPOSURES 15
has a significant share of the variance of the total financial component and V ALXR andFC have a strongly positive correlation. Finally, bivariate regressions yield similar resultsto those in Table 4. This is not to argue that NETINV INC is unimportant in thebalance of payments, since panel B shows its size is not trivial (an average share of GDPof 2-3 percent). Rather, NETINV INC is not particularly variable and its varianceexplains little of the overall financial components variance. Thus, net investment incomecannot be offsetting the swings in V ALXR or V AL. In addition, it has a weakly positivecorrelation with V ALXR. Thus, we see that the valuation term is fairly sizeable and,while shifts in market asset prices explain some of its movements, shifts in currenciesexplain an important part of the overall financial impact on the NFA position.
E. Aggregate Foreign-Currency Exposure
It is useful to develop a measure of aggregate foreign-currency exposure, which capturesthe sensitivity of a country’s external balance sheet to a uniform movement of its domesticcurrency against all foreign currencies. We define aggregate foreign currency exposure atthe end of period t by
(8) FXAGGit = ωA
itsAit − ωL
itsLit
where ωAit is the share of foreign assets denominated in foreign currencies, sA
it is theshare of foreign assets in the sum of foreign assets and foreign liabilities and ωL
it, sLit are
defined analogously. Aggregate foreign currency exposure captures the sensitivity of acountry’s portfolio to a uniform currency movement by which the home currency movesproportionally against all foreign currencies. In turn, the net impact of a uniform shiftin the value of the domestic currency against all foreign currencies is given by
(9) NETFXit = FXAGGit ∗ IFIit
Figure 3 and Table 7 show the cross-sectional distribution of FXAGG in 1994. Wesee that a majority (70 percent) have a net negative position in foreign currencies withan average weight of -23 percent. Roughly 25 percent have below -50 percent weight,leaving them with a considerable short position in foreign currencies. On the other hand,industrial countries are on average close to balance (mean and median weight are betweenzero and 10 percent) and 60 percent of industrial countries have a positive net weight inforeign currencies. Emerging countries are on balance negative, but much closer to zerothan the poorer developing countries.
Figure 3 also shows the same distribution but for the year 2004. By the end of 2004,19 percent more of the sample had taken a positive position against the rest of the world.The mean and median position have both moved close to zero (-3 percent) and less than 5percent have positions of -50 percent or worse. The industrial countries still have meansand medians close to positive 10 percent with 86 percent of them having net positiveexposure. Emerging countries are also on average positive by 2004. It should be notedthat shifting to a positive net position does not eliminate exchange rate based valuationeffects: it simply means that the sign will be positive when the country depreciates againstthe rest of the world.
To put these figures in context, a negative foreign-currency exposure of 50 percentagainst the rest of the world means that a 10 percent depreciation would generate avaluation loss of 10 percent times 50 percent times total assets and liabilities divided

16 THE AMERICAN ECONOMIC REVIEW MARCH 2009
by GDP (recall that equation (new number) shows the valuation gain is the percentagechange in the index times the gross scale of international financial integration). Thus,a country at the average gross position of 200 percent of GDP would experience a 10percent of GDP loss from such a depreciation. These wealth effects are considerable anddemonstrate why the aggregate foreign-currency position against the rest of the world isan important indicator.25
The middle portion of Table 7 shows the shift in financial globalization over the sampleperiod. In general, the external balance sheet as a share of GDP has gone up 60 percent,but this growth has not been evenly distributed. The IFI ratio for advanced countriesis over 200 percent and the scale of financial globalization for emerging markets has goneup 60 percent, while developing countries have actually receded from the global financialsystem on average, with a small decline in the size of their external balance sheets.
The bottom half of Table 7 puts these two features together to show the values ofNETFXit in 1994 and 2004. This helps to demonstrate the scale at which a changein the exchange rate would affect the economy. The changes from 1994 to 2004 showa similar pattern to the raw FXAGG
it statistics in the top half of the table with theexception that the positions of the advanced economies have increased even more bythis measure. While many industrial countries have not shifted FXAGG
it dramatically,their scale of financial globalization (IFI) has increased considerably, so their overall netlong exposure against foreign currencies has increased as a share of the economy. Again,they do not risk negative wealth effects following depreciation, but they are exposed toexchange rate movements. During the recent appreciation of the euro against the dollar,euro area countries long the dollar have faced steep losses.
Next, we provide a decomposition of the shifts in currency exposures over the 1994-2004period. The shift in foreign-currency exposure between periods t − N and t can comeeither from changing the share of assets relative to liabilities in IFI (sA
it), or changingthe foreign currency weight of liabilities (ωL
ijt) or assets (ωAijt). Table 8 shows the driving
factors underlying the changes in FXAGGit . 26 There is a considerable range of behavior
of FXAGGit over the decade. To understand why positions have changed we can divide
the sample into quartiles by the extent that FXAGGit has changed (Panel A of Table 8).
While the lowest quartile sees a small decline in FXAGGit , the top quartile has increased
on average 50 percentage points in the measure.We see that all parts of the decomposition are important in explaining the shift in
positions. The top quartile saw a large positive shift in net foreign asset positions (theasset share of gross assets and liabilities has increased strongly, 17 percentage points),as opposed to a decrease for the low quartile. In addition, the top quartile drasticallyreduced the foreign currency share of their liabilities (30 percentage points) without ashift in the foreign currency share of assets. The bottom quartile showed a considerabledrop in the foreign currency share of both assets and liabilities. Most countries see nochange in (ωA
ijt) as nearly all foreign assets are in foreign currency for most countries.
25We also note that there can still be considerable exchange rate shocks due to bilateral movementseven if FXAGG
it is zero. All but 10 countries are short some other currency in 2004 and 50 percent havea negative weight of 11 percent or more against some other currency. The largest net negative positionvaries, with half short the dollar and the others roughly evenly split between the euro and yen. All butone country are long another currency, though the average position is smaller (7 percent weight). Thelong positions are spread across the dollar (33 percent), the pound (20 percent), and the euro (28 percent)along with 16 other currencies which are the largest long position for somewhere between 1 and 3 othercountries. The more minor currencies become important due to a large FDI holding in the country andno off-setting liabilities in that currency. Thus, even countries with roughly balanced net positions tendto have considerable exposure to movements across bilateral rates.
26See Lane and Shambaugh (2008) on the determinants of aggregate foreign-currency exposures.

VOL. 99 NO. 1 EXCHANGE RATES AND CURRENCY EXPOSURES 17
The drop in the foreign currency component of assets simultaneously with liabilities islargely an EMU phenomenon. We can see this better by examining the decompositionacross country types in the bottom part of Table 8. EMU countries drastically increasedthe importance of domestic currency on both sides of the international balance sheet,with the foreign-currency shares of assets and liabilities decreasing by 52 and 41 per-centage points respectively. Combined with an essentially average NFA position, we seewhy EMU countries did not see much improvement in their aggregate foreign currencyexposure.27
Columns (5)-(8) show more details of the sources of the change in the foreign-currencyexposure. We focus on why the share of assets in the international financial integrationindex rose and why the foreign currency share of liabilities fell. FDI and equity aredenominated in local currency, so increasing their share of liabilities will lower the foreigncurrency component of liabilities. Panel A shows that the top two quartiles (the onesthat improved FXAGG
it the most) saw substantial shifts towards equity oriented financing,while Panel B demonstrates that this shift is found most strongly in the emerging anddeveloping countries. On the other hand, there is effectively no change in the foreign-currency share of debt liabilities beyond the EMU countries, and these changes are trivialfor the top two quartiles.
As for the improved net foreign asset position of many countries, we examine whetherthis is purely a result of increases in the accumulation of reserves. We see that for allquartiles increases in reserves contributed to the increase in total assets. For the topquartile, over 50 percent of the increase in total assets came from an increase in reserves,while only the top quartile saw a substantial increase in the non-reserve net foreign assetposition. Across country groups, we see that only the non-advanced countries were trulystockpiling reserves and that, for emerging countries, it was this behavior that drove theshift in sA
it as the non-reserve net external position was actually negative on average. Thus,the shift away from negative foreign currency positions is not coming from borrowing indomestic currency but from the shift towards equity finance and improvements in the netforeign asset position.
V. Conclusions
Our goal in this paper has been to understand the international financial implicationsof currency movements. To this end, we have drawn from a wide range of sources to builda large-scale data set of international currency positions, constructed financially-weightedexchange rate indices and calculated net foreign-currency exposures.
Our analysis shows that trade-weighted exchange rate indices are an inadequate guidein understanding the wealth effects of currency movements. In addition, we find thatmany developing countries have historically had a negative net position in foreign cur-rencies, such that depreciations of the domestic currency have generated negative wealtheffects. However, we have found that many of these countries have shifted towards aless exposed currency position over the last decade, largely through improvements intheir net foreign asset position and an increase in the share of foreign liabilities that arein domestic-currency categories (such as portfolio equity and FDI). In addition, manycountries (especially the advanced economies) have increased gross international posi-
27The crucial difference within the EMU countries seems to be the share of foreign currency liabilitiesat the start. They all reduce their foreign currency liabilities weight to 10-20 percent. Countries suchas Finland that were near 90 percent to start, therefore see much bigger changes in the foreign currencyliabilities. Also, countries that started with more liabilities tend to see better improvement becauseeven if they reduced the foreign currency share of assets and liabilities simultaneously, the impact of theliabilities is bigger.
18 THE AMERICAN ECONOMIC REVIEW MARCH 2009
tions so much that, even with relatively balanced net positions, they still may experiencesubstantial wealth shocks from currency movements.
Finally, we find that the wealth effects associated with exchange rate changes aresubstantial, unlikely to reverse quickly, and can explain a sizable share of the overallvaluation shocks that hit the net foreign asset position, especially for developing countries.We view these results as providing an important guide for the appropriate design of thenext generation of ‘new portfolio balance’ models of the open economy. Our findingshighlight the importance of modelling the dual role of exchange rates in the internationaladjustment process: the financially-weighted exchange rate index operates through thevaluation channel, while the trade-weighted index influences net exports. Accordingly,the inclusion of the valuation channel in our models may enhance our understanding ofdomestic macroeconomic performance and the optimal design of macroeconomic policiesfor open economies.

VOL. 99 NO. 1 EXCHANGE RATES AND CURRENCY EXPOSURES 19
References
Becker, Chris, and Daniel Fabbro. 2006. “Limiting Foreign Exchange Expo-sure through Hedging: The Australian Experience.” Reserve Bank of AustraliaRDP2006-09.
Burnside, Craig, Martin Eichenbaum, Isaac Kleshchelski, and Sergio Rebelo.2006. “The Returns to Currency Speculation.” National Bureau of Economic Re-search Working Paper 12489.
Caballero, Ricardo, Emmanuel Farhi, and Pierre-Olivier Gourinchas. 2008.“An Equilibrium Model of “Global Imbalances” and Low Interest Rates.” AmericanEconomic Review, 98(1): 358-393.
Campbell, John Y., Karine Serfaty-de Medeiros, and Luis M. Viceira. 2007.“Global Currency Hedging.” National Bureau of Economic Research Working Paper13088.
Devereux, Michael B., and Makoto Saito. 2006. “A Portfolio Theory of Inter-national Capital Flows.” Institute for International Integration Studies DiscussionPaper 124.
Devereux, Michael B., and Alan Sutherland. 2006. “Solving for Country Portfo-lios in Open-Economy Macro Models.” Centre for Economic Policy Research Dis-cussion Paper 5966.
Devereux, Michael B., Philip R. Lane, and Juanyi Xu. 2006. “Exchange Ratesand Monetary Policy for Emerging Market Economies.” The Economic Journal,116: 478-506.
Eichengreen, Barry, Ricardo Hausmann and Ugo Panizza. 2003. CurrencyMismatches, Debt Intolerence and Original Sin: Why They Are Not the Same andWhy it Matters. National Bureau of Economic Research Working Paper 10036.
Eichengreen, Barry, and Ricardo Hausmann. 2005. Other People’s Money: DebtDenomination and Financial Instability in Emerging Market Economies. Chicago,IL: University of Chicago Press.
Eichengreen, Barry, and Donald Mathieson. 2000. “The Currency Compositionof Foreign Exchange Reserves: Retrospect and Prospect.” International MonetaryFund Working Paper 00/131.
Engel, Charles, and Akito Matsumoto. 2006. “Portfolio Choice in a MonetaryOpen-Economy DSGE Model.” National Bureau of Economic Research WorkingPaper 12214.
European Central Bank. 2005. “Review of the International Role of the Euro.”European Central Bank.
Goldstein, Morris, and Philip Turner. 2004. Controlling Currency Mismatches inEmerging Markets. Washington, DC: Institute for International Economics.
Gourinchas, Pierre-Olivier, and Helene Rey. 2007. “From World Banker toWorld Venture Capitalist: US External Adjustment and the Exorbitant Privilege.”National Bureau of Economic Research Working Paper 11563.
Gourinchas, Pierre-Olivier, and Helene Rey. 2007. “International Financial Ad-justment.” Journal of Political Economy, 115: 665-703.
Hau, Harald, and Helene Rey. 2006. “Exchange Rates, Equity Prices, and CapitalFlows.” Review of Financial Studies, 19: 273-313.
Lane, Philip R., and Gian Maria Milesi-Ferretti. 2005. “Financial Globalizationand Exchange Rates.” Centre for Economic Policy Research Discussion Paper 4745.
Lane, Philip R., and Gian Maria Milesi-Ferretti. Forthcoming. “The ExternalWealth of Nations Mark II.” Journal of International Economics.
Lane, Philip R., and Gian Maria Milesi-Ferretti. 2007. “Europe and GlobalImbalances.” Economic Policy, 22: 519-573.
20 THE AMERICAN ECONOMIC REVIEW MARCH 2009
Lane, Philip R., and Gian Maria Milesi-Ferretti. 2008. “International InvestmentPatterns.” Review of Economics and Statistics, 90(3): 538-549.
Lane, Philip R., and Gian Maria Milesi-Ferretti. 2009. “Where Did All theBorrowing Go? A Forensic Analysis of the U.S. External Position. ” Journal ofJapanese and International Economies, forthcoming.
Lane, Philip R., and Jay C. Shambaugh. 2008. “The Long or Short of it: Deter-minants of Foreign Currency Exposure in External Balance Sheets.” Institute forInternational Integration Studies Discussion Paper 253.
Lim, Ewe-Ghee. 2006. “The Euro’s Challenge to the Dollar: Different Views fromEconomists and Evidence from COFER (Currency Composition of Foreign Ex-change Reserves) and other Data.” International Monetary Fund Working Paper06/153.
Martin, Philippe, and Helene Rey. 2004. “Financial Super-Markets: Size Mattersfor Asset Trade.” Journal of International Economics, 64: 335-361.
Pavlova, Anna, and Roberto Rigobon. 2007. “Asset Prices and Exchange Rates.”Review of Financial Studies, 20(4): 1139-1181.
Tille, Cedric. 2003. “The Impact of Exchange Rate Movements on U.S. ForeignDebt.” Current Issues in Economics and Finance, 9(1).
Tille, Cedric, and Eric van Wincoop. 2007. “International Capital Flows.” Na-tional Bureau of Economic Research Working Paper 12856.
Truman, Edwin M, and Anna Wong. 2006. “The Case for an International ReserveDiversification Standard.” Peterson Institute for International Economics WorkingPaper 06-2.
US Treasury. 2004. “Report on US Portfolio Holdings of Foreign Securities.” USTreasury.
Wong, Anna. 2007. “Measurement and Inference in International Reserve Diversifi-cation.” Peterson Institute for International Economics Working Paper 07-3.
VOL. 99 NO. 1 EXCHANGE RATES AND CURRENCY EXPOSURES 21
Table 1: Correlations of Exchange Rate Indices
Quartile (A,L) (A, T ) (L, T ) (A,AD) (L,LFC)
1 Mean 0.85 0.60 0.52 0.98 0.952 Mean 0.97 0.88 0.83 1.00 0.993 Mean 0.99 0.96 0.94 1.00 1.004 Mean 1.00 0.99 0.99 1.00 1.00
All Mean 0.95 0.86 0.82 0.99 0.99Median 0.98 0.92 0.90 1.00 1.00
Advanced Mean 0.97 0.90 0.85 0.99 0.95Median 0.98 0.91 0.84 0.99 0.95
Emerging Mean 0.93 0.89 0.86 0.99 0.99Median 0.98 0.97 0.94 1.00 1.00
Developing Mean 0.96 0.83 0.79 1.00 0.99Median 0.99 0.92 0.91 1.00 1.00
Means and medians of within country correlations between the percentage change inexchange rate indices, annual data over 1991-2005. Full sample of countries. A,L, T
denote asset-, liability- and trade-weighted indices; AD is the debt-only asset-weightedindex, while LFC is the liability index based only on the foreign-currency component.
22 THE AMERICAN ECONOMIC REVIEW MARCH 2009
Table 2: Volatility of Exchange Rate Indices
A L T AD LFC
All Mean (s.d.) 0.173 0.132 0.152 0.175 0.181Median (s.d.) 0.102 0.076 0.091 0.105 0.121
Advanced Mean (s.d.) 0.065 0.044 0.055 0.066 0.089Median (s.d.) 0.064 0.039 0.056 0.069 0.087
Emerging Mean (s.d.) 0.182 0.133 0.167 0.186 0.189Median (s.d.) 0.132 0.082 0.115 0.134 0.136
Developing Mean (s.d.) 0.206 0.162 0.179 0.207 0.209Median (s.d.) 0.152 0.115 0.128 0.152 0.154
Means and medians of within country standard deviation of annual changes in exchangerate indices over 1991-2005, full sample of countries. A,L, T denote asset-, liability- and
trade-weighted indices; AD is the debt-only asset-weighted index, while LFC is theliability index based only on the foreign-currency component.
VOL. 99 NO. 1 EXCHANGE RATES AND CURRENCY EXPOSURES 23
Table 3: Properties of Net Financial Indices
Correlations Volatility
(N,T ) (N,NFC) s.d.(N) s.d.(NFC)
All Mean -0.26 0.99 0.067 0.080Median -0.63 1.00 0.028 0.044
Advanced Mean 0.41 0.97 0.014 0.024Median 0.73 1.00 0.012 0.023
Emerging Mean -0.13 1.00 0.046 0.056Median -0.05 1.00 0.031 0.035
Developing Mean -0.54 1.00 0.095 0.111Median -0.83 1.00 0.063 0.079
N denotes net financial index, T the trade-weighted index and NFC the net indexbased on only the foreign-currency components of foreign asset and liability positions.Means and medians of within country correlations between annual percentage changes
in exchange rate indices and standard deviations of the annual percentage changes.Period 1991-2005.
24 THE AMERICAN ECONOMIC REVIEW MARCH 2009
Table 4: Relation between V ALXR and V AL
ρ V R ρ(V ALXR V ALXR (V ALXR δV AL δV ALXR β R2
, V AL) , V AL) , V ALMV )All Mean 0.47 0.40 -0.01 0.02 0.11 0.78 0.41
Median 0.56 0.29 -0.03 -0.01 0.07 0.93 0.33Advanced Mean 0.29 0.30 -0.16 -0.01 0.14 0.61 0.17
Median 0.30 0.21 -0.23 -0.06 0.09 0.55 0.09Emerging Mean 0.42 0.45 -0.10 0.00 0.10 0.66 0.37
Median 0.44 0.33 -0.16 0.00 0.03 0.84 0.20Developing Mean 0.55 0.41 0.08 0.04 0.11 0.89 0.51
Median 0.77 0.30 0.06 0.00 0.11 1.07 0.61
Note: V R(, ) denotes variance ratio, β and R2 are statistics from a simple regression ofV AL on a constant and V ALXR, ρ(, ) denotes correlation, δ denotes autocorrelationcoefficient.
Table 5: Distribution of V ALXR
Mean Median 75th 90th
All 4.8 1.5 4.1 10.7Advanced 2.4 1.2 2.8 5.4Emerging 3.3 1.1 3.6 9.6Developing 6.4 2.1 5.0 15.0
Note: Table shows the size of the absolute value of V ALXR as a percentage of GDP.75th and 90th refer to 75th and 90th percentiles of observations within each group.
VOL. 99 NO. 1 EXCHANGE RATES AND CURRENCY EXPOSURES 25
Table 6: Relation between V ALXR and FC
Panel A
ρV ALXR
FC V RV ALXR
FC ρV ALXR
INC V RINCFC δFC δINC (β,R2)
All Mean 0.47 0.40 0.13 0.03 0.03 0.56 (0.88, 0.42)Median 0.54 0.27 0.17 0.01 0.00 0.66 (0.97, 0.32)
Advanced Mean 0.31 0.32 0.11 0.03 -0.03 0.63 (0.61, 0.18)Median 0.30 0.22 0.15 0.02 -0.08 0.76 (0.50, 0.08)
Emerging Mean 0.40 0.44 0.15 0.04 0.03 0.68 (0.77, 0.38)Median 0.43 0.30 0.24 0.02 0.01 0.74 (0.95, 0.23)
Developing Mean 0.55 0.41 0.12 0.02 0.05 0.48 (1.03, 0.52)Median 0.77 0.28 0.16 0.01 0.00 0.49 (1.09, 0.60)
Note: V R denotes variance ratio, β and R2 are statistics from a simple regression ofFC on a constant and V ALXR, ρ(, ) denotes correlation, δ denotes autocorrelation
coefficient. FC denotes financial component of change in net foreign asset position andINC denotes net investment income. Statistics are means and medians of within
country calculations.
V AL V ALXR V ALMV INC FCO FC
All Mean 8.7 4.8 6.3 3.1 7.1 9.7Median 4.2 1.5 3.6 2.1 4.4 5.3
Advanced Mean 5.6 2.4 5.3 2.6 6.0 6.3Median 3.2 1.2 2.7 1.5 3.4 3.6
Emerging Mean 5.9 3.3 4.5 2.4 5.6 7.2Median 3.0 1.1 2.6 2.1 3.9 4.7
Developing Mean 11.3 6.4 7.6 3.7 8.2 12.4Median 5.7 2.1 4.6 2.5 5.1 6.9
Note: Size of various components as a share of GDP. FCO = INC + V ALMV .
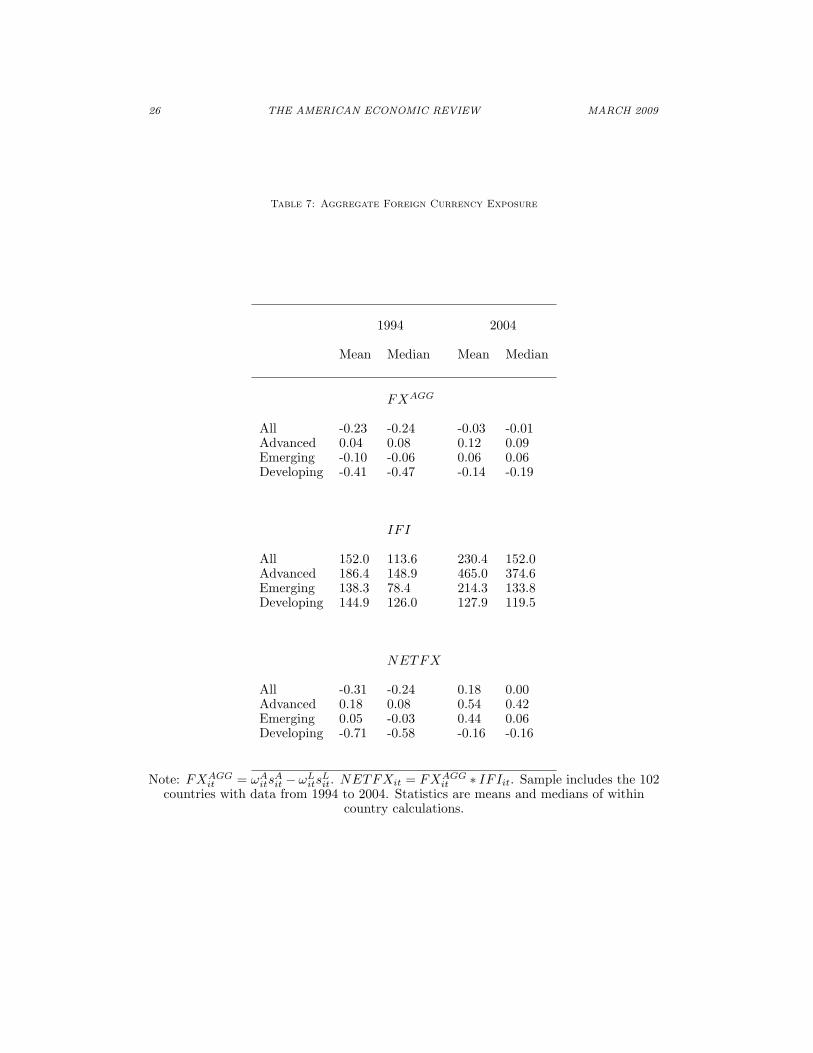
26 THE AMERICAN ECONOMIC REVIEW MARCH 2009
Table 7: Aggregate Foreign Currency Exposure
1994 2004
Mean Median Mean Median
FXAGG
All -0.23 -0.24 -0.03 -0.01Advanced 0.04 0.08 0.12 0.09Emerging -0.10 -0.06 0.06 0.06Developing -0.41 -0.47 -0.14 -0.19
IFI
All 152.0 113.6 230.4 152.0Advanced 186.4 148.9 465.0 374.6Emerging 138.3 78.4 214.3 133.8Developing 144.9 126.0 127.9 119.5
NETFX
All -0.31 -0.24 0.18 0.00Advanced 0.18 0.08 0.54 0.42Emerging 0.05 -0.03 0.44 0.06Developing -0.71 -0.58 -0.16 -0.16
Note: FXAGGit = ωA
itsAit − ωL
itsLit. NETFXit = FXAGG
it ∗ IFIit. Sample includes the 102countries with data from 1994 to 2004. Statistics are means and medians of within
country calculations.

VOL. 99 NO. 1 EXCHANGE RATES AND CURRENCY EXPOSURES 27
Table 8: Decomposition of Shift in Aggregate Foreign Currency Exposure 1994-2004
Quartile ∆FXAGG ∆sAit ∆ωA
it ∆ωLit ∆Res ∆NFApriv ∆(λPEQ
Lit ∆DebtLFC
/∆A /GDP +λFDILit )
1 -0.09 -0.06 -0.15 -0.16 0.21 -0.16 0.08 -0.142 0.12 0.05 -0.06 -0.10 0.28 0.06 0.04 -0.083 0.26 0.07 0.01 -0.22 0.43 0.11 0.22 -0.014 0.50 0.17 -0.02 -0.30 0.53 0.45 0.28 -0.03
All 0.201 0.06 -0.05 -0.20 0.37 0.12 0.16 -0.06Advanced 0.071 0.03 -0.25 -0.24 0.02 0.04 0.06 -0.27EMU -0.005 0.01 -0.52 -0.41 -0.02 -0.01 0.05 -0.54Non-EMU 0.147 0.06 0.02 -0.07 0.07 0.08 0.08 -0.01Emerging 0.157 0.02 -0.0003 -0.19 0.40 -0.06 0.19 -0.01Developing 0.279 0.08 0.0000 -0.18 0.52 0.27 0.18 0.00
∆sAit represents the change in the share of assets in total IFI, ∆ωA
it shows the change inthe foreign currency share of foreign assets, and ∆ωL
it represents the change in foreigncurrency share of liabilities. ∆Res/∆A represents the share of asset growth whichcomes from reserves. ∆NFAprivrepresents change in private (non-reserve) NFA.∆(λPEQ
Lit + λFDILit ) represents the change in the portfolio equity and FDI shares of
liabilities. ∆DebtLFC represents the change in the foreign currency share of DebtLiabilities. 1994-2004. Statistics are means of within country calculations.
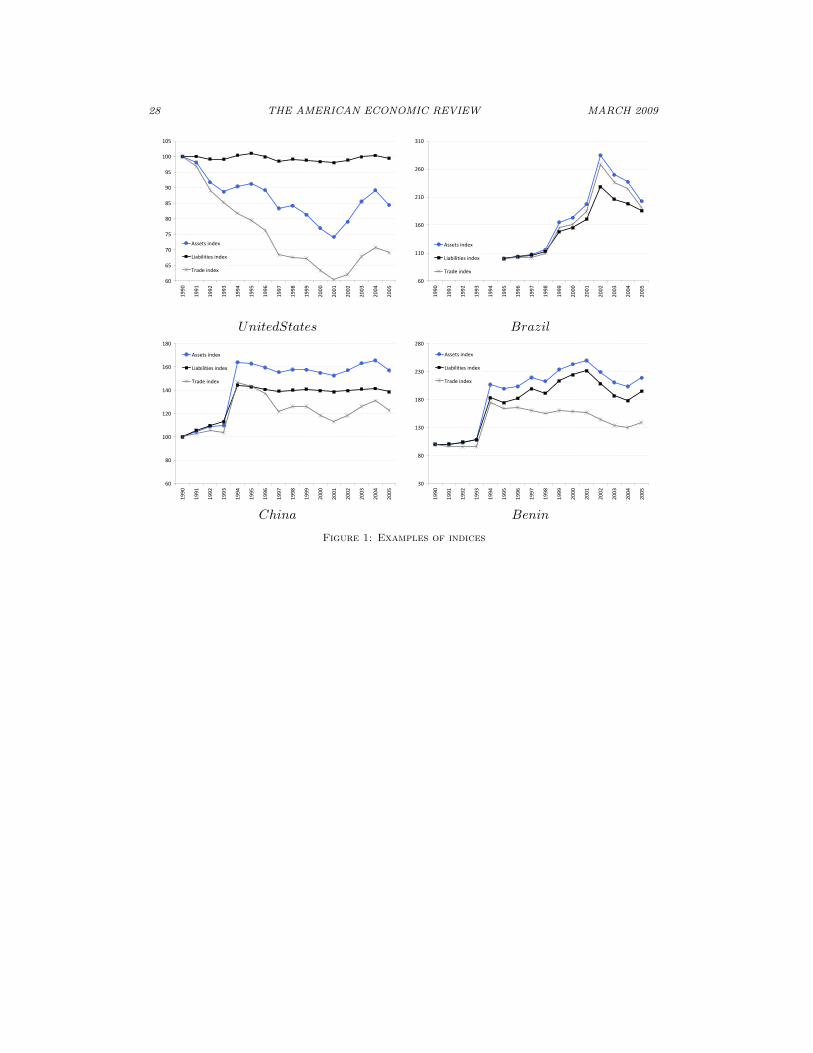
28 THE AMERICAN ECONOMIC REVIEW MARCH 2009
60
65
70
75
80
85
90
95
100
105
1990
1991
1992
1993
1994
1995
1996
1997
1998
1999
2000
2001
2002
2003
2004
2005
Assets index
Liabilities index
Trade index
60
110
160
210
260
310
1990
1991
1992
1993
1994
1995
1996
1997
1998
1999
2000
2001
2002
2003
2004
2005
Assets index
Liabilities index
Trade index
UnitedStates Brazil
60
80
100
120
140
160
180
1990
1991
1992
1993
1994
1995
1996
1997
1998
1999
2000
2001
2002
2003
2004
2005
Assets index
Liabilities index
Trade index
30
80
130
180
230
280
1990
1991
1992
1993
1994
1995
1996
1997
1998
1999
2000
2001
2002
2003
2004
2005
Assets index
Liabilities index
Trade index
China Benin
Figure 1: Examples of indices
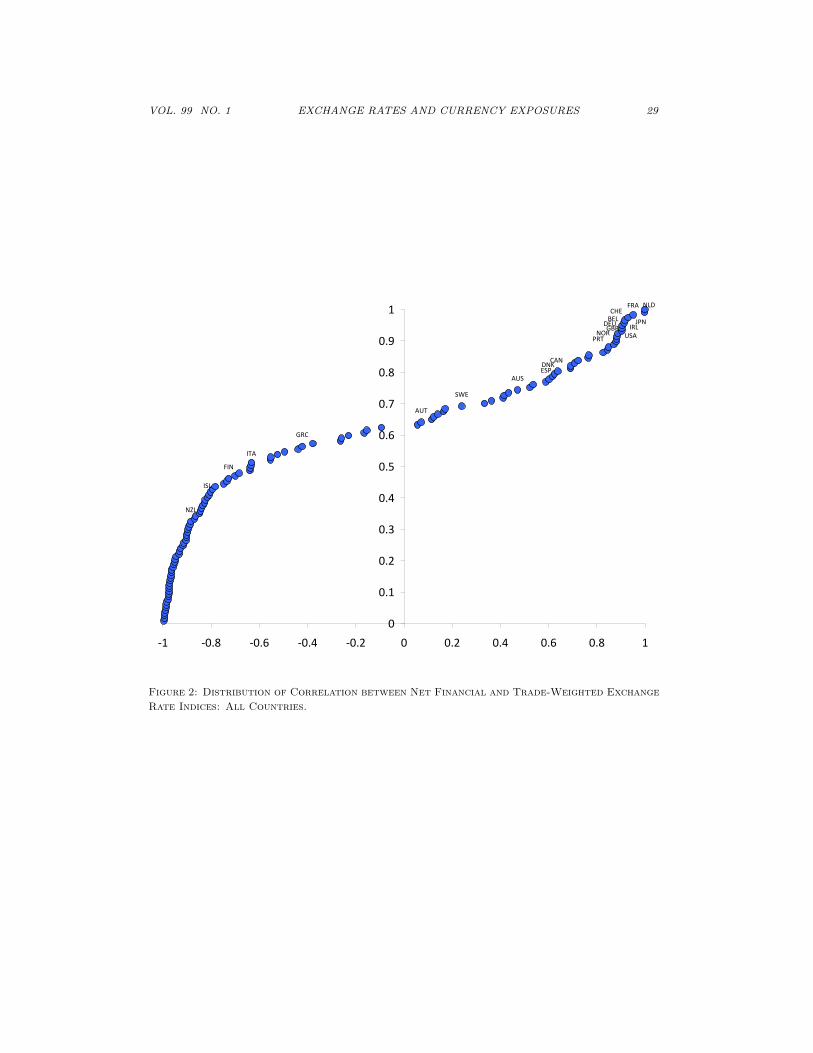
VOL. 99 NO. 1 EXCHANGE RATES AND CURRENCY EXPOSURES 29
NZL
ISL
FIN
ITA
GRC
AUT
SWE
AUSESPDNK
CAN
PRTNOR USA
GBRDEUBEL
IRL
CHE
JPN
FRA NLD
0
0.1
0.2
0.3
0.4
0.5
0.6
0.7
0.8
0.9
1
‐1 ‐0.8 ‐0.6 ‐0.4 ‐0.2 0 0.2 0.4 0.6 0.8 1
Figure 2: Distribution of Correlation between Net Financial and Trade-Weighted Exchange
Rate Indices: All Countries.

30 THE AMERICAN ECONOMIC REVIEW MARCH 2009
0
0.1
0.2
0.3
0.4
0.5
0.6
0.7
0.8
0.9
1
‐1.0 ‐0.8 ‐0.6 ‐0.4 ‐0.2 0.0 0.2 0.4 0.6 0.8 1.0
1994 2004
Figure 3: Distribution of Aggregate Foreign Currency Exposures, 1994 and 2004.