Embed Size (px)
Citation preview

Financial compendium and Feasibility analysis oF WasteWater reuse For industry and agriculture in solapur and VijayaWada
February 2020
supported by project consortium
prepared by
International Development Research Centre
Centre de recherches pour le développement international

2
INTEGRATED RURAL URBAN WATER MANAGEMENT FOR
CLIMATE BASED ADAPTATIONS IN INDIAN CITIES (IAdapt)
Financial Compendium and Feasibility Analysis of Wastewater reuse for Industry and Agriculture in
Solapur and Vijayawada
Proposal Code: Proposal # A-69683
Submitted to: International Development Research Centre (IDRC) Canada
Submitted by: International Water Management Institute (IWMI)
Project Investigators Kaushik Basu, Avinandan Taron, Josiane Nikiema
Date of Submission: February 2020
Project Consortium:
ICLEI South Asia (Lead Member)
Athena Infonomics LLC
International Water Management Institute (IWMI)
Indian Institute of Technology, Madras (IIT M)
Disclaimer
This work was carried out with the aid of a grant from the International Development Research Centre,
Ottawa, Canada. The views expressed herein do not necessarily represent those of IDRC or its Board of
Governors.

3
Integrated Rural Urban Water Management for Climate Based Adaptations in Indian Cities (IAdapt) is a
three year project supported by the International Development Research Centre (IDRC) Canada, being
implemented by ICLEI - Local Governments for Sustainability, South Asia, in partnership with Athena
Infonomics LLC, International Water Management Institute (IWMI) and Indian Institute of Technology,
Madras.
The project focuses on empowering cities to transition from traditional approaches of water management
(which considers water supply, wastewater and storm water as separate entities to be planned,
implemented and operated in silos) to an ‘Integrated Approach’ based on the principles of integrated water
resource management (IWRM) and integrated urban water management (IUWM).
Acknowledgements The project authors would like to express their gratitude to the IDRC Canada and to the Water, Land and
Ecosystem (WLE) research program of the CGIAR, led by the International Water Management Institute
who have supported financially the production of this paper. For their support, the authors are also grateful
to the project partners and to the municipal officials in Solapur and Vijayawada.
Disclaimer A final review could be done following the peer-review process.
4
Table of Contents
Executive Summary ......................................................................................................................................... 6
Financial sources of the ULBs – Resources for Municipal governance ........................................................... 11
Introduction ............................................................................................................................................... 11
Key Financial Resources for municipal governance .................................................................................. 12
Instruments for non-grant financial sources ......................................................................................... 13
Targeting private capital with the help of Public Private Partnerships (PPPs) .......................................... 23
India Infrastructure Project Development Fund (IIPDF) ........................................................................ 24
Viability Gap Funding (VGF) for private entities in PPP initiatives ........................................................ 25
PPP variants in the sewerage sector: .................................................................................................... 30
Proposed business models .................................................................................................................... 34
Financial Feasibility Analysis of tertiary treated wastewater used for agriculture and Industry at Solapur 35
Introduction ............................................................................................................................................... 35
Industrial Area and its distance from Sewage Treatment Plants in Solapur ............................................. 36
Cropping Pattern and Water Demand for Agriculture .......................................................................... 37
Methodology: ............................................................................................................................................ 38
Assumptions: ............................................................................................................................................. 39
Scenario Analysis for Solapur .................................................................................................................... 41
Types of Public Private Partnership ........................................................................................................... 42
Financial Feasibility Analysis of tertiary treated wastewater used for agriculture and Industry at Vijaywada
....................................................................................................................................................................... 45
Introduction ............................................................................................................................................... 45
Industrial area and its proximity to Sewage Treatment Plants ................................................................. 45
Distribution of Minor and Major irrigation sources .............................................................................. 47
Methodology: ............................................................................................................................................ 49
Assumptions: ............................................................................................................................................. 50
Scenario Analysis for Vijayawada .............................................................................................................. 52
Annexure 1 .................................................................................................................................................... 57
Annexure 2 .................................................................................................................................................... 62
Annexure 3 ...................................................................................................................................................... 0

5
List of Tables Table 1. 1: Tax and Non-Tax revenue of the ULBs ................................................................................ 12
Table 1. 2: Financial Institutions associated with PMDO ..................................................................... 15
Table 1. 3: List of bonds issued in India ................................................................................................ 18
Table 1. 4: Credit ratings of the cities in India ...................................................................................... 21
Table 1. 5: PPP distinctions according to ownership, capital investment, tenure and risk bearing .... 31
Table 1. 6: Key success factors of different types of PPPs ................................................................... 31
Table 2. 1: Existing Status of Industrial Areas in Solapur District ......................................................... 36
Table 2. 2: Cropping Pattern under Pratap Nagar plant command area ............................................. 37
Table 2. 3: Water Quality Characteristics of sewage and CPCB norms ................................................ 38
Table 2. 4: Data Collected from field and secondary sources .............................................................. 39
Table 2. 5: Tariff for Viable Operation according to Adoption Rate ..................................................... 41
Table 2. 6: Tariff when interest rate changes from 8% to 10% ............................................................ 42
Table 2. 7: Risk Sharing Pattern in different types of PPP .................................................................... 43
Table 2. 8: Tariff rate under O&M Plus fixed Tariff System .................................................................. 44
Table 3. 1: Industrial Area in Vijaywada ............................................................................................... 45
Table 3. 2: Secondary treatment plants in Vijaywada .......................................................................... 46
Table 3. 3: Irrigated area in Vijaywada ................................................................................................. 47
Table 3. 4: Agricultural water usage ..................................................................................................... 48
Table 3. 5: Crop harvesting ................................................................................................................... 48
Table 3. 6: Water Quality Characteristics of sewage and CPCB norms ................................................ 49
Table 3. 7: Data Collected from field and secondary sources .............................................................. 50
Table 3. 8: Tariff for Viable Operation according to Adoption Rate for UASB & MBBR technology .... 53
Table 3. 9: Tariff for Viable Operation according to Adoption Rate for UASB & MBBR technology .... 53
Table 3. 10: Tariff when interest rate changes from 8% to 10% in UASB Technology ......................... 53
Table 3. 11: Risk Sharing Pattern in different types of PPP .................................................................. 55
Table 3. 12: Tariff rate under O&M Plus fixed Tariff System using UASB + EA .................................... 55
Table 3. 13: Tariff rate under O&M Plus fixed Tariff System using MBBR ........................................... 55
List of Figures Figure 1. 1: Commercial Sources of borrowings of ILBs ....................................................................... 14
Figure 1. 2: Challenges for Municipal bonds in India ........................................................................... 20
Figure 1. 3: Flow of funds in the Pooled Finance Development Scheme ............................................. 23
Figure 1. 4: Access to IIPDF and VGF .................................................................................................... 24
Figure 1. 5: VGF Process Flow for different valuations ........................................................................ 29
Figure 1. 6: Spectrum of the private participation ............................................................................... 30
Figure 1. 7: Risks associated with PPPs in India .................................................................................... 33
Figure 2. 1: Sewage Treatment Plants and their distance from Akkalkot Road MIDC ......................... 37
Figure 3. 1: Location of Sewage Treatment Plants and Industrial Areas on Vijaywada ....................... 47

6
Abstract In India, 38,254 million litres of sewage is generated every day considering both Class-I and Class-II towns of which 11,787 MLD is treated and rest flows into surface water bodies in and around cities. Many cities are situated in water-scarce zones where industrial and agricultural demand for water is being met using freshwater. In recent years, governments at different levels, private players, donors and expert groups have explored alternative water supply arrangement for industry and agriculture sectors, in order to meet their water demand from recycled wastewater. Most of the wastewater is treated up to secondary level as Urban Local Bodies (ULBs) are not obliged go beyond it. Municipal wastewater treated up to secondary level cannot be utilized for industrial use and it is also not suitable for agricultural purpose in most cases. Therefore, the possibility of generating revenue out of secondary treated wastewater is limited and the burden of treating wastewater is left with financially distressed ULBs. The government is trying to manage financial distress and increase efficiency introducing options like Public Private Partnerships (PPPs). We argue that wastewater reuse via PPPs need to generate both sufficient water quality and adequate revenue stream through proper tariffs to make it sustainable. In this paper, we consider Vijaywada city, where both industrial and agricultural demand for water exists and wastewater is till date treated at the secondary level only. We use financial feasibility analysis to explore whether upgrading existing secondary treatment plants to tertiary level is financially feasible and which tariffs applicable to industry and agriculture sector should be set to make the model more sustainable in the long run. Within the financial models, we propose different PPP mechanisms that can be utilised for reclaiming wastewater from cities for industries and agriculture.

7
Executive Summary Introduction
Urban Local Bodies (ULBs) in India are vested with the responsibility of providing civic, social and
economic infrastructure services and facilities in both urban and peri-urban areas. With rapid pace
of urbanization, this is more prerogative to these grassroot organizations, since their sources of
finance are limited. The infrastructure and services being grossly inadequate even for the existing
population, the city authorities in India are in a situation to sketch their action for planned
urbanization and peripheral expansion to accommodate migrants and the local population growth.
The Report of High Powered Expert Committee (HPEC) for Estimating the Investment Requirements
for Urban Infrastructure Services estimates Rs 3.92 million crores as the investment needs to provide
urban services conforming to national benchmarks for urban infrastructure over a period 2012-
31.The operations and maintenance costs would amount to another Rs.2 million crores (Ahluwalia
HPEC 2011).To address the fiscal stress, these bodies may have to resort to borrowings in recent
years, often with State Government guarantees, from Housing and Urban Development Corporation
(HUDCO), financial institutions, banks, open market, external lending agencies like the World Bank
and the Asian Development Bank. This has implications for both Central and State finances, as it
reflects the dependency of the ULBs and consequently, the provision of local public services on the
policies and programmes. This study is primarily focused to provide a compendium of financial
provisions for the Urban Local bodies and carry out a financial feasibility of wastewater reuse for
industry and agriculture.
Finance sources for Urban Local Bodies (ULBs)
ULBs have different sources of finances for urban infrastructure which depends on revenue, grants,
assignments and devolution by the State Government and grants from Central Government and
Finance Commissions, as well as market borrowings. The 74th Constitution Amendment Act, 1992
brought uniformity in the constitution of municipal bodies and empowered Indian municipal
corporations with the power and authority to operate as self-governing entities. While the
Constitution of India does provide for the devolution of tax revenue between the centre and states,
there is no provision that mandates devolution of tax revenue or confers the power to impose taxes
to urban local bodies.
The sources of tax and non-tax revenue are relatively small for municipalities to fund capital
expenditure. A study conducted by the Thirteenth Finance Commission reveals that ULBs’ share in
own taxes is around 2-3 percent and their total revenue is less than 0.75 percent of Gross Domestic
Product (GDP) leaving little room for capital expenditure. Different studies reveal that there are wide
differences among various ULBs in tax jurisdiction, degree of control exercised by the State
Governments in fixing the tax base, tax rate and tax exemption.
The government transfers can be in the form of (i) Central grants, (ii) State Finance Commission
grants (iii) Central Finance Commission assistance, and (iv) other grants from the states. These grants
can be tied to projects / programmes catering towards urban infrastructure development, or might
be untied trying to resolve losses / completion of such projects.
The commercial sources of borrowings include – (i) government institutions which are concerned
with financing for urban infrastructure development (like HUDCO, LIC, GIC etc.); (ii) schedules
commercial (public and private) banks; (iii) Sector specific municipal development funds which
include – Pan India Pooled Municipal Debt Obligation, State funds and State Financial Intermediaries;

8
(iv) capital markets – like issuance of bonds and pooled funds. In addition the GoI has opened the
doors towards targeting private equity in large scale through the PPPs. The different variants of PPPs
which are relevant for India range from Design Build Operate (medium term) to Build Operate and
Transfer (long term) type of models which has been discussed in the report.
Financial feasibility analysis of wastewater reuse for industry and agriculture in Solapur and
Vijayawada
The present report discusses the financial feasibility of the treating wastewater from two cities
(Solapur and Vijayawada) and reuse in agriculture and industry. The financial exercise is performed
after consultations with the relevant stakeholders in relation to Integrated Water Management at a
city level. The financial model developed for two cities with different tertiary level of treatment is
considered to be operational in BOT-type PPP with user fees being collected as a cost recovery
mechanism for the private entity. A brief synopsis of the results are present below.
Solapur
We have assumed that the initial adoption rate will be 10 percent for the first year as it takes time to
create awareness. Then each year there will be increment by 10 percent so that in 10 years it is
possible to sell the whole treated water. In this case the water demand for agriculture is met and
then rest is supplied to the industry. Moreover, we assume treating the whole 75 MLD water coming
out of secondary treatment and out of which in the first year 10 percent of the wastewater adopted
by industry and agriculture and thereby each year it increases by 10 percent. We are treating the
whole water from the beginning otherwise installed capacity will remain unutilized and environment
will be affected even if it is discharged in the canal due to lack of demand. With 10 percent adoption
rate and 25 percent corporate tax rate if we choose sand filtration as the tertiary technique then
industry has to pay Rs.25.85 /m3. If we consider reverse osmosis as the tertiary treatment
mechanism industry has to pay Rs. 33.60 /m3. In this context it is worth mentioning that
Vrishabhavathi Valley STP in Bangalore which operates under the supervision of BWSSB at a capcity
of 60 MLD, supplies tertiary treated wastewater to a number of industries. Its cost of production is
between Rs. 10-12 per kilo litre. Industrial tariff rate in Chennai industrial water tariff is Rs. 60/KL
and household tariff is Rs. 4/KL. Delhi Jal Board (DJB) is planning to sell water form its sewage
tretement plant located in Rithala to two power plants at approximately Rs. 8 per kilo litre. The
estimate of Hingorani (2011) reveals that under both public and private arrangements should be
within Rs. 4-14 and Rs.5-17 per kilo litre. Our tariff is little bit on the higher side as compared to
others mainly because of two reasons. One possible reason is that in the span of 8 years our cost has
increased. On the other hand, other studies didn’t consider the capital expenditure made for setting
up tertiary treatment plant. Hingorani (2011) considered only the capital expenditure incurred for
transporting water to industry and its pumping and maintenance cost. The other possible reason
could be they might have assumed full adoption in the beginning of the production. If the adoption
rate is high obviously the cost will go down substantially. But as the adoption rate increases to 20
percent the cost of tertiary treated water goes down to Rs.14.95 /m3 and Rs.22.70 /m3 for sand
filtration and reverse osmosis technologies respectively.
In the baseline scenario we assumed the PPP venture will be taxed at the rate of 25 percent which is
current corporate tax regime. But since this is development project PPP might be given exemption
from paying corporation tax. In case of zero taxation rule if the adoption rate is 10 percent cost to
the industry goes down to Rs. 22.30 and Rs.28.90 for sand filtration and reverse osmosis process.
Under the assumption of 20 percent adoption cost goes down further to Rs. 19.85 and Rs. 25.60 for
sand filtration and reverse osmosis process respectively.

9
In the baseline scenario we have assumed that cost of borrowing is 8 percent. But the interest rate
might fluctuate in future and if it rises to the level of 10 percent there will be 70-75 paisa increase in
the cost of treated water.
We have assumed that the initial adoption rate will be 10 percent for the first year as it takes time to
create awareness. Then each year there will be increment by 10 percent so that in 10 years it is
possible to sell the whole treated water. In this case the water demand for agriculture is met and
then rest is supplied to the industry. We are treating the whole water from the beginning otherwise
installed capacity will remain unutilised and environment will be affected even if it is discharged in
the canal due to lack of demand.
Vijaywada
There are two types of secondary treatment technologies exist in Vijaywada namely, UASB and
MBBR. With 10 percent adoption rate and 25 percent corporate tax rate if we choose sand filtration
as the tertiary technique then industry has to pay Rs.24.80/m3 and Rs. 31.60 for sand filtration and
reverse osmosis process respectively with UASB technology at the secondary level. The cost of
treated water will be slightly higher in case of MBBR technology which are 26.10 and 32.95 for sand
filtration and reverse osmosis respectively.
In this context it is worth mentioning that Vrishabhavathi Valley STP in Bangalore which operates
under the supervision of BWSSB at a capcity of 60 MLD, supplies tertiary treated wastewater to a
number of industries. Its cost of production is between Rs. 10-12 per kilo litre. Industrial tariff rate in
Chennai industrial water tariff is Rs. 60/KL and household tariff is Rs. 4/KL. Delhi Jal Board (DJB) is
planning to sell water from its sewage tretement plant located in Rithala to two power plants at
approximately Rs. 8 per kilo litre. The estimate of Hingorani (2011) reveals that under both public
and private arrangements should be within Rs. 4-14 and Rs.5-17 per kilo litre. Our tariff is little bit on
the higher side as compared to others mainly because of two reasons. One possible reason is that in
the span of 8 years our cost has increased. On the other hand, other studies didn’t consider the
capital expenditure made for setting up tertiary treatment plant. Hingorani (2011) considered only
the capital expenditure incurred for transporting water to industry and its pumping and
maintenance cost. The other possible reason could be they might have assumed full adoption in the
beginning of the production. If the adoption rate is high obviously the cost will go down
substantially. But as the adoption rate increases to 20 percent the cost of tertiary treated water goes
down to Rs.9.70/m3 and Rs.15/m3 for sand filtration and reverse osmosis technologies combined
with UASB secondary treatment technology. In case of MBBR it goes down to Rs.10.90/m3 and
Rs.16.20/m3.
In the baseline scenario we assumed the PPP venture will be taxed at the rate of 25 percent which is
current corporate tax regime. But since this is development project PPP might be given exemption
from paying corporation tax. In case of zero taxation rules if the adoption rate is 10 percent cost to
the industry goes down to Rs.21.25 and Rs.27.10 for sand filtration and reverse osmosis process
combined with UASB technology. Under the assumption of 20 percent adoption cost goes down
further to Rs.18.85 and Rs.24.00 for sand filtration and reverse osmosis process respectively
combined with UASB technology.
In case of zero taxation rule when the adoption rate is 10 percent cost to the industry goes down to
Rs.22.45 and Rs.28.20 for sand filtration and reverse osmosis process combined with MBBR
technology. Under the assumption of 20 percent adoption cost goes down further to Rs.19.95 and

10
Rs.25.10 for sand filtration and reverse osmosis process respectively combined with MBBR
technology.
In the baseline scenario we have assumed that cost of borrowing is 8 percent. But the interest rate
might fluctuate in future and if it rises to the level of 10 percent there will be marginal increase of 80
paisa in case of sand filtration technique with both the technologies and 50-105 paisa in case of
reverse osmosis in the cost of treated water.

11
Financial sources of the ULBs – Resources for Municipal governance
Introduction
Urban Local Bodies directly influence the welfare of the people by providing civic, social and
economic infrastructure services and facilities in both urban and peri-urban areas. Given their
strategic position in delivering services in the hierarchy of Government set up, following the
Constitutional (73rd & 74th) Amendment Acts, more functions, powers and resources have been
provided to them. The Constitution (74th Amendment) Act, 1992 has mandated grassroot level
democracy in urban areas by assigning the task of preparation and implementation of plans for
economic development and social justice to elected municipal councils and wards committees. It has
incorporated the Twelfth Schedule into the Constitution of India containing a list of 18 functions as
the legitimate functional domain of Urban Local Bodies (ULBs) in the country. In view of this
position, the demands placed by the public on municipal authorities for the provision of various civic
services have increased considerably.
At the same time urbanization is an important ingredient of economic development. The trend
towards greater urbanization is observed across the developing world. Going by this trend, India is
slated to have 50 per cent of its population living in cities and towns in the next few decades, up
from the current proportion of about 30 per cent. Although India’s urban population has been
growing, the level and pace of urbanization have been low in comparison with other developed and
developing countries. After liberalization of the economy, India made strides in economic growth; a
large part of it has been through the contribution of urban areas.
However, over a period of time, the functions and responsibilities of LBs have increased considerably
without commensurate enhancement of their resource base. While the Twelfth Schedule of the 74th
Amendment Act, 1992 demarcates the functional domain of municipal authorities, the Amendment
Act has not provided for a corresponding ‘municipal finance list’ in the Constitution of India. The
assignment of finances has been completely left to the discretion of the State Governments,
excepting in that such assignment shall be ‘by law’. This has resulted in patterns of municipal
finances varying widely across States and in a gross mismatch between the functions assigned to the
ULBs and the resources made available to them to discharge the mandated functions. The ULBs
depend on the respective State Governments for assignment of revenue sources, provision of inter-
governmental transfers and allocation for borrowing with or without State guarantees.
Constitutionally built-in imbalances in the functions and finances eventually reflect in the high
dependency of urban local bodies on State Governments and of the State Governments on the
Central Government. Constitutionally built-in imbalances in functions and finances assigned to
various levels of government eventually reflect in the high dependency of local bodies on State
Governments and the latter, in turn, on Central Government for funds.
Under the constitutional scheme of fiscal federalism, funds from the Central Government are
devolved to the State Governments. Following the recommendations of the State Finance
Commissions (SFCs) and taking into account the devolutions made by the Central Finance
Commission (CFC), the State Governments are required to devolve resources to their local bodies.
However, due to endemic resource constraints, they have not been in a position to allocate
adequate resources to their ULBs. This is further compounded by the fact that even the existing
sources of revenues are not adequately exploited by many of the ULBs. The above factors have led
to rising fiscal gaps in these institutions, with resources drastically falling short of the requirements
to meet the backlog, current and growth needs of infrastructure and services in cities, and, thereby,
failing to meet with the expectations of citizens and business. To address the fiscal stress, these

12
bodies may have to resort to borrowings in recent years, often with State Government guarantees,
from Housing and Urban Development Corporation (HUDCO), financial institutions, banks, open
market, external lending agencies like the World Bank and the Asian Development Bank. This has
implications for both Central and State finances, as it reflects the dependency of the ULBs and
consequently, the provision of local public services on the policies and programmes. This study is
primarily focused to provide a compendium of financial provisions for the Urban Local bodies and
carry out a financial feasibility of wastewater reuse for industry and agriculture.
Key Financial Resources for municipal governance
The resource base of urban local bodies (ULBs) typically consists of their own tax and non-tax
revenue, state revenue, grants and subsidies from the central and state governments, loans from
state governments, loans from banks and other financial institutions and market borrowings.
1. Own revenues – consisting of tax (property tax being the major constituent) and non-tax
revenues
The 74th Constitution Amendment Act, 1992 brought uniformity in the constitution of municipal
bodies and empowered Indian municipal corporations with the power and authority to operate as
self-governing entities. While the Constitution of India does provide for the devolution of tax
revenue between the centre and states, there is no provision that mandates devolution of tax
revenue or confers the power to impose taxes to urban local bodies. The following table delineates
tax and non-tax revenue sources for municipal corporations:
Table 1. 1: Tax and Non-Tax revenue of the ULBs
Sources of Tax Revenue in Indian Cities from Municipal Acts
Sources of Non-Tax Revenue in Indian Cities from Municipal Acts
Advertisement tax Betterment fees
Betterment / development tax Birth / death registration fees
Cable operator tax Dangerous and Offensive Trade license fees
Drainage tax Duty on transfer of immovable property
Education tax Fee for building application
Entertainment tax Fee for fire services
Entry/terminal tax Fees for registration of animals
Environment tax / land revenue Fees on dogs
Latrine tax Market fee
Octroi (local taxes on goods entering the city) Mutation fees
Passengers and goods tax Parking fees
Pilgrim tax Penalty for late tax payment
Profession tax Receipts from fines
Property tax Receipts from interest
Sanitation/ conservancy tax Rent from municipal properties
Scavenging tax Sanitation/ conservancy charge
Tax/toll on animals Slaughterhouse fees
Taxes on vehicles Stamp duty
Timber tax Surcharge on sales tax
Toll/tax on bridges/vehicles Water charges Source: 74th Amendment, Constitution of India

13
2. Grants, assignments and devolution by the State Government and grants from Central
Government and Finance Commissions
This includes – (i) Plan grants made available through planned transfers from the upper tier of
government under various projects, programmes and schemes; (ii) Non-plan grants made available
to compensate for the loss of income and some specific transfers.
Two of the most prominent schemes through which ULBs can access funds for urban infrastructure
are –
Atal Mission for Rejuvenation and Urban Transformation (AMRUT), focussing on water
supply and sewerage improvement. The mission also includes other components, such as
improving storm water drains to reduce flooding; pedestrian, non-motorised and public
transport facilities; parking spaces; and green spaces, parks and recreation centres,
especially for children. AMRUT has adopted a step-by-step approach wherein the first step
and primary objective are to achieve universal coverage of assured water supply and
sewerage connections. Once the first step is successfully completed, other benchmarks will
be targeted.
Smart Cities Mission (SCM), aimed at developing smart solutions for selected urban areas.
Smart solutions will improve the provision of urban infrastructure and services; they cover
water and sanitation, electricity, urban mobility and public transport, affordable housing, IT
connectivity and digitalisation, e-governance and citizen participation, sustainable
environment, citizen safety, and health and education. SCM has adopted a compact area
development approach wherein the focus is on area-based development. This includes
transforming existing areas in identified smart cities, including slums, into better planned
ones. It also includes the development of new areas around the smart cities to
accommodate the expanding population in urban areas. Additionally, the mission
emphasizes developing models that incorporate smart solutions, innovation, best practices,
and new technology, and that use data and evidence in decision-making.
3. Non Grant financial sources/loans for urban infrastructure
Financing of urban infrastructure typically requires not only a large upfront capital investment, but
also periodic replenishment expenditure and annually recurring operations and maintenance
expenditures.
Instruments for non-grant financial sources
Government Institutions
Borrowing by ULBs was typically through guaranteed instruments financed by government-owned
institutions, such as the Housing and Urban Development Corporation Limited (HUDCO) and Life
Insurance Corporation (LIC). Both HUDCO and LIC were mandated by Government of India directives
to lend a certain amount to specific sectors, including the urban sector. HUDCO has been a major
provider of long-term finance for housing and urban infrastructure. By leveraging central
government funds and raising resources directly from the capital market, HUDCO has increased its
financing of urban infrastructure projects, particularly water supply, roads and other commercial
projects. HUDCO’s preferred mode of financing is through the state housing boards, development
authorities and municipal corporations. All of its financing carries state government guarantees.
Because local government lending involves a specialized kind of financial analysis and its

14
development lags behind lending to central government and large private firms, specialized financial
institutions have been created to meet the financing needs of local governments.
Figure 1. 1: Commercial Sources of borrowings of ILBs
The LIC and GIC have extended term loans to parastatal agencies for urban infrastructure projects,
on the basis of state government guarantees. The role of financing and insurance companies has
thus been significant in funding and financing urban infrastructure projects. Their lending for urban
infrastructure and services has been characterized by the directed credit regime under which
different financial institutions were mandated to invest in specific priority sectors. The LIC, for
example, was required to invest 25 percent of its annual accretion of funds to social sectors,
including water and sanitation. However, financing under this route has reduced in recent years, as
explicit State Government guarantees reduced in the context of fiscal pressures on State
Governments.
Scheduled commercial banks
Currently, India has 86 Scheduled Commercial Banks (SCBs) – 18 public sector banks (that is, with the
Government of India holding a stake), 22 private banks (these do not have government stake; they
may be publicly listed and traded on stock exchanges) and 46 foreign banks. SCBs with state or GoI
ownership are the most active. Lately, municipal governments have accessed borrowings from banks
(government-owned banks and private banks), insurance companies and state development
authorities. Since the tenure of commercial banks liabilities is generally short/medium term (< 3
years), municipal governments borrow from these sources to bridge financing gap arising in their
capital expenditure programs.
Sector Specific Municipal Development Funds/Facilities
Pan India Pooled Debt Obligation Facility (PMDO)
The Pooled Municipal Debt Obligation (PMDO) facility has been structured through a partnership of
15 Banks/FIs including IL&FS with a corpus of Rs 2750 cr to primarily finance urban local bodies and
Special Purpose Vehicles (SPVs) promoted under PPP arrangements, to implement urban
infrastructure projects for Water Supply and Sewerage, Solid Waste Management, Roads and Urban
Transport, Environmental Projects, Healthcare and Education etc. The underlying strategy of the
PMDO is to improve credit worthiness and bankability of urban infrastructure projects, and use

15
efficient transaction structures built on robust risk management processes, that have been
successfully replicated in other Infrastructure sectors. The local bodies are encouraged to conceive
and implement projects in the Public Private Partnerships (PPP) framework based on long-term
concession agreements, to make service delivery more efficient and to utilize private sector funding
by tapping the commercial debt and equity market. This arrangement is expected to relieve the
urban local bodies of substantial investment burden on their books and to make scarce public
resources available for core civic services. The contributors to the corpus includes –
Table 1. 2: Financial Institutions associated with PMDO
Banks Financial Institutions
Allahabad Bank Bank of India Canara Bank Corporation Bank Dena Bank Indian Bank Oriental Bank of Commerce Union Bank of India Vijaya Bank Syndicate Bank IDBI
IIFCL Life Insurance Corporation of India IL&FS Financial Services Ltd.
Source: http://www.iuiml.com/html/pmdo.html
State Urban Development Funds
Some states created state-level urban development funds to channelize long-term concessional lines
of credit from development institutions and multi-lateral agencies to ULBs. For instance, the Tamil
Nadu Urban Development Fund (TNUDF) created to channelize concessional lines of credit available
in a non-guaranteed manner, has accessed long-term lines of credit from World Bank, KFW etc. and
has managed a good loan recovery performance for more than 20 years. Odisha recently created the
Odisha Urban Infrastructure Development Fund (OUIDF) on a similar model. Several other states
have tapped multi-lateral lines of credit, albeit on guaranteed mode for financing urban
infrastructure programs.
State level Financial Intermediaries
State level Financial Intermediaries has not yet been utilized much in India. Two most prominent
examples which have mixed public oversight with private finance—are the Tamil Nadu Urban
Development Fund (TNUDF) and the Karnataka Urban Infrastructure Development and Finance
Corporation (KUIDFC). The Tamil Nadu Urban Development Fund (TNUDF) is a financial intermediary
facilitating access to capital markets for the financing of infrastructure by urban local bodies (ULBs,
which include municipal corporations, municipalities, and town panchayats) in the Indian state of
Tamil Nadu. It was established in 1996 as a trust fund, motivated by the government of Tamil Nadu’s
successful experience with the Municipal Urban Development Fund financed by the World Bank. The
fund is managed by Tamil Nadu Urban Infrastructure Financial Services Limited (TNUIFSL), a public
limited company with equity participation from the state of Tamil Nadu and various private financial
institutions (ICICI Bank, Housing Development Finance Corporation Limited, and IL & FS Financial
Services Limited), making it a PPP with the private sector holding the majority. This arrangement
allows for public-sector involvement but keeps management of the fund at a distance from the
government.

16
The TNUDF’s financial resources consist of capital provided by the partners as well as funding from a
World Bank line of credit, market borrowing, and other institutional borrowing—from the Japan
Bank for International Cooperation and KfW (German Development Bank), among others. The fund
makes a profit and performs well, with a loan recovery rate of 100% in the financial year 2015/16. Its
institutional creditors are repaid through the government of Tamil Nadu and the Indian government.
The technical assistance and capacity building provided by TNUDF increase the fiscal, technical, and
managerial capacities of the ULBs, for example with regard to accrual-based accounting, collection
efficiency, effective service delivery, and tariff rationalization, which is particularly beneficial for
smaller ULBs. This increases transparency and makes ULBs more attractive for private investors. It
also stimulates further reforms in accounting, tax mobilization, e-governance, decentralization, etc.
This public–private debt facility helps to build the creditworthiness of ULBs and advances the
development of a municipal debt market, but the lending policies are somewhat rigid. They do not
allow for the resetting of interest rates and are not conducive to early repayment of the principal,
which reduces their competitiveness with pure market models in the long run.
Similarly, KUIDFC a public-sector company responsible for developing and implementing urban
infrastructure projects. It was incorporated in 1993 with an aim to assess the needs of cities and
towns, formulate projects, act as a nodal agency for project implementation and raise funds for
infrastructure. KUIDFC was in charge of managing the Karnataka Water and Sanitation Pooled Fund
(KWSPF), allowing access to the capital market in the Greater Bangalore Water Supply and Sanitation
Project.
Specialized Infrastructure Finance Entities
Government of India approved a scheme for financing viable infrastructure projects through a
Special Purpose Vehicle called the India Infrastructure Finance Company Ltd. Accordingly, India
Infrastructure Finance Company Ltd (IIFCL) was established in January 2006 as a wholly owned
Government of India company and commenced its operations from April 2006.
Infrastructure Development Finance Company Limited (IDFC) was set-up as a company focused on
development and financing of private infrastructure. Government of India earmarked an amount of
Rs 10 billion ($ 20 million) as its contribution to this company. IDFC was conceived as a public-
private-partnership with GOI as a 40% equity shareholder. IDFC’s balance sheet grew rapidly with
CAGR of disbursements at the rate of 48% in the period FY2005 – FY2008. While in the initial years
telecom was the mainstay, the portfolio gradually shifted to higher quantum of assets in energy and
transport sectors.
Infrastructure Leasing & Financial Services Limited (IL&FS) is one of India’s leading infrastructure
development and finance companies. IL&FS was promoted by the Central Bank of India (CBI),
Housing Development Finance Corporation Limited (HDFC) and Unit Trust of India (UTI). Over the
years, IL&FS has broadbased its shareholding and inducted institutional shareholders including State
Bank of India, Life Insurance Corporation of India, ORIX Corporation – Japan and Abu Dhabi
Investment Authority. IL&FS has a distinct mandate – catalyzing the development of infrastructure in
the country. The organization has focused on the commercialization and development of
infrastructure projects by provision of value-added financial services. IL&FS has conceived and
promoted a pan-India facility for financing urban infrastructure – Pooled Municipal Debt Obligation
Facility.

17
Capital markets
Municipal Bonds
While commercial loans may also be tapped by ULBs to address this requirement, Municipal Bonds
when structured well, typically provide greater flexibility in terms of tenure and repayment options.
Peterson (2003) elaborates on the benefits of municipal bonds over borrowing from a commercial or
municipal bank. First, banks must establish a ‘relationship banking’ scenario; however, purchasers of
bonds are not obligated to have a long-term relationship with the issuer. Moreover, market
competition of this kind that focuses on the cost of capital is expected to produce savings for
experienced issuers. Second, while the loan departments of banks are required to possess
proprietary information regarding a particular ULB—and they must develop techniques to ascertain
the creditworthiness of the ULB—a municipal bond market relies on public disclosure of financial
and other information by the ULB. Credit rating agencies use extensive methodologies to assess the
creditworthiness of issuers, including ULBs, in bond markets. Third, most commercial banks focus on
short-term lending, which is appropriate for incremental financing but not for long-term financing.
Municipal Bonds are marketable debt instruments issued by ULBs in India either directly or through
any intermediate vehicle (Corporate Municipal entity/statutory body/special purpose distinct entity)
with an objective to on-lend towards projects implemented by the ULB. The funds raised may be
utilized towards implementation of capital projects, refinancing of existing loans, meeting working
capital requirements etc., depending on powers vested with the ULBs under respective municipal
legislation. The rationale of bond financing emerges from the following –
1. Leverage future cash flows to finance capital expenditure: ULBs are often required to fund
capital projects that require huge capital investments, larger than available resources. Bonds
help ULBs to access through finance market investors promising to pay a definite sum of
money (as interest/coupon rate and principal after a specified time period) against the
borrowing.
2. Attract new long-term investors and resources into urban projects: Bond programs enable
ULBs to attract long-term sources and resources from a variety of investors including
insurance funds, retirement funds, mutual funds, and external funds.
3. Build a credit profile and credit history: Initial bond issues may require extensive structuring
to achieve a good credit rating, by doing regular issuances, ULBs can gradually build a credit
profile and history that can bring down financing costs and credit enhancements needs in
the medium term.
4. Increasing efficiency and delivery of services: (i) Debt financing has an inherent advantage
over grants from higher levels of government (Report on Indian Infrastructure and Service,
2011) since it entail an obligation to repay. Hence, ULBs are constrained to duly plan, design
and execute projects with the objectives of obtaining adequate revenues, minimizing
operation and maintenance (O&M) costs, and generating a surplus over the O&M costs,
which is sustained over the lifetime of the asset created. On the other hand, grants have a
tendency to result in soft budget constraints, leading to wasteful expenditure. (ii) Exposure
to capital markets require a strong set of disclosure and information sharing. Therefore this
pushes the ULBs towards implementing stringent reporting, disclosure standards,
monitoring of quality of services (implying greater transparency and accountability towards
citizens).
5. Flexibility of both ULBs and investors: The municipal bond mode of financing allows both the
borrowers and the lenders to have greater flexibility. Local government bond issuers are
likely to be less restricted by annual budget cycles and the capital grants’ decisions of higher

18
levels of government. Further, they can unbundle their functions, which enables them to
make separate decisions about the placement of their liquid deposits and about obtaining
advice regarding the financial and/or technical components of their infrastructure projects
(Peterson, 2003). However, it should be noted that the danger of such unbundling is that a
credit partner who understands various aspects, especially the financial impacts of different
activities of the ULB on each other, would be absent (Peterson, 2003). The flexibility
available to the lenders arises out of the possibility of trading municipal bonds prior to the
end of their tenor in the secondary bond market. Liquidity in such a market is essential for
the development of the primary municipal bond market.
Types of Bonds issued in India
Municipal Bonds are broadly classified under two categories –
General Obligation Bonds are bonds issued against the credibility and tax revenues of the
issuing municipality. These bonds are issued to raise funds for the projects that do not
directly generate revenue unlike roads, railways, etc. Payment to bondholders is done by
using the tax revenues generated by the municipality.
Revenue Bonds are issued to finance revenue-generating projects and the revenue thus
generated is used to repay bondholders.
All Municipal Bonds issued by ULBs have been more in nature of general obligation bonds, financed
by escrowing property tax or other internal ULB revenues. Most Municipal Bonds in India have been
raised to finance water supply and sewerage projects. This is because the Municipal Acts allow levy
of user charges, it is technically easy to measure consumption, bill and collect user charges and
penalise for non-payment. Further, the amount and frequency of expected revenues can be
predicted with some certainty.
Table 1. 3: List of bonds issued in India
Taxable Municipal Bonds in India –
Year City Amount (INR Crore)
Project Type
1998 Ahmedabad 100 Sanitation and Water Supply
1999 Ludhiana 10 Sanitation and Water Supply
1999 Nashik 100 Sanitation and Water Supply
2001 Nagpur 50 Water Supply
2001 Madurai 30 City Roads
2004 Visakhapatnam 20 Water Supply
Tax-free Bonds in India
Year Municipal Bodies Amount (INR Crore)
Project Type
2002 Ahmedabad Municipal Corporation
1,000 Water supply and sewerage project
2003 Hyderabad Municipal Corporation
825 Road construction and widening
2002 Nashik Municipal Corporation
500 Underground sewerage scheme and stormwater drainage system
2004 Visakhapatnam Municipal Corporation
500 Water supply system
2003 Hyderabad Metropolitan 500 Drinking water project

19
Water Supply and Sewerage Board
2004 Ahmedabad Municipal Corporation
580
Water supply project, stormwater drainage project, road project, bridges and flyovers
2003 Chennai Metropolitan Water Supply & Sewerage Board
420 Chennai water supply augmentation project
2005 Chennai Metropolitan Water Supply & Sewerage Board
500 Chennai water supply project
2005 Chennai Municipal Corporation
458 Roads
2005 Ahmedabad Municipal Corporation
1,000 Roads and water supply
2007 Nagpur 212 Nagpur water supply and sewerage project
Source: Vaidya and Vaidya (2010) Market-Based financing of Urban Infrastructure in India. Book chapter in Kochar and Ramachandran ed. (2010), Building from the bottom. Academic Foundation, New Delhi, India.
Challenges in Issuance of municipal bonds
Although municipal bond issuance dates back to mid-1990s in India, the number and the value of the
issuances are relatively small. During 1998-2010, 25 municipal bond issue were issued in India. These
include taxable and tax-free bonds and pooled financing issues raising approximately INR 2700
Crores (USD 386 million) worth of municipal bonds. This is insignificant compared to the INR 120+
lakh Crores (USD 1.7 trillion) Indian bond market. The summary of key problems/constraints faced
by ULBs which restrict the capital market issuance are provided below.

20
Figure 1. 2: Challenges for Municipal bonds in India
While municipal bonds are perceived as an asset class for risk-averse investors, some of the inherent
risks of municipal bonds (similar to other fixed income instruments) include the following.
a. Credit Risk: This risk arises when the issuer fails to make coupon payments and/or principal
repayment as per the agreed schedule. Municipal bonds are rated by credit rating agencies
to compute the probability of default and measure the associated credit risk relative to
other bonds. Investor capital is further preserved by way of bond insurance.
b. Call risk: If a municipal bond is callable, the issuer has the option to repay the principal
before its maturity date. An issuer may choose to call the bond if interest rates decline, and
then refinance it at a lower rate. This would terminate expected cash flows prematurely.
c. Inflation risk: In an economy plagued by high inflation, interest rates are expected to rise.
This would erode value of existing bonds, paying out fixed coupon rates.
d. Interest-Rate Risk: Since municipal bonds pay out fixed coupon rates, investors receive lower
than market yield, if interest rates move upwards. The same risk may be mirrored for tax
free municipal bonds, if investors expect a reduction in tax rates.
e. Liquidity Risk: In the absence of an active market for a particular municipal bond, the
investor may be forced to hold the bond or liquidate it at a lower price.
Municipal Bonds: Pre-Requisites for Effective Issuance
Financial Discipline and Information disclosure: Long term investors are particularly demanding on
aspects like accounting discipline, quality of financial reporting and periodicity/level of information
dissemination and disclosures. This entails –
Threshold maturity of accounting systems incorporating accrual accounting principles,
Timely finalization and audit,

21
Timely disclosure of high quality information
SEBI (Issue and Listing of Debt Securities by Municipalities) Regulations, 2015 require ULBs to
prepare accounting statements in accordance with the National Municipal Accounts Manual or the
State Manual for at least last three years (Sections 2.2.1 for salient features of SEBI Regulations and
3.1 for aspects related to the financial discipline and disclosure required by ULBs).
Ring-fenced projects: Well-prepared ring-fenced projects with approved DPRs are an important pre-
requisite for successful bond financing structure. This creates a confidence within investors about a
clear modality about use of the funds.
Shelf of projects for sustainable financing: In order to attract sustained investor interest in Municipal
Bonds as a source of financing of infrastructure projects and services, ULBs would be expected to
view the Bonds as an on-going alternative financing channel, rather than as a one-off initiative.
Therefore, a ULB which presents a shelf of projects will help long-term investors identify potential
investment avenues beyond the first issuance and incentivize them to allocate resources on a
regular basis.
Threshold bond issuance size: While the assessed debt capacity of a ULB is a primary determinant in
sizing a bond issue, supply-side considerations and transaction costs also need to be factored in.
Since bond issuance involves relatively higher transaction costs, a minimum threshold size of
issuance is preferable. Further, since, long term funds are expected to be major players in the
Municipal Bond market, it would be prudent to factor in market appetite while sizing up a bond
issue.
Escrowed Revenues: Addressing risk perception of investors is crucial. Setting up of an escrow
mechanism is one of the key solutions for this. The objective of escrowing is to earmark specific
revenue streams of the ULB for debt servicing to improve visibility and certainty of cash flows to
Investors, thereby improving credit quality and issue rating of the Bonds. The identified revenue
streams would have to be sufficient to meet the repayment obligations of the ULB.
Credit Ratings
Details of cities and towns and respective Credit Ratings are as below:
Table 1. 4: Credit ratings of the cities in India
Credit Rating
Cities/Towns
AA+ (3)
New Delhi Municipal Council (NDMC), Navi Mumbai and Pune
AA (3) Ahmedabad, Visakhapatnam and Greater Hyderabad Municipal Corporation
AA- (4) Surat, Nashik, Thane and Pimpri-Chindwad
A+ (5) Indore, Kishanganj(Rajasthan), Kolkata, Vadodara(Gujarat) and Warangal(Telangana)
A (1) Jhunjhunu (Rajasthan)
A-(8) Alwar, Bhiwadi, Beawar, Jaipur(Raj), Bhopal,Jabalpur(MP), Mira Bhayandar(Maha) and New Town Rajarhat(W.Bengal)
BBB+ (5) Ajmer , Kota and Udaipur(Rajasthan), Ludhiana(Punjab) and Jamnagar(Guj)
BBB (14) Kakinada, Anantapur, Kurnool and Tirupati (Andhra Pradesh), Davanagere and Hubbali-Dharwar(Karnataka), Kochi and Trivendrum (Kerala), Panaji (Goa), Kolhapur and Nagpur(Maharashtra), Jodhpur, Nagaur and Tonk(Rajasthan)
BBB- (12) Amaravati (Maharashtra), Belgavi (Karnataka), Bharuch and Bhavnagar (Gujarat),

22
Bharatpur, Bhilwara, Bikaner and Hanumangarh(Rajasthan), Chittor and Cuddapah (Andhra Pradesh), Cuttack (Odisha), Ranchi (Jharkhand).
BB+ (14) Proddatur, Nandyal and Nellore (Andhra Pradesh), Kollam and Kozhikode (Kerala), Kalol, Nadiad and Navsarai (Gujarat), Nanded and Solapur (Maharashtra), Gangapur City, Dhaulpur, Pali and Sawai Madhopur (Rajasthan)
BB (14) Adoni and Tadipatri (Andhra Pradesh), Dwaraka (Gujarat), Aizawal (Mizoram), Thrisur (Kerala), Berhampur, Rourkela and Sambhalpur (Odisha), Bundi, Churu, Chittorgarh, Hindaun, Jodhpur and Sujangarh (Rajasthan)
BB- (7) Adityapur, Chas, Deogarh and Giridh (Jharkhand), Mori (Gujarat), Baran and Jhalawar (Raj)
B+ (3) Baripada and Puri (Odisha) and Hazaribagh (Jharkhand)
B (1) Bhadrak (Odisha)
Pooled Finance Development Scheme
In 2006, GoI approved the Pooled Finance Development Fund Scheme (PFDF) to provide credit
enhancement to ULBs to access market borrowings through State-Level-Pooled Finance Mechanism.
The broad objectives are –
1. Facilitate development of bankable urban infrastructure projects through appropriate
capacity building measures and financial structuring of projects.
2. Facilitate Urban Local Bodies to access capital markets through Pooled Financing Bonds on
behalf of one or more identified ULBs for investment in urban infrastructure projects, by
providing credit enhancement grants to State Pooled Finance Entities (SPFEs).
3. Reduce the cost of borrowing to local bodies with appropriate credit enhancement
measures and through restructuring of existing costly debts.
4. Facilitate development of Municipal Bond Market.
The SPEFs could either be a trust or a Special Purpose Entity, provided that the entity is only a pass
through vehicle. The basic advantage of setting up of SPFE would be that it would enable the ULBs to
enter the bond market on a regular basis and take advantage of scaled up operations. Further,
efficient SPFEs can generate fair degree of goodwill in the bond market and may be able to achieve
much higher levels of efficiency in operations than individual ULBs. Most importantly, it shall be able
to hedge risks against much larger spectrum of activities than individual ULBs. The Central
Government would support SPFEs through the PFDF. Of the funds made available with the Central
Government for PFDF, 5% would be utilized for project development assistance. Balance 95% would
be utilized for contribution to the Credit Rating Enhancement Fund (CREF) to improve the credit
rating of the Municipal Bonds to investment grade.
Several states such as Andhra Pradesh, Karnataka, Nagaland, Orissa, Rajasthan, Tamil Nadu, Kerala
and Assam have set up SPFE to implement the pooled financing scheme. In Tamil Nadu, the state
government has notified the Tamil Nadu Urban Development Fund (TNUDF) as the designated State
Pooled Finance Entity. In Karnataka, the nodal agency notified for pooled financing is the Karnataka
Urban Infrastructure Development Finance Corporation (KUIDFC). The “Pooled Fund” raised by the
SPFE will be lent to specific projects undertaken by one or more ULBs. The borrowing is done
through a Special Purpose Vehicle (SPV) that is set up by the SPFE. Investors in the pooled fund
benefit from credit enhancements such as escrow account, debt reserve and third party guarantees.

23
Institutional Framework for Pooled Finance
Figure 1. 3: Flow of funds in the Pooled Finance Development Scheme
Source: Ministry of Urban Development, “Pooled Finance Development Scheme Toolkits”, 2008
Targeting private capital with the help of Public Private Partnerships (PPPs)
The Government of India has been promoting public private-partnerships (PPP) as an effective tool
for bringing in private sector efficiencies for creation of economic and social infrastructure assets
and for delivery of quality public services. For financial support to PPPs in infrastructure a Viability

24
Gap Funding (VGF) Scheme has been implemented. The India Infrastructure Project Development
Fund (IIPDF) was launched in December 2007 to facilitate quality project development for PPP
projects and ensure transparency in procurement of consultants and projects. The National PPP
Capacity Building Programme was launched in December 2010. The following schematic diagram
presents the concept of accessing the funds for PPP projects.
Figure 1. 4: Access to IIPDF and VGF
India Infrastructure Project Development Fund (IIPDF)
IIPDF is a Revolving Fund with a corpus of 100 crore to quicken the process of project preparation.
The corpus fund has been created in Department of Economic Affairs, Ministry of Finance,
Government of India for supporting the development of credible and bankable Public Private
Partnership (PPP) projects that can be offered to the private sector. The procurement costs of PPPs,
and particularly the costs of Trasactions Advisors1, are significant and often pose a burden on the
budget of the Sponsoring Authority2. Department of Economic Affairs (DEA) has identified the IIPDF
as a mechanism through which Sponsoring Authority will be able to source funding to cover a
portion of the PPP transaction costs, thereby reducing the impact of costs related to procurement on
their budgets. From the Government of India’s perspective, the IIPDF must increase the quality and
quantity of ‘bankable projects’ that are processed through the Central or States’ project pipeline.
The expenses by the Sponsoring Authority which might be included are as follows - feasibility
studies, environment impact studies, financial structuring, legal reviews and development of project
documentation, including concession agreement, commercial assessment studies (including traffic
studies, demand assessment, capacity to pay assessment), grading of projects etc. required for
achieving Technical Close of such projects, on individual or turnkey basis, but would not include
expenses incurred by the Sponsoring Authority on its own staff. To seek financial assistance from the
IIPDF it would be necessary for the Sponsoring Authority to create and empower a PPP Cell to not
1 Consultants hired through a transparent system of procurement by the sponsoring authorities to assist them
in designing the project and/or providing technical, financial and legal input for the project design, and providing advice for the management of the process of procuring the private sector partner for the PPP project. These include Transaction Advisers selected from the panel of Transaction Advisers announced by DEA from time to time. 2 Central Government Ministries/Departments, State Governments, Municipal or Local Bodies, Public Sector
Undertakings or any other statutory authority (such as the Delhi Development Authority).

25
only undertake PPP project development activities but also address larger policy and regulatory
issues of Sponsoring Authorities. The Fund will assist ordinarily upto 75 percent of the project
development expenses to the Sponsoring Authority. On successful completion of the bidding
process, the project development expenditure would be recovered from the successful bidder.
However, in case of failure of the bid, the assistance would not be recovered. The Sponsoring
Authority as a commitment needs to co-fund 25 percent of the development cost (which would
include the cost of the prefeasibility study to determine whether the project is amenable to PPP).
The IIPDF is administered through an Empowered Institutions which will (i) select projects for which
project development costs will be funded; (ii) set the terms and conditions under which the funding
will be provided and recovered and (iii) set milestones for disbursing and recovering (where
appropriate) the funding. Disbursements by the IIPDF will be made in instalments based on
milestones achieved. These milestones will be those set out in the MFC and approved by the EI.
Initially the Sponsoring Authority need to pay for the Technical Advisors for a pre-feasibility get an
approval from the EI based on which they receive the fund for further procurement study of the PPP.
Within 3 weeks a decision of unconditional funding approval, approval subject to certain conditions
or no funding (the conditions may also include confirmation of project details before a commitment
of funding, and an assessment of the affordability and value-for-money implications of recovering
procurement costs as a success fee from the project) is being made after the application is being
made for funding from IIPDF.
Viability Gap Funding (VGF) for private entities in PPP initiatives
To remove the shortcomings of (i) non-availability of infrastructural projects, (ii) non-viability of
project due to long gestation gap and limited financial returns, and (iii) to increase flow of private
sector resources (both financial, technological and managerial); the Government of India (GoI) is
promoting PPPs through a special support known as ‘viability gap funding’ (VGF). Primarily, the main
aim of this support is to reduce the capital cost of the project through credit enhancement and to
make them viable and attractive for private investors through supplementary grant funding.
Provisions of this facility is made on a year-to-year basis.
GoI has established a VGF to financially aid the PPP infrastructure projects in the form of grants, one
time or deferred and is administered through the Ministry of Finance. Provision has been made to
provide up to 20 percent of the total project cost as capital gap to meet the funding gap. Further, in
such projects the sponsoring agency/department/state can provide an additional 20 percent of the
project cost VGF support.
VGF scheme aims towards addressing the following concerns –
The issue of ‘affordability’ of user-fee
Leverage government grant for the commercial viability of the project
Promote user-pay principle
Ensure market-based selection of the developer/promoter
Promote the concept of developer (in place of ’contractor’) and address project life-cycle
costs
Applicability of the VGF –
1. These PPP projects can be posed by the central ministry, state governments and statutory
authorities (like urban local bodies – Municipal Authorities and Councils) who owns the

26
underlying asset or private agency with sponsorship form the relevant central or state
government agency.
2. This scheme will apply only if contract/concession is awarded in favour of private sector
company in which 51 percent or more of the subscribed and paid-up equity is owned and
controlled by a private entity.
3. A private company is eligible for VGF if it is selected through a competitive bidding and is
responsible for financing, construction, maintenance and operation during the concession
period.
4. The project should provide a service against a pre-determined tariff or user charge.
Criteria for funding –
The project must be implemented (constructed, maintained, and operated) during the
project term by an entity with at least 40 percent private equity.
The project must belong to one of the following sectors –
- Roads, railways, seaports airports,
- Power,
- Water supply, sewerage, and solid waste management in urban areas,
- International convention centres.
New sectors added include – (i) irrigation, (ii) terminal markets, (iii) common infrastructure
in agricultural markets, (iv) soil testing laboratories, and capital investment in fertilizers, (v)
Oil and Gas, (vi) telecommunications.
The implementing agency must be selected through a transparent and open competitive
process. The extent of the VGF shall be determined on the basis of the net present value of
the actual VGF required. For this purpose and all calculations, the rate of discount shall be
rate of interest on the 10-year gilts on the date of the submission of the bids.
Funding –
VGF can take various forms, including but not limited to capital grant, subordinated loans, operation
and maintenance (O&M) support grants or interest subsidy. A mix of capital and revenue support
may also be considered. However, the clauses need to be supported through the funding process –
1. The funding is to be disbursed contingent on agreed milestones, preferably physical, and
performance levels being achieved as detailed in funding agreements.
2. The funding is to be provided in instalments, preferably in the form of annuities, and with at
least 15 percent of the funding to be disbursed only after the project is fully functional.

27
VGF Process where VGF sought is up to Rs 100 crore

28
VGF Process where VGF sought is between Rs 100 – 200 crore
29
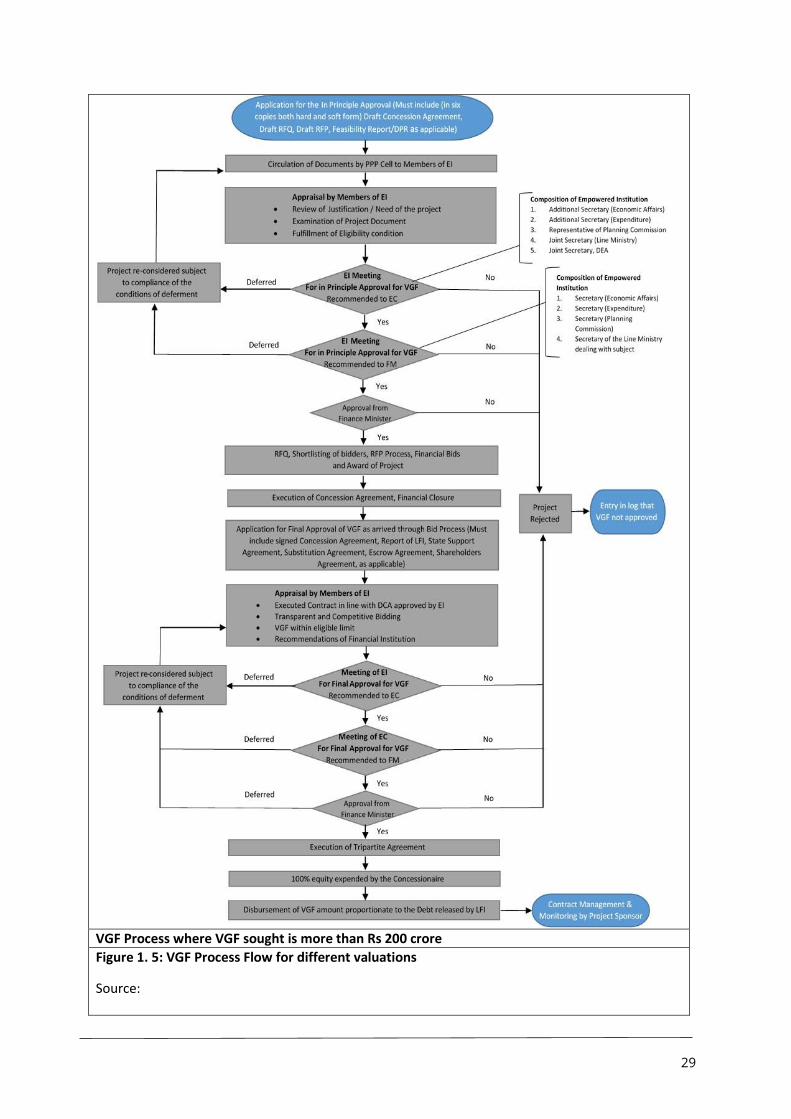
VGF Process where VGF sought is more than Rs 200 crore
Figure 1. 5: VGF Process Flow for different valuations
Source:

30
PPP variants in the sewerage sector:
There exist two major categories of PPPs – (i) Engineering Procurement and Construction (EPC)
along with O&M; (ii) concession arrangements. In the first category, the ownership of the project
lies with the public entity, and either or both service and management contracts are handed over to
the private parties. The private entities therefore are limited to design, build and operate the project
(known as DBO models) in a time of 5-10 years. The ULB or parastatal meets the capital costs for the
project, and uses the private sector to bring in technology and managerial skills to operate and
maintain the assets for a period of 5 to 10 years. The construction, technology and operating risks
are borne by the private sector operator while the financing risk is borne by the government
counterpart. In the second category mentioned, concessions are designed, build, finance, operate
and maintain the assets for a longer period, usually more than 10 years. This type can take Build,
Operate and Transfer Model (BOT) models and Design, Build, Finance, Operate, Transfer (DBFOT)
models into consideration which has different variants as explained below.
Figure 1. 6: Spectrum of the private participation
Build, Operate and Transfer Model (BOT) – these models are concessions, where the private sector
designs, constructs, finances capital expenditure, operates and maintains all assets and at the end of
the concession period returns it to the Concession Granting Authority (CGA). There exits three
variants of this model –
1. BOT end user PPP – in this case the end user is an industrial firm or a power plant which is a
bulk consumer of water. The end user or consumer itself is the private operator, hence owns
and takes responsibility for the project. The end user purchases either treated or raw
sewage from the ULB / Water Utility from its STPs/discharge points through a long term
wastewater supply or purchase contract; conveys it to its facility; and treats it to a level
required by it for its internal process and other non-potable uses. The end user is
responsible for financing all the capital and operating expenditures required for the

31
conveyance infrastructure and additional treatment facilities. In certain cases, the end user
undertakes to operate the municipal STPs for the ULB / Water Utility at its own cost as well,
in return for free treated sewage supplies from the STPs through a long term agreement.
The benefit is the cost savings emanating from a stable source of water of the requisite
quality for own use at a cost which is lower than the cost of alternative sources of treated
water.
Table 1. 5: PPP distinctions according to ownership, capital investment, tenure and risk bearing
Model Ownership Management Expertise
O & M Capital Investment
Commercial Risk
Tenure
Service Agreement
Public Public and private (limited to selected task)
Public and private (limited to specific activities)
Public Public 3 – 5 years
Management Agreement
Public Private Private Public Public 5 – 10 years
Lease Public Private Private Public shared / Private limited to working capital
Public shared / Private
5 – 15 years
Concession Public Private Private Private Private / shared
15 - 25 years
Divestiture Private Private Private Private Private 25 years
2. BOT third party PPP (annuity) – in this case the CGA hires a third part to provide services
(such as wastewater collection, treatment and supply for reuse services to the end users)
and is paid an annuity to cover the capital and O&M costs.
3. BOT third party PPP (user charge) also known as Design, Build, Finance, Operate, Transfer
(DBFOT) – the third party hired by the CGA to provide wastewater collection, treatment and
supply for reuse services to end users and collects user charges in return to recover capital
investments, O&M costs and meet return expectations.
The key success factors for different types of the PPPs are provided in the following table:
Table 1. 6: Key success factors of different types of PPPs
DBO BOT end user PPP BOT third party PPP (annuity)
BOT third party PPP (user charge)
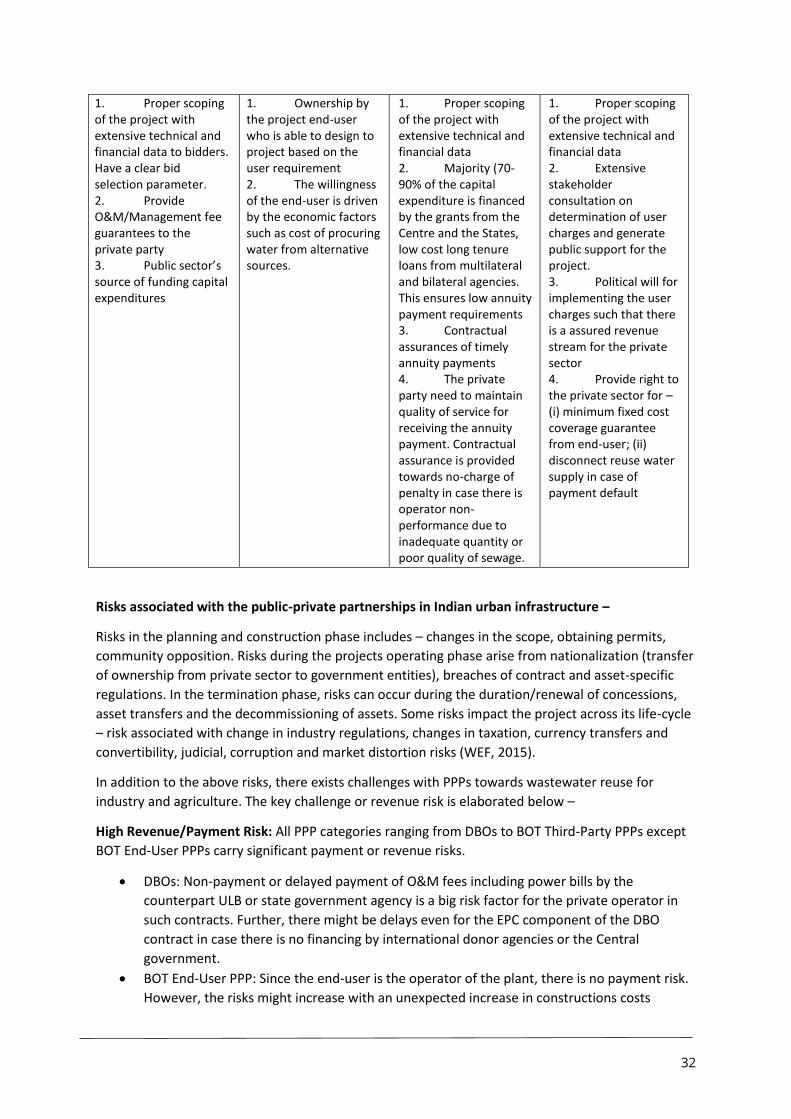
32
1. Proper scoping of the project with extensive technical and financial data to bidders. Have a clear bid selection parameter. 2. Provide O&M/Management fee guarantees to the private party 3. Public sector’s source of funding capital expenditures
1. Ownership by the project end-user who is able to design to project based on the user requirement 2. The willingness of the end-user is driven by the economic factors such as cost of procuring water from alternative sources.
1. Proper scoping of the project with extensive technical and financial data 2. Majority (70-90% of the capital expenditure is financed by the grants from the Centre and the States, low cost long tenure loans from multilateral and bilateral agencies. This ensures low annuity payment requirements 3. Contractual assurances of timely annuity payments 4. The private party need to maintain quality of service for receiving the annuity payment. Contractual assurance is provided towards no-charge of penalty in case there is operator non-performance due to inadequate quantity or poor quality of sewage.
1. Proper scoping of the project with extensive technical and financial data 2. Extensive stakeholder consultation on determination of user charges and generate public support for the project. 3. Political will for implementing the user charges such that there is a assured revenue stream for the private sector 4. Provide right to the private sector for – (i) minimum fixed cost coverage guarantee from end-user; (ii) disconnect reuse water supply in case of payment default
Risks associated with the public-private partnerships in Indian urban infrastructure –
Risks in the planning and construction phase includes – changes in the scope, obtaining permits,
community opposition. Risks during the projects operating phase arise from nationalization (transfer
of ownership from private sector to government entities), breaches of contract and asset-specific
regulations. In the termination phase, risks can occur during the duration/renewal of concessions,
asset transfers and the decommissioning of assets. Some risks impact the project across its life-cycle
– risk associated with change in industry regulations, changes in taxation, currency transfers and
convertibility, judicial, corruption and market distortion risks (WEF, 2015).
In addition to the above risks, there exists challenges with PPPs towards wastewater reuse for
industry and agriculture. The key challenge or revenue risk is elaborated below –
High Revenue/Payment Risk: All PPP categories ranging from DBOs to BOT Third-Party PPPs except
BOT End-User PPPs carry significant payment or revenue risks.
DBOs: Non-payment or delayed payment of O&M fees including power bills by the
counterpart ULB or state government agency is a big risk factor for the private operator in
such contracts. Further, there might be delays even for the EPC component of the DBO
contract in case there is no financing by international donor agencies or the Central
government.
BOT End-User PPP: Since the end-user is the operator of the plant, there is no payment risk.
However, the risks might increase with an unexpected increase in constructions costs

33
causing an unexpected loss of profit to the end-user. Another risk is inadequate supply of
raw or secondary treated sewage by the ULB in terms of both agreed upon quantity and
quality, which can affect the operations of the end-user causing a loss in its profits.
Figure 1. 7: Risks associated with PPPs in India
Source: World Economic Forum (WEF). 2016. Reforms to Accelerate the Development of India’s Smart Cities Shaping the Future of Urban Development & Services.
BOT Third-Party PPP (Annuity): Possibility from frequent non-payment, partial payment or
delay in payment of contractually agreed annuity amounts, particularly, if the public sector
counterparty is a non-metro city or a financially weak water supply and drainage board of
the state government.
BOT Third-Party PPP (User Charge): In most cases payment for sewage collection and
treatment is through the property tax and is not even adequate to cover O&M costs of such
systems. Additionally, if freshwater availability is high, the inducement towards paying water
tariff by consumers (especially treated wastewater) is quite low.
The other risks at the project level such as inadequate scoping and poor quality data, hasty bid
process, land availability and permitting, poor quality of municipal sewage, rigid contracts and
limited public / end-user consultations.
One of the ways to circumvent revenue risk concern and allow the private sector to ensure
commitment and performance over the duration of the concession is to combine the BOT annuity
and DBO models. In such hybrid models, the Concession Granting Authority (CGA) pay 30-40 percent
of the capital investment through different instalments linked to the milestones as the construction
of the utility progresses. The balance is paid through annuities over the remaining life of the
concession. This is unlike the DBO model, where the entire capital investment is borne by the
government, and in this model the private sector use their equity during the construction. Further
since the O&M costs are usually lower than the capital costs, the private players are not
overburdened and usually do not leave during the operational phase. The private sector recover
share of capital cost and O&M expenditure through annuities spread over the contractual /
operational period. However, the government needs to ensure that it is capable of fulfilling the
annuity commitments. Back-stopping arrangements in the form of a fund would provide comfort to
both private players and their lenders. The National Mission for Clean Ganga (NMCG) under the
Ministry of Water Resources, River Development and Ganga Rejuvenation (Government of India)
recently formulated a policy for Public Private Partnership projects in the wastewater sector through
0%
25%
50%
75%
100%En
viro
nm
en
t &
oth
er
pe
rmit
Can
cella
tio
n &
ch
ange
in s
cop
e
Co
rru
pti
on
/ M
arke
td
isto
rtio
n
Co
mm
un
ity
Bre
ach
of
con
trac
t
Jud
icia
l
Ch
ange
of
ind
ust
ryre
gula
tio
n
Co
nce
ssio
n d
ura
tio
n /
ren
ewal
Ass
et-s
pe
cifi
cre
gula
tio
n
Ass
et t
ran
sfe
r
Taxa
tio
n
Dec
om
mis
sio
nin
g
Exp
rop
iati
on
Cu
rren
cy t
ran
sfer
&co
nve
rtib
ility
India Maharastra Andhra Pradesh

34
an innovative hybrid annuity model under the Namami Gange Program in three cities in India –
Varanasi (50 MLD STP), Haridwar (2 STPs of 82 MLD) and Mathura (4 STPs of 67 MLD).
Proposed business models
From the above discussion on engaging private equity through PPPs, three different variants of the
business model can be proposed on the operational aspects –
(i) Three party model – This model is a medium-term tripartite agreement between local
body, private developer and industrial units/zones. The contract lay down Design-build-
operate type of PPP between the local body and the private entity for a period of 5-10
years after which the wastewater treatment utility is handed back to the local body. The
local body provides land and is also the enforcer of the contract through quality
compliance and operations. The local body can provide annuities to the private
developer for construction, operation and maintenance of the treatment and
conveyance facilities or give the right for the user charge collection from the industrial
units/zone. The private developed invests in building the treatment plant as well as the
conveyance infrastructure and is also responsible for operation of the facilities. They
also need to ensure the quality of the water to the industrial consumer who purchase
water at a predefined quality, quantity and tariff.
(ii) End-user PPP model – This model assumes a contract between the local body and an
industrial user. The local body enters into a long-term contract promising a certain
volume of wastewater which is treated and reclaimed by the industry for internal
consumption. The industry in return pays back for the wastewater at a defined cost and
invest and maintain the conveyance units.
(iii) Two party model – This model assumes a contract between the local body and a private
entity engaged in treatment of wastewater. The local body buy-back the reclaimed
wastewater and sell the water to industrial units/industrial zones and in turn provides
annuity to the private entity for operation and maintenance of the wastewater
treatment plant.
In the following chapters we discuss about financial feasibility of implementing wastewater reuse for
industry and agriculture in the two cities of Solapur and Vijayawada respectively with a focus on
utilization of private equity through PPPs.

35
Financial Feasibility Analysis of tertiary treated wastewater used for
agriculture and Industry at Solapur
Introduction
Central Pollution Control Board (CPCB) report reveals that 38254 million litres of sewage is
generated in India everyday considering both Class I cities and Class-II towns both (CPCB, 2013). Out
of which only 30.8% is treated and rest flows into surface water bodies and that contaminates the
fresh water bodies in and around cities. Solapur is also not an exception. There are three sewage
treatment Plants in Solapur which are operating with Sequential Batch Reactor (SBR) technology.
The capacities of plants are 75 MLD, 10 MLD, and 12.5 MLD. 75 MLD plant is located in Degaon and
10 MLD plant is located in Pratap Nagar and the other plant is located in Kumthe. Currently, all the
three plants discharge wastewater treated at the secondary level directly into the nearby canal and
the water is mostly used to irrigate the plots occupied by sugarcane as only sugarcane withstand this
secondary treated water but other crop gets burnt3 when this water is applied. Moreover, recent
literature (2012-16) also suggests that inappropriately treated waste water used for agriculture
significantly affects soil texture properties, and also causes possible alterations of the biomass and
microbiota (Jaramilo & Restrepo, 2017). Moreover, wastewater treated at the secondary level
cannot be used for most of the industries as it does not meet the water quality requirement, in
particular Biological Oxygen Demand (BOD), Chemical Oxygen Demand (COD), Total Suspended
Solids (TSS), Nitrate, and Phosphate levels are higher than the permissible level. At present, fresh
water required to supply for domestic and industrial use is drawn from Ujani dam. Recently,
Maharashtra government has allocated 52.6 million cubic meter of water for National Thermal
Power Corporation (NTPC) for its 1320 MW power plant from Ujani dam (Greenpeace, 2016)4. The
actual water requirement for NTPC plant is 96 MLD. Degaon sewage treatment plant was established
with the intention to supply recycled wastewater to NTPC. Since Degaon plant treats water at the
secondary level, recycled wastewater cannot be used for the plant. NTPC is supposed to send back
75 MLD water to Solapur Municipal Corporation (SMC) in case it receives the properly treated
wastewater. Even if NTPC draws half of the required level of water and the rest can be managed
from recycled wastewater, the leftover recycled water can be used for agriculture and other
industries. The primary criteria to use the water for industry and agriculture it is essential to treat
the water at the tertiary level and then only dependence on fresh water can be reduced to a large
extent. As a result of declining dependence on fresh water, sufficient water can be supplied to
households which receive water once or twice in a week during summer due to dearth of water at
Ujani dam.
It is a well-known fact that in India, urban local bodies are not obliged to treat water beyond
secondary level. The burden of even secondary treatment plants remains with Urban Local Bodies
(ULBs). Treating water at the tertiary level will impose another level of burden on ULBs. It is needless
to say that ULBs do not have requisite funds for operation and achieve integrated wastewater
management system. Therefore, the challenge to maintain wastewater systems and achieve
resource recovery and reuse is technological, institutional (regulatory and policy framework) as well
as financial. We are taking up only one aspect in this study the financial aspect (provided we have
different set of technologies to achieve quality parameters for reuse). Therefore, if we add tertiary
3 Farmers in the command area of Pratap Nagar plant informed this during field work.
4 We received the same information during field visit to Solapur

36
treatment facility to the existing secondary treatment plants and treated water is supplied to
industry as well as agriculture what type of financial arrangements are needed and what are the
possible ways of recovering the expenditures for a sustainable operation of the plant needs
attention. In this paper, an attempt is made to find out the feasibility for supplying water treated at
the tertiary level to the industry and agriculture in Solapur city. In other words, we are trying to
figure out what could be the potential tariff rate for industry and agriculture that would help self-
sustaining the system.
Industrial Area and its distance from Sewage Treatment Plants in Solapur
In Solapur district, there are four industrial zones namely-Akkalkot Road, Chincholi, Tembhurni,
Mangalvedha, and Kurduwadi. Amongst these four industrial zones Akkalkot Road is the nearest one
which is 3 kms away from Solapur city. The other industrial area which is close to Solapur city is
Mangalvedha which is around 50 km away from solapur. Rest of the industrial zones are located at
least in the 80-120 km range from Solapur city. These industrial areas are mostly dominated by
textile, chemical, electrical machinery manufacturing products.
Since the Akkalkot Road is the nearest industrial area in Solpaur, we can think of supplying
wastewater to the MIDC Akkalkot Road. The distance from Degaon, Kumthe and Ranna Pratap Nagar
STPs to Akkalkot Road MIDC are 10, 16, and 12 kms respectively.
Table 2. 1: Existing Status of Industrial Areas in Solapur District5
Area Name Area (in Hect.) No. of plots developed
No. of plots allotted
Prevailing rate per Sq.
m.
No. of vacant plots
Akkalkot Road 215.48 903 903 3701 NIL
CHincholi 1022.60 720 510 2822 210
Tembhurni 321.44 164 58 1021 106
Mangalvedha 95.06 40 16 1311 24
Kurduwadi 25.97 42 6 1050 38
Total 1681.55 1870 1493 378
As the capacity of Pratap Nagar Plant is 10 MLD and the agricultural command area is adjacent to it,
water treated at this plant should be used for agriculture only. Water treated at the Degaon Plant
and Kumthe Plant can be utilised for both agriculture as well as Industry as the accumulated capacity
will be of 87.5 MLD. Even if NTPC is given In order to carry the water to industry we assume that we
need to lay a pipeline of 20 km (to reach to Akkalkot Industrial area) and the water required to serve
agriculture in the command area under Degaon plant can be directly released into canal for
utilisation of farmers.
5 Presently, we do not have the water demand data from industries situated in MIDC but we know that NTPC
needs 96 MLD water to run its operation and Maharashtra Government has sanctioned 52.6 Million cubic meter fresh water from Ujani dam. We can think of supplying 50 MLD treated wastewater to NTPC and rest can be met from fresh water from Ujani dam. Public Heath Engineer revealed that SMC is constructing 3 other STPs in Solapur. Once they are in operation and the pipeline for recovering sewage from households is in place most of the industrial demand can be met from treated wastewater. In 2012, Solapur had a population of 1250000. Assuming a growth rate of 1 percent per year, in 2018 it is probably at the level of 1326900. If we assume that per capita water consumption is 150 litre per day, total waste water generated per day will be of 199 MLD. Therefore, after meeting the NTPC demand we will be left with a sizeable amount of water to cater t the need of agriculture and industry.

37
Cropping Pattern and Water Demand for Agriculture
Table 2 provides the cropping pattern and crop wise water requirement under Pratap Nagar plant
command area. We are also assuming similar cropping pattern under Degaon plant command area
as cropping pattern in a region doesn’t vary substantially. It is to be noted that the fallow land could
be utilised for agriculture provided there is sufficient water supply throughout the year and this is
only possible when we supply wastewater treated at the tertiary level.
Figure 2. 1: Sewage Treatment Plants and their distance from Akkalkot Road MIDC
Table 2. 2: Cropping Pattern under Pratap Nagar plant command area
Command Area under Pratap Nagar Plant (acre): 1000
Crops Grown Area (%) Water Requirement(mm/day)
Sugarcane 30 7
Groundnut 5 6
Mint 5 4
Maize 10 5
Ragi 10 3.26
Cucumber 2 7
Papaya 10 6
Pomegranate 2 4
Tur 5 3
Guava 5 3.5
Fallow Land 16 0
The requirement for tertiary treatment arises from the fact that water quality requirement for the
use of wastewater in Industry and agriculture doesn’t conform to the quality requirement. Recent

38
literature (2012-16) also suggests that inappropriately treated waste water used for agriculture
significantly affects soil texture properties, and also causes possible alterations of the biomass and
microbiota (Jaramilo & Restrepo, 2017). Moreover, wastewater treated at the secondary level
cannot be used for most of the industries as it does not meet the water quality requirement, in
particular Biological Oxygen Demand (BOD), Chemical Oxygen Demand (COD), Total Suspended
Solids (TSS), Nitrate, and Phosphate levels are higher than the permissible level Table below shows
the qualities of wastewater received from sewerage and Central Pollution Control Board (CPCB)
norms for discharge of water.
Table 2. 3: Water Quality Characteristics of sewage and CPCB norms
Water Quality Characteristics
Untreated SEWAGE WATER
CPCB NNORMS SBR Tertiary Treatment
BOD 110-400 <30 <5 <10
COD 250-1000 <250 <50 <50
TSS 100-350 <20 <10 <2
Nitrates 20-85 -- <10 <10
Phosphates 4-15 -- <1.0 <1.0
Turbidity 16 <5
pH 6.5-7.5 <6.0-7.5
Total Hardness as CaCO3(mg/l)
750 <300
Iron (mg/l) 0.63 <0.25
TDS (mg/l) 2100 <500
Manganese (mg/l) 0.12 <0.10
Water treated at the secondary level using various technologies meets the requirement of CPCB
norms. It can be seen that water released through SBR technology meets the parameter
requirement and can be used for Low end industrial activity. High end industrial use needs more
refinement and that’s where we need tertiary treatment of wastewater released through secondary
treatment.
Methodology:
In order to carry out the financial feasibility study, we needed to understand ground realities of
Solapur city i.e. the status of wastewater treatment, water demand for industry and agriculture
surrounding the city. We met Public Health Engineer in SMC. Initially we went with the concern to
supply the treated wastewater to National Thermal Power Corporation (NTPC) plant of 1320 MW
established recently as it has become a controversial issue. Public Health Engineer claimed that the
issue of supplying wastewater to NTPC power plant has been resolved and asked us to figure out if
we could do something for agriculture and other industries. She facilitated us for the visit to
operational Sewage treatment plants in Degaon, Pratap Nagar. Visit to these plants helped us
getting data about the functioning of the STP and data of capital expenditure and operation and
maintenance costs under various heads. To understand the demand for farmers we visited the
farmers in the command area of Pratap Nagar Plant. Farmers told us their requirement and the
problems with the currently treated wastewater. We had collected data about the cropping pattern
in the region. To carry out the financial feasibility study we needed data for establishing pipeline,
pumping stations, and cost of different tertiary treatment technologies. To collect the cost the cost
of establishing pipeline and secondary treatment options we met officials of Bangalore Water Supply
and Sewage Board (BWSSB) officials. Information about the cost of tertiary treatment and land

39
requirement was obtained from practitioners from Taru Leading Edge Pvt. Ltd. who have extensively
worked on sewage treatment plants in the past. In addition to the primary survey, we have collected
data from the secondary literature available on sewage treatment plants. Majority of the
information has been obtained from the report published by Central Pollution Control Board study
on performance of sewage treatment plants in India published in the year 2013.
Assumptions:
1. Tertiary treatment unit will be built inside the existing secondary treatment plant as there is
sufficient space left out in the Degaon Plant.
2. There will be 10 percent loss of wastewater during processing.
3. The cost of laying 900 mm pipe to carry water will be Rs. 3 crore per kilometre.
4. The cost of laying pipeline to transport the treated water will be borne by ULB. Only
maintenance cost and cost of pumping water will be borne by private entity.
5. We are assuming that cost of pumping 1 KL liter water over 10 km is Rs. 1.
6. Power tariff is Rs. 6.3/kwh which has been observed from electricity bill at Degaon plant in
Solapur.
7. The capital expenditure for Filtration with Sand (Pressurised sand filters, Activated carbon
filters) (4 Filters can be installed 2 of them will be standby) is Rs. 2 lakh per MLD.
8. The capital expenditure for Reverse Osmosis (Microfiltration+RO+Ultraviolet
Treatment+Demineralisation) is Rs. 30 lakh per MLD.
9. We assume that operation and maintenance cost for tertiary treatment will be Rs. 562487.
10. Construction of storage facility will require Rs. 40 lkh per MLD.Land requirement for storage
facility will be 12141 square meter.
11. Operation and maintenance cost for the storage facility will be 3 percent of total
expenditure.
12. Land requirement for Sand filtration plant is 2000 square meter.
13. Land requirement for tertiary treatment plant with reverse osmosis is 4047 square meter.
14. Land cost per acre is Rs. 1.5 crore.
15. We assume that ULBs will provide land for construction of tertiary treatment plant inside
secondary treatment facilities.
16. Operation and maintenance cost of secondary treatment using Sequencing Batch Reactor is
Rs. 576480.
17. We are assuming 75 MLD waste water will be treated at the tertiary level.
18. Adoption rate in the first year of processing is 10 percent and thereby every year it will
increase by 10 percent. Therefore, in 10 years we will be able to achieve 100 percent
adoption.
19. Interest rate for borrowing is 8 percent which is the current rate of interest in India.
20. Social Discount rate is 15 percent as suggested for India by literature.
21. Corporate tax rate is 25 percent which is the existing tax rate in India.
22. We are assuming that operation and maintenance cost will go up by 2 percent every year for
secondary and tertiary treatment.
23. We assume debt equity ratio will be 70:30.
Table 2. 4: Data Collected from field and secondary sources
Piping rates (Including cost of digging road- Quantity Source

40
laying pipe-closing the road) Unit
600-900 mm Diameter Pipe (Main) INR/km 30000000 BWSSB
Length of pipeline for supplying water to Industry (km) km 20 Assumed
Power Tariff - INR/kWh (Using Multiplying Factor of 30) Rs/Kwh 6.3 Electricity Bill
Cost of carrying Treated Water using pipeline (Pumping cost) INR/L/10
Km 0.00000000
758 Hingorani
(2011)
Capital Cost of Tertiary Treatment
Filtration with Sand (Pressurised sand filters, Activated carbon filters) (4 Filters can be installed 2 of them will be standby) Rs./Liter 0.2
Expert Estimates
Reverse Osmosis (Microfiltration+RO+Ultraviolet Treatment+Demineralisation) Rs./Liter 3 CPCB(2013)
O&M COST FOR TERTIARY TREATMENT
Energy Cost for Tertiary Treatment Plant
Average technology power requirement, kwh/d/MLD (Tertiary Treatment + Tertiary Sludge Handling) 1 CPCB
Average Non-technology Power required, kwh/d/MLD (Tertiary Treatment) 4.5 CPCB
Yearly Power cost for Tertiary Treatment per MLD INR/MLD 12647 CPCB
Repair Cost/L
Annual Repair Costs for tertiary treatment[Civil Works, E&M works] INR/MLD 88000 CPCB
Chemical Cost for tertiary treatment INR/MLD 445000 CPCB
Manpower Cost[Salary+Benefits] for Tertiary Treatment INR/MLD 16840 CPCB
Construction Cost of storage (Excluding cost of Land) Rs./Liter 4 Expert
Estimates
Land Requirement for Storage Capacity Sq meter 12141 Expert
Estimates
Operation and maintenance of Storage facility 3% Expert
Estimates
Land Requirement for Tertiary Treatment Plant (Sand Filtration) Sq meter 2000 Expert
Estimates
Land Requirement for Tertiary Treatment Plant (Reverse Osmosis) Sq meter 4047
Expert Estimates
Land Cost (INR/Acre) INR/Acre 15000000 Assumed
Subsidy Given by Municipality INR/Acre 15000000 Assumed
OPERATION & MAINTENANCE COST
Yearly Power cost (INR/MLD) upto secondary treatment INR/MLD 334000 CPCB
Annual Repairs cost (INR/MLD) upto secondary Treatment INR/MLD 116000 CPCB
Annual chemical cost (INR/MLD) upto secondary treatment INR/MLD 85000 CPCB
Annual Manpower cost(INR/MLD) upto secondary treatment INR/MLD 41480 CPCB
Total O&M cost (including pre-treatment + primary treatment + secondary treatment using SBR)
576480
Capacity of Secondary Treatment Facility Liter/day 75,000,000 Stp capacity
Water Loss during processing Percent 10% Assumed
Adoption rate in first year Percent 10% Assumed
Increment in adoption rate each year Percent 10% Assumed
Water discharged by secondary (STP)
cubic meter/da
y 67500
Calculated

41
Water demand for Industry
cubic meter/da
y 49002
Calculated
Total Capital expenditure (Sand Filtration) INR 915000000 Calculated
Total Capital Expenditure (RO) INR 1125000000 Calculated
Interest Rate Percent 8 Assumed
Discount Rate Percent 15
Income Tax rate Percent 25 Assumed
Installment paid per year (sand Filtration) INR 56893971.0
8 Calculated
Installment paid per year (RO) INR 99030862.5
6 Calculated
Scenario Analysis for Solapur
We have conducted a financial feasibility analysis based on the assumptions mentioned above.
(Financial model has been placed in the Annexure). Sensisivity analysis has been carried out with
respect to parameters like adoption rate, Income tax rate, interest rate.
We have assumed that the initial adoption rate will be 10 percent for the first year as it takes time to
create awareness. Then each year there will be increment by 10 percent so that in 10 years it is
possible to sell the whole treated water. In this case the water demand for agriculture is met and
then rest is supplied to the industry. Moreover, we are treating the whole 75 MLD water coming out
of secondary treatment and out of which in the first year 10 percent of the wastewater adopted by
industry and agriculture and thereby each year it increases by 10 percent. We are treating the whole
water from the beginning otherwise installed capacity will remain unutilised and environment will be
affected even if it is discharged in the canal due to lack of demand. With 10 percent adoption rate
and 25 percent corporate tax rate if we choose sand filtration as the tertiary technique then farmers
will have to pay Rs. 5/m3 and industry has to pay Rs.17.15 /m3. If we consider reverse osmosis as the
tertiary treatment mechanism industry has to pay Rs. 24.00 /m3. In this context it is worth
mentioning that Vrishabhavathi Valley STP in Bangalore which operates under the supervision of
BWSSB at a capcity of 60 MLD, supplies tertiary treated wastewater to a number of industries. Its
cost of production is between Rs. 10-12 per kilo litre. Industrial tariff rate in Chennai industrial water
tariff is Rs. 60/KL and household tariff is Rs. 4/KL. Delhi Jal Board (DJB) is planning to sell water form
its sewage tretement plant located in Rithala to two power plants at approximately Rs. 8 per kilo
litre. The estimate of Hingorani (2011) reveals that under both public and private arrangements
should be within Rs. 4-14 and Rs.5-17 per kilo litre. Our tariff is little bit on the higher side as
compared to others mainly because of two reasons. One possible reason is that in the span of 8
years our cost has increased. On the other hand, other studies didn’t consider the capital
expenditure made for setting up tertiary treatment plant. Hingorani (2011) considered only the
capital expenditure incurred for transporting water to industry and its pumping and maintenance
cost. The other possible reason could be they might have assumed full adoption in the beginning of
the production. If the adoption rate is high obviously the cost will go down substantially. But as the
adoption rate increases to 20 percent the cost of tertiary treated water goes down to Rs.14.95 /m3
and Rs.22.70 /m3 for sand filtration and reverse osmosis technologies respectively.
Table 2. 5: Tariff for Viable Operation according to Adoption Rate
SAND FILTRATION Tax Rate:25% Tax Rate: 0%

42
AR: 10% AR: 20% AR:10% AR:20%
Tariff Imposed on agriculture(SBR+SF) 5.00 5.00 5.00 5.00
Tariff Imposed on Industry(SBR+SF) 17.15 14.95 14.95 12.65
REVERSE OSMOSIS
Tariff Imposed on agriculture (SBR+RO) 5 5 5 5
Tariff Imposed on Industry(SBR+RO) 24.00 22.70
21.20 19.35
In the baseline scenario we assumed the PPP venture will be taxed at the rate of 25 percent which is
current corporate tax regime. But since this is development project PPP might be given exemption
from paying corporation tax. In case of zero taxation rule if the adoption rate is 10 percent cost to
the industry goes down to Rs.14.95 and Rs.21.20 for sand filtration and reverse osmosis process.
Under the assumption of 20 percent adoption cost goes down further to 12.65 and 19.35 for sand
filtration and reverse osmosis process respectively.
In the baseline scenario we have assumed that cost of borrowing is 8 percent. But the interest rate
might fluctuate in future and if it rises to the level of 10 percent there will be marginal increase in
the cost of treated water.
Table 2. 6: Tariff when interest rate changes from 8% to 10%
SAND FILTRATION Tax-25%|adoption rate 10%|Interest rate 8%
Tax-25%| adoption rate 10%|Interest Rate 10%
Tariff Imposed on agriculture(SBR+SF) 5.75 5.00
Tariff Imposed on Industry(SBR+SF) 16.25 17.55
REVERSE OSMOSIS
Tariff Imposed on agriculture (SBR+RO) 5 5
Tariff Imposed on Industry(SBR+RO) 23.25 24.95
Types of Public Private Partnership
Currently, there are five types of PPP models that exist in Indian wastewater sector. Those are
Design Build and Operate (DBO) model, Build Operate and Transfer Model (BOT)-End User PPP, Build
Operate and Transfer (BOT) Third Party Annuity, BOT Third Party PPP (User Charge). It has been
observed that DBO and BOT-End User models are most successful in wastewater sector in India.
DBO
In this case the private entity will Design build and Operate (DBO) for the term of the project which
is 30 years. In this case we assume that Municipal Corporation will fund capital expenditure, provide
land for the tertiary treatment plant and it will build pipeline required for transferring water to
industry and agriculture as deems convenient. If needed municipality will provide the land required
for creation of storage capacity and build the storage capacity. Moreover, Municipality will also bear
demand off-take and therefore revenue risk. Private entity will bear the risk of technology,
construction, and operation and maintenance. In this case the ULBs will have the liberty to decide
the tariff. But private sector will bear the risk of timely payment even though work is completed on
time. This could be one possible option.
BOT End-user PPP

43
In this case the end user takes the risk of design, technology, construction and municipality ensures
land required for construction and timely availability of sewage and its quality. This is not a feasible
option for us as we intend not only to supply a particular firm but the industry as a whole and
agriculture surrounding the cities. This requires operation at large scale and hence we discard this
option.
BOT- Third Party Annuity
In this case the private agency will bear the risk of major capital expenditure, along technology,
construction and operation and maintenance risk. Municipality takes the risk of partial funding for
capital expenditure, and annuity payment to ensure expected returns of the private operator.
Demand off-take and thereby revenue risk is borne by the ULBs. This is another feasible option.
BOT- Third Party PPP (User Charge)
In this case the risk of capital expenditure can be partially borne by municipality but majority of
capital expenditure has to be borne by private agency along with technology, construction and
operation and maintenance cost. But the major risk of demand off-take and revenue has to be borne
by private agency. This is other possible option but has been the failure in most of the cases as
demand off-take and revenue is often uncertain.
In case we consider the most successful options in wastewater sector in India we find those cases
are successful when revenue risk is taken by government. When revenue risks are taken by
government, often it translates into loss for the government and hence adds to the fiscal burden. It
is a well known fact that ULBs have shortage of funds. Therefore adding burden on the government
further cannot be called successful model at all. Therefore, we need to think of some alternative
mechanism which doesn’t add to the burden of government. We argue that there should be full cost
recovery model for sustainability of the venture. Demand off-take is a problem as there are
alternative resources available and present policy environment doesn’t prevent entities from using
those alternate resources and doesn’t make sufficient provision. For example, either use of treated
waste water is not mandatory and that induces industry to use fresh water or even though there is
policy in place government doesn’t make sufficient provision for treated wastewater for reuse by the
industry. Therefore, a stringent policy should be in place and government needs to make provision
for sufficient treated reusable wastewater.
Table 2. 7: Risk Sharing Pattern in different types of PPP
Capital Expenditure
Construction Technology Revenue Land
DBO Govt. Private Private Govt. Govt.
BOT End-user PPP Private Private Private Private Govt.
BOT- Third Party Annuity Govt. & Private Private Private Govt. Govt.
BOT- Third Party PPP (User Charge)
Private Private Private Private Govt.
Since demand off-take is a problem, we can think of recovering operation and maintenance cost in
the beginning, thus keeping the tariff rate low and after few years recovering capital expenditure
through imposition of a fixed cost along with variable cost of production. Considering Solapur we see
that if we adopt BOT-Third Party PPP (user charge) which will be self-sustainable the uniform tariff
rate that is applied is Rs. 5 for agriculture and Rs. 23.10. If we adopt recovering O&M cost policy for
first 5 year and recovering fixed cost in next 25 years, then in first 5 years agriculture sector has to
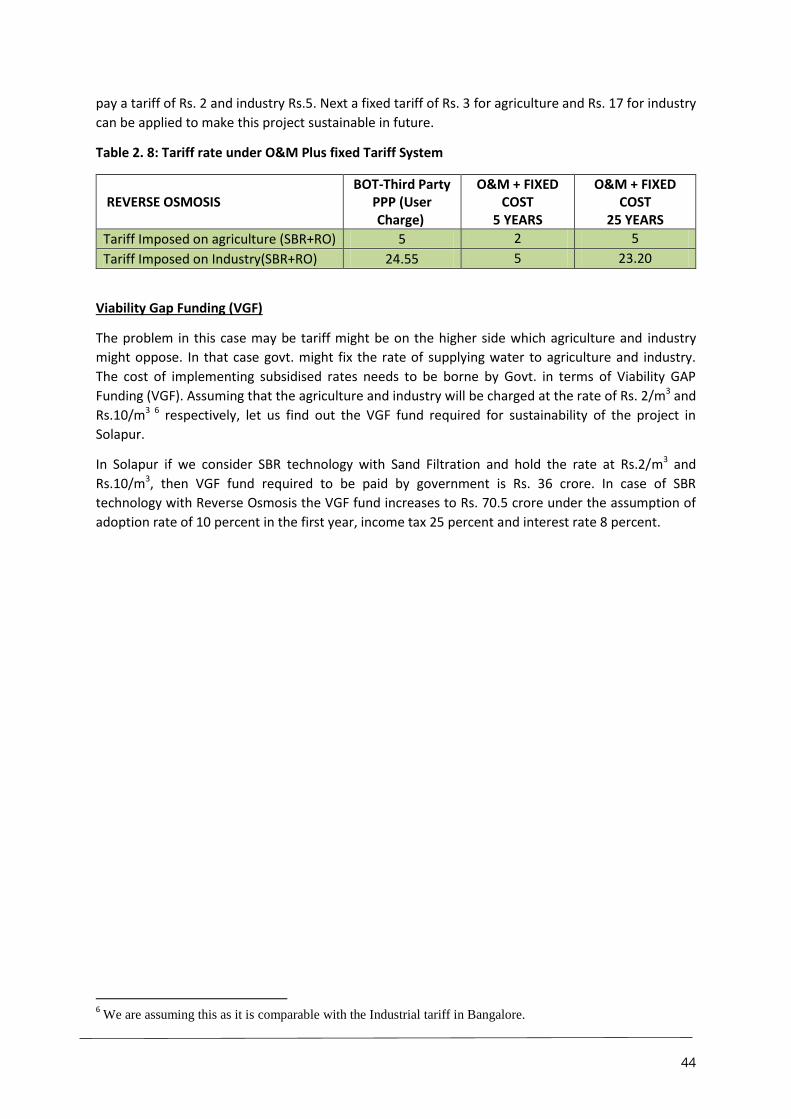
44
pay a tariff of Rs. 2 and industry Rs.5. Next a fixed tariff of Rs. 3 for agriculture and Rs. 17 for industry
can be applied to make this project sustainable in future.
Table 2. 8: Tariff rate under O&M Plus fixed Tariff System
REVERSE OSMOSIS BOT-Third Party
PPP (User Charge)
O&M + FIXED COST
5 YEARS
O&M + FIXED COST
25 YEARS
Tariff Imposed on agriculture (SBR+RO) 5 2 5
Tariff Imposed on Industry(SBR+RO) 24.55 5 23.20
Viability Gap Funding (VGF)
The problem in this case may be tariff might be on the higher side which agriculture and industry
might oppose. In that case govt. might fix the rate of supplying water to agriculture and industry.
The cost of implementing subsidised rates needs to be borne by Govt. in terms of Viability GAP
Funding (VGF). Assuming that the agriculture and industry will be charged at the rate of Rs. 2/m3 and
Rs.10/m3 6 respectively, let us find out the VGF fund required for sustainability of the project in
Solapur.
In Solapur if we consider SBR technology with Sand Filtration and hold the rate at Rs.2/m3 and
Rs.10/m3, then VGF fund required to be paid by government is Rs. 36 crore. In case of SBR
technology with Reverse Osmosis the VGF fund increases to Rs. 70.5 crore under the assumption of
adoption rate of 10 percent in the first year, income tax 25 percent and interest rate 8 percent.
6 We are assuming this as it is comparable with the Industrial tariff in Bangalore.

45
Financial Feasibility Analysis of tertiary treated wastewater used for
agriculture and Industry at Vijaywada
Introduction
Central Pollution Control Board (CPCB) report reveals that 38254 million litres of sewage is
generated in India everyday considering both Class I cities and Class-II towns both (CPCB, 2013). Out
of which only 30.8% is treated and rest flows into surface water bodies and that contaminates the
fresh water bodies in and around cities. Vijaywada is also not an exception. There are four sewage
treatment Plants in Vijaywada which are operating with Upflow Anaerobic Sludge Blanket Reactor
(UASB) and Moving Bed Biofilm Reactor (MBBR) technology. The total capacity of these four plants
taken together is 150 MLD. These plants are located at Ajithsingh Nagar, Jakkampudi,
Ramalingeswara Nagar, and Auto Nagar. Currently, all the three plants discharge wastewater treated
at the secondary level directly into the nearby canal or in Krishna River. Recent literature (2012-16)
suggests that inappropriately treated waste water used for agriculture significantly affects soil
texture properties, and also causes possible alterations of the biomass and microbiota (Jaramilo &
Restrepo, 2017). Moreover, wastewater treated at the secondary level cannot be used for most of
the industries as it does not meet the water quality requirement, in particular Biological Oxygen
Demand (BOD), Chemical Oxygen Demand (COD), Total Suspended Solids (TSS), Nitrate, and
Phosphate levels are higher than the permissible level.
It is a well-known fact that in India, urban local bodies are not obliged to treat water beyond
secondary level. The burden of even secondary treatment plants remains with Urban Local Bodies
(ULBs). Treating water at the tertiary level will impose another level of burden on ULBs. It is needless
to say that ULBs do not have requisite funds for operation and achieve integrated wastewater
management system. Therefore, the challenge to maintain wastewater systems and achieve
resource recovery and reuse is technological, institutional (regulatory and policy framework) as well
as financial. We are taking up only one aspect in this study the financial aspect (provided we have
different set of technologies to achieve quality parameters for reuse). Therefore, if we add tertiary
treatment facility to the existing secondary treatment plants and treated water is supplied to
industry as well as agriculture what type of financial arrangements are needed and what are the
possible ways of recovering the expenditures for a sustainable operation of the plant needs
attention. In this paper, an attempt is made to find out the feasibility for supplying water treated at
the tertiary level to the industry and agriculture in Vijaywada city. In other words, we are trying to
figure out what could be the potential tariff rate for industry and agriculture that would help self-
sustaining the system.
Industrial area and its proximity to Sewage Treatment Plants
There are 6 identified industrial areas with the total area of 956.65 acres which are existing in and
around pilot mandals with 29 large scale industries located within them. In which noted major
industries are Vijayawada Thermal power station, Hindustan petroleum, Lanco power, Bharat
petroleum and Indian oil corporation.
There are no medium scale enterprises and there are two existing clusters (small scale enterprises)
which area Vijayawada pharma cluster and Krishna food processing centre. Major exportable items
are Mango and other fruits, pickles, fishes & prawns, limestone, pulses, boiled rice, Handlooms &
handicrafts.
Table 3. 1: Industrial Area in Vijaywada

46
IP Name Land Acquired
(acres)
Percentage of land developed
AN KANURU (Phase I) 115.94 65.37
AN KANURU (Phase II) 32.34 100.00
IP GANNAVARA M 10.4 99.48
IP KONDAPALLY 438.19 80.21
IP VIJAYAWADA 53.93 58.90
SEZ GANNAVARAM 30.17 88.30
AN VIJAYAWADA 275.68 62.36
Table 2.2: Industrial water usage
Vijayawada (Urban) Vijayawada (Rural) Gannavaram
Area (Ha) 477.89 438.19 40.57
Annual water usage MLD 870 800 70
Table 2 provides the water requirement for the industry in Vijaywada. Ground water has been the
source for major source for the industrial purpose. For industries around the city VMC only supply
water for drinking purposes. For the manufacturing and other industrial uses water is being drawn
from the ground through borewells.
A CETP was established in kanuru to treat the wastewater from the Industrial - Vijayawada, Auto
Nagar - Vijayawada, IDA - Kondapally, Coca cola plant – Atmakur, Priya foods – Poranki and the
capacity of the effluents treated by the CETP is 200 KLD. Treated water is being used for the median
plantation and Green belt plantation. The maintenance and other operations are taken care by
Industrial Area Local Authority which is a
Sewage Treatment Situation in Vijaywada
In Vijaywada there are four secondary sewage treatment plants with total capacity of 130 MLD. Soon
20 MLD will be added to the existing capacity. In these plants two types of technologies are used for
treating waste water, namely-UASB and MBBR. These plants are located in different parts of city. So
we can think of accumulating water in one place and then distributing the water to agriculture and
industry.
Table 3. 2: Secondary treatment plants in Vijaywada
Location Capacity Year of commission Status Technology
Ajithsingh Nagar
20 MLD 2011 Functioning UASB
40 MLD Mar-17 Functioning UASB
Ramalingeswara Nagar 10 MLD 2005 Functioning UASB+EA
20 MLD 2012 Functioning UASB
Jakkampudi 20 MLD Mar-17 Functioning UASB
20 MLD Nearing completion UASB
Auto Nagar 10 MLD 2004 Functioning UASB+EA
10 MLD 2019 Functioning MBBR

47
Since Jakkampudi plant is very near to canal we can release water directly in canal. Water from the
rest three plants needs to be accumulated. To carry water to storage facility and distributing water
to industry we need to lay pipeline of around 50 km. To carry the water 900 mm pipe will be laid at
the cost of Rs. 3 crore per kilometre. Cost of pumping 1 KL liter water over 10 km is Rs. 1. In this case
we assume that capital expenditure for laying pipe will be borne by ULB and operation and
maintenance cost of and the cost of pumping water will be borne by the private entity.
Figure 3. 1: Location of Sewage Treatment Plants and Industrial Areas on Vijaywada
Distribution of Minor and Major irrigation sources
From the table below it is evident that agricultural activity is practiced in Vijayawada rural and
Gannavaram mandals. There are 7 Irrigation tanks in Vijayawada rural and 16 Irrigation tanks in
Gannavaram which majorly provide water for the agricultural activities. In Vijayawada urban,
irrigation canals and tanks which are surface water sources majorly serve 58 percent of agricultural
requirement and rest 42 percent comes from ground water.
Table 3. 3: Irrigated area in Vijaywada
Vijayawada (Urban) Vijayawada (Rural) Gannavaram
No. of MI Sources (Nos) 0 7 16
Regd. Ayacut (Ha) 0 3589.49 7351.03
Actual Area Irrigated (Ha) 0 3589.49 7110.93

48
Table 4, 5, 6, and 7 below provide the water requirement of agriculture and cropping pattern in
Vijaywada during Khariff and Rabi. From the tables below it is evident that Paddy is the major crop in
Vijaywada followed by Maize, Sugarcane, Greengram, Blackgram, Fruits and dryfruits, cotton and
Tobacco.
Due to the scarcity of water in the Rabi season the area irrigated is less when compared to the kharif
season. Most percentage of water from canals and rivers is diverted for agricultural activities as
amount of rainfall is less in Rabi season as compared to Kharif.
Table 3. 4: Agricultural water usage
Vijayawada (Urban) Vijayawada (Rural) Gannavaram
Area under agricultural activities (Ha) 481 10317 14517
Annual water usage MLD 1370 2940 4137
Surface water source MLD 800 1705 2400
Ground water source MLD 580 1235 1738
Table 3. 5: Crop harvesting
Kharif Vijayawada (Urban) Vijayawada (Rural) Gannavaram
Tonnes
Paddy 297 4485 6340
Jowar - - 0
Maize - - 30
Greengram - - 1
Blackgram - - 63
Redgram - - 28
Condiments and spices - - 2
Total sugarcane 31 297 490
Fruits & dry fruits - 2072 2077
Cotton - 10 539
Rabi Vijayawada (Urban) Vijayawada (Rural) Gannavaram
Tonnes
Paddy 184 3148 1510
Jowar - - 36
Maize 30 600 810
Greengram - 20 450
Blackgram - 50 510
Chillies - - 72
Condiments and spices - - 72
Total sugarcane 38 234 432
Fruits & dry fruits - - 15
Castor - - 20
Tobacco - - 131
The requirement for tertiary treatment arises from the fact that water quality requirement for the
use of wastewater in Industry and agriculture doesn’t conform to the quality requirement. Recent
literature (2012-16) also suggests that inappropriately treated waste water used for agriculture
significantly affects soil texture properties, and also causes possible alterations of the biomass and
microbiota (Jaramilo & Restrepo, 2017). Moreover, wastewater treated at the secondary level
cannot be used for most of the industries as it does not meet the water quality requirement, in
particular Biological Oxygen Demand (BOD), Chemical Oxygen Demand (COD), Total Suspended

49
Solids (TSS), Nitrate, and Phosphate levels are higher than the permissible level Table below shows
the qualities of wastewater received from sewerage and Central Pollution Control Board (CPCB)
norms for discharge of water.
Table 3. 6: Water Quality Characteristics of sewage and CPCB norms
Water Quality Characteristics
SEWAGE WATER CPCB NNORMS UASB+EA MBBR
BOD 110-400 <30 <20 <30
COD 250-1000 <250
TSS 100-350 <20 <30 <30
Nitrates 20-85 --
Phosphates 4-15 --
Methodology:
In order to carry out the financial feasibility study, we needed to understand ground realities of
Vijaywada city i.e. the status of wastewater treatment, water demand for industry and agriculture
surrounding the city. We visited Vijaywada Municipal Corporation to meet Public Health Engineer
and commissioner. In spite of two days visit we could not meet any one of them. Then somehow we
managed to get the contact met Public Health Engineer in SMC. In the next step we tried to get the
contacts of the person in charge of Sewage Treatment Plants (STPs). We managed and visited four
STPs We first visited Ajithsingh Nagar Plant which consists of two separate units- 20 MLD and 40
MLD and both these units use UASB technology. Thereafter, we visited Jakkampudi which also
consists of two separate units-20 MLD and 20 MLD. Second unit is near completion and first unit is
functional. Both the units run with UASB technology. Third plant we visited in Ramalingeswara Nagar
which has two separate units-10 MLD and 20 MLD. 10 MLD unit runs with UASB plus EA technique,
and other unit runs with UASB technology. The last plant we visited is in Auto Nagar. It consists of
two units-10 MLD, and 10 MLD. One unit is running with UASB technology plus EA and another 10
MLD unit runs with MBBR technology. Currently, all of these plants discharge water in the canal
except Ramalingeswara plant which releases water in adjacent Krishna River. There we collected
data on capital expenditure, operation and maintenance expenditure, number of staffs, electricity
expenditure etc. We have also collected data related to agriculture and industries surrounding the
city. Data regarding cropping pattern, industrial activities and their respective water demands. To
carry out the financial feasibility study we needed data for establishing pipeline, pumping stations,
and cost of different tertiary treatment technologies. To collect the cost the cost of establishing
pipeline and secondary treatment options we met officials of Bangalore Water Supply and Sewage
Board (BWSSB) officials. Information about the cost of tertiary treatment and land requirement was
obtained from practitioners from Taru Leading Edge Pvt. Ltd. who have extensively worked on
sewage treatment plants in the past. In addition to the primary survey, we have collected data from
the secondary literature available on sewage treatment plants. Majority of the information has been
obtained from the report published by Central Pollution Control Board study on performance of
sewage treatment plants in India published in the year 2013.

50
Assumptions:
1. Since there is very limited space inside most of the STPs except Ramalingeswara Nagar, we
propose to build a separate tertiary treatment plant in such a place so that minimum
distance needs to be covered to transport the treated wastewater to industry and
agriculture. The capacity of the tertiary treatment plant should be of 150 MLD which will
accommodate the all secondary treated wastewater in one place.
2. There will be 10 percent loss of wastewater during processing.
3. The cost of laying 900 mm pipe to carry water will be Rs. 3 crore per kilometre.
4. The cost of laying pipeline to transport the treated water will be borne by ULB. Only
maintenance cost and cost of pumping water will be borne by private entity.
5. We are assuming that cost of pumping 1 KL liter water over 10 km is Rs. 1.
6. Power tariff is Rs. 6.3/kwh.
7. The capital expenditure for Filtration with Sand (Pressurised sand filters, Activated carbon
filters) (4 Filters can be installed 2 of them will be standby) is Rs. 2 lakh per MLD.
8. The capital expenditure for Reverse Osmosis (Microfiltration+RO+Ultraviolet
Treatment+Demineralisation) is Rs. 30 lakh per MLD.
9. We assume that operation and maintenance cost for tertiary treatment will be Rs. 562487
per MLD.
10. Construction of storage facility will require Rs. 40 lkh per MLD. Land requirement for storage
facility will be 12141 square meter.
11. Operation and maintenance cost for the storage facility will be 3 percent of total
expenditure.
12. Land requirement for Sand filtration plant is 2000 square meter.
13. Land requirement for tertiary treatment plant with reverse osmosis is 4047 square meter.
14. Land cost per acre is Rs. 1.5 crore.
15. We assume that ULBs will provide land for construction of tertiary treatment plant inside
secondary treatment facilities.
16. Operation and maintenance cost of secondary treatment using UASB is Rs. 581400 and Rs.
743540 for MBBR.
17. We are assuming 150 MLD waste water will be treated at the tertiary level.
18. Adoption rate in the first year of processing is 10 percent and thereby every year it will
increase by 10 percent. Therefore, in 10 years we will be able to achieve 100 percent
adoption.
19. Interest rate for borrowing is 8 percent which is the current rate of interest in India.
20. Social Discount rate is 15 percent as suggested for India by literature.
21. Corporate tax rate is 25 percent which is the existing tax rate in India.
22. We are assuming that operation and maintenance cost will go up by 2 percent every year for
secondary and tertiary treatment.
23. We assume debt equity ratio will be 70:30.
Table 3. 7: Data Collected from field and secondary sources
Unit Quantity Source
600-900 mm Diameter Pipe (Main) INR/km 30000000 BWSSB
Length of pipeline for supplying water to Industry (km) km 20 Assumed

51
Power Tariff - INR/kWh (Using Multiplying Factor of 30) Rs/Kwh 6.3 Electricity Bill
Cost of carrying Treated Water using pipeline (Pumping cost) INR/L/10K
m 0.0000000075
8 Hingorani
(2011)
Capital Cost of Tertiary Treatment
Filtration with Sand (Pressurised sand filters, Activated carbon filters) (4 Filters can be installed 2 of them will be standby) Rs./Liter 0.2
Expert Estimates
Reverse Osmosis (Microfiltration+RO+Ultraviolet Treatment+Demineralisation) Rs./Liter 3 CPCB(2013)
O&M COST FOR TERTIARY TREATMENT
Energy Cost for Tertiary Treatment Plant
Average technology power requirement, kwh/d/MLD (Tertiary Treatment + Tertiary Sludge Handling) 1 CPCB
Average Non-technology Power required, kwh/d/MLD (Tertiary Treatment) 4.5 CPCB
Yearly Power cost for Tertiary Treatment per MLD INR/MLD 12647 CPCB
Repair Cost/L
Annual Repair Costs for tertiary treatment[Civil Works, E&M works] INR/MLD 88000 CPCB
Chemical Cost for tertiary treatment INR/MLD 445000 CPCB
Manpower Cost[Salary+Benefits] for Tertiary Treatment INR/MLD 16840 CPCB
Construction Cost of storage (Excluding cost of Land) Rs./Liter 4 Expert
Estimates
Land Requirement for Storage Capacity Sq meter 12141 Expert
Estimates
Operation and maintenance of Storage facility 3% Expert
Estimates
Land Requirement for Tertiary Treatment Plant (Sand Filtration) Sq meter 2000 Expert
Estimates
Land Requirement for Tertiary Treatment Plant (Reverse Osmosis) Sq meter 4047 Expert
Estimates
Land Cost (INR/Acre) INR/Acre 15000000 Assumed
Subsidy Given by Municipality INR/Acre 15000000 Assumed
OPERATION & MAINTENANCE COST of UASB+EA
Yearly Power cost (INR/MLD) upto secondary treatment 273000 INR/MLD CPCB
Annual Repairs cost (INR/MLD) upto secondary Treatment 156000 INR/MLD CPCB
Annual chemical cost (INR/MLD) upto secondary treatment 85000 INR/MLD CPCB
Annual Manpower cost(INR/MLD) upto secondary treatment 67400 INR/MLD CPCB
Total O&M cost (includes O&M for pre-treatment+ primary treatment+UASB technology) 581400
OPERATION & MAINTENANCE Cost of MBBR
Yearly Power cost (INR/MLD) upto secondary treatment 487000 INR/MLD CPCB
Annual Repairs cost (INR/MLD) upto secondary Treatment 122000 INR/MLD CPCB
Annual chemical cost (INR/MLD) upto secondary treatment 85000 INR/MLD CPCB
Annual Manpower cost(INR/MLD) upto secondary treatment 49540 INR/MLD CPCB
Total O&M cost (includes O&M for pre-treatment+ primary treatment+MBBR technology) 743540
Capacity of Secondary Treatment Facility Liter/day 150,000,000 STP CAPACITY
Water Loss during processing Percent 10% Assumed
Adoption rate in first year Percent 10% Assumed
Increment in adoption rate each year Percent 10% Assumed
Water discharged by secondary (STP) cubic
meter/day 1350000 Calculated

52
Water demand for Industry cubic
meter/day 1332712 Calculated
Total Capital expenditure (Sand Filtration) INR 6300000000 Calculated
Total Capital Expenditure (RO) INR 10500000000 Calculated
Interest Rate Percent 8 Assumed
Discount Rate Percent 15
Income Tax rate Percent 25 Assumed
Installment paid per year (sand Filtration) INR 391728981 Calculated
Installment paid per year (RO) INR 1599152081 Calculated
Scenario Analysis for Vijayawada
We have conducted a financial feasibility analysis based on the assumptions mentioned above.
(Financial model has been placed in the Annexure). Sensisivity analysis has been carried out with
respect to parameters like adoption rate, Income tax rate, interest rate.
We have assumed that the initial adoption rate will be 10 percent for the first year as it takes time to
create awareness. Then each year there will be increment by 10 percent so that in 10 years it is
possible to sell the whole treated water. In this case the water demand for agriculture is met and
then rest is supplied to the industry. Moreover, we are treating the whole 150 MLD water coming
out of secondary treatment and out of which in the first year 10 percent of the wastewater adopted
by industry and agriculture and thereby each year it increases by 10 percent. We are treating the
whole water from the beginning otherwise installed capacity will remain unutilised and environment
will be affected even if it is discharged in the canal due to lack of demand.
There are two types of secondary treatment technologies exist in Vijaywada namely, UASB and
MBBR. With 10 percent adoption rate and 25 percent corporate tax rate if we choose sand filtration
as the tertiary technique then farmers will have to pay Rs. 5/m3 and industry has to pay Rs.13.95/m3
and 19.05 for sand filtration and reverse osmosis process respectively with UASB technology at the
secondary level. The cost of treated water will be slightly higher in case of MBBR technology which
are 15.10 and 20.15 for sand filtration and reverse osmosis respectively.
In this context it is worth mentioning that Vrishabhavathi Valley STP in Bangalore which operates
under the supervision of BWSSB at a capcity of 60 MLD, supplies tertiary treated wastewater to a
number of industries. Its cost of production is between Rs. 10-12 per kilo litre. Industrial tariff rate in
Chennai industrial water tariff is Rs. 60/KL and household tariff is Rs. 4/KL. Delhi Jal Board (DJB) is
planning to sell water from its sewage tretement plant located in Rithala to two power plants at
approximately Rs. 8 per kilo litre. The estimate of Hingorani (2011) reveals that under both public
and private arrangements should be within Rs. 4-14 and Rs.5-17 per kilo litre. Our tariff is little bit on
the higher side as compared to others mainly because of two reasons. One possible reason is that in
the span of 8 years our cost has increased. On the other hand, other studies didn’t consider the
capital expenditure made for setting up tertiary treatment plant. Hingorani (2011) considered only
the capital expenditure incurred for transporting water to industry and its pumping and
maintenance cost. The other possible reason could be they might have assumed full adoption in the
beginning of the production. If the adoption rate is high obviously the cost will go down
substantially. But as the adoption rate increases to 20 percent the cost of tertiary treated water goes
down to Rs.9.70/m3 and Rs.15/m3 for sand filtration and reverse osmosis technologies combined

53
with UASB secondary treatment technology. In case of MBBR it goes down to Rs.10.90/m3 and
Rs.16.20/m3.
In the baseline scenario we assumed the PPP venture will be taxed at the rate of 25 percent which is
current corporate tax regime. But since this is development project PPP might be given exemption
from paying corporation tax. In case of zero taxation rule if the adoption rate is 10 percent cost to
the industry goes down to Rs.12.40 and Rs.16.65 for sand filtration and reverse osmosis process
combined with UASB technology. Under the assumption of 20 percent adoption cost goes down
further to Rs.8.10 and Rs.12.55 for sand filtration and reverse osmosis process respectively
combined with UASB technology.
In case of zero taxation rule when the adoption rate is 10 percent cost to the industry goes down to
Rs.13.45 and Rs.17.70 for sand filtration and reverse osmosis process combined with MBBR
technology. Under the assumption of 20 percent adoption cost goes down further to Rs.9.20 and
Rs.13.65 for sand filtration and reverse osmosis process respectively combined with MBBR
technology.
In the baseline scenario we have assumed that cost of borrowing is 8 percent. But the interest rate
might fluctuate in future and if it rises to the level of 10 percent there will be marginal increase of 30
paisa in case of sand filtration technique with both the technologies and 70 paisa in case of reverse
osmosis in the cost of treated water.
Table 3. 8: Tariff for Viable Operation according to Adoption Rate for UASB & MBBR technology
UASB+EA MBBR
Tax Rate:25% Tax Rate: 25%
SAND FILTRATION AR: 10% AR: 20% AR:10% AR:20%
Tariff Imposed on agriculture 5 5 5 5
Tariff Imposed on Industry 13.95 9.70 15.10 10.90
REVERSE OSMOSIS
Tariff Imposed on agriculture 5 5 5 5
Tariff Imposed on Industry 19.05 15.00 20.15 16.20
Table 3. 9: Tariff for Viable Operation according to Adoption Rate for UASB & MBBR technology
UASB+EA MBBR
Tax Rate:0% Tax Rate: 0%
SAND FILTRATION AR: 10% AR: 20% AR:10% AR:20%
Tariff Imposed on agriculture 5 5 5 5
Tariff Imposed on Industry 12.40 8.10 13.45 9.20
REVERSE OSMOSIS
Tariff Imposed on agriculture 5 5 5 5
Tariff Imposed on Industry 16.65 12.55 17.70 13.65
Table 3. 10: Tariff when interest rate changes from 8% to 10% in UASB Technology
UASB+EA MBBR
Tax Rate: 25% |AR: 10% Tax Rate: 25%| AR: 10%
SAND FILTRATION IR: 8% IR: 10% IR:8% IR:10%

54
Tariff Imposed on agriculture 5 5 5 5
Tariff Imposed on Industry 13.95 14.25 15.10 16.40
REVERSE OSMOSIS
Tariff Imposed on agriculture 5 5 5 5
Tariff Imposed on Industry 19.05 19.75 20.15 20.85
Types of Public Private Partnership
Currently, there are five types of PPP models that exist in Indian wastewater sector. Those are
Design Build and Operate (DBO) model, Build Operate and Transfer Model (BOT)-End User PPP, Build
Operate and Transfer (BOT) Third Party Annuity, BOT Third Party PPP (User Charge). It has been
observed that DBO and BOT-End User models are most successful in wastewater sector in India.
DBO
In this case the private entity will Design build and Operate (DBO) for the term of the project which
is 30 years. In this case we assume that Municipal Corporation will fund capital expenditure, provide
land for the tertiary treatment plant and it will build pipeline required for transferring water to
industry and agriculture as deems convenient. If needed municipality will provide the land required
for creation of storage capacity and build the storage capacity. Moreover, Municipality will also bear
demand off-take and therefore revenue risk. Private entity will bear the risk of technology,
construction, and operation and maintenance. In this case the ULBs will have the liberty to decide
the tariff. But private sector will bear the risk of timely payment even though work is completed on
time. This could be one possible option.
BOT End-user PPP
In this case the end user takes the risk of design, technology, construction and municipality ensures
land required for construction and timely availability of sewage and its quality. This is not a feasible
option for us as we intend not only to supply a particular firm but the industry as a whole and
agriculture surrounding the cities. This requires operation at large scale and hence we discard this
option.
BOT- Third Party Annuity
In this case the private agency will bear the risk of major capital expenditure, along technology,
construction and operation and maintenance risk. Municipality takes the risk of partial funding for
capital expenditure, and annuity payment to ensure expected returns of the private operator.
Demand off-take and thereby revenue risk is borne by the ULBs. This is another feasible option.
BOT- Third Party PPP (User Charge)
In this case the risk of capital expenditure can be partially borne by municipality but majority of
capital expenditure has to be borne by private agency along with technology, construction and
operation and maintenance cost. But the major risk of demand off-take and revenue has to be borne
by private agency. This is other possible option but has been the failure in most of the cases as
demand off-take and revenue is often uncertain.
In case we consider the most successful options in wastewater sector in India we find those cases
are successful when revenue risk is taken by government. When revenue risks are taken by
government, often it translates into loss for the government and hence adds to the fiscal burden. It

55
is a well known fact that ULBs have shortage of funds. Therefore adding burden on the government
further cannot be called successful model at all. Therefore, we need to think of some alternative
mechanism which doesn’t add to the burden of government. We argue that there should be full cost
recovery model for sustainability of the venture. Demand off-take is a problem as there are
alternative resources available and present policy environment doesn’t prevent entities from using
those alternate resources and doesn’t make sufficient provision. For example, either use of treated
waste water is not mandatory and that induces industry to use fresh water or even though there is
policy in place government doesn’t make sufficient provision for treated wastewater for reuse by the
industry. Therefore, a stringent policy should be in place and government needs to make provision
for sufficient treated reusable wastewater.
Table 3. 11: Risk Sharing Pattern in different types of PPP
Capital Expenditure Construction Technology Revenue Land
DBO Govt. Private Private Govt. Govt.
BOT End-user PPP Private Private Private Private Govt.
BOT- Third Party Annuity
Govt. & Private Private Private Govt. Govt.
BOT- Third Party PPP (User Charge)
Private Private Private Private Govt.
Since demand off-take is a problem, we can think of recovering operation and maintenance cost in
the beginning, thus keeping the tariff rate low and after few years recovering capital expenditure
through imposition of a fixed cost along with variable cost of production. We see that if we adopt
BOT-Third Party PPP (user charge) which will be self-sustainable the uniform tariff rate that is
applied is Rs. 5 for agriculture and Rs. 19.05 for industry. If we adopt recovering O&M cost policy for
first 5 year and recovering fixed cost in next 25 years, then in first 5 years agriculture sector has to
pay a tariff of Rs. 2 and industry Rs.5. Next a fixed tariff of Rs. 3 for agriculture and Rs. 9.75 for
industry can be applied to make this project sustainable in future with UASB plus EA technology. In
case of MBBR the fixed tariff is marginally higher for industry by 35 paisa.
Table 3. 12: Tariff rate under O&M Plus fixed Tariff System using UASB + EA
REVERSE OSMOSIS BOT-Third Party
PPP (User Charge)
O&M + FIXED COST
5 YEARS
O&M + FIXED COST
25 YEARS
Tariff Imposed on agriculture 5 2 5
Tariff Imposed on Industry(SBR+RO) 19.05 5 14.75
Table 3. 13: Tariff rate under O&M Plus fixed Tariff System using MBBR
REVERSE OSMOSIS BOT-Third Party
PPP (User Charge)
O&M + FIXED COST
5 YEARS
O&M + FIXED COST
25 YEARS
Tariff Imposed on agriculture (SBR+RO) 5 2 5
Tariff Imposed on Industry(SBR+RO) 20.15 5 15.10
Viability Gap Funding (VGF)

56
The problem in this case may be tariff might be on the higher side which agriculture and industry
might oppose. In that case govt. might fix the rate of supplying water to agriculture and industry.
The cost of implementing subsidised rates needs to be borne by Govt. in terms of Viability GAP
Funding (VGF). Assuming that the agriculture and industry will be charged at the rate of Rs. 2/m3 and
Rs.10/m3 7 respectively, let us find out the VGF fund required for sustainability of the project in
Vijaywada.
In Vijaywada if we consider UASB technology along with Sand Filtration and hold the rate at Rs.2/m3
and Rs.10/m3, then VGF fund required to be paid by government is Rs. 42.23 crore. In case of UASB
technology with Reverse Osmosis the VGF fund increases to Rs. 114 crore under the assumption of
adoption rate of 10 percent, income tax 25 percent and interest rate 8 percent.
In Vijaywada if we consider MBBR technology along with Sand Filtration and hold the rate at Rs.2/m3
and Rs.10/m3, then VGF fund required to be paid by government is Rs. 59 crore. In case of MBBR
technology with Reverse Osmosis the VGF fund increases to Rs. 74 crore under the assumption of
adoption rate of 10 percent, income tax 25 percent and interest rate 8 percent.
7 We are assuming this as it is comparable with the Industrial tariff in Bangalore.

57
Annexure 1 Study Area Description
Location & Geographical Area:
Solapur is a city located in the south-western region of the Indian state of Maharashtra, close to its
border with Karnataka. Solapur is located on major Highway, rail routes between Mumbai, Pune,
Bangalore and Hyderabad, with a branch line to the cities of Bijapur and Gadag in the neighbouring
state of Karnataka. It is classified as A1 Tier and B-1 class city by House Rent Allowance (HRA)
classification by the Government of India. It is the 5th biggest city in Maharashtra. It is also the 49th
most populous city and 43rd largest urban agglomeration in India.
Solapur is located at 17.68°N 75.92°E. It has an average elevation of 458 metres (1502 feet). It is
bordered by Ahmednagar district on the north; Osmanabad district on the north and northeast,
Gulbarga district on the southeast and Bijapur Districts on the south of Karnataka State, Sangli
district on the south and southwest; Satara district on the west, and Pune district on the northwest.
It is situated at a distance of 410 km from the Maharashtra State Capital of Mumbai by road and
train. Solapur is at a distance of 245 km from Pune and 305 km from Hyderabad. Solapur is situated
on the Deccan plateau.
As per 2011 census of Solapur city, the population of Solapur in 2011 was 951,118, of whom 50.69
percent were male and 49.31 percent were female. Solapur's population, with the inclusion of its
suburbs in 2012, increased to 1,250,000.
In 2011, the total literates in Solapur city are 710,180 of whom 390,335 are males while 319,845 are
females. The average literacy rate of Solapur city is 74.66 percent of which male and female literacy
was 80.94 and 68.20 percent respectively.
Hinduism is the majority religion in Solapur city with 75.73% followers. Islam is the second most
popular religion, with approximately 20.64% following it. Buddhism 1.62% Jainism by 1.00%,
Christianity 0.73%, others, no religion and not stated 0.28%.
The civic administration of the city is managed by the Solapur Municipal Corporation, which was
established on the Maharashtra Day of 1 May 1964. The corporation oversees the engineering
works, health, sanitation, water supply, administration and taxation in the city. The city is divided
into 135 wards and 6 zones.
The district has good agricultural land and is mainly fed with river Bhima. Additionally, other sub-
rivers - Neera, Mann, Seena, Bhogawati plays an important role in giving necessary water for the
district.

58
Table A1: Financial Analysis and Sequential Batch Reactor (SBR) and Sand Filtration Technique
Profit Loss Statement (Figures are in Rs. Crore)
Year 0 1 2 3 4 5 …………….. 23 24 25 26 27 28 29
Capital Expenditure
Cost of Sand Filters 1.5
Cost of Establishing Reservoirs 30
Cost of Establishing pipeline to supply water to Industry 60
Cost of Land for Reservoir 4.5
Subsidy given by Govt. for Land -4.5
Cost of Land for Tertiary plant 0
Total Capital Expenditure 91.5
Current Expenditure
O&M cost for SBR 4.3 4.5 4.6 4.7 4.9 8.3 8.5 8.8 9.1 9.3 9.6 9.9
Energy Cost 0.1 0.1 0.1 0.1 0.1 0.1 0.1 0.1 0.1 0.1 0.1 0.1
Annual Repair Cost 0.7 0.7 0.7 0.7 0.7 0.7 0.7 0.7 0.7 0.7 0.7 0.7
Chemical Cost 3.3 3.3 3.3 3.3 3.3 3.3 3.3 3.3 3.3 3.3 3.3 3.3
Manpower Cost 0.1 0.1 0.1 0.1 0.1 0.1 0.1 0.1 0.1 0.1 0.1 0.1
Carrying cost of water (Variable cost) 0.0 0.0 0.0 0.0 0.0 0.0 0.0 0.0 0.0 0.0 0.0 0.0
Operation & Maintanance Cost of Storage Facility 0.9 0.9 0.9 0.9 0.9 0.9 0.9 0.9 0.9 0.9 0.9 0.9
Total Current Expenditure 9.4 9.6 9.7 9.8 10.0 13.4 13.7 13.9 14.2 14.4 14.7 15.0
Debt Servicing 2.0 2.0 2.0 2.0 2.0 2.0 2.0 2.0 2.0 2.0 2.0 2.0
Total Outflow 31.5 11.4 11.5 11.7 11.8 11.9 15.4 15.6 15.9 16.1 16.4 16.7 17.0
Revenue
Revenue from Industry 3.1 6.1 9.2 12.3 15.3 30.7 30.7 30.7 30.7 30.7 30.7 30.7

59
Year 0 1 2 3 4 5 …………….. 23 24 25 26 27 28 29
Revenue from Agriculture 0.3 0.7 1.0 1.4 1.7 3.4 3.4 3.4 3.4 3.4 3.4 3.4
Total Revenue 3.4 6.8 10.2 13.6 17.0 34.0 34.0 34.0 34.0 34.0 34.0 34.0
Revenue
Revenue from Industry 3.1 6.1 9.2 12.3 15.3 27.6 27.6 27.6 27.6 27.6 27.6 27.6
Revenue from Agriculture 0.9 1.8 2.7 3.6 4.5 8.0 8.0 8.0 8.0 8.0 8.0 8.0
Total Revenue 4.0 7.9 11.9 15.8 19.8 35.7 35.7 35.7 35.7 35.7 35.7 35.7
Net Profit -31.5 -8.0 -4.7 -1.4 1.8 5.1 18.7 18.4 18.2 17.9 17.6 17.4 17.1
Corporate Tax 0.0 0.0 0.0 0.5 1.3 4.7 4.6 4.5 4.5 4.4 4.3 4.3
Profit After tax -31.5 -8.0 -4.7 -1.4 1.4 3.8 14.0 13.8 13.6 13.4 13.2 13.0 12.8
Net Profit -31.5 -7.4 -3.6 0.2 4.0 7.9 20.3 20.0 19.8 19.5 19.3 19.0 18.7
Corporate Tax 0.0 0.0 0.1 1.0 2.0 5.1 5.0 4.9 4.9 4.8 4.7 4.7
Profit After Tax -31.5 -7.4 -3.6 0.2 3.0 5.9 15.2 15.0 14.8 14.6 14.4 14.2 14.0
NPV@10% ₹ 0.21
NPV@20% ₹ 9.66

60
Table A2: Financial Analysis and Sequential Batch Reactor (SBR) and Reverse Osmosis Technique
Profit Loss Statement (Figures in Rs. crore)
Year 0 1 2 3 4 5 ……… 23 24 25 26 27 28 29
Capital Expenditure
Cost of RO 22.5
Cost of Establishing Reservoirs 30.0
Cost of Establishing pipeline to supply water to Industry 0.0
Cost of Land for Reservoir 4.5
Subsidy given by Govt. for Land -4.5
Cost of Land for Tertiary plant
Total Capital Expenditure 52.5
Current Expenditure
O&M cost for SBR 4.3 4.5 4.6 4.7 4.9 8.3 8.5 8.8 9.1 9.3 9.6 9.9
Energy Cost 0.1 0.1 0.1 0.1 0.1 0.1 0.1 0.1 0.1 0.1 0.1 0.1
Annual Repair Cost 0.7 0.7 0.7 0.7 0.7 0.7 0.7 0.7 0.7 0.7 0.7 0.7
Chemical Cost 3.3 3.3 3.3 3.3 3.3 3.3 3.3 3.3 3.3 3.3 3.3 3.3
Manpower Cost 0.1 0.1 0.1 0.1 0.1 0.1 0.1 0.1 0.1 0.1 0.1 0.1
Carrying cost of water (Variable cost) 0.0 0.0 0.0 0.0 0.0 0.0 0.0 0.0 0.0 0.0 0.0 0.0
Operation & Maintanance Cost of Storage Facility 0.9 0.9 0.9 0.9 0.9 0.9 0.9 0.9 0.9 0.9 0.9 0.9
Total Current Expenditure 9 10 10 10 10 13 14 14 14 14 15 15
Debt Servicing 4.7 4.7 4.7 4.7 4.7 4.7 4.7 4.7 4.7 4.7 4.7 4.7
Total Outflow 52.5 ₹
14 ₹
14 ₹ 14 ₹ 15 ₹ 15
₹ 18 ₹ 18 ₹ 19 ₹ 19 ₹ 19 ₹ 19 ₹ 20

61
Year 0 1 2 3 4 5 ……… 23 24 25 26 27 28 29
Revenue
Revenue from Industry 4.3 8.6 12.9 17.2 21.5 42.9 42.9 42.9 42.9 42.9 42.9 42.9
Revenue from Agriculture 0.3 0.7 1.0 1.4 1.7 3.4 3.4 3.4 3.4 3.4 3.4 3.4
Total Revenue 5 9 14 19 23 46 46 46 46 46 46 46
Revenue
Revenue from Industry 4.3 8.6 12.9 17.2 21.5 38.6 38.6 38.6 38.6 38.6 38.6 38.6
Revenue from Agriculture 0.9 1.8 2.7 3.6 4.5 8.0 8.0 8.0 8.0 8.0 8.0 8.0
Total Revenue 5 10 16 21 26 47 47 47 47 47 47 47
Net Profit -52.5 -9 -5 0 4 9 28 28 28 27 27 27 27
Corporate Tax 0 0 0 1 2 7 7 7 7 7 7 7
Profit After tax -52.5 -9 -5 0 3 6 21 21 21 21 20 20 20
Net Profit -52.5 -9 -4 1 6 11 29 28 28 28 28 27 27
Corporate Tax 0 0 0 2 3 7 7 7 7 7 7 7
Profit After Tax -52.5 -9 -4 1 5 8 21 21 21 21 21 20 20
NPV@10% ₹ 0.03
NPV@20% ₹ 8

62
Annexure 2 Study Area Description
Vijayawada is a city on the banks of Krishna River, in Krishna district of the Indian state of Andhra
Pradesh. It is one of the twelve urban local bodies and is a highly developed area in the Andhra
Pradesh Capital Region. The city is the second largest city in the state by population and third most
densely populated urban built-up areas in the world. The city has a population density of 16462
persons per acre.
Vijayawada has been described as commercial, political, media capital of Andhra Pradesh and is one
of the rapidly growing urban areas in India. The city is the second most populous in the state with a
population of more than one million. It was recognised as a "Global City of the Future" by McKinsey
Quarterly, which expected an increase to GDP of $17 billion by 2025. In October 2018, it was
awarded with ISO 37120 platinum level certification and has been added to the "Global Cities
Registry". It is expected to be the India's 10th fastest growing economy in the world by 2035, a
report published by Oxford Economics.
It also serves as an important national hub for rail traffic being one of the busiest railway station in
the country and is also the largest railway junction on the South Coast Railway network. The city is
home to the largest wagon workshops of Indian Railways. Anchored by Jawaharlal Nehru Auto Nagar
Industrial Estate, Vijayawada in the eastern side, Vijayawada has been called both the most
economically powerful city and the leading political centre of the state of Andhra Pradesh.
Distribution of population
Population explosion had been the major concern in the city as the city had become the part of the
capital region witnessing the increase in migration during the recent years. Meanwhile predominant
agrarian economy is transforming into service and industrial hub serving the capital region.
Table 1 below shows that the villages in the peripheral area of the municipal corporation i.e.,
Gollapudi, Rayanapadu, Paidurupadu, Nidamanuru, Amabapuram, Nunna and Ramavarappadu have
a population density of 10000 and above persons per sq. Km
Table 1: Population density in Vijaywada
Vijayawada (Urban) Vijayawada (Rural) Gannavaram
Area (Sq. Km) 62.00 181.00 207.00
Population 1021806 153591 87027
Density (Persons/ Sq. Km) 16462 846 421
Agricultural and allied activities
Table 2: Land utilisation pattern in Vijaywada
Category Vijayawada (Urban) Vijayawada (Rural) Gannavaram
Area in Ha
Forest area 121.00 3424.00 600.00
Barren & Uncultivable Land 342.00 194.00 983.00
Land put to Non-Agricultural uses
5263.00 3503.00 4530.00

63
Category Vijayawada (Urban) Vijayawada (Rural) Gannavaram
Cultivable waste 0.00 142.00 3.00
Permanent Pastures & other grazing lands
0.00 350.00 25.00
Misc. Tree crops & groves not included in net area sown
0.00 219.00 9.00
Other Fallows 100.00 2663.00 1356.00
Current Fallows 24.00 539.00 1885.00
Net Area Sown 357.00 7115.00 11276.00
Total area 6207.00 18149.00 20667.00

64
Table A1: Financial Analysis of UASB+EA and Sand Filtration Technique
Profit Loss Statement (Figures are in Rs. Crore)
Year 0 1 2 3 4 5 ……… 23 24 25 26 27 28 29
Capital Expenditure
Cost of Sand Filters 30
Cost of Establishing Reservoirs 600
Cost of Establishing pipeline to supply water to Industry 0
Cost of Land for Reservoir 4.5
Subsidy given by Govt. for Land -4.5
Cost of Land for Tertiary plant
Total Capital Expenditure 630
Current Expenditure
O&M cost for UASB+EA 87.2 89.8 92.5 95.3 98.2 167.1 172.1 177.3 182.6 188.1 193.7 199.5
Energy Cost 1.9 1.9 1.9 1.9 1.9 1.9 1.9 1.9 1.9 1.9 1.9 1.9
Annual Repair Cost 13.2 13.2 13.2 13.2 13.2 13.2 13.2 13.2 13.2 13.2 13.2 13.2
Chemical Cost 66.8 66.8 66.8 66.8 66.8 66.8 66.8 66.8 66.8 66.8 66.8 66.8
Manpower Cost 2.5 2.5 2.5 2.5 2.5 2.5 2.5 2.5 2.5 2.5 2.5 2.5
Carrying cost of water (Variable cost) 0.0 0.0 0.0 0.0 0.0 0.0 0.0 0.0 0.0 0.0 0.0 0.0
Operation & Maintanance Cost of Storage Facility 18.0 18.0 18.0 18.0 18.0 18.0 18.0 18.0 18.0 18.0 18.0 18.0
Total Current Expenditure 190 192 195 198 201 269 274 280 285 290 296 302
Debt Servicing 46.78
46.78
46.78
46.78
46.78
46.78
46.78
46.78
46.78
46.78
46.78
46.78
Total Outflow 630 ₹ 236 ₹ 239 ₹ 242 ₹ 244 ₹ 247 ₹ 316 ₹ 321 ₹ 326 ₹ 332 ₹ 337 ₹ 343 ₹ 349
Revenue

65
Year 0 1 2 3 4 5 ……… 23 24 25 26 27 28 29
Revenue from Industry 69.3 138.6 208.0 277.3 346.6 693.2 693.2 693.2 693.2 693.2 693.2 693.2
Revenue from Agriculture 0.3 0.6 0.9 1.3 1.6 3.2 3.2 3.2 3.2 3.2 3.2 3.2
Total Revenue 70 139 209 279 348 696 696 696 696 696 696 696
Net Profit -630 -167 -100 -33 34 101 380 375 370 365 359 353 348
Corporate Tax 0 0 0 9 25 95 94 92 91 90 88 87
Profit After tax -630 -167 -100 -33 26 76 285 281 277 273 269 265 261
₹ 2.55
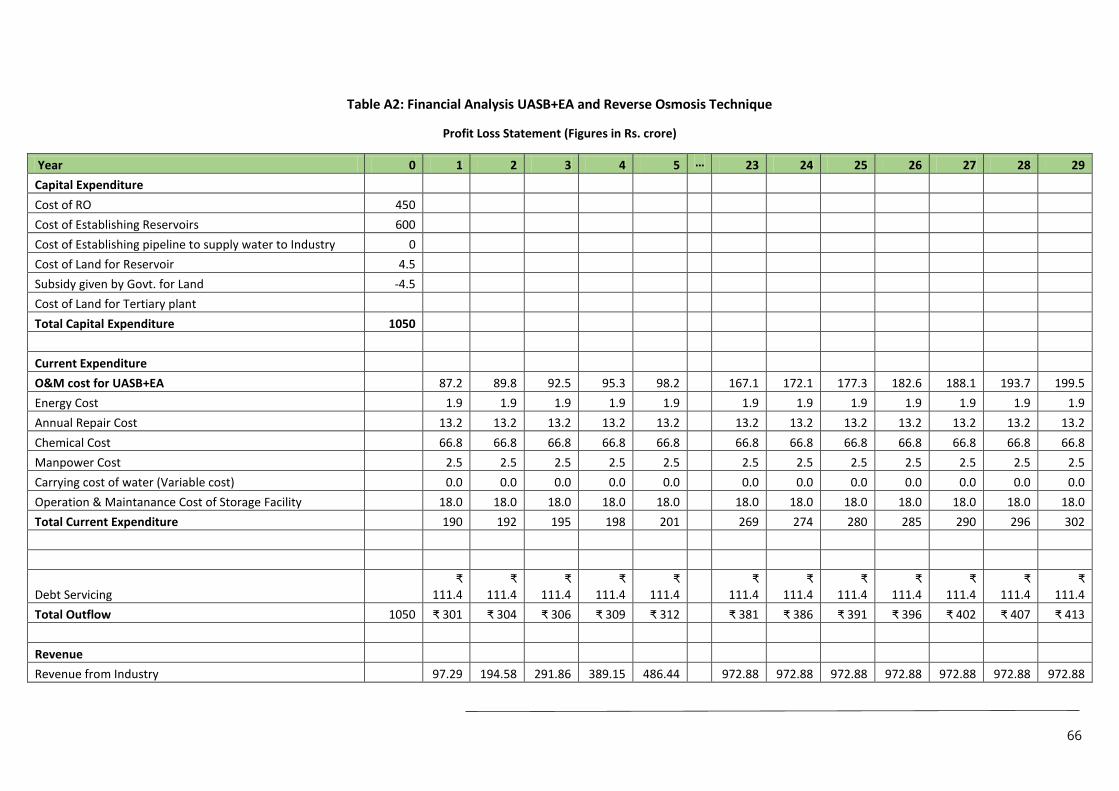
66
Table A2: Financial Analysis UASB+EA and Reverse Osmosis Technique
Profit Loss Statement (Figures in Rs. crore)
Year 0 1 2 3 4 5 … 23 24 25 26 27 28 29
Capital Expenditure
Cost of RO 450
Cost of Establishing Reservoirs 600
Cost of Establishing pipeline to supply water to Industry 0
Cost of Land for Reservoir 4.5
Subsidy given by Govt. for Land -4.5
Cost of Land for Tertiary plant
Total Capital Expenditure 1050
Current Expenditure
O&M cost for UASB+EA 87.2 89.8 92.5 95.3 98.2 167.1 172.1 177.3 182.6 188.1 193.7 199.5
Energy Cost 1.9 1.9 1.9 1.9 1.9 1.9 1.9 1.9 1.9 1.9 1.9 1.9
Annual Repair Cost 13.2 13.2 13.2 13.2 13.2 13.2 13.2 13.2 13.2 13.2 13.2 13.2
Chemical Cost 66.8 66.8 66.8 66.8 66.8 66.8 66.8 66.8 66.8 66.8 66.8 66.8
Manpower Cost 2.5 2.5 2.5 2.5 2.5 2.5 2.5 2.5 2.5 2.5 2.5 2.5
Carrying cost of water (Variable cost) 0.0 0.0 0.0 0.0 0.0 0.0 0.0 0.0 0.0 0.0 0.0 0.0
Operation & Maintanance Cost of Storage Facility 18.0 18.0 18.0 18.0 18.0 18.0 18.0 18.0 18.0 18.0 18.0 18.0
Total Current Expenditure 190 192 195 198 201 269 274 280 285 290 296 302
Debt Servicing ₹
111.4 ₹
111.4 ₹
111.4 ₹
111.4 ₹
111.4 ₹
111.4 ₹
111.4 ₹
111.4 ₹
111.4 ₹
111.4 ₹
111.4 ₹
111.4
Total Outflow 1050 ₹ 301 ₹ 304 ₹ 306 ₹ 309 ₹ 312 ₹ 381 ₹ 386 ₹ 391 ₹ 396 ₹ 402 ₹ 407 ₹ 413
Revenue
Revenue from Industry 97.29 194.58 291.86 389.15 486.44 972.88 972.88 972.88 972.88 972.88 972.88 972.88

67
Year 0 1 2 3 4 5 … 23 24 25 26 27 28 29
Revenue from Agriculture 0.13 0.25 0.38 0.50 0.63 1.26 1.26 1.26 1.26 1.26 1.26 1.26
Total Revenue 97 195 292 390 487 974 974 974 974 974 974 974
Net Profit -1050 -204 -109 -14 81 175 593 588 583 578 572 567 561
Corporate Tax 0 0 0 20 44 148 147 146 144 143 142 140
Profit After tax -1050 -204 -109 -14 60 131 445 441 437 433 429 425 421
₹ 31.7

68
Table A3: Financial Analysis MBBR and Sand Filtration Technique
Profit Loss Statement (Figures in Rs. crore)
Year 0 1 2 3 4 5 … 23 24 25 26 27 28 29
Capital Expenditure
Cost of Sand Filters 30
Cost of Establishing Reservoirs 600
Cost of Establishing pipeline to supply water to Industry 0
Cost of Land for Reservoir 4.5
Subsidy given by Govt. for Land -4.5
Cost of Land for Tertiary plant
Total Capital Expenditure 630
Current Expenditure
O&M cost for MBBR 111.5 114.9 118.3 121.9 125.5 213.7 220.1 226.7 233.5 240.5 247.7 255.2
Energy Cost 1.9 1.9 1.9 1.9 1.9 1.9 1.9 1.9 1.9 1.9 1.9 1.9
Annual Repair Cost 13.2 13.2 13.2 13.2 13.2 13.2 13.2 13.2 13.2 13.2 13.2 13.2
Chemical Cost 66.8 66.8 66.8 66.8 66.8 66.8 66.8 66.8 66.8 66.8 66.8 66.8
Manpower Cost 2.5 2.5 2.5 2.5 2.5 2.5 2.5 2.5 2.5 2.5 2.5 2.5
Carrying cost of water (Variable cost) 0.0 0.0 0.0 0.0 0.0 0.0 0.0 0.0 0.0 0.0 0.0 0.0
Operation & Maintanance Cost of Storage Facility 18.0 18.0 18.0 18.0 18.0 18.0 18.0 18.0 18.0 18.0 18.0 18.0
Total Current Expenditure 214 217 221 224 228 316 322 329 336 343 350 358
Debt Servicing ₹
46.78 ₹
46.78 ₹
46.78 ₹
46.78 ₹
46.78 ₹
46.78 ₹
46.78 ₹
46.78 ₹
46.78 ₹
46.78 ₹
46.78 ₹
46.78
Total Outflow 630 ₹ 261 ₹ 264 ₹ 267 ₹ 271 ₹ 275 ₹ 363 ₹ 369 ₹ 376 ₹ 383 ₹ 390 ₹ 397 ₹ 404
Revenue

69
Year 0 1 2 3 4 5 … 23 24 25 26 27 28 29
Revenue from Industry 75.40 150.8
0 226.1
9 301.5
9 376.9
9 753.9
8 753.9
8 753.9
8 753.9
8 753.9
8 753.9
8 753.9
8
Revenue from Agriculture 0.32 0.63 0.95 1.26 1.58 3.16 3.16 3.16 3.16 3.16 3.16 3.16
Total Revenue 76 151 227 303 379 757 757 757 757 757 757 757
Net Profit -630 -185 -113 -40 32 104 394 388 381 374 367 360 353
Corporate Tax 0 0 0 8 26 99 97 95 94 92 90 88
Profit After tax -630 -185 -113 -40 24 78 296 291 286 281 276 270 265
₹
17.12
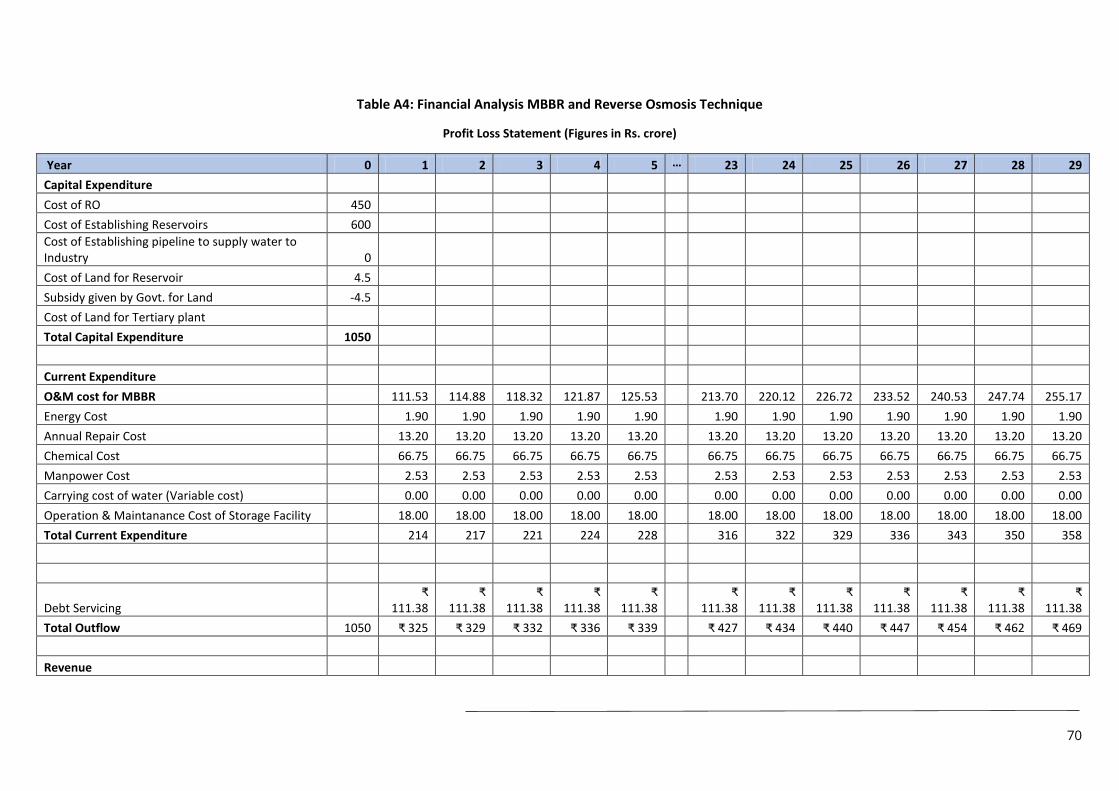
70
Table A4: Financial Analysis MBBR and Reverse Osmosis Technique
Profit Loss Statement (Figures in Rs. crore)
Year 0 1 2 3 4 5 … 23 24 25 26 27 28 29
Capital Expenditure
Cost of RO 450
Cost of Establishing Reservoirs 600
Cost of Establishing pipeline to supply water to Industry 0
Cost of Land for Reservoir 4.5
Subsidy given by Govt. for Land -4.5
Cost of Land for Tertiary plant
Total Capital Expenditure 1050
Current Expenditure
O&M cost for MBBR 111.53 114.88 118.32 121.87 125.53 213.70 220.12 226.72 233.52 240.53 247.74 255.17
Energy Cost 1.90 1.90 1.90 1.90 1.90 1.90 1.90 1.90 1.90 1.90 1.90 1.90
Annual Repair Cost 13.20 13.20 13.20 13.20 13.20 13.20 13.20 13.20 13.20 13.20 13.20 13.20
Chemical Cost 66.75 66.75 66.75 66.75 66.75 66.75 66.75 66.75 66.75 66.75 66.75 66.75
Manpower Cost 2.53 2.53 2.53 2.53 2.53 2.53 2.53 2.53 2.53 2.53 2.53 2.53
Carrying cost of water (Variable cost) 0.00 0.00 0.00 0.00 0.00 0.00 0.00 0.00 0.00 0.00 0.00 0.00
Operation & Maintanance Cost of Storage Facility 18.00 18.00 18.00 18.00 18.00 18.00 18.00 18.00 18.00 18.00 18.00 18.00
Total Current Expenditure 214 217 221 224 228 316 322 329 336 343 350 358
Debt Servicing ₹
111.38 ₹
111.38 ₹
111.38 ₹
111.38 ₹
111.38 ₹
111.38 ₹
111.38 ₹
111.38 ₹
111.38 ₹
111.38 ₹
111.38 ₹
111.38
Total Outflow 1050 ₹ 325 ₹ 329 ₹ 332 ₹ 336 ₹ 339 ₹ 427 ₹ 434 ₹ 440 ₹ 447 ₹ 454 ₹ 462 ₹ 469
Revenue

71
Year 0 1 2 3 4 5 … 23 24 25 26 27 28 29
Revenue from Industry 102.2 204.3 306.5 408.6 510.8 1021.5 1021.5 1021.5 1021.5 1021.5 1021.5 1021.5
Revenue from Agriculture 0.3 0.6 0.9 1.3 1.6 3.2 3.2 3.2 3.2 3.2 3.2 3.2
Total Revenue 102 205 307 410 512 1025 1025 1025 1025 1025 1025 1025
Net Profit -1050 -223 -124 -25 74 173 597 591 584 577 570 563 556
Corporate Tax 0 0 0 19 43 149 148 146 144 143 141 139
Profit After tax -1050 -223 -124 -25 56 130 448 443 438 433 428 422 417
₹
20.33

Annexure 3
For the reuse projects to be viable, the tariff of the treated water should be cost-competitive when
compared to the alternative options available to the industries. The main sources of water for industries
include municipalities, tankers, and extraction of groundwater. However, with regulation on use of
groundwater in different cities, water supply from the municipalities are the most reliable option for
industries.
Fig A: Water tariff in Major Indian Cities Source: PwC, 2016
As can be gleaned from the above table, industrial water tariff in most of metropolitan cities and
industrial towns ranges between 19 Rs./m3 to 146 Rs./m3. The weighted average of industrial water
tariff is estimated to be 50 Rs./m3 which can be considered as a competitive price for setting the tariff
for industrial water. This estimation is in line with the costs of wastewater treatment where the
treatment process can be established to cover most of the industries (i.e. Grade III) which costs 40
Rs./m3.
60 60 60 50
28
60
90
19 19
146
36
120
0
40
80
120
160
Mad
ura
i
Co
imb
ato
re
Ch
en
nai
Jaip
ur
Pu
ne
Mu
mb
ai
Be
nga
luru
Vad
od
ara
Sura
t
De
lhi
Vis
akh
apat
nam
Hyd
era
bad
Water tariff in major Indian cities (INR/KL)

Fig B: Cost of producing treated wastewater Source: PwC, 2016

References:
Central Pollution Control Board (2013), Performance Evaluation of Sewage Treatment Plants Under
NRCD.
Hingorani, P.,(2011), “The Economics of Municipal Sewage Water Recycling and Resue in India”, India
Infrastructure Development Report, pp. 312-323.
Innovation in Waste Water Treatment recycle, Reuse of Sewage Water through Tertiary Treatment
(2014), accessed from http://www.cips.org.in/documents/VC/2014/4th_Sept/TTP_Surat_040914.pdf,
09.11.2019
Jaramillo, F. M. and Restrepo, I. (2017), “Wastewater Reuse in Agriculture: A Review about Its
Limitations and Benefits”, Sustaiability, pp. 1-19.
Vaidya and Vaidya (2010) Market-Based financing of Urban Infrastructure in India. Book chapter in
Kochar and Ramachandran ed. (2010), Building from the bottom. Academic Foundation, New Delhi,
India.
World Economic Forum (WEF). (2016). Reforms to Accelerate the Development of India’s Smart Cities
Shaping the Future of Urban Development & Services.
Ministry of Urban Development (2008), Pooled Finance Development Scheme Toolkits. New Delhi, India.
PricewaterhouseCoopers (PwC). (2016). Closing the water loop: Reuse of treated wastewater in urban
India. Knowledge Paper, PricewaterhouseCoopers Private Limited, India.