Embed Size (px)
Citation preview

Financial Behavior Scale 2
Financial Behavior Scale: Development and Validation
Jeffrey Dew
Utah State University
Jing Jian Xiao
University of Rhode Island
Financial Behavior Scale 3
Abstract
Although financial behavior research is common in the literature, no financial behavior scale
exists that is both multi-dimensional and psychometrically validated. Using data from a national
sample, this study developed and examined the psychometric properties of a new scale of
financial management behaviors. The Financial Behavior Scale (FBS) displayed adequate
reliability (alpha = .81). Further, it was highly associated with other measures of financial
behavior and discriminated between financial behaviors and time use behaviors. Finally, the
scale was highly predictive of savings, consumer debt, and investments. Thus, the FBS appears
to be a reliable and valid scale of financial behaviors.

Financial Behavior Scale 4
The U.S. is a consumer society. Individuals and families in the U.S. engage in financial
behaviors nearly every day. These behaviors influence consumers’ financial wellbeing. For
example, the more consumer credit households have, the more likely they are to default on their
loans, and the less likely they are to have established an IRA (Bernstein, 2004; Sullivan, 1987).
Consequently, personal finance researchers, financial planners, and financial counselors need to
measure financial management behaviors accurately.
Unfortunately, few validated financial management scales exist. Researchers typically
settle for using proxies of financial behavior like consumer debt (e.g., the citations above) rather
than assessing the actual behaviors themselves. Although financial behaviors’ items do exist,
they all fail to either 1) comprehensively measure financial behavior (Xiao, 2008) or 2) be
psychometrically validated. That is, the validated scales found in the literature (e.g.,
Fitzsimmons, Hira, Bauer, & Hafstrom, 1993), typically only measure two financial management
domains, whereas comprehensive measures (Hilgert, Hogarth, & Beverly, 2003) have typically
not been psychometrically validated. Further, none of the validated scales have been validated
using nationally representative data.
A comprehensive and psychometrically strong measure of financial management
behaviors could assist researchers in many fields, not just in consumer studies. For example, in
addition to the obvious financial benefits, sound financial management has both personal and
interpersonal consequences. Consumer debt levels are positively related to anxiety (Drentea &
Lavrakas, 2000), whereas assets positively predict emotional wellbeing (Muntaner, Eaton, Diala,
Kessler, & Sorlie, 1998). Additionally, assets and consumer debts are associated with
relationship quality among cohabiting and married couples (Dew, 2008, 2009a, 2009b). Finally,
for college students, positive financial behaviors are associated with physical health, mental
health, academic success, and life satisfaction (Xiao, Shim, Barber, & Lyons, 2008; Xiao, Tang,
Financial Behavior Scale 5
& Shim, 2008). Such a scale might be useful to more closely examine the microprocesses
associated with social stratification and poverty. Thus, a financial behavior scale could benefit
researchers in many disciplines.
To address the lack of a strong financial behavior instrument, we developed the Financial
Behavior Scale (FBS). We then tested it using the Family Response to Financial Instability
Study – a nationally representative sample.
Measuring Financial Behaviors
One of the main problems with existing measures of financial behavior is that they are
not comprehensive. Of the seven different financial behavior instruments1 we found, most of
them only assessed two domains of financial management (usually savings and cash flow
management). Only two of the measures we examined addressed four domains of financial
management (Hilgert et al., 2003; Xiao et al., 2008). Accordingly, we designed the FBS to
measure five domains – consumption management, cash flow management, credit management,
savings and investments, and insurance – although we will test the structure using factor
analysis.
Measuring many different domains of financial management is important because each
domain can have a serious impact on family life. For example, only one measure we reviewed
asked questions about insurance – the College Student Financial Literacy Survey (Jorgensen,
2007); however, families with inadequate health insurance face an increased risk of unmet health
needs, shoulder the financial burden of expensive medical bills, and may be more likely to
declare bankruptcy (Ayanian, Weissman, Schneider, Ginsburg, & Zaslavsky, 2000; Domowitz &
Sartain, 1999; Short & Graefe, 2003). A lack of health insurance is not the only predictor of
1We examined the financial measures in the following studies: Fitzsimmons et al., 1993; Hilgert et al., 2003;
Jorgensen, 2007; Kim, Garman, & Sorhaindo, 2003; Perry & Morris, 2005; Servon & Kaestner, 2008; Xiao et al.,
2008.
Financial Behavior Scale 6
financial insolvency, however; consumer debt levels are also associated with bankruptcy
(Sullivan, 1987). Thus, even though each of these domains is important in and of itself, when
families use prudent financial behaviors in all of these domains, their financial position becomes
strong.
Another main problem with current instruments of financial behavior is that they have
not been empirically validated. Despite many different studies of financial behaviors,
researchers have empirically validated only one scale – the Frequency of Financial Management
Scale (Fitzsimmons et al., 1993). This effort was notable because it was the first, and still only,
scale of financial behaviors to be psychometrically validated. Unfortunately, however, this scale
has only four items and is not comprehensive – it only measures cash flow management. No
other study that measured financial behaviors validated the items, although a few studies did
report the inter-item reliability.
The Financial Management Behaviors Scale also incorporates observations that
individuals will serially adopt good financial management practices. For example, a national
study of consumers revealed a hierarchical pattern of financial management behaviors (Hilgert,
et al., 2003). Sixty-six percent of the participants practiced cash flow management and 45%
managed credit; however, only 33% used savings management, and only 19% of the participants
invested. This suggests a gradual uptake in financial management behavior with cash-
management developed first, and then credit, savings, and finally investment management.
This behavioral hierarchy may arise because of the financial resource differences across
individuals. For example, when families’ incomes are insufficient to meet all of their financial
obligations, they may not have the financial capacity to save (Garasky, Nielsen, & Fletcher,
2008). Further, certain financial behaviors such as paying off consumer credit may take
precedence over other types such as contributing to a retirement fund (Bernstein, 2004). Further,
Financial Behavior Scale 7
some individuals may not have insurance policies because they do not own property or may not
have access to employer-provided health insurance plans (DeNavas-Walt, Proctor, & Lee, 2006).
To incorporate these insights, we added a financial management behavior that might
precede cash-flow management – consumption management. We felt that since virtually all
individuals are consumers, if nothing else, they could engage in behaviors that would maximize
their consumption benefits. Called “Shopping and Purchases” in the actual scale, we think that
even more individuals will use strategies to manage their purchases than will use cash-flow
management behaviors.
We also included a fifth domain – insurance. Insurance allows individuals to protect
their income, financial assets, and even non-financial assets, such as health, from unexpected
loss. Insurance is an important component of good financial management practices and is a
major policy issue. Thus, we added an insurance domain to the FBS.
Method
Scale Construction
We first examined about 10 articles and reports that used or developed financial
behaviors scales (e.g., Fitzsimmons et al., 1993; Kim, Garman, & Sorhaindo, 2003; Xiao, et al.,
2008). We identified and noted the domains of financial behaviors that these scales measured
but did not include in the scales. For example, we found that cash flow management behaviors
and savings behaviors were frequently measured, whereas credit management and insurance
behaviors were less frequently measured.
Following our review of previous measures, we selected five domains that we felt were
important areas of sound financial management – consumption, cash flow, credit, savings and
investment, and insurance. We then wrote measures related to each of these domains; many of
Financial Behavior Scale 8
them were similar to previous measures. Every domain in the FBS had at least three behavioral
measures.
Our next step was to send a draft of the FBS to nine financial planning and counseling
professionals and financial management scholars. These individuals reviewed the FBS to ensure
that it covered the important domains of good financial management behavior (e.g., content
validity) and that the FBS appeared “on its face” to measure financial management behavior
(e.g., face validity). Our panelists felt that the FBS covered the main domains of good financial
management behavior. Further, the panelists felt that the measures were important aspects of
each domain.
Our last step in creating the draft of the FBS was to utilize panelist suggestions to
strengthen and clarify the FBS. As a result of the input, we added some items and dropped
others. For example, we added an item that more directly measured investment behaviors. We
also reworded some of the items and the scale instructions to make them clearer. The final FBS
draft appears in Appendix 1.
We chose not to incorporate a few of the panelists’ suggestions. For example, some
panelists noted that estate planning and taxes were important missing domains. Despite this, we
left estate planning out because we weren't sure that very many young people engage in estate
planning even if they were otherwise using sound financial management. We left taxes out
because we wanted to keep the scale short and we were not sure that enough individuals utilized
tax minimization strategies to be a useful domain. Additionally, one panelist suggested that we
add attitudinal measures; however, we declined to do this. We wanted to restrict the FBS to
measuring behaviors because behaviors are most proximal to financial outcomes such as
financial stability (Xiao, 2008).
Sample and Data

Financial Behavior Scale 9
The sample was drawn from the Family Response to Financial Instability Study. The
survey was conducted in August 2009 using a stratified random sample design (Dennis &
McCready, 2009). Participants were initially contacted through both random-digit dialing
techniques and address-based sampling. The study recruited households with landlines and cell
phones only in addition to households that had no phone service.
Participants who agreed to be part of the study responded to the survey via the Internet.
If participants did not have access to the Internet, they were given the technology necessary to
connect to it. Out of the 1,517 individuals contacted, 1,014 participated for a 67%
response/participation rate. When combined with the post-stratification weight, the sample is
nationally representative (Dennis & McCready, 2009). For the present study, we used all 1,014
participants.
Measures
FBS Scale Items. We included 17 items as part of the FBS scale (see Appendix 1). The
instruction for 14 of the items stated, “Please indicate how often you have engaged in the
following activities in the past six months.” The response set for these questions ranged from 1
(Never) to 5 (Always). Participants could also report that the item was not applicable. We
thought that these 14 items measured participants’ financial behaviors in four domains –
consumption, cash management, savings and investment, and credit management. Examples of
items from each of these domains include, “comparison shopped when purchasing a product or
service”; “kept a written or electronic record of your monthly expenses”; “bought bonds, stocks,
or mutual funds”; and “maxed out the limit on one or more credit cards,” respectively. Items that
represented less sound financial behaviors (such as maxing out a credit card) were reverse coded
prior to the analysis. The instruction for the three insurance items stated, “Please rate your
behavior regarding insurance within the past year on a scale of 1 – 5.” We asked about the past
Financial Behavior Scale 10
year because sometimes insurance behaviors occur on an annual basis. The response set was the
same as the other items. The insurance items queried participants about health insurance,
property insurance, and life insurance.
Validation Measures. We also included measures that would facilitate our validating the
FBS items. First, we included five different items of financial behavior to make sure that the
FBS demonstrated concurrent validity. We took these items from a paper that measured
“responsible financial behaviors” (Perry & Morris, 2005, p. 304). The instruction on these items
stated, “How do you grade yourself in the following areas?” The items included controlling
spending, paying bills on time, planning for the financial future, providing for oneself and
family, and saving money. On these items, participants could respond from 1 (Poor) to 5
(Excellent).
We also included three items from a time management scale (Fitzsimmons et al., 1993)
for the purposes of assessing discriminant validity. These items asked how often participants
engaged in various time management behaviors from 1 (Never) to 5 (Most of the Time). These
items were planning time use, doing things when they needed to be done, and combining errands
to make only one trip.
Finally, we included measures of participants’ actual levels of savings, investments, and
consumer debt. Although we had initially wanted to measure the exact level of these variables,
the study IRB panel asked us to use scales. Thus, for the savings item, the investment item, and
the consumer debt item, participants could respond that they had between 1 (None) and 9
($100,000 or more).
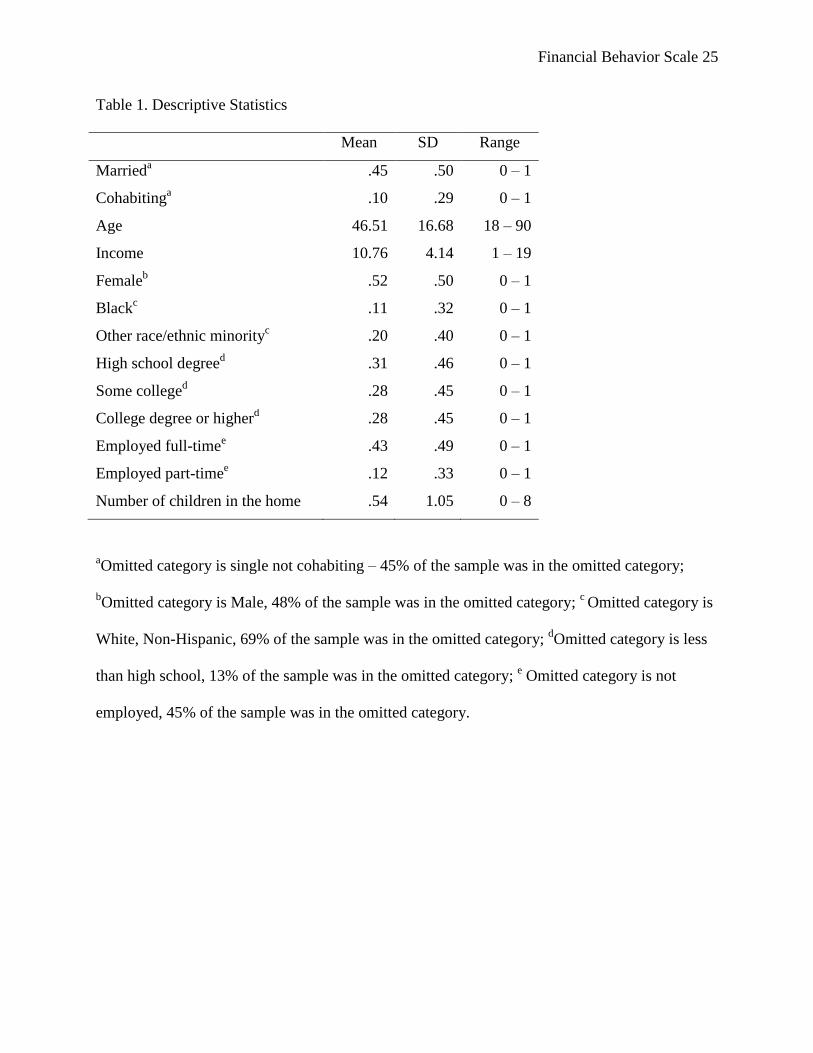
Demographic Characteristics. We also wanted to include demographic characteristics in
the analyses. The control covariates we used in this study included two dichotomous variables
that assessed marital and cohabiting status (single, not cohabiting was the omitted category), age,
Financial Behavior Scale 11
total household income (measured on a scale), gender (male is the omitted category), two
dichotomous variables measuring race and ethnicity (White, Non Hispanic is the omitted
category), three dichotomous variables measuring obtained education (less than high school
degree is the omitted category), two dichotomous variables measuring employment status (not
employed is the omitted category), and number of children in the home. Descriptive statistics for
the demographic measures are found in Table 1.
Handling “Not Applicable” Responses
One problem we faced was that we had allowed participants to respond “not applicable”
on the financial behavior items. Responding “not applicable” was a reasonable response for
some financial behaviors. For example, if an individual does not have dependents, then
purchasing life insurance is not necessarily a sound financial choice. Further, it would be
difficult for a participant to “max out” a credit card if they did not have one. Unfortunately,
some participants responded not applicable at inappropriate times. For example, 35 respondents
reported that the item “paying bills on time” was not applicable and 45 participants reported that
“staying within their budget or spending plan” was not applicable. It would be difficult to
imagine a financial situation where paying bills and staying within a budget would not be
applicable even if only 3 – 5% of the participants chose this response.
Participants who answered not applicable to one or more of the FBS items could not be
included in the factor analyses or the regressions. Consequently, we had to determine what to do
with the data. Out of an abundance of caution, we assessed three possible solutions. First, we
listwise deleted participants with missing data. Second, we set the not applicable responses to
the lowest response based on the assumption that if participants were choosing not applicable
then they were not engaging in that behavior. Third, we used multiple imputation to generate a
plausible value for the missing response. Multiple imputation uses maximum likelihood

Financial Behavior Scale 12
methods to generate five plausible responses for the missing response. Any statistical analyses
that are run are actually run five times (once for each imputed response), and then the results are
synthesized (Rubin, 1987).
We found that results were the same no matter how we dealt with the missing responses.
That is, whether we listwise deleted participants, set their missing responses equal to the lowest
level, or used multiple imputation our factor solution was the same. Although the factor loadings
were slightly different, they were not different enough to influence the factors we extracted. In
this study, we present the results generated by using multiple imputation because we also used
multiple imputation to address the participants who declined to answer questions about their
demographic characteristics such as their income or age.
Results
Factor Analysis
We first ran an exploratory factor analysis to extract the factors among the financial
behaviors. Following the initial factor extraction, we utilized a promax rotation to simplify the
factor solution. Promax is a type of oblique rotation, which allowed the factors to correlate with
each other. Because we believed that couples would adopt financial behaviors serially, we
thought it would be most appropriate to use an oblique rather than an orthogonal rotation.
Deciding on the number of factors to extract continues to be debated in the literature, and
no definitive solution exists (Comrey & Lee, 1992). Although we hypothesized that we would
extract five factors, we used the residual correlations and the scree test (Cattell, 1966) to help us
decide the proper number of factors. Because the idea behind factor analysis is to account for as
much of the variance between the items as possible using latent factors (Comrey & Lee, 1992),
the best models will produce the fewest residual correlations between the items.
Financial Behavior Scale 13
We found that a four-factor solution produced the same number of residual correlations
under .10, as did a five-factor solution (residual correlations available upon request). Thus, the
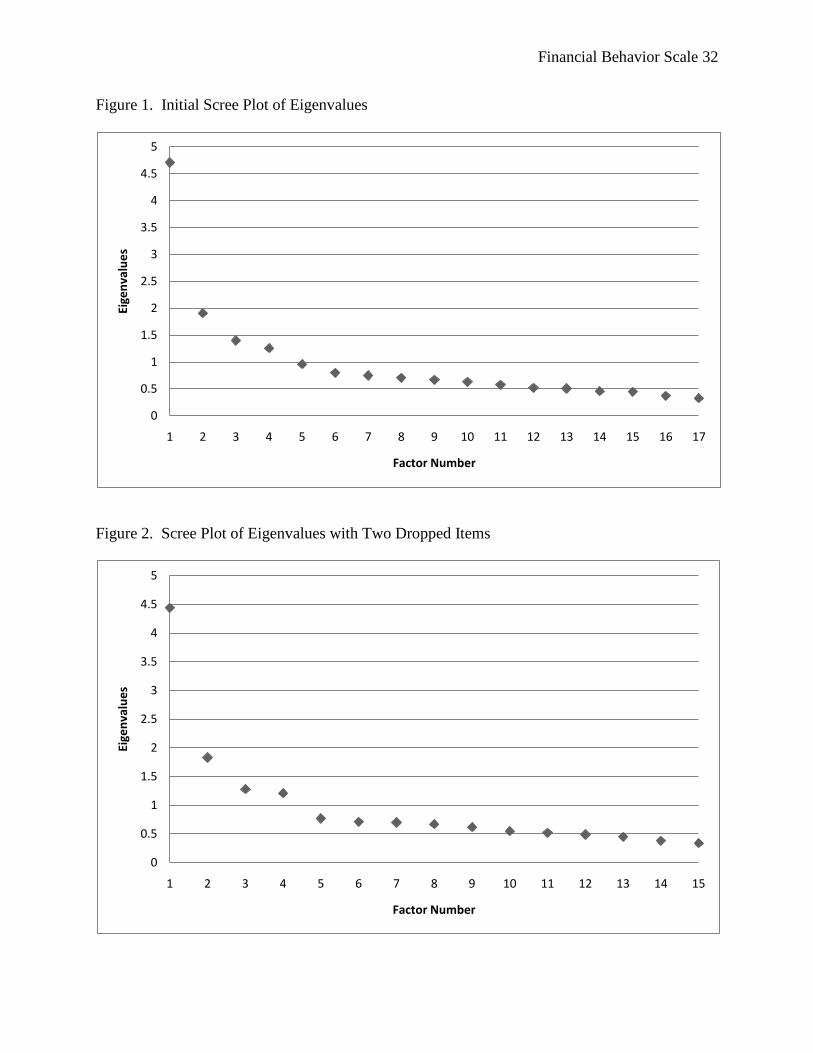
residual correlation test suggested that we retain four or five factors. We then turned to the scree
plot test (see Figure 1). One recommendation is to retain the number of factors corresponding to
the factor that departs from the main line of the lower factors (Comrey & Lee, 1992). Following
the recommendation meant that we should retain 4 or 5 factors. Thus, although we had
originally hypothesized the existence of five domains, we decided to use a four-factor solution
for the sake of parsimony. After we decided to retain four factors, we ran the factor analysis
with the promax rotation. In order for an item to load on one of the factors, we required that it
have a loading of .6 or better.
In reviewing the rotated factor structure, we noticed two problematic items. One of the
items, impulsive buying, did not load well on any of the factors; it never had a factor loading
above .49. When we had specified a five-factor solution, impulsive buying was the only variable
that loaded on the fifth factor. The Cronbach’s alpha for the FBS rose when impulsive buying
was not included. These findings suggested that impulsive buying was tapping a different
construct than the other items. A second item, searching for information prior to a large
purchase, was also problematic. It loaded on multiple factors equally, but never at the .6 level.
Further, when it was in the factor analysis, other items loaded on multiple factors equally. When
we took out information search, all of the other items clearly loaded on one factor. Because
impulsive buying and searching for information proved problematic, we dropped them from the
scale.
We had to evaluate whether dropping these two items altered the number of factors to
extract. The residual correlation analysis did not change – a four-factor solution performed as
well as a five-factor solution. The scree plot was modified somewhat and clearly showed that a
Financial Behavior Scale 14
four-factor solution was most appropriate (Figure 2). This was expected because the impulse
buying item was the only item that loaded well on a fifth factor. Thus, after dropping these two
variables we retained a four-factor solution.
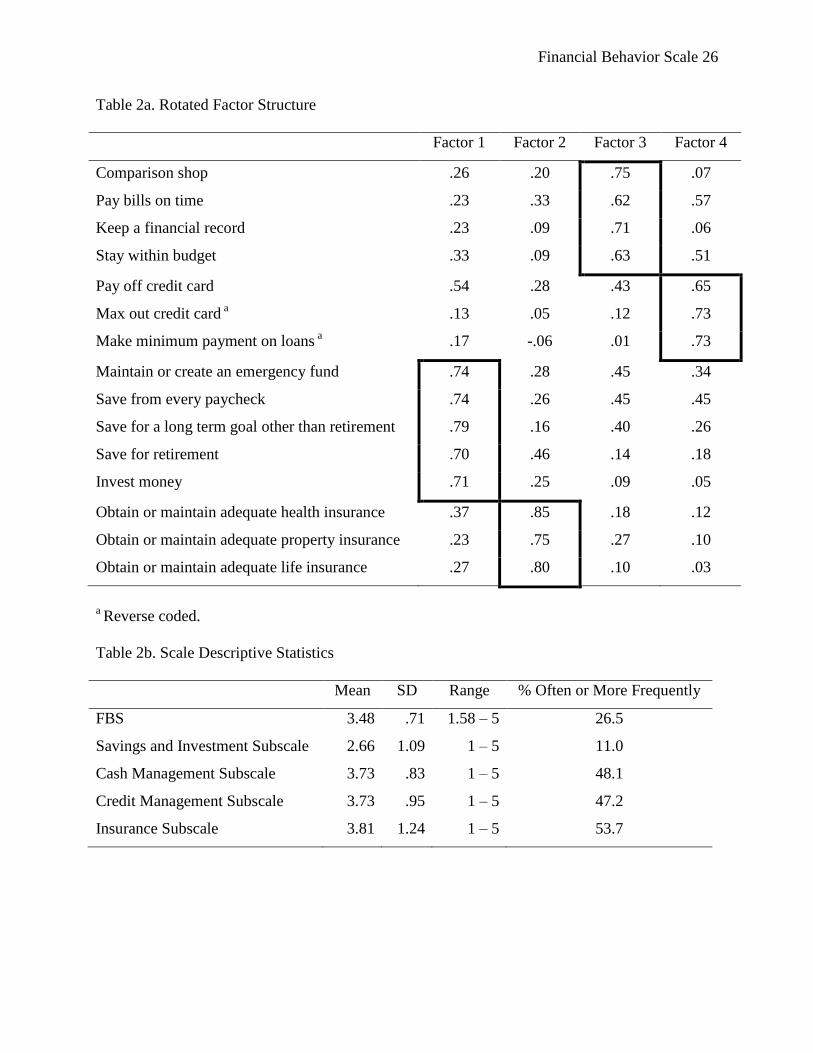
The factor structure after dropping the two variables is found in Table 2a. Five savings
and investment items loaded on Factor 1 with loadings of .70 to .79; hence, we call Factor 1,
“Savings and Investment Behaviors.” The three insurance items loaded best on Factor 2
(loadings between .75 and .85) or the “Insurance Behavior” factor. Items that indicated positive
inflow and outflow management such as keeping a financial record and paying bills on time
loaded on Factor 3 with loadings between .62 and .75. We called this factor the “Cash
Management” factor. Finally, three items indicating positive credit management loaded on
Factor 4. The loadings ranged from .63 to .75, and we called this factor “Credit Management. “
Because we had hypothesized that these different factors would all be related to the same
construct – overall financial behaviors – we made mean-scales out of each factor and factor
analyzed the sub-scales. They loaded on only one factor (results available upon request). This
supports the idea off a larger super-factor of financial behavior. It also supports the use of the
overall FBS score as a measure of financial behaviors. (A revised version of the FBS is found in
Appendix 2).
Financial Behavior Hierarchy
Once we finalized the scale and subscales, we examined whether they displayed the same
sort of hierarchical behavior as previous studies have shown (see Table 2b). Like other studies,
we found that savings and investment behaviors were the least frequent financial behavior.
Unlike other studies, however, we found that cash management and credit management
behaviors were at about the same level and that insurance behaviors were the most common
behavior type.

Financial Behavior Scale 15
Reliability Analysis
We assessed reliability using Chronbach’s alpha. Chronbach’s alpha is equivalent to the
average of all possible split-half reliabilities for a scale. The full FBS had a Chronbach’s alpha
of .81. We also calculated Chronbach alpha scores for the four subscales. The savings and
investments subscale and the insurance subscale also had satisfactory Chronbach alpha scores
(.79 and .73 respectively). Chronbach’s alpha for the cash management subscale and the credit
management subscale were lower (.63 and .56 respectively), indicating that the items that make
up these scales do not hang together as well as the items that make up the savings subscale and
the insurance subscale. These reliability analyses suggest that the overall FBS scale is reliable.
It also suggests that the savings and investment subscales have sufficient reliability. When using
the cash flow management and positive credit behavior subscales, some caution is warranted,
though they still have reasonable levels of reliability.
Validity
Face and Content Validity. We established face validity and content validity by using an
expert panel as noted above. The financial planners and financial counselors agreed that the FBS
items appeared to measure what it purported to measure (face validity). Further, they also agreed
that the FBS measured important financial behaviors (content validity). The method section
gives more details on these two types of validity.
Construct Validity. Establishing construct validity necessitated demonstrating that the
FBS measured what it claimed to measure (Cohen & Swerklik, 1999; Silva, 1993). An
alternative way of thinking of construct validity is that the inferences drawn from the use of the
scale are sound (Silva, 1993). We assessed construct validity by examining convergent validity
and discriminant validity. Convergent validity is demonstrated when a measure is associated
with other items or scales that measure the same construct (Cohen & Swerklik, 1999; Silva,
Financial Behavior Scale 16
1993). Discriminant validity requires that the measure discriminate between the construct it
purports to measure and another construct that it does not purport to measure (Cohen &
Swerklik, 1999; Silva, 1993).
To assess concurrent validity, we regressed a scale that measured financial behaviors
(Perry & Morris, 2005) onto the FBS, the subscales, and the control covariates (refer to Table 3
for the results). The FBS was positively associated with the responsible financial behaviors scale
(b = .94, p < .001, Model 1). Given that the standard deviation of the responsible financial
behaviors was .96, this coefficient represented an effect size of nearly 1.0. Very few of the
control covariates were significant, and the overall model explained more than half of the
variance in the responsible financial behaviors scale. The subscales were also positively
associated with the responsible financial behaviors scale (Table 5, Model 2). Thus, the FBS
displayed remarkable convergent validity.
Turning to discriminant validity, we regressed a measure of time management onto the
FBS and the subscales. We thought that the FBS and the subscales should be somewhat related
to time management because both might tap participants’ organizational skills and any
propensity toward conscientiousness. However, we also reasoned that the FBS and the subscales
should not be too closely related to time management because they measure two different types
of behaviors (Silva, 1993). Financial management behaviors and time management behaviors
are different; therefore, if the FBS could adequately discriminate between these two behaviors,
discriminant validity would be demonstrated.
Table 4 shows the association between the FBS, the subscales, and a time management
scale. The FBS was moderately associated with time management (b = .38, p < .001, Model 1).
Looking at the subscale analysis (Model 2), though, this association was driven almost totally by
the cash management subscale. Savings behaviors, positive credit behavior, and insurance
Financial Behavior Scale 17
behaviors were not related to time management behaviors. Thus, something about keeping a
budget, paying bills on time, etc., is somewhat associated with managing time. Again, this
association may be because participants’ organizational skills generalize across both time
management and financial domains or may simply reflect participants’ conscientiousness.
Because the FBS was not too strongly associated with time management, we suggest that it
demonstrated discriminant validity.
Criterion Validity. Finally, measures that possess criterion validity predict criterion that
they would reasonably be expected to predict if they truly measured what they claimed to
measure (Kaplan & Saccuzzo, 2009; Silva, 1993). Because we had cross-sectional data, we had
to use the concurrent form of criterion validity rather than the predictive form. That is, we could
only show that the FBS predicted criterion that were contemporary with its measure rather than
showing that the FBS predicted the occurrence or levels of future criterion.
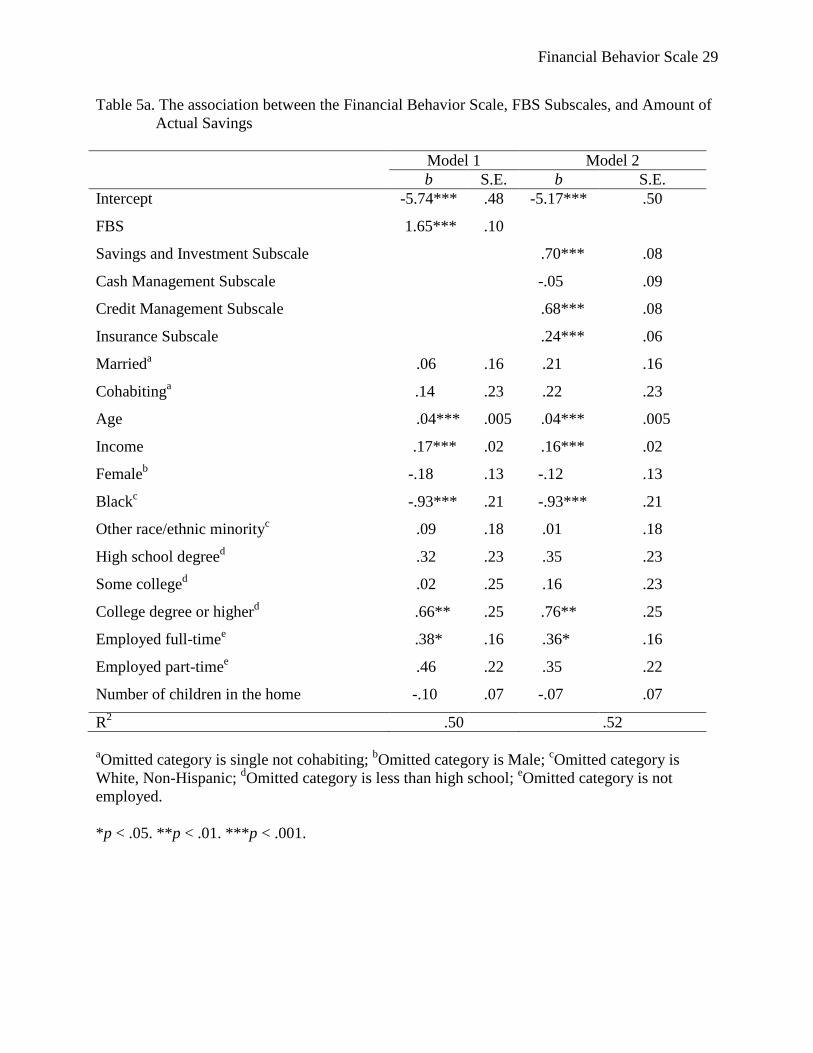
We examined the criterion validity of the FBS and the subscales by regressing actual
levels of savings, investments, and consumer debt onto the FBS and subscales. We believed that
if the FBS truly measured sound financial behaviors, it should be associated with these measures
of actual financial wellbeing. In the models, we also included the control covariates of age,
income, gender, race/ethnicity, education, employment status, and number of children in the
home. Table 5a shows the association between the FBS, the subscales, and savings. For every
one unit increase in the FBS, savings increased by 1.65 (p < .001, Table 5a). The FBS
coefficient represents .6 of a standard deviation for actual level of savings, and the model
explained 50% of the variance in savings. When the subscales were used instead of the full
scale, they performed as we expected. Savings behaviors and positive credit behavior were
strongly associated with actual savings (b = .70 and .63, respectively, p < .001 for both).
Insurance behaviors were also positively associated with savings.
Financial Behavior Scale 18
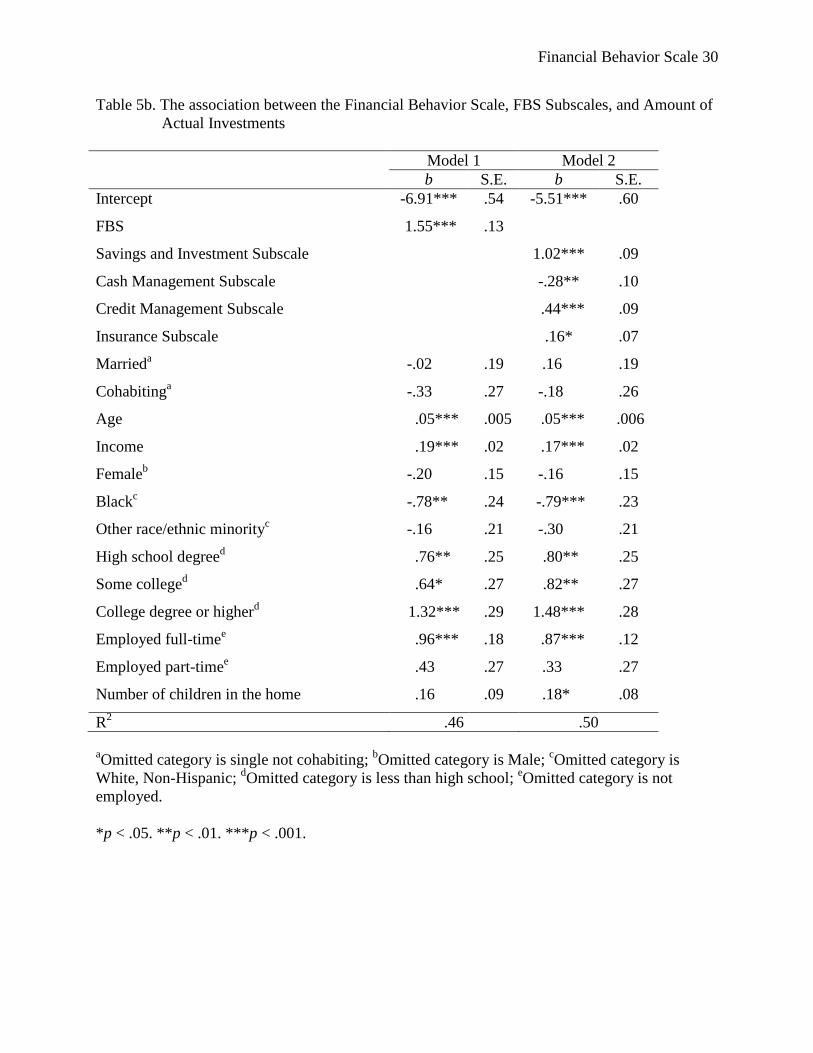
Table 5b shows the association between the FBS, the subscales, and participants’ levels
of investments. Like actual levels of savings, the FBS positively predicted participants’
investments (b = 1.55, p < .001, Model 1). Given that investments had a standard deviation of
3.09, this represents a .5 standard deviation effect size. This model explained 46% of the
variance in investment levels. With the exception of the case management subscale, the other
subscales positively predicted investments (Table 5b, Model 2). The savings and investment
subscale was strongly positively associated with investments, as it should have been.
The negative association between cash management and investment levels was
unexpected. Because tolerance statistics in the multivariate regression equation were within
normal ranges, we suspected a suppressor effect. We first examined the bivariate correlation
between the cash management subscale and investment levels; the correlation was positive (r =
.24, p < .001). Next, we took out the three other financial behavior subscales from the regression
in Model 2. When the other subscales were not in the model, the cash flow subscale positively
predicted investments (b = .36, p < .001, not shown). This regression confirmed the existence of
a suppressor effect. We address this suppressor effect in the discussion section.
Finally, we regressed participants’ reports of their consumer debt level onto the FBS, the
subscales, and the control covariates. The FBS was negatively associated with consumer debt
levels (b = -.90, p < .001; Table 5c, Model 1). This coefficient represents a .38 standard
deviation effect size for consumer debt. Unlike savings and investment levels, however, this
model only explains 16% of the variance in consumer debt.
The analysis of the subscales (Table 5c, Model 2) had both expected and unexpected
results. As we had expected, the savings and investment subscale and the credit management
subscale were negatively associated with participants’ consumer debt (b = -.31 and -1.04
Financial Behavior Scale 19
respectively, both p < .001). Further, the subscale model explained nearly twice the variance as
the FBS model (R2 = .31).
Unexpectedly, however, cash management was not significantly associated with
consumer debt and insurance behaviors positively predicted consumer debt (b = .33, p < .001).
In a regression with just cash management and the control covariates, the cash management
subscale negatively predicted consumer debt (b = -.42, p < .001). This indicates that the cash
management subscale shared enough variance with the other subscales that it did not explain
independent variance in consumer debt when the others are included. In a regression with just
the insurance subscale and the control covariates, insurance behaviors were still positively
associated with consumer debt. We address this unexpected finding in the results.
Together, these findings present strong evidence for criterion validity. The FBS purports
to measure sound financial management behaviors. Both the full scale and the subscales
predicted financial outcomes such as higher savings that are associated with sound financial
management.
Discussion
This study developed the Financial Behavior Scale and examined its psychometric
properties using a nationally representative sample. The scale had adequate reliability
(Chronbach’s alpha was .81). Further, our analyses suggested that the FBS does measure what it
purports to measure. It was strongly associated with another measure of financial behaviors and
discriminated between financial management and time management. Further, it demonstrated
concurrent criterion validity with respect to actual levels of savings, investments, and consumer
debt. In other words, as the financial behavior scale increased, participants’ reported levels of
savings and investments increased, whereas their reports of consumer debt decreased. Using an
exploratory factor analysis, we extracted four factors within the FBS. The subscales – cash

Financial Behavior Scale 20
management, credit management, savings and investments, and insurance – demonstrated
reliability and validity in the analyses.
Despite the overall findings that the FBS and the subscales had solid psychometric
properties, we also found some unexpected results. First, we had written the FBS so that it
would measure five dimensions of financial management, but the factor analysis suggested that a
four-factor solution was the best fitting and most parsimonious solution. Specifically, we had
thought that consumption management would be the fifth dimension of the scale, but two of the
consumption items were problematic and ultimately dropped to increase the strength of the FBS
(compare Appendix 1 and 2). The final consumption measure of comparison shopping
ultimately loaded on the cash management factor.
Two competing possibilities explain the lack of a consumption management dimension to
the scale. The first is that we may have not written acceptable consumption management
questions. Impulse buying was clearly not related to any of the other items in the FBS, and
searching for information prior to a large purchase was problematic. Perhaps other questions
might have more suitably measured consumption management.
The alternative possibility is that consumption behaviors might not load well with the
other financial management behaviors that we measured. A possible explanation is that
consumers may mentally treat spending and money management as two different domains and
treat them differently. Financial behaviors may be relevant to only money management related
activities that do not include spending behavior.
Another finding that failed to materialize was a distinct hierarchy of financial
management behaviors. Although savings and investments had the lowest mean and was
practiced “often” by the lowest number of people, the other behaviors – insurance, cash
management, and credit management – were practiced at about the same level. This conflicts
Financial Behavior Scale 21
with findings from other studies (e.g., Hilgert et al., 2003). Part of the reason for the discrepancy
might be that the data were taken during the recession. The recession simply may have forced
more individuals to engage in cash and credit management behaviors.
Finally, two of the subscales – cash management and insurance – demonstrated some
unanticipated analytic properties. The cash management subscale, for example, seemed
particularly sensitive to the presence of the other subscales. For example, in two of the financial
analyses, cash management was not significant. Yet when run without the subscales in the
model, it was significant. This suggests that cash management shares so much variance with the
other subscales, independently, it does not predict participants’ finances. It is not surprising,
given that the reliability for cash management was lower than that of savings, is not as strong a
predictor.
Cash management also positively predicted investment levels when it was the only
subscale in the analysis, but negatively predicted them in the presence of the other subscales.
This strongly suggests a suppressor effect. A suppressor effect occurs when adding variables to
a multivariate model makes the coefficient in the model become stronger or switch signs. We
speculate that when the other subscales were in the model, cash management might have
reflected conservative or conscientious financial behavior. The discriminant validity test
certainly supported this idea because cash management was the only subscale to be associated
with time management. Thus, after accounting for the other subscales, cash management may
have reflected a conservative orientation toward money, which is associated with lower levels of
investments.
Another surprise in the subscale analysis concerned the insurance behavior subscale.
Although the insurance behaviors positively predicted savings and investment, it also positively
predicted consumer debt. Even in the bivariate analyses, insurance behaviors were positively
Financial Behavior Scale 22
correlated with consumer debt. This may suggest that some participants had maintained their
insurance policies using consumer credit. Many consumers purchase and continue to pay for
insurance policies using credit cards. This is particularly the case with the growth of insurance
websites. Consequently, even though insurance behaviors are positively associated with actual
savings, they may also encourage accumulating consumer debt. These ideas are speculative,
though, and need to be directly tested in future research.
One of the main limitations of this study is that the data were not longitudinal. This
limited our analysis of criterion validity to concurrent validity rather than predictive validity.
Specifically, showing that the FBS positively predicted current savings, investments, and
consumer debt levels strengthened its case as a valid measure. Nevertheless, it would have been
much stronger to show that measures of the FBS predicted future levels of savings, investments,
and consumer debt – or even changes in levels of savings, investments, and consumer debt.
Further, not having longitudinal data limit what we can say about the direction of the relationship
between financial behaviors and actual levels of financial wellbeing.
Although this study has limitations, it also makes a singular contribution. To our
knowledge, this is the first multi-dimensional scale of financial management behavior developed
and validated using nationally representative data. Compared to previous research-based
financial behavior measures, this measure has the comprehensive coverage and possesses
desirable psychometric properties. This study offers researchers and practitioners a reliable and
valid tool to measure financial management behavior. Dependent on the needs of researchers and
practitioners, either the whole scale or subscale can be used in research and counseling projects.

Financial Behavior Scale 23
References
Ayanian, J. Z., Weissman, J. S., Schneider, E. C., Ginsburg, J. A., & Zaslavsky, A. M. (2000).
Unmet health needs of uninsured adults in the United States. Journal of the American
Medical Association, 284, 2061 – 2069.
Bernstein, D. (2004). Household debt and IRAs: Evidence from the survey of consumer finances.
Financial Counseling and Planning, 15, 63 – 72.
Cattell, R. B. (Ed.). (1966). Handbook of Multivariate Experimental Psychology. Chicago: Rand
McNally.
Cohen, R. J., & Swerklik, M. E. (1999). Psychological Testing and Assessment: An Introduction
to Tests and Measurment (4th ed.). Mountain View, CA: Mayfield Publishing.
Comrey, A. L., & Lee, H. B. (1992). A first course in factor analysis. Hillsdale, NJ: Lawrence
Erlbaum Associates.
DeNavas-Walt, C., Proctor, B. D., & Lee, C. H. (2006). Income, poverty, and health insurance
coverage in the United States: 2005 Retrieved January 10, 2007, from
http://www.census.gov/prod/2006pubs/p60-231.pdf
Dennis, M., & McCready, B. (2009). Sample Field Report: Familial Response to Financial
Instability. Menlo Park, CA: Knowledge Networks.
Dew, J. P. (2008). The relationship between debt change and marital satisfaction change in
recently married couples. Family Relations, 57, 60 – 71.
Dew, J. P. (2009a). Financial disagreements and the stability of cohabiting unions. Paper
presented at the Population Association of American, Detroit, MI.
Dew, J. P. (2009b). The Gendered Meaning of Assets for Divorce. Journal of Family and
Economic Issues, 20, 20 – 31.
Domowitz, I., & Sartain, R. L. (1999). Determinants of the consumer bankruptcy decision. The
Journal of Finance, 54, 403 – 420.
Drentea, P., & Lavrakas, P. J. (2000). Over the limit: The association between health, race, and
debt. Social Science and Medicine, 50, 517 – 529.
Fitzsimmons, V. S., Hira, T. K., Bauer, J. W., & Hafstrom, J. L. (1993). Financial management:
Development of Scales. Journal of Family and Economic Issues, 14, 257 – 274.
Garasky, S., Nielsen, R. B., & Fletcher, C. N. (2008). Consumer finances of low-income
families. In J. J. Xiao (Ed.), Advances in Consumer Finance Behavior Research (pp. 223
– 237). New York: Springer.
Financial Behavior Scale 24
Hilgert, M. A., Hogarth, J. M., & Beverly, S. G. (2003). Household financial management: The
connection between knowledge and behavior. Federal Reserve Bulletin, 89, 309 – 322.
Jorgensen, B. L. (2007). Financial literacy of college students: Parental and peer influences.
Unpublished Masters Thesis, The Virginia Polytechnic Institute and State University.
Kaplan, R. M., & Saccuzzo, D. P. (2009). Psychological Testing: Principles, Applications, and
Issues (7th ed.). Belmont, CA: Wadsworth.
Kim, J., Garman, E. T., & Sorhaindo, B. (2003). Relationship among credit counseling clients'
financial wellbeing, financial behaviors, financial stressor events, and health. Financial
Counseling and Planning, 14, 75 – 87.
Muntaner, C., Eaton, W. W., Diala, C., Kessler, R. C., & Sorlie, P. D. (1998). Social class,
assets, organizational control and the prevalence of common groups of psychiatric
disorders. Social Science and Medicine, 42, 2043 – 2053.
Perry, V. G., & Morris, M. D. (2005). Who is in control? The role of self-perception,
knowledge, and income in explaining consumer financial behavior. The Journal of
Consumer Affairs, 39, 299 – 313.
Rubin, D. B. (1987). Multiple imputation for non-response in surveys. New York: Wiley.
Servon, L. J., & Kaestner, R. (2008). Consumer financial literacy and the impact of online
banking on the financial behavior of lower-income bank customers. Journal of
Consumer Affairs, 42, 271 – 305.
Short, P. F., & Graefe, D. R. (2003). Battery-powered health insurance? Stability in the
coverage of the uninsured. Health Affairs, 22, 244 – 255.
Silva, F. (1993). Psychometric foundations and behavioral assessment. Newbury Park, CA:
Sage.
Sullivan, A. C. (1987). Economic factors associated with delinquency rates on consumer
installment debt. Credit Research Center: Working Paper Series, Working Paper #55.
Xiao, J. J. (2008). Appying behavior theories to financial behavior. In J. J. Xiao (Ed.), Handbook
of Consumer Finance Research (pp. 69 – 82). New York: Springer.
Xiao, J. J., Shim, S., Barber, B., & Lyons, A. (2008). Academic success and well-being of
college students:Financial behaviors matter. Tucson, AZ: Take Charge America Institute
for Consumer Financial Education Research.
Financial Behavior Scale 25
Table 1. Descriptive Statistics
Mean SD Range
Marrieda .45 .50 0 – 1
Cohabitinga .10 .29 0 – 1
Age 46.51 16.68 18 – 90
Income 10.76 4.14 1 – 19
Femaleb .52 .50 0 – 1
Blackc .11 .32 0 – 1
Other race/ethnic minorityc .20 .40 0 – 1
High school degreed .31 .46 0 – 1
Some colleged .28 .45 0 – 1
College degree or higherd .28 .45 0 – 1
Employed full-timee .43 .49 0 – 1
Employed part-timee .12 .33 0 – 1
Number of children in the home .54 1.05 0 – 8
aOmitted category is single not cohabiting – 45% of the sample was in the omitted category;
bOmitted category is Male, 48% of the sample was in the omitted category;
c Omitted category is
White, Non-Hispanic, 69% of the sample was in the omitted category; dOmitted category is less
than high school, 13% of the sample was in the omitted category; e Omitted category is not
employed, 45% of the sample was in the omitted category.
Financial Behavior Scale 26
Table 2a. Rotated Factor Structure
Factor 1 Factor 2 Factor 3 Factor 4
Comparison shop .26 .20 .75 .07
Pay bills on time .23 .33 .62 .57
Keep a financial record .23 .09 .71 .06
Stay within budget .33 .09 .63 .51
Pay off credit card .54 .28 .43 .65
Max out credit card a .13 .05 .12 .73
Make minimum payment on loans a .17 -.06 .01 .73
Maintain or create an emergency fund .74 .28 .45 .34
Save from every paycheck .74 .26 .45 .45
Save for a long term goal other than retirement .79 .16 .40 .26
Save for retirement .70 .46 .14 .18
Invest money .71 .25 .09 .05
Obtain or maintain adequate health insurance .37 .85 .18 .12
Obtain or maintain adequate property insurance .23 .75 .27 .10
Obtain or maintain adequate life insurance .27 .80 .10 .03
a Reverse coded.
Table 2b. Scale Descriptive Statistics
Mean SD Range % Often or More Frequently
FBS 3.48 .71 1.58 – 5 26.5
Savings and Investment Subscale 2.66 1.09 1 – 5 11.0
Cash Management Subscale 3.73 .83 1 – 5 48.1
Credit Management Subscale 3.73 .95 1 – 5 47.2
Insurance Subscale 3.81 1.24 1 – 5 53.7

Financial Behavior Scale 27
Table 3. The association between the Financial Behavior Scale and the Responsible Financial
Behavior Scale
Model 1 Model 2
b S.E. B S.E.
Intercept .21 .15 -.03 .16
FBS .94*** .03
Savings and Investment Subscale .29*** .03
Cash Management Subscale .37*** .04
Credit Management Subscale .25*** .03
Insurance Subscale .06* .02
Marrieda -.02 .05 .03 .05
Cohabitinga .03 .09 .08 .07
Age .01 .01 .01 .01
Income .01 .01 .01 .01
Femaleb -.05 .04 -.03 .04
Blackc -.09 .07 -.06 .07
Other race/ethnic minorityc .02 .06 -.04 .05
High school degreed -.18* .07 -.15* .07
Some colleged -.12 .08 -.10 .07
College degree or higherd -.07 .08 -.09 .07
Employed full-timee .03 .05 .07 .05
Employed part-timee -.03 .08 .01 .07
Number of children in the home -.05* .02 -.03 .02
R2 .54 .59
aOmitted category is single not cohabiting;
bOmitted category is Male;
cOmitted category is
White, Non-Hispanic; dOmitted category is less than high school;
eOmitted category is not
employed.
*p < .05. **p < .01. ***p < .001.

Financial Behavior Scale 28
Table 4. The Association between the Financial Behavior Scale and Time Management
Model 1 Model 2
b S.E. B S.E.
Intercept 2.19*** .19 1.81 .20
FBS .38*** .05
Savings and Investment Subscale .03 .03
Cash Management Subscale .39*** .04
Credit Management Subscale -.04 .04
Insurance Subscale .04 .03
Marrieda -.02 .06 -.05 .06
Cohabitinga -.05 .09 -.05 .09
Age -.01 .01 .01 .01
Income -.01 .01 -.01 .01
Femaleb .12* .05 .09 .05
Blackc .08 .08 .09 .08
Other race/ethnic minorityc .06 .07 .04 .07
High school degreed .34*** .09 .36*** .09
Some colleged .48*** .09 .44*** .09
College degree or higherd .61*** .10 .56*** .09
Employed full-timee -.02 .06 .02 .06
Employed Part-timee .02 .08 .07 .08
Number of children in the home .11*** .03 .10*** .03
R2 .16 .23
aOmitted category is single not cohabiting;
bOmitted category is Male;
cOmitted category is
White, Non-Hispanic; dOmitted category is less than high school;
eOmitted category is not
employed.
*p < .05. **p < .01. ***p < .001.
Financial Behavior Scale 29
Table 5a. The association between the Financial Behavior Scale, FBS Subscales, and Amount of
Actual Savings
Model 1 Model 2
b S.E. b S.E.
Intercept -5.74*** .48 -5.17*** .50
FBS 1.65*** .10
Savings and Investment Subscale .70*** .08
Cash Management Subscale -.05 .09
Credit Management Subscale .68*** .08
Insurance Subscale .24*** .06
Marrieda .06 .16 .21 .16
Cohabitinga .14 .23 .22 .23
Age .04*** .005 .04*** .005
Income .17*** .02 .16*** .02
Femaleb -.18 .13 -.12 .13
Blackc -.93*** .21 -.93*** .21
Other race/ethnic minorityc .09 .18 .01 .18
High school degreed .32 .23 .35 .23
Some colleged .02 .25 .16 .23
College degree or higherd .66** .25 .76** .25
Employed full-timee .38* .16 .36* .16
Employed part-timee .46 .22 .35 .22
Number of children in the home -.10 .07 -.07 .07
R2 .50 .52
aOmitted category is single not cohabiting;
bOmitted category is Male;
cOmitted category is
White, Non-Hispanic; dOmitted category is less than high school;
eOmitted category is not
employed.
*p < .05. **p < .01. ***p < .001.
Financial Behavior Scale 30
Table 5b. The association between the Financial Behavior Scale, FBS Subscales, and Amount of
Actual Investments
Model 1 Model 2
b S.E. b S.E.
Intercept -6.91*** .54 -5.51*** .60
FBS 1.55*** .13
Savings and Investment Subscale 1.02*** .09
Cash Management Subscale -.28** .10
Credit Management Subscale .44*** .09
Insurance Subscale .16* .07
Marrieda -.02 .19 .16 .19
Cohabitinga -.33 .27 -.18 .26
Age .05*** .005 .05*** .006
Income .19*** .02 .17*** .02
Femaleb -.20 .15 -.16 .15
Blackc -.78** .24 -.79*** .23
Other race/ethnic minorityc -.16 .21 -.30 .21
High school degreed .76** .25 .80** .25
Some colleged .64* .27 .82** .27
College degree or higherd 1.32*** .29 1.48*** .28
Employed full-timee .96*** .18 .87*** .12
Employed part-timee .43 .27 .33 .27
Number of children in the home .16 .09 .18* .08
R2 .46 .50
aOmitted category is single not cohabiting;
bOmitted category is Male;
cOmitted category is
White, Non-Hispanic; dOmitted category is less than high school;
eOmitted category is not
employed.
*p < .05. **p < .01. ***p < .001.

Financial Behavior Scale 31
Table 5c. The association between the Financial Behavior Scale, FBS Subscales, and Amount of
Actual Consumer Debt
Model 1 Model 2
b S.E. B S.E.
Intercept 3.76*** .50 4.49*** .49
FBS -.90*** .12
Savings and Investment Subscale -.31*** .07
Cash Management Subscale .01 .09
Credit Management Subscale -1.04*** .08
Insurance Subscale .33*** .06
Marrieda .80*** .17 .48** .16
Cohabitinga .44 .25 .31 .23
Age .01 .01 .01* .005
Income .06** .02 .05* .02
Femaleb .18 .14 .02 .13
Blackc -.31 .23 -.40 .21
Other race/ethnic minorityc -.34 .19 -.19 .17
High school degreed .67** .24 .59** .22
Some colleged 1.34*** .25 1.12*** .22
College degree or higherd 1.02*** .27 1.01*** .24
Employed full-timee .70*** .17 .55*** .16
Employed part-timee .58* .23 .59** .22
Number of children in the home .20** .08 .13 .07
R2 .16 .31
aOmitted category is single not cohabiting;
bOmitted category is Male;
cOmitted category is
White, Non-Hispanic; dOmitted category is less than high school;
eOmitted category is not
employed.
*p < .05. **p < .01. ***p < .001.
Financial Behavior Scale 32
Figure 1. Initial Scree Plot of Eigenvalues
Figure 2. Scree Plot of Eigenvalues with Two Dropped Items
0
0.5
1
1.5
2
2.5
3
3.5
4
4.5
5
1 2 3 4 5 6 7 8 9 10 11 12 13 14 15 16 17
Eige
nva
lue
s
Factor Number
0
0.5
1
1.5
2
2.5
3
3.5
4
4.5
5
1 2 3 4 5 6 7 8 9 10 11 12 13 14 15
Eige
nva
lue
s
Factor Number

Financial Behavior Scale 33
Appendix 1
FBS as used in the Family Response to Financial Instability Study
Please indicate how often you have engaged in the following activities in the past six months:
1 = never, 2 = seldom, 3 = sometimes, 4 = often, 5 = always (Also could say “Not Applicable
(N/A)”)
1. Comparison shopped when purchasing a product or service 1 2 3 4 5 (N/A)
2. Bought something on impulse 1 2 3 4 5 (N/A)
3. Searched for information about a big-ticket item before purchasing it 1 2 3 4 5 (N/A)
4. Paid all your bills on time 1 2 3 4 5 (N/A)
5. Kept a written or electronic record of your monthly expenses 1 2 3 4 5 (N/A)
6. Stayed within your budget or spending plan 1 2 3 4 5 (N/A)
7. Paid off credit card balance in full each month
1 2 3 4 5 (N/A)
8. Maxed out the limit on one or more credit cards 1 2 3 4 5 (N/A)
9. Made only minimum payments on a loan 1 2 3 4 5 (N/A)
10. Began or maintained an emergency savings fund 1 2 3 4 5 (N/A)
11. Saved money from every paycheck 1 2 3 4 5 (N/A)
12. Saved for a long-term goal such as a car, education, home, etc. 1 2 3 4 5 (N/A)
13. Contributed money to a retirement account 1 2 3 4 5 (N/A)
14. Bought bonds, stocks, or mutual funds 1 2 3 4 5 (N/A)
Please rate your behavior regarding insurance within the past year on a scale of 1 – 5.
1 = never, 2 = seldom, 3 = sometimes, 4 = often, 5 = always
15. Maintained or purchased an adequate health insurance policy 1 2 3 4 5 (N/A)
16. Maintained or purchased adequate property insurance like auto or homeowners insurance
1 2 3 4 5 (N/A)
17. Maintained or purchased adequate life insurance
1 2 3 4 5 (N/A)

Financial Behavior Scale 34
Appendix 2
Revised FBS
Please indicate how often you have engaged in the following activities in the past six months:
1 = never, 2 = seldom, 3 = sometimes, 4 = often, 5 = always
1. Comparison shopped when purchasing a product or service 1 2 3 4 5
2. Paid all your bills on time 1 2 3 4 5
3. Kept a written or electronic record of your monthly expenses 1 2 3 4 5
4. Stayed within your budget or spending plan 1 2 3 4 5
5. Paid off credit card balance in full each month
1 2 3 4 5
6. Maxed out the limit on one or more credit cards 1 2 3 4 5
7. Made only minimum payments on a loan 1 2 3 4 5
8. Began or maintained an emergency savings fund 1 2 3 4 5
9. Saved money from every paycheck 1 2 3 4 5
10. Saved for a long-term goal such as a car, education, home, etc. 1 2 3 4 5
11. Contributed money to a retirement account 1 2 3 4 5
12. Bought bonds, stocks, or mutual funds 1 2 3 4 5
Please rate your behavior regarding insurance within the past year on a scale of 1 – 5.
1 = never, 2 = seldom, 3 = sometimes, 4 = often, 5 = always
13. Maintained or purchased an adequate health insurance policy 1 2 3 4 5
14. Maintained or purchased adequate property insurance like auto or homeowners insurance
1 2 3 4 5
15. Maintained or purchased adequate life insurance
1 2 3 4 5