Embed Size (px)
Citation preview

financial andstrategicupdate
2
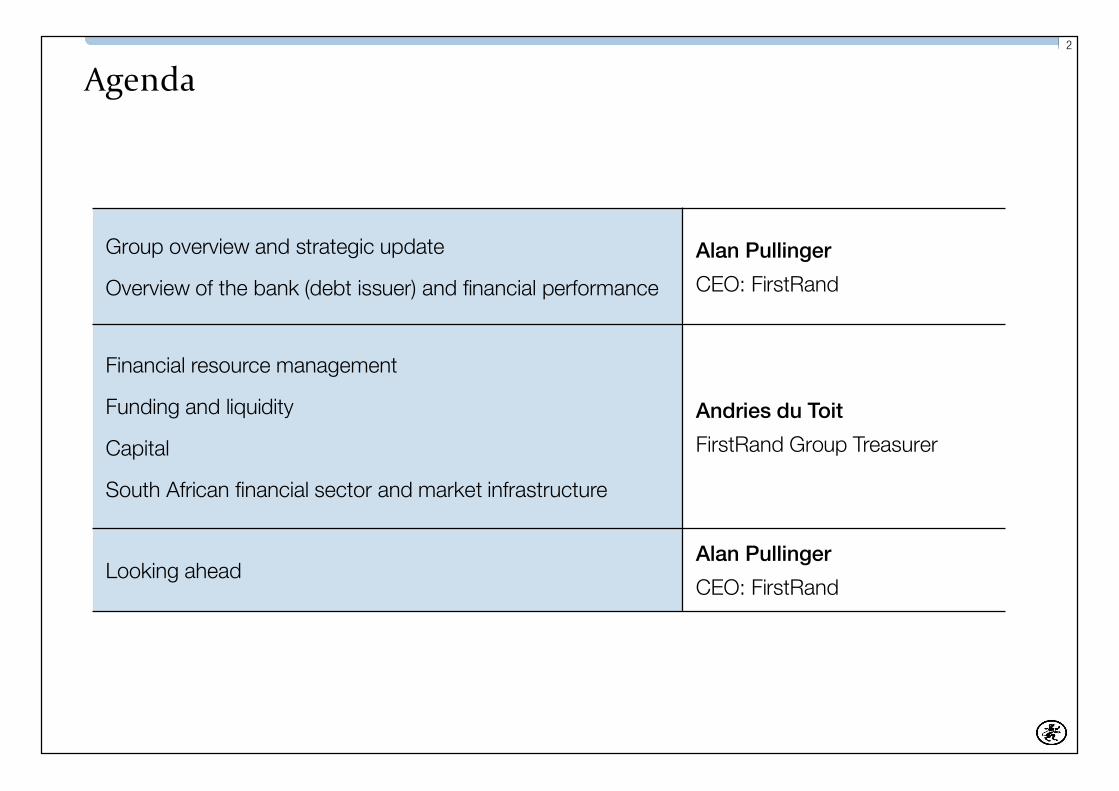
Agenda
Group overview and strategic update
Overview of the bank (debt issuer) and financial performance
Alan Pullinger
CEO: FirstRand
Financial resource management
Funding and liquidity
Capital
South African financial sector and market infrastructure
Andries du Toit
FirstRand Group Treasurer
Looking aheadAlan Pullinger
CEO: FirstRand
group overviewand strategic
update

4
FirstRand’s portfolio
Group-widefunctions
Retail and commercialbanking, insuranceand investments
Corporate andinvestment banking
Vehicle assetfinance and fleet
management
Assetmanagement
LISTED HOLDING COMPANY (FIRSTRAND LIMITED, JSE: FSR)
UK specialistbank
5
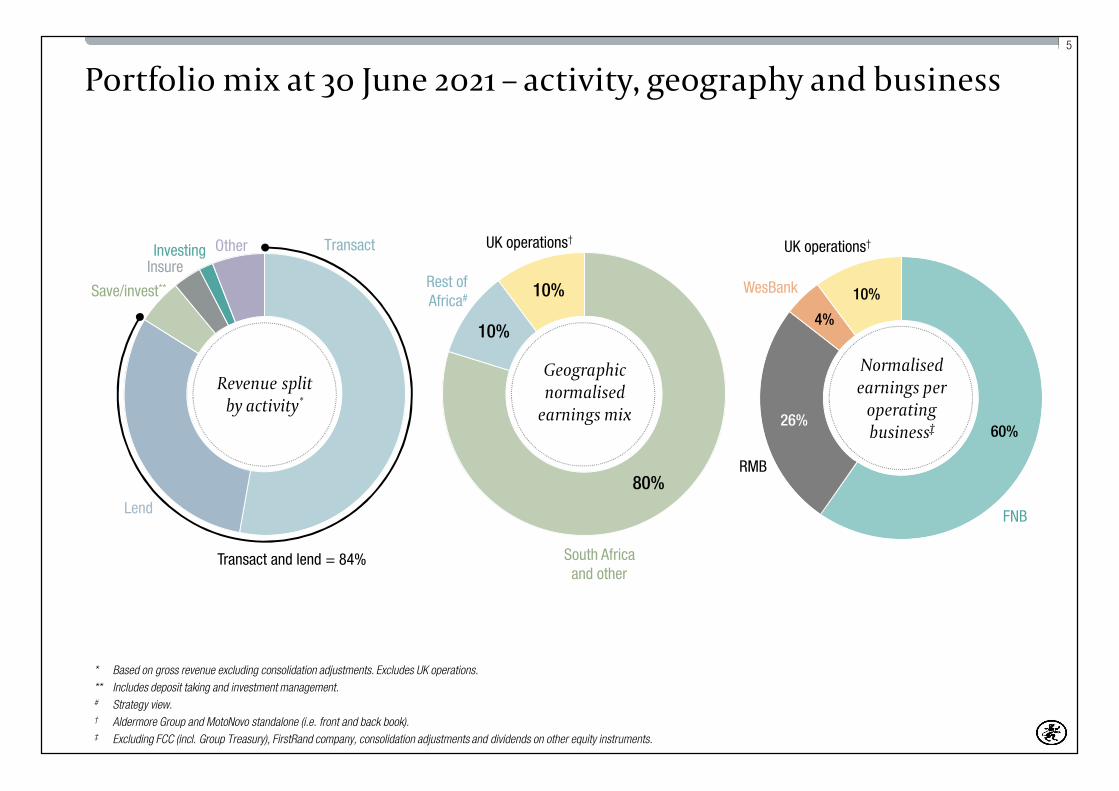
Portfolio mix at 30 June 2021 – activity, geography and business
80%
10%
10%
Transact
Lend
Insure
Save/invest**
Other
60%26%
4%
10%
Normalisedearnings per
operatingbusiness‡
WesBank
RMB
FNB
* Based on gross revenue excluding consolidation adjustments. Excludes UK operations.** Includes deposit taking and investment management.# Strategy view.† Aldermore Group and MotoNovo standalone (i.e. front and back book).‡ Excluding FCC (incl. Group Treasury), FirstRand company, consolidation adjustments and dividends on other equity instruments.
UK operations†UK operations†
Rest ofAfrica#
Geographicnormalised
earnings mix
South Africaand other
Revenue splitby activity*
Investing
Transact and lend = 84%
6
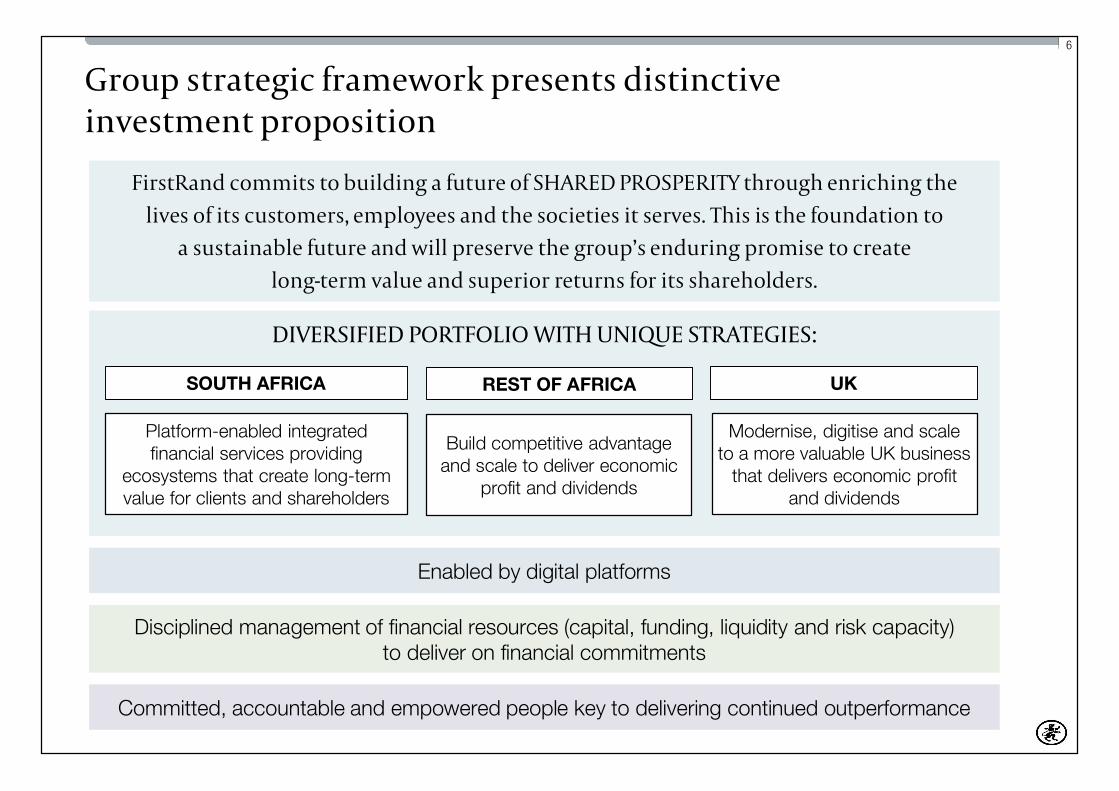
DIVERSIFIED PORTFOLIO WITH UNIQUE STRATEGIES:
Group strategic framework presents distinctiveinvestment proposition
FirstRand commits to building a future of SHARED PROSPERITY through enriching thelives of its customers, employees and the societies it serves. This is the foundation to
a sustainable future and will preserve the group’s enduring promise to createlong-term value and superior returns for its shareholders.
SOUTH AFRICA
Platform-enabled integratedfinancial services providing
ecosystems that create long-termvalue for clients and shareholders
REST OF AFRICA
Build competitive advantageand scale to deliver economic
profit and dividends
Committed, accountable and empowered people key to delivering continued outperformance
UK
Modernise, digitise and scaleto a more valuable UK business
that delivers economic profitand dividends
Enabled by digital platforms
Disciplined management of financial resources (capital, funding, liquidity and risk capacity)to deliver on financial commitments
7
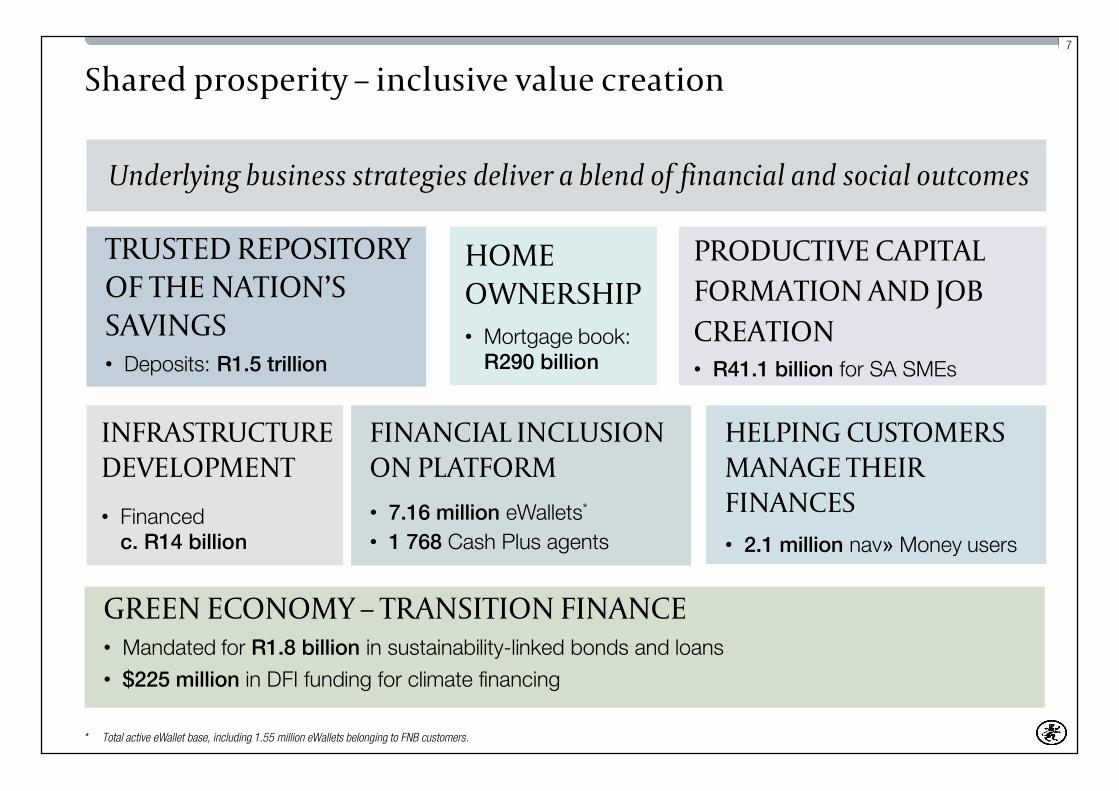
Shared prosperity – inclusive value creation
Underlying business strategies deliver a blend of financial and social outcomes
HOMEOWNERSHIP• Mortgage book:
R290 billion
PRODUCTIVE CAPITALFORMATION AND JOBCREATION• R41.1 billion for SA SMEs
INFRASTRUCTUREDEVELOPMENT
• Financedc. R14 billion
TRUSTED REPOSITORYOF THE NATION’SSAVINGS• Deposits: R1.5 trillion
GREEN ECONOMY – TRANSITION FINANCE• Mandated for R1.8 billion in sustainability-linked bonds and loans
• $225 million in DFI funding for climate financing
FINANCIAL INCLUSIONON PLATFORM• 7.16 million eWallets*
• 1 768 Cash Plus agents
HELPING CUSTOMERSMANAGE THEIRFINANCES• 2.1 million nav» Money users
* Total active eWallet base, including 1.55 million eWallets belonging to FNB customers.

8
• FirstRand implemented specific actions in March 2020 to emerge from Covid-19 withlimited vulnerabilities and with capital to fully take advantage of the recovery
• Anchored business to financial resource management principles:
• Carefully price for financial resources
• Appropriately provide against lending portfolios
• Cost management focus
• Balance sheet appropriately tilted to macro outlook and strengthened further
• Accrete capital and NAV – deployment of capital to reflect revised cost of equity
• Group resumed paying dividends at the bottom end of its cover range (56% payout)
Adherence to the pandemic response FRM framework protectedthe balance sheet and underpinned ROE recovery
Emerged with strong balance sheet and capital for growth
9
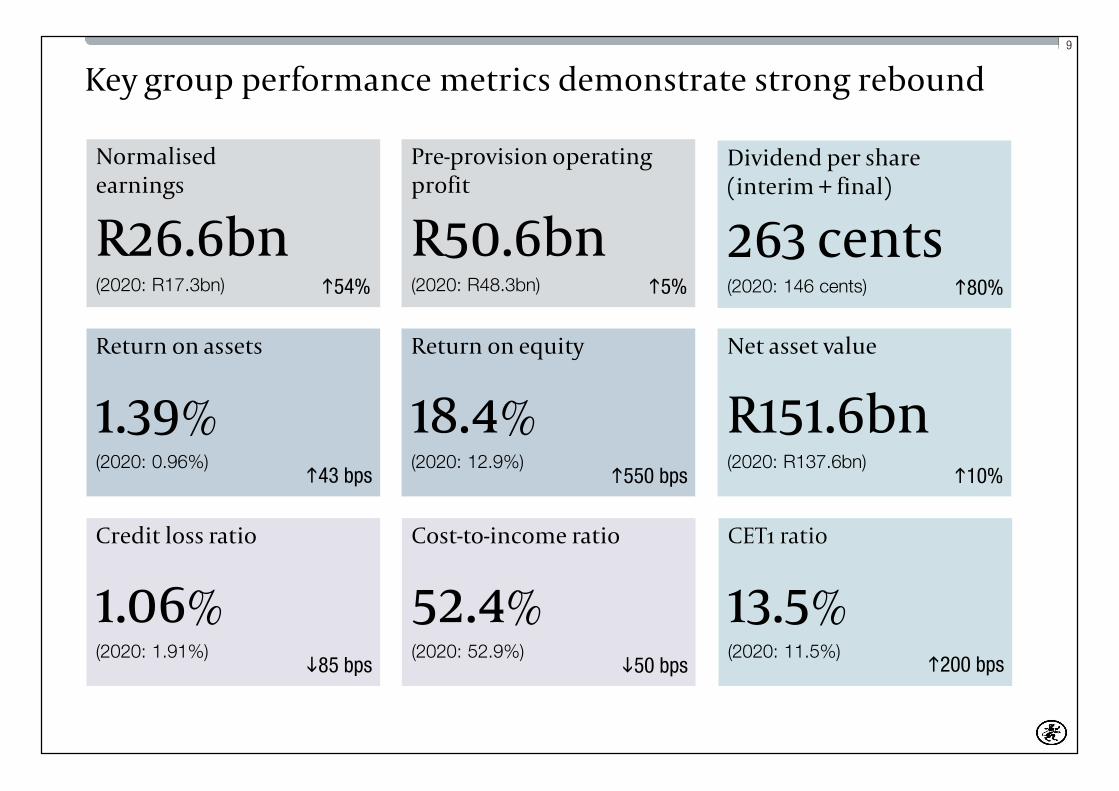
Key group performance metrics demonstrate strong rebound
Normalisedearnings
R26.6bn(2020: R17.3bn)
Dividend per share(interim + final)
263 cents(2020: 146 cents)
Pre-provision operatingprofit
R50.6bn(2020: R48.3bn)
Return on assets
1.39%(2020: 0.96%)
Return on equity
18.4%(2020: 12.9%)
CET1 ratio
13.5%(2020: 11.5%)
Credit loss ratio
1.06%(2020: 1.91%)
Cost-to-income ratio
52.4%(2020: 52.9%)
54% 80%5%
43 bps 550 bps
200 bps85 bps 50 bps
Net asset value
R151.6bn(2020: R137.6bn)
10%

overview ofthe bank
(debt issuer)and financialperformance

11
FirstRand Bank is a wholly-owned subsidiary of FirstRand Limited
* Trading as FNB Channel Islands.
FIRSTRAND BANK LIMITED (FRB)
100%
DIVISIONS
BRANCHESLondon, Guernsey* and India
REPRESENTATIVE OFFICESKenya, Angola and Shanghai
Retail and commercial
Corporate and institutional
Vehicle asset finance
DEBT ISSUER
Other activities
Rest of Africa
Investment management
FirstRand InvestmentHoldings (Pty) Ltd (FRIHL)
FirstRand EMA Holdings(Pty) Ltd (FREMA)
FirstRand InvestmentManagement Holdings Ltd
Insurance
FirstRand InsuranceHoldings (Pty) Ltd
OTHER WHOLLY-OWNEDSUBSIDIARIES OF FIRSTRAND LIMITED
UK banking and hard currencyplatform
FirstRand InternationalLimited (Guernsey) (FRI)
SA banking
LISTED HOLDING COMPANY (FIRSTRAND LIMITED, JSE: FSR)

12
FRB a significant contributor to group’s financial position
75%
25%
72%
28%
FirstRand Bank
Other legal entities*
91%
2%5% 2%
United Kingdom
South Africa
Rest of Africa
69%
31%
FirstRand Bank
Other legal entities*
FirstRand Bank
Other legal entities*
* Include FREMA, FRIHL, FirstRand Investment Management Holdings Ltd, FirstRand Insurance Holdings (Pty) Ltd and FirstRand International Limited (Guernsey), the holding company of Aldermore.Sources: Analysis of financial results for the year ended 30 June 2021 for FirstRand Limited and FirstRand Bank Limited.
Other
Groupnormalised
earningsGroupassets
Groupnormalised
net assetvalue
FRBgeographical
advancessplit

13
SA banking business remains underpin to group’s growth
Build competitive advantageand scale to deliver economic
profit and dividends
Modernise, digitise and scaleto a more valuable UK business
that delivers economic profitand dividends
SOUTH AFRICA UKREST OF AFRICA
• Grow at macro +
• More customers
• More to customers
• All done more efficiently
• Continue to strengthen competitive positioning
• Refreshed value props for re-segmented customer bases (entry, retail and private banking)
• Underpinned by market-leading behavioural rewards programme (eBucks)
• Ongoing evolution of platform
• Optimisation mindset
• Disciplined allocation of financial resources
Platform-enabled integrated financialservices providing ecosystems that
create long-term value for clients andshareholders

14
The bank supports the group’s rest of Africa strategy
• The bank’s balance sheet is utilised inRMB’s cross-border lending and tradefinance activities into the rest of Africa
• Have also established hard currencyplatform in Mauritius for group’s rest ofAfrica dollar exposures
Build competitive advantageand scale to deliver economic
profit and dividends
Modernise, digitise and scaleto a more valuable UK business
that delivers economic profitand dividends
SOUTH AFRICA UKREST OF AFRICA
Platform-enabled integrated financialservices providing ecosystems that
create long-term value for clients andshareholders
15
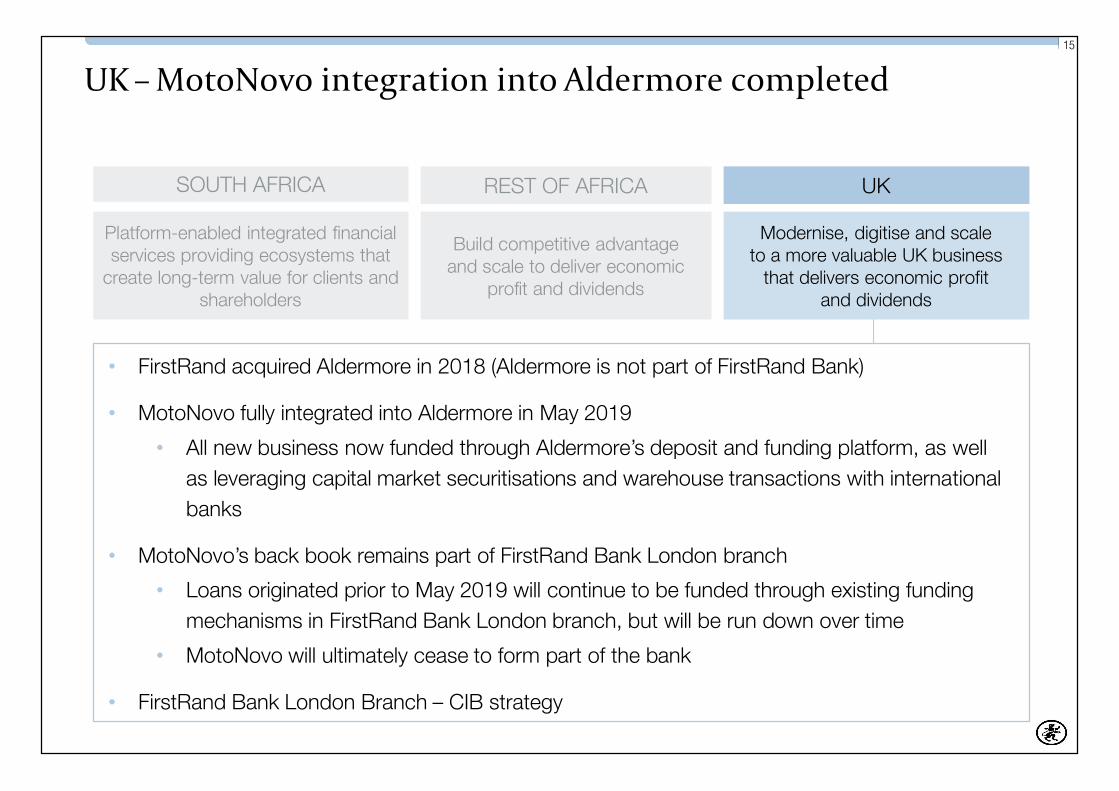
UK – MotoNovo integration into Aldermore completed
• FirstRand acquired Aldermore in 2018 (Aldermore is not part of FirstRand Bank)
• MotoNovo fully integrated into Aldermore in May 2019
• All new business now funded through Aldermore’s deposit and funding platform, as wellas leveraging capital market securitisations and warehouse transactions with internationalbanks
• MotoNovo’s back book remains part of FirstRand Bank London branch
• Loans originated prior to May 2019 will continue to be funded through existing fundingmechanisms in FirstRand Bank London branch, but will be run down over time
• MotoNovo will ultimately cease to form part of the bank
• FirstRand Bank London Branch – CIB strategy
Build competitive advantageand scale to deliver economic
profit and dividends
Modernise, digitise and scaleto a more valuable UK business
that delivers economic profitand dividends
SOUTH AFRICA UKREST OF AFRICA
Platform-enabled integrated financialservices providing ecosystems that
create long-term value for clients andshareholders

16
Key performance metrics (normalised)
2021 2020 % change
Earnings (R million) 19 032 13 762 38
Pre-provision operating profit (R million) 37 366 35 778 4
Net interest margin (%) 4.72 4.65
Credit loss ratio (%) 1.23 2.00
Cost-to-income ratio (%) 54.0 54.8
Return on equity (%) 19.1 14.6
Return on assets (%) 1.35 1.02
Tier 1 ratio* (%) 15.2 12.8
CET1 ratio* (%) 14.5 12.3
LCR (%) 117 124
NSFR (%) 122 116
Average gross loan-to-deposit ratio (%) 81.0 85.1
Gross advances (R million) 896 424 905 712 (1)
* Including foreign branches. Ratios include unappropriated profits and the transitional impact of IFRS 9.

17
0.95
2.00
1.23
2019 2020 2021
Earnings close to pre-pandemic levels, ahead of expectations
21 152
13 762
19 032
0
5 000
10 000
15 000
20 000
25 000
2019 2020 2021
Normalised earningsR million
8 460
18 269
11 115
2019 2020 2021
Credit impairment chargeR million
Credit loss ratio%
38%
39%
10%

18
13 762
19 032
1 331
7 154
1 102(647)
(3 670)
0
3 000
6 000
9 000
12 000
15 000
18 000
21 000
24 000
27 000
2020 NII Impairments NIR Opex Tax and other 2021
Lower impairments are largest driver of earnings growth
Normalised earningsR million
38%
81%1%3%
39%
3%
Effective tax rate2021: 25.5%
(2019: 24.4%)

19
1.03% 1.10% 0.97%
11.34% 13.25% 12.00%
44.7%46.2%
46.4%
Jun 20 Dec 20 Jun 21
Provisioning strengthened balance sheet further
Provisions and coverage
Coverage%
Stage 3/NPLsStage 2Stage 1
Total provisions
R40 031m R38 469mR37 772m

20
750
800
850
900
950
1 000
Jun 20 FNB WesBank RMB RMB repos Other* Dec 20 FNB WesBank RMB RMB repos Other* Jun 21
Declining advances trend started to reverse in FNB in second half
R billion
1%
Jun 21 vs Dec 20▲1%
Dec 20 vs Jun 202%
* Includes UK operations, GTSY and other, and currency impact.

21
736
792
-
100
200
300
400
500
600
700
800
900
2020 2021
Deposit franchise growth resulted in improved funding mix
• Strong deposit growth across all operating
businesses
• Driven by precautionary savings,
compelling savings propositions and
customer acquisition
• Slight contraction in advances
• Bank’s institutional funding reduced to 27.2%
of total funding (2020: 31.7%)
• Increased liquidity buffers (invested in short-
dated government treasury bills)
Deposit franchiseR billion
8%
financialresource
management

23
Disciplined approach to financial resource management
Balance sheetstrength
Capitalmanagement
• Strong capital position
• Appropriate buffers in excess of minimum
• Distance-to-trigger/default
Assets • Quality
Liabilities • Integrated funding and liquidity
Earnings resilience, volatility and growth
• Quality
• Diversification
• Risk appetite

24
FUNDING CAPITAL RISK APPETITE MEASURES
• Diversify across business,markets, currencies, maturitiesand instrument types
• Flexibility across markets,products and investors
• Focus on alignment of fundingstrategies to asset growth andcomposition, incorporatingrisk-adjusted pricing
• Continued evolution of fundinginstruments and mix to reduceregulatory volatility andoptimise asset/liabilitymatching
• Capital planning performedon forward-looking basis,not point-in-time
• Targets aligned to end-stateminimum requirements
• Frequent issuer, managingroll-over profile
• View Additional Tier 1 andTier 2 instruments as sourcesof funding, i.e. not used tosupport economic risk
• Regulator – comfortablyexceed minimum prudentialrequirements
• Shareholder – stress testingresults within capacity growth,return and earnings volatility
• Debtholder – standalone creditrating pierce the sovereign andhighest rated
FirstRand’s philosophy on funding and capital

fundingand liquidity
26
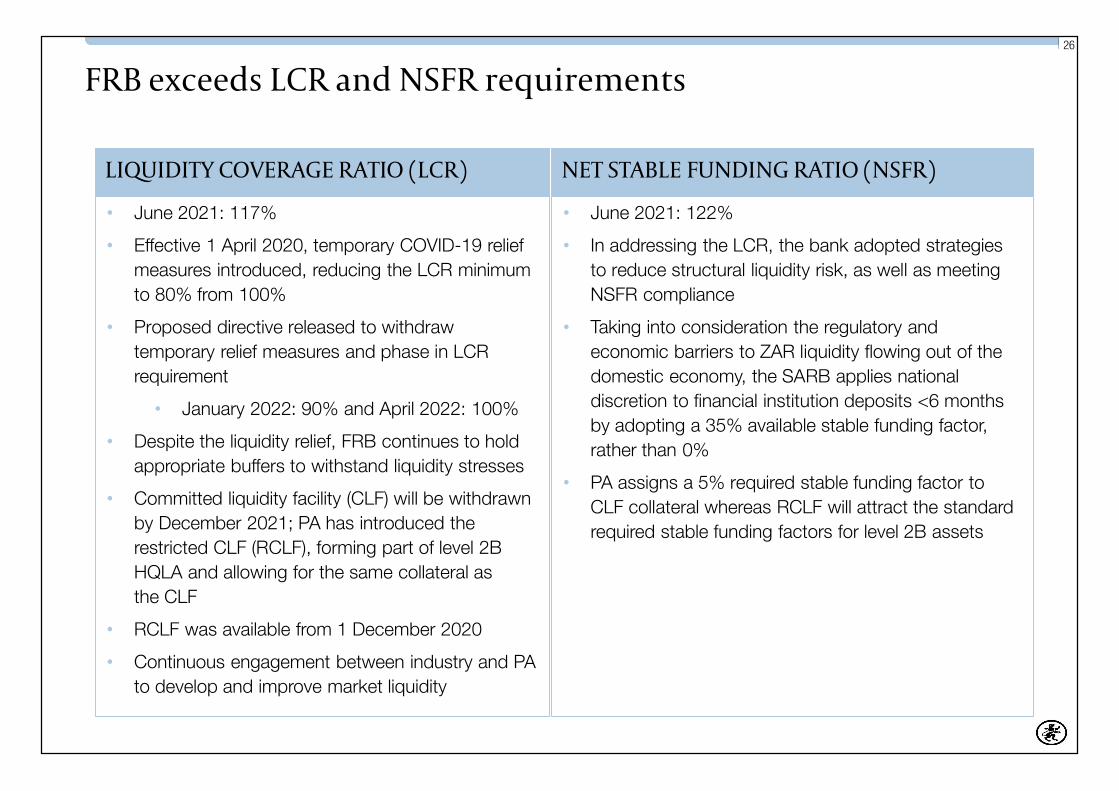
FRB exceeds LCR and NSFR requirements
LIQUIDITY COVERAGE RATIO (LCR) NET STABLE FUNDING RATIO (NSFR)
• June 2021: 122%
• In addressing the LCR, the bank adopted strategiesto reduce structural liquidity risk, as well as meetingNSFR compliance
• Taking into consideration the regulatory andeconomic barriers to ZAR liquidity flowing out of thedomestic economy, the SARB applies nationaldiscretion to financial institution deposits <6 monthsby adopting a 35% available stable funding factor,rather than 0%
• PA assigns a 5% required stable funding factor toCLF collateral whereas RCLF will attract the standardrequired stable funding factors for level 2B assets
• June 2021: 117%
• Effective 1 April 2020, temporary COVID-19 reliefmeasures introduced, reducing the LCR minimumto 80% from 100%
• Proposed directive released to withdrawtemporary relief measures and phase in LCRrequirement
• January 2022: 90% and April 2022: 100%
• Despite the liquidity relief, FRB continues to holdappropriate buffers to withstand liquidity stresses
• Committed liquidity facility (CLF) will be withdrawnby December 2021; PA has introduced therestricted CLF (RCLF), forming part of level 2BHQLA and allowing for the same collateral asthe CLF
• RCLF was available from 1 December 2020
• Continuous engagement between industry and PAto develop and improve market liquidity
27
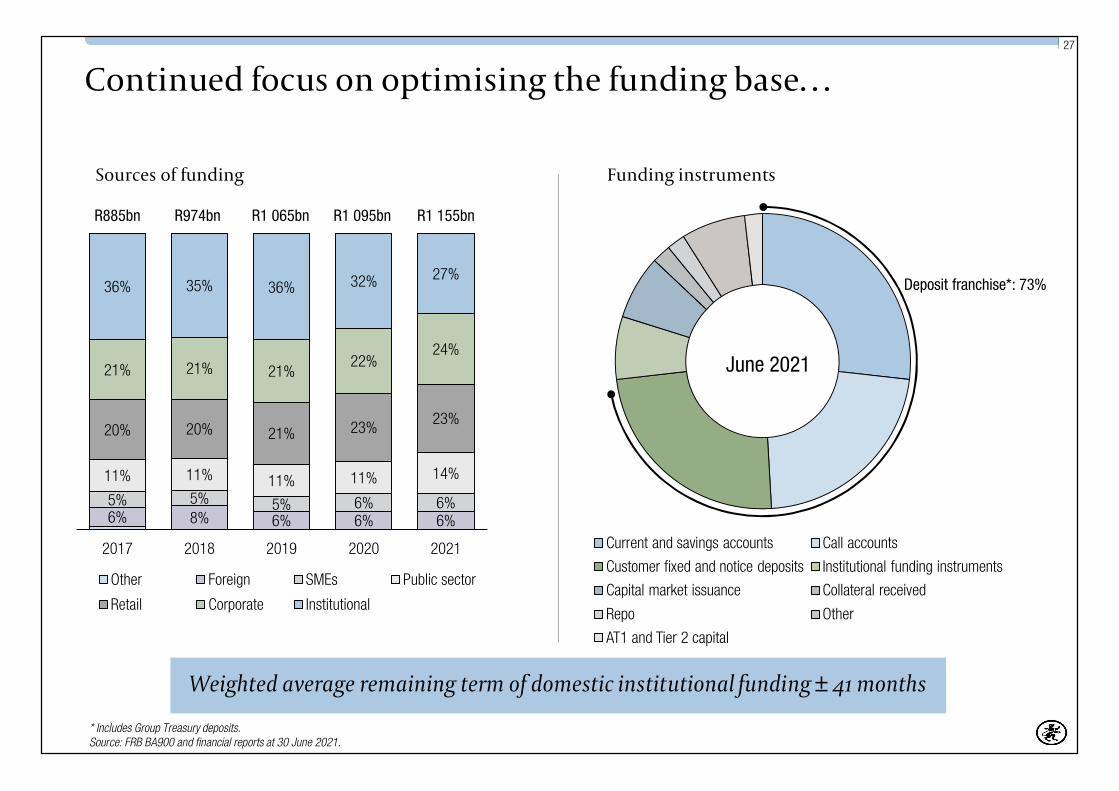
Continued focus on optimising the funding base…
Sources of funding
* Includes Group Treasury deposits.Source: FRB BA900 and financial reports at 30 June 2021.
Funding instruments
6% 8% 6% 6% 6%5% 5% 5% 6% 6%
11% 11% 11% 11% 14%
20% 20% 21% 23% 23%
21% 21% 21%22%
24%
36% 35% 36% 32% 27%
2017 2018 2019 2020 2021
Other Foreign SMEs Public sector
Retail Corporate Institutional
R885bn R974bn R1 065bn R1 095bn
June 2021
Current and savings accounts Call accounts
Customer fixed and notice deposits Institutional funding instruments
Capital market issuance Collateral received
Repo Other
AT1 and Tier 2 capital
Deposit franchise*: 73%
Weighted average remaining term of domestic institutional funding ± 41 months
R1 155bn
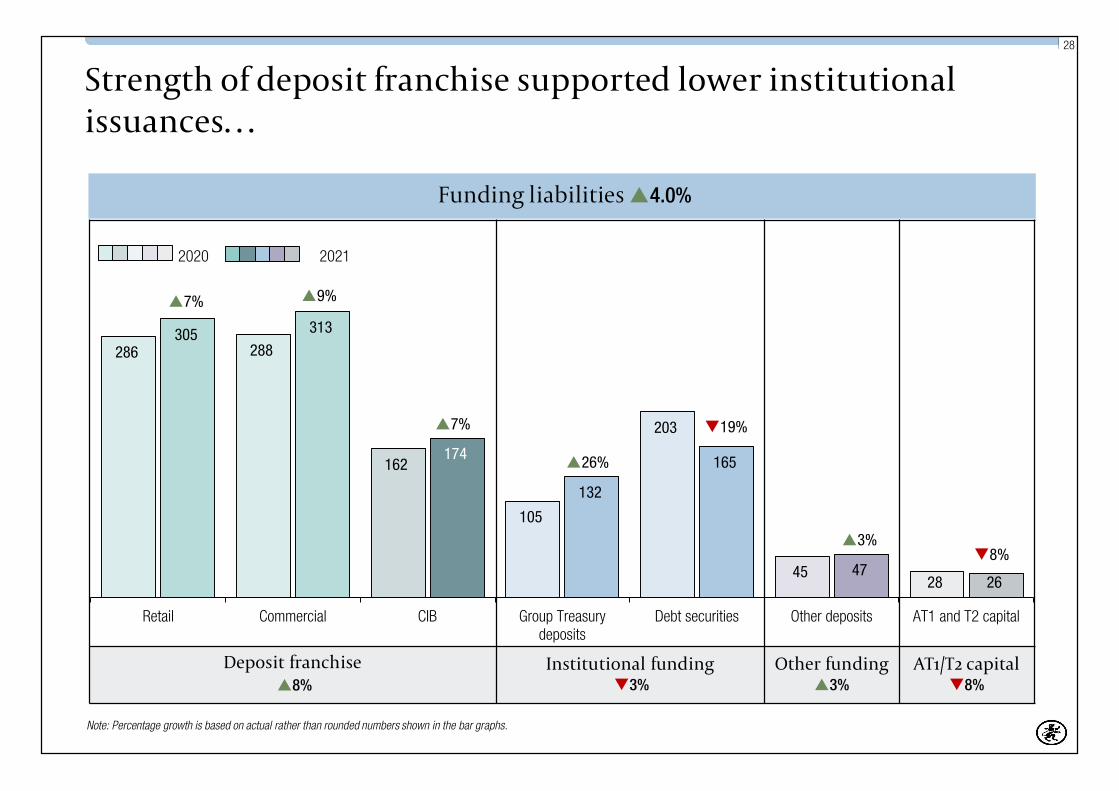
28
Deposit franchise8%
Institutional funding3%
Other funding3%
AT1/T2 capital8%
286 288
162
105
203
4528
305 313
174
132
165
4726
7% 9%
7%
26%
19%
3%8%
Retail Commercial CIB Group Treasurydeposits
Debt securities Other deposits AT1 and T2 capital
Strength of deposit franchise supported lower institutionalissuances…
Note: Percentage growth is based on actual rather than rounded numbers shown in the bar graphs.
2020 2021
Funding liabilities4.0%

29
…resulting in lengthening of term
Institutional funding as % of total funding
* Negotiable certificates of deposit (NCDs) and floating rate notes (FRNs).** Weighted average remaining term (WART) is for institutional funding in South Africa.
***
Institutional funding composition Months
Diversified institutional funding mix and term profile
3133 34
36 37 41
-
5
10
15
20
25
30
35
40
45
0%
10%
20%
30%
40%
50%
60%
70%
80%
90%
100%
2016 2017 2018 2019 2020 2021
Bonds Deposits NCDs and FRNs WART (RHS)25%
27%
29%
31%
33%
35%
37%
39%
41%
43%
45%
Jun
11De
c 11
Jun
12De
c 12
Jun
13De
c 13
Jun
14De
c 14
Jun
15De
c 15
Jun
16De
c 16
Jun
17De
c 17
Jun
18De
c 18
Jun
19De
c 19
Jun
20De
c 20
Jun
21
capital
31
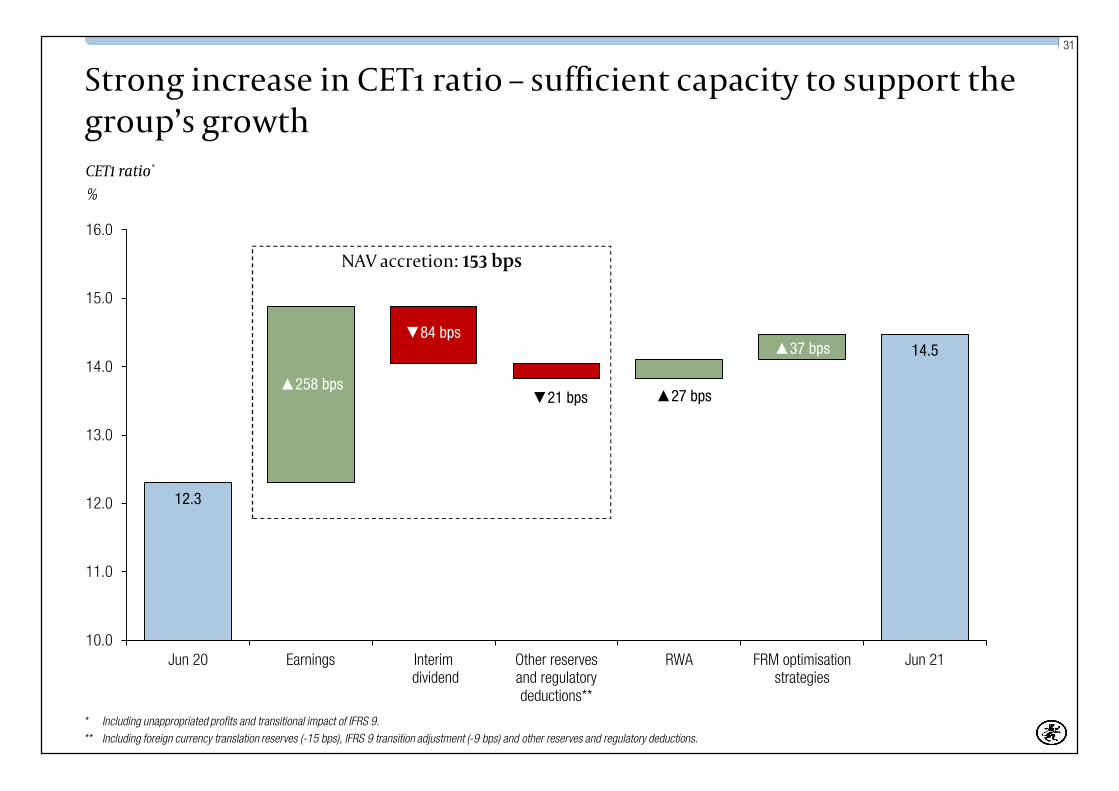
12.3
14.5
10.0
11.0
12.0
13.0
14.0
15.0
16.0
Jun 20 Earnings Interim dividend
Other reservesand regulatorydeductions**
RWA FRM optimisationstrategies
Jun 21
Strong increase in CET1 ratio – sufficient capacity to support thegroup’s growth
NAV accretion: 153 bps
▲37 bps
CET1 ratio*
%
* Including unappropriated profits and transitional impact of IFRS 9.** Including foreign currency translation reserves (-15 bps), IFRS 9 transition adjustment (-9 bps) and other reserves and regulatory deductions.
▲258 bps
▼84 bps
▼21 bps ▲27 bps

financial sectorand marketinfrastructure

33
• South African resolution framework contained in the Financial Sector Laws Amendment Bill is stillpending parliamentary promulgation
• Full scope, timeframe and impact of resolution planning is unclear at this point
• To date, the South African Reserve Bank (SARB) has released discussion papers outlining keyelements of an effective resolution regime, namely:
• Establishment of a privately funded deposit insurance scheme (DIS)
• Introduction of a new class of instruments, i.e. first loss after capital (Flac) instruments,which will be subject to bail-in after regulatory capital instruments but before any otherunsecured liabilities.
• Financial conglomerate framework
• September 2020: Financial conglomerate designation criteria released
• October 2020: Draft standards, excluding the capital standards, were released for a thirdround of consultation
• July 2021: Draft capital standards released for public consultation
• October 2021: Seminar with the PA to discuss capital standards
• Guidance Note 4/2021, Proposed implementation dates in respect of specified regulatory reforms,released in July 2021
Regulatory update
34
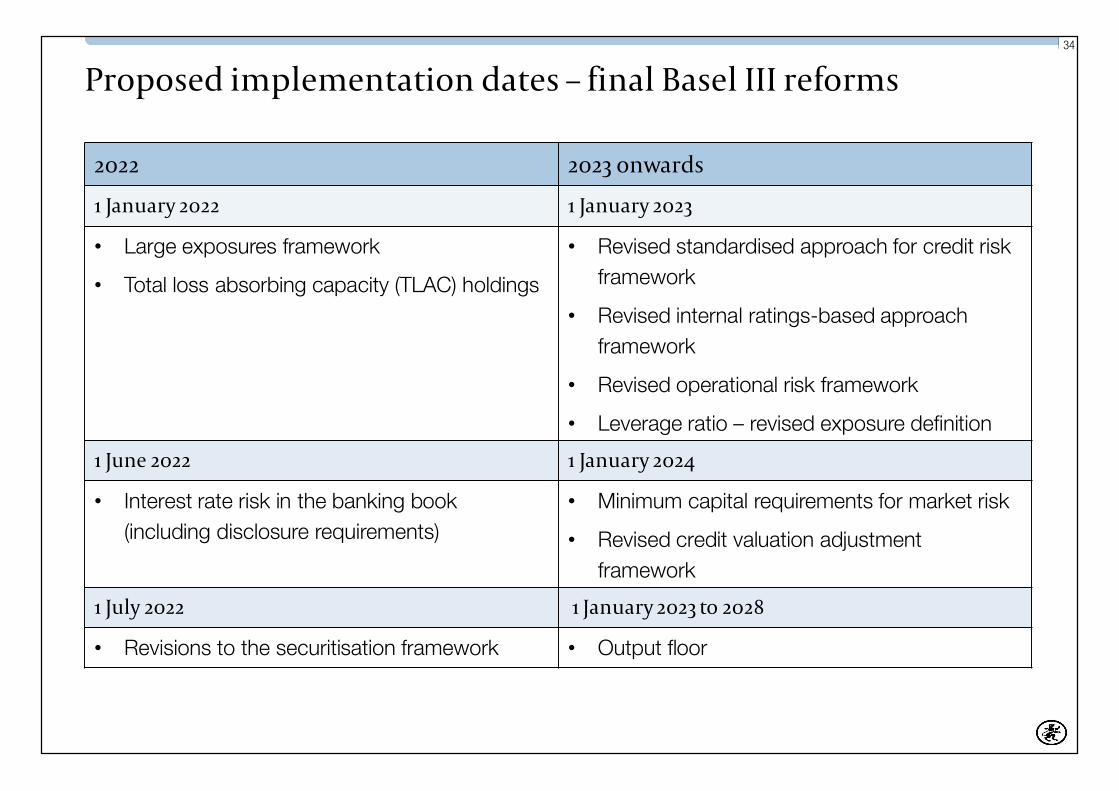
Proposed implementation dates – final Basel III reforms
2022 2023 onwards
1 January 2022 1 January 2023
• Large exposures framework
• Total loss absorbing capacity (TLAC) holdings
• Revised standardised approach for credit riskframework
• Revised internal ratings-based approachframework
• Revised operational risk framework
• Leverage ratio – revised exposure definition
1 June 2022 1 January 2024
• Interest rate risk in the banking book(including disclosure requirements)
• Minimum capital requirements for market risk
• Revised credit valuation adjustmentframework
1 July 2022 1 January 2023 to 2028
• Revisions to the securitisation framework • Output floor

35
FRB credit ratings
Sources: S&P Global Ratings and Moody’s Investors Service.
Sovereign rating is a ceiling to standalonecredit rating and credit profile
* S&P Global’s standalone credit profile and Moody’s baseline credit assessment.Credit ratings at 20 October 2021.
SOUTH AFRICASOVEREIGN RATINGS
FIRSTRAND BANK LIMITEDCREDIT RATINGS
FOREIGN CURRENCY LOCAL AND FOREIGN CURRENCY
Long term/outlook
Long term/outlook
Long-termnational scale
Standalonecredit rating*
S&P Global BB-/Stable BB-/Stable zaAA bbb-
Moody’s Ba2/Negative Ba2/Negative Aa1.za ba2
lookingahead
37
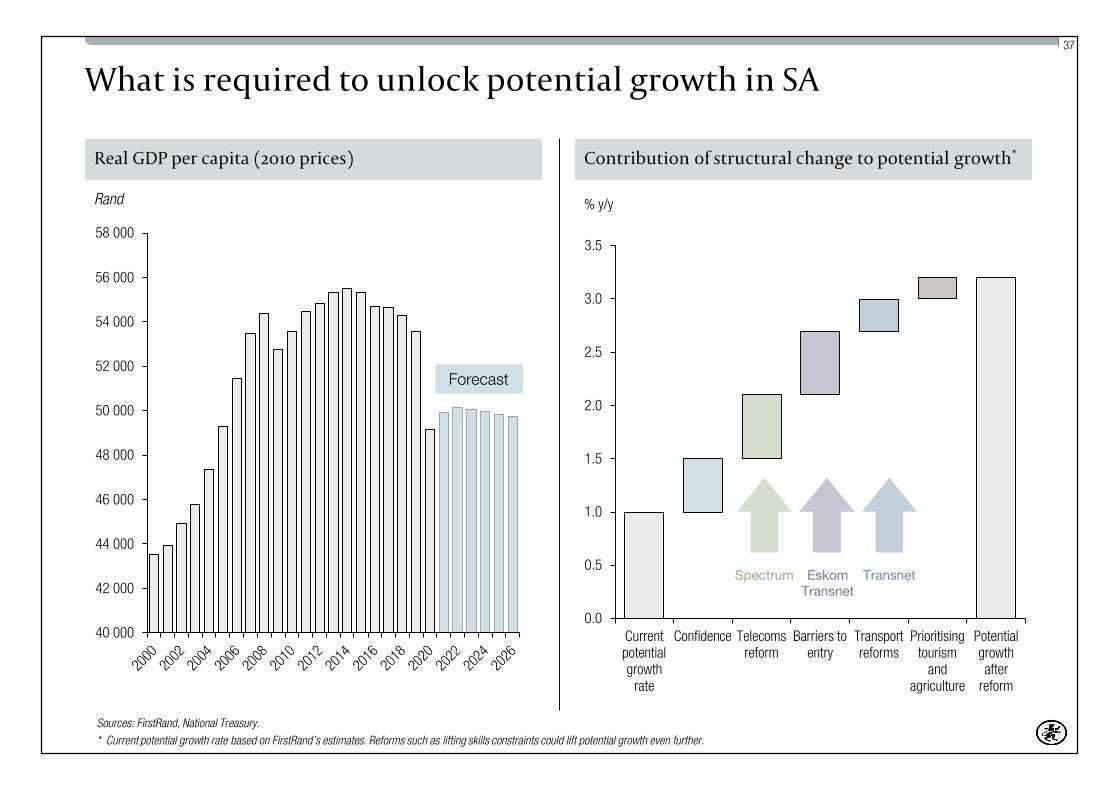
What is required to unlock potential growth in SA
Real GDP per capita (2010 prices)
40 000
42 000
44 000
46 000
48 000
50 000
52 000
54 000
56 000
58 000
Contribution of structural change to potential growth*
0.0
0.5
1.0
1.5
2.0
2.5
3.0
3.5
Currentpotentialgrowth
rate
Confidence Telecomsreform
Barriers toentry
Transportreforms
Prioritisingtourism
andagriculture
Potentialgrowthafter
reform
Sources: FirstRand, National Treasury.* Current potential growth rate based on FirstRand’s estimates. Reforms such as lifting skills constraints could lift potential growth even further.
% y/y
Forecast
Rand
Spectrum EskomTransnet
Transnet

38
• Modest credit cycle expected to form in SA – advances will build on Q4 pick-up
• Rest of Africa portfolio benefiting from commodity cycle
• As UK government support is withdrawn, NPLs are expected to remain elevated,constraining earnings growth in the year ahead
• Speed, extent and breadth of earnings rebound is exceeding expectations –pace expected to moderate
• Imminent restoration of group peak earnings
• ROE expected to remain in the target range
Looking forward, the group is well positioned to deliver growthand superior returns

appendix

40
Continued improvements to balance sheet liquidity
0
50
100
150
200
250
300
2016 2021
Cash and central bank deposits Government bonds and bills
Other liquid assets
996
1 385
0
200
400
600
800
1 000
1 200
1 400
1 600
2016 2021
Balance sheet growth
R billion
CAGR▲6.8%
Source: FRB BA900 and BA100 at June 2021.
CAGR▲12.1%
Liquid asset growth and mix
R billion
162
287

41
Covid-19 regulatory update
LCR
The PA temporarily reduced the LCRrequirement from 100% to 80%,effective 1 April 2020
• Proposed directive released (1 September 2021) towithdraw the temporary relief measures and phase in theLCR requirement as follows:• 1 January 2022: minimum LCR of 90%• 1 April 2022: minimum LCR of 100%
Capital
PA temporarily reduced the Pillar 2Acapital requirement from 1% to 0%,effective 6 April 2020
• Pillar 2A requirement of 1% to be reinstated in 2022• Target aligned to end-state minimum requirements
Credit
Temporary relief on the minimumcapital requirements of restructuredcredit exposures related to Covid-19
• Proposed directive released (7 September 2021) towithdraw temporary relief measure, effective 1 April 2022
• Temporary relief will also no longer apply to anyrestructured credit exposures (new or reapplications)granted from 1 January 2022 onwards
• Impact of the withdrawal of this directive on CET1 capitalwill not be material

42
Resolution blueprint – proposed hierarchy in insolvency
Preferred
Unsecured
Secured(up to thevalue ofsecurity)
CURRENT
Preferred
Covereddeposits
Secured(up to thevalue ofsecurity)
AMENDED
Unsecuredcreditors
Flacinstruments
Regulatorydebt
instruments
• Allows for setoff up to the value of security held
• Residual claims rank pari passu with all other unsecured creditors
• Assets under repo GMRA, ISDA, etc.
• Creditors specified by legislation, including outstanding tax claims andcentral banks claims
• Deposits qualifying for deposit insurance - maximum of R100 000 perdepositor, per bank
• All residual claims (uncovered deposits > covered amount) and nonqualifying debt instruments
• Pre-identified, transparent tranche of funding instruments available forbail-in at point of resolution (POR) – sufficient to restore minimum capitalrequirements
• Rank senior to regulatory capital
• Ranked in the order as per regulatory framework
• Assumed to be available to absorb going concern losses and depletedat POR

43
The information, statements and opinions contained in this presentation do not constitute a public offer under any applicable legislation or an offer or solicitationof an offer to buy or sell securities or financial instruments or any advice or recommendation to buy such securities or financial instruments. This presentation issolely provided for information purposes.
This presentation is not for publication, release or distribution, directly or indirectly, into any jurisdiction in which it would be unlawful to do so.
By electing to view this presentation, you agree to be bound by the following limitations:
The information in this presentation has been prepared by FirstRand Bank Limited (FRB) for the purposes of information only. This presentation may not be reliedupon for the purpose of entering into any transaction.
The information herein has not been independently verified and no representation or warranty, express or implied, is made as to, and no reliance should beplaced on, the fairness, accuracy, completeness or correctness of the information or opinions contained herein. The information set out herein may be subject toupdating, revision, verification and amendment and such information may change materially. FRB is under no obligation to update or keep current the informationcontained in this presentation and any opinions expressed herein are subject to change without notice. None of FRB and any of its respective affiliates,subsidiaries, advisers or representatives shall have any liability whatsoever (in negligence or otherwise) for any loss whatsoever arising from any use of thispresentation or its contents, or otherwise arising in connection with this presentation.
FRB makes no representation or warranty, express or implied, that its future operating, financial or other results will be consistent with results implied, directly orindirectly, by such information or with FRB’s past operating, financial or other results. Any information herein is as of the date of this presentation and may changewithout notice. In addition, information in this presentation may be condensed or incomplete, and this presentation may not contain all material information inrespect of FRB.
To the extent available, the industry, market and competitive position data contained in this presentation come from official or third-party sources. Third-partyindustry publications, studies and surveys generally state that the data contained therein have been obtained from sources believed to be reliable, but that thereis no guarantee of the accuracy or completeness of such data. Accordingly, undue reliance should not be placed on any of the industry, market or competitiveposition data contained in this presentation.
No representation, warranty or undertaking, expressed or implied, is or will be made by FRB and no reliance should be placed on, the truth, fairness, accuracy,completeness or correctness of the information or the opinions contained herein (and whether any information has been omitted from the presentation). To theextent permitted by law, FRB and each of their respective directors, officers, employees, affiliates, advisors and representatives disclaims all liability whatsoever (innegligence or otherwise) for any loss however arising, directly or indirectly, from any use of this presentation or its contents or otherwise arising in connection withthis presentation.
Important notice

44
The information in this presentation is given in confidence and the recipients of this presentation should not engage in any behaviour which would or mightamount to market abuse for the purpose of Regulation (EU) 596/2014 (the Market Abuse Regulation).
This presentation does not disclose all the risks and other significant issues related to an investment in any securities/transaction.
This presentation includes FRB figures presented on a normalised basis to take into account certain non-operational items and accounting anomalies. A detaileddescription of the differences between FRB’s normalised and IFRS information is provided in FRB’s analysis of financial results for the year ended 30 June 2021.
Certain analysis is presented herein and is solely for purposes of indicating a range of outcomes that may result from changes in market parameters. It is notintended to suggest that any outcome is more likely than another, and it does not include all possible outcomes or the range of possible outcomes. Thispresentation and subsequent discussion may contain projections, estimates, forecasts, targets, opinions, prospects, results, returns and forward-lookingstatements with respect to the financial condition, results of operations, capital position, strategy and business of FRB (together, forward-looking statements). Anysuch forward-looking statements are not a reliable indicator of future performance, as they may involve significant assumptions and subjective judgements whichmay or may not prove to be correct and there can be no assurance that any of the matters set out in forward-looking statements are attainable, will actuallyoccur or will be realised or are complete or accurate. Forward-looking statements are statements about the future and are inherently uncertain and generallybased on stated or implied assumptions. Forward-looking statements involve all matters that are not historical by using the words “aim”, “continue”, “plan”,“may”, “will”, “would”, “should”, “expect”, “intend”, “estimate”, “anticipate”, “believe” and similar expressions or their negatives. Such statements are made on thebasis of assumptions and expectations that FRB currently believes are reasonable, but could prove to be wrong or differ materially from actual results.
By accepting this presentation you will be deemed to have represented, warranted and undertaken that (i) you have read and agree to comply with the contentsof this notice; and (ii) you will treat and safeguard as strictly private and confidential this presentation and its contents and any comments made during anymeeting which is connected to this presentation and take all reasonable steps to preserve such confidentiality.
Important notice (continued)


![Hallmark Financial Services Selects Majesco Policy as a Strategic Enterprise Platform [Company Update]](https://img.dokumen.tips/doc/110x75/577ca5be1a28abea748ba454/hallmark-financial-services-selects-majesco-policy-as-a-strategic-enterprise.jpg)