Embed Size (px)
Citation preview

Financial and Operating Report for The Nathaniel Witherell
Town of Greenwich Greenwich, Connecticut
February 26, 2019

Financial and Operating Report for
The Nathaniel Witherell
TABLE OF CONTENTS
Introduction ................................................................................................................................. 1
Executive Summary .................................................................................................................... 2
Market Analysis ....................................................................................................................... 2
Control of Expenses ................................................................................................................ 3
Business Office Process/Accounting ....................................................................................... 3
Patient-Driven Payment Model (PDPM) .................................................................................. 4
Strategic Recommendations ................................................................................................... 4
Analysis of Market Dynamics ...................................................................................................... 6
Market Area ............................................................................................................................ 6
Demographics ....................................................................................................................... 11
Market Analysis ..................................................................................................................... 17
Competitor Analysis .............................................................................................................. 26
Nursing Home Bed Demand Analysis ................................................................................... 33
Senior Living Demand Analysis ............................................................................................. 37
Medicare Analysis ................................................................................................................. 39
Financial/Benchmarking Assessment ........................................................................................ 47
Key Findings ......................................................................................................................... 47
Comparison Communities ..................................................................................................... 47
Profit & Loss Analysis ........................................................................................................... 48
Benchmark Operational Performance ................................................................................... 49
Revenue Analysis ................................................................................................................. 50
Occupancy Analysis .............................................................................................................. 51
Payor Mix Analysis ................................................................................................................ 52
Revenue per Patient Day (PPD) Analysis ............................................................................. 53
Medicare Analysis ................................................................................................................. 53
Patient-Driven Payment Model (PDPM) Analysis .................................................................. 55
Medicaid Analysis ................................................................................................................. 56
Wage and Employee Benefit Analysis ................................................................................... 57
Cost per Resident Day .......................................................................................................... 63
Capital Costs ......................................................................................................................... 64

Financial and Operating Report for
The Nathaniel Witherell
Financial Analysis of Strategic Recommendations .................................................................... 65
Maintain Current Town Ownership and Operation ................................................................. 65
Lease/Sell to a 501(c)(3) Corporation.................................................................................... 68
Lease/Sell to a For-Profit Manager ........................................................................................ 70
Model Comparison and Recommendations ........................................................................... 72
Operational Assessment ........................................................................................................... 73
Operational Leadership ......................................................................................................... 73
Marketing Analysis ................................................................................................................ 74
Business Office Assessment ..................................................................................................... 76
Admissions and Census Analysis .......................................................................................... 76
Resident Financial File Contents Analysis ............................................................................. 79
Resident Trust Account (RTA) Analysis ................................................................................ 80
Billing and Collections Policies and Procedures Analysis ...................................................... 81
Social Services Department Analysis .................................................................................... 87
Bed Management, Short-Term Residents Analysis ............................................................... 88
Recreation Department Analysis ........................................................................................... 89
Dietary Department Analysis ................................................................................................. 90
Facilities Maintenance, Housekeeping, and Laundry Departments Analysis ......................... 91
Human Resources Assessment ................................................................................................ 93
Pay Practices Analysis .......................................................................................................... 93
Non-Productive Hours/Sick Pay Analysis .............................................................................. 97
Staff Development Analysis .................................................................................................. 98
Collective Bargaining Agreements (CBA) Analysis ................................................................ 99
Clinical Assessment ................................................................................................................ 110
Rounding Observations ....................................................................................................... 110
Supply Management Analysis ............................................................................................. 110
Pharmacy Services Analysis ............................................................................................... 111
Nursing Staffing Analysis .................................................................................................... 112
Clinical Reimbursement Assessment ...................................................................................... 116
Medicare Meetings .............................................................................................................. 116
Minimum Data Set (MDS) Process ...................................................................................... 117
Minimum Data Set (MDS) Submission and Validation ......................................................... 118
Financial and Operating Report for
The Nathaniel Witherell
Therapy Assessment .............................................................................................................. 119
General Recommendations ................................................................................................. 119
Medical Records and MDS Review ..................................................................................... 119
Patient-Driven Payment Model (PDPM) .............................................................................. 120
Value-Based Market Dynamics ............................................................................................... 123
Hospital Profiles .................................................................................................................. 124
Payor Profiles ...................................................................................................................... 124
Appendices (Under Separate Cover)
Appendix A: BPCI Advanced Participants Located near The Nathaniel Witherell
Appendix B: Primary Referral Sources
Appendix C: Provider Profiles
Appendix D: New Executive Director/DON Training and Orientation Checklists
Appendix E: Insurance Verification Form
Appendix F: Resident Trust Fund Authorization Form
Appendix G: Bad Debt Worksheet Form
Appendix H: Office of Inspector General (OIG) Vendor Verification Form
Appendix I: IDEAL Discharge Process Checklist (Example)
Appendix J: Paid Time Off (PTO) Policy (Example)
Appendix K: CMS 5-Star User Guide
Appendix L: Minimum Data Set (MDS) Forms
Appendix M: Glossary of Terms

Financial and Operating Report for
The Nathaniel Witherell
February 26, 2019 Page 1
INTRODUCTION
Health Dimensions Group (HDG) was contracted by the Town of Greenwich, Connecticut, to
provide a financial and operational review to assist in determining the most viable option for the
future of The Nathaniel Witherell (TNW) as identified in the Town’s request for proposal (RFP)
#7404. HDG conducted the onsite assessment during the month of September 2018.
It was a pleasure to meet the staff and residents during our assessment of the facilities.
Following are key findings and conclusions from the assessment; please see specific sections
of the report for more details. A glossary of terms is included as Appendix M.
General Observations
The Nathaniel Witherell is a licensed Chronic and Convalescent Nursing Home (CCNH). This
202-bed facility is located on 24 acres, just two miles from downtown Greenwich. The Nathaniel
Witherell is owned and operated by the Town of Greenwich, serving the community since 1903.
The Nathaniel Witherell provides care for short-term rehabilitation (rehab) and skilled nursing
patients, including a 40-bed memory care unit. The short-term rehab and skilled nursing center
provides a home-like environment and is well-maintained. The relationship between the
residents, families, and staff is excellent. During HDG’s assessment, the hospitality provided to
our team by the staff at TNW was outstanding.
The memory care unit, located on the third floor, allows residents with Alzheimer’s disease and
dementia to live in a secure, distinct environment. The unit is currently under renovation while
continuing to provide programming such as gardening, spiritual programs, outings, and visits to
the in-house café, gift shop, and beauty salon.
Additionally, 116 long-term beds are located on the first, second, and fourth floors, and are
under renovation. The health care center is a Centers for Medicare & Medicaid Services (CMS)
4-star facility that makes a good first impression. TNW is committed to person-centered care by
supporting autonomy and individual choices for the residents for whom it provides care. The
health care center has 46 private, short-term rehab rooms consisting of 21 beds on the main
unit and 25 beds on the garden unit. The short-term rehab unit provides comprehensive
programs with developed clinical pathways in the areas of:
Orthopedic
Cardiac/Pulmonary
Neurological
General medical
Financial and Operating Report for
The Nathaniel Witherell
February 26, 2019 Page 2
EXECUTIVE SUMMARY
Health Dimensions Group (HDG) is pleased to present this summary of findings as the result of
an operational, clinical, and financial assessment completed for The Nathanial Witherell (TNW)
located in Greenwich, Connecticut. HDG conducted an onsite assessment of the community in
September of 2018, with additional off-site analysis in the weeks since that time in an effort to
provide details related to the operations of the community.
Over the course of the site visit, HDG consultants interviewed community leaders to obtain an
understanding of the operations of the community. HDG staff also attended a number of
meetings to best understand the effectiveness and efficiency of the community’s communication
and transmission of operational data among community leadership.
Upon completion of HDG’s onsite visit and our off-site analysis, primary areas of opportunity
became apparent and are recommended for your consideration. These areas of opportunity are
listed below.
Market Analysis
The primary competition for TNW consists of seven SNF communities with a total of 974 beds.
Overall occupancy of these communities is 86.3 percent, which indicates that the market utilizes
beds less than the state average. The need for nursing home beds in the market area is
projected to continually decline through 2023, with the market requiring approximately 128 fewer
beds than in 2018. While nursing home bed needs decline, the need for assisted living (AL),
independent living (IL), and memory care assisted living (MCAL) units increases. It is projected
that the:
Market can support an additional 158 beds of IL units
Market can support an additional 87 beds of AL units
Market can support an additional 54 beds of MCAL units
For consideration, HDG recommends the following:
An increase in alternative health care, which could include an update and expansion to the
existing MCAL beds.
Addition of AL/IL beds in a new facility on the campus.
Modification of the existing facility to include an AL/IL unit.

Financial and Operating Report for
The Nathaniel Witherell
February 26, 2019 Page 3
Control of Expenses
HDG noted several opportunities to reduce expenses, including the following:
Departmental budgets: Each department manager should be provided with the budget for their
specific unit at or prior to the beginning of the fiscal year to be able to appropriately monitor
expenses and keep on target.
Paid benefits: TNW’s paid benefits are 38.3 percent (cost report period ending 9/30/17) as
compared to the comparison local communities, which run at 33.1 percent. The northeast
benchmark is 20.0 percent and the national average is 17.4 percent.
Staff wages: Wages in all departments are higher than the eight comparison communities as
well as the northeast benchmark.
Costs per resident day: TNW’s cost per resident day by department runs higher than all
competitors and industry median.
Nursing staffing: Manage nursing staff to the daily census. Currently, the nursing department
is staffing direct care staff above the CMS 5-star level.
Business Office Process/Accounting
HDG reviewed TNW’s business office operations, and present the following recommendations.
Admissions and Census
Admissions and business office staff should work as a team to ensure all necessary
information is received and uploaded into the billing software and shared with the billing staff.
An insurance/payor verification form for each potential admission should be completed prior to
acceptance of a new resident.
Complete an admission agreement for every admission within the first 24 to 48 hours.
Resident Trust Account
For Medicaid residents who have chosen to deposit their social security check into the
resident trust account (RTA), ensure the RTA shows the total social security check going into
the RTA as a deposit with the amount for care withdrawn and paid to the facility.
Refund all RTA balances for discharged/deceased residents within 30 days of discharge or
death, per Federal Regulation §483.10(f)(10)(iv) Notice of Certain Balances.
Ensure that no resident trust account is negative at any time.

Financial and Operating Report for
The Nathaniel Witherell
February 26, 2019 Page 4
Billing and Collections Policies and Procedures
Medicare biller to schedule triple-check meeting for the same time each month before
Medicare or Managed Care claims are submitted.
Review copies of minimum data set (MDS) verification reports to verify that the MDS has been
submitted and accepted by CMS prior to submission of any claim.
Accounts Receivable (A/R)
Hold monthly accounts receivable (A/R) review meeting with the business office staff,
administrator, and chief financial officer (CFO) to accomplish the following:
Clearly define the credit balances due to residents or insurance companies and process
the refunds within 30 days if it is determined they are due to the resident/insurance
company.
Refund credit balances as quickly as possible to comply with the CMS Mega Rule (within
30 days of discharge or death).
Accounts Payable
HDG recommends completing an Office of Inspector General (OIG) verification for all vendors
prior to employing or contracting.
Patient-Driven Payment Model (PDPM)
The Patient-Driven Payment Model (PDPM) will go into effect in October 2019. This will change
the payment system from a resource utilization group (RUG) payment system to a new model
for Medicare payment. HDG recommends that TNW partner with a consultant to develop a
strategic plan to roll out and implement the appropriate adjustments to meet the requirements of
PDPM.
Strategic Recommendations
HDG compared the following three scenarios as potential options for TNW: 1) maintain current
Town ownership and operation, 2) lease or sell to a 501(c)(3) corporation, and 3) lease or sell to
a for-profit manager.
HDG compiled a five-year pro forma for each of the three scenarios. HDG also computed the
impact of reducing nursing staffing to the Centers for Medicare & Medicaid Services (CMS) four-
and five-star levels. Those staffing levels could provide significant cost savings to TNW.
HDG recommends further exploration of the scenario of selling/leasing to a 501(c)(3)
corporation while continuing to make operational improvements to the facility. The 501(c)(3)
operator and for-profit operator scenarios are projected to have similar financial outcomes, with
the for-profit option being more profitable. However, the option that appears most ideal for TNW
would be the 501(c)(3) operator option, which would provide the potential for a reduced
employee cost structure while likely maintaining community involvement. In addition, a 501(c)(3)

Financial and Operating Report for
The Nathaniel Witherell
February 26, 2019 Page 5
operator would qualify for tax deductible contributions and be eligible for grants1. This option
would have a greater potential for economies of scale than current operations and would no
longer be government restricted.
Specific findings and recommendations for each key area reviewed are provided throughout this
report on the following pages.
1 In 2006, the Board of TNW established the Friends of The Nathaniel Witherell (the Friends) as a 501(c)(3) nonprofit corporation under the Internal Revenue Code for tax-exempt purposes. The Friends raise funds for TNW for enrichment activities of residents and for facility enhancement, and not for funding operating deficits.

Financial and Operating Report for
The Nathaniel Witherell
February 26, 2019 Page 6
ANALYSIS OF MARKET DYNAMICS
The Greenwich Board of Estimate and Taxation, through the Town of Greenwich (the Town)
contracted with Health Dimensions Group (HDG) to complete a market analysis for strategic
planning regarding the nursing home. HDG provides the following conclusions to the analysis.
Market Area
HDG believes that sound market area definition is extremely critical to any market analysis.
Regardless of data quality and analytical approach, the value of a study is tied to the accuracy
of its market area definition. This definition is crucial for making decisions in several subsequent
steps, including analysis of the demographic characteristics of potential residents, which leads
to estimated market demand.
Determination of Market Area
A combination of factors influences the market area definition of a skilled nursing facility (SNF).
In particular, key determinants include the suitability and appeal of the campus, product
differentiation, and the site location in terms of market orientation, accessibility, and current
patterns experienced by the campus and other providers in the market.
In determining the market area to analyze, HDG reviewed the ZIP code of origin of current
residents at TNW, impact of geographic boundaries, and historical consumer behavior in the
market, as well as our knowledge of the area. Table 1 includes the ZIP code or origin of current
residents at TNW. There are eight market area ZIP codes, highlighted in yellow, which account
for 70.7 percent of the current residents.
The average community will draw between 70 and 80 percent of its residents from the market
area. The remaining residents mostly originate from near the market area, move back to the
market area or to be near adult children and/or healthcare services.

Financial and Operating Report for
The Nathaniel Witherell
February 26, 2019 Page 7
Table 1: ZIP Code of Origin
The Nathaniel Witherell August 2018 Residents
ZIP Code - City Current
Residents Percent
Cumulative Percent
06830 – Greenwich, CT 54 32.3% 32.3%
06902 – Stamford, CT 18 10.8% 43.1%
06831 – Greenwich, CT 15 9.0% 52.1%
06807 – Cos Cob, CT 9 5.4% 57.5%
06870 – Greenwich, CT 8 4.8% 62.3%
06878 – Riverside, CT 7 4.2% 66.5%
06905 – Stamford, CT 7 4.2% 70.7%
06903 – Stamford, CT 5 3.0% 73.7%
06460 – Milford, CT 2 1.2% 74.9%
06820 – Darien, CT 2 1.2% 76.0%
06906 – Stamford, CT 2 1.2% 77.2%
06907 – Stamford, CT 2 1.2% 78.4%
01982 – Hamilton, MA 1 0.6% 79.0%
06355 – Mystic, CT 1 0.6% 79.6%
06405 – Branford, CT 1 0.6% 80.2%
06482 – Newtown, CT 1 0.6% 80.8%
06492 – Wallingford, CT 1 0.6% 81.4%
06512 – East Haven, CT 1 0.6% 82.0%
06525 – Woodbridge, CT 1 0.6% 82.6%
06610 – Bridgeport, CT 1 0.6% 83.2%
06759 – Litchfield, CT 1 0.6% 83.8%
06801 – Stony Hill, CT 1 0.6% 84.4%
06824 – Fairfield, CT 1 0.6% 85.0%
06840 – New Canaan, CT 1 0.6% 85.6%
06851 – Norwalk, CT 1 0.6% 86.2%
06854 – Norwalk, CT 1 0.6% 86.8%
06855 – Norwalk, CT 1 0.6% 87.4%
06890 – Southport, CT 1 0.6% 88.0%
06897 – Wilton, CT 1 0.6% 88.6%
08234 – Egg Harbor Twp., NJ 1 0.6% 89.2%
08527 – Jackson, NJ 1 0.6% 89.8%
10028 – New York, NY 1 0.6% 90.4%
10461 – Bronx, NY 1 0.6% 91.0%
10468 – Bronx, NY 1 0.6% 91.6%
10504 – Armonk, NY 1 0.6% 92.2%
10573 – Rye Brook, NY 1 0.6% 92.8%

Financial and Operating Report for
The Nathaniel Witherell
February 26, 2019 Page 8
ZIP Code - City Current
Residents Percent
Cumulative Percent
10580 – Rye, NY 1 0.6% 93.4%
10601 – White Plains, NY 1 0.6% 94.0%
10605 – White Plains, NY 1 0.6% 94.6%
10606 – White Plains, NY 1 0.6% 95.2%
10704 – Yonkers, NY 1 0.6% 95.8%
10708 – Bronxville, NY 1 0.6% 96.4%
10801 – White Plains, NY 1 0.6% 97.0%
10805 – New Rochelle, NY 1 0.6% 97.6%
11210 – Brooklyn, NY 1 0.6% 98.2%
12953 – Malone, NY 1 0.6% 98.8%
16509 – Erie, PA 1 0.6% 99.4%
34952 – Port St. Lucia, FL 1 0.6% 100.0%
06901 – Stamford, CT 0 0.0% 100.0%
Total 167 100.0% 100.0%
Market Area Total 118 70.7%
Source: The Nathaniel Witherell August 2018 roster and Health Dimensions Group analysis
A map of the market area is shown in Figure 1. TNW is represented by a maroon target symbol,
and a ten-mile radius is outlined in black for ease of reference. The market area is highlighted
yellow and is located within ten miles of TNW.

Financial and Operating Report for
The Nathaniel Witherell
February 26, 2019 Page 9
Figure 1: The Nathaniel Witherell Market Area
Source: Caliper’s Maptitude 2018 and Health Dimensions Group analysis
Financial and Operating Report for
The Nathaniel Witherell
February 26, 2019 Page 10
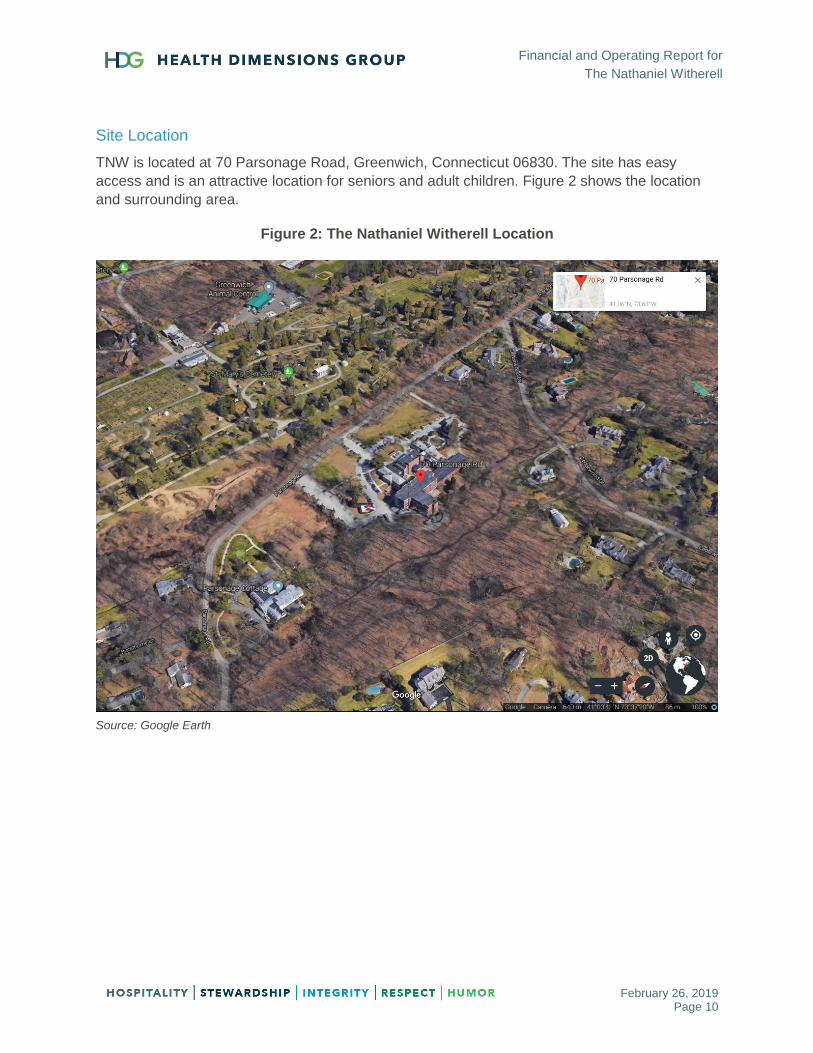
Site Location
TNW is located at 70 Parsonage Road, Greenwich, Connecticut 06830. The site has easy
access and is an attractive location for seniors and adult children. Figure 2 shows the location
and surrounding area.
Figure 2: The Nathaniel Witherell Location
Source: Google Earth

Financial and Operating Report for
The Nathaniel Witherell
February 26, 2019 Page 11
Demographics
The demographics of the eight-ZIP code market area is summarized in this section of the report.
The demographics, provided by Environics Analytics, includes current year (2018) and five-year
(2023) projections. Environics Analytics uses Nielsen Claritas data, which is one of the leading
demographics providers in the nation and updates their data on an annual basis.
Total Population
Tables 2 and 3 summarize the total population of the market area.
Table 2: TNW Market Area
Total Population by Age Cohort
Age Cohort 2010
Actual 2018
Estimate
Percent Change
2010–2018
2023 Projection
Percent Change
2018–2023
0–4 Years 9,959 9,057 -9.1% 8,956 -1.1%
5–9 Years 9,702 9,923 2.3% 9,165 -7.6%
10–14 Years 9,709 10,334 6.4% 9,988 -3.3%
15–17 Years 5,969 6,026 1.0% 6,462 7.2%
18–20 Years 4,048 5,401 33.4% 5,850 8.3%
21–24 Years 6,560 6,995 6.6% 7,752 10.8%
25–34 Years 22,388 20,635 -7.8% 19,678 -4.6%
35–44 Years 22,363 22,242 -0.5% 21,060 -5.3%
45–54 Years 22,676 22,466 -0.9% 22,038 -1.9%
55–64 Years 16,770 20,297 21.0% 21,505 6.0%
65–74 Years 10,340 13,204 27.7% 15,960 20.9%
75–84 Years 7,256 7,150 -1.5% 8,060 12.7%
85+ Years 3,876 4,084 5.4% 3,937 -3.6%
Total 151,616 157,814 4.1% 160,411 1.6%
65+ Years 21,472 24,438 13.8% 27,957 14.4%
75+ Years 11,132 11,234 0.9% 11,997 6.8%
85+ Years 3,876 4,084 5.4% 3,937 -3.6%
Source: Environics Analytics and Health Dimensions Group analysis
Findings:
Total population is projected to increase by 2,597 individuals (1.6 percent), from 157,814
individuals in 2018 to 160,411 individuals in 2023.
Seniors 75 years of age and older are the primary users of services; this age cohort is
projected to increase by 763 individuals (6.8 percent) through 2023.
Seniors 85-and-older cohort is projected to decrease by 147 individuals (3.6 percent) through
2023, indicating the highest users of services will be decreasing.

Financial and Operating Report for
The Nathaniel Witherell
February 26, 2019 Page 12
Table 3: TNW Market Area, Connecticut, and National
Total Population by Age Cohort
Age Cohort
Market Area Connecticut National
Percent Change
2018–2023
Percent Change
2018–2023
Percent Change
2018–2023
0–4 Years -1.1% -1.2% 1.5%
5–9 Years -7.6% -5.4% -0.2%
10–14 Years -3.3% -9.2% -0.2%
15–17 Years 7.2% -4.5% 4.0%
18–20 Years 8.3% -2.0% 2.8%
21–24 Years 10.8% 1.8% 1.5%
25–34 Years -4.6% 0.0% -0.9%
35–44 Years -5.3% -0.3% 3.9%
45–54 Years -1.9% -12.1% -2.8%
55–64 Years 6.0% 2.3% 2.8%
65–74 Years 20.9% 20.3% 20.3%
75–84 Years 12.7% 9.6% 15.1%
85+ Years -3.6% 0.4% 5.5%
Total 1.6% 0.0% 3.5%
65+ Years 14.4% 14.4% 17.0%
75+ Years 6.8% 6.4% 12.2%
85+ Years -3.6% 0.4% 5.5%
Source: Environics Analytics and Health Dimensions Group analysis
Findings:
Seniors 75 years of age and older are the primary users of services; TNW market area is
increasing (6.8 percent) at a slightly higher rate than Connecticut (6.4 percent), but less than
nationally (12.2 percent).
Seniors 85-and-older cohort is the highest users of services; TNW market area is declining,
while there is a small increase in Connecticut (0.4 percent) and a larger increase nationally
(5.5 percent).
Need for senior services will increase in the TNW market area, but with a decline in the
85-and-older age cohort, the demand will increase at a lower rate than in Connecticut and
nationally.
Financial and Operating Report for
The Nathaniel Witherell
February 26, 2019 Page 13
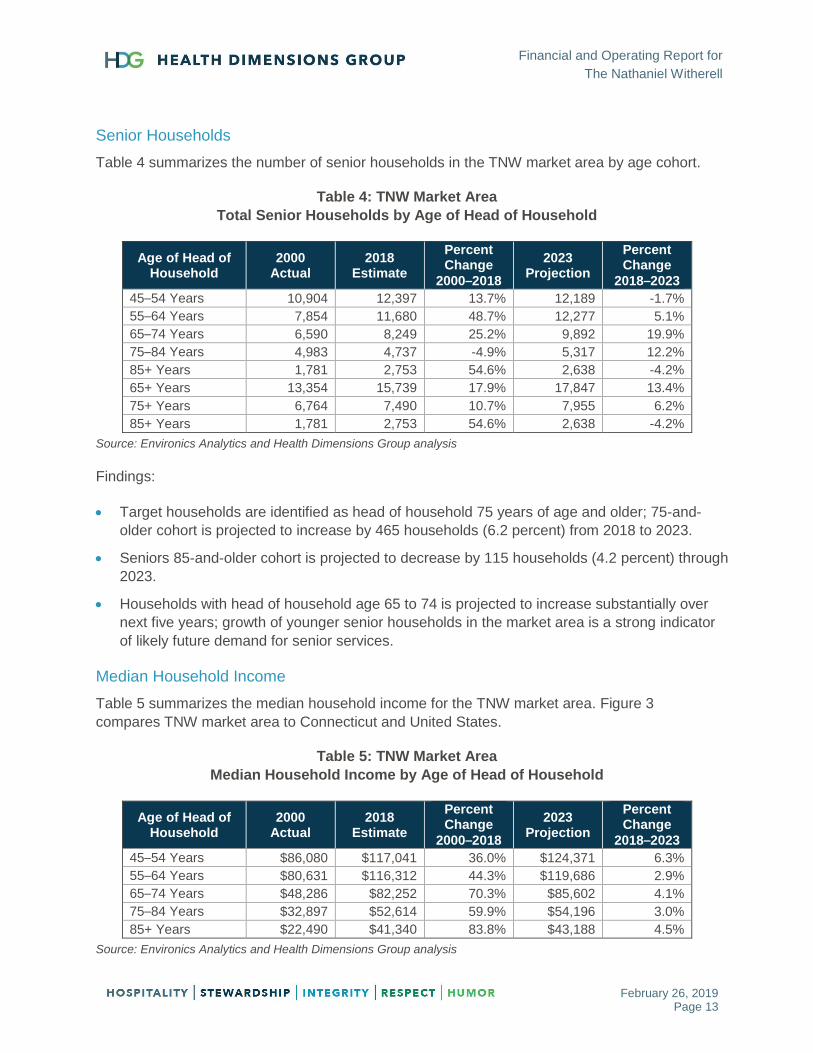
Senior Households
Table 4 summarizes the number of senior households in the TNW market area by age cohort.
Table 4: TNW Market Area
Total Senior Households by Age of Head of Household
Age of Head of Household
2000 Actual
2018 Estimate
Percent Change
2000–2018
2023 Projection
Percent Change
2018–2023
45–54 Years 10,904 12,397 13.7% 12,189 -1.7%
55–64 Years 7,854 11,680 48.7% 12,277 5.1%
65–74 Years 6,590 8,249 25.2% 9,892 19.9%
75–84 Years 4,983 4,737 -4.9% 5,317 12.2%
85+ Years 1,781 2,753 54.6% 2,638 -4.2%
65+ Years 13,354 15,739 17.9% 17,847 13.4%
75+ Years 6,764 7,490 10.7% 7,955 6.2%
85+ Years 1,781 2,753 54.6% 2,638 -4.2%
Source: Environics Analytics and Health Dimensions Group analysis
Findings:
Target households are identified as head of household 75 years of age and older; 75-and-
older cohort is projected to increase by 465 households (6.2 percent) from 2018 to 2023.
Seniors 85-and-older cohort is projected to decrease by 115 households (4.2 percent) through
2023.
Households with head of household age 65 to 74 is projected to increase substantially over
next five years; growth of younger senior households in the market area is a strong indicator
of likely future demand for senior services.
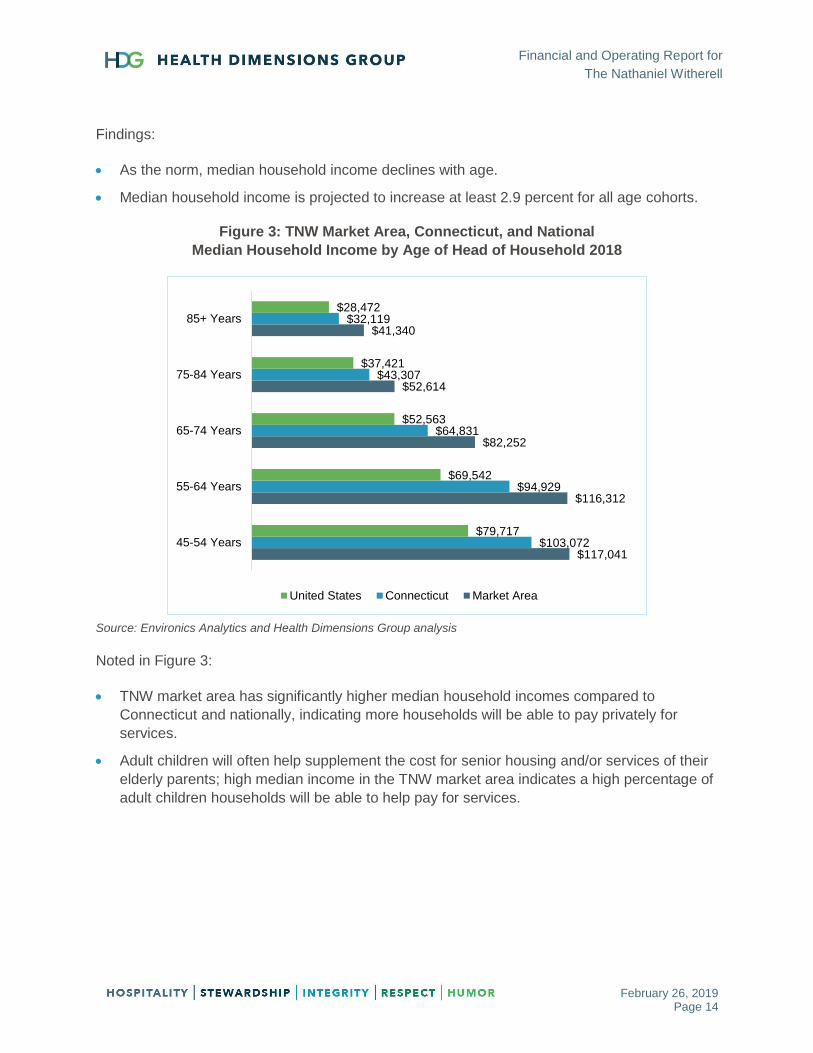
Median Household Income
Table 5 summarizes the median household income for the TNW market area. Figure 3
compares TNW market area to Connecticut and United States.
Table 5: TNW Market Area
Median Household Income by Age of Head of Household
Age of Head of Household
2000 Actual
2018 Estimate
Percent Change
2000–2018
2023 Projection
Percent Change
2018–2023
45–54 Years $86,080 $117,041 36.0% $124,371 6.3%
55–64 Years $80,631 $116,312 44.3% $119,686 2.9%
65–74 Years $48,286 $82,252 70.3% $85,602 4.1%
75–84 Years $32,897 $52,614 59.9% $54,196 3.0%
85+ Years $22,490 $41,340 83.8% $43,188 4.5%
Source: Environics Analytics and Health Dimensions Group analysis
Financial and Operating Report for
The Nathaniel Witherell
February 26, 2019 Page 14
Findings:
As the norm, median household income declines with age.
Median household income is projected to increase at least 2.9 percent for all age cohorts.
Figure 3: TNW Market Area, Connecticut, and National
Median Household Income by Age of Head of Household 2018
Source: Environics Analytics and Health Dimensions Group analysis
Noted in Figure 3:
TNW market area has significantly higher median household incomes compared to
Connecticut and nationally, indicating more households will be able to pay privately for
services.
Adult children will often help supplement the cost for senior housing and/or services of their
elderly parents; high median income in the TNW market area indicates a high percentage of
adult children households will be able to help pay for services.
$117,041
$116,312
$82,252
$52,614
$41,340
$103,072
$94,929
$64,831
$43,307
$32,119
$79,717
$69,542
$52,563
$37,421
$28,472
45-54 Years
55-64 Years
65-74 Years
75-84 Years
85+ Years
United States Connecticut Market Area

Financial and Operating Report for
The Nathaniel Witherell
February 26, 2019 Page 15
Elderly Homeownership
Figure 4 summarizes the elderly homeownership in the TNW market area by age cohort.
Figure 4: TNW Market Area Elderly Homeownership
Source: Environics Analytics and Health Dimensions Group analysis
Noted in Figure 4:
Majority of households with age of head of household 75+ are homeowners; homeowners will
realize assets from sale of home to help pay for services.
Homeownership in the TNW market area is very similar for 55–64, 65–74, and 75–84 age
cohorts, but decline significantly for the 85-and-older age cohort.
68.1%
69.7%
69.8%
61.6%
78.4%
78.6%
74.8%
63.4%
76.7%
79.9%
77.7%
64.4%
0.0% 10.0% 20.0% 30.0% 40.0% 50.0% 60.0% 70.0% 80.0% 90.0%
55-64 Years
65-74 Years
75-84 Years
85+ Years
United States Connecticut Market Area
Financial and Operating Report for
The Nathaniel Witherell
February 26, 2019 Page 16
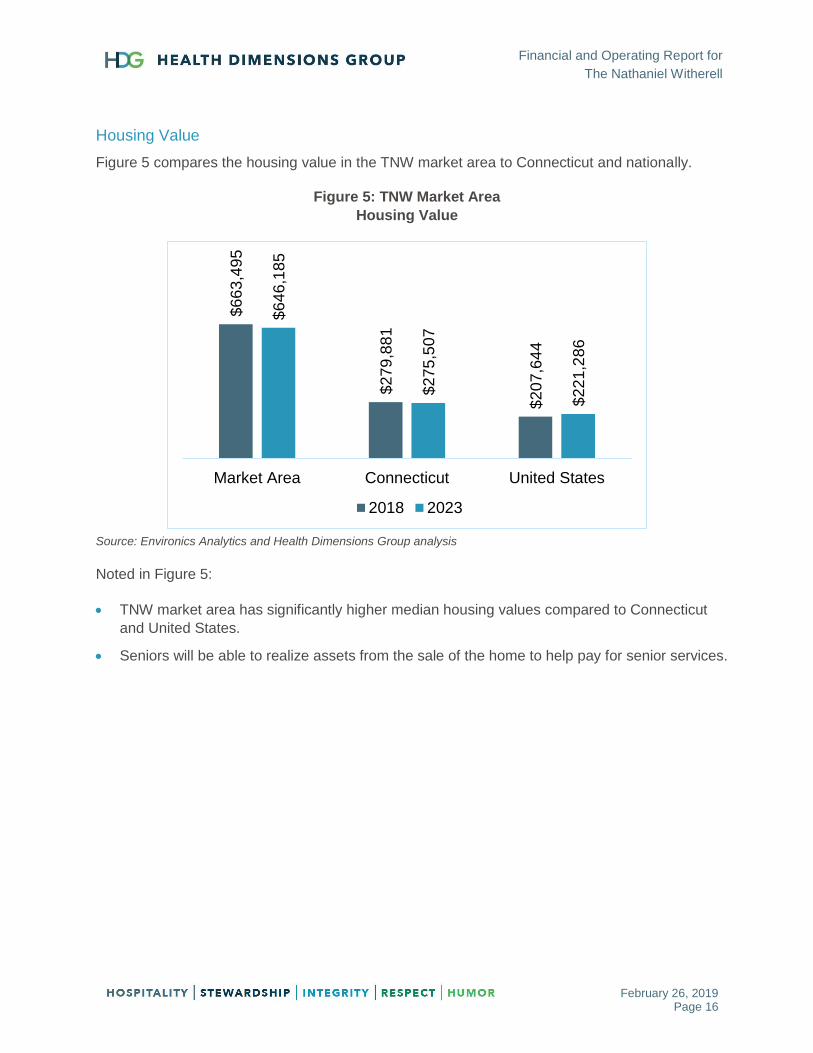
Housing Value
Figure 5 compares the housing value in the TNW market area to Connecticut and nationally.
Figure 5: TNW Market Area
Housing Value
Source: Environics Analytics and Health Dimensions Group analysis
Noted in Figure 5:
TNW market area has significantly higher median housing values compared to Connecticut
and United States.
Seniors will be able to realize assets from the sale of the home to help pay for senior services.
$6
63
,49
5
$2
79
,88
1
$2
07
,64
4
$6
46
,18
5
$2
75
,50
7
$2
21
,28
6
Market Area Connecticut United States
2018 2023
Financial and Operating Report for
The Nathaniel Witherell
February 26, 2019 Page 17
Market Analysis
A market analysis was completed to determine activity in or near the market that will impact
senior services in the near future. Specifically, the market analysis includes the following:
Accountable Care Organizations (ACOs)
Mandatory Bundling
Bundled Payments for Care Improvement Advanced (BPCI-A)
Primary Referral Sources
Medicare Advantage
Special Needs Plans (SNPs)
Accountable Care Organizations
Accountable care organizations (ACOs) are groups of doctors, hospitals, and other health care
providers who come together to provide coordinated, high quality care to their patients. The goal
of coordinated care is to ensure that patients, especially the chronically ill, get the right care at
the right time, while avoiding unnecessary duplication of services and preventing medical errors.
There are currently 40 active ACOs within 25 miles of TNW. Active ACOs include 24
commercial ACOs, two Medicare Comprehensive End-Stage Renal Disease Care Model ACOs,
two Medicare Next Generation ACOs, and 12 Medicare Shared Savings ACOs.
Tables 6 and 7 on the next page include a listing of the active and closed ACOs within 25 miles
of TNW.

Financial and Operating Report for
The Nathaniel Witherell
February 26, 2019 Page 18
Table 6: Commercial Accountable Care Organizations within 25 Miles of TNW
Source: Definitive Healthcare.
Note: Programs that have closed have been highlighted red
Table 7: Medicare Accountable Care Organizations within 25 Miles of TNW
Source: Definitive Healthcare
Note: Programs that have closed have been highlighted red.
ESRD – End-stage Renal Disease; ESCO – ESRD Seamless Care Organization; ACO – Accountable Care
Organization; MSSP – Medicare Shared Savings Program
ACO Name ACO Type City StateACO Start
Date
Aetna - Mount Sinai Health System ACO Commercial ACO New York NY 2016 Q1
Aetna - NYUPN ACO Commercial ACO New York NY 2014 Q3
Aetna - WCHN ACO Commercial ACO Danbury CT 2015 Q1
Aetna - Weill Cornell Physician Organization ACO Commercial ACO New York NY 2014 Q3
Aetna - WESTMED Medical Group ACO Commercial ACO Purchase NY 2013 Q1
Aetna Medicare Advantage - NYUPN Clinically Integrated Network LLC Commercial ACO New York NY 2013 Q3
Cigna - Mount Sinai Health Partners IPA ACO Commercial ACO New York NY 2017 Q3
Cigna - New York Quality Care Commercial ACO New York NY 2015 Q1
Cigna - Northwell Health ACO Commercial ACO New Hyde Park NY 2016 Q4
Cigna - NYUPN Clinically Integrated Network ACO Commercial ACO New York NY 2013 Q3
Cigna - ProHealth Care Associates ACO Commercial ACO Bronx NY 2016 Q3
Cigna - Stamford Health Integrated Practices ACO Commercial ACO Stamford CT 2015 Q2
Cigna - Weill Cornell Physician Organization ACO (Closed) Commercial ACO New York NY 2012 Q1
Cigna - Westmed Medical Group ACO Commercial ACO Purchase NY 2012 Q2
Empire BlueCross BlueShield - Beacon Health Partners ACO Commercial ACO Manhasset NY 2013 Q3
Empire Bluecross Blueshield - Montefiore Medical Center ACO Commercial ACO Bronx NY 2013 Q1
Empire BlueCross BlueShield - Mount Sinai Health System Accountable Care Organization Commercial ACO New York NY 2015 Q1
HealthyCT - WCHN ACO (Closed) Commercial ACO Danbury CT 2015 Q1
Humana Medicare Advantage - NYUPN Clinically Integrated Network LLC Commercial ACO New York NY 2013 Q3
Montefiore Medical Center - EmblemHealth ACO Commercial ACO Bronx NY 2011 Q1
Multiplan - WCHN ACO Commercial ACO Danbury CT 2015 Q1
Oxford - NYUPN Clinically Integrated Network LLC Commercial ACO New York NY 2013 Q3
UnitedHealthcare - Montefiore Medical Center ACO Commercial ACO Yonkers NY 2014 Q3
UnitedHealthcare - Northwell Health ACO Commercial ACO Manhasset NY 2013 Q1
UnitedHealthcare - NYUPN Clinically Integrated Network LLC Commercial ACO New York NY 2013 Q3
Unitedhealthcare - Optum - Westmed Medical Group ACO Commercial ACO Purchase NY 2012 Q3
ACO Name ACO Type City StateACO Start
Date
Rogosin Kidney Care Alliance LLC Medicare Comprehensive ESRD Care Model New York NY 2016 Q1
The Gotham City Kidney Care ESCO LLC Medicare Comprehensive ESRD Care Model College Point NY 2017 Q1
Bronx Accountable Healthcare Network IPA Inc (AKA Montefiore Accountable Care Organization) Medicare Next Generation ACO Bronx NY 2017 Q1
CareMount ACO Medicare Next Generation ACO Chappaqua NY 2018 Q1
Montefiore Care Management Organization (Closed - Left Pioneer Program) Medicare Pioneer ACO Bronx NY 2012 Q1
Balance ACO Medicare Shared Savings ACO New York NY 2012 Q3
Beacon Health Partners ACO Medicare Shared Savings ACO Garden City NY 2012 Q3
Empire ACO Medicare Shared Savings ACO Brooklyn NY 2017 Q1
Healthcare Provider ACO Inc (Closed - Did not Renew Participation in 2016) Medicare Shared Savings ACO Garden City NY 2012 Q3
Mount Sinai Care Medicare Shared Savings ACO New York NY 2012 Q3
MSHP ACO LLC (AKA Mount Sinai Health Partners ACO) Medicare Shared Savings ACO New York NY 2018 Q1
New York Medical Partners ACO Medicare Shared Savings ACO Oceanside NY 2017 Q1
New York State Elite (NYSE) ACO Inc (CLosed - Left MSSP Program) Medicare Shared Savings ACO East Meadow NY 2014 Q1
NewYork Quality Care Medicare Shared Savings ACO New York NY 2015 Q1
Northwell Health ACO (FKA North Shore-LIJ MSSP ACO LLC) Medicare Shared Savings ACO New Hyde Park NY 2016 Q1
Primary PartnerCare Associates IPA Medicare Shared Savings ACO Great Neck NY 2014 Q1
ProHEALTH Accountable Care Medical Group (AKA ProHEALTH Care Associates) Medicare Shared Savings ACO New Hyde Park NY 2012 Q3
Western Connecticut Health Network Physician Hospital Organization ACO Medicare Shared Savings ACO Danbury CT 2015 Q1
Westmed Medical Group Medicare Shared Savings ACO Purchase NY 2012 Q3

Financial and Operating Report for
The Nathaniel Witherell
February 26, 2019 Page 19
Mandatory Bundling
The Comprehensive Care for Joint Replacement (CJR) model was created by the Centers for
Medicare & Medicaid Services (CMS) to support better and more efficient care for beneficiaries
undergoing the most common inpatient surgeries for Medicare beneficiaries, which is hip and
knee replacement. The model was created to test bundled payment and quality measurements
for an episode of care association with hip and knee replacements to encourage hospitals,
physicians, and post-acute care providers to work together to improve the quality and
coordination of care from the hospital through recovery. The model began on April 1, 2016 and
will run through December 31, 2020.
TNW is located in Fairfield County, which is part of the Bridgeport-Stamford-Norwalk,
Connecticut Metropolitan Statistical Area (MSA). The MSA is not located in any mandatory
bundle markets.
Bundled Payments for Care Improvement Advanced (BPCI-A)
Bundled Payments for Care Improvement Advanced (BPCI-A) aims to encourage clinicians to
redesign care delivery by adopting best practices, reducing variation from standards of care,
and providing a clinically appropriate level of services for patients throughout a clinical episode.
BPCI-A will operate under a total-cost-of-care concept, in which the total Medicare fee-for-
service (FFS) spending on all items and services furnished to a BPCI-A beneficiary during the
clinical episode, including outlier payments, will be part of the clinical episode expenditure for
purposes of the target price and reconciliation calculations, unless specifically excluded.
The first cohort of participants started on October 1, 2018, and will run through December 31,
2023. A second application opportunity will be in January 2020.
BPCI-A includes 29 inpatient clinical episodes and three outpatient clinical episodes.
Participants that were selected to participate in BPCI-A are held accountable for one or more
clinical episodes and may not add or drop clinical episodes until January 1, 2020. CMS may
also elect to revise the clinical episodes in BPCI-A on an annual basis beginning January 1,
2020. Table 8 summarizes the BPCI-A participants.
Table 8: Bundled Payment for Care Improvement Advanced (BPCI-A) Participants
Located Near The Nathaniel Witherell
Source: Centers for Medicare & Medicaid Services
Note: Participant types include Physician Group Practices (PGP) and Acute Care Hospitals (ACH)
Organization DBA NameParticipant
TypeCity
Clinical
EpisodesConvener Organization Name
BAY AREA INPATIENT GROUP PGP DARIEN 32 LIBERTY HEALTH PARTNERS LLC
CEP AMERICA - ILLINOIS HOSPITALISTS, LLP PGP DARIEN 11 REMEDY BPCI PARTNERS, LLC
GREENWICH HOSPITAL ACH GREENWICH 25 YALE NEW HAVEN HOSPITAL, INC.
HOUSTON INPATIENT PHYSICIAN ASSOCIATES PLLC PGP DARIEN 32 LIBERTY HEALTH PARTNERS LLC
ORTHOPAEDIC AND NEUROSURGERY SPECIALISTS, PC PGP GREENWICH 2 SIGNATURE MEDICAL GROUP, INC.
STAMFORD HEALTH MEDICAL GROUP PGP STAMFORD 4 REMEDY BPCI PARTNERS, LLC
STAMFORD HOSPITAL ACH STAMFORD 10 REMEDY BPCI PARTNERS, LLC

Financial and Operating Report for
The Nathaniel Witherell
February 26, 2019 Page 20
More specific information regarding the types of clinical episodes can be found in Appendix A.
Primary Referral Sources
HDG analyzed the primary acute care referral sources to TNW during calendar year 2016,
which is the most recent data reported by CMS (see Appendix B). A review of Medicare claims
data indicated the top two sources accounted for 88.9 percent of all admissions to TNW. Table
9 summarizes the top Medicare Fee-for-Service (FFS) admission sources to TNW. Greenwich
Hospital and Stamford Hospital have been highlighted yellow since they account for nearly all of
TNW Medicare FFS admissions. It should be noted, due to CMS data reporting requirements,
any data size less than 11 appears blank.
Table 9: Primary Acute Care Referral Sources
The Nathaniel Witherell during Calendar Year 2016
Source: Definitive Healthcare
Findings:
Greenwich Hospital and Stamford Hospital account for 88.9 percent of total admissions to
TNW. Most skilled nursing facilities have between one and three primary referral sources.
Hospital for Special Surgery is the only other referral source to meet the CMS minimum data
reporting requirements, but accounted for less than three percent of referrals.
Approximately 8 percent of referrals will come from other hospitals, but none of these
hospitals is a significant referral source.
Hospital Name City StateMedicare
Pmts
Medicare
Charges# of Referrals
% of
Referrals
Greenwich Hospital Greenwich CT $5,782,895 $9,162,930 417 82.60%
Stamford Hospital Stamford CT $662,511 $1,066,401 32 6.30%
Hospital for Special Surgery New York NY $113,944 $147,852 14 2.80%
Danbury Hospital Danbury CT $86,444 $132,677
White Plains Hospital Center White Plains NY $80,015 $100,741
NewYork-Presbyterian Weill Cornell Medical Center New York NY $76,135 $113,681
Yale New Haven Hospital New Haven CT $75,323 $117,782
Memorial Sloan Kettering Cancer Center New York NY $46,748 $74,578
Northern Westchester Hospital Mount Kisco NY $33,979 $50,360
Stony Brook Southampton Hospital (FKA Southampton Hospital) Southampton NY $27,828 $33,959
Montefiore Nyack Hospital (FKA Nyack Hospital) Nyack NY $23,695 $21,014
Broward Health North (FKA North Broward Medical Center) Deerfield Beach FL $21,684 $30,542
St Johns Riverside Hospital - Andrus Pavilion Yonkers NY $21,263 $23,475
Putnam Hospital Center Carmel NY $17,651 $22,645
Beaufort Memorial Hospital Beaufort SC $17,208 $22,056
Phelps Memorial Hospital Sleepy Hollow NY $14,993 $17,512
Mount Sinai St Lukes New York NY $14,794 $17,858
Norwalk Hospital Norwalk CT $14,753 $21,130
Peconic Bay Medical Center Riverhead NY $14,014 $15,956
St Vincents Medical Center Bridgeport CT $13,344 $48,554
Massachusetts General Hospital Boston MA $10,660 $12,275
Bridgeport Hospital Bridgeport CT $10,222 $15,105
Helen Hayes Hospital West Haverstraw NY $9,251 $17,840
Masonicare Health Center Wallingford CT $4,593 $20,380
Mount Sinai Medical Center (AKA the Mount Sinai Hospital) New York NY $1,835 $3,802

Financial and Operating Report for
The Nathaniel Witherell
February 26, 2019 Page 21
Table 10 summarizes calendar year 2017 post-acute discharges from the two primary referral
hospitals.
Table 10: Post-Acute Discharge Disposition 2017
Primary Referral Sources Compared to National Averages
Discharge Disposition
Greenwich Hospital
Stamford Hospital
National
SNF 34.5% 25.6% 20.2%
Home Health 18.9% 27.3% 17.5%
IRF 1.7% 4.6% 4.0%
Hospice 2.4% 3.8% 3.0%
LTACH 0.0% 0.0% 1.2%
Total PAC 57.5% 61.3% 45.9%
Source: Definitive Healthcare 2017 Medicare claims data (hospitals) and MedPAC 2016 Medicare claims data
(national)
Findings:
Both Greenwich Hospital and Stamford Hospital discharge a significantly higher percentage of
Medicare Fee-for-Service (FFS) patients to post-acute compared to the national average.
High referral rate of Medicare FFS to skilled nursing facility (SNF) indicates the primary
referral sources utilize SNFs much higher than national average and will likely either maintain
current discharge pattern or decrease overall discharge percentage in the future.
Table 11 summarizes the past four fiscal year discharges percentages of Medicare FFS to SNF
from the two primary referral sources.
Table 11: Skilled Nursing Facility Discharges
Primary Referral Sources FY14–FY17
Hospital FY17 FY16 FY15 FY14
Greenwich Hospital 34.1% 35.7% 32.0% 31.4%
Stamford Hospital 25.6% 27.5% 28.0% 27.7%
Total 29.6% 31.3% 29.9% 29.4%
Source: American Hospital Directory
Findings:
Percentage of Medicare FFS discharges to SNF has fluctuated from both hospitals; Stamford
Hospital has been steadily declining.
Overall, average of the two hospitals has remained consistent, but has declined over the past
couple of years.

Financial and Operating Report for
The Nathaniel Witherell
February 26, 2019 Page 22
Medicare Advantage
HDG analyzed the historical penetration of Medicare Advantage in Fairfield County and
compared to Connecticut and United States. Figure 6 graphically shows the change in
penetration from August 2013 – August 2018.
Figure 6: Medicare Advantage Penetration
Fairfield County, Connecticut and United States
Source: Centers for Medicare & Medicaid Services (August 2013–August 2018)
Noted in Figure 6:
Fairfield County has a much lower penetration compared to Connecticut and United States,
but is nearer to the National average in 2018 than in prior years.
Connecticut has a penetration of approximately 9 percent higher than Fairfield County,
indicating Fairfield County is low compared to other counties in the State.
Table 12 indicates the Medicare Advantage plans, enrollment, and market share in Fairfield
County for August 2018.
20.00%
25.00%
30.00%
35.00%
40.00%
45.00%
2013 2014 2015 2016 2017 2018
Fairfield County Connecticut United States

Financial and Operating Report for
The Nathaniel Witherell
February 26, 2019 Page 23
Table 12: Medicare Advantage Plans
Fairfield County August 2018
Source: Centers for Medicare & Medicaid Services
Coordinated Care Plan (CCP); Health Maintenance Organization (HMO); Health Maintenance Organization Point-of-
Service (HMOPOS); Preferred Provider Organization (PPO)
Findings:
Providers may have different plan types, such as Health Maintenance Organizations (HMOs)
or local Preferred Provider Organizations (PPOs), resulting in the organization being listed
multiple times.
Oxford Health Plans has the highest market share with 24.9 percent of the market. The
market is rather competitive with many plan options and no one provider penetrating a
majority of the county.
Table 13 summarizes the Medicare Advantage penetration in fiscal year 2017 compared to
overall Medicare discharges from the two primary referral sources.
Table 13: Medicare Advantage Penetration FY17
Primary Referral Sources
Hospital Medicare
FFS Medicare
Advantage Total
Medicare
Medicare Advantage Penetration
Greenwich Hospital 4,153 648 4,801 13.5%
Stamford Hospital 4,610 961 5,571 17.3%
Total 8,763 1,609 10,372 15.5%
Source: American Hospital Directory
Organization Name Organization Type Plan Type Enrolled Market Share
OXFORD HEALTH PLANS (CT), INC. Local CCP HMO/HMOPOS 11,214 24.9%
AETNA LIFE INSURANCE COMPANY Local CCP Local PPO 6,521 14.5%
ANTHEM HEALTH PLANS, INC. Local CCP HMO/HMOPOS 6,059 13.5%
SIERRA HEALTH AND LIFE INSURANCE COMPANY, INC. Local CCP Local PPO 5,287 11.8%
CONNECTICARE, INC. Local CCP HMO/HMOPOS 5,136 11.4%
AETNA HEALTH INC. (CT) Local CCP HMO/HMOPOS 3,320 7.4%
ANTHEM INSURANCE COMPANIES, INC. Local CCP Local PPO 2,930 6.5%
WELLCARE OF CONNECTICUT, INC. Local CCP HMO/HMOPOS 2,336 5.2%
UNITEDHEALTHCARE INSURANCE COMPANY Regional CCP Regional PPO 1,096 2.4%
UNITEDHEALTHCARE INSURANCE COMPANY Local CCP Local PPO 897 2.0%
HUMANA INSURANCE COMPANY Local CCP Local PPO 71 0.2%
HORIZON INSURANCE COMPANY Local CCP Local PPO 28 0.1%
HCSC INSURANCE SERVICES COMPANY Local CCP Local PPO 24 0.1%
BCBS OF MICHIGAN MUTUAL INSURANCE COMPANY Local CCP Local PPO 22 0.0%
ANTHEM INSURANCE COMPANIES, INC. Local CCP Local PPO 20 0.0%
MCS ADVANTAGE, INC. Local CCP HMO/HMOPOS 12 0.0%
HEALTH INSURANCE PLAN OF GREATER NEW YORK Local CCP HMO/HMOPOS 11 0.0%
44,984 100.0%Total

Financial and Operating Report for
The Nathaniel Witherell
February 26, 2019 Page 24
Findings:
Medicare Advantage penetration in the hospital is always lower compared to the County
penetration due to the managed aspects of the plan. Although the Fairfield County penetration
is 28 percent, Medicare Advantage enrollees only accounted for 16 percent of the hospital
inpatient admissions.
Overall number of Medicare Advantage enrollees and penetration is higher at Stamford
Hospital, which refers fewer patients to TNW than Greenwich Hospital.
Special Needs Plans (SNPs)
A special needs plan (SNP) is a Medicare Advantage coordinated care plan specifically
designed to provide targeted care and limit enrollment to special needs individuals. There are
three types of individuals who qualify for a special needs plan:
Institutionalized
Dually eligible for Medicare and Medicaid
Individuals with severe or disabling chronic conditions
SNPs may be any type of coordinated care plan, including a local or regional preferred provider
organization (PPO), health maintenance organization (HMO), or an HMO Point-of-Service
(HMO-POS) plan. The three different types of SNPs include:
Chronic Condition SNP (C-SNP)
Dual Eligible SNP (D-SNP)
Institutional SNP (I-SNP)
SNPs follow existing Medicare Advantage program rules with regard to Medicare-covered
services and prescription drug benefits. All SNPs provider Part D prescription drug coverage.
Payment procedures are the same for non-SNP Medicare Advantage plans. Each SNP
prepares and submits bids the same as other Medicare Advantage plans and are paid in the
same manner.
As shown on Table 14, there are four SNPs in Connecticut, including two D-SNPs and two
I-SNPs.

Financial and Operating Report for
The Nathaniel Witherell
February 26, 2019 Page 25
Table 14: Medicare Advantage Penetration
Primary Referral Sources
Contract Name Plan Name Plan Type
Plan Geographic Name
Plan Enrollment
Special Needs
Plan Type
WELLCARE OF CONNECTICUT, INC.
WellCare Access (HMO SNP)
HMO Fairfield, Hartford
Counties 3,206
Dual-Eligible
ANTHEM HEALTH PLANS, INC.
Anthem MediBlue Dual Advantage
(HMO SNP) HMO
Select Counties in Connecticut
22,480 Dual-
Eligible
UNITEDHEALTHCARE INSURANCE COMPANY
UnitedHealthcare Nursing Home Plan
(PPO SNP)
Local PPO
State of Connecticut
3,711 Institutional
UNITEDHEALTHCARE INSURANCE COMPANY
UnitedHealthcare Assisted Living Plan
(PPO SNP)
Local PPO
State of Connecticut
Not Available
Institutional
Source: Centers for Medicare & Medicaid Services, November 2018 enrollment
Health Maintenance Organization (HMO), Preferred Provider Organization (PPO), Special Needs Plan (SNP)
Financial and Operating Report for
The Nathaniel Witherell
February 26, 2019 Page 26
Competitor Analysis
A competitor analysis was completed to determine how TNW compares to other SNF providers
in the market area (see Appendix C). Specifically, the competitor analysis includes the following:
Identification of current providers
Census and historical payor mix
Quality scores
Alternative providers
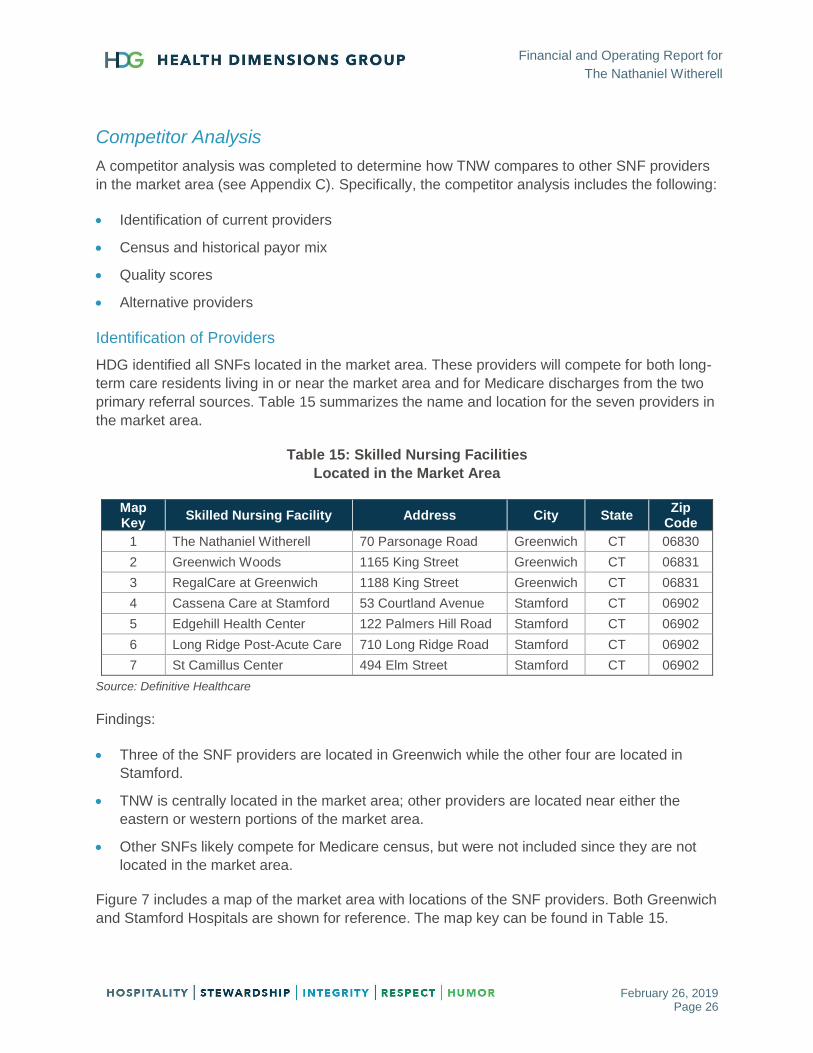
Identification of Providers
HDG identified all SNFs located in the market area. These providers will compete for both long-
term care residents living in or near the market area and for Medicare discharges from the two
primary referral sources. Table 15 summarizes the name and location for the seven providers in
the market area.
Table 15: Skilled Nursing Facilities
Located in the Market Area
Map Key
Skilled Nursing Facility Address City State Zip
Code
1 The Nathaniel Witherell 70 Parsonage Road Greenwich CT 06830
2 Greenwich Woods 1165 King Street Greenwich CT 06831
3 RegalCare at Greenwich 1188 King Street Greenwich CT 06831
4 Cassena Care at Stamford 53 Courtland Avenue Stamford CT 06902
5 Edgehill Health Center 122 Palmers Hill Road Stamford CT 06902
6 Long Ridge Post-Acute Care 710 Long Ridge Road Stamford CT 06902
7 St Camillus Center 494 Elm Street Stamford CT 06902
Source: Definitive Healthcare
Findings:
Three of the SNF providers are located in Greenwich while the other four are located in
Stamford.
TNW is centrally located in the market area; other providers are located near either the
eastern or western portions of the market area.
Other SNFs likely compete for Medicare census, but were not included since they are not
located in the market area.
Figure 7 includes a map of the market area with locations of the SNF providers. Both Greenwich
and Stamford Hospitals are shown for reference. The map key can be found in Table 15.

Financial and Operating Report for
The Nathaniel Witherell
February 26, 2019 Page 27
Figure 7: Skilled Nursing Facilities
Located in the Market Area
Source: Definitive Healthcare and Caliper’s Maptitude 2018
Financial and Operating Report for
The Nathaniel Witherell
February 26, 2019 Page 28
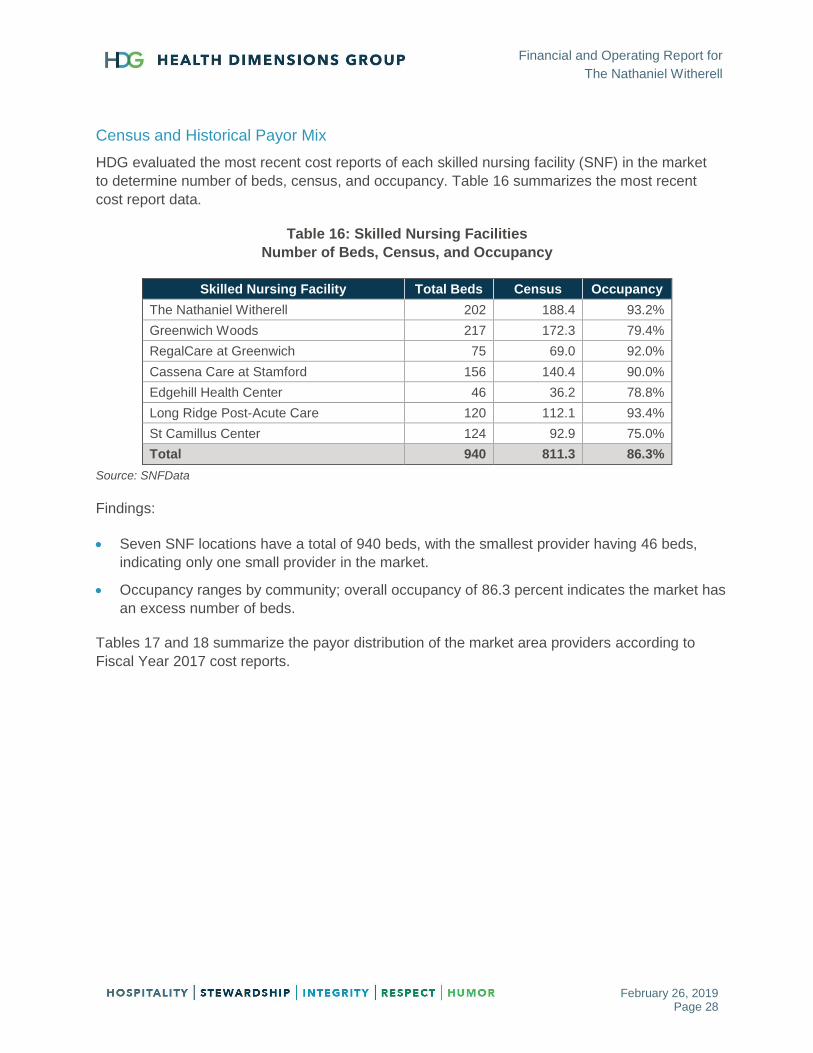
Census and Historical Payor Mix
HDG evaluated the most recent cost reports of each skilled nursing facility (SNF) in the market
to determine number of beds, census, and occupancy. Table 16 summarizes the most recent
cost report data.
Table 16: Skilled Nursing Facilities
Number of Beds, Census, and Occupancy
Skilled Nursing Facility Total Beds Census Occupancy
The Nathaniel Witherell 202 188.4 93.2%
Greenwich Woods 217 172.3 79.4%
RegalCare at Greenwich 75 69.0 92.0%
Cassena Care at Stamford 156 140.4 90.0%
Edgehill Health Center 46 36.2 78.8%
Long Ridge Post-Acute Care 120 112.1 93.4%
St Camillus Center 124 92.9 75.0%
Total 940 811.3 86.3%
Source: SNFData
Findings:
Seven SNF locations have a total of 940 beds, with the smallest provider having 46 beds,
indicating only one small provider in the market.
Occupancy ranges by community; overall occupancy of 86.3 percent indicates the market has
an excess number of beds.
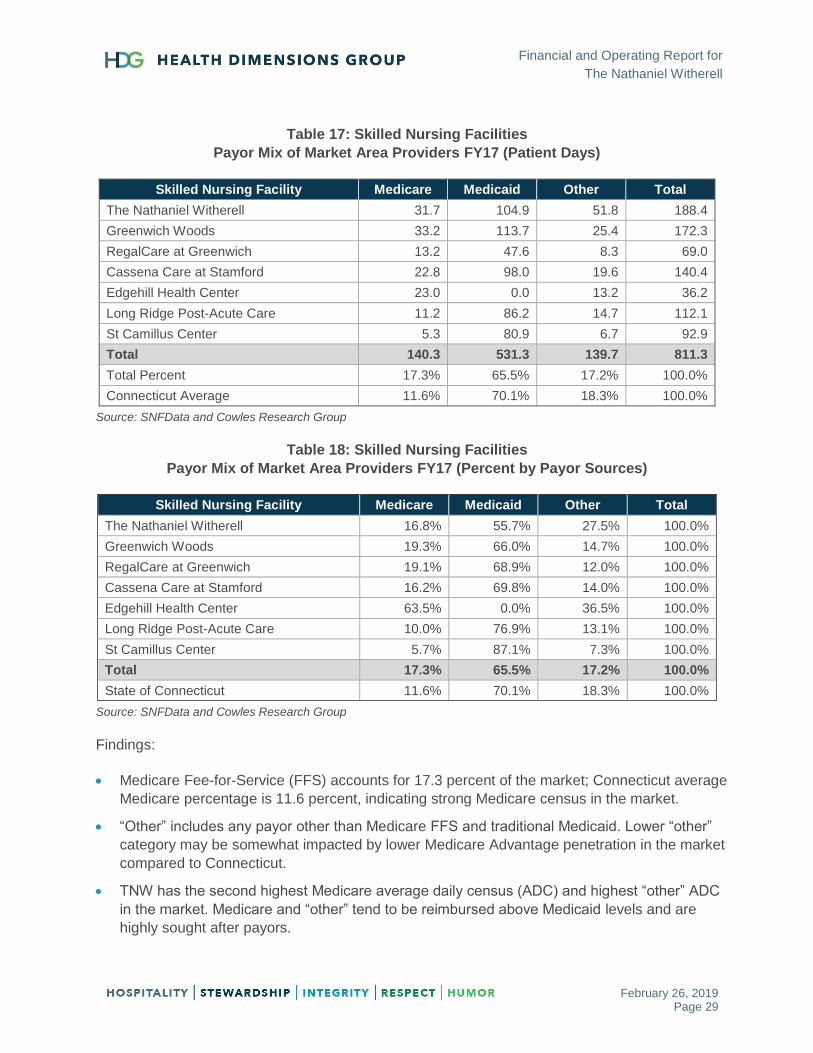
Tables 17 and 18 summarize the payor distribution of the market area providers according to
Fiscal Year 2017 cost reports.
Financial and Operating Report for
The Nathaniel Witherell
February 26, 2019 Page 29
Table 17: Skilled Nursing Facilities
Payor Mix of Market Area Providers FY17 (Patient Days)
Skilled Nursing Facility Medicare Medicaid Other Total
The Nathaniel Witherell 31.7 104.9 51.8 188.4
Greenwich Woods 33.2 113.7 25.4 172.3
RegalCare at Greenwich 13.2 47.6 8.3 69.0
Cassena Care at Stamford 22.8 98.0 19.6 140.4
Edgehill Health Center 23.0 0.0 13.2 36.2
Long Ridge Post-Acute Care 11.2 86.2 14.7 112.1
St Camillus Center 5.3 80.9 6.7 92.9
Total 140.3 531.3 139.7 811.3
Total Percent 17.3% 65.5% 17.2% 100.0%
Connecticut Average 11.6% 70.1% 18.3% 100.0%
Source: SNFData and Cowles Research Group
Table 18: Skilled Nursing Facilities
Payor Mix of Market Area Providers FY17 (Percent by Payor Sources)
Skilled Nursing Facility Medicare Medicaid Other Total
The Nathaniel Witherell 16.8% 55.7% 27.5% 100.0%
Greenwich Woods 19.3% 66.0% 14.7% 100.0%
RegalCare at Greenwich 19.1% 68.9% 12.0% 100.0%
Cassena Care at Stamford 16.2% 69.8% 14.0% 100.0%
Edgehill Health Center 63.5% 0.0% 36.5% 100.0%
Long Ridge Post-Acute Care 10.0% 76.9% 13.1% 100.0%
St Camillus Center 5.7% 87.1% 7.3% 100.0%
Total 17.3% 65.5% 17.2% 100.0%
State of Connecticut 11.6% 70.1% 18.3% 100.0%
Source: SNFData and Cowles Research Group
Findings:
Medicare Fee-for-Service (FFS) accounts for 17.3 percent of the market; Connecticut average
Medicare percentage is 11.6 percent, indicating strong Medicare census in the market.
“Other” includes any payor other than Medicare FFS and traditional Medicaid. Lower “other”
category may be somewhat impacted by lower Medicare Advantage penetration in the market
compared to Connecticut.
TNW has the second highest Medicare average daily census (ADC) and highest “other” ADC
in the market. Medicare and “other” tend to be reimbursed above Medicaid levels and are
highly sought after payors.
Financial and Operating Report for
The Nathaniel Witherell
February 26, 2019 Page 30
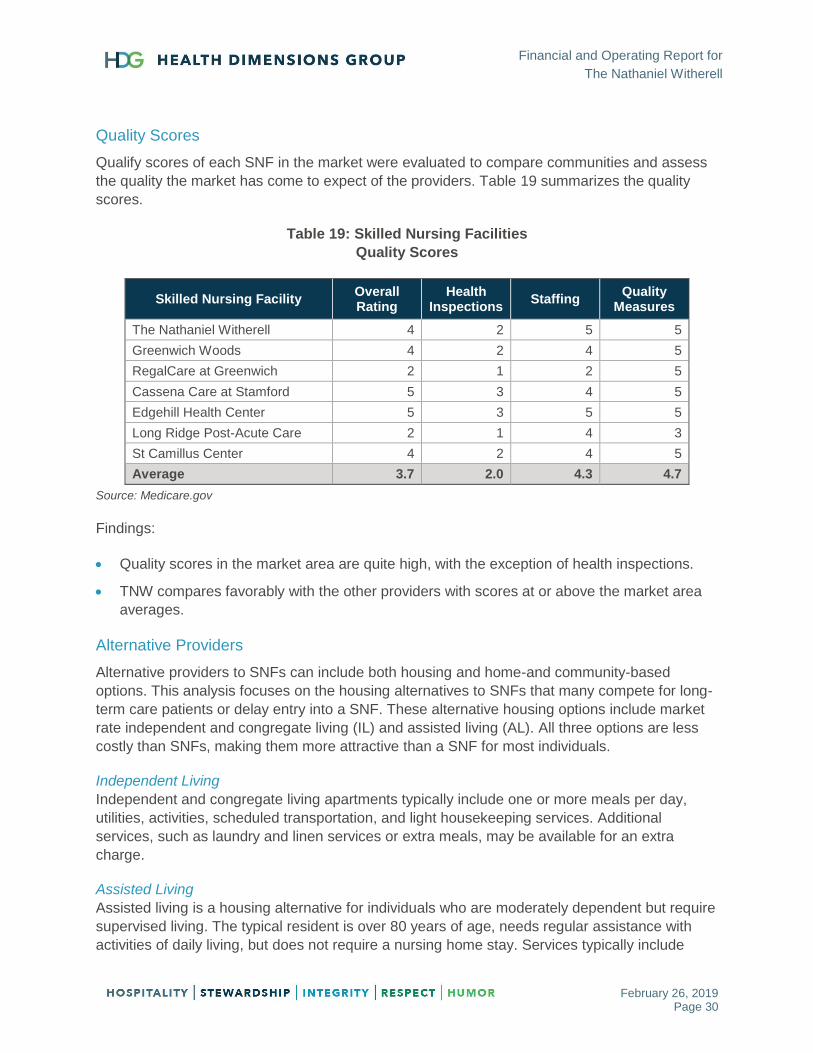
Quality Scores
Qualify scores of each SNF in the market were evaluated to compare communities and assess
the quality the market has come to expect of the providers. Table 19 summarizes the quality
scores.
Table 19: Skilled Nursing Facilities
Quality Scores
Skilled Nursing Facility Overall Rating
Health Inspections
Staffing Quality
Measures
The Nathaniel Witherell 4 2 5 5
Greenwich Woods 4 2 4 5
RegalCare at Greenwich 2 1 2 5
Cassena Care at Stamford 5 3 4 5
Edgehill Health Center 5 3 5 5
Long Ridge Post-Acute Care 2 1 4 3
St Camillus Center 4 2 4 5
Average 3.7 2.0 4.3 4.7
Source: Medicare.gov
Findings:
Quality scores in the market area are quite high, with the exception of health inspections.
TNW compares favorably with the other providers with scores at or above the market area
averages.
Alternative Providers
Alternative providers to SNFs can include both housing and home-and community-based
options. This analysis focuses on the housing alternatives to SNFs that many compete for long-
term care patients or delay entry into a SNF. These alternative housing options include market
rate independent and congregate living (IL) and assisted living (AL). All three options are less
costly than SNFs, making them more attractive than a SNF for most individuals.
Independent Living
Independent and congregate living apartments typically include one or more meals per day,
utilities, activities, scheduled transportation, and light housekeeping services. Additional
services, such as laundry and linen services or extra meals, may be available for an extra
charge.
Assisted Living
Assisted living is a housing alternative for individuals who are moderately dependent but require
supervised living. The typical resident is over 80 years of age, needs regular assistance with
activities of daily living, but does not require a nursing home stay. Services typically include
Financial and Operating Report for
The Nathaniel Witherell
February 26, 2019 Page 31
three meals per day, laundry and linen services, housekeeping, assistance with activities of
daily living (ADLs), medication supervision, utilities and schedule transportation.
Memory Care Assisted Living
The elderly market for memory care assisted living (MCAL) includes the moderately dependent
resident who has some form of memory loss and requires supervised living. This person is
typically over age 80, needs regular assistance with ADLs, and/or needs continuous supervision
in the form of a locked or monitored unit, but does not have to be placed in a nursing home.
Services include three meals a day, flat linen and personal laundry, assistance with ADLs as
needed, medication supervision, daily housekeeping, scheduled transportation, and all utilities.
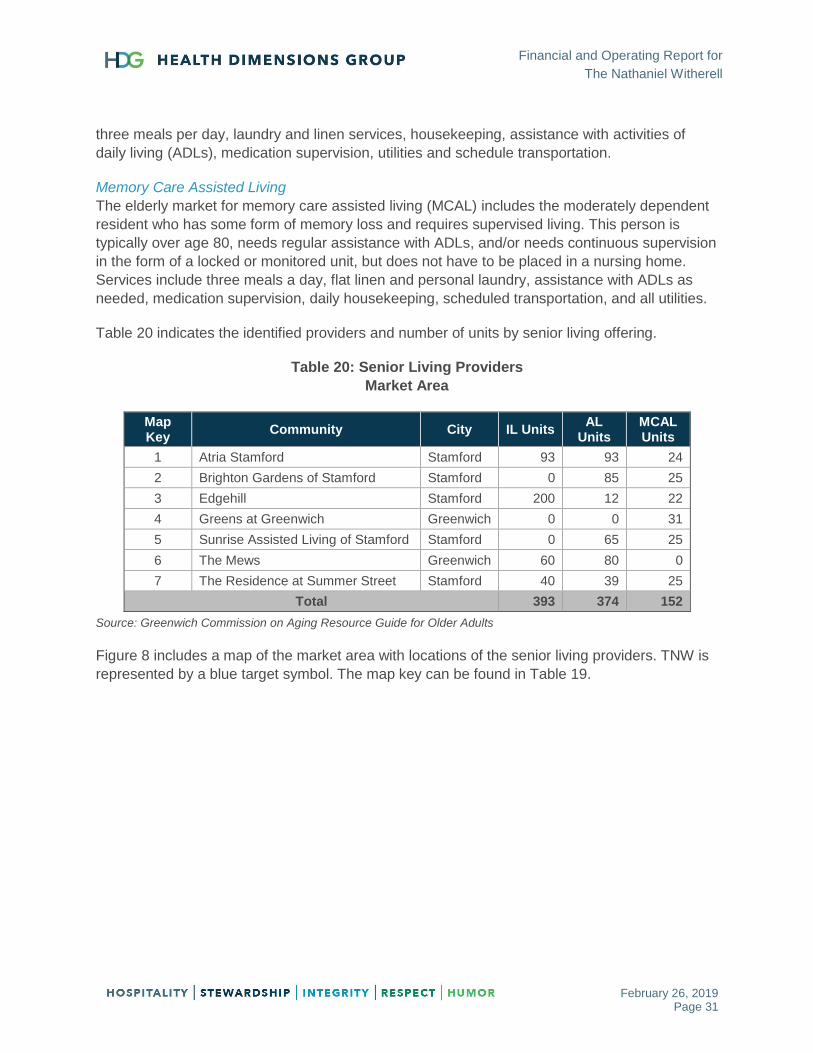
Table 20 indicates the identified providers and number of units by senior living offering.
Table 20: Senior Living Providers
Market Area
Map Key
Community City IL Units AL
Units MCAL Units
1 Atria Stamford Stamford 93 93 24
2 Brighton Gardens of Stamford Stamford 0 85 25
3 Edgehill Stamford 200 12 22
4 Greens at Greenwich Greenwich 0 0 31
5 Sunrise Assisted Living of Stamford Stamford 0 65 25
6 The Mews Greenwich 60 80 0
7 The Residence at Summer Street Stamford 40 39 25
Total 393 374 152
Source: Greenwich Commission on Aging Resource Guide for Older Adults
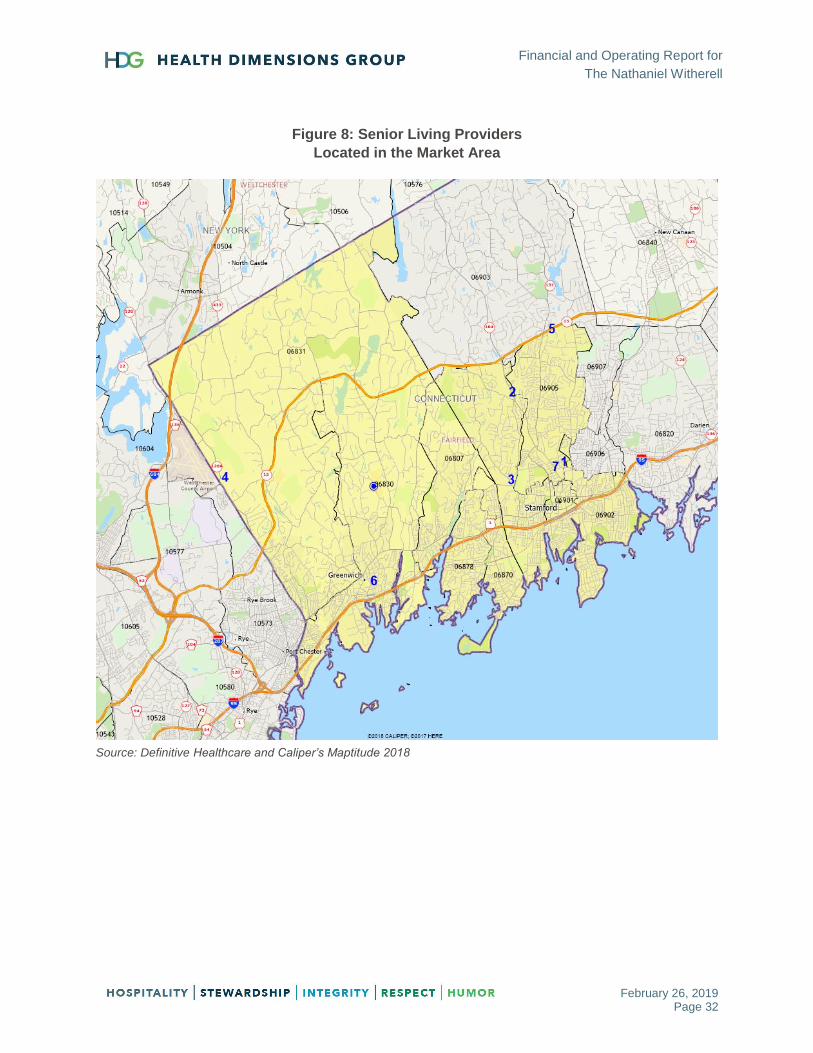
Figure 8 includes a map of the market area with locations of the senior living providers. TNW is
represented by a blue target symbol. The map key can be found in Table 19.
Financial and Operating Report for
The Nathaniel Witherell
February 26, 2019 Page 32
Figure 8: Senior Living Providers
Located in the Market Area
Source: Definitive Healthcare and Caliper’s Maptitude 2018
Financial and Operating Report for
The Nathaniel Witherell
February 26, 2019 Page 33
Nursing Home Bed Demand Analysis
A demand analysis was completed to determine the excess number or unmet need for addition
nursing home beds in the market area. Two different methodologies were calculated to estimate
demand. These methodologies include utilization and the ratio of seniors per occupied nursing
home bed.
Utilization
The utilization demand scenario calculates the nursing home bed demand using actual 2017
Connecticut nursing home bed utilizations. To mirror recent state and national trends,
utilizations are projected forward to project 2018 and 2023 utilizations.
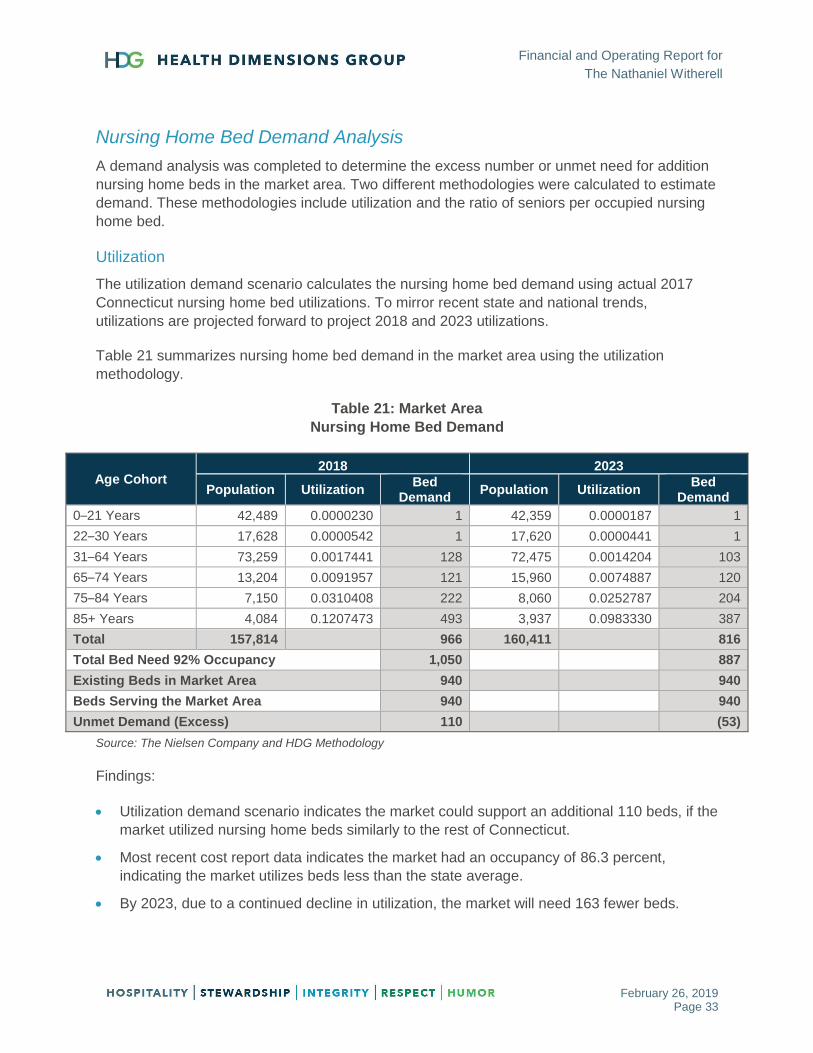
Table 21 summarizes nursing home bed demand in the market area using the utilization
methodology.
Table 21: Market Area
Nursing Home Bed Demand
Age Cohort 2018 2023
Population Utilization Bed
Demand Population Utilization
Bed Demand
0–21 Years 42,489 0.0000230 1 42,359 0.0000187 1
22–30 Years 17,628 0.0000542 1 17,620 0.0000441 1
31–64 Years 73,259 0.0017441 128 72,475 0.0014204 103
65–74 Years 13,204 0.0091957 121 15,960 0.0074887 120
75–84 Years 7,150 0.0310408 222 8,060 0.0252787 204
85+ Years 4,084 0.1207473 493 3,937 0.0983330 387
Total 157,814 966 160,411 816
Total Bed Need 92% Occupancy 1,050 887
Existing Beds in Market Area 940 940
Beds Serving the Market Area 940 940
Unmet Demand (Excess) 110 (53)
Source: The Nielsen Company and HDG Methodology
Findings:
Utilization demand scenario indicates the market could support an additional 110 beds, if the
market utilized nursing home beds similarly to the rest of Connecticut.
Most recent cost report data indicates the market had an occupancy of 86.3 percent,
indicating the market utilizes beds less than the state average.
By 2023, due to a continued decline in utilization, the market will need 163 fewer beds.
Financial and Operating Report for
The Nathaniel Witherell
February 26, 2019 Page 34
Seniors per Occupied Bed Ratio
The seniors per occupied bed ratio demand scenario calculates the nursing home bed demand
using historical Connecticut ratios. To mirror historical trending, ratios are projected forward to
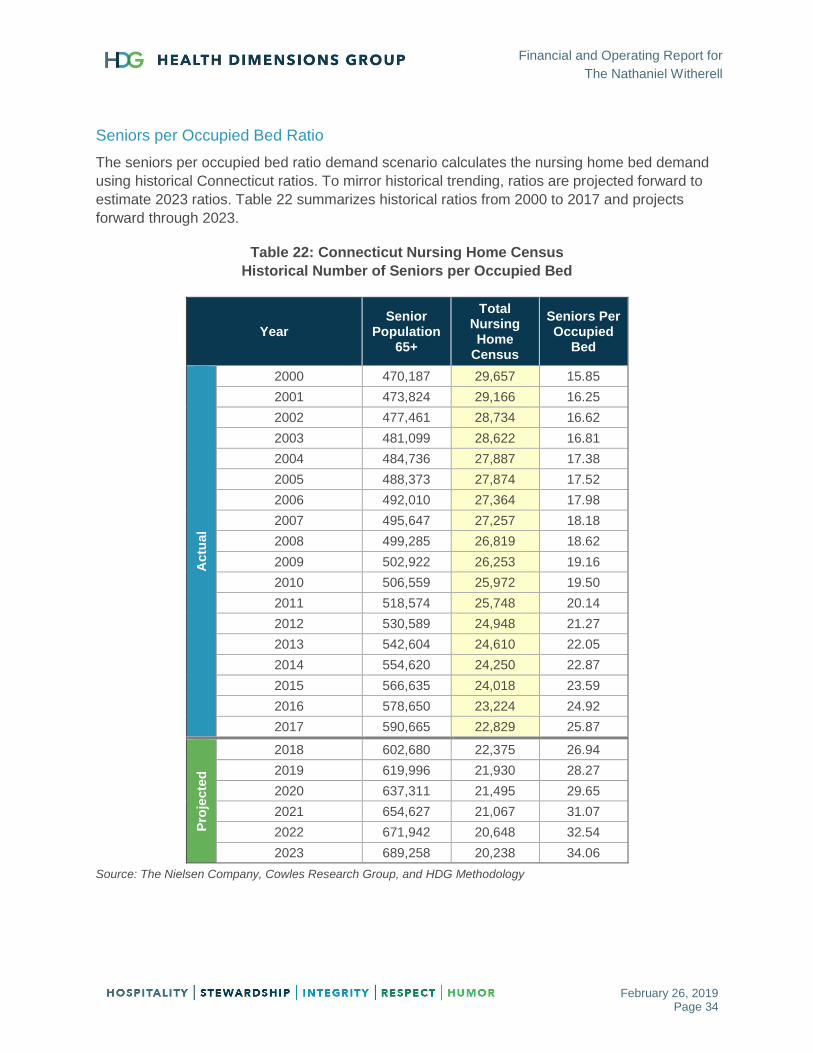
estimate 2023 ratios. Table 22 summarizes historical ratios from 2000 to 2017 and projects
forward through 2023.
Table 22: Connecticut Nursing Home Census
Historical Number of Seniors per Occupied Bed
Year Senior
Population 65+
Total Nursing Home
Census
Seniors Per Occupied
Bed
Actu
al
2000 470,187 29,657 15.85
2001 473,824 29,166 16.25
2002 477,461 28,734 16.62
2003 481,099 28,622 16.81
2004 484,736 27,887 17.38
2005 488,373 27,874 17.52
2006 492,010 27,364 17.98
2007 495,647 27,257 18.18
2008 499,285 26,819 18.62
2009 502,922 26,253 19.16
2010 506,559 25,972 19.50
2011 518,574 25,748 20.14
2012 530,589 24,948 21.27
2013 542,604 24,610 22.05
2014 554,620 24,250 22.87
2015 566,635 24,018 23.59
2016 578,650 23,224 24.92
2017 590,665 22,829 25.87
Pro
jecte
d
2018 602,680 22,375 26.94
2019 619,996 21,930 28.27
2020 637,311 21,495 29.65
2021 654,627 21,067 31.07
2022 671,942 20,648 32.54
2023 689,258 20,238 34.06
Source: The Nielsen Company, Cowles Research Group, and HDG Methodology
Financial and Operating Report for
The Nathaniel Witherell
February 26, 2019 Page 35
Findings:
Number of seniors has increased significantly while nursing home census has continued to
decline, resulting in more seniors per occupied bed.
If recent trends continue over the next five years, the number of seniors per occupied bed will
increase from 25.9 in 2017 to 34.1 in 2023.
Lower number of seniors per occupied bed indicates higher utilization of SNF beds; as the
seniors-per-occupied-bed ratio increases, the lower the utilization becomes. States such as
Arizona and Oregon have a high number of seniors per occupied bed, indicating low SNF
utilization. As states such as Connecticut continually increase access to Medicaid long-term
funding for alternative sources to institutional placement, the closer Connecticut will move
towards Arizona and Oregon ratios.
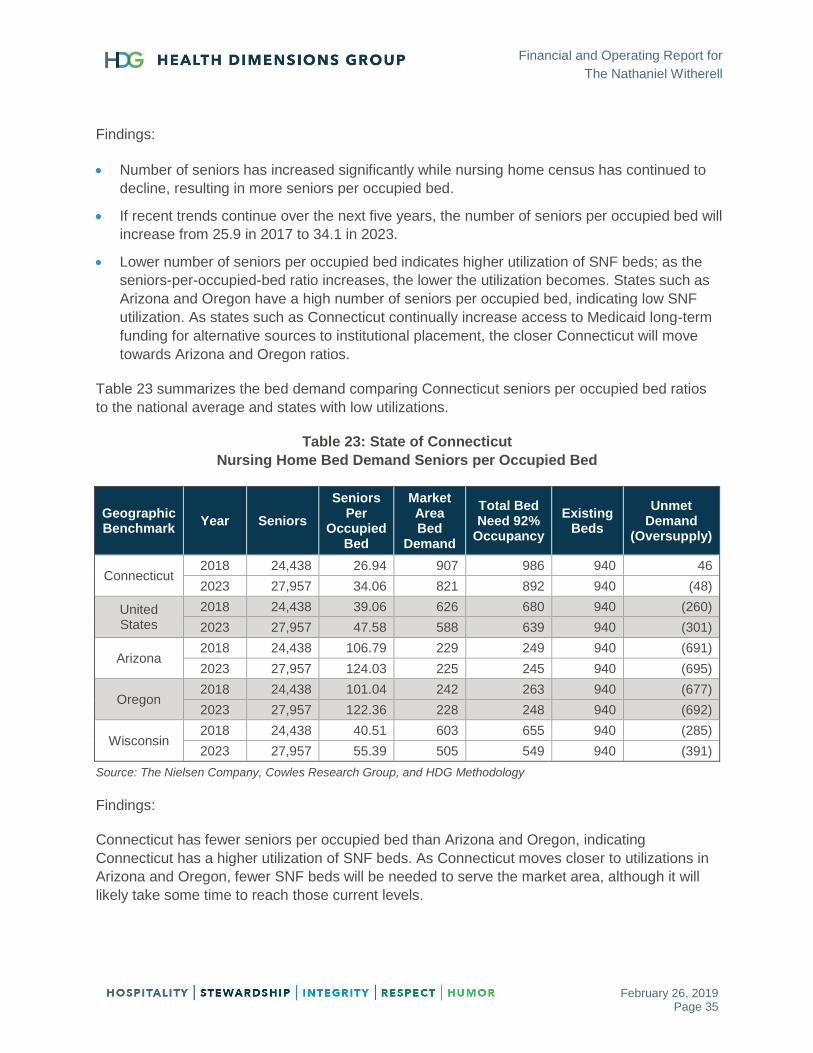
Table 23 summarizes the bed demand comparing Connecticut seniors per occupied bed ratios
to the national average and states with low utilizations.
Table 23: State of Connecticut
Nursing Home Bed Demand Seniors per Occupied Bed
Geographic Benchmark
Year Seniors
Seniors Per
Occupied Bed
Market Area Bed
Demand
Total Bed Need 92%
Occupancy
Existing Beds
Unmet Demand
(Oversupply)
Connecticut 2018 24,438 26.94 907 986 940 46
2023 27,957 34.06 821 892 940 (48)
United States
2018 24,438 39.06 626 680 940 (260)
2023 27,957 47.58 588 639 940 (301)
Arizona 2018 24,438 106.79 229 249 940 (691)
2023 27,957 124.03 225 245 940 (695)
Oregon 2018 24,438 101.04 242 263 940 (677)
2023 27,957 122.36 228 248 940 (692)
Wisconsin 2018 24,438 40.51 603 655 940 (285)
2023 27,957 55.39 505 549 940 (391)
Source: The Nielsen Company, Cowles Research Group, and HDG Methodology
Findings:
Connecticut has fewer seniors per occupied bed than Arizona and Oregon, indicating
Connecticut has a higher utilization of SNF beds. As Connecticut moves closer to utilizations in
Arizona and Oregon, fewer SNF beds will be needed to serve the market area, although it will
likely take some time to reach those current levels.

Financial and Operating Report for
The Nathaniel Witherell
February 26, 2019 Page 36
Average of Two Methodologies
Both methodologies indicate a similar excess number of beds in 2023. Table 24 summarizes the
results of the two methodologies and calculates an “average” of the two demands.
Table 24: Primary Market Area
Summary of Nursing Home Bed Demand
Year Demand Scenario Bed
Demand
Total Bed Need 92%
Occupancy
Existing Beds
Unmet Demand
(Oversupply)
2018
Utilization 966 1,050 940 110
Average 937 1,018 940 78
Seniors Per Occupied Bed 907 986 940 46
2023
Utilization 816 887 940 (53)
Average 819 890 940 (50)
Seniors Per Occupied Bed 821 892 940 (48)
Source: The Nielsen Company, Cowles Research Group, and HDG Methodology
Findings:
Nursing home bed need in the market area is projected to continually decline through 2023, with
the market requiring approximately 128 fewer beds than in 2018 (difference from the “average”
of the two methodologies in Table 24).

Financial and Operating Report for
The Nathaniel Witherell
February 26, 2019 Page 37
Senior Living Demand Analysis
A demand analysis was completed to determine the potential need for senior living in the market
area. Specifically, a high-level snapshot demand was calculated for market rate independent
living, assisted living, and memory care assisted living. Each community was contacted to
determine the number of units. Although the analysis provides a rough estimate of potential
need, a full market feasibility study would need to be completed to determine pricing structure,
occupancies, planned developments, and overall competitiveness to a new TNW sponsored
product. All demands calculated in this analysis are for a market rate population.
Independent Living
Table 25 summarizes the high-level snapshot demand for market rate independent living units.
Table 25: Market Area – Independent Living
Independent Living 2018 2023
Households with Head of Household Age 75+ 7,490 7,955
Income Qualified Households $40,000+ (2018) and $45,000+ (2023)
4,310 4,336
Competitive Independent Living Units 393 393
Target Market 3,917 3,943
Capture Rate 3–5% 118 196 118 197
Outside Draw 80% 147 245 148 246
Occupancy 93% 158 263 159 265
Demand (Excess) 158 263 159 265
Source: The Nielsen Company and HDG Methodology
Findings:
Market can support an additional 158 units of market rate independent living units.
Income qualification was set at $40,000 in 2018 and $45,000 in 2023.
Assisted Living
Table 26 on the next page summarizes the high-level snapshot demand for market rate assisted
living units.

Financial and Operating Report for
The Nathaniel Witherell
February 26, 2019 Page 38
Table 26: Market Area – Assisted Living
Assisted Living 2018 2023
Households with Head of Household Age 75+ 7,490 7,955
Income Qualified Households: $45,000+ (2018) and $50,000+ (2023)
3,972 3,989
ADL (15.4% age 75–84 and 30.2% age 85+) 803 787
Competitive Assisted Living Units 374 374
Target Market 429 413
Capture Rate 15–20% 64 86 62 83
Outside Draw 80% 81 107 77 103
Occupancy 93% 87 115 83 111
Demand (Excess) 87 115 83 111
Source: The Nielsen Company and HDG Methodology
Findings:
Market can support an additional 87 units of market rate assisted living units.
Income qualification was set at $45,000 in 2018 and $50,000 in 2023.
Memory Care Assisted Living
Table 27 summarizes the high-level snapshot demand for market rate memory care assisted
living units.
Table 27: Market Area – Memory care Assisted Living
Memory Care Assisted Living 2018 2023
Households with Head of Household Age 75+ 7,490 7,955
Income Qualified Households: $50,000+ (2018) and $55,000 (2023)
3,633 3,764
Need (10% age 75–84 and 26% age 85+) 551 553
Competitive Memory Care Assisted Living Units 152 152
Target Market 399 401
Capture Rate 10–15% 40 60 40 60
Outside Draw 80% 50 75 50 75
Occupancy 93% 54 80 54 81
Demand (Excess) 54 80 54 81
Source: The Nielsen Company and HDG Methodology
Findings:
Market can support an additional 54 units of market rate memory care assisted living units.
Income qualification was set at $50,000 in 2018 and $55,000 in 2023.
Financial and Operating Report for
The Nathaniel Witherell
February 26, 2019 Page 39
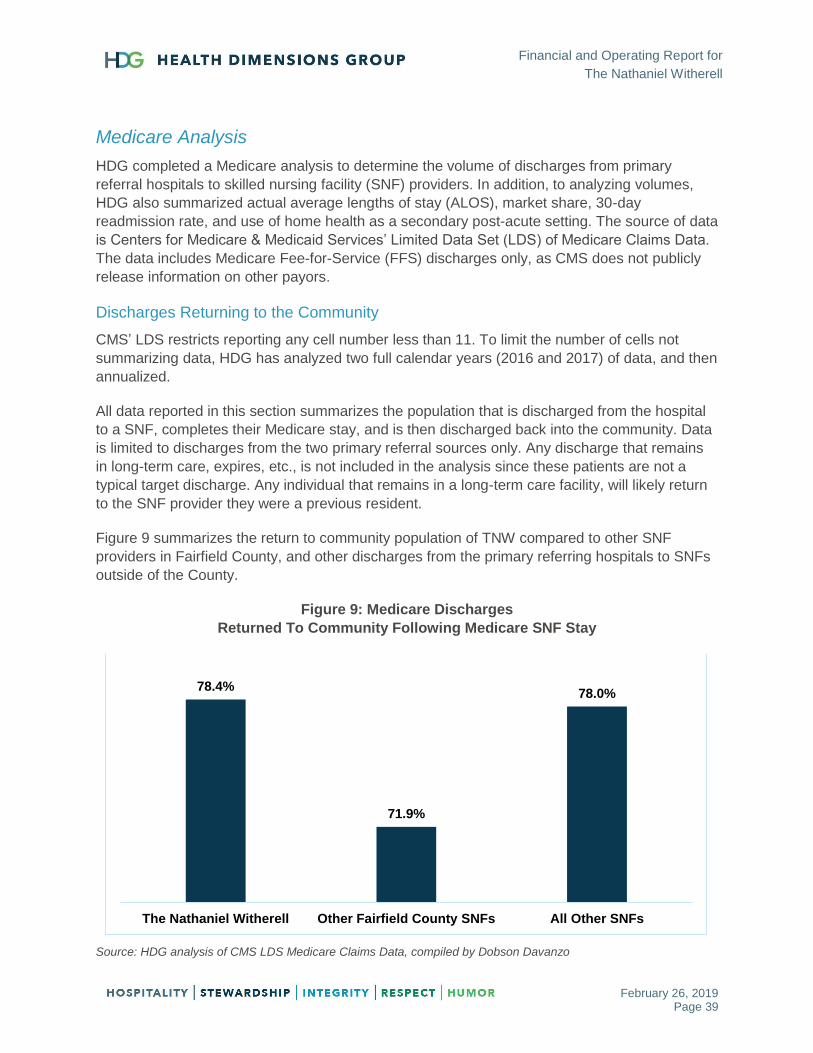
Medicare Analysis
HDG completed a Medicare analysis to determine the volume of discharges from primary
referral hospitals to skilled nursing facility (SNF) providers. In addition, to analyzing volumes,
HDG also summarized actual average lengths of stay (ALOS), market share, 30-day
readmission rate, and use of home health as a secondary post-acute setting. The source of data
is Centers for Medicare & Medicaid Services’ Limited Data Set (LDS) of Medicare Claims Data.
The data includes Medicare Fee-for-Service (FFS) discharges only, as CMS does not publicly
release information on other payors.
Discharges Returning to the Community
CMS’ LDS restricts reporting any cell number less than 11. To limit the number of cells not
summarizing data, HDG has analyzed two full calendar years (2016 and 2017) of data, and then
annualized.
All data reported in this section summarizes the population that is discharged from the hospital
to a SNF, completes their Medicare stay, and is then discharged back into the community. Data
is limited to discharges from the two primary referral sources only. Any discharge that remains
in long-term care, expires, etc., is not included in the analysis since these patients are not a
typical target discharge. Any individual that remains in a long-term care facility, will likely return
to the SNF provider they were a previous resident.
Figure 9 summarizes the return to community population of TNW compared to other SNF
providers in Fairfield County, and other discharges from the primary referring hospitals to SNFs
outside of the County.
Figure 9: Medicare Discharges
Returned To Community Following Medicare SNF Stay
Source: HDG analysis of CMS LDS Medicare Claims Data, compiled by Dobson Davanzo
78.4%
71.9%
78.0%
The Nathaniel Witherell Other Fairfield County SNFs All Other SNFs
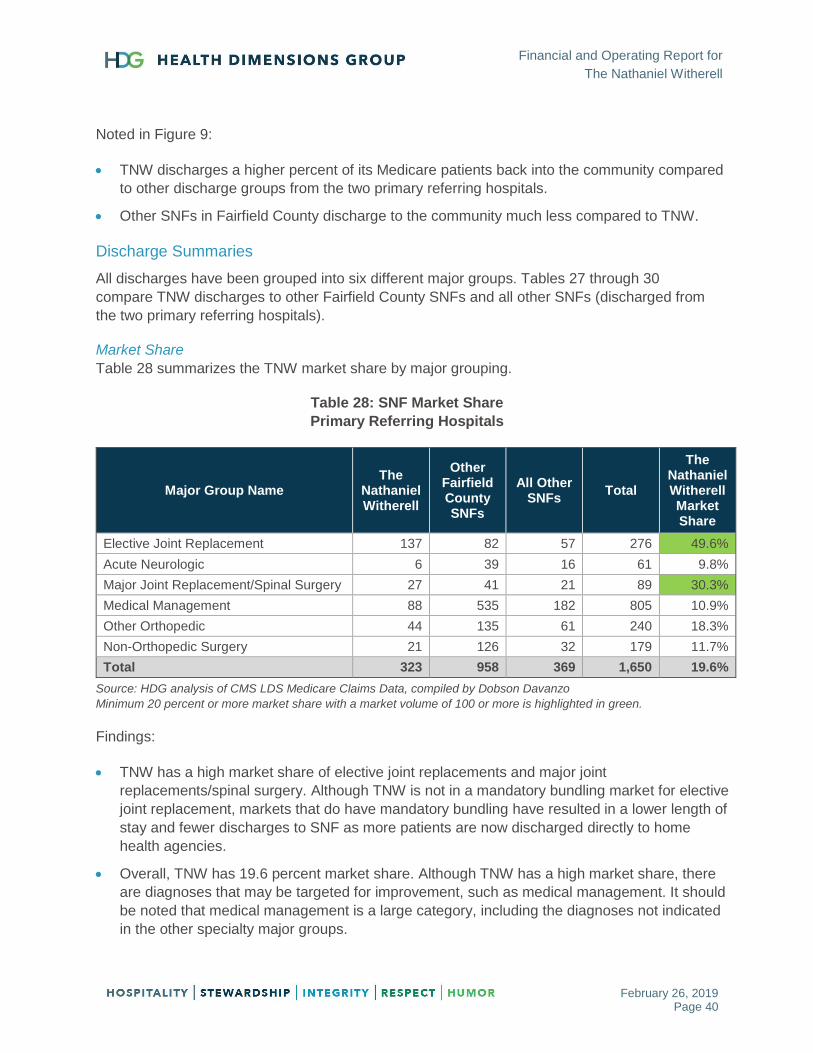
Financial and Operating Report for
The Nathaniel Witherell
February 26, 2019 Page 40
Noted in Figure 9:
TNW discharges a higher percent of its Medicare patients back into the community compared
to other discharge groups from the two primary referring hospitals.
Other SNFs in Fairfield County discharge to the community much less compared to TNW.
Discharge Summaries
All discharges have been grouped into six different major groups. Tables 27 through 30
compare TNW discharges to other Fairfield County SNFs and all other SNFs (discharged from
the two primary referring hospitals).
Market Share
Table 28 summarizes the TNW market share by major grouping.
Table 28: SNF Market Share
Primary Referring Hospitals
Major Group Name The
Nathaniel Witherell
Other Fairfield County SNFs
All Other SNFs
Total
The Nathaniel Witherell Market Share
Elective Joint Replacement 137 82 57 276 49.6%
Acute Neurologic 6 39 16 61 9.8%
Major Joint Replacement/Spinal Surgery 27 41 21 89 30.3%
Medical Management 88 535 182 805 10.9%
Other Orthopedic 44 135 61 240 18.3%
Non-Orthopedic Surgery 21 126 32 179 11.7%
Total 323 958 369 1,650 19.6%
Source: HDG analysis of CMS LDS Medicare Claims Data, compiled by Dobson Davanzo
Minimum 20 percent or more market share with a market volume of 100 or more is highlighted in green.
Findings:
TNW has a high market share of elective joint replacements and major joint
replacements/spinal surgery. Although TNW is not in a mandatory bundling market for elective
joint replacement, markets that do have mandatory bundling have resulted in a lower length of
stay and fewer discharges to SNF as more patients are now discharged directly to home
health agencies.
Overall, TNW has 19.6 percent market share. Although TNW has a high market share, there
are diagnoses that may be targeted for improvement, such as medical management. It should
be noted that medical management is a large category, including the diagnoses not indicated
in the other specialty major groups.

Financial and Operating Report for
The Nathaniel Witherell
February 26, 2019 Page 41
Average Length of Stay (ALOS)
Table 29 summarizes the TNW average length of stay (ALOS) by major grouping.
Table 29: SNF Average Length of Stay
Primary Referring Hospitals
Major Group Name The
Nathaniel Witherell
Other Fairfield
County SNFs
All Other SNFs
Total
Elective Joint Replacement 13.9 13.2 10.4 13.0
Acute Neurologic 27.8 21.4 21.2 22.0
Major Joint Replacement/Spinal Surgery 24.5 19.1 17.2 20.3
Medical Management 25.2 22.9 20.0 22.5
Other Orthopedic 29.5 29.3 28.9 29.2
Non-Orthopedic Surgery 25.0 23.4 15.1 22.1
Total 21.0 22.8 19.4 21.7
Source: HDG analysis of CMS LDS Medicare Claims Data, compiled by Dobson Davanzo
Minimum 10 percent less than total average length of stay is highlighted in green (minimum 11 discharges).
Minimum 10 percent more than total average length of stay is highlighted in red (minimum 11 discharges).
Findings:
TNW has a high ALOS for medical management, non-orthopedic surgery, and major joint
replacement/spinal surgery.
Overall, TNW has slightly lower ALOS (21.0 days) than the overall total average (21.7 days).
30-Day Readmission Rate
Table 30 summarizes the TNW 30-day readmission rate by major grouping.
Table 30: SNF 30-Day Readmission Rate
Primary Referring Hospitals
Major Group Name The
Nathaniel Witherell
Other Fairfield
County SNFs
All Other SNFs
Total
Elective Joint Replacement 3.3% 4.3% 1.8% 3.3%
Acute Neurologic 8.3% 21.8% 12.9% 18.2%
Major Joint Replacement/Spinal Surgery 0.0% 17.3% 7.1% 9.7%
Medical Management 17.1% 17.1% 19.0% 17.5%
Other Orthopedic 6.8% 10.7% 11.6% 10.2%
Non-Orthopedic Surgery 16.7% 17.5% 25.0% 18.8%
Total 8.2% 15.4% 14.7% 13.8%
Source: HDG analysis of CMS LDS Medicare Claims Data, compiled by Dobson Davanzo
Minimum 10 percent less than total 30-day readmission rate is highlighted in green (minimum 11 discharges).
Minimum 10 percent more than total 30-day readmission rate is highlighted in red (minimum 11 discharges).

Financial and Operating Report for
The Nathaniel Witherell
February 26, 2019 Page 42
Findings:
TNW has low 30-day readmission rates for major joint replacement/spinal surgery, other
orthopedic, and non-orthopedic surgery.
Overall, TNW has a lower 30-day readmission rate (8.2 percent) than the overall total average
(13.8 percent).
Home Health as a Secondary Post-Acute Setting
Table 31 summarizes the TNW use of home health as a secondary post-acute setting (after the
SNF stay) by major grouping.
Table 31: Home Health as a Secondary Post-Acute Setting
Primary Referring Hospitals
Major Group Name The
Nathaniel Witherell
Other Fairfield County SNFs
All Other SNFs
Total
Elective Joint Replacement 17.6% 62.0% 50.0% 37.5%
Acute Neurologic 75.0% 55.1% 58.1% 57.9%
Major Joint Replacement/Spinal Surgery 52.8% 56.8% 61.9% 56.8%
Medical Management 54.9% 60.3% 62.6% 60.2%
Other Orthopedic 54.5% 62.6% 71.1% 63.3%
Non-Orthopedic Surgery 42.9% 60.6% 60.9% 58.5%
Total 38.4% 60.4% 61.7% 56.4%
Source: HDG analysis of CMS LDS Medicare Claims Data, compiled by Dobson Davanzo
Minimum 10 percent less than total home health use as a second post-acute setting is highlighted in green
(minimum 11 discharges).
Minimum 10 percent more than total home health use as a second post-acute setting is highlighted in red
(minimum 11 discharges).
Findings:
TNW has a “low home health as a second post-acute setting” use rate for other orthopedic,
non-orthopedic surgery, and elective joint replacement.
Overall, TNW utilizes home health as a second post-acute setting at 38.4 percent compared
to the overall total average of 56.4 percent.
TNW has recently entered the home health market, which will likely increase the percentage
of residents discharged to home health following the SNF stay.

Financial and Operating Report for
The Nathaniel Witherell
February 26, 2019 Page 43
Primary Referral Sources – Opportunities for Improvement
The two primary referral sources (Greenwich Hospital Association and Stamford Hospital)
discharge a significant percentage of their Medicare patients to SNFs. HDG analyzed, by major
grouping, the number of discharges to a SNF that returned home, the ALOS in the SNF, 30-day
readmission rate from the SNF to the acute hospital, and home health as a secondary post-
acute setting.
An opportunity was identified by hospital and major group if the following conditions were met:
Minimum of 25 discharges
30-day readmission rate from the SNF to the hospital was higher than the market average
Any major grouping meeting this criteria is listed in Table 32. Detailed tables, by major group,
can be found in Appendix B (also referred to earlier in this report).
Table 32: Opportunities for Improvement
Primary Referring Hospitals
Hospital Major Group Name Annualized
Discharges
First PAC
SNF
Length of
Stay
Readmission
Rate
(30 Days
from SNF
Admission)
HHA as 2nd
PAC Setting
Within 14
Days of SNF
Discharge
STAMFORD HOSPITAL Acute Neurologic 29 22.5 19.0% 60.3%
STAMFORD HOSPITAL Elective Joint
Replacement 44 14.9 4.5% 70.5%
GREENWICH HOSPITAL
ASSOCIATION Medical Management 418 22.6 18.7% 59.0%
STAMFORD HOSPITAL Non-Orthopedic
Surgery 112 23.0 18.8% 60.1%
STAMFORD HOSPITAL Other Orthopedic 97 30.9 13.0% 62.7%
STAMFORD HOSPITAL Total 687 23.2 15.8% 62.0%
Source: HDG analysis of CMS LDS Medicare Claims Data, compiled by Dobson Davanzo
SNF Medicare Census
HDG calculated the Medicare SNF census of patients returning to the community after their
Medicare stay from the two primary referral hospitals.
Assumptions used in the analysis include the following:
Analysis assumes a small percentage of the population will be Medicare Advantage in 2017
(12 percent) and increasing to 17 percent in 2022.
Target population will increase 6 percent, which is the age 75-and-older population increase in
Fairfield County from 2018 to 2023.
SNF utilization and ALOS will have modest declines, which is in line with recent trends.

Financial and Operating Report for
The Nathaniel Witherell
February 26, 2019 Page 44
Table 33 summarizes the estimated overall Medicare average daily census (ADC) for 2017 and
2022.
Table 33: SNF Medicare Average Daily Census
Primary Referring Hospitals
Map Key
Hospital 2017
Medicare ADC
2022 Average
Market ADC
1 STAMFORD HOSPITAL 49 44
2 GREENWICH HOSPITAL ASSOCIATION 61 53
TOTAL 111 98
Source: HDG analysis of CMS LDS Medicare Claims Data, compiled by Dobson Davanzo
Findings:
Estimated ADC will decline from 111 in 2017 to 98 in 2022, due to continued declines in
utilization of SNF beds and lower ALOS.
Markets impacted with higher Medicare Advantage participation would likely experience a
decline of even more beds due to lower ALOS of Medicare Advantage populations.
SNF Medicare Census by Major Group
The SNF Medicare census by major group in summarized in Tables 34 (2017 ADC) and 35
(2022 ADC).
Table 34: SNF Medicare Average Daily Census by Major Group 2017
Primary Referring Hospitals
Major Group Name Stamford Hospital
Greenwich Hospital
Association Total
Elective Joint Replacement 2 9 11
Acute Neurologic 2 2 4
Major Joint Replacement/Spinal Surgery
1 4 6
Medical Management 27 29 56
Other Orthopedic 9 13 22
Non-Orthopedic Surgery 8 4 12
Total 49 62 111
Source: HDG analysis of CMS LDS Medicare Claims Data, compiled by Dobson Davanzo
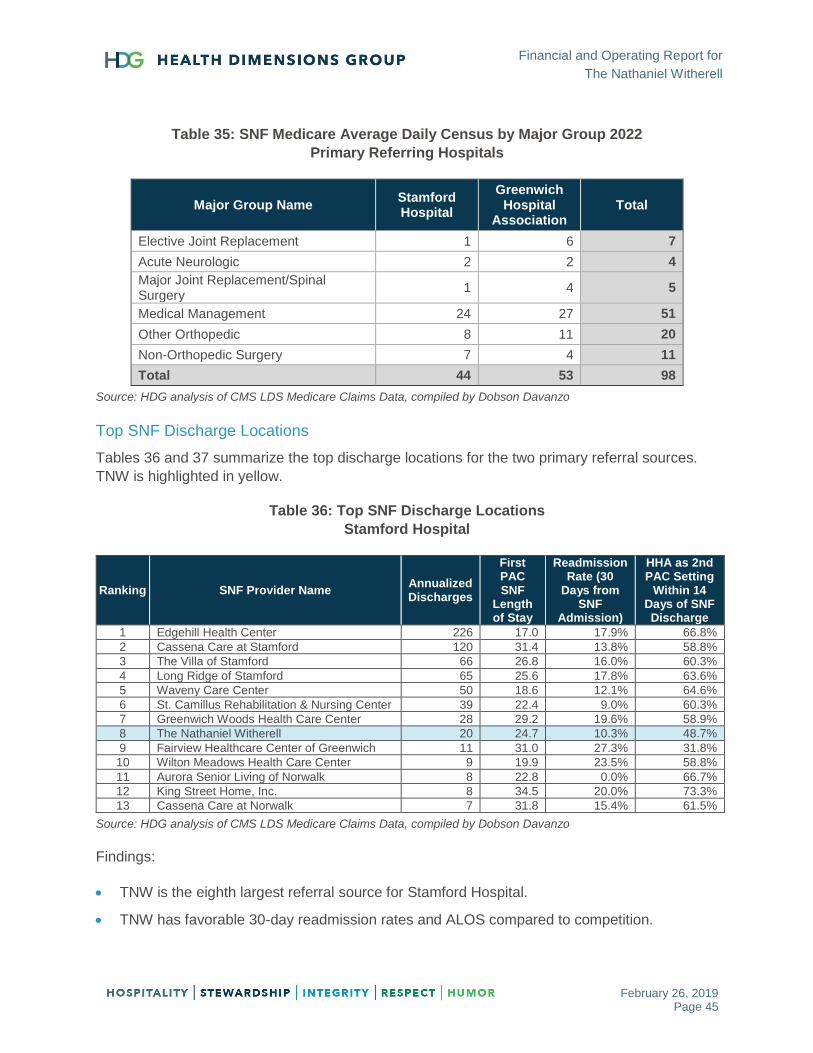
Financial and Operating Report for
The Nathaniel Witherell
February 26, 2019 Page 45
Table 35: SNF Medicare Average Daily Census by Major Group 2022
Primary Referring Hospitals
Major Group Name Stamford Hospital
Greenwich Hospital
Association Total
Elective Joint Replacement 1 6 7
Acute Neurologic 2 2 4
Major Joint Replacement/Spinal Surgery
1 4 5
Medical Management 24 27 51
Other Orthopedic 8 11 20
Non-Orthopedic Surgery 7 4 11
Total 44 53 98
Source: HDG analysis of CMS LDS Medicare Claims Data, compiled by Dobson Davanzo
Top SNF Discharge Locations
Tables 36 and 37 summarize the top discharge locations for the two primary referral sources.
TNW is highlighted in yellow.
Table 36: Top SNF Discharge Locations
Stamford Hospital
Ranking SNF Provider Name Annualized Discharges
First PAC SNF
Length of Stay
Readmission Rate (30
Days from SNF
Admission)
HHA as 2nd PAC Setting
Within 14 Days of SNF Discharge
1 Edgehill Health Center 226 17.0 17.9% 66.8%
2 Cassena Care at Stamford 120 31.4 13.8% 58.8%
3 The Villa of Stamford 66 26.8 16.0% 60.3%
4 Long Ridge of Stamford 65 25.6 17.8% 63.6%
5 Waveny Care Center 50 18.6 12.1% 64.6%
6 St. Camillus Rehabilitation & Nursing Center 39 22.4 9.0% 60.3%
7 Greenwich Woods Health Care Center 28 29.2 19.6% 58.9%
8 The Nathaniel Witherell 20 24.7 10.3% 48.7%
9 Fairview Healthcare Center of Greenwich 11 31.0 27.3% 31.8%
10 Wilton Meadows Health Care Center 9 19.9 23.5% 58.8%
11 Aurora Senior Living of Norwalk 8 22.8 0.0% 66.7%
12 King Street Home, Inc. 8 34.5 20.0% 73.3%
13 Cassena Care at Norwalk 7 31.8 15.4% 61.5%
Source: HDG analysis of CMS LDS Medicare Claims Data, compiled by Dobson Davanzo
Findings:
TNW is the eighth largest referral source for Stamford Hospital.
TNW has favorable 30-day readmission rates and ALOS compared to competition.
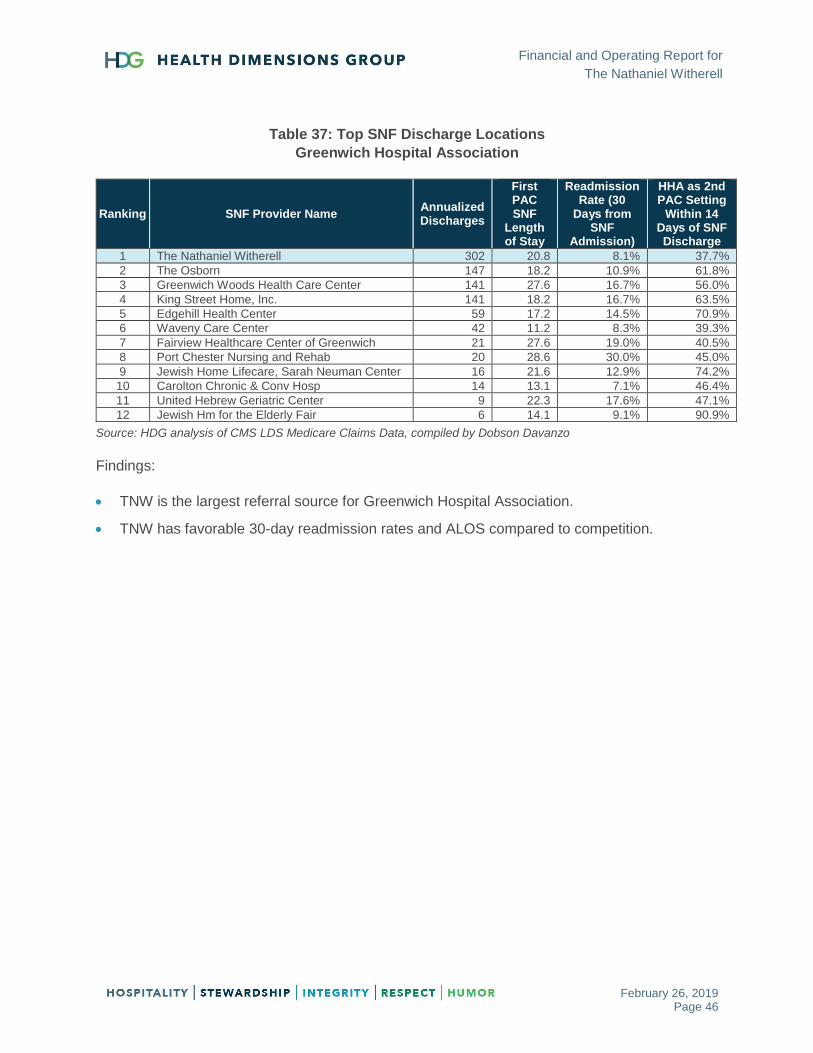
Financial and Operating Report for
The Nathaniel Witherell
February 26, 2019 Page 46
Table 37: Top SNF Discharge Locations
Greenwich Hospital Association
Ranking SNF Provider Name Annualized Discharges
First PAC SNF
Length of Stay
Readmission Rate (30
Days from SNF
Admission)
HHA as 2nd PAC Setting
Within 14 Days of SNF Discharge
1 The Nathaniel Witherell 302 20.8 8.1% 37.7%
2 The Osborn 147 18.2 10.9% 61.8%
3 Greenwich Woods Health Care Center 141 27.6 16.7% 56.0%
4 King Street Home, Inc. 141 18.2 16.7% 63.5%
5 Edgehill Health Center 59 17.2 14.5% 70.9%
6 Waveny Care Center 42 11.2 8.3% 39.3%
7 Fairview Healthcare Center of Greenwich 21 27.6 19.0% 40.5%
8 Port Chester Nursing and Rehab 20 28.6 30.0% 45.0%
9 Jewish Home Lifecare, Sarah Neuman Center 16 21.6 12.9% 74.2%
10 Carolton Chronic & Conv Hosp 14 13.1 7.1% 46.4%
11 United Hebrew Geriatric Center 9 22.3 17.6% 47.1%
12 Jewish Hm for the Elderly Fair 6 14.1 9.1% 90.9%
Source: HDG analysis of CMS LDS Medicare Claims Data, compiled by Dobson Davanzo
Findings:
TNW is the largest referral source for Greenwich Hospital Association.
TNW has favorable 30-day readmission rates and ALOS compared to competition.

Financial and Operating Report for
The Nathaniel Witherell
February 26, 2019 Page 47
FINANCIAL/BENCHMARKING ASSESSMENT
This section outlines the results of HDG’s financial assessment of The Nathaniel Witherell.
Key Findings
Occupancy has recently declined and should be monitored closely.
Medicare census has declined recently, which will impact financial performance given the rate
difference between Medicare and Medicaid/Private pay. In addition, TNW is projected to
experience a drop in Medicare payments under the Patient-Driven Payment Model (PDPM)
going into effect on October 1, 2019.
Employee wages and benefits are significantly above benchmarks.
Comparison Communities
HDG worked with the committee to determine the appropriate communities for comparison
purposes. Table 38 summarizes those facilities and the areas that were used for comparison.
Table 38: Summary of Comparison Communities
Facility Key Areas Compared City County State Licensed
Beds
Average Daily
Census
Overall Star
Rating
Star Rating
Staffing FP/NP
The Nathaniel Witherell Greenwich Fairfield CT 202 188 4 5 Govt
Greenwich Woods Census, Costs, Staffing, Wages, Margin
Greenwich Fairfield CT 217 172 4 4 FP
Carolton Chronic & Conv Hospital
Census, Costs, Staffing, Wages, Margin
Fairfield Fairfield CT 229 161 5 4 FP
Waveny Census, Costs, Staffing, Wages, Margin
New Canaan Fairfield CT 76 73 5 5 NP
The Villa at Stamford Census, Staffing, Wages, Margin
Stamford Fairfield CT 128 120 2 4 FP
Dumont Center for Rehab & Nursing Care
Census, Wages New Rochelle Westchester NY 195 185 5 2 FP
Glen Island Census, Wages New Rochelle Westchester NY 182 177 5 2 FP
St. Cabrini Nursing Home Census, Costs, Staffing, Wages, Margin
Dobbs Ferry Westchester NY 304 294 5 3 NP
Andrus on Hudson Census, Costs, Wages Hastings on Hudson
Westchester NY 247 188 5 2 NP
Enclave at Port Chester Census, Costs Port Chester Westchester NY 160 148 5 2 FP
Spring Creek Rehab & Nsg Center (Willoughby Rehab)
Census Brooklyn Kings NY 188 183 4 1 FP
Providence Rest Census, Costs, Staffing, Margin
Bronx Bronx NY 202 188 4 3 NP
*FP/NP – For-Profit/Nonprofit
Source: 2017 Medicare Cost Report Data and https://www.medicare.gov/nursinghomecompare

Financial and Operating Report for
The Nathaniel Witherell
February 26, 2019 Page 48
Profit & Loss Analysis
HDG obtained financial and census information from TNW and summarized the revenue by
payor and expenses by department. Findings are presented below in Table 39.
Table 39: Profit and Loss Summary
Sources: Nathaniel Witherell 2016–2018 financial statements and census data
6/30/2016 PPD 6/30/2017 PPD 6/30/2018 PPD from PY from PY
Census
Medicare 34.1 32.0 29.1 (2.8) -8.9%
Medicaid 103.6 106.7 103.0 (3.7) -3.4%
Managed Care 2.3 3.3 4.6 1.3 37.6%
Commercial 4.3 4.8 2.2 (2.6) -53.3%
Private Pay 39.6 43.1 44.6 1.5 3.5%
Average Daily Census 184.0 189.9 183.6 (6.3) -3.3%
Total Available Beds 202 202 202
Occupancy % 91.1% 94.0% 90.9%
Financials
Resident Revenues
Medicare 7,925,477 637.05 7,476,928 641.03 6,903,062 649.64 (573,866) -7.7%
Medicaid 10,352,844 273.76 10,535,463 270.52 10,334,710 274.84 (200,753) -1.9%
Managed Care 269,650 316.49 441,816 363.34 713,961 426.75 272,144 61.6%
Commercial 682,799 431.06 725,988 413.20 341,900 416.95 (384,088) -52.9%
Private Pay 7,512,954 519.71 7,774,466 493.96 8,902,106 546.48 1,127,640 14.5%
Part B 700,220 56.28 576,177 49.40 816,840 76.87 240,663 41.8%
Other Revenue - - - - - - - #DIV/0!
Total Revenues 27,443,944 408.70 27,530,837 397.15 28,012,578 418.03 481,741 1.7%
Operating Expenses
Nursing 12,493,239 186.05 13,117,334 189.23 13,297,926 198.44 180,592 1.4%
Therapy 2,638,353 39.29 2,464,063 35.55 2,395,039 35.74 (69,024) -2.8%
Plant 1,406,722 20.95 1,391,871 20.08 1,430,236 21.34 38,365 2.8%
Houskeeping 913,558 13.60 916,322 13.22 965,644 14.41 49,322 5.4%
Laundry 142,773 2.13 146,546 2.11 161,256 2.41 14,710 10.0%
Dietary 2,206,511 32.86 2,325,927 33.55 2,262,181 33.76 (63,746) -2.7%
Administrative 3,491,403 51.99 3,674,429 53.01 3,815,940 56.94 141,511 3.9%
Benefits 6,222,380 92.66 5,714,296 82.43 5,214,218 77.81 (500,078) -8.8%
Total Operating Expenses 29,514,939 439.54 29,750,788 429.17 29,542,440 440.86 (208,348) -0.7%
EBIDA (2,070,995) (30.84) (2,219,951) (32.02) (1,529,862) (22.83) 690,089 31.1%
EBIDA % -7.5% -8.1% -5.5% 2.6%
Depreciation 1,423,315 21.20 1,272,103 18.35 1,553,530 23.18 281,427 22.1%
Net Income (Loss) (3,494,310) (52.04) (3,492,054) (50.38) (3,083,392) (46.01) 408,662 -11.7%
Net Income (Loss) % -12.7% -12.7% -11.0% 1.7%
Non Operating Revenue 122,910 1.77 372,689 5.56
Pension/OPEB liability adjustment 1,112,211 16.04 684,100 10.21
Non Operating Expenses (103,073) (1.49) (112,005) (1.67)
Total Other Revenue (Expense) 1,132,048 16.33 944,784 14.10
Net Income/(Loss) (2,360,006) (34.04) (2,138,608) (31.91)

Financial and Operating Report for
The Nathaniel Witherell
February 26, 2019 Page 49
Findings:
Medicare days have been decreasing with an increase in Managed Care and private pay.
Year ending June 30, 2017, had a higher census than 2018 and 2016, with higher Medicaid
and increase in private pay.
The higher census in 2017 did not lead to a positive impact to the bottom line, as revenue
per patient day was down.
Other revenue for year ending June 30, 2018, included contributions and grants received in
the amounts of $200,000 and $38,444, respectively.
Employee benefits were 38 percent of salaries for 2017 compared to 34 percent in 2018.
Benchmark Operational Performance
HDG computed the operating margin and compared the operating margin for TNW to several
comparison communities and Northeast regional and national benchmarks and summarized the
findings in Table 40 below.
Table 40: Operating Margin Comparison
Sources: 2017 Medicare cost reports and CLA 33rd Edition Nursing Facility Cost Comparison Report (based on 2017
data) (Net Patient Revenues-Operating Expenses/Net Patient Revenues)
Findings:
The TNW operating margin of 5.5 percent and 8.1 percent for 2017 and 2018, respectively, was
the lowest of any of the competitors except for Waveny and the Northeast and national
benchmarks. Overall operating margin for TNW was favorable in 2018 compared to 2017.
Facility Name Year End Margin
Nathaniel Witherell 6/30/18 -5.5%
Nathaniel Witherell 6/30/17 -8.1%
Greenwich Woods 9/30/17 7.7%
Carolton 9/30/17 5.8%
Waveny 9/30/17 -7.7%
Providence Rest 12/31/17 4.6%
St. Cabrini 12/31/17 2.8%
Villa at Stamford 12/31/17 10.9%
Comparison Facility Average 8.0%
Northeast Benchmark -0.4%
National Benchmark 0.5%

Financial and Operating Report for
The Nathaniel Witherell
February 26, 2019 Page 50
Revenue Analysis
To analyze TNW revenue, HDG provided further analysis regarding census, payor mix, and
Medicare Resource Utilization Groups (RUGs) distribution. HDG summarized occupancy
percentages over the past five years from data obtained from Medicare cost reports and the
fiscal year June 30, 2018, and year-to-date December 31, 2018, census. The data is
summarized in Figure 10 below.
Figure 10: Occupancy and Payor Mix Summary
Sources: 2015–2017 Medicare cost reports, fiscal year June 30, 2018 census, and YTD December 31, 2018 census
Findings:
Overall occupancy has fallen in 2018 compared to 2017, but has remained relatively
consistent over the past four years.
Medicare percentage of total days has been on the decline with lower paying Managed Care
and private pay days offsetting the decline from Medicare.
Percentage of Medicaid days has remained fairly stable.
18% 18%23%
16% 15%
56% 58% 56% 56%58%
26%
24% 22%
28% 27%
89% 91%93% 91%
89%
0%
10%
20%
30%
40%
50%
60%
70%
80%
90%
100%
2015 2016 2017 2018 2019 YTD
Medicare Medicaid Other Occupancy

Financial and Operating Report for
The Nathaniel Witherell
February 26, 2019 Page 51
Occupancy Analysis
HDG compared occupancy percentage for TNW to several comparison communities and regional
and national benchmarks and summarized the findings in Table 41 below.
Table 41: Occupancy Percentage
Sources: 2017 Medicare cost reports, 2017 and 2018 The Nathaniel Witherell Profit Center Analysis, 33rd Edition
Skilled Nursing Facility Cost Comparison Report (based on 2017 data)
Findings:
TNW occupancy percentage is higher than the Northeast and national benchmarks.
TNW occupancy percentage is higher than Greenwich Woods, Carolton, and Andrus for 2017
and 2018.
As noted earlier, TNW occupancy percentage declined in 2018 compared to 2017, and the
recent census data that was provided to HDG showed the average daily census at 172, or
85.5 percent.
Some beds were out of service for renovations, but HDG did not have the exact dates of those
time periods.
Facility Name Year End Occ. %
Nathaniel Witherell July-Dec 18 89.0%
Nathaniel Witherell 6/30/18 90.9%
Nathaniel Witherell 6/30/17 94.0%
Greenwich Woods 9/30/17 79.4%
Carolton 9/30/17 70.1%
Waveny 9/30/17 96.3%
Willoughby Rehab 12/31/17 97.5%
Dumont Center 12/31/17 94.5%
Providence Rest 12/31/17 92.9%
Glen Island 12/31/17 97.5%
St. Cabrini 12/31/17 96.8%
Andrus 12/31/17 76.1%
Port Chester 12/31/17 92.6%
Villa at Stamford 12/31/17 93.9%
Comparison Facility Average 89.8%
Northeast Benchmark 90.0%
National Benchmark 84.9%

Financial and Operating Report for
The Nathaniel Witherell
February 26, 2019 Page 52
Payor Mix Analysis
HDG compared the payor mix for TNW to several comparison communities and regional and
national benchmarks. The findings are summarized in Table 42 below.
Table 42: Payor Mix
Sources: 2017 Medicare cost reports, 2017 and 2018 The Nathaniel Witherell Profit Center Analysis, 33rd Edition
Skilled Nursing Facility Cost Comparison Report (based on 2017 data)
Findings:
TNW Medicare and Other mix is higher than Northeast and national benchmarks and
comparison facility average.
TNW Medicare mix is lower than Greenwich Woods, Carolton, Waveny, and Willoughby
Rehab, but higher than the remaining communities.
TNW Medicaid mix is lower than the comparison facility average and national and regional
benchmarks.
Facility Name Year End Medicare Medicaid Other
Nathaniel Witherell July-Dec 18 16.9% 55.1% 28.0%
Nathaniel Witherell 6/30/18 15.9% 56.1% 28.0%
Nathaniel Witherell 6/30/17 16.8% 56.2% 27.9%
Greenwich Woods 9/30/17 19.3% 66.0% 14.7%
Carolton 9/30/17 16.6% 53.5% 29.9%
Waveny 9/30/17 17.5% 61.8% 20.6%
Willoughby Rehab 12/31/17 16.6% 51.9% 31.5%
Dumont Center 12/31/17 14.8% 55.2% 30.0%
Providence Rest 12/31/17 13.4% 55.6% 31.0%
Glen Island 12/31/17 11.7% 61.9% 26.4%
St. Cabrini 12/31/17 9.0% 56.4% 34.6%
Andrus 12/31/17 7.7% 72.5% 19.8%
Port Chester 12/31/17 13.5% 59.3% 27.2%
Villa at Stamford 12/31/17 13.7% 72.4% 13.9%
Comparison Facility Average 14.0% 60.6% 25.4%
Northeast Benchmark 10.3% 67.0% 22.7%
National Benchmark 10.6% 64.2% 25.2%
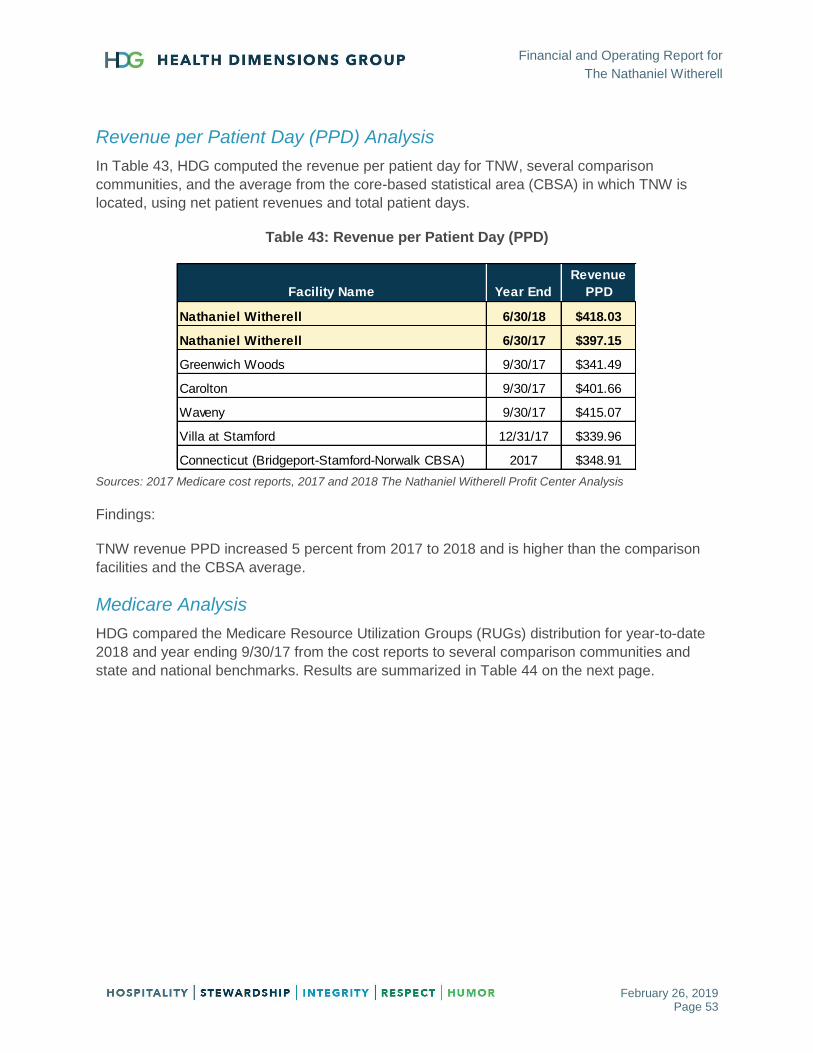
Financial and Operating Report for
The Nathaniel Witherell
February 26, 2019 Page 53
Revenue per Patient Day (PPD) Analysis
In Table 43, HDG computed the revenue per patient day for TNW, several comparison
communities, and the average from the core-based statistical area (CBSA) in which TNW is
located, using net patient revenues and total patient days.
Table 43: Revenue per Patient Day (PPD)
Sources: 2017 Medicare cost reports, 2017 and 2018 The Nathaniel Witherell Profit Center Analysis
Findings:
TNW revenue PPD increased 5 percent from 2017 to 2018 and is higher than the comparison
facilities and the CBSA average.
Medicare Analysis
HDG compared the Medicare Resource Utilization Groups (RUGs) distribution for year-to-date
2018 and year ending 9/30/17 from the cost reports to several comparison communities and
state and national benchmarks. Results are summarized in Table 44 on the next page.
Facility Name Year End
Total
Revenue
PPD
Nathaniel Witherell 6/30/18 $418.03
Nathaniel Witherell 6/30/17 $397.15
Greenwich Woods 9/30/17 $341.49
Carolton 9/30/17 $401.66
Waveny 9/30/17 $415.07
Villa at Stamford 12/31/17 $339.96
Connecticut (Bridgeport-Stamford-Norwalk CBSA) 2017 $348.91

Financial and Operating Report for
The Nathaniel Witherell
February 26, 2019 Page 54
Table 44: Medicare RUGs Distribution Summary
Sources: 2017 Medicare cost reports; 2018 The Nathaniel Witherell Profit Center Medicare patient days by RUG category; October 1, 2018 Medicare rates
(Fairfield wage index) before the sequestration adjustment and Value-Based Payment adjustment
TNW-computed Medicare rate is higher than state and national benchmarks, but lower than comparison communities.
TNW percentage of rehabilitation days are higher than state and national benchmarks and two of the comparison communities.
TNW percentage of rehab ultra-high/rehab very high (RU/RV) days are higher than state and national benchmarks and three of
the comparison communities.
TNW has a higher percentage of Rehab A days than the comparison communities and state and regional benchmarks.
Greenwich
Woods Carolton Willoughby Dumont
Providence
Rest
6/30/18 9/30/17 9/30/17 9/30/17 12/31/17 12/31/17 12/31/17
Rehab Plus Extensive 0.1% 1.4% 0.4% 0.0% 0.2% 14.6% 0.9% 1.2% 1.2% 1.9%
Rehabilitation 96.6% 94.7% 93.3% 97.6% 99.5% 69.6% 98.0% 84.3% 84.4% 89.0%
Total Rehabilitation 96.7% 96.1% 93.7% 97.6% 99.8% 84.2% 98.9% 85.5% 85.6% 90.9%
Extensive Services 0.0% 0.1% 0.6% 0.0% 0.0% 11.4% 0.0% 0.4% 0.4% 0.6%
Special Care High 0.6% 0.6% 0.8% 0.9% 0.1% 0.6% 0.1% 4.5% 4.5% 2.1%
Special Care Low 0.5% 0.0% 2.3% 0.2% 0.0% 1.8% 0.6% 3.3% 3.3% 2.6%
Clinically Complex 1.2% 1.5% 2.2% 1.0% 0.0% 0.1% 0.3% 3.2% 3.2% 1.9%
Behavior 0.4% 0.0% 0.0% 0.0% 0.0% 0.0% 0.0% 0.4% 0.4% 0.3%
Reduced Physical Function 0.6% 1.7% 0.4% 0.3% 0.0% 1.9% 0.2% 2.6% 2.6% 1.6%
Total 100.0% 100.0% 100.0% 100.0% 100.0% 100.0% 100.0% 100.0% 100.0% 100.0%
RU 71.4% 69.4% 74.4% 78.0% 98.6% 80.4% 53.1% 36.9% 36.5% 50.4%
RV 16.4% 19.9% 10.6% 14.7% 0.6% 0.2% 34.0% 30.4% 30.8% 25.3%
Combined RU/RV% 87.7% 89.3% 85.1% 92.7% 99.2% 80.6% 87.1% 67.3% 67.3% 75.6%
Rehab As 23.0% 25.3% 13.3% 5.9% 2.8% 7.1% 3.1% 23.2% 23.3% 24.9%
Rehab Bs 59.2% 56.2% 51.4% 43.8% 53.7% 66.2% 60.2% 41.3% 40.8% 39.9%
Rehab Cs 17.8% 18.5% 35.2% 50.3% 43.5% 26.7% 36.7% 35.5% 35.9% 35.2%
Combined Rehabilitation 100.0% 100.0% 100.0% 100.0% 100.0% 100.0% 100.0% 100.0% 100.0% 100.0%
Medicare Rate: 663.59$ 662.26$ 681.20$ 702.08$ 742.06$ 767.66$ 660.68$ 598.52$ 597.88$ 629.66$
RUG Classification
Nathaniel WitherellConnecticut -
Urban
Connecticut -
ALLNational

Financial and Operating Report for
The Nathaniel Witherell
February 26, 2019 Page 55
Patient-Driven Payment Model (PDPM) Analysis
As of October 1, 2019 Centers for Medicare and Medicaid Services (CMS) will be transitioning
from the Resource Utilization Group (RUG-IV) case-mix payment methodology to the Patient-
Driven Payment Model (PDPM). Using the analysis that CMS prepared, HDG compared the
proposed Medicare rate for TNW to the comparison communities weighted average rate,
Connecticut statewide average rate and the National average rate and summarized in Table 45
below.
Table 45: RUG-IV to PDPM Summary
Source: CMS SNF PDPM Impact Enhanced Provider-Specific File (uses 2017 data)
Findings:
TNW’s Medicare rate will decrease 2.6 percent, or $17.12 per day under the PDPM
methodology compared to RUG-IV.
Comparison facilities’ weighted average Medicare rate decreases 6.4 percent, or $43.60.
Statewide and national weighted average rates are similar under RUG-IV and PDPM.
HDG recommends TNW to develop strategic plan for rollout and implementation of PDPM due
to this projected decrease in Medicare payments.
RUG-IV PDPM $ Var. $ Var.
Nathaniel Witherell $650.15 $633.03 ($17.12) -2.6%
Competitors $681.91 $638.30 ($43.60) -6.4%
Connecticut $598.28 $598.14 ($0.14) 0.0%
National $527.27 $527.27 $0.00 0.0%
RUG-IV vs PDPM

Financial and Operating Report for
The Nathaniel Witherell
February 26, 2019 Page 56
Medicaid Analysis
HDG obtained the Medicaid rates from the past four years for TNW and the other communities
located in Fairfield County. Results are presented below in Tables 46 and 47.
Table 46: Medicaid Rate Trending
Sources: Medicaid rates from the state of CT website
Findings:
TNW’s Medicaid rates are higher than the state average and all of the comparison facilities.
There have been minimal increases the past three years.
The state of Connecticut approved a 2 percent increase to nursing home rates effective
November 1, 2018. This increase is intended to fund permanent increases to employee wages
and/or benefits.
Table 47: Calculated Medicaid Rate versus Issued Medicaid Rate
Nathaniel
Witherell
Medicaid Calculated Rate 9/30/16 Annual Report $322.28
Medicaid Rate 6/30/17 $268.12
Medicaid Issued Rate Under Calculated Rate ($54.16)
Annual Impact of Issued versus Calculated Rate ($2,108,720)
Sources: Medicaid rates from the state of CT website
Findings:
There is a significant variance between the calculated rate and the issued rate, which correlates
to significant costs that are not being reimbursed for Medicaid payors.
Facility Name FY 2016 FY 2017 FY2018 FY 2019
Nathaniel Witherell $277.23 $280.45 $268.33 $269.33
Greenwich Woods $219.58 $223.28 $223.34 $223.83
Carolton $255.98 $252.76 $251.73 $251.85
Waveny $253.47 $256.62 $253.47 $254.84
Villa at Stamford $255.98 $254.66 $256.46 $256.49
State Average $230.59 $231.89 $231.67 $233.30
Financial and Operating Report for
The Nathaniel Witherell
February 26, 2019 Page 57
Wage and Employee Benefit Analysis
As part of the operational and financial assessment for The Nathaniel Witherell (TNW), HDG
was requested by the Town of Greenwich to complete an analysis of wages and employee
benefits at TNW and to provide this preview of findings.
Salaries Paid per Hour
HDG obtained 2017 Medicare cost report data for skilled nursing facilities in Fairfield,
Connecticut, and Westchester, New York, and compared the average wage rate paid to the
average rates paid at TNW for the periods September 30, 2017, June 30, 2018, and fiscal year-
to-date 2018–19. The June 30, 2018, and fiscal year-to-date data was computed without the
retroactive salaries paid out during each period. These wage rates do include overtime and shift
differentials, so they are much higher than the base rates of the employees.
Findings are presented in Table 48 on the next page.

Financial and Operating Report for
The Nathaniel Witherell
February 26, 2019 Page 58
Table 48: Salaries Paid per Hour
Registered nurse (RN), licensed practical nurse (LPN), certified nursing assistant (CNA)
No benchmark available for Medical Records
Sources: 2017 Medicare cost reports, 2018 The Nathaniel Witherell payroll data, 33rd Edition Skilled Nursing Facility Cost Comparison Report (based on 2017 data)
Note: Purchased services nursing is not included.
Findings:
Wage rates in all departments, except administrative, are higher than comparison facility data.
Nathaniel
Witherell
Nathaniel
Witherell
Greenwich
Woods Carolton
Waveny
Care
Center
The Villa at
Stamford
Dumont
Center Glen Island St. Cabrini Andrus
Position/Department6/30/18 FYTD 18 19 9/30/17 9/30/17 9/30/17 12/31/17 12/31/17 12/31/17 12/31/17 12/31/17
RN $47.05 $48.66 $40.87 $34.60 $37.54 $43.97 $30.98 $37.50 $41.50 $42.23 $38.65 $41.01
LPN $36.21 $37.83 $31.29 $33.10 $31.22 $22.76 $29.52 $27.86 $29.64 $30.83 $29.53 $32.60
CNA $21.45 $22.41 $16.53 $16.39 $17.31 $14.38 $18.91 $20.04 $20.42 $19.73 $17.96 $18.61
Nursing Admin $59.64 $59.28 $59.70 $44.08 $72.67 $27.01 $56.70 $97.70 $50.95 $47.25 $57.01 $39.85
Medical Records $33.28 $34.43 $22.22 $17.12 $22.78 $18.58 $20.18
Social Services/Activities $38.04 $38.26 $31.53 $20.40 $21.78 $13.29 $35.56 $23.62 $26.70 $25.63 $24.81 $25.73
Plant/Maintenance $33.62 $34.42 $17.99 $18.59 $23.94 $23.09 $20.05 $43.56 $28.90 $24.65 $25.10 $21.16
Housekeeping $18.99 $19.93 $13.48 $14.07 $16.73 $19.51 $16.71 $20.26 $19.71 $17.21 $13.22
Laundry $20.90 $21.57 $15.80 $14.71 $18.89 $20.87 $18.17 $17.69 $12.89
Dietary $18.29 $20.00 $17.95 $17.79 $16.29 $18.78 $22.02 $18.22 $22.06 $20.19 $19.16 $15.24
Administrative $43.96 $44.96 $32.72 $24.10 $46.17 $53.69 $23.74 $48.43 $85.01 $64.18 $47.26 $30.02
Northeast
Benchmark
Comparison
Facility
Average
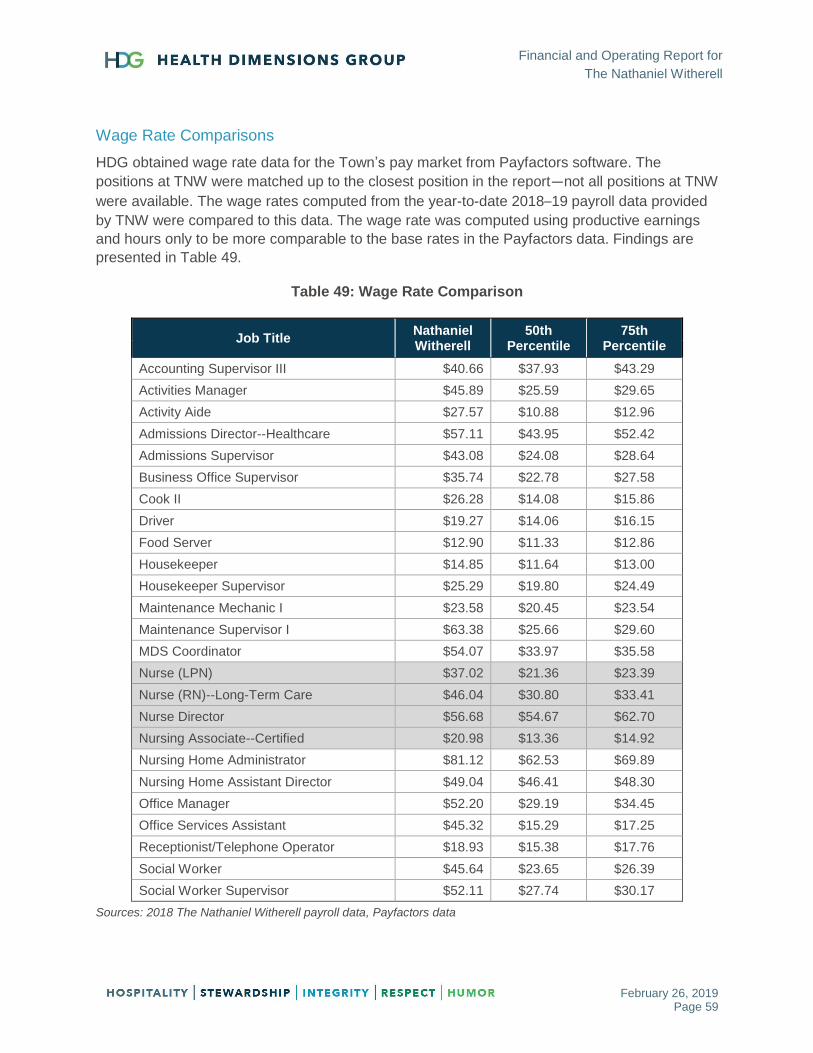
Financial and Operating Report for
The Nathaniel Witherell
February 26, 2019 Page 59
Wage Rate Comparisons
HDG obtained wage rate data for the Town’s pay market from Payfactors software. The
positions at TNW were matched up to the closest position in the report—not all positions at TNW
were available. The wage rates computed from the year-to-date 2018–19 payroll data provided
by TNW were compared to this data. The wage rate was computed using productive earnings
and hours only to be more comparable to the base rates in the Payfactors data. Findings are
presented in Table 49.
Table 49: Wage Rate Comparison
Job Title Nathaniel Witherell
50th Percentile
75th Percentile
Accounting Supervisor III $40.66 $37.93 $43.29
Activities Manager $45.89 $25.59 $29.65
Activity Aide $27.57 $10.88 $12.96
Admissions Director--Healthcare $57.11 $43.95 $52.42
Admissions Supervisor $43.08 $24.08 $28.64
Business Office Supervisor $35.74 $22.78 $27.58
Cook II $26.28 $14.08 $15.86
Driver $19.27 $14.06 $16.15
Food Server $12.90 $11.33 $12.86
Housekeeper $14.85 $11.64 $13.00
Housekeeper Supervisor $25.29 $19.80 $24.49
Maintenance Mechanic I $23.58 $20.45 $23.54
Maintenance Supervisor I $63.38 $25.66 $29.60
MDS Coordinator $54.07 $33.97 $35.58
Nurse (LPN) $37.02 $21.36 $23.39
Nurse (RN)--Long-Term Care $46.04 $30.80 $33.41
Nurse Director $56.68 $54.67 $62.70
Nursing Associate--Certified $20.98 $13.36 $14.92
Nursing Home Administrator $81.12 $62.53 $69.89
Nursing Home Assistant Director $49.04 $46.41 $48.30
Office Manager $52.20 $29.19 $34.45
Office Services Assistant $45.32 $15.29 $17.25
Receptionist/Telephone Operator $18.93 $15.38 $17.76
Social Worker $45.64 $23.65 $26.39
Social Worker Supervisor $52.11 $27.74 $30.17
Sources: 2018 The Nathaniel Witherell payroll data, Payfactors data
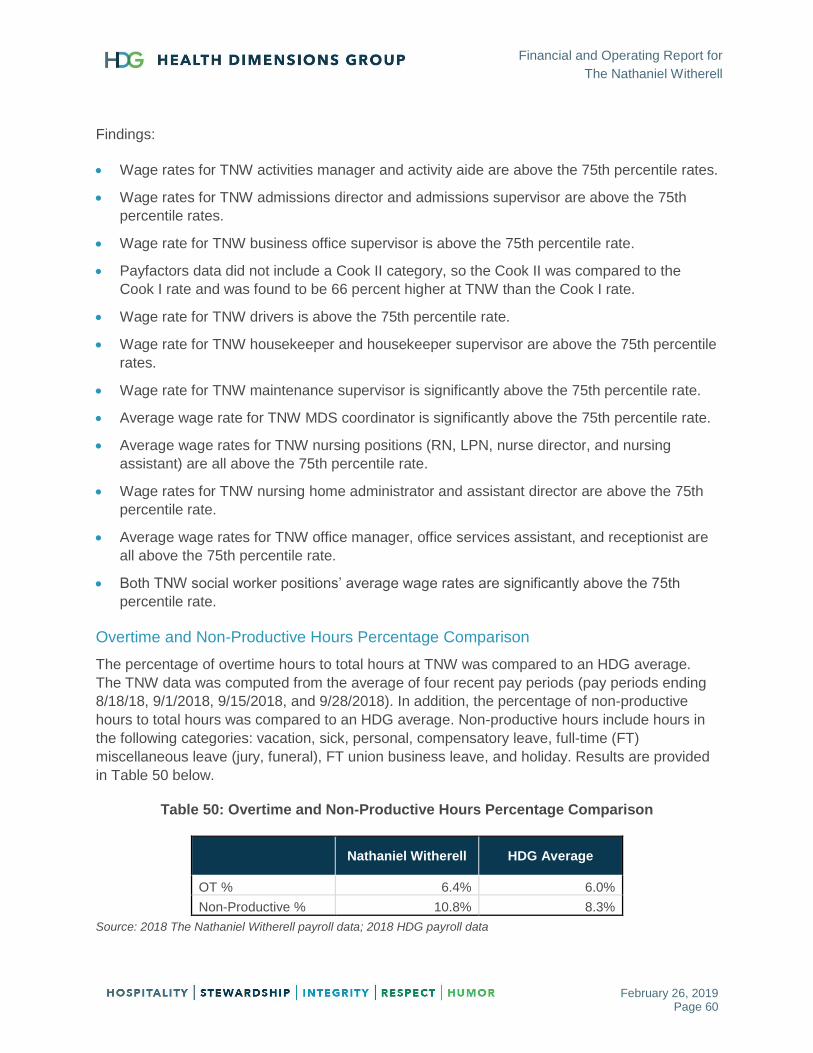
Financial and Operating Report for
The Nathaniel Witherell
February 26, 2019 Page 60
Findings:
Wage rates for TNW activities manager and activity aide are above the 75th percentile rates.
Wage rates for TNW admissions director and admissions supervisor are above the 75th
percentile rates.
Wage rate for TNW business office supervisor is above the 75th percentile rate.
Payfactors data did not include a Cook II category, so the Cook II was compared to the
Cook I rate and was found to be 66 percent higher at TNW than the Cook I rate.
Wage rate for TNW drivers is above the 75th percentile rate.
Wage rate for TNW housekeeper and housekeeper supervisor are above the 75th percentile
rates.
Wage rate for TNW maintenance supervisor is significantly above the 75th percentile rate.
Average wage rate for TNW MDS coordinator is significantly above the 75th percentile rate.
Average wage rates for TNW nursing positions (RN, LPN, nurse director, and nursing
assistant) are all above the 75th percentile rate.
Wage rates for TNW nursing home administrator and assistant director are above the 75th
percentile rate.
Average wage rates for TNW office manager, office services assistant, and receptionist are
all above the 75th percentile rate.
Both TNW social worker positions’ average wage rates are significantly above the 75th
percentile rate.
Overtime and Non-Productive Hours Percentage Comparison
The percentage of overtime hours to total hours at TNW was compared to an HDG average.
The TNW data was computed from the average of four recent pay periods (pay periods ending
8/18/18, 9/1/2018, 9/15/2018, and 9/28/2018). In addition, the percentage of non-productive
hours to total hours was compared to an HDG average. Non-productive hours include hours in
the following categories: vacation, sick, personal, compensatory leave, full-time (FT)
miscellaneous leave (jury, funeral), FT union business leave, and holiday. Results are provided
in Table 50 below.
Table 50: Overtime and Non-Productive Hours Percentage Comparison
Nathaniel Witherell HDG Average
OT % 6.4% 6.0%
Non-Productive % 10.8% 8.3%
Source: 2018 The Nathaniel Witherell payroll data; 2018 HDG payroll data

Financial and Operating Report for
The Nathaniel Witherell
February 26, 2019 Page 61
Shift Differential Summary
HDG reviewed the shift differential paid for the most recent pay period provided by The
Nathaniel Witherell. Table 51 summarizes the shift differentials and how much was paid for
each during the 9/29/18 pay period.
Table 51: Shift Differential Summary
Shift Differential
9/28/18 Pay Period
Annualized
Teamsters 456 Weekend $1.25 $1,161 $30,189.12
Teamsters 456 Evening $1.15 $1,780 $46,285.98
Teamsters 456 Night $1.35 $1,027 $26,694.98
Teamsters 456 Weekend $2.65 $1,196 $31,093.14
Teamsters 456 Weekend Night $3.10 $646 $16,786.38
Week End Shift Differential 1st $1.55 $197 $5,128.24
Week End Shift Differential 2nd $3.95 $561 $14,584.18
Week End Shift Differential 3rd $5.00 $621 $16,152.50
The Nathaniel Witherell Evening Shift Differential $1.80 $1,059 $27,541.80
The Nathaniel Witherell Night Shift Diff $2.25 $1,059 $27,524.90
TOTALS $9,307 $241,981
Source: The Nathaniel Witherell 9/28/18 payroll data
Findings:
TNW spent $9,307 on shift differentials, which annualizes out to almost $242,981. Many of
these shift differentials are significantly higher than HDG has seen at other union buildings.
TNW offers shift differentials to employees on first shift on the weekends. This is outside of the
industry norm. In addition, shift differentials are offered to departments other than nursing. This
is also not a typical practice in the skilled nursing industry.
Employee Benefits
HDG reviewed the percentage of employee benefits to salaries; results are shown in Table 52
on the next page. In Table 53, HDG computed the specific employee benefit cost to salaries for
those facilities available. This data was taken from the 2017 Connecticut Medicaid cost reports.
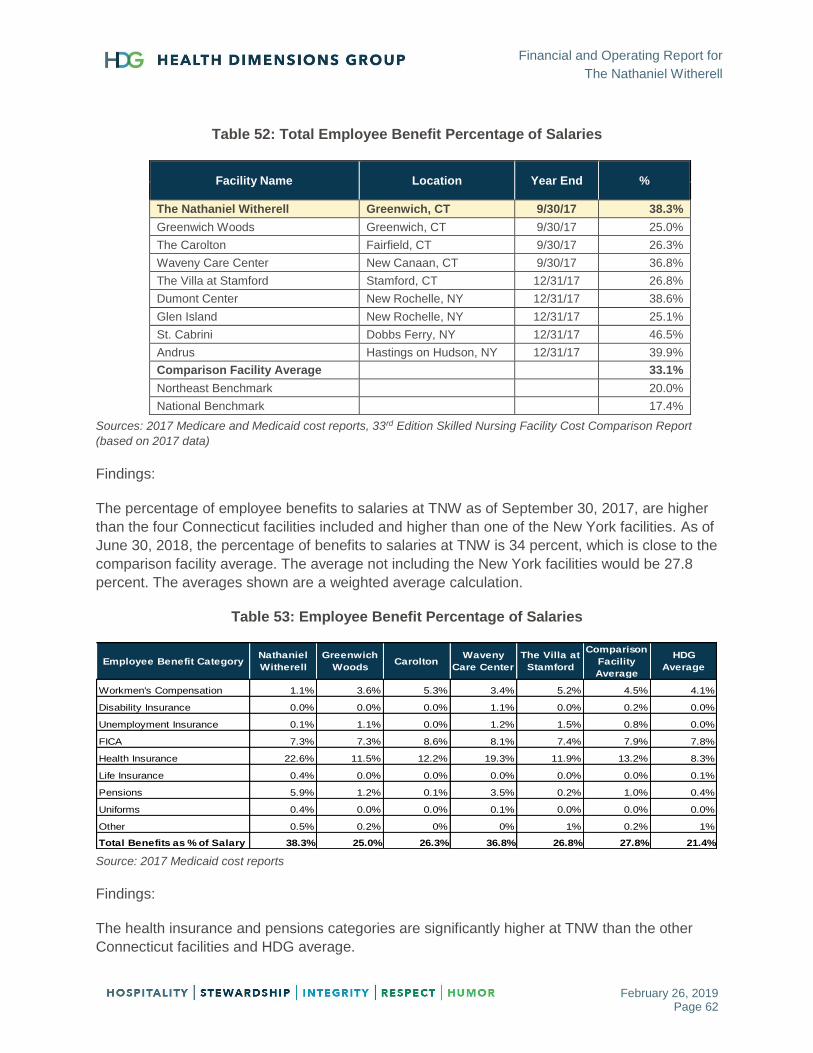
Financial and Operating Report for
The Nathaniel Witherell
February 26, 2019 Page 62
Table 52: Total Employee Benefit Percentage of Salaries
Facility Name Location Year End %
The Nathaniel Witherell Greenwich, CT 9/30/17 38.3%
Greenwich Woods Greenwich, CT 9/30/17 25.0%
The Carolton Fairfield, CT 9/30/17 26.3%
Waveny Care Center New Canaan, CT 9/30/17 36.8%
The Villa at Stamford Stamford, CT 12/31/17 26.8%
Dumont Center New Rochelle, NY 12/31/17 38.6%
Glen Island New Rochelle, NY 12/31/17 25.1%
St. Cabrini Dobbs Ferry, NY 12/31/17 46.5%
Andrus Hastings on Hudson, NY 12/31/17 39.9%
Comparison Facility Average 33.1%
Northeast Benchmark 20.0%
National Benchmark 17.4%
Sources: 2017 Medicare and Medicaid cost reports, 33rd Edition Skilled Nursing Facility Cost Comparison Report
(based on 2017 data)
Findings:
The percentage of employee benefits to salaries at TNW as of September 30, 2017, are higher
than the four Connecticut facilities included and higher than one of the New York facilities. As of
June 30, 2018, the percentage of benefits to salaries at TNW is 34 percent, which is close to the
comparison facility average. The average not including the New York facilities would be 27.8
percent. The averages shown are a weighted average calculation.
Table 53: Employee Benefit Percentage of Salaries
Source: 2017 Medicaid cost reports
Findings:
The health insurance and pensions categories are significantly higher at TNW than the other
Connecticut facilities and HDG average.
Employee Benefit CategoryNathaniel
Witherell
Greenwich
WoodsCarolton
Waveny
Care Center
The Villa at
Stamford
Comparison
Facility
Average
HDG
Average
Workmen's Compensation 1.1% 3.6% 5.3% 3.4% 5.2% 4.5% 4.1%
Disability Insurance 0.0% 0.0% 0.0% 1.1% 0.0% 0.2% 0.0%
Unemployment Insurance 0.1% 1.1% 0.0% 1.2% 1.5% 0.8% 0.0%
FICA 7.3% 7.3% 8.6% 8.1% 7.4% 7.9% 7.8%
Health Insurance 22.6% 11.5% 12.2% 19.3% 11.9% 13.2% 8.3%
Life Insurance 0.4% 0.0% 0.0% 0.0% 0.0% 0.0% 0.1%
Pensions 5.9% 1.2% 0.1% 3.5% 0.2% 1.0% 0.4%
Uniforms 0.4% 0.0% 0.0% 0.1% 0.0% 0.0% 0.0%
Other 0.5% 0.2% 0% 0% 1% 0.2% 1%
Total Benefits as % of Salary 38.3% 25.0% 26.3% 36.8% 26.8% 27.8% 21.4%

Financial and Operating Report for
The Nathaniel Witherell
February 26, 2019 Page 63
Cost per Resident Day
HDG compared expenses per patient day for TNW to several comparison communities and Northeast regional benchmarks. Results
are summarized in Table 54 below.
Table 54: Expense Benchmark Comparison
Sources: 2017 Medicare cost reports, 2017 and 2018 The Nathaniel Witherell financial statements, CLA 33rd Edition Skilled Nursing Facility Cost Comparison
Report (based on 2017 data)
Findings:
Total operating expenses for TNW are higher than comparison communities and regional benchmarks, with major variances in
the nursing and benefits departments.
TNW nursing, dietary and benefits’ cost centers expenses per patient day are higher than all comparison communities and
regional benchmarks.
TNW has a higher per-patient-day expense for housekeeping than all comparison communities except Providence Rest.
TNW laundry and administrative expenses per patient day are within the ranges of comparison communities and regional
benchmarks.
Nathaniel
Witherell
Nathaniel
Witherell
Greenwich
Woods Carolton
Providence
Rest St. Cabrini Andrus
Port
Chester
Villa at
Stamford
6/30/17 6/30/18 9/30/17 9/30/17 12/31/17 12/31/17 12/31/17 12/31/17 12/31/17
Northeast
50th
Northeast
75th
Nursing/Social
Services/Activities $189.23 $198.44 $140.65 $142.99 $132.75 $119.24 $106.62 $106.54 $132.88 $125.95 $106.00 $128.20
Ancillary $35.55 $35.74 $40.72 $48.73 $29.09 $23.61 $19.09 $28.09 $33.67 $31.86 $23.27 $31.74
Plant $20.08 $21.34 $15.43 $15.41 $22.54 $16.57 $21.43 $19.80 $14.10 $17.90 $12.85 $16.57
Houskeeping $13.22 $14.41 $8.02 $12.42 $16.82 $11.73 $10.33 $8.51 $11.41 $11.32 $7.16 $9.46
Laundry $2.11 $2.41 $4.86 $3.82 $4.08 $4.43 $1.71 $4.42 $0.74 $3.44 $3.58 $4.75
Dietary $33.55 $33.76 $23.32 $31.73 $31.51 $26.68 $29.58 $20.81 $22.22 $26.55 $21.04 $26.18
Administrative $53.01 $56.94 $42.25 $61.69 $56.76 $58.86 $41.63 $68.21 $47.20 $53.80 $56.91 $69.01
Benefits $97.34 $92.64 $39.98 $59.93 $81.93 $90.79 $62.64 $45.98 $40.61 $60.27 $28.07 $40.39
Total Operating Expenses $444.08 $455.68 $315.22 $376.71 $375.49 $351.89 $293.03 $302.36 $302.82 $331.08 $258.88 $326.30
Department
Industry Median
Comparison
Average

Financial and Operating Report for
The Nathaniel Witherell
February 26, 2019 Page 64
Capital Costs
HDG reviewed the capital costs at TNW. The facility currently has approximately $18.5 million in
long-term obligations, which consist of bonds. The interest expense for the period June 30, 2018,
was $836,170. The depreciation expense on the fixed assets for the period June 30, 2018, was
$717,360. The facility expects to spend approximately $3.5 million in capital improvements over
the next five years. The capital costs per patient day for June 30, 2018, come out to $23.18, which
is not an unreasonable amount. Capital costs are difficult to benchmark since the costs would be
dependent on the age and condition of the facility. HDG did note that the capital costs of the
comparison facilities ranged from $18.01 to $56.24 per patient day. TNW capital costs per patient
day would be on the low end of that range.

Financial and Operating Report for
The Nathaniel Witherell
February 26, 2019 Page 65
FINANCIAL ANALYSIS OF STRATEGIC RECOMMENDATIONS
HDG is pleased to provide this financial analysis of the three strategic scenarios listed below.
Maintain Current Town Ownership and Operation
Lease/Sell to a 501(c)(3) Corporation
Lease/Sell to a For-Profit Manager
Maintain Current Town Ownership and Operation
Revenue Assumptions
Census decrease of 18 expected by 2023 (see market demand section of report).
Medicare rate decrease of 2.4 percent as of 10/1/18.
Medicare rate decrease of 2.6 percent as of 10/1/19 for Patient-Driven Payment Model
(PDPM) implementation, annual increase of 1.5 percent as of 10/1/20 and 10/1/21.
Medicaid rate increase of 2 percent as of 11/1/18 for wage increases, 2 percent increase
every other year after.
Annual private pay rate increases of 3 percent.
Annual commercial rate increases of 2 percent.
Contribution and grant income kept constant.
Operating Cost Assumptions
Current fringe benefit percentage of 34 percent was assumed (FY ending 6/30/18).
Provider bed tax of $16.13 per non-Medicare patient day.
Annual wage increases of 2.25 percent.
Current staffing structure.
Current county allocation.
Annual increases of 2 percent for non-labor expenses.
Capital Expenditures
Current depreciation is assumed, plus capital amounts, as shown in Table 55 on the next
page.
Interest agrees to current amortization schedule.

Financial and Operating Report for
The Nathaniel Witherell
February 26, 2019 Page 66
Table 55: Five-Year Capital Spending Plan – FY 2019 Budget
Source: Capital spending plan provided by TNW
Sensitivity Analysis
Included a scenario at 5-star minimum staffing level and 4-star minimum staffing level – starts
in Year 2.
HDG recommends exploring assisted living/independent living to offset the losses.
Table 56: Five-Year Summary Profit & Loss, As Is Scenario
Sources: 2018 TNW financial statements compiled by PFK O’Connor Davies, LLP, and HDG analysis
Note: Numbers do not include the Pension/OPEB liability adjustment (this amount was $684,100 in 2016)
Project Description Year 1 Year 2 Year 3 Year 4 Year 5 Total
HVAC 48,000 48,960 49,939 - - 146,899
Equipment (Non-Auto) 165,000 160,140 163,343 166,610 169,942 825,034
Maintenance 109,300 263,976 461,417 673,867 246,795 1,755,355
Roofing - 20,400 - - 129,892 150,292
Autos - - - - 59,534 59,534
Domestic hot water boiler replace (14 Units) - 255,000 - - - 255,000
Rehab Gym Expansion (TOG) 90,000 - - - - 90,000
Rehab Gym Expansion (STEAP) 182,000 - - - - 182,000
TOTAL 594,300 748,476 674,699 840,477 606,162 3,464,114
The Nathaniel Witherell 5 Year Capital Spending Plan - FY 2019 Buget
Actual Projected Projected Projected Projected Projected
6/30/18 Year 1 Year 2 Year 3 Year 4 Year 5
Residents
Total 184 180 176 172 165 162
Occupancy % 91% 89% 87% 85% 82% 80%
Total Net Revenues 28,012,578 27,193,155 26,692,910 26,582,281 26,009,042 25,994,158
Total Operating Expenses 29,542,440 29,116,660 29,343,701 29,490,128 29,206,114 29,299,244
Net Operating Income/(Loss) (1,529,862) (1,923,506) (2,650,791) (2,907,847) (3,197,072) (3,305,085)
Depreciation 717,360 776,790 851,638 919,108 1,003,155 1,063,771
Interest 836,170 778,267 698,852 654,787 609,922 558,807
Net Operating Income/(Loss) (3,083,392) (3,478,563) (4,201,281) (4,481,742) (4,810,150) (4,927,664)
Non Operating Revenue 372,689 372,689 372,689 372,689 372,689 372,689
Non Operating Expenses (112,005) (113,125) (114,256) (115,399) (116,553) (117,718)
Total Other Revenue (Expense) 260,684 259,564 258,433 257,290 256,136 254,971
Net Income/(Loss) (2,822,708) (3,218,999) (3,942,848) (4,224,452) (4,554,013) (4,672,693)

Financial and Operating Report for
The Nathaniel Witherell
February 26, 2019 Page 67
Table 57: Five-Year Summary Profit & Loss, As Is Scenario – Five-Star Staffing
Sources: 2018 TNW financial statements compiled by PFK O’Connor Davies, LLP, and HDG analysis
Table 58: Five-Year Summary Profit & Loss, As Is Scenario – Four-Star Staffing
Sources: 2018 TNW financial statements compiled by PFK O’Connor Davies, LLP, and HDG analysis
Actual Projected Projected Projected Projected Projected
6/30/18 Year 1 Year 2 Year 3 Year 4 Year 5
Residents
Total 184 180 176 172 165 162
Occupancy % 91% 89% 87% 85% 82% 80%
Total Net Revenues 28,012,578 27,193,155 26,692,910 26,582,281 26,009,042 25,994,158
Total Operating Expenses 29,542,440 29,116,660 28,252,214 28,475,161 28,363,078 28,531,968
Net Operating Income/(Loss) (1,529,862) (1,923,506) (1,559,304) (1,892,880) (2,354,036) (2,537,810)
Depreciation 717,360 776,790 851,638 919,108 1,003,155 1,063,771
Interest 836,170 778,267 698,852 654,787 609,922 558,807
Net Income/(Loss) (3,083,392) (3,478,563) (3,109,794) (3,466,774) (3,967,114) (4,160,388)
Non Operating Revenue 372,689 372,689 372,689 372,689 372,689 372,689
Non Operating Expenses (112,005) (113,125) (114,256) (115,399) (116,553) (117,718)
Total Other Revenue (Expense) 260,684 259,564 258,433 257,290 256,136 254,971
Net Income/(Loss) (2,822,708) (3,218,999) (2,851,361) (3,209,484) (3,710,977) (3,905,418)
Actual Projected Projected Projected Projected Projected
6/30/18 Year 1 Year 2 Year 3 Year 4 Year 5
Residents
Total 184 180 176 172 165 162
Occupancy % 91% 89% 87% 85% 82% 80%
Total Net Revenues 28,012,578 27,193,155 26,692,910 26,582,281 26,009,042 25,994,158
Total Operating Expenses 29,542,440 29,116,660 27,344,358 27,559,512 27,382,840 27,427,953
Net Operating Income/(Loss) (1,529,862) (1,923,506) (651,448) (977,231) (1,373,798) (1,433,794)
Depreciation 717,360 776,790 851,638 919,108 1,003,155 1,063,771
Interest 836,170 778,267 698,852 654,787 609,922 558,807
Net Income/(Loss) (3,083,392) (3,478,563) (2,201,938) (2,551,126) (2,986,875) (3,056,373)
Non Operating Revenue 372,689 372,689 372,689 372,689 372,689 372,689
Non Operating Expenses (112,005) (113,125) (114,256) (115,399) (116,553) (117,718)
Total Other Revenue (Expense) 260,684 259,564 258,433 257,290 256,136 254,971
Net Income/(Loss) (2,822,708) (3,218,999) (1,943,505) (2,293,835) (2,730,739) (2,801,402)
Financial and Operating Report for
The Nathaniel Witherell
February 26, 2019 Page 68
Lease/Sell to a 501(c)(3) Corporation
Revenue Assumptions
Census decrease of 18 expected by 2023 (see market demand section of report).
Medicare rate decrease of 2.4 percent as of 10/1/18.
Medicare rate decrease 2.6 percent as of 10/1/19 for Patient-Driven Payment Model (PDPM)
implementation, annual increase of 1.5 percent as of 10/1/20 and 10/1/21.
Medicaid rate increase of 2 percent as of 11/1/18 for wage increases, 2 percent every other
year after.
Private pay rate increases of 4 percent.
Annual commercial rate increases of 2 percent.
Increase of Contributions of $100,000 Years 2–3 and $150,000 Years 4–5.
Operating Cost Assumptions
Changes start in Year 2.
Four-star nursing staffing.
Fringe benefit percentage of 27.8 percent was assumed (Connecticut comparison facility
average).
Reduced overtime by 1 percent.
Wage rate reduction of 5 percent.
Provider bed tax of $21.02 per non-Medicare patient day.
Management fee of 5 percent (there could also be a scenario without a management fee but
some of the Town provided services would need to be replaced by other vendors or FTEs). In
2018, the Town allocation was over $1.1 million.
Annual increases of 2 percent for non-labor expenses and 1.5 percent for supplies.
Reduce dietary expenses to benchmark in Year 3.
Reduce administrative expenses in Year 4.
Reduce non-operating expenses.
Capital Expenditures
Not likely to get fair market price with current losses and being a union facility.
Estimated value of $65,000–$75,000 per bed, based on recent Connecticut sale history.
Annual debt service payments are approximately $1.7 million.
Model includes lease expense of 8.5 percent of $13.1 million value.
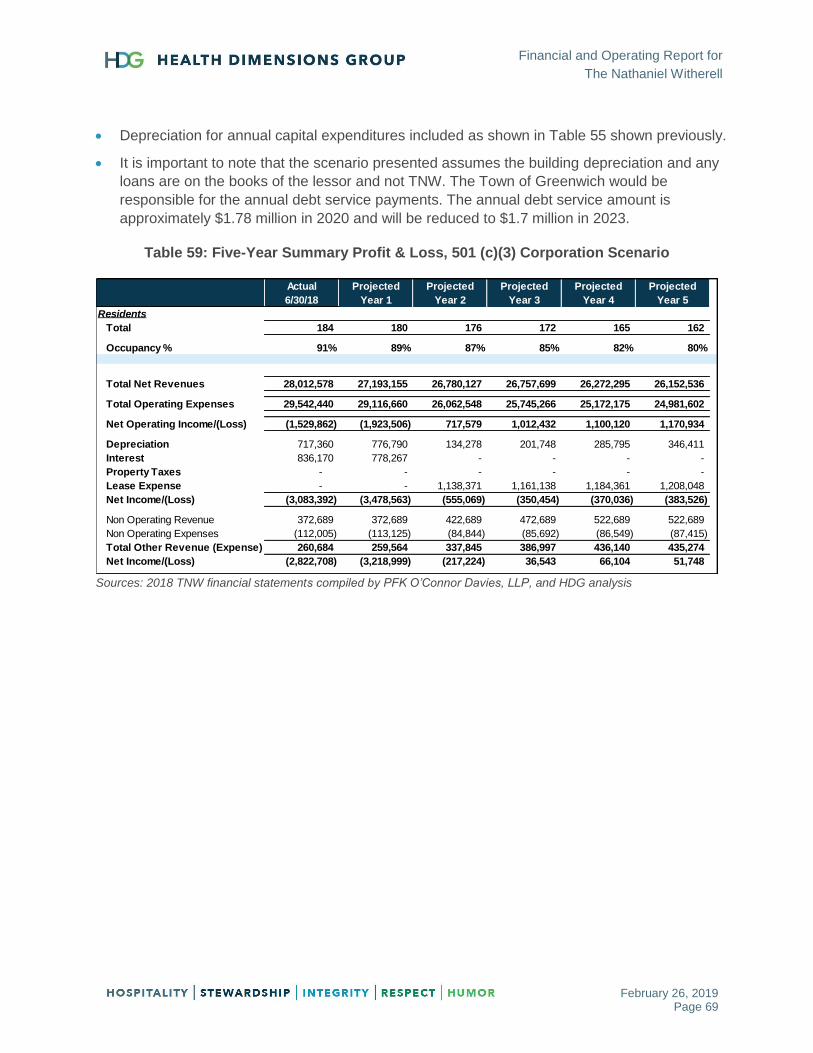
Financial and Operating Report for
The Nathaniel Witherell
February 26, 2019 Page 69
Depreciation for annual capital expenditures included as shown in Table 55 shown previously.
It is important to note that the scenario presented assumes the building depreciation and any
loans are on the books of the lessor and not TNW. The Town of Greenwich would be
responsible for the annual debt service payments. The annual debt service amount is
approximately $1.78 million in 2020 and will be reduced to $1.7 million in 2023.
Table 59: Five-Year Summary Profit & Loss, 501 (c)(3) Corporation Scenario
Sources: 2018 TNW financial statements compiled by PFK O’Connor Davies, LLP, and HDG analysis
Actual Projected Projected Projected Projected Projected
6/30/18 Year 1 Year 2 Year 3 Year 4 Year 5
Residents
Total 184 180 176 172 165 162
Occupancy % 91% 89% 87% 85% 82% 80%
Total Net Revenues 28,012,578 27,193,155 26,780,127 26,757,699 26,272,295 26,152,536
Total Operating Expenses 29,542,440 29,116,660 26,062,548 25,745,266 25,172,175 24,981,602
Net Operating Income/(Loss) (1,529,862) (1,923,506) 717,579 1,012,432 1,100,120 1,170,934
Depreciation 717,360 776,790 134,278 201,748 285,795 346,411
Interest 836,170 778,267 - - - -
Property Taxes - - - - - -
Lease Expense - - 1,138,371 1,161,138 1,184,361 1,208,048
Net Income/(Loss) (3,083,392) (3,478,563) (555,069) (350,454) (370,036) (383,526)
Non Operating Revenue 372,689 372,689 422,689 472,689 522,689 522,689
Non Operating Expenses (112,005) (113,125) (84,844) (85,692) (86,549) (87,415)
Total Other Revenue (Expense) 260,684 259,564 337,845 386,997 436,140 435,274
Net Income/(Loss) (2,822,708) (3,218,999) (217,224) 36,543 66,104 51,748

Financial and Operating Report for
The Nathaniel Witherell
February 26, 2019 Page 70
Lease/Sell to a For-Profit Manager
Revenue Assumptions
Census decrease of 18 expected by 2023 (see market demand section of report).
Medicare rate decrease of 2.4 percent as of 10/1/18.
Medicare rate decrease of 2.6 percent as of 10/1/19 for Patient-Driven Payment Model
(PDPM) implementation, annual increase of 2 percent as of 10/1/20 and 10/1/21.
Medicaid rate increase of 2 percent as of 11/1/18 for wage increases, 1.5 percent every other
year after.
Annual private pay rate increases of 4 percent.
Annual commercial rate increases of 3 percent.
Operating Cost Assumptions
Four-star nursing staffing.
Fringe benefit percentage of 27.8 percent.
Reduced overtime by 1 percent.
Wage rate reduction of 5 percent.
Provider bed tax of $21.02 per non-Medicare patient day.
Management fee of 5.5 percent (there could also be a scenario without a management fee but
some of the Town services would need to be replaced by other vendors or FTEs). In 2018, the
Town allocation was over $1.1 million.
Annual increases of 2 percent for non-labor expenses and 1.5 percent for supplies.
Decreased maintenance and A&G expenses in Years 4 and 5 for census loss.
Reduce non-operating expenses.
Capital Expenditures
Not likely to get fair market price with current losses and being a union facility.
Estimated value of $65,000–$75,000 per bed, based on recent Connecticut sale history.
Annual debt service payments are around $1.7 million.
Model includes lease expense of 8.5 percent of $13.1 million value.
Depreciation for annual capital expenditures included, per the table shown in previous
scenarios.
Property taxes estimated at $125,000.
It is important to note that the scenario presented assumes the building depreciation and any
loans are on the books of the lessor and not TNW. The Town of Greenwich would be

Financial and Operating Report for
The Nathaniel Witherell
February 26, 2019 Page 71
responsible for the annual debt service payments. The annual debt service amount is
approximately $1.78 million in 2020 and will be reduced to $1.7 million in 2023.
Table 60: Five-Year Summary Profit & Loss, For-Profit Scenario
Sources: 2018 financial statements compiled by PFK O’Connor Davies, LLC, and HDG analysis
Actual Projected Projected Projected Projected Projected
6/30/18 Year 1 Year 2 Year 3 Year 4 Year 5
Residents
Total 184 180 176 172 165 162
Occupancy % 91% 89% 87% 85% 82% 80%
Total Net Revenues 28,012,578 27,193,155 26,708,345 26,758,180 26,272,784 26,347,143
Total Operating Expenses 29,542,440 29,116,660 24,946,520 25,049,078 24,467,973 24,450,241
Net Operating Income/(Loss) (1,529,862) (1,923,506) 1,761,825 1,709,102 1,804,811 1,896,902
Depreciation 717,360 776,790 134,278 201,748 285,795 346,411
Interest 836,170 778,267 - - - -
Property Taxes - - 126,875 128,778 130,710 132,670
Lease Expense - - 1,138,371 1,161,138 1,184,361 1,208,048
Net Income/(Loss) (3,083,392) (3,478,563) 362,301 217,438 203,944 209,772
Non Operating Revenue 372,689 372,689 134,245 135,587 136,943 138,313
Non Operating Expenses (112,005) (113,125) (84,844) (85,692) (86,549) (87,415)
Total Other Revenue (Expense) 260,684 259,564 49,401 49,895 50,394 50,898
Net Income/(Loss) (2,822,708) (3,218,999) 411,703 267,333 254,339 260,670
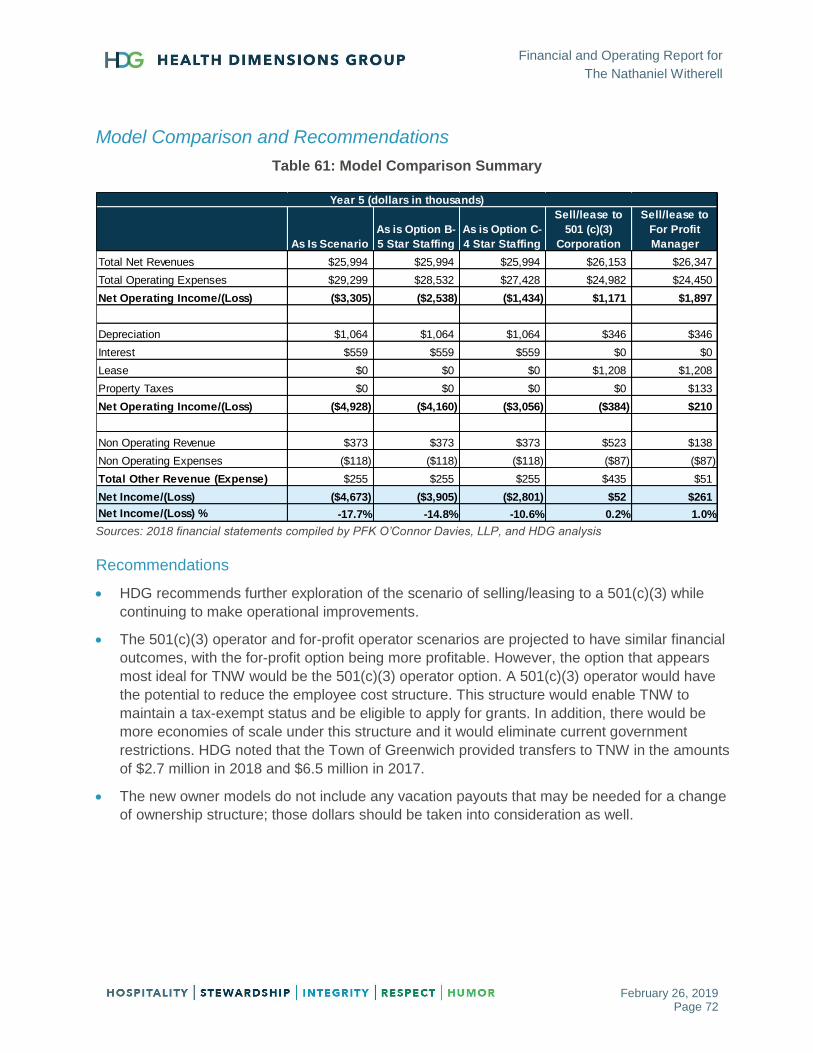
Financial and Operating Report for
The Nathaniel Witherell
February 26, 2019 Page 72
Model Comparison and Recommendations
Table 61: Model Comparison Summary
Sources: 2018 financial statements compiled by PFK O’Connor Davies, LLP, and HDG analysis
Recommendations
HDG recommends further exploration of the scenario of selling/leasing to a 501(c)(3) while
continuing to make operational improvements.
The 501(c)(3) operator and for-profit operator scenarios are projected to have similar financial
outcomes, with the for-profit option being more profitable. However, the option that appears
most ideal for TNW would be the 501(c)(3) operator option. A 501(c)(3) operator would have
the potential to reduce the employee cost structure. This structure would enable TNW to
maintain a tax-exempt status and be eligible to apply for grants. In addition, there would be
more economies of scale under this structure and it would eliminate current government
restrictions. HDG noted that the Town of Greenwich provided transfers to TNW in the amounts
of $2.7 million in 2018 and $6.5 million in 2017.
The new owner models do not include any vacation payouts that may be needed for a change
of ownership structure; those dollars should be taken into consideration as well.
As Is Scenario
As is Option B-
5 Star Staffing
As is Option C-
4 Star Staffing
Sell/lease to
501 (c)(3)
Corporation
Sell/lease to
For Profit
Manager
Total Net Revenues $25,994 $25,994 $25,994 $26,153 $26,347
Total Operating Expenses $29,299 $28,532 $27,428 $24,982 $24,450
Net Operating Income/(Loss) ($3,305) ($2,538) ($1,434) $1,171 $1,897
Depreciation $1,064 $1,064 $1,064 $346 $346
Interest $559 $559 $559 $0 $0
Lease $0 $0 $0 $1,208 $1,208
Property Taxes $0 $0 $0 $0 $133
Net Operating Income/(Loss) ($4,928) ($4,160) ($3,056) ($384) $210
Non Operating Revenue $373 $373 $373 $523 $138
Non Operating Expenses ($118) ($118) ($118) ($87) ($87)
Total Other Revenue (Expense) $255 $255 $255 $435 $51
Net Income/(Loss) ($4,673) ($3,905) ($2,801) $52 $261
Net Income/(Loss) % -17.7% -14.8% -10.6% 0.2% 1.0%
Year 5 (dollars in thousands)

Financial and Operating Report for
The Nathaniel Witherell
February 26, 2019 Page 73
OPERATIONAL ASSESSMENT
The following sections outline HDG’s findings and recommendations regarding TNW operations.
Operational Leadership
HDG interviewed leaders and managers of TNW’s individual service lines and reviewed TNW’s
operational systems and processes, which revealed collaboration and coordination between
service lines.
The executive director started in his position with the short-term and skilled nursing center in
2009, and is the primary leader of the community. He reports to The Nathaniel Witherell Board.
He previously served as executive director of other nursing homes in the state of Connecticut,
chief of operations in two hospital systems, and chief executive officer at APT Foundation. He
also previously led the only other skilled nursing facility (SNF) owned by a municipality.
HDG identified during interviews and observations that the executive director has a big vision;
however, his big-picture approach does not cover day-to-day details at TNW. This type of
leadership requires that dedicated managers have a more detailed approach to ensure
administrative tasks and daily processes are in place. Detail-oriented managers are crucial to
TNW’s success. It is important that leaders monitor performance and effectively communicate
expectations to staff to prevent work standards from slipping.
Department managers shared during interviews that systems that were once in place no longer
exist, such as completing time card punch forms prior to a change in an employee’s time card.
Also, beginning with the new fiscal year July 1, 2018, department managers do not yet have
their new budget numbers.
Recommendations
Provide the fiscal year 2019 budget to managers. When TNW’s fiscal year began on July 1,
2018, only one department manager knew their 2018–2019 budget expectations.
Develop a formalized mentoring/orientation program for managers. Two key department
managers—the director of financial operation and the director of nursing (DON)—are new to
TNW within the last six months. Multiple interviews revealed the orientation process does not
appear to have a solid onboarding foundation that supports a new manager’s success. (See
Appendix D for new executive director/DON orientation and training checklists.)
Administrator needs to work with the chief financial officer (CFO) to complete an audit of
vendors and outside contracts to develop a comprehensive list of vendors providing services
within TNW, along with costs.

Financial and Operating Report for
The Nathaniel Witherell
February 26, 2019 Page 74
Develop a strategic plan for rollout and implementation of Patient-Driven Payment Model
(PDPM), TNW for Medicare & Medicaid Services (CMS)’s new payment model for Medicare
long-term care effective October 1, 2019. TNW should also reduce its reliance on Select
Rehab.
It is imperative that the community own the clinical oversight of skill with the onset of
PDPM.
Emphasis will no longer be on therapy services being the revenue driver—rather, they
will become an expense.
Majority of the new levels of clinical payment are driven by nursing skills.
Therapy will be a component of the payment, but a much smaller element.
Length of stay, when driven by therapy, will decrease by 2 percent on Day 20 within the
therapy component of the payment.
Skilled levels cannot be assessed by non-nurses.
TNW could consider partnering with Select Rehab for education to the nursing
department as well as appropriate roles for the therapists within the new structure, but
the majority will need to be driven by nursing.
Marketing Analysis
TNW has contracted with Harrison Edwards Public Relations & Marketing to provide the
following marketing services:
Advertising/Collateral: Created half-page ad for Seniors Blue Book
Blogs/Digital: “A Greenwich Treasure Makes His Home at the Witherell”
Special Event: Provided a cost estimate to produce a two-minute video for event
Facebook/Instagram advertising: Measures short-term rehab clicks and “likes” campaign
Calls/Meetings: Friends Board Meeting, catch-up calls
Social Media: Facebook and Twitter posts
The admissions director is not responsible for developing advertising/collateral material that
represents TNW. According to the executive director, the public relations and marketing contract
costs $150,000 per year. The cost is shared with the Friends, a non-profit organization that
TNW partners with. The cost to TNW is $5,000 per month, or $60,000 per year.
TNW’s monthly social media report for January 2018 was provided to HDG for review. The
report provides a summary of the engagement overview, including audience, post-
engagements, posts sent, and media mentions.

Financial and Operating Report for
The Nathaniel Witherell
February 26, 2019 Page 75
Also noted in the report is three-month trending, which is presented in Table 62 below.
Table 62: Three-Month Social Media Trending
Summary November 2017 December 2017 January 2018
Tweets (cumulative) 3,456 3,554 3,660
Followers (cumulative) 161 169 176
Mentions 0 1 1
Retweets 5 6 4
Source: 01 Jan 2018–31 Jan 2018 Nathaniel Witherell Monthly Report by Harrison Edwards
As noted in the table above, the cumulative tweets increased by 3 percent month-over-month,
followers increased by 5 percent in December and 4 percent in January, mentions remain flat
with only one noted, and retweets have declined by 33 percent.
TNW did not provide to HDG the method they are using to validate the return on their investment
as it relates to referrals to their center.
Recommendations
Based on its reputation and location in the Town of Greenwich, TNW can sell itself. The greatest
challenge to TNW is the large number of long-term care beds in the immediate area (974). HDG
recommends the admissions director explore other approaches to enhance marketing and sales
effectiveness, including, but not limited to, the following:
Strengthen or initiate relationships with support groups such as Chamber of Commerce,
Kiwanis, Jaycees, and other local nonprofit organizations.
Engage more primary care physicians by holding continuing education unit (CEU) workshops
at the community center.
Complete a competitive analysis twice a year.
Mystery shop TNW twice a year to ensure responsiveness to inquiries.
Develop a marketing and communication plan focused on census development for the
Medicare and Managed Care population, including communication and outreach to the Town
of Greenwich.

Financial and Operating Report for
The Nathaniel Witherell
February 26, 2019 Page 76
BUSINESS OFFICE ASSESSMENT
As part of the operations assessment, HDG reviewed the following business office systems and
processes:
Admissions and census
Resident financial file contents
Billing and collections policies and procedures
Accounts receivable (A/R)
Other A/R concerns/recommendations
Triple check/pre-billing audit process
Resident trust account
Admissions and Census Analysis
The admissions director has been with TNW for 11 years, serving in his current role for the last
five years. At the time of the assessment, the admissions director was responsible for the
referral and admissions process. Referrals come through an electronic system—naviHealth or
EpicCare. When a referral is received, the admissions director or clinical staff (DON or RN)
reviews it for acceptance and checks the insurance and financial information. The business
office manager is not involved in this pre-admissions process.
Once a referral is accepted, an admissions department staff member completes the admissions
agreement with the resident/family member and obtains signatures. She then enters the new
resident demographic information into the computer software system. The business office
manager verifies the census and payor tree information that has been entered into Matrix.
Admissions Policies and Procedures
The following policies and procedures are in place at TNW to assist with the referrals and
admissions processes.
TNW Waiting List Policy and Procedures
TNW Admissions Policy
TNW Referrals
Nursing Policy and Procedural Guidelines
In review of the admissions policy, HDG noted that “In need of care for acute psychosis” is listed
twice (b. and d.). HDG also noted the admissions criteria lists diagnoses which TNW considers
not appropriate for admission. In preparation for the new CMS PDPM, TNW has an opportunity
to review its criteria in relation to Item e. (intravenous medication, total parenteral nutrition, and
peripheral parenteral nutrition of a central intravenous line).

Financial and Operating Report for
The Nathaniel Witherell
February 26, 2019 Page 77
According to Public Act 93-327, An Act Concerning Nursing Home Services, TNW can admit
self-pay applicants before those with Title 19 when the census of residents with self-pay status
is at or below 30 percent. The Act provides for a six-month waiver from the policy under
Connecticut General Statutes 19a-533: Discrimination against Indigent Applicants (“the Waiting
List Law”) which states that no bed may be held open for longer than 30 days.
Referral Source Summary
According to the admissions director, TNW’s referral sources are broken down as shown in
Table 63 below.
Table 63: Referral Summary
Referral Source Percent
Greenwich Hospital 71%
Stamford Hospital 9%
Other Sources: 20%
From Hospital for Special Surgery 4%
From Yale-New Haven Hospital 3%
From other nursing homes 3%
From home 3%
Random referrals 7%
Source: TNW admissions director
In review of the average monthly census for fiscal year 2018, HDG noted a downward trend,
from 188 in July 2017 to 178 in June 2018. The executive director noted that with the renovation
in progress and as a result of a recent survey concern, the average census was reduced by 14
beds due to hallway renovation.
Private Pay Summary
HDG completed a limited review of TNW’s competitor’s private pay room rates for comparison
purposes. Results are provided in Table 64 on the following page.

Financial and Operating Report for
The Nathaniel Witherell
February 26, 2019 Page 78
Table 64: Private Pay Room Rates Comparison
Facility Private Room
Rate Semi-Private Room Rate
Comments
Greenwich Woods $503/day $481/day 12 private pay rooms, all full. Each double shares a bath and is
separated by a curtain
Cassena Care at Stamford
$530/day $495/day On January 1, 2019, rates will increase to $555/day private and $520/day
semi-private
Long Ridge Post-Acute Care
$568.24/day $506.17/day 120 beds, 30 of which are short-term rehab. If resident finishes their Medicare
stay and is private pay, the facility will charge only $300/day for the first 14 days before the normal rate kicks in. According
to the contact, Long Ridge has larger rooms than most competitors.
Source: HDG analysis
At a private pay rate of $600/day, a decline of four private pay residents per day for one quarter
equals a decrease in revenue of approximately $219,000. The census history also shows a declining
trend in Medicare residents (31.1 percent in first quarter and 26.7 percent in fourth quarter), and in
Managed Care residents (4.6 percent in first quarter and 3.1 percent in fourth quarter).
In review of fiscal year 2018 census data for TNW, the private pay census is in a downward
trend, with the first quarter average private pay census at 50.2 percent and the last quarter fiscal
year average at 46.1 percent.
A 2–2.5 percent annual rate increase is standard for long-term care. Taking into consideration
issues with the current labor market on a national and state level, TNW might consider an
increase in rates to compensate for increasing wages.
TNW has a waiting list for 19 males and 41 females divided between memory care and complex
medical, and divided between private pay and Medicaid. During HDG’s interview, the
admissions director shared that he calls everyone on the list with every available open bed. He
later clarified that no one on the current list is ready for long-term care.
Recommendations
Admissions and business office staff should work together as a team to ensure all necessary
information is received and uploaded into the billing software, or emailed and scanned to the
billing staff. It is crucial that management communicate daily regarding census and admission
information/changes; the morning stand-up meeting is a good place for this communication.
This will not only assist in the billing and collections process, but could also decrease the
likelihood of bad debt and risk of compliance issues.
Business office manager (BOM) to complete an insurance/payor verification form for each
potential admission prior to acceptance of a new resident. This ensures verification of payor
source (primary and secondary) and insurance benefits, how the insurance will pay, and what

Financial and Operating Report for
The Nathaniel Witherell
February 26, 2019 Page 79
will be included on the UB-04 claim. It is important this information is accurate on the front end
to alleviate bad debt down the road (see insurance verification form in Appendix E).
Admissions team to provide the documents listed in the Resident Financial File section of this
report to the BOM prior to submitting any statements or claims. Currently, some of the
documents that need to be verified by the BOM reside in different offices (admissions and
social services). These all need to be uploaded into the computer software system, and
verified that they are completed by the BOM prior to billing.
Build a positive census culture by setting expectations for admissions/discharges, hold census
huddles to seek ways to improve census performance, manage discharges to optimize
admissions, and implement a rewards program for positive customer service.
Complete an admissions agreement for every resident within the first 24 hours of admission.
Create a census development action plan with the focus on private pay, Medicare, and
Managed Care. The census development plan should be a working tool that is reviewed and
revised at least monthly.
Revise the admissions policy by removing the duplicate reasons for non-acceptance and
consider acceptance of intravenous (IV) patients.
Revise the waiting list to identify categories for short-term leads versus long-term leads. Long-
term leads would be contacted monthly and short-term leads would be contacted when an
appropriate bed is available.
Resident Financial File Contents Analysis
The HDG consultant and TNW’s business office manager performed an audit of selected
resident financial files. The files were reviewed for required documentation and forms that
should be included in resident financial files on-site and uploaded into the billing software. The
information is necessary for billing and collections, and claims submissions. The following items
are to be included in the files and reviewed by the billing staff:
Signed copy of admission agreement
Copies of insurance, Medicare, and Medicaid cards (front and back)
Copy of Medicare Secondary Screening (MSS) form
Signed Assignment of Benefits form
Payor/Insurance Verification form
Medicare technical denial (if applicable)
Copy of hospital face sheet (if applicable)
At the time of the assessment, the resident financial files audited were missing pieces of the
information recommended above. It appears that some information resides in the admissions
files, some in social services files, and some in business office resident financial files.

Financial and Operating Report for
The Nathaniel Witherell
February 26, 2019 Page 80
Recommendations
Maintain a checklist to ensure all necessary documents are completed upon admission, and
the appropriate documents needed for billing and collections (see above) are routed to the
business office manager for the resident financial file. Upload these documents into the billing
software system and verify receipt by the business office manager prior to billing.
Complete the recommended insurance verification form prior to an admission—preferably by
the business office manager—and include in the resident financial file.
Resident Trust Account (RTA) Analysis
According to State regulations, every resident has the right to manage his or her financial
affairs. A resident may choose to deposit personal funds with the facility into a resident trust
account (RTA). If a resident chooses to deposit personal funds with the facility, upon written
authorization of a resident, the facility will act as a fiduciary of the resident’s funds, and hold,
safeguard, manage, and account for the personal funds of the resident deposited with the
facility. Findings and recommendations from our review of the RTA are provided below.
Quarterly statements are currently being generated and mailed to the resident/financial
contact. At the time of HDG’s assessment, the statements being generated did not show the
total resident social security check going into the account as a deposit. It only showed the
personal needs allowance portion ($60/month) with the description “receipt from Social
Security”. While the Social Security does in fact go into the RTA bank account (for those
residents who choose this option), this is not recognized on the statements.
At the time of the assessment, the total RTA balance report from Matrix showed it did not
reconcile to what is actually in the bank account. The difference of over $100,000 was
accounted for when running an additional report of discharged/deceased resident balances.
Some of these balances are 2–3 years old and have not been refunded to Medicaid. When
this practice was questioned, the business office manager shared a document from the State
of Connecticut dating back to 2014 that instructs the facility to hold off on refunding the
balances of discharged/deceased Medicaid resident balances for three years. HDG’s concern
is that this documentation conflicts with the Federal Government’s Mega Rule mandate
effective November 28, 2016. The Mega Rule states that all balances for
discharged/deceased residents need to be refunded within 30 days.
At the time of the assessment, TNW was not obtaining a signed resident trust authorization
form upon opening a resident trust account. This form should state that the resident/family
authorizes a resident trust fund be opened for the resident. In addition, it would list any
individuals who are authorized to make withdrawals from that specific residents trust account.
This form would also communicate any restrictions, etc., that pertain to that residents account.
Upon review of the current resident trust balance report, one account had a negative balance.
This report is utilized by the receptionist on a daily basis to verify if the resident has funds
available before doing cash withdrawals.

Financial and Operating Report for
The Nathaniel Witherell
February 26, 2019 Page 81
Recommendations
For Medicaid residents who have chosen to deposit their social security check into the
resident trust account, ensure the RTA shows the total social security check going into the
RTA as a deposit, with the amount for care (resident liability as directed by Medicaid)
withdrawn and paid to the facility, leaving the personal needs balance in the RTA.
Refund all RTA balances for discharged/deceased residents within 30 days of discharge or
death, in accordance with Federal Regulation §483.10(f)(10)(iv) Notice of Certain Balances
(CMS Mega Rule).
Include in the admissions packet a Resident Trust Fund Authorization form (see Appendix F).
Review this form and the resident trust fund procedure with the resident upon admission to
ensure they have been given the option to place their money in the account.
Ensure that no resident trust account is negative at any time, as this can be a survey citation.
Billing and Collections Policies and Procedures Analysis
At the time of the on-site assessment, business office policies and procedures specific to billing
and collections were reviewed. The policies and procedures available at that time were general
and brief in nature. HDG recommends the following:
Develop formal billing and collections policies and procedures specific to billing and
collections guidelines and processes, including those below, at a minimum:
Private pay & resident liability billing and collection procedures
o Series of three collection letters followed by phone calls
o 30-day discharge process
Insurance billing and collection procedures
Medicaid pending process
A/R review policy and procedure
Bad debt write-off policy and procedure
Cash receipt and posting process
Miscellaneous cash flow and deposits procedure
Segregation of duties policy and procedure
Triple check (pre-billing audit) policy and procedure
Resident trust account policy and procedure

Financial and Operating Report for
The Nathaniel Witherell
February 26, 2019 Page 82
Managed Care Billing Process (Triple Check)
HDG conducted a review of current Medicare and Managed Care billing while on site. Best
practice, often called the triple-check or prebilling audit, comprises a review of claims
information prior to submission to ensure accurate, compliant claims. At the time of the
assessment, the community was not conducting a formal triple-check meeting.
The prebilling audit is designed to review the following items, at a minimum:
Verification that technical requirements have been met for Medicare A
Verification of signed and dated physician certification/recertification
Ensure accuracy of all service dates
Ensure accuracy for types of assessment and resource utilization group (RUG) scores
Ordering of diagnoses on UB04
Verification of provided therapy minutes
Verification of ancillary charges
The triple-check team should consist of the following staff members:
Medicare biller
MDS coordinator
Therapy director
Medical records
Administrator
Others as deemed necessary by team
Copies of the minimum data set (MDS) validation reports are not being shared with the billing
staff. These validation reports verify that an MDS has been completed and accepted by CMS.
Recommendations
Medicare biller to schedule triple-check meeting for same time each month, before Medicare
or Managed Care claims are submitted.
Provide training and education to staff to ensure accuracy of claims information and to verify
required information prior to submission of claims.
Review copies of MDS verification reports to verify that the MDS has been submitted and
accepted by CMS prior to submission of any claim. Maintain records of these meetings in
order to defend any potential post-payment reviews by entities engaged in recouping payment
and auditing compliance.

Financial and Operating Report for
The Nathaniel Witherell
February 26, 2019 Page 83
Accounts Receivable (A/R) Review Process
HDG reviewed TNW’s accounts receivable (A/R) review process and the bad debt policy and
procedures. Our findings and recommendations are provided next. At the time of HDG’s visit, no
formal accounts receivable aging (A/R) review meetings were being conducted.
Recommendations
Hold a monthly A/R review meeting with business office staff, the administrator, and the CFO
(and others as deemed necessary) to accomplish the following:
Identify “problem” accounts, and discuss and assign follow-up steps and collection tasks
to be completed prior to the next scheduled A/R review meeting.
Discuss any accounts that are 60 days and older; and any private pay account that is not
current.
Identify potential bad debt balances, and discuss final collection attempts to ensure all
collection efforts have been exhausted prior to completing the bad debt write-off form.
Social Services to attend a portion of the monthly A/R meeting to review the Medicaid
Pending accounts and discuss the status of each, and identify follow-up items with
specific tasks assigned.
Bad Debt Policy and Procedures
All collection efforts should be exhausted before a balance will be considered to be a bad debt
and be officially written off. Collection efforts at TNW include, but are not limited to:
Resident/responsible party is called at least weekly to discuss the past due balance.
Resident/responsible party is offered the option of setting up a payment plan to pay off the
past-due balance.
Collections notes are documented and updated weekly in PointClickCare (PCC).
Accounts are regularly discussed on monthly or weekly A/R aging calls.
Series of collection letters is sent to resident/responsible party.
Collection agency is utilized, if deemed appropriate.
Attorney is utilized, if advised by Corporate and administrator to do so.
Once all avenues of collection have been exhausted, the business office staff fills out the Bad
Debt Worksheet form (see Appendix G). The form is signed by the BOM, the administrator, the
designated corporate business office consultant, and the CFO. Attachments include:
Transaction history report
Current A/R aging report
Collection notes/log from software system

Financial and Operating Report for
The Nathaniel Witherell
February 26, 2019 Page 84
Collection letters
Other documentation regarding collection attempts for this balance
Once all the paperwork has been signed by all parties, the adjustment may be made to write off
the balance. This is posted by the designated corporate business office consultant.
Recommendation
HDG suggests identifying the bad debt and processing on a monthly basis instead of annually,
as TNW is currently doing.
Other A/R Concerns/Recommendations
Medicaid Pending – Revenue
Currently, when a resident is considered “Medicaid Pending” (a Medicaid application has been
submitted to the county or Medicaid office), the payor assigned in Matrix is Medicaid Pending,
but the rate in the computer system is the private pay rate. The private pay rate remains in
effect until the application is approved or denied, which in some cases can take 6–12 months.
When a resident is considered Medicaid Pending, HDG recommends entering the Medicaid rate
rather than the private pay rate, because the private pay rate of $520.00/day is so much higher than
the Medicaid rate of $277.84/day. Due to the current practice, the A/R aging revenue is overstated.
With an approval potentially taking many months, the overstatement of revenue on the A/R aging
causes very large adjustments that happen when the approval/denial does come through.
Total A/R Aging Balance versus Credit Balance Report
The total balance of the A/R aging at the time of HDG’s assessment was $3,316,654.02. This
total balance includes a credit balance of ($210,158.34) tied to residents which are either due
back to residents or need to be researched to determine if they were true credit balances. This
being said, the total A/R balance is actually understated by $210,158.34.
Additionally, the A/R report does not balance with the ledger presented to the Town Board.
According to that report, there is actually more than $888,000 in credits. This credit balance has
increased greatly since 2016; in 2016, the credit balance was $373,000; in 2017 it was
$457,000; and in 2018, it was $888,000. According to the CFO and business office manager at
the facility, much of this large credit balance is due to Medicaid take-backs due to rate
decreases over these years. The staff indicated that they have filed an appeal with the State
regarding these rate decreases.
HDG could not determine how much of the credit balance total was due to the appeal and how
much was actually owed back to a resident or insurance company.
Recommendations
Clearly define the total of credits that comprise the Medicaid rates appeal and provide to the
board a monthly update regarding the appeal. By not reporting this information, the financial
information presented is inaccurate or overstated.

Financial and Operating Report for
The Nathaniel Witherell
February 26, 2019 Page 85
Clearly define the credit balances due to residents or insurance companies and refund as
quickly as possible to comply with the Mega Rule regarding resident refunds within 30 days of
discharge or death.
Billing Proper Payor for All Residents/Billing Consistency
At the time of the assessment, there was one account on A/R aging that totaled over $280,000.
The explanation for this large balance was that an exception was made for this resident, and he
should actually be private pay. If/when the payor is changed to private pay, the total account
balance owed to the facility will be over $500,000. According to business office staff, the only
payment received each month on this account is the resident’s social security check.
HDG recommends that the proper payor be entered for a resident without exception. All
residents should be billed the same according to their pay source. If there are collection issues,
a 30-day discharge notice should be issued and the collection policy and procedure followed.
Business Office Issues/Training Needs
HDG identified the following opportunities for improvement and training needs for the business
office manager and the chief financial officer (CFO). Because the CFO is relatively new to his
role at TNW, there is an opportunity to learn specifically about skilled nursing facility financial
and billing processes. Below are specific training opportunities which HDG recommends:
For CFO: General skilled nursing facility financial processes, as well as billing and collections.
Consolidated billing process for Medicare claims.
Ancillary invoice review process/verification of payors.
Ancillary entry into Matrix software and flow to claims.
Streamlined admissions process as it pertains to business office.
Triple-check/pre-billing audit process.
A/R aging monthly review process.
Schedule business office semiannual audits.
Billing staff review of managed care contracts.
New York Medicaid approval process (consensus at this time is that if a resident is admitted
with NY Medicaid, there is no pay source and no payment).
Utilization of collection letters and collection notes in Matrix.
Documents needed/required to be in resident financial file for compliance and collections
issues.
Payor set-up in Matrix for proper and automatic contractual adjustments.

Financial and Operating Report for
The Nathaniel Witherell
February 26, 2019 Page 86
Accounts Payable (A/P)
Accounts payable is money owed by TNW to its suppliers and is shown as a liability on a
company’s balance sheet. HDG’s interview with accounts payable staff indicates TNW has a
system in place to manage accounts payable, but staff were unable to produce a written policy
and procedure.
The process starts with TNW’s purchasers obtaining a purchase order (PO) prior to placing an
order. Invoices are received and stamped with the date in which they were received.
Statements, if any, are matched up with receipts, purchase orders, and packing slips. According
to A/P staff, all vendors have a W-9 form. It was confirmed that statements are not processed
for payment unless paid with a credit card or a monthly statement of invoiced charges is
received from an approved vendor. The mathematical accuracy of the invoices should be
verified prior to processing.
Currently, A/P staff codes all invoices; however, it would be appropriate for department
managers to code their own invoices. It is very important not to send an invoice through without
a general ledger (G/L) code.
Invoices should be approved by the appropriate parties before payment is submitted. The
department manager should approve all invoices based on purchases. They should check for
accuracy and, if not already coded, should code the invoice according to the G/L breakdown. If
the invoice is already coded, managers should verify the coding is correct according to the
department budget. Once the department manager has reviewed and approved, invoices should
be routed to the executive director for final approval.
Once the approved invoices are received from the executive director, they should be batched.
Batching consists of alphabetizing invoices and running a duplicate tape of invoice totals to
verify the batch. Finally, the invoices are entered into the electronic system. Each invoice should
be initialed along with the time of entry; verify the remittance address, and enter the invoice
number exactly as these items appear on the invoice. Ensure the batch total and entered total
are in balance.
TNW should maintain a vendor ledger that shows the vendor history of invoices entered and
payments made (accounts payable staff were not aware of what invoices are paid).
Furthermore, TNW should complete an Office of Inspector General (OIG) verification on all
vendors with follow-up verification (see Appendix H). The purpose of the verification is to identify
and eliminate fraud, waste, and abuse (FWA) in Medicare, Medicaid, and other federal
programs. Prior to employing or contracting with persons and entities and periodically thereafter,
all facility staff and vendors are screened appropriately as outlined by the OIG List of Excluded
Individuals/Entities (LEIE). The screening is conducted for applicants, employees, independent
contractors, and vendors to ensure they have not been sanctioned by state or federal law
enforcement and/or regulatory or licensing agencies; and full disclosure of any other relevant
information is provided. If a health care provider arranges or contracts with a person the
provider knows or should know is excluded by the OIG, TNW risks the following actions:

Financial and Operating Report for
The Nathaniel Witherell
February 26, 2019 Page 87
Assessment of civil money penalties (CMPs) of up to $10,000 for each item or service
furnished by the excluded person or entity.
Assessment of up to three times the amount claimed.
Program exclusion from Medicare, Medicaid, etc.
Recommendations
Develop a written policy and procedure that supports the A/P system TNW is using.
Provide G/L training for department managers to review and properly code their purchases.
Maintain a vendor ledger (electronic is recommended) that shows the vendor history of
invoices entered and payments made.
Ensure all invoices are reviewed by the department, coded, and signed off—any incorrect
invoices must be addressed prior to sending up for payment.
As a commitment to maintaining the integrity of care and services, as well as financial and
business operations, TNW should run an OIG verification for all vendors prior to employing or
contracting with persons and entities and periodically after employing or contracting with
entities.
Social Services Department Analysis
Social services consists of a director of social work, a discharge planner, a full-time social
worker, and a part-time social worker, totaling 130 hours per week. The director and discharge
planner are responsible for 76 patients each, the full-time social worker is assigned to long-term
care, and the part-time social worker covers short-term rehab. Social workers are responsible
for the following:
Completion of certain sections of the minimum data set (MDS). Social workers do not
complete care plans.
Completion of preadmission screening and resident review (PASRR) and levels of care
(LOC).
Serving as patient advocates.
Providing State of Connecticut Q & A about applying for Medicaid to Pay for Long-Term Care
or Home Care.
Bed management (process is discussed later in this report).
Discharge planning (process is noted later in this report).

Financial and Operating Report for
The Nathaniel Witherell
February 26, 2019 Page 88
Recommendations
Based on review of the social services department, HDG recommends the following:
Provide the director of social services with the fiscal year 2019 budget.
Participate in care plans.
It was noted during interviews that social services does not compose care plans, but
they do participate in multidisciplinary care plan meetings. According to federal
regulations F665, §483.21(a) Baseline Care Plans, the facility must develop and
implement a baseline care plan for each resident that includes the instructions needed to
provide effective and person-centered care of the resident that meet professional
standards of quality care. The baseline care plan must:
(i) Be developed within 48 hours of a resident’s admission
(ii) Include the minimum health care information necessary to properly care for a resident,
including, but not limited to:
o Initial goals based on admission orders
o Physician orders
o Dietary orders
o Therapy services
o Social services
Preadmission Screening and Resident Review (PASRR) recommendation, if applicable
The facility must provide the resident and the representative, if applicable, with a written
summary of the baseline care plan by completion of the comprehensive care plan.
Bed Management, Short-Term Residents Analysis
If it is known a short-term resident will be staying, the resident receives a “Welcome to Long-
term Care” letter which provides notice that upon completion of their short-term stay, they will
have a room change. If this is not known upon admission, as the social workers learn about the
resident, the resident will receive a written 15-day notice of room change. The social workers do
have a room change list for requested room changes, which is managed according to
personalities of the residents.
HDG recommends ensuring the room change process includes Federal Regulation F559,
§438.10(e)(6) The Right to Receive Written Notice, including the reason for the change, before
the resident’s room or roommate in the facility is changed.
Discharge Planning Process
TNW’s discharge process is managed mostly by the discharge planner. The system is solid, and
the following steps are in place:
Ensure everyone is in agreement, including resident, family, staff providers, and physician.

Financial and Operating Report for
The Nathaniel Witherell
February 26, 2019 Page 89
Outpatient care is arranged, if needed
Appointments are scheduled
If homebound, care is arranged
Equipment is arranged
Transportation is arranged
Nurse practitioner is given a list of patients ready for discharge; she writes the orders
If a visiting nurse is needed, a W-10 and face-to-face with doctor is required
Based on information provided during the interview, all relevant resident information is to be
incorporated into the discharge planning process to avoid unnecessary delays in the resident’s
discharge or transfer. However, it was noted that a couple of areas were identified as not being
included: resident education or training and medication review.
Recommendations
To ensure documentation is completed timely based on the residents’ needs and included in the
clinical record, HDG recommends TNW consider an evidence-based discharge process such as
IDEAL Discharge Planning, Overview, Process, and Checklist to ensure all resident’s needs are
met at the time of discharge and documented (see Appendix I).
Recreation Department Analysis
TNW’s recreation department provides activities based on the comprehensive assessment, care
plan, and preferences of each resident. The department has an ongoing program that offers
both facility-sponsored groups and independent activities that encourage both independence
and interaction in the community.
The department consists of the recreation director and a team of five full-time, 35 hours/week
employees, for a total of 210 hours per week. Also, there is a part-time position for Fridays and
Saturdays. TNW provides two activities on Saturday and church services on Sunday. No
evening activities are provided.
TNW staffs two employees on the dementia unit Monday–Friday. For residents with dementia,
the lack of engaging activities can cause boredom, loneliness, and frustration that results in
distress or agitation. Activities must be individualized based on the resident’s previous lifestyle.
Recommendation
As a best practice, most long-term care facilities provide evening activities. HDG suggests
monitoring and evaluating evening occurrences and behaviors, such as agitated residents, falls,
resident-to-resident issues, etc. to determine if evening activities would be beneficial.

Financial and Operating Report for
The Nathaniel Witherell
February 26, 2019 Page 90
Dietary Department Analysis
The dietary staff does not know its fiscal year budget. The department is operating at $7.88 per-
patient day (PPD) for food, which is acceptable for the area.
Morrison Community Living Compass Group manages the dietary department for TNW. TNW’s
service employees (e.g., cooks, food service workers, production manager, and dietician) report
to the Morrison dietary director. The employees are part of the Teamsters union and receive
benefits according to the union contract.
In HDG’s review of the TNW’s kitchen, the strengths include well-organized service delivery and
committed leadership. The dietary staff includes the executive chef who has been with Morrison
for 5.5 years, and the dietary director for Morrison who has served in that role for 1.5 years and
has been with the company for 13 years.
The kitchen design lends itself to a select menu service. The building supports dining as
established per unit. It is set up on a four-menu cycle annually with an additional per-order
menu for sandwiches and salads. The menus are set up as follows:
Long-term care: Menus completed one week prior.
Rehab units: New menu every three days.
Dementia unit: Menus completed one week prior. It was noted that nursing staff, volunteers, or
family members assist residents to complete their menu choices.
The residents can also dine at an onsite café. The dietary department is responsible for
cleaning the kitchen; there is a list for cleaning that also includes tables, chairs, and floors.
Food is ordered from Morrison’s preferred vendor, Sysco (food) and Sardalli (produce and
dairy). There is an onsite garden which is used for produce. The Morrison dietary director and
executive chef are not aware of TNW’s dietary fiscal year budget, even though they are ordering
the food, supplies, and nutritional supplements. They stated they are currently operating at
$7.88 PPD for food.
The Morrison dietary director said his biggest challenge is staffing. The process to get an
employee hired and onboarded takes so long that most applicants just go somewhere else. It
takes over 30 days from the time a candidate submits an application to starting at TNW. All
applicants for positions at The Nathaniel Witherell are required to be fingerprinted by the State
of Connecticut State Police. The closest barracks is in Bridgeport, Connecticut, which is a 35-
mile drive for applicants. Some applicants choose not to make that drive. Furthermore, there is
always a delay in getting the fingerprint test results back.
TNW’s dietary operating expense for September 30, 2017, was $33.55 PPD, higher than all
comparison facilities (which average in the range of $31.73–$20.81) and in comparison to the
Northeast industry median 50th percentile of $21.04 and 75th percentile of $26.18.

Financial and Operating Report for
The Nathaniel Witherell
February 26, 2019 Page 91
Recommendations
Ensure the food service director has the fiscal year department budget including staffing
expectations.
Continue to partner with the Town of Greenwich’s human resources (HR) department to
reduce the onboarding time for new hires.
Facilities Maintenance, Housekeeping, and Laundry Departments Analysis
The director of facilities oversees TNW’s maintenance, housekeeping, and laundry
departments. The position is supported by a trades foreman and the housekeeping and laundry
supervisor.
Building Maintenance
The building maintenance mechanics report to the trades foreman. Approximately 40 hours of
training is provided upon hire (three hours at Town Hall, eight hours of orientation at TNW, and
24-32 hours with the manager). The mechanics oversee a variety of building trade functions for
the nursing home, such as:
Maintenance and repair of heating, ventilating, and air-conditioning (HVAC) systems; electrical
equipment; plumbing; structural repairs; masonry; painting; alarm system; and emergency
systems.
Time and attendance system.
Maintenance plans and purchasing records.
Automotive equipment.
Performing minor repairs.
Transporting nursing home residents to various appointments and/or Town staff to and from
the railroad station on an as-needed basis.
During HDG’s interview, the director of facilities stated he enjoys his job because it is always
good to help people. He supports teamwork and harmony. The director shared a concern
regarding facility staff, stating that a few years ago, a consultant company came in and
recommended a reduction in full-time staff and an increase in part-time staff without benefits.
The director believes this has reduced TNW’s ability to fill open positions.
The director shared that the maintenance department has four employees who are responsible
for the maintenance of a 24-acre campus and a 124,000 sq. ft. building. He also stated the
building maintenance mechanics have low skill levels and bad attitudes—three men are older
and ready to retire, and the pay is not adequate, at $18 per hour. He also said the department
does not have enough employees to sustain preventive maintenance, such as painting touch-
ups. TNW has contracted a painter, and also contracts for grounds maintenance, snow removal,
landscaping, and other building maintenance tasks. Because of recent changes in the federal
Financial and Operating Report for
The Nathaniel Witherell
February 26, 2019 Page 92
regulations related to the CMS Mega Rule, routine tasks such as bed audits, door audits,
legionnaire assessments, and emergency preparedness have been contracted to third parties.
During interviews, the chief financial officer (CFO) and director of facilities were not able to
provide a comprehensive list or cost of building maintenance tasks that are maintained by
outside contracts. The director of facilities shared that because of the union, every employee is
reviewed from April of each year through March of the following year. He said anyone averaging
30 hours per week must be offered benefits. He has already offered his part-time employee
benefits. This is the process they use to fill shifts.
The average operating expenses PPD for maintenance are slightly higher than the majority of
the comparison facilities. The Nathaniel Witherell is $20.08 PPD for maintenance, while three of
the ten comparison facilities are higher and the Northeast 50th percentile is $12.85 PPD and
75th percentile is $16.57 PPD.
Housekeeping and Laundry
The housekeeping and laundry supervisor oversees a 29-employee department consisting of 13
full-time employees and 14 part-time employees (2 part-time with benefits and 12 part-time
without benefits).
The housekeeping department works 7:00 a.m. to 3:30 p.m. daily. The laundry department
works varied hours: 6:00 a.m.–2:00 p.m., 7:00 a.m.–3:00 p.m. and 7:30 a.m.–3:30 p.m. The
supervisor shared that supplies are ordered through approved Town vendors on MUNIS, a
purchase order system.
The housekeeping operating expenses are $13.28 PPD, higher than all but one of the
comparable facilities, with the Northeast 50th percentile at $7.16 PPD and the 75th percentile at
$9.46 PPD. The laundry operating expenses are $2.11 PPD, lower than seven of the
comparable facilities, with the Northeast 50th percentile at $3.58 PPD and the 75th percentile at
$4.75 PPD.
Recommendations
Ensure the director of facilities and the housekeeping & laundry supervisor have the fiscal
year 2018–2019 budget to manage the department to expectations.
CFO and director of facilities should complete an audit of maintenance vendors and outside
contracts to ensure they have a comprehensive list of vendors and the cost of those services
provided to TNW.
Review the staffing allocations between housekeeping and laundry to ensure the staffing
hours are correctly charged on a per-pay-period basis.
Review the labor law with department managers. The Internal Revenue Code enacted by the
Affordable Care Act, Section 4980H, applies to large companies with an average of 50 full-
time employees during the preceding year. Section 4980H(c)(4) provides that a full-time
employee is an employee who is employed on average of at least 30 hours of service per
week in any given month. Minimum Essential Coverage (MEC) must be offered.
Financial and Operating Report for
The Nathaniel Witherell
February 26, 2019 Page 93
HUMAN RESOURCES ASSESSMENT
TNW is supported by the Department of Human Resources (HR department) for the Town of
Greenwich. The HR department is responsible for the development, implementation, and
administration of policies and procedures, rules, and regulations for Town employees, as well as
pay practices for TNW based on requirements set out under collective bargaining units with
unions. At TNW, there is an administrative assistant who is not an HR person but is responsible
for staff scheduling and time keeping. The administrative assistant maintains and monitors the
staffing schedules, fills shifts, makes adjustments in employee time cards, and prepares time
cards for processing.
The employment functions of the HR department include, without limitation:
Recruitment.
Employment eligibility determinations, testing, and assessment.
Administration of employee performance review plans.
Guidance of department heads and supervisors on employee performance, discipline and
termination in accordance with collective bargaining agreement.
Organization of staff development programs, personnel training, and retention processes for
all Town of Greenwich employees, including those at TNW.
Maintenance of employee records and documents.
Affirmative action to degree required of a municipality.
No advertisements may be placed without written approval of the HR director, and written
approval from the HR director must be obtained to use outside employment agencies. All
applicants are required to complete an employment application through the Town’s online
application system, NeoGov, at www.greenwichct.org/jobs. The Town conducts background
checks on all job candidates post offer, and TNW pays for the testing. The Town carries out at
least two reference checks prior to making an offer. Once the conditional offer of employment
has been made and accepted, the candidate is required to submit to a background check, a pre-
employment medical examination and drug screening test. The appointing authority who
initiated the requisition then makes the offer of employment. All applicants for regular part-time
and full-time positions must pass entrance exams dependent on the skills necessary for the
open position.
Pay Practices Analysis
The HDG consultant reviewed pay practices at TNW. The following sections outline HDG’s
findings and recommendations.
Financial and Operating Report for
The Nathaniel Witherell
February 26, 2019 Page 94
Hiring Process
Several department managers at TNW expressed concerns about the length of time it takes to
onboard an applicant. The perception is that it takes a minimum of 30 days to hire a new
employee, and by that time most applicants in need of a job (such as CNA., dietary aide,
housekeeper, or laundry staff) have already moved on to another organization that has a faster
hiring process. During HDG’s interview, the administrator confirmed the lengthy hiring process.
When a nursing position become available, a posting for transfer-only is displayed internally for
one week. These minimum requirements are driven by union contracts. The managers noted
that criminal history and abuse background checks must be completed by the State police
department in Bridgeport, Connecticut (half an hour away), which takes approximately 30 days
and, as a result of the delay and distance, the applicant seeks employment elsewhere.
Applicant Tracking
As part of the information request, HDG asked for the applicant tracking log. As a municipality,
the Town is not required to submit an EEO-1 Report, but is required to file an EEO-4 Report.
The data regarding applicants and employees is available on NeoGov, the Applicant Tracking
System (ATS) through which the Town is able to access data provided by applicants. The HR
department has the ability to report on applicants through NeoGov.
HDG observed that the Town follows best practices by collecting demographic information in
order to protect against unlawful discrimination claims and to monitor diversity efforts.
Workers’ Compensation
HDG interviewed the administrative assistant who oversees time cards and scheduling.
In Connecticut, an employee has one year from the date of injury to file a claim, or three years
from the first manifestation of an occupational disease. An employer has one year to contest a
claim. The Town has implemented an initiative to improve safe working environments and
reduce workers’ compensation claims. According to TNW’s Compensation Claim Report for the
period from July 1, 2011, to August 31, 2018, 290 claims were filed and paid with reserved
expenses of $785,158. Currently, there are nine open claims with a reserved expense of
$180.894. The Town’s initiative has had a significant impact on improving the workers’
compensation history at The Nathaniel Witherell.
HDG recommends continuing the best practices TNW has developed.
Employee Time Verification
HDG’s interview with the administrative assistant revealed that employees’ time cards had been
altered in the past without the employee’s verbal or written consent. The administrative assistant
shared that in the past, TNW always completed a form, but they no longer use that process.
Under the Fair Labor Standards Act (FLSA), employees who are not exempted under the law

Financial and Operating Report for
The Nathaniel Witherell
February 26, 2019 Page 95
must be paid for all hours worked in a work week2. The time card must accurately reflect the
hours an employee worked. TNW holds employees accountable for punching in and out
correctly; each employee has an obligation to punch in and out accurately.
HDG recommends using a time card exception form, signed and dated by the employee, before
changing a time card.
The employer cannot fire an employee for complaining about their pay and/or the employer’s
unilateral change in a time card. If the employer does not pay for all hours an employee works,
the employee can file a complaint with the Labor Commissioner. Normally, the burden of proof
is on the employer.
Staff Turnover
TNW has a low turnover rate for direct care staff (licensed nurses or CNAs). During our site
visit, it was noted that there are open positions in dietary and throughout the facility. Regular
monitoring of staff turnover through exit interviews can show TNW why turnover may happen
and thus enable TNW to retain its staff. A facility does need to know why its employees choose
to leave; it cannot address issues causing them to leave if it does not carry out exit interviews.
In talking with the Town’s HR department, the HR software being used does allow them to track,
trend, and monitor turnover.
HDG recommends that TNW review exit interview reports on a quarterly basis.
Overtime
HDG reviewed the Detailed Labor Report, which shows direct-care nursing employee (licensed
nurses and CNAs) overtime hours submitted. In reviewing overtime using the nursing services
punch detail report for the period ending July 28, 2018, it showed that 59.8 percent of full-time
direct-care nursing employees and 6.3 percent of part-time direct-care nursing employees
submitted overtime hours. For the period ending August 11, 2018, it showed that 56.9 percent of
full-time direct-care nursing employees and 4.2 percent of part-time direct-care nursing
employees submitted overtime hours. TNW’s patient care coordinators (PCCs) and assistant
director of nursing/associate director of nursing (ADONs) are averaging overtime at the rate of
130 hours per pay period, or 17.6 percent.
HDG reviewed the direct-care nursing staff time card punches for a six-week period against the
HDG benchmark, and determined that TNW direct care overtime is averaging 6.21 percent.
HDG compared the percentage of overtime hours to total hours at TNW and to an HDG
average; results showed TNW 6.4 percent and HDG average 6.0 percent. Taking into
consideration issues with the current labor market on a national and state level, TNW might
2 https://www.dol.gov/whd/regs/compliance/whd_fs.pdf

Financial and Operating Report for
The Nathaniel Witherell
February 26, 2019 Page 96
expect to see an increase in overtime usage. Overtime usage is also a concern within other
departments at TNW.
TNW is currently installing OnShift, a staffing software that has the ability to assist with
monitoring overtime if used to its fullest capacity. The software is designed to flag employees
who go into overtime by picking up shifts and identify employees who, when they work any
additional hours, would be into overtime; however, the scheduler must pay attention to what the
software identifies.
Current direct care staff overtime is running at 6.21 percent. Reducing overtime usage at TNW
to 4 percent or less would decrease the cost of overtime by approximately $321,829.04
annually, as shown in Table 65 below.
Table 65: Direct Care Cost of Overtime for Fiscal Year Ending June 30, 2018
Staff Overtime
Hours
Overtime Cost
per Hour
Total
Overtime Cost
Overtime
Hours in
Excess of 4%
Savings in
Overtime Cost
LPN Staff Charge Total 2,430.00 $48.43 $117,686.32 864.78 $41,881.30
LPN Staff Charge Total 365.25 $59.36 $21,681.90 129.98 $7,715.61
RN Staff Nurse 5,259.55 $62.13 $326,776.65 1,871.76 $116,292.45
RN Staff Nurse 355.50 $76.87 $27,325.57 126.51 $9,724.82
TNW Certified Nursing Assistant (CNA)
7,254.92 $30.30 $219,834.18 2,581.86 $78,230.36
PCC – ADON 2,051.50 $66.23 $135,842.43 729.90 $48,341.28
CNA 23.75 $30.34 $725.44 8.45 $256.37
TNW CNA 1,806.25 $30.16 $54,478.37 642.80 $19,386.85 Source: HDG Benchmark and TNW Detail labor reports
Findings:
By reducing overtime by 2.21 percent, TNW would realize a total savings of $321,829.04.
The Teamsters contract calls for overtime to be distributed as equally as possible to qualified
LPNs and CNAs. It also states that an employee is required to be reasonably available to
accept and work offered overtime assignments.
Recommendations
HDG recommends that overtime be offered and rotated between all full-time employees:
Rotate offers of overtime between all full-time employees.
Submit all overtime requests to the employee’s supervisor for approval.
Make a concerted effort, between employees and department managers/supervisors, to be
mindful of overtime usage, keeping overtime down to an acceptable level of 3.5 to 4 percent.
Learn and use the scheduling software to its fullest capacity.

Financial and Operating Report for
The Nathaniel Witherell
February 26, 2019 Page 97
Provide training and clear expectations to scheduler on use of software and overtime.
Consider moving nursing management (patient care coordinators, assistant directors of
nursing) to salaried positions.
Understand the reason for the overtime:
Is the overtime built into the schedule by scheduling six days one week and four days
one week?
Is it creeping overtime (e.g., employees punching in early, punching out late, or not
taking lunch breaks)?
Is it caused by call-off, no-show, or open shift?
Use the following guidelines when staff is needed to pick up shifts:
Use casual or PRN staff first
Next, call staff working less than 40 hours per week
If necessary, call full-time staff
Non-Productive Hours/Sick Pay Analysis
Another area of opportunity for TNW is controlling the excessive amount of sick leave. In
accordance with the union contract, sick leave is used by an employee who has contracted or
incurred and is suffering from any non-service connected sickness or disability, including
pregnancy, which renders her/him unable to perform the duties of their position.
In addition, an employee is eligible to receive paid sick leave when there is an illness or
disability involving a member of their immediate family which requires the employee’s personal
care and attendance. Also, at the time of retirement or death, the heirs or estate shall be paid
for unused sick leave at the rate of the employee’s last position: e.g., 0–74 accrued days = no
payment, 75–150 days = 50 percent of accrued days, 151–180 days = 75 percent of accrued
days. An employee hired or rehired on or after September 23, 1998, shall not be eligible to
receive payment for unused sick leave.
An employee taking sick leave is to notify their immediate supervisor, including the reason
thereof. Failure to do so within a reasonable time will be cause for denial of paid sick leave for
the period of absence.
If the Town has reasonable grounds to believe sick leave is being abused, it may require an
employee requesting sick leave, or leave without pay when sick leave is exhausted, to furnish a
statement from their attending physician certifying the absence from work was necessary. This
becomes a disciplinary matter which must be monitored and addressed. It is unusual to have
sick time as a payable benefit and payable upon employee’s death to heirs; consider
renegotiation with the union.
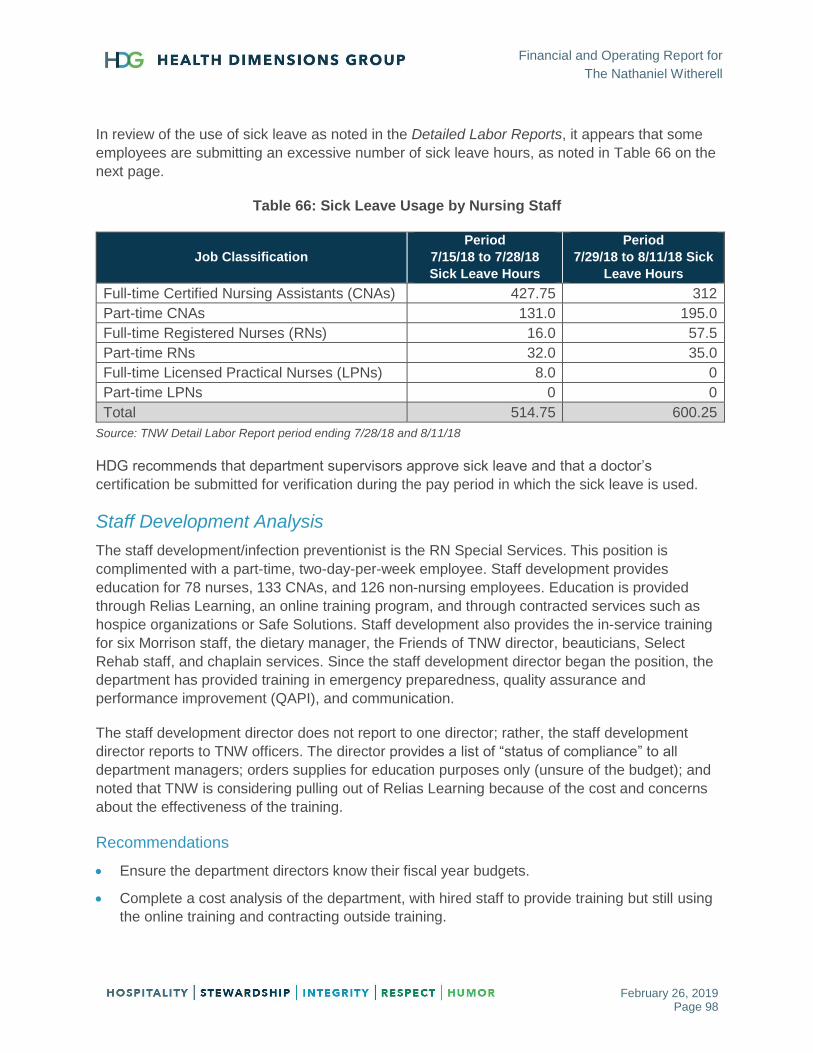
Financial and Operating Report for
The Nathaniel Witherell
February 26, 2019 Page 98
In review of the use of sick leave as noted in the Detailed Labor Reports, it appears that some
employees are submitting an excessive number of sick leave hours, as noted in Table 66 on the
next page.
Table 66: Sick Leave Usage by Nursing Staff
Job Classification
Period
7/15/18 to 7/28/18
Sick Leave Hours
Period
7/29/18 to 8/11/18 Sick
Leave Hours
Full-time Certified Nursing Assistants (CNAs) 427.75 312
Part-time CNAs 131.0 195.0
Full-time Registered Nurses (RNs) 16.0 57.5
Part-time RNs 32.0 35.0
Full-time Licensed Practical Nurses (LPNs) 8.0 0
Part-time LPNs 0 0
Total 514.75 600.25
Source: TNW Detail Labor Report period ending 7/28/18 and 8/11/18
HDG recommends that department supervisors approve sick leave and that a doctor’s
certification be submitted for verification during the pay period in which the sick leave is used.
Staff Development Analysis
The staff development/infection preventionist is the RN Special Services. This position is
complimented with a part-time, two-day-per-week employee. Staff development provides
education for 78 nurses, 133 CNAs, and 126 non-nursing employees. Education is provided
through Relias Learning, an online training program, and through contracted services such as
hospice organizations or Safe Solutions. Staff development also provides the in-service training
for six Morrison staff, the dietary manager, the Friends of TNW director, beauticians, Select
Rehab staff, and chaplain services. Since the staff development director began the position, the
department has provided training in emergency preparedness, quality assurance and
performance improvement (QAPI), and communication.
The staff development director does not report to one director; rather, the staff development
director reports to TNW officers. The director provides a list of “status of compliance” to all
department managers; orders supplies for education purposes only (unsure of the budget); and
noted that TNW is considering pulling out of Relias Learning because of the cost and concerns
about the effectiveness of the training.
Recommendations
Ensure the department directors know their fiscal year budgets.
Complete a cost analysis of the department, with hired staff to provide training but still using
the online training and contracting outside training.

Financial and Operating Report for
The Nathaniel Witherell
February 26, 2019 Page 99
In providing training for multiple outside contracted employees, determine if TNW is receiving
contractual consideration for providing their training.
Collective Bargaining Agreements (CBA) Analysis
The HDG consultant was asked to provide recommendations for the upcoming union
negotiations. HDG reviewed each of the three union contracts that are in place at TNW. In our
review, we noted several items in each of the contracts that are not standard/normal for a long-
term care facility. This observation is based on many other facilities HDG has worked with,
particularly in the Midwest. A list of these items is provided below, along with comments. Please
note that any changes you make to your contracts should be in accordance with the
employment regulations for the State of Connecticut.
Laborers International Union of North American (LUNA), 2016–2019, page 31 D: The Town
shall post all job openings and shall send a copy of the notice to the union (RNs).
Teamsters Local #456 International Brotherhood of Teamsters, 2016–2019:
Page 30 A: The Town, using its best efforts and subject to budgetary considerations,
shall fill vacant bargaining unit positions within 120 days, and within 160 days if the
Town is required to create a valid employment register form with which to make the
appointment.
Page 30 B: Employees seeking a transfer shall complete and submit a transfer
application to the Department of Human Resources with ten (10) calendar days from the
date the date the transfer notice was posted to the Town’s web page.
Page 31 D (iii): To be qualified for a transfer to The Nathaniel Witherell, employee is
required to submit to a criminal history and patient abuse background search pursuant to
the requirements of Connecticut General Statutes Section 19a-491c (LPN, CNA, Dietary,
Laundry, Housekeeping, and Maintenance).
Greenwich Municipal Employees Association (GMEA), 2016–2019, page 34 A: Whenever the
Town intends to fill a permanent full-time vacant or new position in the bargaining unit, it shall
post the opening for at least 14 calendar days for permanent full-time positions and for seven
calendar days for permanent part-time positions. During this time, any employee wishing to be
considered must notify the Town according to the posting (clerical, business office, and
administrative assistant).
Recommendations
Review the union agreements thoroughly for direct care staff as well as dietary, laundry, and
housekeeping to determine if the length of time involved in the hiring process can be reduced.
Consider changing to a paid time off policy (see example in Appendix J).
Include a provision that allows for renegotiation of the contract when there is a change of
ownership or management of the facility.
A summary of the union agreements is provided next.

Financial and Operating Report for
The Nathaniel Witherell
February 26, 2019 Page 100
Greenwich Municipal Employees Association
Clerical, Business Office, Administrative Assistant
(*please note the standards listed are aggregate of HDG and national best practices, this does not take into account any state or municipality laws that may apply
to Greenwich and would supersede any standard recommendations)
Table 67: Greenwich Municipal Employees Association Agreement Summary
Unusual Requirements Standard*
Employee longevity payments:
10 years: $450/year
15 years: $600/year
20 years: $800/year
Not applicable in best practice
Employees shall be paid at the rate of 1.5 times their regular straight time hourly rate for overtime in excess of their standard 7-hour work day or 35-hour work week. The employee shall not receive overtime compensation when within 48 hours following the day the overtime is worked or the employee is absent due to non-occupational illness or injury (sick leave), in which case the excess time worked shall be paid at the straight time rate.
Overtime (1.5 times their regular rate of pay) for any hours worked over 40 in a week for clerical-type positions
Shift differentials:
Evening shift: $1.25
Night shift: $1.75 Not applicable in best practice
Sick leave:
FTE accrual rate is 1 sick day/month for first nine years,
2 days/month (FTE hired after 7/1/11 receive 1.5 days/month)
beginning in tenth year.
Max accumulation is 180 days.
50% of unused sick leave is paid out upon death or retirement.
FTE may borrow up to 10 days of sick leave if not accumulated.
FTE who accumulates 180 days as of June 30 will receive 1 extra
day of vacation for every 4 days of sick leave above 180 days.
Recommendation and best practice to move all paid leave to a Paid
Time Off (PTO) program

Financial and Operating Report for
The Nathaniel Witherell
February 26, 2019 Page 101
Unusual Requirements Standard*
FTE with less than 180 days of accumulated sick leave that
completes all scheduled work shifts without interruption receives
1.25 days’ vacation for each quarter for a maximum of 5 days
each year. Part-time employees are similar but based on hours
worked.
An employee on approved FMLA to provide childcare for their
newborn or to provide childcare for their new adopted child may
charge up to 10 days of such FMLA to accrued sick leave.
Vacation:
FTE scheduled to 35-hour workweek earns:
First 24 months: 5.833 hours (10/year)
25–60 months: 8.75 hours (15/year)
61+ months: 11.666 hours (20/year)
FTE shall be entitled to carry forward unused vacation from one
fiscal year to next provided that an employee shall not carry
forward more than 175 hours.
Recommendation and best practice to move all paid leave to a Paid
Time Off (PTO) program
The Town of Greenwich shall provide at no cost to the employee a $50,000 term life insurance policy.
Typically at $25,000 for non-management positions
Bereavement leave:
5 consecutive working days for immediate family
3 days for in-laws
Bereavement leave:
3 consecutive working days for immediate family
2 days for others
Retirement:
Contributions for all employees shall be 4% if pensionable
earnings are deducted from the employee’s biweekly check on a
pre-taxed basis.
The employee is vested after 5 years of service.
Eligibility for retirement occurs when the employee age plus years
of service equals 80, or when the employee reaches age 65.
Permanent part-time employees may elect to defer compensation
to a 457 account.
Discretionary match is more typical

Financial and Operating Report for
The Nathaniel Witherell
February 26, 2019 Page 102
Unusual Requirements Standard*
FTE have the right to request and obtain up to 4 days of personal
leave on a prorated basis each contract year.
Recommendation and best practice to move all paid leave to a Paid
Time Off (PTO) program
FTE shall be entitled to reasonable time off without loss of pay not to
exceed 6 hours annually to attend medical appointments
Recommendation and best practice to move all paid leave to a Paid
Time Off (PTO) program

Financial and Operating Report for
The Nathaniel Witherell
February 26, 2019 Page 103
Laborers International Union of North America
Registered Nurse (RN), Nurse Manager, Patient Care Coordinator (PCC), Associate Director of Nursing (ADON)
Table 68: Laborers International Union of North America Agreement Summary
Unusual Requirements Standard
A part-time nurse included within the bargaining unit shall be paid an
hourly rate that is 120% of the established rate for their classification.
(no benefits)
Due to requirements under the Affordable Care Act (ACA), you must
offer benefits to any employee averaging 30 hours per week or more.
You cannot restrict someone from being offered benefits.
Shift differentials:
Weekdays:
Evening shift: $1.80
Night shift: $2.25
Weekends:
Day shift: $1.55
Evening shift: $2.15
Night shift: $2.75
For simplification purposes, it would be best to standardize these.
Most entities have moved away from a Day Shift weekend differential
since weekends are standard in health care.
Additional compensation:
A nurse assigned to perform the duties of an assistant director of
nursing (ADON) is paid an additional $30.00 per shift.
A day shift nurse assigned to perform the functions of both a
patient care coordinator and medication nurse on a unit shall be
paid an additional compensation of $36.00 per shift ($4.50/hour)
A day shift nurse assigned to perform the functions of both the
ADON and PCC receives an additional $48.00 per shift ($6.00 per
hour).
ADON with 4 years’ experience earns $54.10 and the PCC earns
$49.44 per hour.
An RN with 4 years’ experience earns $46.82 per hour plus $6.00
per hour or $52.82 per hour.
Not applicable in best practice
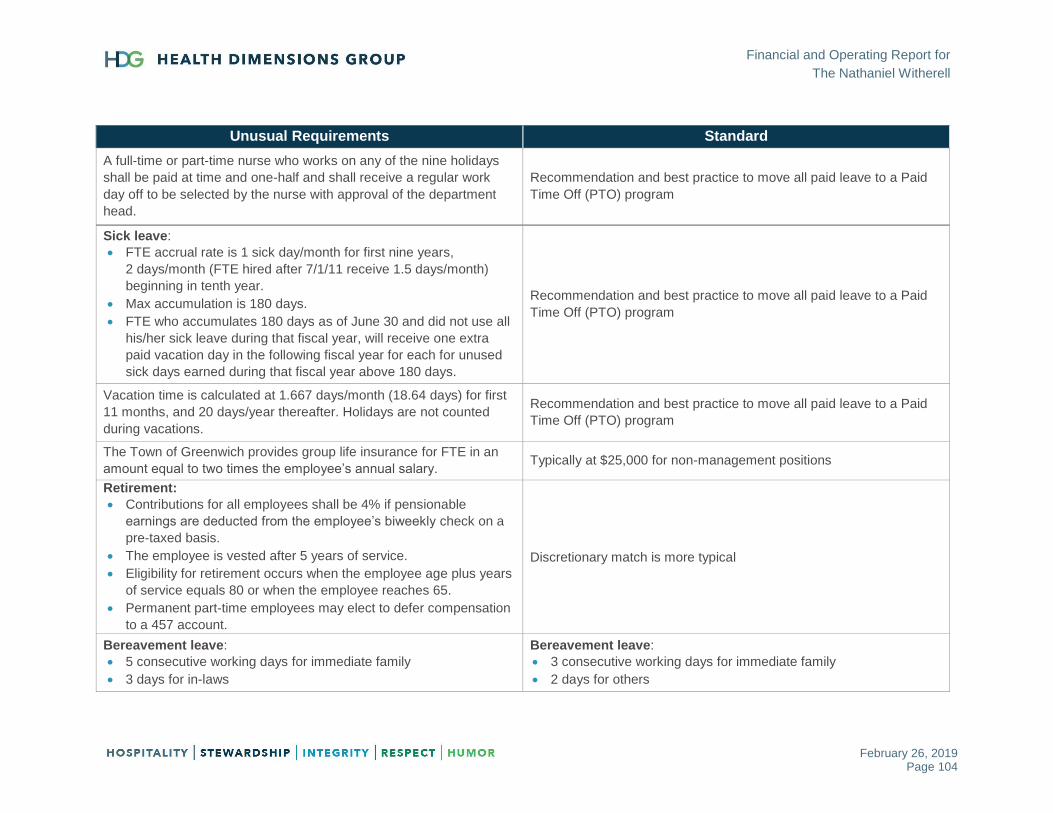
Financial and Operating Report for
The Nathaniel Witherell
February 26, 2019 Page 104
Unusual Requirements Standard
A full-time or part-time nurse who works on any of the nine holidays
shall be paid at time and one-half and shall receive a regular work
day off to be selected by the nurse with approval of the department
head.
Recommendation and best practice to move all paid leave to a Paid
Time Off (PTO) program
Sick leave:
FTE accrual rate is 1 sick day/month for first nine years,
2 days/month (FTE hired after 7/1/11 receive 1.5 days/month)
beginning in tenth year.
Max accumulation is 180 days.
FTE who accumulates 180 days as of June 30 and did not use all
his/her sick leave during that fiscal year, will receive one extra
paid vacation day in the following fiscal year for each for unused
sick days earned during that fiscal year above 180 days.
Recommendation and best practice to move all paid leave to a Paid
Time Off (PTO) program
Vacation time is calculated at 1.667 days/month (18.64 days) for first
11 months, and 20 days/year thereafter. Holidays are not counted
during vacations.
Recommendation and best practice to move all paid leave to a Paid
Time Off (PTO) program
The Town of Greenwich provides group life insurance for FTE in an
amount equal to two times the employee’s annual salary. Typically at $25,000 for non-management positions
Retirement:
Contributions for all employees shall be 4% if pensionable
earnings are deducted from the employee’s biweekly check on a
pre-taxed basis.
The employee is vested after 5 years of service.
Eligibility for retirement occurs when the employee age plus years
of service equals 80 or when the employee reaches 65.
Permanent part-time employees may elect to defer compensation
to a 457 account.
Discretionary match is more typical
Bereavement leave:
5 consecutive working days for immediate family
3 days for in-laws
Bereavement leave:
3 consecutive working days for immediate family
2 days for others

Financial and Operating Report for
The Nathaniel Witherell
February 26, 2019 Page 105
Unusual Requirements Standard
Personal time:
1–24 months: 1 day
24+ months: 4 days annually
Recommendation and best practice to move all paid leave to a Paid
Time Off (PTO) program
Employees may take up to 2 hours with pay to attend doctor
appointments with a maximum of 6 appointments per year.
Recommendation and best practice to move all paid leave to a Paid
Time Off (PTO) program
FTE completing 12 consecutive months of employment is eligible for
a biennial reimbursement of the cost of prescription eyeglasses and
contact lenses not to exceed $350.
Recommendation would be to offer voluntary Vision coverage
Uniform allowance of $250 annually. Typically between $50 and $150 annually
Each nurse is reimbursed for reasonable cost of tuition for
educational courses not to exceed 30 classroom hours in any one
year.
Recommendation to be made on a case-by-case basis based on
need for current or future job
The patient care coordinator shall receive an additional annual
stipend of $3,000 for the responsibility of 24 hours on call duties. Not applicable in best practice
A certified wound care nurse shall receive an annual stipend of
$5,000. Not applicable in best practice

Financial and Operating Report for
The Nathaniel Witherell
February 26, 2019 Page 106
Local #456 International Brotherhood of Teamsters
Licensed Practical Nurse (LPN), Certified Nursing Assistant (CNA), Dietary, Housekeeping, Laundry, Maintenance
Table 69: Local #456 International Brotherhood of Teamsters Agreement Summary
Unusual Requirements Standard
New hires shall have a 6-month probationary period during which they will be paid at 90% of the straight time regular rate of pay for the classification.
Not applicable in best practice
Shift differentials:
Weekdays:
- Evening shift: $1.15
- Night shift: $1.35
Weekends:
- Day shift: $1.25
- Evening shift: $2.65
- Night shift: $3.10
Not applicable in best practice
FTE longevity payments made the first payroll of December:
9+ years: $750
14+ years: $1,000
19+ years: $1,250
Not applicable in best practice
When a licensed LPN works as a charge nurse, he/she shall be paid $15.00 per shift worked. He/She shall also be paid as a charge nurse for holidays, provided that she works as such 5 days before and 5 days after the holiday. He/She shall also be paid as a charge nurse for vacation leave, provided that she has worked as such at least 26 weeks out of the last preceding fiscal year.
Not applicable in best practice
In addition to regular salary, an LPN who works both nursing floors or a floor and the nursing office shall be paid $25.00 per shift.
Not applicable in best practice

Financial and Operating Report for
The Nathaniel Witherell
February 26, 2019 Page 107
Unusual Requirements Standard
Overtime:
Overtime worked on employees’ regularly scheduled day off shall
be paid at 1.5 rate
Double time will be paid for overtime performed on the
employee’s second regularly scheduled day off.
When TNW declares an emergency condition and direct an
employee to work overtime in order to meet its minimum staffing
requirement during the emergency condition, such employee shall
be paid at the time-and-one-half rate for all overtime hours worked
under such emergency condition.
Overtime for LPN and C.N.A.s shall be distributed as equally as
possible among all qualified employees in the same classification.
Overtime (1.5 times) at their regular rate of pay for any hours worked over 40 in a week or 8 / 80 (8 hours in a day or 80 hours in a pay period, whichever is more advantageous for the employee) depending on work class.
Sick leave:
FTE accrual rate is 1 sick day/month for first nine years.
FTE hired on or after 9/23/98 receive 2 days/month beginning in
tenth year.
Max accumulation is 180 days.
Regular part-time employee shall earn .05 hours of sick leave for
each hour the employee is scheduled to work.
At the time of retirement or death, the heirs or estate shall be paid
for unused sick leave at the rate of the employee’s last position.
- 0–74 accrued days: no payment
- 75–150 accrued days: 50%
- 151–180 accrued days: 75%
An employee hired or rehired on or after 9/23/98 shall not be
eligible to receive payment for unused sick leave.
Accumulated sick leave will remain to the credit of an employee
for a period of 1 year after leaving the service of the Town and will
be reinstated if the employee returns to service within that period
of time.
Recommendation and best practice to move all paid leave to a Paid
Time Off (PTO) program

Financial and Operating Report for
The Nathaniel Witherell
February 26, 2019 Page 108
Unusual Requirements Standard
An employee on the active payroll for the entire calendar quarter
shall be eligible to participate in the sick incentive program. If an
employee report and completes all scheduled work shifts during a
calendar quarter shall be credited with 1.25 vacation days for that
quarter. The employee can accumulate up to 5 vacation days
during the year.
A regular part-time employee shall earn 0.05 hours of vacation credit for each hour that the employee is regularly scheduled to work.
Recommendation and best practice to move all paid leave to a Paid Time Off (PTO) program
The Town of Greenwich shall provide at no cost to the employee a
$50,000 term life insurance policy. Typically at $25,000 for non-management positions
Retirement:
Contributions for all employees shall be 5% if pensionable
earnings are deducted from the employee’s biweekly check on a
pre-taxed basis.
The employee is vested after 5 years of service.
Eligibility for retirement occurs when the employee age plus years
of service equals 80, or when the employee reaches age 65.
Permanent part-time employees may elect to defer wages to the
“Savings Plan for Employees of the Town of Greenwich (401-K
only)
Discretionary match is more typical
Bereavement leave:
5 consecutive working days for immediate family
3 days for in-laws
Bereavement leave:
3 consecutive working days for immediate family
2 days for others
FTEs have the right to request up to 1 day of personal leave each contract year and up to 4 days after completion of 2 years continuous employment.
Recommendation and best practice to move all paid leave to a Paid Time Off (PTO) program
An employee is eligible for retirement if the age of the person and the number of years of service is equal to 80.
N/A
The Town shall reimburse an employee for damages sustained, without negligence on the part of the employee, to the employee’s eyeglasses or false teeth during the course of the employee’s employment.
Not applicable in best practice
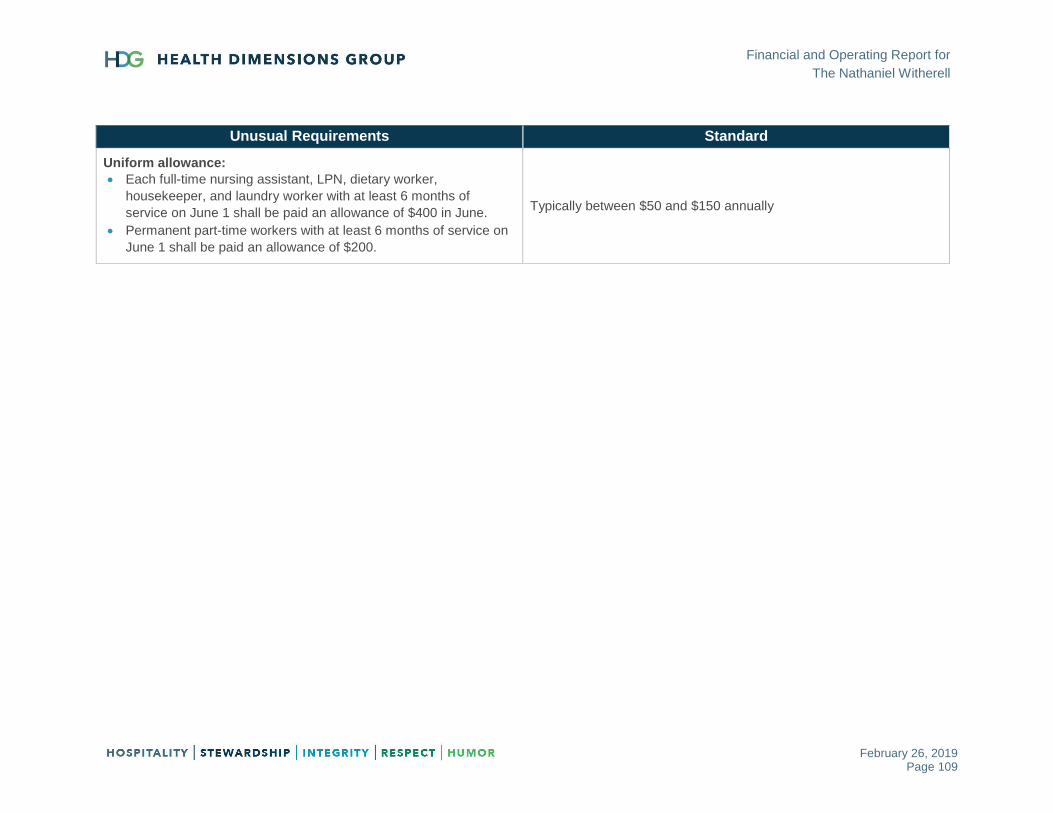
Financial and Operating Report for
The Nathaniel Witherell
February 26, 2019 Page 109
Unusual Requirements Standard
Uniform allowance:
Each full-time nursing assistant, LPN, dietary worker,
housekeeper, and laundry worker with at least 6 months of
service on June 1 shall be paid an allowance of $400 in June.
Permanent part-time workers with at least 6 months of service on
June 1 shall be paid an allowance of $200.
Typically between $50 and $150 annually
Financial and Operating Report for
The Nathaniel Witherell
February 26, 2019 Page 110
CLINICAL ASSESSMENT
The director of nursing (DON) has been in his position for four months, replacing the previous
DON who retired after 15 years in the position and 32 years at TNW. The DON is developing a
rapport with his direct reports and appears to be well organized and innovative. He has eight
years of experience in medical care. During HDG’s interview, the DON stated that TNW has a
provider relationship with Greenwich Hospital, Stamford Hospital, and Hospital for Special
Surgery, with identified clinical pathways for the following clinical programs:
Congestive heart failure/Cardiac care
Chronic obstructive pulmonary disease (COPD)/Respiratory care
Infectious disease
Orthopedic care
End-stage renal disease
Stroke and neurological care
Tracheostomy care and wound care
HDG recommends the following:
Develop the DON as TNW’s clinical leader with a focus on gaining insight into the changing
landscape of health care, such as clinical integration of care, bundled payments, shared risk,
Mega Rule, Patient-Driven Payment Model (PDPM), etc.
Consider enrolling in a director of nursing training program such as those offered by
LeadingAge.
Rounding Observations
During rounds of the facility, the HDG consultant observed the following:
Long-term care area was in the process of hallway renovations
Residents appeared clean and well cared for
Call lights were answered in a timely manner
Dining experience on the rehab unit was noted to be a person-centered approach
On dementia floor, residents were engaged in activities
Staff were pleasant and smiling
Supply Management Analysis
The associate director of nursing (ADON) is responsible for supply management within the
facility and ordering of all supplies for the supply room. The medication rooms on each nursing

Financial and Operating Report for
The Nathaniel Witherell
February 26, 2019 Page 111
unit are stocked with a limited amount of supplies due to storage issues. A CNA delivers
supplies to resident rooms three times per week, and a driver takes supplies to the floors. The
charge nurses can assist with the supplies, if needed.
The wound specialist works with vendors and physicians regarding wound care products and
recommends supplies to be ordered for wound care.
TNW lacks par levels or a system for tracking supplies. Staff are unable to determine usage,
and supplies are not charged out to each unit or to residents as ordered. Monitoring and /or
management of non-chargeable supplies such as incontinence briefs, denture cups, etc. is
lacking. The ADON stated that TNW does not bill any of the supplies, there is not a tracking
method for supplies, and they do not utilize a third-party biller for supplies such as tube feeding.
They are unaware of a defined supply budget.
Recommendations
Complete in-depth supply management review that includes ordering of supplies, supply
storage on and off units, control of access to supplies, inventory management, and supply
contracts.
Establish par levels for nursing supplies on each unit and the supply room.
Establish nursing supply budgets and assign accountability for management to nursing
leadership.
Consider utilizing an electronic purchase order system; ensure interface with current software.
Continue participating in group purchasing organizations (GPOs) such as Premier/Innovatix
GPO.
Pharmacy Services Analysis
Omnicare provides pharmacy services for TNW. The DON is new to the position, so the ADON
is assisting with pharmacy oversight. The DON provided HDG with TNW’s August 2018
pharmacy consultation reports, which included a list of residents reviewed, quality improvement
report, and summary of pharmacy consultant services. The report is signed by the consultant
pharmacist and medical director. The administrator and DON have not signed the pharmacy
consultant report for the period August 1–31, 2018.
HDG recommends the new DON receive training in the following areas related to long-term care
pharmacy services:
Facility formulary
Non-covered medication rules and preauthorizations
Return medication policy
House stock
Dispensing, delivery, emergency kits, intravenous (IV) needs
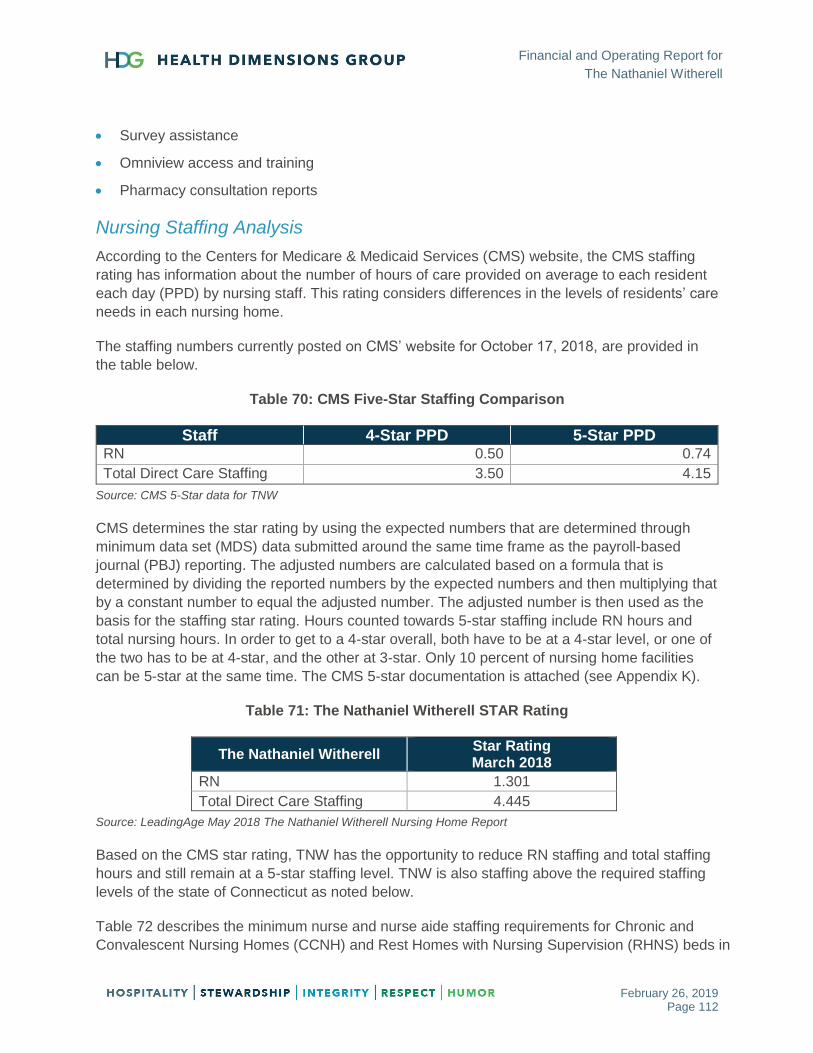
Financial and Operating Report for
The Nathaniel Witherell
February 26, 2019 Page 112
Survey assistance
Omniview access and training
Pharmacy consultation reports
Nursing Staffing Analysis
According to the Centers for Medicare & Medicaid Services (CMS) website, the CMS staffing
rating has information about the number of hours of care provided on average to each resident
each day (PPD) by nursing staff. This rating considers differences in the levels of residents’ care
needs in each nursing home.
The staffing numbers currently posted on CMS’ website for October 17, 2018, are provided in
the table below.
Table 70: CMS Five-Star Staffing Comparison
Staff 4-Star PPD 5-Star PPD RN 0.50 0.74
Total Direct Care Staffing 3.50 4.15
Source: CMS 5-Star data for TNW
CMS determines the star rating by using the expected numbers that are determined through
minimum data set (MDS) data submitted around the same time frame as the payroll-based
journal (PBJ) reporting. The adjusted numbers are calculated based on a formula that is
determined by dividing the reported numbers by the expected numbers and then multiplying that
by a constant number to equal the adjusted number. The adjusted number is then used as the
basis for the staffing star rating. Hours counted towards 5-star staffing include RN hours and
total nursing hours. In order to get to a 4-star overall, both have to be at a 4-star level, or one of
the two has to be at 4-star, and the other at 3-star. Only 10 percent of nursing home facilities
can be 5-star at the same time. The CMS 5-star documentation is attached (see Appendix K).
Table 71: The Nathaniel Witherell STAR Rating
The Nathaniel Witherell Star Rating March 2018
RN 1.301
Total Direct Care Staffing 4.445
Source: LeadingAge May 2018 The Nathaniel Witherell Nursing Home Report
Based on the CMS star rating, TNW has the opportunity to reduce RN staffing and total staffing
hours and still remain at a 5-star staffing level. TNW is also staffing above the required staffing
levels of the state of Connecticut as noted below.
Table 72 describes the minimum nurse and nurse aide staffing requirements for Chronic and
Convalescent Nursing Homes (CCNH) and Rest Homes with Nursing Supervision (RHNS) beds in
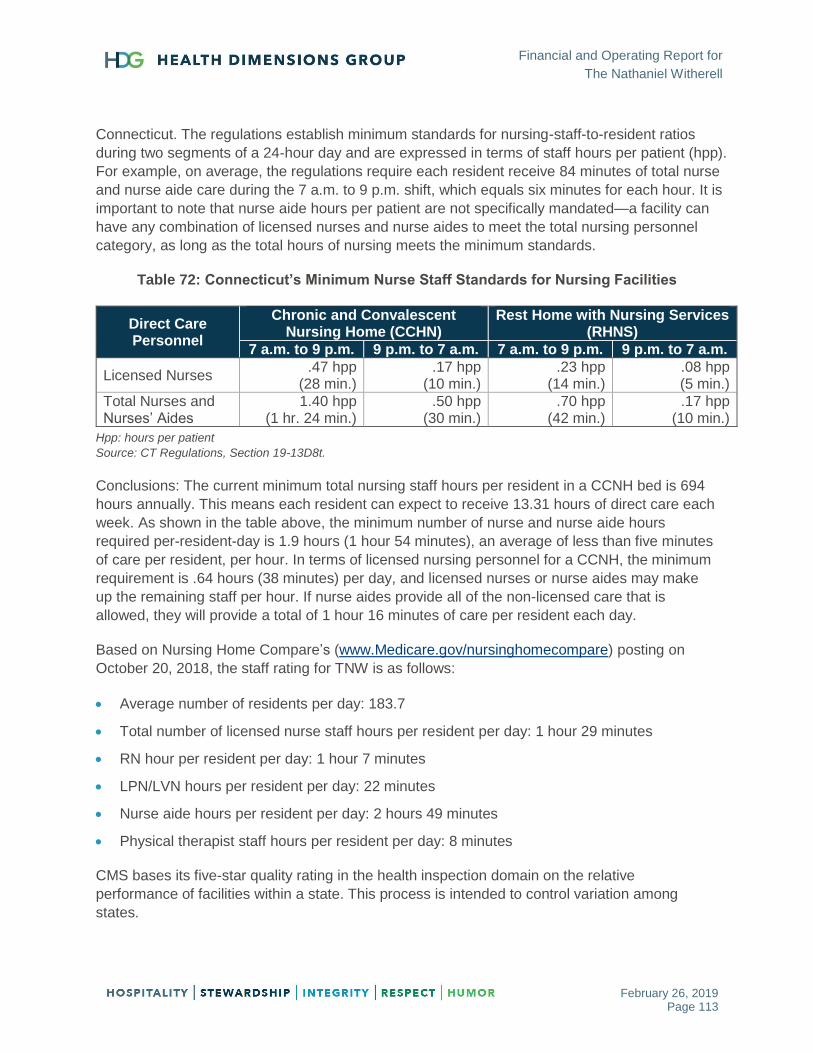
Financial and Operating Report for
The Nathaniel Witherell
February 26, 2019 Page 113
Connecticut. The regulations establish minimum standards for nursing-staff-to-resident ratios
during two segments of a 24-hour day and are expressed in terms of staff hours per patient (hpp).
For example, on average, the regulations require each resident receive 84 minutes of total nurse
and nurse aide care during the 7 a.m. to 9 p.m. shift, which equals six minutes for each hour. It is
important to note that nurse aide hours per patient are not specifically mandated—a facility can
have any combination of licensed nurses and nurse aides to meet the total nursing personnel
category, as long as the total hours of nursing meets the minimum standards.
Table 72: Connecticut’s Minimum Nurse Staff Standards for Nursing Facilities
Direct Care Personnel
Chronic and Convalescent Nursing Home (CCHN)
Rest Home with Nursing Services (RHNS)
7 a.m. to 9 p.m. 9 p.m. to 7 a.m. 7 a.m. to 9 p.m. 9 p.m. to 7 a.m.
Licensed Nurses .47 hpp
(28 min.) .17 hpp
(10 min.) .23 hpp
(14 min.) .08 hpp (5 min.)
Total Nurses and Nurses’ Aides
1.40 hpp (1 hr. 24 min.)
.50 hpp (30 min.)
.70 hpp (42 min.)
.17 hpp (10 min.)
Hpp: hours per patient
Source: CT Regulations, Section 19-13D8t.
Conclusions: The current minimum total nursing staff hours per resident in a CCNH bed is 694
hours annually. This means each resident can expect to receive 13.31 hours of direct care each
week. As shown in the table above, the minimum number of nurse and nurse aide hours
required per-resident-day is 1.9 hours (1 hour 54 minutes), an average of less than five minutes
of care per resident, per hour. In terms of licensed nursing personnel for a CCNH, the minimum
requirement is .64 hours (38 minutes) per day, and licensed nurses or nurse aides may make
up the remaining staff per hour. If nurse aides provide all of the non-licensed care that is
allowed, they will provide a total of 1 hour 16 minutes of care per resident each day.
Based on Nursing Home Compare’s (www.Medicare.gov/nursinghomecompare) posting on
October 20, 2018, the staff rating for TNW is as follows:
Average number of residents per day: 183.7
Total number of licensed nurse staff hours per resident per day: 1 hour 29 minutes
RN hour per resident per day: 1 hour 7 minutes
LPN/LVN hours per resident per day: 22 minutes
Nurse aide hours per resident per day: 2 hours 49 minutes
Physical therapist staff hours per resident per day: 8 minutes
CMS bases its five-star quality rating in the health inspection domain on the relative
performance of facilities within a state. This process is intended to control variation among
states.
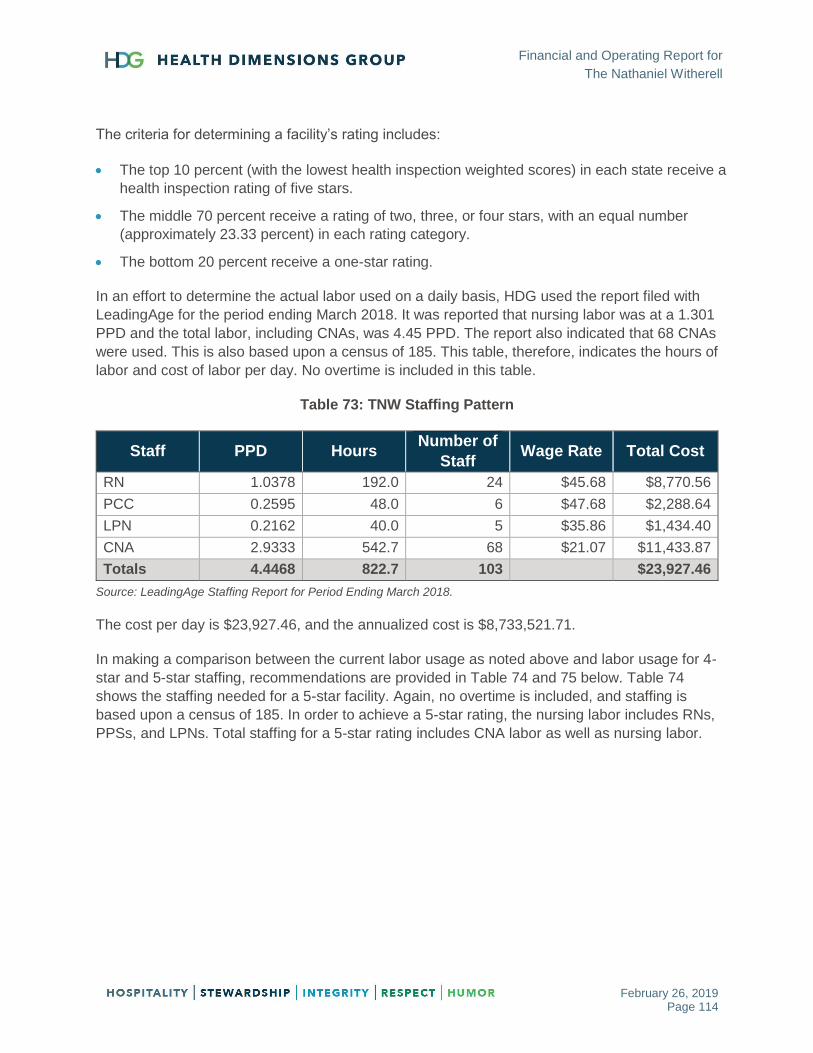
Financial and Operating Report for
The Nathaniel Witherell
February 26, 2019 Page 114
The criteria for determining a facility’s rating includes:
The top 10 percent (with the lowest health inspection weighted scores) in each state receive a
health inspection rating of five stars.
The middle 70 percent receive a rating of two, three, or four stars, with an equal number
(approximately 23.33 percent) in each rating category.
The bottom 20 percent receive a one-star rating.
In an effort to determine the actual labor used on a daily basis, HDG used the report filed with
LeadingAge for the period ending March 2018. It was reported that nursing labor was at a 1.301
PPD and the total labor, including CNAs, was 4.45 PPD. The report also indicated that 68 CNAs
were used. This is also based upon a census of 185. This table, therefore, indicates the hours of
labor and cost of labor per day. No overtime is included in this table.
Table 73: TNW Staffing Pattern
Staff PPD Hours Number of
Staff Wage Rate Total Cost
RN 1.0378 192.0 24 $45.68 $8,770.56
PCC 0.2595 48.0 6 $47.68 $2,288.64
LPN 0.2162 40.0 5 $35.86 $1,434.40
CNA 2.9333 542.7 68 $21.07 $11,433.87
Totals 4.4468 822.7 103 $23,927.46
Source: LeadingAge Staffing Report for Period Ending March 2018.
The cost per day is $23,927.46, and the annualized cost is $8,733,521.71.
In making a comparison between the current labor usage as noted above and labor usage for 4-
star and 5-star staffing, recommendations are provided in Table 74 and 75 below. Table 74
shows the staffing needed for a 5-star facility. Again, no overtime is included, and staffing is
based upon a census of 185. In order to achieve a 5-star rating, the nursing labor includes RNs,
PPSs, and LPNs. Total staffing for a 5-star rating includes CNA labor as well as nursing labor.

Financial and Operating Report for
The Nathaniel Witherell
February 26, 2019 Page 115
Table 74: Staffing Levels for a 5-Star Rating
Staff PPD Hours Number of
Staff Wage Rate Total Cost
RN .7351 136.0 17 $45.68 $6,212.48
PCC .2594 48.0 6 $47.68 $2,288.64
LPN .1297 24.0 3 $35.86 $860.64
CNA 3.0270 560.0 70 $21.07 $11,799.20
Totals 4.1513 768.0 96 $21,160.96
Source: LeadingAge Staffing Report for Period Ending March 2018.
The cost per day for a facility rated at 5-stars for staffing is $21,160.96, and the annualized cost
is $7,723,750.40.
The 4-star staffing rating requires the staffing of RNs, PCCs, and LPNs at a 0.50 PPD and a
total minimum staffing, including CNAs, of 3.50 PPD. No overtime is included, and the staffing is
based on a census of 185 residents.
Table 75: Staffing Levels for a 4-Star Rating
Staff PPD Hours Number of
Staff Wage Rate Total Cost
RN .4324 80 11 $45.68 $3,654.40
PCC .2594 48 6 $47.68 $2,288.64
LPN .3891 72 9 $35.86 $2,581.92
CNA 2.4216 448 56 $21.07 $9,439.36
Totals 3.5027 648 82 $17,964.32
Source: LeadingAge Staffing Report for Period Ending March 2018.
The cost per day for a facility rated at 4-stars for staffing is $17,964.32, and the annualized cost
is $6,556,976.80.
Financial and Operating Report for
The Nathaniel Witherell
February 26, 2019 Page 116
CLINICAL REIMBURSEMENT ASSESSMENT
HDG conducted an onsite clinical reimbursement assessment of The Nathaniel Witherell, to
determine regulatory compliance and opportunities for financial and operational improvement.
The assessment also focused on critical elements related to existing resource utilization group
(RUG) requirements, including:
RAI/Clinical reimbursement assessment for Medicare and Medicaid, case mix, activities of
daily living (ADLs) reimbursement/documentation.
Managed care contract review.
Audit of random sample of Medicare claims from current year-to-date and one year prior.
Assessment of processes and systems with respect to Medicare compliance.
Staff interview on processes and understanding of those processes.
Evaluation of internal changes made for capturing data proper coding.
Review of physician certification documentation, or substitute documentation, for compliance.
Chart review for documentation with respect to RUG internal audits completed with fiscal
evaluation of coding.
As part of the on-site and off-site clinical assessment, HDG conducted interviews, attended
meetings, met one-on-one with MDS completers, and reviewed medical records. Our
observations and recommendations are provided next.
Medicare Meetings
HDG participated in the Medicare meeting, which was attended by the rehab coordinator, MDS
coordinator, social services, business office manager, DON, ADON, executive director, and
nurse managers. The group had a good discussion surrounding therapy and clinical updates. A
worksheet is used for the Medicare meeting, although it does not contain any information
regarding assessment reference dates (ARDs) or resource utilization groups (RUGs), and there
was no active discussion regarding same. Discharge was addressed only if it was upcoming,
although an estimate is listed on the worksheet. The Medicare worksheet is updated by the
therapy manager.
HDG recommends the following:
Include discussion regarding ARD and RUGs along with entering data on Medicare tracking
worksheet.
Ensure ongoing discussion regarding discharge and care conference scheduling.

Financial and Operating Report for
The Nathaniel Witherell
February 26, 2019 Page 117
Minimum Data Set (MDS) Process
HDG conducted interviews with staff members who are responsible for completing sections of
the MDS. Findings included the following:
No pre-screening RUG-based tool is utilized in the pre-admission process.
Certification and recertification processes are completed by ADON and Medical records staff.
Assessments are opened on the day of admission except for late-afternoon admissions, which
are opened on the next business day.
Therapy screens are completed consistently along with MDS, utilizing the scheduler in Matrix.
MDS department consists of two full-time MDS coordinators (MDSCs), one short-term and
one long-term, and two part-time MDS completers who each work two days a week.
Social services completes sections D and Q, dietary completes section K, activities completes
section F (activity preferences), therapy completes section O (therapy minutes), and MDSC
completes all other sections, including the remainder of sections F and O.
Care area assessment (CAA) summary is completed by social services for triggered
areas.
Social services does not have care plan responsibilities, care plans are written by
nursing.
Activities writes CAA and associated care plans.
MDSCs organize scheduling, complete all care plans and care plan meetings, and insurance
updates. MDS completers complete MDS coding and CAAs.
Per MDS department, the weakest area needing further development is section GG.
HDG recommends the following:
Social services take a more active role in care planning.
Dietary should not complete sections until after assessment reference date (ARD); if data is
entered prior to end of observation period, double-check information after ARD and sign at
that time.
Re-evaluation of sections to be completed by discipline; HDG recommends that social
services complete sections C, D, and Q, and that activities complete entire section F.
Begin working on Patient-Driven Payment Method (PDPM) preparation: section GG coding
and ICD-10 coding.

Financial and Operating Report for
The Nathaniel Witherell
February 26, 2019 Page 118
Minimum Data Set (MDS) Submission and Validation
HDG reviewed the MDS submission and validation process and noted the following:
Sharon in the nursing office submits and maintains validation reports.
Submissions are generally weekly, no specific day of the week.
Some warnings noted on multiple uploads for late assessment, completion, and submission.
Inconsistent warnings are relayed back to MDS department, but staff are not always aware of
late assessments.
HDG recommends the following:
MDS department should assume ownership of submissions and validation reports.
Investigate use of “Simple LTC” for management of submissions and quality measure data.
Tighten up dates for completion and submission of MDS. Double-check date for ARD to
prevent any late assessment dates.
Please see Appendix L for copies of MDS forms which were also left with staff at the time of the assessment.

Financial and Operating Report for
The Nathaniel Witherell
February 26, 2019 Page 119
THERAPY ASSESSMENT
HDG conducted an assessment of the therapy department and therapy process. Select Therapy
is the contract provider for therapy services at TNW. A typical caseload for Medicare Part A is
mid 20’s, for Medicare Part B is 25–30 per week, and for outpatient is four per day. The shortest
length of stay is usually for joint replacements, especially those managed by bundled payment.
The therapy director attends the morning meeting, the Medicare meeting, the care plan meeting
(if on caseload), the weekly falls meeting, and the monthly safety meeting. HDG noted the
following:
Benchmark is 90 percent for therapy assistants and 85 percent for therapist
Therapy is not normally a part of admissions and marketing, unless a visitor desires to meet
with therapy director during tour.
Therapy is consistently provided seven days per week for ortho and six days per week for
others.
Therapy has daily discussion with MDS regarding ARD and RUGs.
CASPER reporting is utilized for possible Medicare Part B.
Day 8 is consistently used to set five-day ARD.
Per-diem therapists are available for vacations and sick time.
General Recommendations
Investigate use of day 7 for 5-day assessment reference date (ARD). With use of day 8, TNW
loses day 1 for ADL coding purposes. Selection of ARD should be on a per-resident basis rather
than dictated by policy.
Medical Records and MDS Review
HDG conducted a medical records and MDS review, and noted the following:
All certifications and recertification of reviewed records are accounted for.
Interviews are not consistently completed in observation time frame.
Toileting programs marked on MDS without care plans in place.
Restorative programs marked on MDS without programs identified and/or not care planned
accordingly; no progress notes.
Most Medicare daily skilled notes are not supportive of daily skill provided.
Even though sections G and GG are scored independent of each other, there does need to be
some correlation between the two
Section G states wheelchair, section GG states no wheelchair
Total dependence in transfers in section G, transfers in GG are listed with max assist.
Financial and Operating Report for
The Nathaniel Witherell
February 26, 2019 Page 120
Recommendations
Ensure all interviews are conducted in observation period, entered into MDS, and signed-off
as support of interview conducted in look-back; otherwise, questions must be dashed.
Toileting and restorative programming must follow the RAI requirement; refer to the RAI
Manual, Chapter 3, Sections H and O for specifics.
Nurse managers to review a percentage of documentation daily to ensure all skilled resident
documentation is being reviewed during the course of a week and is supportive of skilled
services provided. MDS to verify documentation is reviewed during observation period and
MDS completion.
Patient-Driven Payment Model (PDPM)
Patient-Driven Payment Model (PDPM) is scheduled to go into effect October 1, 2019, for fiscal
year 2020. The payment model eliminates payment based on services delivered in favor of
resident classifications and anticipated resource needs during the course of a patient’s stay.
The following summarizes anticipated PDPM payments versus RUG-IV payments for TNW.
Centers for Medicare & Medicaid Services (CMS) estimated fiscal year 2017 (FY17)
differences between actual RUG-IV payments and estimated PDPM payments for TNW. CMS
estimated that TNW would have been paid $183,166 less under PDPM than RUG-IV,
indicating a significant loss.
CMS reported estimated differences for 211 Connecticut skilled nursing facilities (SNFs).
Overall, the 211 SNFs would have lost an accumulative $108,313 in the conversion, which
was an average of negative $513.
TNW had an estimated loss ($183,166) significantly higher than the state average ($513) and,
actually, had the 26th largest loss in the entire state.
PDPM versus RUGs comparison (actual example from randomly selected TNW chart audit)
Nursing
o HC1: $446.97 (daily rate STINRC received under RUG-IV [current payment system])
o PDPM: $738.70 days 1–3, $588.84 days 4–20 (comparable rate STINRC would
receive under PDPM; listed below is a breakdown for the five-day MDS):
PT component: $84.25 TJ
OT component: $79.53 TJ
ST component: $51.61 SE
NTA component: $74.93 NE
Nursing component: $205.89 HDE1
Non-case mix: $92.63

Financial and Operating Report for
The Nathaniel Witherell
February 26, 2019 Page 121
Therapy
o Rehab Ultra-C (RUC): $744.17 (daily rate STINRC received under RUG-IV [current
payment system]).
o PDPM: $660.75 days 1–3, $510.91 days 4–20 (comparable rate STINRC would
receive under PDPM; listed below is the breakdown for five-day MDS):
PT component: $99.08 TG
OT component: $90.58 TG
ST component: $15.06 SA
NTA component: $74.92 NE
Nursing component: $138.64 CBC1
Non-case mix: $92.63
Comparison of RUGs versus PDPM payments:
Five-day PPS assessment scoring HC1 and RUC, under the current payment model of
RUG-IV; specifics of these assessments were then translated into the proposed
payment model of PDPM.
Daily rate for PDPM is increased for the first three days due to the NTA component
being tripled; daily rate for days 4–20 is then the rate totaling up all the individual
components.
Non-therapeutic ancillary component is basically comprised of clinical services provided,
along with comorbidity conditions.
In both scenarios, the nursing component is significantly higher than the therapy
component; this reinforces the idea that the clinical drivers for the resident are far more
important than the therapy drivers.
Recommendations for Transition to PDPM
TNW should continue preparing in earnest for PDPM to create a smooth transition for a
therapy-driven RUGs model to a clinical-driven payment model.
It is imperative that the community own the clinical oversight of skilled services with the onset
of PDPM.
Emphasis will no longer be on therapy services as the revenue driver—they will become
an expense instead.
Majority of the new levels of clinical payment are driven by nursing skills.
Therapy will be a component of the payment, but a much smaller element.
Length of stay, when driven by therapy, will decrease by 2 percent starting on Day 20
within the therapy component of the payment.
Skilled levels cannot be assessed by non-nurses.

Financial and Operating Report for
The Nathaniel Witherell
February 26, 2019 Page 122
Consider partnering with Select Rehab for education to the nursing department as well as
appropriate role for the therapists within the new structure; majority will need to be driven by
nursing.
Recommendations for Improving Medical Management
PDPM success is more than just increasing medical management—ensure that STINRC is
providing the necessary amount of therapy for diagnosis, based on the evaluation and
individual resident needs (not just ultra-high rehab).
Conduct preadmission review of the clinical picture using nursing-based levels as well as non-
therapeutic ancillary specifics to drive admission choices; e.g., chronic conditions, residents
with multiple comorbidities, and special treatments (trach, suctioning, transfusions, and
radiation therapy).
Provide nursing department education in order to accept residents who are more clinically-
driven versus therapy-driven; e.g., IV therapy, wound management.
Partner with a consulting firm for PDPM readiness and implementation.

Financial and Operating Report for
The Nathaniel Witherell
February 26, 2019 Page 123
VALUE-BASED MARKET DYNAMICS
Across the country, there has been explosive growth in value-based payment models (also
referred to by Medicare as Alternative Payment Models, or APMs), whose goal is to promote
lower costs and improve quality directly through payment policy. The two key APMs in the
Medicare program are accountable care organizations (ACOs) and the Bundled Payments for
Care Improvement Advanced (BPCI-A).
ACOs are population-based models, usually sponsored by health systems or physician group
practices, which have a Medicare spending target for a population of beneficiaries (usually
greater than 5,000) attributed to the ACO based on beneficiary utilization patterns of ACO
participating physicians. From a risk perspective, these models can either be upside-only or
two-sided risk (incorporating both upside gains and downside risk).
Nether of the two primary referring hospitals appears to be a participant in the Medicare ACO
program (known as Medicare Shared Savings Program, or MSSP).
The Bundled Payment for Care Improvement Advanced (BPCI-A) program is an episodic
payment model wherein participating hospitals or physician group practices are given a target
based on an episode of care for certain diagnostic categories (based on the hospital or
outpatient discharge which starts the episode). This program is a two-sided risk model, which
means that BPCI-A conveners (risk-taking hospitals or physician groups) face downside risk
and may seek to adjust their downstream participating providers’ behavior in rapid fashion in
order to meet targets and avoid financial penalties.
The current iteration of the BPCI-A program was initiated on October 1, 2018. Both Greenwich
and Stamford Hospitals have elected to participate in this program for at least the first six-
month trial period (after which they can drop some or all of their clinical categories without
risk). There are also some physician groups (see Table 1A in Appendix A) that are
participating in your area.
If the hospitals or physician groups elect to move forward after the six-month BPCI-A trail
period, they are accepting risk on all qualifying episodes from October 1, 2018, until December
31, 2019. As such, the scope and magnitude of this program will be clarified by 2Q 2019.
Regardless of the outcome of the BPCI-A trail period decision-making, it is safe to conclude that
there will likely be continued pressure on length of stay, 30-day readmission rates, and post-
SNF discharge management as a result of the need to lower costs and improve quality. This will
be true for Medicare fee-for-service, Medicare Advantage, and Medicaid programs, as well as
commercial payors. The tables and appendices that follow describe the value-based
characteristics of the referring hospital profiles in more detail.
Financial and Operating Report for
The Nathaniel Witherell
February 26, 2019 Page 124
Hospital Profiles
The two leading acute referrers to TNW are Greenwich Hospital and Stamford Hospital. Both
hospitals are short-term acute care hospitals. The following should be noted:
The two hospitals have a similar case mix index (CMI).
Greenwich Hospital has an affiliated accountable care organization (ACO), while Stamford
Hospital does not.
Greenwich Hospital received a positive financial incentive as part of value-based purchasing,
while Stamford Hospital did not.
Medicare spending per patient was similar between the two hospitals.
Stamford Hospital had a much higher Medicaid payor mix than Greenwich Hospital.
A detailed table showing additional information regarding the two hospitals can be found in
Appendix C, also referred to earlier in this report.
Payor Profiles
Connecticut has multiple financial assistance program options, including Medicare Savings Plan
(MSP) and Husky C.
Medicare Savings Plan
The State of Connecticut provides financial assistance to eligible Medicare enrollees through
the Medicare Savings Plan (MSP). Qualified individuals can receive assistance by having the
Department of Social Services (DSS) pay the Medicare Part B premium each month. Some
enrollees will also receive Medicare deductible and co-insurance coverage. The MSP is funded
by Medicaid.
Husky C
Husky C is the Medicaid option for the senior population, blind, and/or disabled individuals who
receive Medicaid benefits. Waivers include under Husky C include:
Connecticut Home Care Community-Based Case-Managed Waiver
Connecticut Home Care Self-Directed Waiver
Autism Waiver
Personal Care Assistant Waiver
Assisted Living Waiver
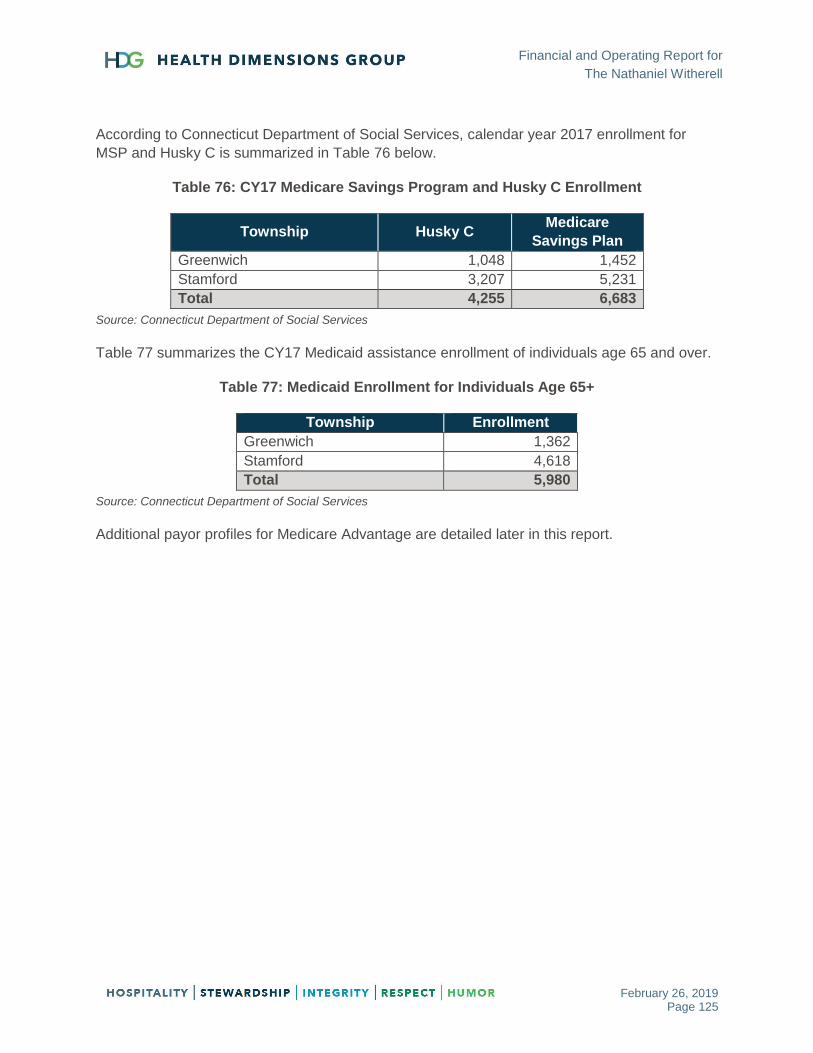
Financial and Operating Report for
The Nathaniel Witherell
February 26, 2019 Page 125
According to Connecticut Department of Social Services, calendar year 2017 enrollment for
MSP and Husky C is summarized in Table 76 below.
Table 76: CY17 Medicare Savings Program and Husky C Enrollment
Township Husky C Medicare
Savings Plan
Greenwich 1,048 1,452
Stamford 3,207 5,231
Total 4,255 6,683
Source: Connecticut Department of Social Services
Table 77 summarizes the CY17 Medicaid assistance enrollment of individuals age 65 and over.
Table 77: Medicaid Enrollment for Individuals Age 65+
Township Enrollment
Greenwich 1,362
Stamford 4,618
Total 5,980
Source: Connecticut Department of Social Services
Additional payor profiles for Medicare Advantage are detailed later in this report.