Embed Size (px)
Citation preview
Financial andFinancial andCost-Volume-Profit ModelsCost-Volume-Profit Models
Chapter 12Chapter 12

Financial ModelingQuantitative simulation of relations among
various factors
Allows the organization to assess “what if” scenarios to support
Decision making
Forecasting

Cost-Volume-Profit ModelsIllustrates the relationship between sales
volume, costs and revenues
Based on variable (direct) costing
Sales – variable costs = contribution margin
Each additional unit sold “contributes” that amount to the bottom line
Breakeven point is reached when total contribution equals total fixed costs
Cost-Volume-Profit Models
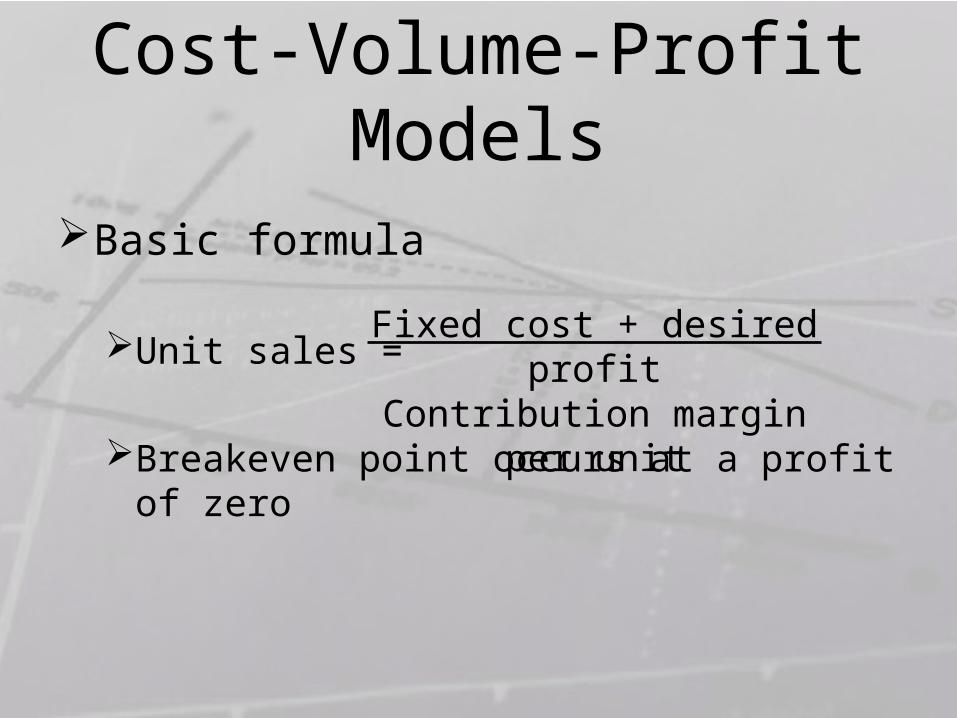
Basic formula
Unit sales =
Breakeven point occurs at a profit of zero
Fixed cost + desired profitContribution margin per unit
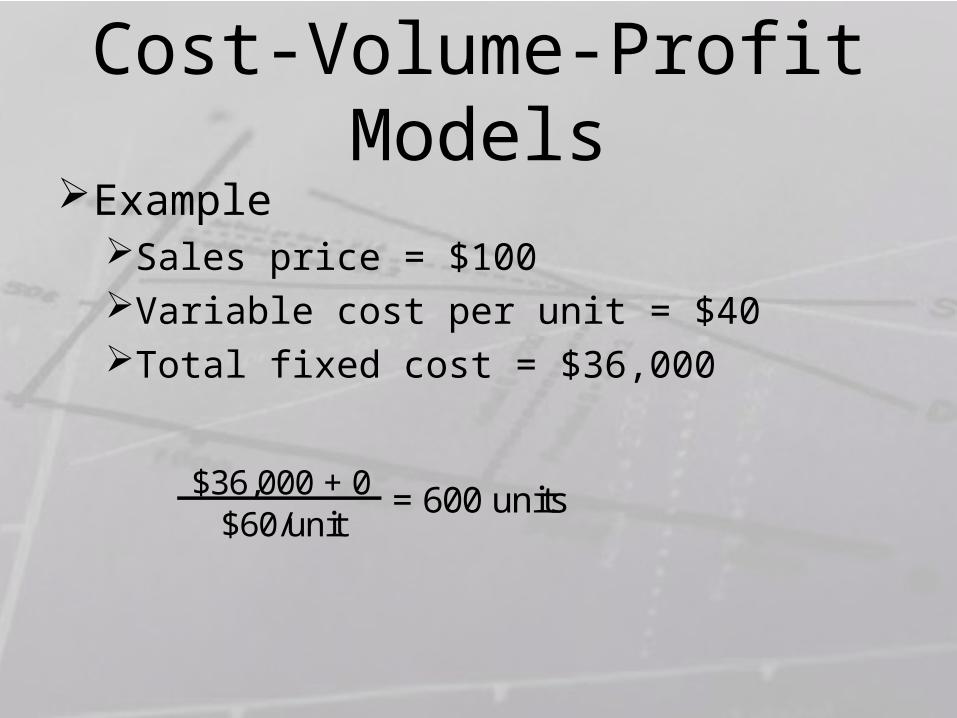
Cost-Volume-Profit ModelsExample
Sales price = $100Variable cost per unit = $40Total fixed cost = $36,000
= 600 units$36,000 + 0$60/unit

$0
$20,000
$40,000
$60,000
$80,000
$100,000
$120,000
$140,000
$160,000
$180,000
010
020
030
040
050
060
070
080
090
01,
000
1,10
01,
200
1,30
01,
400
1,50
01,
600
Unit sales
Re
ve
nu
e a
nd
co
sts
Fixed cost Total cost Revenue
Variable cost
Profit
Loss
Breakevenpoint
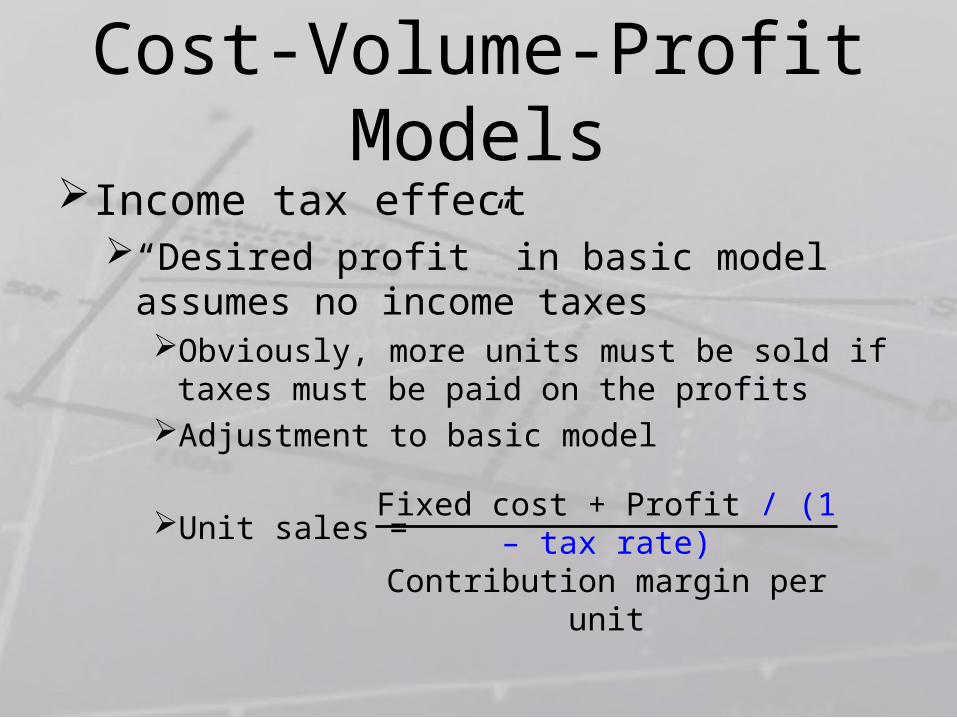
Cost-Volume-Profit ModelsIncome tax effect
“Desired profit” in basic model assumes no income taxesObviously, more units must be sold if taxes must
be paid on the profitsAdjustment to basic model
Unit sales = Fixed cost + Profit / (1 – tax rate)
Contribution margin per unit
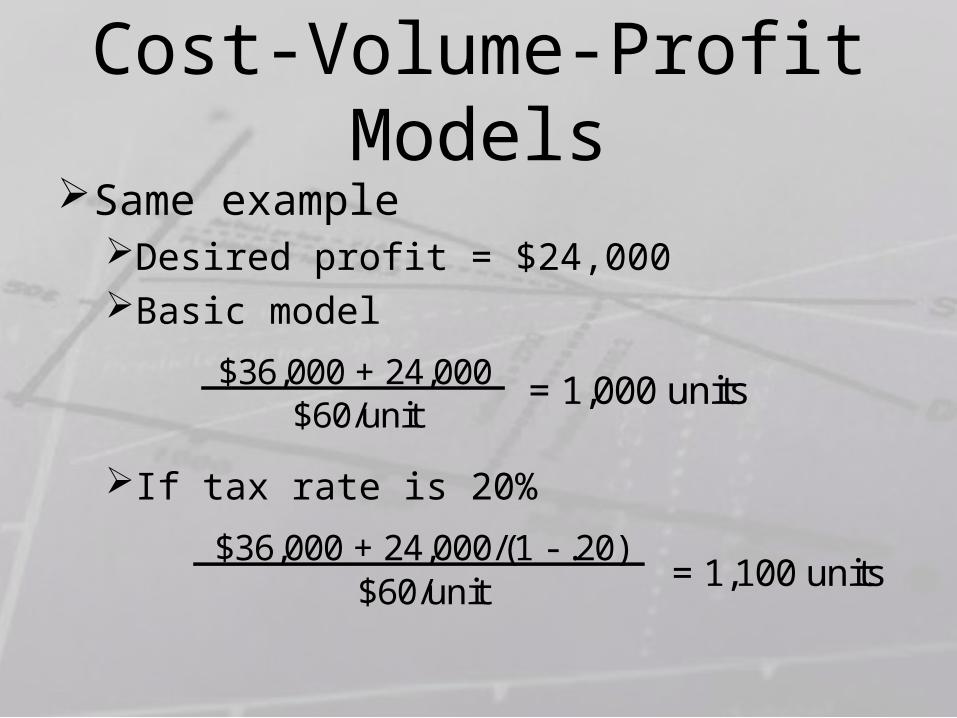
Cost-Volume-Profit ModelsSame example
Desired profit = $24,000Basic model
If tax rate is 20%
$36,000 + 24,000$60/unit
= 1,000 units
$36,000 + 24,000/(1 - .20)$60/unit = 1,100 units
Cost-Volume-Profit ModelsContribution margin can be used to make
scarce resource allocation decisions
Goal is to maximize the amount of income that can be generated
How to best use the scarce resource?
Determine the contribution per unit of the scarce resource
Can only consider one resource at a time

Product A Product B Product C Product DSales price 100$ 210$ 380$ 450$ Variable cost/unit 72 90 200 210 Contribution margin 28$ 120$ 180$ 240$ Units of scarce resources required for each unit of product 2 5 6 12 Contribution margin per unit of scarce resource 14$ 24$ 30$ 20$
What is the best use of 300 units of the resource?

Cost-Volume-Profit ModelsMultiple product situations
Basic model assumes only one productMultiple product situation replaces the
contribution margin per unit with the weighted average contribution marginBased on the normal relative sales volumes of the
products
Resulting “units to sell” is then divided among the products in their original proportions

Cost-Volume-Profit ModelsExample
ProductSelling price
Var.cost per unit
CM per unit
Relative sales
Weighted CM per unit
Folders 1.00$ 0.40$ 0.60$ 60% 0.36$ Binders 5.00 2.20 2.80 30% 0.84 Portfolios 20.00 12.00 8.00 10% 0.80
2.00$
Fixed cost 100,000$
Desired profit 10,000$

Cost-Volume-Profit Models
$100,000 + 10,000$2.00/unit
= 55,000 units
ProductRelative
salesTotal sales
Units of product
CM per unit Total CM
Folders 60% 55,000 33,000 0.60$ 19,800$ Binders 30% 55,000 16,500 2.80 46,200 Portfolios 10% 55,000 5,500 8.00 44,000
110,000$

Cost-Volume-Profit ModelsOperating leverage
Companies with relatively low variable costs per unit, but high fixed costs, experience greater swings in profitability with volume changes than do companies with high variable costs and low fixed costs
Operating leverage is a multiplier
%∆ in sales * operating leverage = %∆ in income

Cost-Volume-Profit Models
Operating leverage =Contribution marginOperating income
Company A Company BSales 1,000,000$ 1,000,000$ Variable costs 300,000 600,000 Contribution margin 700,000$ 400,000$ Fixed costs 600,000 300,000 Operating income 100,000$ 100,000$
Operating leverage 7.00 4.00

Cost-Volume-Profit ModelsA 10% increase in sales will result in a
70% increase in Company A’s income, but only a 40% increase in Company B’s
Company A Company BSales 1,100,000$ 1,100,000$ Variable costs 330,000 660,000 Contribution margin 770,000$ 440,000$ Fixed costs 600,000 300,000 Operating income 170,000$ 140,000$
New operating leverage 4.53 3.14
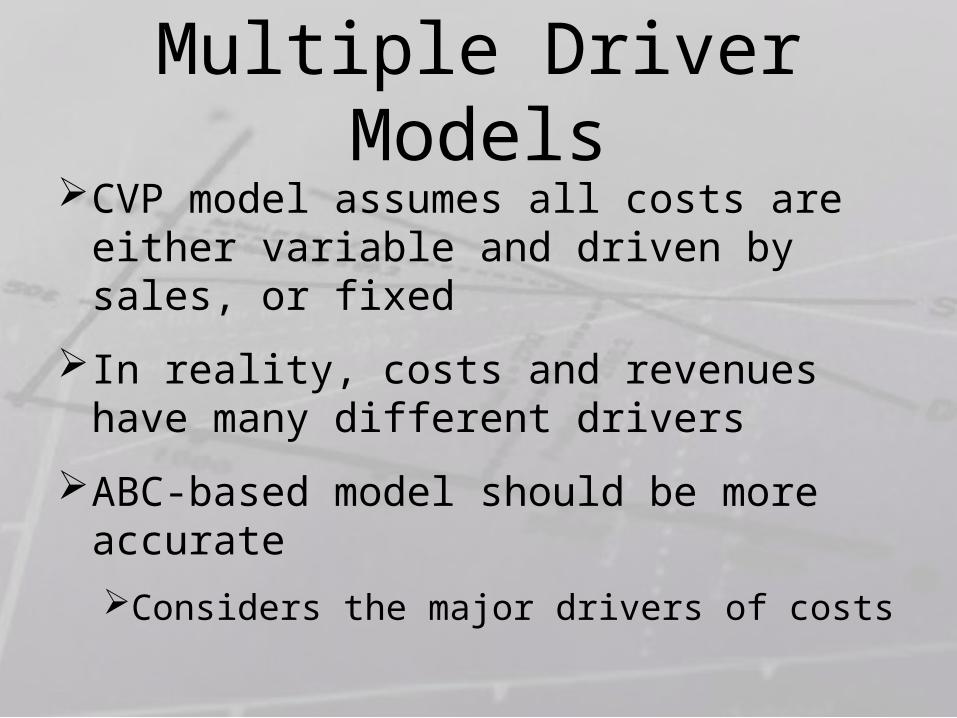
Multiple Driver ModelsCVP model assumes all costs are either
variable and driven by sales, or fixed
In reality, costs and revenues have many different drivers
ABC-based model should be more accurate
Considers the major drivers of costs
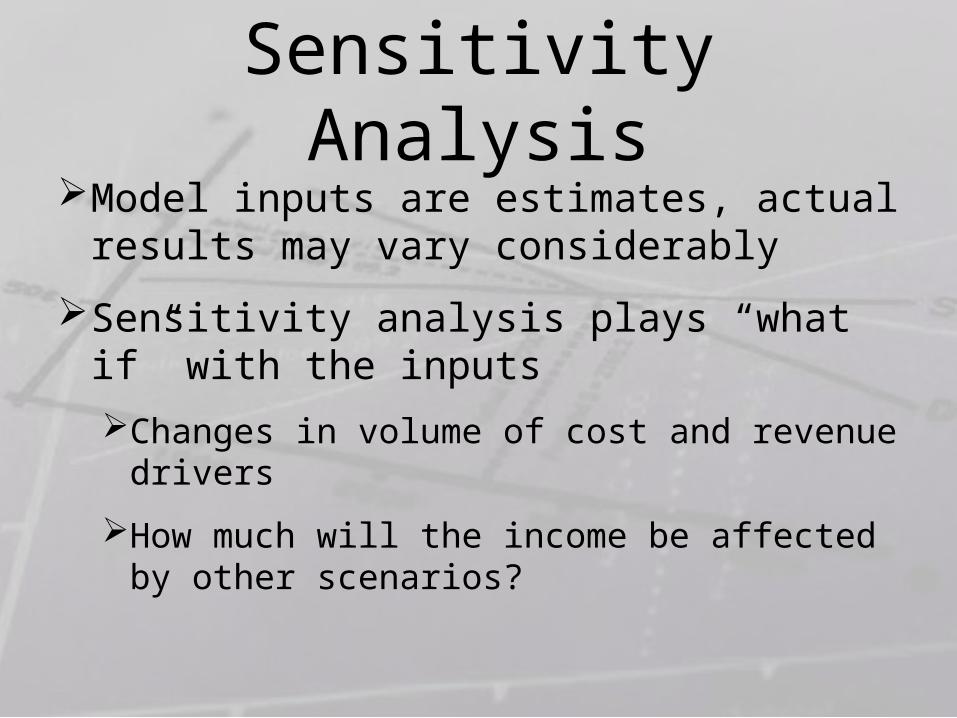
Sensitivity AnalysisModel inputs are estimates, actual results
may vary considerably
Sensitivity analysis plays “what if” with the inputs
Changes in volume of cost and revenue drivers
How much will the income be affected by other scenarios?

Theory of ConstraintsIdentification and best use of bottlenecks
Bottleneck is anything that prevents the company from producing and selling more
Process: machine capacity, available labor
Policy: no weekend or overtime work
Resource: shortage of materials
Market: not enough demand for product

Theory of Constraints
Product AProcess 1 Process 2 Process 3 Process 4
Product B Capacity: Capacity: Capacity: Capacity:12/hour 4/hour 6/hour 5/hour
Product C

Theory of ConstraintsStep 1: Identify appropriate value measure
Usually throughput
Step 2: Identify bottlenecks
Work piling up, unused capacity, etc.
Step 3: Optimize the bottleneck
What will produce the greatest value?
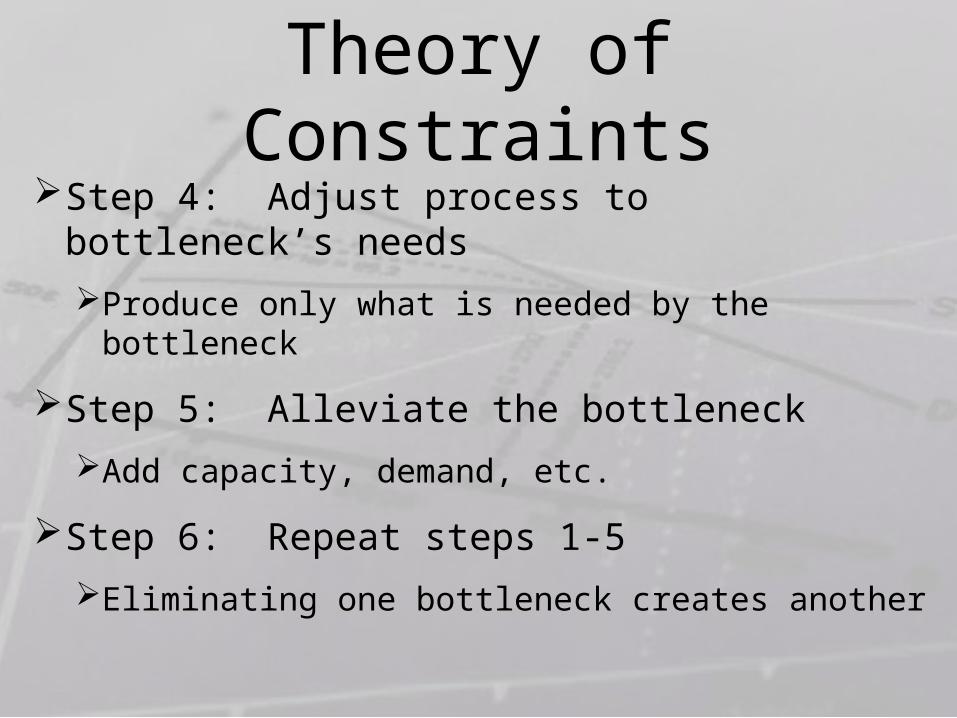
Theory of ConstraintsStep 4: Adjust process to bottleneck’s needs
Produce only what is needed by the bottleneck
Step 5: Alleviate the bottleneck
Add capacity, demand, etc.
Step 6: Repeat steps 1-5
Eliminating one bottleneck creates another
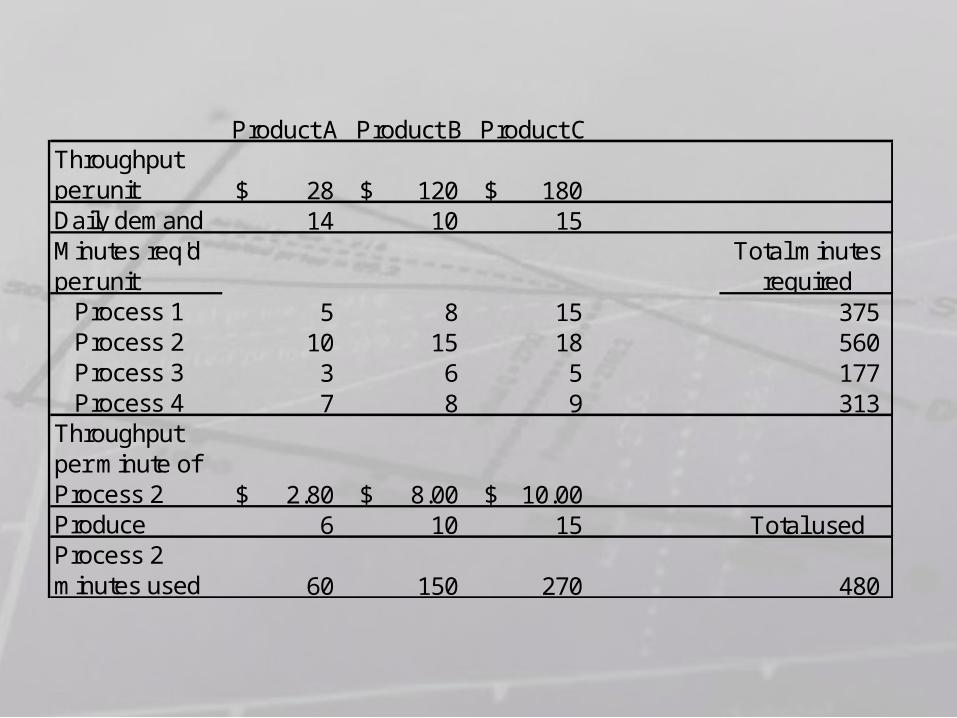
Product A Product B Product CThroughput per unit 28$ 120$ 180$ Daily demand 14 10 15 Minutes req'd per unit
Total minutes required
Process 1 5 8 15 375 Process 2 10 15 18 560 Process 3 3 6 5 177 Process 4 7 8 9 313 Throughput per minute of Process 2 2.80$ 8.00$ 10.00$ Produce 6 10 15 Total usedProcess 2 minutes used 60 150 270 480