Embed Size (px)
Citation preview

Issuer
International Hotel Investments p.l.c.
Financial
Analysis
Summary
28 June 2017

The Directors
International Hotel Investments p.l.c.
22, Europa Centre
Floriana FRN 1400
Malta
28 June 2017
Dear Sirs
Financial Analysis Summary
In accordance with your instructions, and in line with the requirements of the Listing Authority
Policies, we have compiled the Financial Analysis Summary (the “Analysis”) set out on the following
pages and which is being forwarded to you together with this letter.
The purpose of the financial analysis is that of summarising key financial data appertaining to
International Hotel Investments p.l.c. (the “Issuer”, “Company” or “Group”). The data is derived
from various sources or is based on our own computations as follows:
(a) Historical financial data for the three years ended 31 December 2014 to 31 December 2016
has been extracted from audited financial statements of the Issuer for the three years in
question.
(b) The forecast data for the year ending 31 December 2017 has been provided by management.
(c) Our commentary on the results of the Issuer and its financial position is based on the
explanations provided by management.
(d) The ratios quoted in the Analysis have been computed by us applying the definitions set out in
Part 5 of the Analysis.
(e) Relevant financial data in respect of the companies included in Part 4 has been extracted from
public sources such as websites of the companies concerned, financial statements filed with
the Registrar of Companies or websites providing financial data.

The Analysis is meant to assist investors in the Issuer’s securities and potential investors by
summarising the more important financial data of the Group. The Analysis does not contain all data
that is relevant to investors or potential investors. The Analysis does not constitute an endorsement
by our firm of any securities of the Issuer and should not be interpreted as a recommendation to
invest in any of the Issuer’s securities. We shall not accept any liability for any loss or damage arising
out of the use of the Analysis. As with all investments, potential investors are encouraged to seek
independent professional financial advice before investing in the Issuer’s securities.
Yours faithfully,
Wilfred Mallia
Director

IHI GROUP FINANCIAL ANALYSIS SUMMARY 1
TABLE OF CONTENTS
PART 1 – INFORMATION ABOUT THE ISSUER ................................................................................. 3
1. Key Activities ................................................................................................................. 3
2. Directors and Key Employees .......................................................................................... 5
3. Corinthia Group Organisational Structure ....................................................................... 6
PART 2 – OPERATIONAL DEVELOPMENT ........................................................................................ 8
4. Hotel Properties ............................................................................................................. 8
4.1 Room Inventory ............................................................................................................. 8
4.2 Corinthia Hotel Budapest .............................................................................................. 9
4.3 Corinthia Hotel St Petersburg ...................................................................................... 11
4.4 Corinthia Hotel Lisbon ................................................................................................. 14
4.5 Corinthia Hotel Prague ................................................................................................ 16
4.6 Corinthia Hotel Tripoli ................................................................................................. 18
4.7 Corinthia Hotel St George’s Bay .................................................................................. 20
4.8 Marina Hotel ................................................................................................................ 22
4.9 Corinthia Hotel & Residences London ......................................................................... 23
4.10 Radisson Blu Resort & Spa Golden Sands .................................................................... 26
4.11 Radisson Blu Resort St Julians ..................................................................................... 28
4.12 IHI’s Aggregate Hotel Revenue and Operating Profit .................................................. 29
4.13 Management Company ............................................................................................... 31
4.14 Event Catering Business .............................................................................................. 33
4.15 Food Retail and Contract Catering Business (including Costa Coffee) ........................ 34
4.16 Other Assets ................................................................................................................ 36
5. Business Development Strategy .................................................................................... 37
PART 3 – PERFORMANCE REVIEW ............................................................................................... 38
IHI GROUP FINANCIAL ANALYSIS SUMMARY 2
PART 4 - COMPARABLES ............................................................................................................. 50
PART 5 - EXPLANATORY DEFINITIONS AND REFERENCES .............................................................. 52

IHI GROUP FINANCIAL ANALYSIS SUMMARY 3
PART 1 – INFORMATION ABOUT THE ISSUER
1. KEY ACTIVITIES
International Hotel Investments p.l.c. (the “Issuer”, “Company” or “Group”) is a company listed on the
Malta Stock Exchange, and is principally engaged in the ownership, development and operation of hotels and
ancillary real estate in Europe and North Africa.
To date, the Issuer has acquired and/or developed hotels in Prague (Czech Republic), Tripoli (Libya), Lisbon
(Portugal), Budapest (Hungary), St Petersburg (Russia), St Julian’s (Malta) and Golden Sands (Malta). The Issuer
also has a 50% shareholding in a 294 roomed luxury hotel and residential development in London (UK) (which it
manages and controls), the latter property originally consisting of 12 residential apartments located within the
same building as the hotel. In April 2014, 11 of the aforesaid apartments were sold to third parties with the
holding company retaining ownership of the penthouse apartment.
Revenue and earnings are derived primarily from the operation of owned hotels. A secondary source of income
and earnings is rental income of residential and commercial premises, particularly in St Petersburg and Tripoli.
Additional revenue streams include fees earned by CHI Limited, a wholly owned subsidiary of the Company,
from hotels owned by IHI itself or managed pursuant to management contracts with CPHCL and other third
parties. Furthermore, revenue is also generated from a vacation ownership marketing business, a retail and
event catering business, and the operation of Costa Coffee outlets in Malta and Spain.
On 10 August 2015, the Issuer acquired 100% of the issued share capital of Island Hotels Group Holdings p.l.c.
(“IHGH”). The business of IHGH largely relates to: the ownership, management and operation of five-star
hotels in Malta (namely, the Radisson Blu Resort St Julians and the Radisson Blu Resort & Spa, Golden Sands);
the operation of a vacation ownership marketing business (Radisson Blu Resort & Spa, Golden Sands and Azure
Resorts Limited). It also includes the operation of retail and event catering business (Island Caterers Limited);
and the development and operation of Costa Coffee outlets in Malta, the East Coast of Spain, Canary Islands
and the Balearic Islands. IHGH, through a wholly owned subsidiary, also owns a plot of land measuring
83,530m2 located adjacent to the Radisson Blu Resort & Spa, Golden Sands, Malta. The property is earmarked
for the development of a luxury tourist complex.
Following the above-mentioned IHGH acquisition in 2015, IHI initiated the design process to consolidate the
three hotel properties situated in St George’s Bay, St Julians, Malta (namely, the Radisson Blue Resort St
Julians, the Corinthia Hotel St George’s Bay and the Marina Hotel), and make way for a mixed-use development
that will feature a luxury hotel, attracting high net leisure and corporate guests, as well as high-end residential,
office, retail and commercial facilities targeting a six-star market. Subject to receiving the necessary regulatory
planning approvals and having the required funding in place, this project will be spread out over a number of
years to minimise interruption to hotel operations.
On 11 April 2016, NLI Holdings Ltd, the owner of the Corinthia Hotel and Residential Development in London,
acquired the Grand Hotel Astoria in Brussels for £11 million and a deferred payment of €500,000 payable two
years from opening of the reconstructed and refurbished hotel, free of interest, through the acquisition of the
entire issued share capital of the Belgian hotel-owning company, Hotel Astoria S.A. IHI will undertake the
redevelopment of the hotel on behalf of NLI Holdings Ltd, much as it had done on the London project. IHI has

IHI GROUP FINANCIAL ANALYSIS SUMMARY 4
reorganised the ground floor flows and uses, as well as reconfigured the bedroom inventory, to ensure that all
bedrooms are larger than 30m2. The hotel will have around 126 bedrooms, of which, 25% will be junior suites
or suites. The hotel has been awarded a building permit to carry out the planned redevelopment. IHI has
prepared a capital concept cost estimate for the full refurbishment project, which cost is estimated at €65
million, inclusive of all costs, fees and contingencies. Work is underway to source and secure funding of the €65
million for the refurbishment project. The objective is to progress to construction by early 2018. IHI’s aim is to
complete the reconstruction and fit out of the hotel by early 2019. QPM are acting as project managers and
work is underway to seek quotations from Belgian and international engineers, M&E designers, cost
consultants and interior designers.
In May 2016, CHI signed a technical services and pre-opening services agreement with Meydan Group of Dubai,
to assist Meydan’s architects, engineers and consultants in the planning and development of a luxury hotel and
residences to be operated under the Corinthia® brand on Jumeirah Beach in Dubai, UAE. CHI has also entered
into a management agreement in respect of this hotel having a term of 20 years commencing as of the
scheduled hotel opening date in early 2022. In addition, the Dubai entity has engaged CHI to provide consulting
services to its two existing hotels in Dubai.
On 12 September 2016, IHI acquired from Corinthia Palace Hotel Company Limited the remaining 80% share in
QPM Limited (“QPM”) - a provider of architectural, engineering, management and technical construction
services. The cash consideration of €4.6 million was paid partly from the net proceeds of the June 2016 bond
issue. The share purchase agreement further includes additional condition payments that may be or may
become due to QPM and which, had they been crystallised at the point in time of the acquisition date, would
have enhanced the value of QPM, resulting in a higher purchase consideration.
The said additional conditional payments comprise the following: (i) QPM is due an amount for services
provided on a third party project. Upon receipt of all or part of said amount by QPM, the purchaser will be
bound to pay an additional amount to the seller calculated on a given percentage of settled amounts; (ii) in
view of the political and economic situation in Libya, the business activities of QPM in the country have stalled.
In the event that QPM were to recommence any projects in Libya and were to generate cash revenues in any of
the financial years ending 31 December 2017, 2018 and 2019, the seller will be due an additional amount from
the purchaser based on a percentage of such cash revenues; (iii) Although QPM is already engaged to provide
its services on the Corinthia St George’s Bay Development, this engagement has not been factored in the
valuation. Accordingly the seller will be due an amount equivalent to a percentage of revenues generated by
QPM from the project on an annual basis up to 31 December 2026.
None of the above events have been included in the determination of the consideration payable for the
acquisition of QPM, and therefore the figure indicated above may vary accordingly as aforesaid.
In early 2017, CHI entered into an agreement with a strategic investor, to manage and operate a luxury hotel
development in Doha, Qatar, under the Corinthia® brand. Construction of the proposed hotel & residences is
expected to commence in the current financial year (2017).

IHI GROUP FINANCIAL ANALYSIS SUMMARY 5
2. DIRECTORS AND KEY EMPLOYEES
The Issuer is managed by a Board consisting of ten directors entrusted with its overall direction and
management, including the establishment of strategies for future development.
The Board members of the Issuer as at the date of this report are as follows:
Board of Directors
Alfred Pisani Chairman
Abdulnaser M.B. Ahmida Non-Executive Director
Douraid Zaghouani Non-Executive Director
Hamad Mubarak Mohd Buamin Non-Executive Director
Abuagila Almahdi Non-Executive Director
Khaled Amr Algonsel Non-Executive Director
Joseph Pisani Non-Executive Director
Winston V. Zahra Non-Executive Director
Frank Xerri de Caro Senior Independent Non-Executive Director
Joseph J. Vella Independent Non-Executive Director
The Chairman and the Joint Chief Executive Officers (Joseph Fenech and Simon Naudi) are responsible for the
identification and execution of new investment opportunities. They are also responsible for managing the
Company’s assets, ensuring the establishment of appropriate management contracts of the hotel properties in
the case of operational properties, and negotiating and awarding project contracts in respect of the
development or refurbishment of new properties.
The weekly average number of employees engaged at the Issuer’s corporate office and in its owned hotels
during FY2016 amounted to 2,015 persons (FY2015: 2,014).

IHI GROUP FINANCIAL ANALYSIS SUMMARY 6
3. CORINTHIA GROUP ORGANISATIONAL STRUCTURE
The following diagram summaries, in simplified format, the structure of the Corinthia Group and the position
within the said group of the Issuer. The complete list of companies forming part of the Group is included in the
consolidated audited financial statements of the Issuer for the year ended 31 December 2016.
The following table provides a list of the principal assets and operations of the Issuer:
10.85%
International Hotel
Investments p.l.c. (Malta)
ISSUER
Corinthia Palace Hotel
Company Limited (Malta)
57.82%
LFICO
(Libya)
Istithmar Hotels FZE
(Dubai)
General Public (Malta Stock
Exchange listing)
21.69% 9.64%
INTERNATIONAL HOTEL INVESTMENTS PLC
PRINCIPAL ASSETS AND OPERATIONS
AS AT 31 DECEMBER 2016
Name Location Description % ownership
No. of hotel
rooms
Corinthia Hotel Budapest Hungary Property owner 100 440
Corinthia Hotel St Petersburg Russia Property owner 100 388
Commercial property St Petersburg Russia Property owner 100 n/a
Corinthia Hotel Lisbon Portugal Property owner 100 518
Corinthia Hotel Prague Czech Republic Property owner 100 539
Corinthia Hotel Tripol i Libya Property owner 100 299
Commercial property Tripoli Libya Property owner 100 n/a
Corinthia Hotel St George’s Bay Malta Property owner 100 250
Marina Hotel St George’s Bay Malta Property owner 100 200
Corinthia Hotel & Residences London* United Kingdom Property owner 50 294
Corinthia Grand Astoria Hotel Brussels* Belgium Property owner (under development) 50 n/a
Radisson Blu Resort St Julians Malta Property owner 100 252
Radisson Blu Resort & Spa Golden Sands MaltaProperty owner & vacation ownership
operation50 329
CHI Limited Malta Hotel management 100 n/a
QPM Limited Malta Project management 100 n/a
Medina Tower Libya Mixed-use property (to be developed) 25 n/a
Island Caterers Malta Event catering 100 n/a
Hal Ferh Complex Malta Vacant site (to be developed) 100 n/a
Costa Coffee Malta/Spain Retail catering 100 n/a
3,509
* under control and management of IHI

IHI GROUP FINANCIAL ANALYSIS SUMMARY 7
The following table illustrates the carrying values of the principal properties of the Issuer, accounted for in the
balance sheet under the headings: “investment properties”, “property, plant & equipment” and “investments
accounted for using the equity method”:
INTERNATIONAL HOTEL INVESTMENTS PLC
VALUATION OF PRINCIPAL PROPERTIES
AS AT 31 DECEMBER
FY2014 FY2015 FY2016
Investment Properties
Commercial Centre St Petersburg 77,830 67,231 64,555
Commercial Centre Tripoli 68,243 68,243 68,243
Commercial Centre Lisbon 1,102 1,300 1,980
Site in Tripoli 29,500 29,500 29,500
176,675 166,274 164,278
Hotel Properties
Corinthia Hotel St George's Bay 27,557 37,711 40,477
Radisson Blu Resort, St Julians - 37,711 40,291
Corinthia Hotel Lisbon 92,168 89,200 93,428
Corinthia Hotel Prague 74,039 82,901 83,006
Corinthia Hotel Tripoli 86,687 84,085 81,206
Corinthia Hotel Budapest 95,231 104,800 122,458
Corinthia Hotel St Petersburg 90,729 70,610 85,710
Marina Hotel 22,499 28,813 31,115
488,910 535,831 577,691
Joint Ventures and Associates
Corinthia Hotel & Residences London (50%) 296,167 315,680 271,850
Corinthia Grand Astoria Hotel Brussels (50%) - - 7,600
Radisson Blu Resort & Spa Golden Sands (50%) - 32,672 31,509
Medina Towers J.S.C. (25%) 12,701 13,871 13,567
308,868 362,223 324,526
Assets in the Course of Development
The Heavenly Collection Ltd (Hal Ferh) - 21,576 21,576
- 21,576 21,576
Total 974,453 1,085,904 1,088,071

IHI GROUP FINANCIAL ANALYSIS SUMMARY 8
PART 2 – OPERATIONAL DEVELOPMENT
4. HOTEL PROPERTIES
4.1 ROOM INVENTORY
As at the date of this report, the Issuer fully owns 8 hotel properties and 50% of each of 2 other hotel
properties (namely, Corinthia Hotel & Residences London and Radisson Blu Resort & Spa Golden Sands). The
chart below sets out the growth in room inventory of the Issuer since incorporation, which increased from 250
to 3,509 rooms over a 16-year period.
0
200
400
600
800
1000
1200
1400
1600
1800
2000
2200
2400
2600
2800
3000
3200
3400
3600
3800
2000 2001 2002 2003 2004 2005 2006 2007 2008 2009 2010 2011 2012 2013 2014 2015 2016
Rooms
Owned Rooms in Operation
Corinthia Hotel St George's Bay Corinthia Hotel Lisbon
Corinthia Hotel St Petersburg Corinthia Hotel Budapest
Corinthia Hotel Prague Corinthia Hotel Tripoli
Corinthia Hotel & Residences London Marina Hotel
Radisson Blu Resort & Spa Golden Sands Radisson Blu Resort St Julians
Source: Management information.

IHI GROUP FINANCIAL ANALYSIS SUMMARY 9
4.2 CORINTHIA HOTEL BUDAPEST
Introduction
IHI Magyarország Zrt., a fully-owned subsidiary of the Company, owns the 440-room five-star Corinthia Hotel
located in Budapest, Hungary (“Corinthia Hotel Budapest”). The hotel was acquired as a vacant building in
2000 for €27 million. The property was subsequently demolished except for the historic facade and ballroom
and rebuilt at a cost of €90 million. It was officially opened in April 2003. In 2006, 26 self-catering apartments
were added to its stock of rooms, which are included in the above room count, and a health spa was opened.
The carrying value of the Corinthia Hotel Budapest as at 31 December 2015 is €122.5 million (FY2015: €104.8
million).
Market Overview
i. Economic update
The Hungarian economy shifted into a lower gear as growth slid in the final quarter of 2016. Comprehensive
data released by the Central Statistics Office (KSH) show that the economy expanded 1.6% annually in Q4,
marking the second consecutive quarterly deceleration and matching the preliminary estimate figure. 2016
GDP came in at a four-year low of 2.0% as the economy reeled from dwindling EU investment funds and
weakening demand for Hungarian goods. On a seasonally-adjusted quarter-on-quarter basis, GDP remained
broadly stable and expanded a soft 0.4% in Q4 (Q3: +0.3% q-o-q).
Abysmal readings in fixed investment and government consumption dented growth in the domestic economy
and are largely behind the quarterly deceleration. Fixed investment declined at a double-digit rate in Q4 as EU-
investment funds have dried up (Q3: -9.9% y-o-y; Q4: -19.6% y-o-y) and government consumption plunged to
an over nine-year low (Q4: -5.0% y-o-y). The only bright spot was private consumption, which accelerated
thanks to cheap credit, growth in real personal disposable income, low unemployment, and strong consumer
confidence throughout the whole quarter. Overall, growth in domestic demand slowed from 1.8% in Q3 to
1.1% in Q4.
The contribution of the external sector to growth improved in the final quarter, even though the figure itself is
misleading as exports actually slowed from a strong 5.1% expansion in Q3 to 3.1%, an over three-year low.
However, imports decelerated even faster and expanded at an almost four-year low of 2.7% in Q4 (Q3: + 5.1%
y-o-y) despite strong private consumption. As growth in imports slowed at a faster rate than exports, the
contribution of the external sector improved from 0.1 percentage points in Q3 to 0.5 percentage points in Q4.
The slowdown experienced in the final quarter of 2016 is not expected to continue this year (2017). A list of
measures announced by the government late last year such as wage hikes, increased spending and tax cuts will
support stronger growth and offset domestic challenges such as rising prices. The resumption of EU inflows and
the Central Bank’s commitment to maintaining favourable monetary conditions will provide a further boost to
the economy. The aforementioned factors should shield the economy from external headwinds such as weaker
economic growth in Hungary’s trading partners and its ripple effect on the country’s external sector, as well as
monetary policy normalisation in the United States and Euro Area, which could trigger capital flow volatility
and drive up financing costs. The Central Bank sees GDP expanding 3.6% in 2017 and 3.7% in 2018.

IHI GROUP FINANCIAL ANALYSIS SUMMARY 10
ii. Tourism market
In 2016, accommodation establishments recorded 27.7 million tourism nights, 7.0% more than in 2015, with
total gross revenues of accommodation establishments rising by 9.1% at current prices and amounting to more
than HUF 402 billion. In the reviewed period, foreign guests spent 6.9% more nights in accommodation
establishments as compared to the previous year to reach 13.9 million nights, while domestic guests spent
7.1% more nights totalling 13.8 million nights. Room occupancy in hotels in 2016 rose by an average of 2.5
percentage points to 56.4%.
Budapest attracts most of the foreign guests, and in 2016, 86% of foreign visitors stayed in the capital spending
a total of 8.2 million guest nights, almost 6% more than in the previous year. Among the most significant feeder
markets, Czech Republic (+20%) and Romania (+17%) showed the most significant increase. The number of
guests from Germany increased for the first time in several years with 0.3%, while the number of Russian
tourists continued to fall by 5.3%.
Operational Performance
The following table sets out the highlights of the hotel’s operating performance for the years indicated therein:
Positive results were achieved in FY2014, in which, the Hotel registered a 15% increase in RevPAR and a growth
in revenue of €1.9 million to €20.4 million. This increase resulted in a €0.9 million improvement in gross
operating profit. FY2015 was another positive year in which average room rate increased by 11% from €114 in
FY2014 to €127 in FY2015, and RevPAR by 16% to €99 in FY2015. In this regard, gross operating profit increased
by €1.9 million from FY2014 to FY2015 (+29%). A substantial part of these improvements in performance is
attributable to the diversification in market segmentation wherein lower rated business is being replaced by
the more lucrative leisure market segment.
Revenue for FY2016 was higher than FY2015’s revenue at €23.5 million (FY2015: €22.8 million) and gross
operating profit was also higher when compared to the prior year at €8.6 million (FY2015: €8.4 million). As for
FY2017, occupancy and RevPAR are expected to increase from 78% to 81% and €101 to €113 respectively,
Corinthia Hotel Budapest FY2014 FY2015 FY2016 FY2017
Actual Actual Actual Forecast
Turnover (€’000) 20,404 22,810 23,457 25,563
Gross operating profit before incentive fees (€’000) 6,500 8,364 8,577 9,448
Gross operating profit margin (%) 32 37 37 37
Occupancy level (%) 74 78 78 81
Average room rate (€) 114 127 129 140
Revenue per available room (RevPAR) (€) 85 99 101 113
Benchmark performance
Occupancy level (%) 76 80 79 79
Average room rate (€) 103 115 124 129
Revenue per available room (RevPAR) (€) 78 92 98 102
Revenue Generating Index 1.09 1.08 1.03 1.11
Source: Management information.

IHI GROUP FINANCIAL ANALYSIS SUMMARY 11
mainly due to one-off international events and exhibitions to be organised in 2017 at the HUNGEXPO – the
largest multifunctional venue in Budapest. As a result, FY2017 revenue is projected to increase by €2.1 million
(+9%) to €25.6 million and gross operating profit is set to increase from €8.6 million in FY2016 to €9.4 million
(+10%). In subsequent years, management is expected to continue implementing a strategy of focusing more
on increasing revenue from leisure, corporate and conference & event segments with progressive decrease in
the volume of low rated sectors (such as groups and tour operator business).
During the historical period under review, the Hotel performed at a similar level to its competitive set as to
occupancy, but achieved a marginally higher average room rate than its competitors. Overall, the Hotel
performed much better than its competitive set in FY2014 (RGI: 1.09), FY2015 (RGI: 1.08) and FY2016 (RGI:
1.03). This over performance relative to the competitive set is anticipated to continue also in the projected
year FY2017 (RGI of 1.11).
4.3 CORINTHIA HOTEL ST PETERSBURG
Introduction
IHI Benelux B.V. (a fully-owned subsidiary of the Company) owns the 388-room five-star Corinthia Hotel located
in St Petersburg, Russia (“Corinthia Hotel St Petersburg”), which was acquired in 2002 for €35 million. The
company also purchased properties adjacent to the hotel, which were subsequently demolished and rebuilt as
a hotel extension and a commercial centre including retail and office space. This development project, which
was completed in May 2009, also involved the refurbishment of the lobby and the public areas of the original
hotel. A renovation programme, estimated at €23.5 million, is currently underway. This project comprises the
refurbishment of the rooms of the original hotel and the development of an area measuring circa 1,500 square
metres situated behind the Hotel and which will consist in the creation of a car park and further office space.
The carrying amount of the Corinthia Hotel St Petersburg and the commercial centre as at 31 December 2016 is
€85.7 million (FY2015: €70.6 million) and €64.6 million (FY2015: €67.2 million) respectively.
Market Overview
i. Economic update
The Russian economy has responded exceptionally well in the last two years to the dual shock of collapsing oil
prices and the continuation of Western sanctions. GDP decreased just 0.2% in 2016, which followed an
upwardly revised 2.8% contraction in 2015. Tighter fiscal and monetary policies and a flexible exchange rate
ensured a much smaller GDP decline in over the two-year period 2015 and 2016 compared to 2009, when the
economy plummeted nearly 8%, despite higher oil prices back then. Further indications that a nascent
economic recovery remains in place at the beginning of 2017 were supported by PMI (Purchasing Managers’
Index) data for March and a strong increase in exports in January, which resulted from a pickup in exports both
of oil – due to higher prices – and of non-oil products, particularly machinery, reflecting stronger demand from
other CIS countries.
ii. Tourism market
As of year-end 2016, the St Petersburg hotel market accounted for 149 hotels, with a supply of 20,600 rooms
(excluding mini-hotels, departmental hotels, and hostels). The share of rooms managed by international hotel
operators amounted to 43%.

IHI GROUP FINANCIAL ANALYSIS SUMMARY 12
Expecting such major events as FIFA Confederations Cup 2017 and FIFA World Cup 2018, both Russian and
international hoteliers started to expand their room supply. American chains entered the St Petersburg market
– such hotels as Hampton by Hilton Saint Petersburg ExpoForum and Best Western Plus Centre Hotel were
opened. St Petersburg players – hotel chain Station, Hotel Group Eurasia and Nevsky Hotel Group – also made
their moves to expand.
The amount of visitors to St Petersburg in 2016, according to official municipal administration data, reached 6.9
million people in comparison with the previous year’s figure of 6.5 million visitors. The number of Russian
citizens who visited St Petersburg in 2016 (domestic tourism) increased by 14% compared to 2015, mainly due
to the depreciation of the rouble which led to the redirection of outbound tourism to the domestic market.
Operational Performance
The following table sets out the highlights of the hotel’s operating performance for the years indicated therein:
In FY2014, revenue at the Corinthia Hotel St Petersburg declined by 25% to €14.2 million relative to FY2013 due
to a decrease in demand (both leisure and conference business) as a result of the political situation between
Russia and Ukraine (in relation to the annexation of Crimea to the Russian Federation). Management’s strategy
for the year was to maintain occupancy rate at above 50%, which was achieved at the expense of a reduction in
average room rate (from €180 in FY2013 to €139 in FY2014), mainly in consequence of the tumbling Rouble, as
there was a concerted shift from international to domestic clients.
During FY2015, the Hotel was able to capture a higher share of the domestic market, but the average room
rate decreased in euro terms principally as a result of a weaker Rouble. As such, the Hotel increased occupancy
levels from 52% to 60%, but average room rate decreased from €139 to €112. Overall, revenue in FY2015
declined by €1.4 million (year-on-year) to €12.8 million. On the other hand, gross operating profit improved by
€1.2 million in consequence of cost-reduction measures.
Corinthia Hotel St Petersburg FY2014 FY2015 FY2016 FY2017
Actual Actual Actual Forecast
Turnover (€’000) 14,229 12,783 14,103 16,576
Gross operating profit before incentive fees (€’000) 3,007 4,210 5,871 7,255
Gross operating profit margin (%) 21 33 42 44
Occupancy level (%) 52 60 60 64
Average room rate (€) 139 112 122 139
Revenue per available room (RevPAR) (€) 72 67 74 89
Benchmark performance
Occupancy level (%) 53 61 61 63
Average room rate (€) 193 153 186 194
Revenue per available room (RevPAR) (€) 85 93 113 122
Revenue Generating Index 0.85 0.72 0.65 0.73
Source: Management information.
IHI GROUP FINANCIAL ANALYSIS SUMMARY 13
In FY2016, turnover recovered from €12.8 million generated in FY2015 to €14.1 million (+10%) and gross
operating profit improved by €1.7 million (+39%) from €4.2 million in FY2015 to €5.9 million. Although the
occupancy level remained static at 60% in FY2016, the average room rate increased from €112 in FY2015 to
€122 in FY2016, with the consequence of an increase in RevPAR of 10%.
The challenges set and acted upon by the Hotel’s management team have been to source alternative markets,
targeting in particular as much business as possible from within the Russian Federation itself, and to operate
the Hotel with a wide range of room rates targeting upscale corporate to luxury travellers. A sales office has
been opened in Moscow with Russian-language online marketing being given prominence. RevPAR will remain
under pressure in the near term, because of competition in the market and the increasing supply of rooms in
consequence of the opening of new hotels. Consequently, the strategy adopted by the Hotel will remain
focused on securing a base demand and driving occupancy rather than building average room rate.
In FY2017, management is anticipating an economic recovery in Russia and a return of international tourists to
the country. As such, the average room rate is projected to increase from €122 in FY2016 to €139 in FY2017,
and RevPAR in FY2017 should increase by 20% when compared to the prior year.
Similar to the Hotel, its competitive set registered a decrease in RevPAR in FY2014 of 28% (Hotel: -26%),
principally as a consequence of the conflict with Ukraine, and also because two major events which were
organised in FY2013 increased average rates above normal levels. In FY2015 and FY2016, the Hotel performed
at par with its competitive set in terms of occupancy but its average room rate was lower than the average rate
of competitors by 27% and 34% respectively. In FY2017, the Hotel expects to improve occupancy level by 4
percentage points to 64% (similar to the benchmark level of 63%) and RevPAR is projected to increase from €74
in FY2016 to €89 (being 27% lower than the forecasted RevPAR of the competitive set).
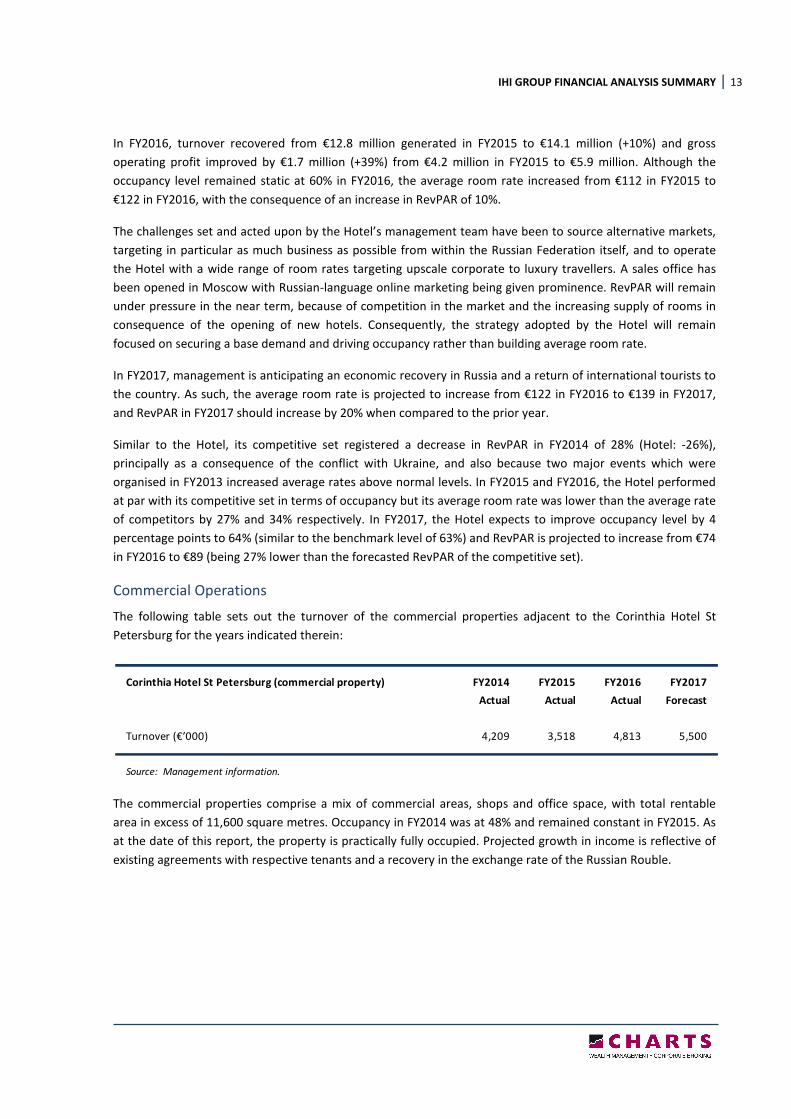
Commercial Operations
The following table sets out the turnover of the commercial properties adjacent to the Corinthia Hotel St
Petersburg for the years indicated therein:
The commercial properties comprise a mix of commercial areas, shops and office space, with total rentable
area in excess of 11,600 square metres. Occupancy in FY2014 was at 48% and remained constant in FY2015. As
at the date of this report, the property is practically fully occupied. Projected growth in income is reflective of
existing agreements with respective tenants and a recovery in the exchange rate of the Russian Rouble.
Corinthia Hotel St Petersburg (commercial property) FY2014 FY2015 FY2016 FY2017
Actual Actual Actual Forecast
Turnover (€’000) 4,209 3,518 4,813 5,500
Source: Management information.

IHI GROUP FINANCIAL ANALYSIS SUMMARY 14
4.4 CORINTHIA HOTEL LISBON
Introduction
Alfa Investimentos Lda (a fully-owned subsidiary of the Company) owns the 518-room five-star Corinthia Hotel
located in Lisbon, Portugal (“Corinthia Hotel Lisbon”), which was acquired in 2001 for €45 million. The
Corinthia Hotel Lisbon required significant renovation and following an extensive refurbishment was re-opened
in May 2004.
A renovation programme is underway at the Corinthia Hotel Lisbon, estimated at a cost of €10 million. The
refurbishment started in November 2016 and will take 30 months to complete. The programme comprises the
complete refurbishment of all room stock at the hotel to upgrade the product, including increasing the size and
upgrading of the fit-out to the rooms. The refurbishment will be carried out in phases sealing off two to three
floors at a time without causing any disturbance to the on-going operation of the hotel which continues to
operate normally. Works on the first two floors have already been completed and the finished product has
been received well by the market. The programme of works is on schedule.
The carrying amount of the Corinthia Hotel Lisbon as at 31 December 2016 is €93.4 million (FY2015: €89.2
million). Alfa Investimentos Lda also owns an apartment block in Lisbon for investment purposes, valued at
€2.0 million as at 31 December 2016 (FY2015: €1.3 million).
Market Overview
i. Economic update
Although the Portuguese economy is gradually moving into a higher gear, a surge in imports due to higher
energy prices and more dynamic domestic demand dragged on growth in Q4 2016. Portugal’s GDP increased
0.6% in the fourth quarter of 2016 compared to the previous quarter, according to the National Statistics
Institute (INE). This figure was down from the 0.9% growth recorded in the third quarter of 2016. On a year-on-
year basis, growth reached 2.0% in Q4, up from 1.7% in Q3 and marking the fastest expansion since Q2 2010.
Over last year as a whole, the economy expanded 1.4% (2015: +1.6%).
Cheap loans as a result of the European Central Bank’s accommodative monetary policy, falling unemployment
and rising consumer confidence caused private consumption growth to accelerate to 1.2% (Q3: +0.4% quarter-
on-quarter). Gross fixed investment expanded at the fastest pace since Q4 2010 (Q3: +0.2% q-o-q; Q4: +4.6% q-
o-q) mainly due to healthy construction activity, while government spending rebounded marginally in Q4 (Q3: -
0.6% q-o-q; Q4: +0.3% q-o-q).
On the external side of the economy, improving domestic demand and higher energy prices led imports of
goods and services to expand a robust 4.5% (Q3: -0.1% q-o-q), while growth in exports steadied at 2.5%. As a
result, the contribution from the external sector to overall growth fell from plus 1.2 percentage points in Q3 to
minus 1.0 percentage point in Q4. The Bank of Portugal expects the economy to expand 1.4% 2017, followed
by 1.5% in 2018.
ii. Tourism market
A record number of foreign tourists stayed in Portuguese hotels in 2016, boosting the economy after a
punishing international bailout. Tourist arrivals and all travel-related revenues, which account for around 10%
of Portugal’s gross domestic product, have been growing since 2011, as security fears lure visitors away from
rival Mediterranean sunshine destinations. The number of foreign tourists reached 11.4 million in 2016, a
IHI GROUP FINANCIAL ANALYSIS SUMMARY 15
12.7% rise over the previous year when the number of arrivals hit a record 10.1 million. The number of local
travellers rose by 4.8% to 7.6 million as the Portuguese economy expanded by 1.4% in 2016.
Hotel revenues rose by more than 15.1% to 2.9 billion euro (USD3.1 billion), outpacing the growth in tourist
arrivals as hotels were able to increase prices thanks to strong demand. Britons again topped the list of foreign
visitors to the country, followed by Germans, Spaniards and French. The official statistics do not include the
number of foreign visitors who stayed in private homes rented through home-sharing sites like Airbnb, which
has soared in popularity in Portugal in recent years.
The rise in tourist arrivals has helped the Atlantic coastal country overcome its economic and debt crisis and
helped slash the country’s jobless rate. Portugal’s unemployment rate fell to 11.1% last year after hitting a
record high of 17.5% in the first quarter of 2013 as the country grappled with recession under the weight of
austerity imposed by a 78-billion-euro EU/IMF bailout deal that ended in 2014.
Total hotel room supply, in the city of Lisbon, stands slightly below 20,000 rooms. In the Greater Lisbon area,
the room total increases by, approximately, 10,000 rooms. Total room supply has been increasing steadily, with
25% of total supply built or renovated after 2010. In addition, over the last 15 years, room supply in Lisbon has
doubled, growing at a 4.5% yearly pace.
Such room supply growth, in Lisbon, is not expected to slow down in the near term, as approx. 3,000 new
rooms are projected in the next 3 years (mainly in 4 and 5 star hotels). Hence, although the positive trend in
tourism hints at an optimistic outlook, the increase in room supply may induce a reduction in future occupancy
rates and possibly also limit growth in average room rates.
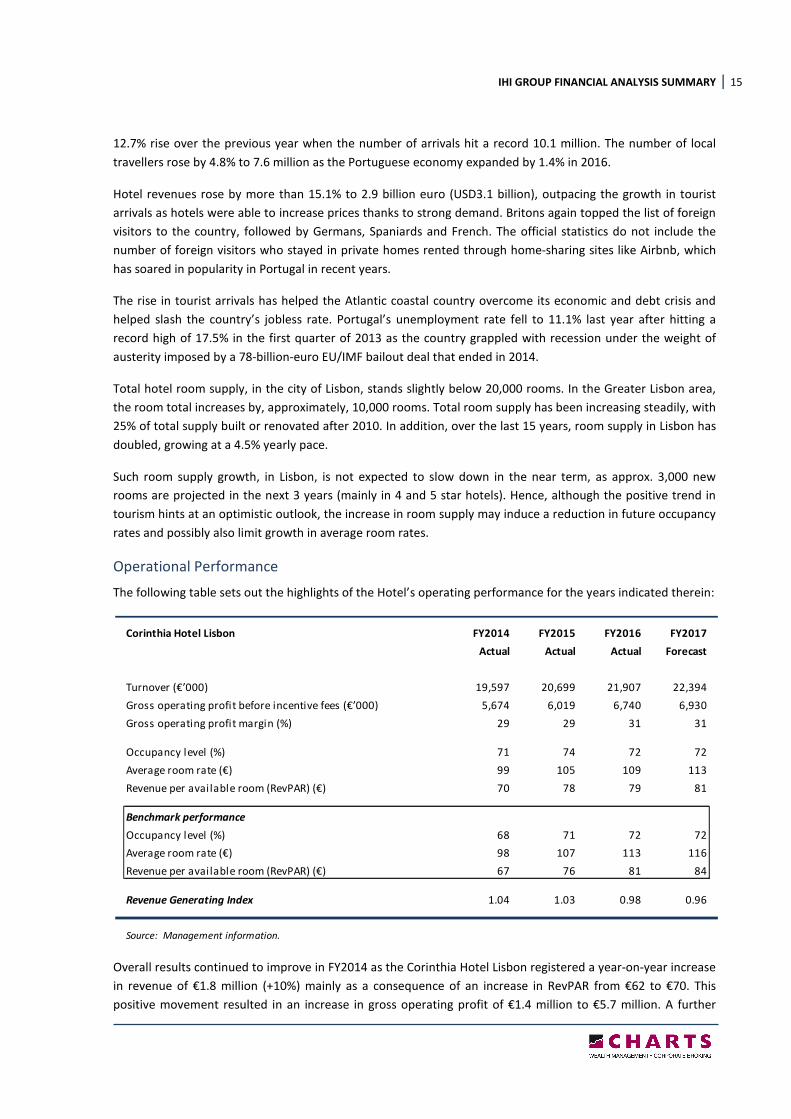
Operational Performance
The following table sets out the highlights of the Hotel’s operating performance for the years indicated therein:
Overall results continued to improve in FY2014 as the Corinthia Hotel Lisbon registered a year-on-year increase
in revenue of €1.8 million (+10%) mainly as a consequence of an increase in RevPAR from €62 to €70. This
positive movement resulted in an increase in gross operating profit of €1.4 million to €5.7 million. A further
Corinthia Hotel Lisbon FY2014 FY2015 FY2016 FY2017
Actual Actual Actual Forecast
Turnover (€’000) 19,597 20,699 21,907 22,394
Gross operating profit before incentive fees (€’000) 5,674 6,019 6,740 6,930
Gross operating profit margin (%) 29 29 31 31
Occupancy level (%) 71 74 72 72
Average room rate (€) 99 105 109 113
Revenue per available room (RevPAR) (€) 70 78 79 81
Benchmark performance
Occupancy level (%) 68 71 72 72
Average room rate (€) 98 107 113 116
Revenue per available room (RevPAR) (€) 67 76 81 84
Revenue Generating Index 1.04 1.03 0.98 0.96
Source: Management information.

IHI GROUP FINANCIAL ANALYSIS SUMMARY 16
improvement of 6% and 11% in revenue (to €20.8 million) and RevPAR (to €78) respectively was registered in
FY2015 over FY2014 results. In FY2016, the Hotel increased y-o-y revenue by €1.2 million (+6%) and gross
operating profit improved further from €6.0 million in FY2015 to €6.7 million in FY2016.
With the introduction of low cost airline carriers to the country, Portugal is perceived as a ‘value for money’
destination and this has been one of the leading factors contributing to the growth in the hospitality figures
outlined above. The Hotel has likewise benefitted from this upsurge in business registering significant year-on-
year growth both in revenue and gross operating profit. Management plans to continue focusing on higher
yielding segments (leisure and conference & events) and believes that due to the size of the Hotel, there
should not be any displacement of leisure guests when signing larger conference & events business. It is
estimated that in FY2017 revenue will increase y-o-y by 2% to €22.4 million and gross operating profit is
expected to grow y-o-y by 3% to €6.9 million.
The Hotel has performed broadly in line with its competitive set in FY2014 to FY2016, although a marginally
weaker performance was recorded in FY2016 as the benchmark average rate improved by 6% compared to the
Hotel’s incremental increase of 4%. A similar trend is being projected for FY2017 as management expects to
maintain the current occupancy rate at 72%, and increase average room rate by 4%. Projected RevPAR for the
Hotel is set at €81, which is €3 lower than the expected benchmark performance, but this is understandable
considering the refurbishment works that are ongoing.
4.5 CORINTHIA HOTEL PRAGUE
Introduction
IHI Towers s.r.o. (a fully-owned subsidiary of the Company) owns the 539-room five-star Corinthia Hotel
located in Prague, Czech Republic (“Corinthia Hotel Prague”), which was acquired in 2007 for €105 million. The
carrying amount of the Corinthia Hotel Prague as at 31 December 2016 is €83.0 million (FY2015: €82.9 million).
Market Overview
i. Economic update
The Czech economy gained some steam in the final quarter of 2016, following a disappointing Q3. Growth in
Q4 was supported by strong private consumption and a more favourable external sector. A sharp fall in fixed
investment, however, still weighed on the economy. GDP growth strengthened from Q3’s 1.8% to 1.9% in Q4.
Q4’s result overshot market expectations of 1.8% growth and brought full-year 2016 GDP growth to 2.3%, half
the 4.6% rate seen in 2015, when the country benefited from an unusually high level of public investment
associated with the end of the EU funding cycle.
Growth in the Czech Republic continues to be supported by robust private consumption, which contributed 1.4
percentage points to growth. This, together with the positive contribution from the external sector, offset a
sharp deterioration in fixed investment. The enduring expansion in private consumption - which grew 2.9% in
Q4, marginally down from Q3’s 3.1% increase - has been supported by rising wages, a strong labour market and
still low inflation. On the downside, the impact on investment of the diminished absorption of aid from the
European Structural and Investment Fund continued to bite and drove fixed investment to fall 6.1% in Q4,
worsening from the already considerable 5.0% drop recorded in the previous quarter. Moreover, government
consumption flattened in Q4 after the 1.0% growth recorded in Q3.
Meanwhile, the external sector added 0.9 percentage points to growth. Imports of goods and services
decelerated from a 1.7% increase in Q3 to a 0.5% rise in Q4, reflecting weaker demand of foreign goods for

IHI GROUP FINANCIAL ANALYSIS SUMMARY 17
domestic investment. Export growth also moderated, but to a lesser extent, decelerating from Q3’s 2.4% to
Q4’s 1.9%. The Czech National Bank expects the economy to expand 2.8% in both 2017 and 2018.
ii. Tourism market
Tourism was up in 2016 for both Prague and the Czech Republic as a whole, as measured by both the number
of visitors and by overnight stays. Visitor numbers from China increased sharply. Figures for Russians are still
down but are starting to recover. Some 7.07 million people visited Prague in 2016, with 6.05 million of them
being foreigners, based on statistics from the Czech Statistical Office (ČSÚ). The number of nights that visitors
stayed also increased. Compared to the previous year, the number of tourists visiting Prague was up 7.0%, with
foreigners rising 5.9% and residents up 14.3%. Tourists in Prague stayed for a collective 16.67 million nights,
with 14.89 million overnight stays attributable to foreigners.
During the whole of 2016, the number of guests visiting the Czech Republic increased by 6.9% and the number
of overnight stays by 5.4%. Some 18.37 million people used overnight accommodations (9.09 million Czech
residents and 9.29 million foreigners). The number of residents was up 7.0% and non-residents up 6.7%. The
number of overnight stays was higher for both groups than in 2015. In total, there were 49.64 million overnight
stays, split almost evenly between residents and foreigners. This represented an increase of 5.4% over the
previous year.
In all regions of the Czech Republic, the number of guests as well as the number of overnight stays went up.
The Hradec Králové region saw the highest increase in guests, up 13.2%, and the number of overnight stays
increased mostly in the Ústí nad Labem region, up 10.6%.
A year-on-year decrease in guests from Russia and Japan was compensated by higher occupancy by guests
from other countries, including Germans (+6.4%), Slovaks (+11.7%) and Polish (+12.1%). Demand from Asia was
also higher, particularly from China, South Korea and Taiwan, as well as from the Middle East including Israel.
Operational Performance
The following table sets out the highlights of the hotel’s operating performance for the years indicated therein:
Corinthia Hotel Prague FY2014 FY2015 FY2016 FY2017
Actual Actual Actual Forecast
Turnover (€’000) 15,740 16,518 16,819 17,977
Gross operating profit before incentive fees (€’000) 4,064 4,750 5,153 5,834
Gross operating profit margin (%) 26 29 31 32
Occupancy level (%) 65 68 66 70
Average room rate (€) 71 74 78 80
Revenue per available room (RevPAR) (€) 46 50 51 56
Benchmark performance
Occupancy level (%) 71 77 78 77
Average room rate (€) 102 106 109 113
Revenue per available room (RevPAR) (€) 73 82 85 87
Revenue Generating Index 0.63 0.61 0.60 0.64
Source: Management information.

IHI GROUP FINANCIAL ANALYSIS SUMMARY 18
In FY2014, the Corinthia Hotel Prague registered a satisfactory performance as it managed to improve
occupancy by 5 percentage points over the previous year (from 60% to 65%) whilst broadly maintaining an
average room rate above €70. Results for FY2015 show that the Hotel continued to build on this positive trend
and thereby achieved a RevPAR of €50 (from €46 in FY2014) and a gross operating profit of €4.8 million (from
€4.1 million in FY2014). Revenue in FY2016 was similar to that achieved in the prior year and amounted to
€16.8 million. Gross operating profit increased by 8% from €4.8 million in FY2015 to €5.2 million in FY2016.
Turnover for FY2017 is projected at €18.0 million, an increase of 7% from a year earlier, mainly due to an
increase in projected occupancy from 66% to 70% and an increase in average room rate from €78 in FY2016 to
€80 in FY2017. In the near term, management will continue to work towards displacing tour operator bookings
with the more profitable conference & events and leisure business in an effort to improve RevPAR.
The Hotel has, in recent years, consistently underperformed its competitive set principally in terms of room
rates (being circa 30% lower than benchmark rates). This gap in room rates is largely linked to the Hotel’s
location just outside the City centre in Prague and its large room inventory, making it more challenging to
compete at the same rates offered by the competitive set hotels, which are centrally located and smaller in
size. Consistent with current performance, management expects to continue to match its competitive set in
terms of occupancy and recover part of the gap in room rates. The Hotel is forecasting room rates to increase
through, inter alia, the generation of more room nights from higher-rated segments, improved segmentation
and the expected increase in conference & events business organised at the (neighbouring) Prague Congress
Centre. As such, the Hotel is aiming to improve the RGI from 0.60 in FY2016 to 0.64 in FY2017.
4.6 CORINTHIA HOTEL TRIPOLI
Introduction
Corinthia Towers Tripoli Limited (a fully-owned subsidiary of the Company) owns the 299-room five-star
Corinthia Hotel located in Tripoli, Libya (“Corinthia Hotel Tripoli”), and a commercial centre measuring circa
10,000 square metres and a tract of undeveloped land, both of which are adjacent to the hotel. The said
properties were acquired in 2007 for a total consideration of €207 million split as follows: Corinthia Hotel
Tripoli (€139 million); the commercial centre (€62 million); and an undeveloped parcel of land (€6 million). The
carrying amounts of the Corinthia Hotel Tripoli, commercial centre and the adjacent plot as at 31 December
2016 are €81.2 million, €68.2 million and €29.5 million respectively (FY2015: €84.1 million, €68.2 million, €29.5
million), or a combined total of €178.9 million.
Market Overview
The instability and state of uncertainty prevailing since the 2011 uprising continues to have a negative effect on
Libya’s economy. Ongoing conflict between rival militias has left Libya deeply divided, with vast regions split
under the rule of various Islamist and nationalist groups and armed gangs taking control on a smaller scale.
Since 2014, Libya experienced severe political instability due to the collapse of the central government during
the same year and the country has been going through difficult times ever since. A United Nations-brokered
ceasefire deal was reached in December 2015 and the Libyan Political Agreement to form a Government of
National Accord was signed. On 31 March 2016, the leaders of the new UN-supported unity government
arrived in Tripoli. It is not yet clear whether the new arrangement will succeed, as the unity government has
not yet received the approval of the House of Representatives. As such, it is difficult to ascertain as to when the
political situation in Libya will return to normality and thereafter, how rapidly the economy and state of affairs
will re-establish a sustainable pace of growth and a recovery in business investment.

IHI GROUP FINANCIAL ANALYSIS SUMMARY 19
Operational Performance
The following table sets out the highlights of the hotel’s operating performance for the years indicated therein:
The results for FY2014 reflect the prevailing difficult political environment in the country due to the persistent
conflicts, unstable political situation and the closure of the international airport. In FY2014, revenue declined
by 58%, relative to the year before, to €8.3 million and a gross operating loss of €1.2 million was registered.
On 27 January 2015, the Hotel was the scene of an armed attack and has since remained closed for business. In
FY2015 and the first half of FY2016, repair works were commissioned and completed for the Hotel to resume
operations as and when the current unrest in Libya subsides. During FY2016, the Hotel incurred a gross
operating loss of €3.1 million. As for FY2017, management’s objective r is to try to match increased payroll and
increased operating costs to operating income, if the opportunity arises for the Hotel to re-open for business,
and thereby contribute in some manner towards general overheads such as utilities, security and maintenance
costs. It is projected that revenue in FY2017 will amount to €2.3 million (FY2016: €0.8 million) and is expected
to incur an operating loss of €3.1 million (FY2016: operating loss of €3.1 million).
There are currently no statistics published in terms of hotel performance in Tripoli. As such, no comparison can
be made between the Corinthia Hotel Tripoli and other hotels situated in Tripoli.
Commercial Operations
The following table sets out the turnover of the Commercial Centre adjacent to the Corinthia Hotel Tripoli for
the years indicated therein:
The Commercial Centre which is fully occupied, save for an area of 1,888 square metres, includes rentable
office space having a gross area of 7,249 square metres. It also comprises 306 square metres of storage space
and 235 of internal and external car spaces. To date, the performance of the Commercial Centre remains
largely unaffected by the political conflicts that the country is witnessing.
Corinthia Hotel Tripoli FY2014 FY2015 FY2016 FY2017
Actual Actual Actual Forecast
Turnover (€’000) 8,345 893 799 2,264
Gross operating profit/(loss) before incentive fees (€’000) -1,211 -2,791 -3,104 -3,137
Gross operating profit/(loss) margin (%) -15 -313 -388 -139
Occupancy level (%) 22 2 0 5
Average room rate (€) 212 218 185 194
Revenue per available room (RevPAR) (€) 47 4 0 10
Source: Management information.
Corinthia Hotel Tripoli (commercial property) FY2014 FY2015 FY2016 FY2017
Actual Actual Actual Forecast
Turnover (€’000) 5,863 5,593 5,290 5,000
Source: Management information.

IHI GROUP FINANCIAL ANALYSIS SUMMARY 20
4.7 CORINTHIA HOTEL ST GEORGE’S BAY
Introduction
Five Star Hotels Limited (a fully-owned subsidiary of the Company) owns the 250-room five-star Corinthia Hotel
located in St Julians, Malta (“Corinthia Hotel St George’s Bay”), which was acquired in 2000 for €32 million.
The carrying amount of the Corinthia Hotel St George’s Bay as at 31 December 2016 is €40.5 million (FY2015:
€37.7 million).
Market Overview
i. Economic update
Economic activity in Malta is expected to remain relatively strong in the near term, supported by both demand
and supply factors. In particular, the energy reforms that have taken place in recent years, new investment
projects, increased labour market participation and robust services exports are the primary drivers supporting
the economic expansion. Real GDP growth in 2016 was at 5.0%, and thereafter is projected to decelerate to
4.1% in 2017, 3.7% in 2018 and 3.3% in 2019.
During 2016, Gross Value Added (GVA) increased by €536.8 million when compared to the prior year (2015), to
€8,693.0 million. GVA is the net result of output, valued at basic prices less intermediate consumption valued
at purchasers’ prices. The increase in GVA was mainly generated by professional, scientific & technical activities
and administrative & support services activities which increased by €116.6 million or 11.9%; arts,
entertainment & recreation, repair of household goods & other services which increased by €100.8 million or
9.3%; and public administration & defence, education, human health & social work activities which increased
by €90.2 million or 6.2%. A decrease of €21.0 million or -6.0% was registered in construction.
Economic growth was primarily driven by net exports of goods and services, which increased (in real terms) by
€359.3 million or 63.7% from €563.8 million in 2015 to €923.1 million in 2016. Household consumption
expenditure also increased on a y-o-y basis by €164.3 million or 3.9% to €4,397.1 million. On the other hand,
declines in investment and government consumption were registered in 2016 when compared to a year earlier.
Inflation rose to 1.06% in December 2016, up from 0.68% in November 2016. The main upward impacts on
annual inflation were recorded in the food index, the beverages and tobacco index, and the household
equipment and house maintenance costs. This increase was mitigated by a reduction in the prices of fuel,
clothing and transport.
ii. Tourism market
Tourism in Malta has in recent years been performing at a strong level and this trend continued in 2015 as well
as in 2016. Inbound tourism from January to December 2015 amounted to 1.8 million guests, an increase of
6.0% over the same period in 2014. Although tourists residing in collective accommodation (hotels,
guesthouses, hostels, B&Bs, etc) made up 71.7% of the market in 2015, preference for private accommodation
has been growing in the last years at a faster pace, and actually increased by 18.2% from 2014. Tourism
expenditure was estimated at €1.6 billion, 7.5% higher than that recorded for the comparable period in 2014.
Inbound tourist trips from January to December 2016 amounted to 1.99 million, an increase of 10.2% when
compared to a year earlier. Total nights spent by inbound tourists went up by 5.7%, reaching almost 15.0
million nights. During 2016, total guests in collective accommodation establishments surpassed 1.6 million, an
increase of 2.1% over the same period in 2015. Within the collective accommodation establishments, the 5 star

IHI GROUP FINANCIAL ANALYSIS SUMMARY 21
and 4 star hotels gained 10,878 guests (+2.8%) and 30,779 guests (+4.5%) respectively in 2016 compared to a
year earlier, while there was a decrease of 24,042 guests (-5.7%) in the 3 star category. Tourism expenditure
was estimated at €1.71 billion in 2016, an increase of 4.3% over 2015.
Focus will be maintained on increasing arrivals during the winter months and attracting more visitors from new
markets to Malta. This bodes well for the Maltese hospitality industry as the expectation is to continue to grow
revenues and increase profitability.
Looking forward, Malta’s EU Presidency in the current year (2017) together with Valletta serving as the
European City of Culture in 2018 are widely expected to generate increased demand for hotels and enhance
Malta’s image as a tourist destination, which would in turn generate further growth in the hospitality sector.
Meanwhile, the somewhat uncertain future of the national carrier Air Malta poses a concern to further growth
whilst competition from other Mediterranean countries will likely remain strong.
Operational Performance
The following table sets out the highlights of the hotel’s operating performance for the years indicated therein:
In FY2014, the Corinthia Hotel St George’s Bay registered a 14% increase in revenue over FY2013 to €13.3
million. This positive performance had a significant contribution to gross operating profit of +103% from €1.5
million recorded in FY2013 to over €3.0 million in FY2014, also on account of substantial savings in operating
and administrative costs. As for FY2015, the Hotel continued to perform well, both in terms of revenue
generation and profitability. In fact, revenue and gross operating profit increased by €1.9 million (+14%) and
€1.1 million (+36%) respectively.
Performance improved further in FY2016 as the Hotel increased revenue by 4% to €15.8 million and gross
operating profit increased from €4.1 million in FY2015 to €4.4 million. Occupancy during the said year
improved by 2 percentage points to 81%, whilst average room rate decreased marginally by €2 to €137.
Corinthia Hotel St George's Bay FY2014 FY2015 FY2016 FY2017
Actual Actual Actual Forecast
Turnover (€’000) 13,339 15,225 15,765 15,920
Gross operating profit before incentive fees (€’000) 3,049 4,145 4,399 4,362
Gross operating profit margin (%) 23 27 28 27
Occupancy level (%) 72 79 81 80
Average room rate (€) 127 139 137 140
Revenue per available room (RevPAR) (€) 92 110 111 112
Benchmark performance
Occupancy level (%) 74 78 74 75
Average room rate (€) 130 143 151 156
Revenue per available room (RevPAR) (€) 96 112 112 117
Revenue Generating Index 0.96 0.98 0.99 0.96
Source: Management information.

IHI GROUP FINANCIAL ANALYSIS SUMMARY 22
Management plans to continue to focus on its revenue management strategy of driving business through the
Hotel’s largest growing segment (leisure), principally by undertaking more web-based online and other
marketing initiatives. As such, the Hotel is projected to increase average room rate from €137 in FY2016 to
€140 in FY2017 whilst maintaining occupancy at the 80% level.
The Hotel’s competitive set also recorded positive results in recent years, which is a reflection of the present
buoyant tourism market in Malta. As such, the Hotel performed marginally below par with its competition in
each of the historical years under review, which trend is also being projected for FY2017.
4.8 MARINA HOTEL
Introduction
Marina San Gorg Limited (a fully-owned subsidiary of the Company) owns the 200-room four-star Hotel located
in St Julians, Malta (“Marina Hotel”), adjacent to the Corinthia Hotel St George’s Bay. It was acquired in early
2012 for €23 million. A number of facilities at the Hotel are shared with the Corinthia Hotel St George’s Bay,
which provides guests with a larger product variety, especially with regards to food and beverage offering and
swimming pool areas. Being a four-star hotel with access to five-star conference and meeting space at the
Corinthia Hotel St George’s Bay is another unique selling point of the property. The carrying amount of the
Marina Hotel as at 31 December 2016 is €31.1 million (2015: €28.8 million).
Market Overview
The market overview relating to the economy and tourism in Malta is included in section 4.7 above.
Operational Performance
The following table sets out the highlights of the hotel’s operating performance for the years indicated therein:
Marina Hotel FY2014 FY2015 FY2016 FY2017
Actual Actual Actual Forecast
Turnover (€’000) 7,852 9,486 9,880 9,984
Gross operating profit before incentive fees (€’000) 1,822 2,931 3,048 3,021
Gross operating profit margin (%) 23 31 31 30
Occupancy level (%) 81 82 83 83
Average room rate (€) 87 110 117 118
Revenue per available room (RevPAR) (€) 71 90 97 98
Benchmark performance
Occupancy level (%) 75 75 71 72
Average room rate (€) 90 116 123 127
Revenue per available room (RevPAR) (€) 68 87 87 91
Revenue Generating Index 1.04 1.03 1.11 1.08
Source: Management information.

IHI GROUP FINANCIAL ANALYSIS SUMMARY 23
The sales team has, in recent years, been focusing more on yield management with a drive towards achieving
higher rates by increasing occupancy levels in the higher yielding segments, including leisure and corporate.
Particularly in the leisure segment, last-minute business and online bookings have become more prevalent, and
therefore management is being more restrictive in offering lower yielding tour operator allocations on package
deals.
In consequence, average room rate has increased over the years from €87 in FY2014 to €117 in FY2016, and
RevPAR grew by 37% from €71 to €97 in the same period (an annualised growth of circa 17%). FY2015 was a
very positive year for the Hotel, in which revenue increased by 21% (from €7.9 million in FY2014 to €9.5
million) and gross operating profit increased significantly by 61% (from €1.8 million in FY2014 to €2.9 million).
Growth in FY2016 was more modest as revenue increased y-o-y by 4% to €9.9 million and gross operating
profit also increased by 4% from €2.9 million in FY2015 to €3.0 million. Performance in FY2017 is projected at
the same level registered in FY2016 and as such, revenue is expected to reach €10.0 million and gross
operating profit is estimated at €3.0 million.
As for benchmark performance, the Hotel outperformed its competitive set in FY2014 in terms of occupancy by
6 percentage points. On the other hand, average room rate was lower (-3%) than the benchmark rate at €90. In
FY2015, the Hotel’s occupancy level and RevPAR exceeded the market average by 7 percentage points and 3%
respectively. The Hotel continued to outperform its benchmark in FY2016, particularly with respect to RevPAR
which amounted to €97 compared to €87 achieved by the competitive set. As for FY2017, the Hotel is
projected to surpass its competitive set both in terms of occupancy level (83% as compared to the benchmark
of 72%) and RevPAR (€98 as compared to the reference rate of €91).
4.9 CORINTHIA HOTEL & RESIDENCES LONDON
Introduction
NLI Holdings Limited (equally owned by the Libyan Foreign Investment Company (LFICO) and IHI) owns the 294-
room luxury Corinthia Hotel located in London, United Kingdom (“Corinthia Hotel London”) together with a
penthouse apartment (11 residential apartments in the same premises were sold in April 2014). The said
penthouse has been leased in FY2016 for a maximum period of two years.
In 2008, NLI Holdings Limited acquired the former Metropole Building and its adjoining 10 Whitehall Place for
£136 million (circa €160 million) and after raising a £135 million bank facility in April 2009, which was
subsequently increased to £150 million, embarked on a two-year project to redevelop and reconstruct the said
properties to the luxury Corinthia Hotel and Residences. The carrying amount of 50% of the Corinthia Hotel
London (including the penthouse) as at 31 December 2016 is £232.0 million (equivalent to €271.9 million)
(FY2015: £231.5 million [equivalent to €315.7 million]).
Market Overview
i. Economic update
In the final quarter of 2016, the United Kingdom’s economy continued to defy expectations and remained fairly
impervious to the political uncertainty stemming from Brexit. Revised figures showed that GDP expanded at a
healthy rate of 0.7% in Q4 compared to the prior quarter, up from the preliminary estimate of 0.6% and coming
in above the figure markets had predicted. On an annual basis, GDP over 2016 as a whole expanded by 1.8%,
which was down from the initial estimate of 2.0% and below 2015’s 2.2%.

IHI GROUP FINANCIAL ANALYSIS SUMMARY 24
Breaking GDP down by expenditure, Q4’s growth was underpinned by an improvement in private consumption,
which rose 0.7% compared to Q3. Healthy consumption growth was reflected in an increase in retail sales in
the final quarter of the year. On a less positive note, fixed investment stagnated in Q4, capping off a year of
meagre growth. Behind the disappointing result was a drop in business investment, mainly due to a reduction
in investment in IT and transport equipment. As a result, business investment in 2016 registered the first
annual decline since 2009. The external sector improved, with the external sector’s contribution to growth
swinging from minus 1.2 percentage points in Q3 to plus 1.3 percentage points in Q4, due to exports surging by
4.1% and imports contracting by 0.4%.
Looking at the sector-by-sector picture, services remained the engine of the economy, expanding 0.8% quarter-
on-quarter and marking the 16th consecutive quarter of growth. The rise was driven by an expansion across
the board, with the distribution, hotels and restaurants and transport, storage and communication sub-sectors
performing particularly strongly. Industry rose 0.3% q-o-q, driven by a strong contribution from manufacturing,
while construction showed a 0.2% rise thanks to a boost in public and private new housing work. Agriculture
also performed well, expanding 1.0% q-o-q.
On an annual basis, GDP grew 2.0% in the fourth quarter, below the preliminary estimate of 2.2% and
undershooting analysts’ estimates of a 2.2% expansion (Q3: +2.0% year-on-year). The Central Bank expects the
economy to expand 2.0% in 2017 and 1.6% in 2018.
ii. Tourism market
During the period October to December 2016, the number of overseas residents’ visits to the UK increased by
6% to 9.2 million compared with the corresponding period a year earlier. The total amount spent on these
visits remained the same at £5.3 billion when compared with the same period in 2015.
In the 12 months to December 2016, the number of visits to the UK totalled 37.3 million, 3% higher than a year
earlier and the highest since records began in 1961, while the total amount spent remained unchanged at
£22.2 billion. The UK proved particularly popular with North American and EU visitors, which were both up by
7% and 4% respectively, primarily due to the decline in the value of pound against the dollar and euro following
the vote for Brexit in June 2016. In contrast, visits from other countries fell by 3%. The number of holidays
remained unchanged, business visits and visiting friends and family increased by 2% and 10% respectively.

IHI GROUP FINANCIAL ANALYSIS SUMMARY 25
Operational Performance
The following table sets out the highlights of the hotel’s operating performance for the years indicated therein:
Revenue in FY2014 increased on a y-o-y basis by 2% to £47.5 million and gross operating profit increased by
£0.4 million to £14.4 million. On the other hand, a more substantial increase of £5.0 million (+11%) and £2.2
million (+15%) was registered in revenue and gross operating profit respectively in FY2015 compared to the
results achieved in FY2014, mainly in consequence of an increase in the average room rate from £404 to £445.
The Hotel maintained a positive performance in FY2016 as revenue increased from £52.5 million in FY2015 to
£53.3 million, whilst gross operating profit improved from £16.3 million in FY2015 to £16.7 million. Revenue for
FY2017 is projected to increase by £6.6 million (+12%) principally on account of a higher average room rate of
£474 compared to £433 in FY2016. In turn, gross operating profit is set to grow from £16.7 million in FY2016 to
£19.6 million (+17%) in 2017.
In comparison to benchmark results, the Hotel managed an RGI of 0.70 in FY2014 mainly due to an adverse
difference of £135 in its average room rate. Similar results for the Hotel as compared to its competitive set
were registered in FY2015 (RGI of 0.71). The gap between the Hotel’s performance and its benchmark was
further augmented in FY2016 as the Hotel’s occupancy was lower than its competitive set by 7 percentage
points and the average room rate achieved was lower by £155. The Hotel is expected to improve its
performance in FY2017 compared to the benchmark, and is therefore projected to register a better RGI of 0.71
compared to 0.68 a year earlier.
Corinthia Hotel London FY2014 FY2015 FY2016 FY2017
Actual Actual Forecast Budget
Turnover (£’000) 47,494 52,543 53,274 59,906
Gross operating profit before incentive fees (£’000) 14,374 16,271 16,716 19,563
Gross operating profit margin (%) 30 31 31 33
IHI's share of gross operating profit at 50% 7,187 8,136 8,358 9,782
Occupancy level (%) 72 73 72 68
Average room rate (£) 404 445 433 474
Revenue per available room (RevPAR) (£) 295 323 312 324
Benchmark performance
Occupancy level (%) 76 80 79 79
Average room rate (£) 539 571 588 605
Revenue per available room (RevPAR) (£) 421 455 459 459
Revenue Generating Index 0.70 0.71 0.68 0.71
Source: Management information.
Note: IHI owns 50% of the Corinthia Hotel London and as such its share of profits or losses is included in the consolidated
financial statements of IHI under the heading ‘Share of profit from equity accounted investments’ of the income statement.
As of FY2017, IHI has secured the right to nominate and appoint the majority of board members of NLI such that
IHI can consolidate the performance of this business in the Group financial statements.

IHI GROUP FINANCIAL ANALYSIS SUMMARY 26
4.10 RADISSON BLU RESORT & SPA GOLDEN SANDS
Introduction
The Radisson Blu Resort & Spa Golden Sands commenced operations in October 2005 and is located on a cliff’s
edge overlooking Golden Bay beach on the Northern coast of Malta. IHGH holds a 50% shareholding in the
Golden Sands resort (the other 50% being owned by an experienced international timeshare operator) and title
to the site is in the form of temporary utile dominium which expires in 2114. The five-star resort comprises a
total of 329 rooms, various F&B outlets and is equipped with a 1,000m2 spa and leisure centre, 4 pools, a tennis
court and a private sandy beach.
The carrying amount of 50% of the Radisson Blu Resort & Spa Golden Sands (being the share of IHGH) as at 31
December 2016 is €31.5 million (2015: €32.7 million).
Market Overview
The market overview relating to the economy and tourism in Malta is included in section 4.7 above.
Operational Performance
The following table sets out the highlights of the hotel’s operating performance for the periods indicated
therein:
A significant portion of the property’s inventory is being operated on an upscale vacation ownership
accommodation model (timeshare) through a 50% holding by IHGH in the Azure Group. To date, pursuant to a
room allocation agreement with Azure Resorts Limited (a wholly owned subsidiary of the Azure Group), a total
of 295 rooms have been released for sale on a timeshare basis. The remaining rooms together with any unsold
weeks on the aforesaid 295 rooms are available for use by the resort in its hotel operations.
Radisson Blu Resort & Spa Golden Sands FY2014 FY2015 FY2016 FY2017
12 months 14 months 12 months 12 months
Actual Actual Actual Forecast
Turnover (€’000) 34,229 42,843 40,197 30,394
Timeshare revenue 21,960 27,426 25,614 16,761
Hotel operations 12,269 15,417 14,583 13,633
EBITDA (€’000) 11,954 13,547 14,451 10,692
EBITDA margin (%) 35 32 36 35
IHGH's share of EBITDA at 50% 5,977 6,774 7,226 5,346
Source: Management information.
Note 1: The financial results of the Radisson Blu Resort & Spa Golden Sands are consolidated with the results of IHI, as a line item
under 'share of profits/(losses) of equity accounted investments', with effect from 1 July 2015. As such, financial information in the
table above relating to the period prior to 1 July 2015 has been included for comparison purposes only.
Note 2: In FY2015, IHGH changed its financial year end from 31 October 2015 to 31 December 2015. In this regard, the financial
information for FY2015 covers the 14-month period 1 November 2014 to 31 December 2015.

IHI GROUP FINANCIAL ANALYSIS SUMMARY 27
All timeshare units are being sold for a fixed time period that expires in 2045. Timeshare units are sold in weeks
with the calendar year split into four seasons: Bronze, Silver, Gold and Platinum. As expected, most of the
unsold timeshare weeks to date relate to the (low-season) Bronze and Silver packages (circa 59%). The current
hotel configuration, which has been allocated to the timeshare operation, also includes a total of 13 superior
rooms (marketed as the Heavenly Suites and the Heavenly Collection) that are sold at double the price of the
other rooms. The majority of the timeshare weeks related to these rooms have already been sold.
Timeshare revenue is generated from the sale of timeshare weeks and resale of repossessed timeshare weeks
to targeted vacation ownership guests. ‘Hotel operations’ revenue principally comprises the generation of
yearly maintenance fees receivable from timeshare owners, allocation charges in terms of the aforesaid
agreement with Azure Resorts Limited, fly-buy sales (being discounted rooms offered for promotional
purposes), accommodation revenue (from rooms not utilised by timeshare operations) and revenue from F&B
outlets and other ancillary services. The operating profit is the resultant surplus after deducting operating
expenses, selling and marketing costs, and all administrative and other operating costs.
The table above summarises the results from the operation of the Radisson Blu Resort & Spa and shows that
the principal source of revenue is the sale of timeshare units, which accounted for circa 65% of revenue
between FY2014 to FY2016. The recovery in the UK economy (being Azure’s principal market) and the
strengthening of the UK Pound against the Euro were the main drivers for the robust increase in timeshare
sales in FY2014 (+40%). A similar trend was observed in FY2015, whereby revenue increased by 25% from €22.0
million in FY2014 to €27.4 million. On an annual basis (since FY2015 reflects a 14-month period), average
growth in timeshare sales was of 7% when compared to FY2014.
Revenue for FY2016 was lower by €2.6 million (-6%) when compared to the previous 14-month period of€40.2
million (but on an annualised basis y-o-y revenue was €3.5 million higher (+9.5%)). During the reviewed year,
the vacation ownership operation was adversely impacted on translation of financial results from the Pound
Sterling to the euro currency. The projected revenue for FY2017 has been prudently set at €16.8 million, a
decline of €8.9 million (-34%) when compared to a year earlier.
As for ‘Hotel operations’, revenue generated in FY2015 amounted to €15.4 million, an increase of €3.1 million
from FY2014. Revenue decreased by €0.8 million (-5%) to €14.6 million in FY2016 in comparison to the prior
year. Revenue in FY2017 is projected to decline by 6% (y-o-y) from €14.6 million in FY2016 to €13.6 million.
The resort achieved an EBITDA of €12.0 million in FY2014, a significant increase of €4.8 million (+67%) when
compared to the prior year. This result is a reflection of the sharp increase in timeshare weeks sold during the
said year. A further 13% growth was registered in FY2015 (+€1.6 million), which actually represents a marginal
decline from FY2014 given that FY2015 comprised a 14 month period. FY2016 was a very positive year for the
resort as it generated an EBITDA of €14.5 million, surpassing FY2015’s EBITDA by €0.9 million (notwithstanding
that FY2015 included 14 months of operations). Projected lower timeshare revenue in FY2017, referred to in
the preceding paragraph, is expected to adversely impact EBITDA by €3.8 million (-26%, y-o-y), from €14.5
million in FY2016 to €10.7 million.

IHI GROUP FINANCIAL ANALYSIS SUMMARY 28
4.11 RADISSON BLU RESORT ST JULIANS
Introduction
The Radisson Blu Resort St Julians is a 252 room 5-star hotel located in St George’s Bay, St Julians. The Hotel
commenced operations in May 1997 and provides accommodation and other services to a range of guests,
from leisure to conference and incentive travel groups. The Hotel’s amenities include conference facilities, a
ballroom, an outdoor and a heated indoor pool, a fully equipped gymnasium as well as two tennis courts. The
carrying amount of the Radisson Blu Resort St Julians as at 31 December 2016 is €40.3 million (2015: €37.7
million).
Market Overview
The market overview relating to the economy and tourism in Malta is included in section 4.7 above.
Operational Performance
The following table sets out the highlights of the hotel’s operating performance for the periods indicated
therein:
The Radisson Blu Resort St Julians generated revenue of €10.6 million in FY2014, which was marginally higher
than that generated in FY2013. In FY2015, the Hotel was closed for refurbishment between 1 November 2014
and 30 March 2015, and re-opened as of 31 March 2015. The renovation, estimated at circa €2 million, enabled
the Hotel to better compete in the market and command higher room rates. KPIs outlined in the table above
reflect performance results during the period between April and December 2015 (and exclude the low season
which typically dilutes the better performing spring/summer months). In this respect, although revenue was
Radisson Blu Resort St Julians FY2014 FY2015 FY2016 FY2017
12 months 14 months 12 months 12 months
Actual Actual Actual Forecast
Turnover (€’000) 10,554 10,156 12,811 13,450
Gross operating profit before incentive fees (€’000) 2,214 2,642 4,492 4,509
Gross operating profit margin (%) 21 26 35 34
Occupancy level (%) 68 77 76 80
Average room rate (€) 108 135 123 127
Revenue per available room (RevPAR) (€) 73 104 93 103
Benchmark performance
Occupancy level (%) 76 79 77 77
Average room rate (€) 132 144 146 152
Revenue per available room (RevPAR) (€) 100 113 113 118
Revenue Generating Index 0.73 0.92 0.82 0.87
Source: Management information.
Note 1: The financial results of the Radisson Blu Resort St Julians are consolidated with the results of IHI with effect from 1 July 2015.
As such, financial information in the table above relating to the period prior to 1 July 2015 has been included for comparison purposes only.
Note 2: In FY2015, IHGH changed its financial year end from 31 October 2015 to 31 December 2015. In this regard, the financial
information for FY2015 covers the 14-month period 1 November 2014 to 31 December 2015.

IHI GROUP FINANCIAL ANALYSIS SUMMARY 29
marginally lower when compared to FY2014 by €0.4 million due to the period of closure, the hotel achieved a
higher gross operating profit in FY2015 of €0.4 million, from €2.2 million in FY2014 to €2.6 million.
Revenue generated at the Hotel increased in FY2016 by €2.7 million (+26, y-o-y) and gross operating profit also
increased from €2.6 million in FY2015 to €4.5 million in FY2016. Occupancy rate in FY2016 was broadly
maintained at FY2015 level, but RevPAR was lower by 8% from €104 in FY2015 to €93 (it is to be noted that
RevPAR in FY2015 excludes the dilution effect of the winter months).
In consequence of a robust local tourism market and management’s focus to shift its principal revenue sectors
from tour operator business to direct/online sales, the Hotel is projected to increase both average room rate
(from €123 in FY2016 to €127 in FY2017) and occupancy rate (from 76% in FY2016 to 80% in FY2017). Projected
revenue is thus forecasted to increase by €0.6 million to €13.5 million in FY2017, but no movement is expected
in gross operating profit which should match FY2016’s figure of €4.5 million, in view of an allocation of
common costs incurred by the Company to this Hotel.
4.12 IHI’S AGGREGATE HOTEL REVENUE AND OPERATING PROFIT
Revenue Geographic Distribution
The chart below depicts total revenue generated by each hotel as a percentage of aggregate hotel revenue
generated by the Group’s hotels. In the case of the Corinthia Hotel London and the Radisson Blu Resort & Spa
Golden Sands, the amounts included for each year is 50% of actual revenue, reflecting the 50% shareholding
(directly or indirectly) of IHI in the respective hotels.
0%
5%
10%
15%
20%
25%
Budapest St Petersburg
Lisbon Prague Tripoli St George Marina London Golden Sands
Radisson St Julians
% share of revenue (by hotel)
FY2012
FY2013
FY2014
FY2015
FY2016
FY2017(P)
Source: Management information.

IHI GROUP FINANCIAL ANALYSIS SUMMARY 30
The above chart shows that the Corinthia Hotel & Residences London generates over 20% of total hotel
revenue. This percentage share peaked in FY2015 to 22% as the Corinthia Hotel Tripoli and Corinthia Hotel St
Petersburg underperformed in view of political and economic issues in their respective jurisdictions. Pursuant
to the acquisition of IHGH, and the consolidation of its results as from 1 July 2015, two properties (namely,
Radisson Blu Resort & Spa Golden Sands and Radisson Blu Resort St Julians) have been included in the portfolio
of hotels. Apart from the positive effect on revenue contribution towards IHI, the increase in properties will
further dilute the reliance on the performance on any particular hotel property. As a consequence of the
introduction of these two properties, coupled with a gradual increase in operating performance at the
Corinthia Hotel St Petersburg and the adverse effect of the Euro/Sterling exchange rate on earnings of the
London property, income generated in FY2016 by Corinthia Hotel & Residences London constituted circa 18%
of revenue derived from all hotels. Likewise, the revenue generation from the other hotels, although increasing
in real terms (year-on-year), has reduced in percentage terms in FY2016. In the projected year (FY2017),
revenue generated by the Corinthia Hotel London is expected to represent 19% of total Group revenue,
followed by Corinthia Hotel Budapest at 14%.
Operating Profit Geographic Distribution
The chart below shows operating profit generated by each hotel as a percentage of IHI’s hotel operating profit
(directly or indirectly). The amounts relating to the Corinthia Hotel London and the Radisson Blu Resort & Spa
Golden Sands are only 50% of each hotel’s actual results, reflecting the 50% shareholding (directly or indirectly)
of IHI in the respective hotels.
Until FY2013, the primary contributors to operating profit included Corinthia Hotel Tripoli, Corinthia Hotel St
Petersburg, Corinthia Hotel Budapest and Corinthia Hotel & Residences London. Thereafter, and particularly in
FY2014 and FY2015, operating profits generated by Corinthia Hotel Tripoli and Corinthia Hotel St Petersburg
declined substantially for country specific reasons mentioned elsewhere in this report. Such decreases had a
0%
5%
10%
15%
20%
25%
30%
% share of total operating profit (by hotel)
FY2012
FY2013
FY2014
FY2015
FY2016
FY2017(P)
Source: Management information.

IHI GROUP FINANCIAL ANALYSIS SUMMARY 31
material adverse effect on the consolidated operating profit of IHI, which was however mostly mitigated by the
continued improvement in the operating results of IHI’s European hotels.
The other hotels all registered improvements in their respective operating profit results relative to the previous
year. The Radisson Blu Resort & Spa Golden Sands and the Radisson Blu Resort St Julians, being part of the
IHGH acquisition in FY2015, have contributed in aggregate circa 13% of IHI’s total operating profit from hotel
operations in FY2016. No material changes in percentage contribution per hotel are being projected for
FY2017, other than an improvement in Corinthia Hotel St Petersburg from 18% in FY2016 to 21% and Corinthia
Hotel London from 16% in FY2016 to 18%.
4.13 MANAGEMENT COMPANY
CHI Limited (a fully-owned subsidiary of IHI) manages and operates a number of hotel properties,
predominantly owned by IHI and CPHCL. IHI acquired the shares of CHI in three tranches: a 20% shareholding
was purchased on IHI’s formation in 2000 at a cost of circa €750,000, a further 50% was acquired in October
2006 at a cost of €20.15 million, and in May 2012 IHI acquired the remaining 30% from Wyndham for an
aggregate consideration of €250,000 in terms of an agreement signed in 2006 (at the same time of acquisition
of the 50% share purchase).
CHI is a full-service hotel management company with in-house skills and capabilities supporting the Corinthia
brand and operations. It has a track record of driving performance improvements across the Corinthia Group’s
existing assets, those of CPHCL and of third parties. It ensures consistent service levels and performance across
the properties. CHI is scaled to support future growth of Corinthia. CHI currently manages 19 hotels (10 owned
by IHI and 7 owned by third parties and a further 2 under development). In 2016, it signed a technical and pre-
opening services and management agreement for the development and eventual management of a Corinthia
hotel for a third party owner in Dubai. In 2017, it signed a management agreement for two operational hotels
owned by a third party in Dubai on a white label basis. CHI management contracts are entered into and
structured for a 20-year term. Its key commercial terms include management fees, marketing and reservation
fees based on turnover and incentive fees based on gross operating profit achieved. It is an efficient use of
capital and resource with no capital outlay required for each new management contract and a cost-effective
way to gain in-depth knowledge of various markets.

IHI GROUP FINANCIAL ANALYSIS SUMMARY 32
Further detail on the managed hotels is provided hereunder:
Operational Performance
The following table sets out the turnover of CHI Limited for the years indicated therein:
CHI LIMITED
Managed Hotel Portfolio as at 31 December 2016
Name Location % ownership
No. of hotel
rooms
Owned and managed properties (operational)
Corinthia Hotel Budapest Hungary 100 440
Corinthia Hotel St Petersburg Russia 100 388
Corinthia Hotel Lisbon Portugal 100 518
Corinthia Hotel Prague Czech Republic 100 539
Corinthia Hotel Tripoli Libya 100 299
Corinthia Hotel St George’s Bay Malta 100 250
Marina Hotel St George’s Bay Malta 100 200
Radisson Blu Resort St Julians Malta 100 252
Radisson Blu Resort & Spa Golden Sands Malta 50 329
Corinthia Hotel & Residences London United Kingdom 50 294
Owned & managed properties (under development)
Corinthia Grand Astoria Hotel Brussels Belgium 50 124
Managed properties (operational)
Panorama Hotel Prague Czech Republic - 440
Aquincum Hotel Budapest Hungary - 310
Corinthia Palace Hotel & Spa Malta - 150
Ramada Plaza Tunisia - 309
Corinthia Hotel Khartoum Sudan - 230
The Meydan Hotel Dubai - 284
Bab El Shams Hotel Dubai - 115
Managed properties (under development)
Corinthia Hotel Meydan Dubai - 360
5,831
CHI Limited (Management Fees) FY2014 FY2015 FY2016 FY2017
Actual Actual Actual Forecast
Turnover (€’000) 11,305 13,702 14,207 16,342
IHI Properties (owned and associate) (€’000) 9,463 11,717 11,596 12,587
Other Properties (€’000) 1,842 1,985 2,611 3,755
Source: Management information.
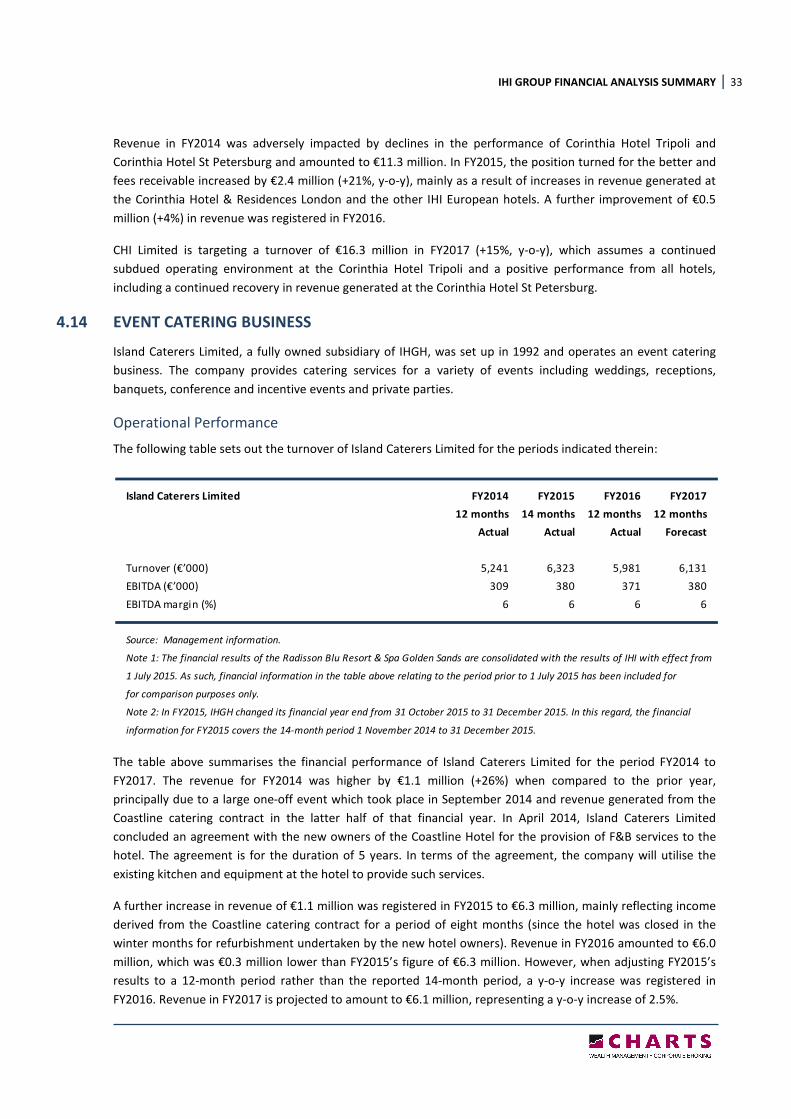
IHI GROUP FINANCIAL ANALYSIS SUMMARY 33
Revenue in FY2014 was adversely impacted by declines in the performance of Corinthia Hotel Tripoli and
Corinthia Hotel St Petersburg and amounted to €11.3 million. In FY2015, the position turned for the better and
fees receivable increased by €2.4 million (+21%, y-o-y), mainly as a result of increases in revenue generated at
the Corinthia Hotel & Residences London and the other IHI European hotels. A further improvement of €0.5
million (+4%) in revenue was registered in FY2016.
CHI Limited is targeting a turnover of €16.3 million in FY2017 (+15%, y-o-y), which assumes a continued
subdued operating environment at the Corinthia Hotel Tripoli and a positive performance from all hotels,
including a continued recovery in revenue generated at the Corinthia Hotel St Petersburg.
4.14 EVENT CATERING BUSINESS
Island Caterers Limited, a fully owned subsidiary of IHGH, was set up in 1992 and operates an event catering
business. The company provides catering services for a variety of events including weddings, receptions,
banquets, conference and incentive events and private parties.
Operational Performance
The following table sets out the turnover of Island Caterers Limited for the periods indicated therein:
The table above summarises the financial performance of Island Caterers Limited for the period FY2014 to
FY2017. The revenue for FY2014 was higher by €1.1 million (+26%) when compared to the prior year,
principally due to a large one-off event which took place in September 2014 and revenue generated from the
Coastline catering contract in the latter half of that financial year. In April 2014, Island Caterers Limited
concluded an agreement with the new owners of the Coastline Hotel for the provision of F&B services to the
hotel. The agreement is for the duration of 5 years. In terms of the agreement, the company will utilise the
existing kitchen and equipment at the hotel to provide such services.
A further increase in revenue of €1.1 million was registered in FY2015 to €6.3 million, mainly reflecting income
derived from the Coastline catering contract for a period of eight months (since the hotel was closed in the
winter months for refurbishment undertaken by the new hotel owners). Revenue in FY2016 amounted to €6.0
million, which was €0.3 million lower than FY2015’s figure of €6.3 million. However, when adjusting FY2015’s
results to a 12-month period rather than the reported 14-month period, a y-o-y increase was registered in
FY2016. Revenue in FY2017 is projected to amount to €6.1 million, representing a y-o-y increase of 2.5%.
Island Caterers Limited FY2014 FY2015 FY2016 FY2017
12 months 14 months 12 months 12 months
Actual Actual Actual Forecast
Turnover (€’000) 5,241 6,323 5,981 6,131
EBITDA (€’000) 309 380 371 380
EBITDA margin (%) 6 6 6 6
Source: Management information.
Note 1: The financial results of the Radisson Blu Resort & Spa Golden Sands are consolidated with the results of IHI with effect from
1 July 2015. As such, financial information in the table above relating to the period prior to 1 July 2015 has been included for
for comparison purposes only.
Note 2: In FY2015, IHGH changed its financial year end from 31 October 2015 to 31 December 2015. In this regard, the financial
information for FY2015 covers the 14-month period 1 November 2014 to 31 December 2015.

IHI GROUP FINANCIAL ANALYSIS SUMMARY 34
The company is expected to register an EBITDA margin of 6%, which is unchanged when compared to prior
years. The sales mix is not expected to change in FY2017 and will continue to comprise weddings, corporate
events, conference incentive travel (CIT) and the Coastline catering contract.
4.15 FOOD RETAIL AND CONTRACT CATERING BUSINESS (INCLUDING COSTA COFFEE)
In May 2011, IHGH acquired 50% of the share capital of Buttigieg Holdings Ltd (“BHL”), a company operating in
the food retail and contract catering sector. The acquisition of the remaining 50% in BHL was completed in June
2015, prior to IHI’s acquisition of IHGH. BHL, through subsidiary companies (both locally and overseas),
operates the Costa Coffee franchise in Malta and in the East Coast territory of Spain, the Balearic Islands and
the Canary Islands.
The Coffee Company Malta Limited (“TCCM”), a wholly owned subsidiary of BHL, entered into a 10-year
franchise agreement with Costa Coffee International Limited in May 2012 for the development of Costa Coffee
retail outlets in Malta. The first Costa Coffee outlet was opened in June 2012 at the check-in lounge of the
Malta International Airport. Since then, another nine Costa Coffee outlets were opened (three outlets at the
Malta International Airport [one in the arrivals area, another in the Schengen area and the third one in the non-
Schengen area] and one outlet in each of The Point Shopping Complex Sliema, the premises formerly known as
Papillon in Balzan, The Embassy Valletta, Bay Street Complex St Julians, Marsaxlokk [opened in February 2016]
and Spinola Bay St Julians [opened in April 2016]). The company plans to open a further three outlets in Malta
over the coming years.
In March 2014, The Coffee Company Spain S.L. (“TCCS”), a wholly owned subsidiary of BHL, entered into a 10-
year franchise agreement with Costa Coffee International Limited for the development and operation of up to
75 Costa Coffee outlets in the East Coast of Spain, the Balearic and Canary Islands. The first outlet in Spain
opened in the third quarter of 2014 and as at the date of this report, total openings has increased to 15 outlets.
Nine of these outlets are located in Barcelona with the other six located in Valencia (2), Palma (2) and
Benidorm (2). A sixteenth outlet will be opening in June 2017 bring the number of stores in Barcelona to a total
of 10. The company is currently consolidating its position on the Spanish market and once results achieve the
required levels of performance, further outlets will be opened across the region.

IHI GROUP FINANCIAL ANALYSIS SUMMARY 35
Operational Performance
The following table sets out the turnover of BHL for the years indicated therein:
In FY2014 BHL generated a turnover of €7.6 million, an increase of 17% on FY2013. During the year, eight Costa
outlets were in operation in Malta with the Bay Street outlet only commencing operations in the latter quarter
of FY2014. Revenue generated in FY2015 by TCCM amounted to €6.6 million, almost double the turnover figure
of FY2014. This positive movement resulted from the fact that the eight outlets were operational for the full
financial year, improved performance registered by all outlets, and the additional two months’ revenue in the
financial period due to a change in year end. A further two outlets were opened in FY2016, and revenue
generated from the 10 outlets amounted to €7.1 million (+7%, y-o-y). The same outlets are expected to
generate the same level of revenue in FY2017 as in the prior year.
The operation of Costa outlets in Spain commenced in FY2014 with one outlet opening in Barcelona. By end
FY2015, TCCS opened a further nine outlets and generated €1.9 million in revenue. An additional five outlets
initiated operations in FY2016 and aggregate revenue amounted to €4.6 million. Revenue in FY2017 is
projected to increase by €1.7 million to €6.3 million from a total of 16 outlets.
Revenue derived from ’other catering operations’ in FY2014 amounted to €4.0 million and increased to €5.4
million in FY2015. The increase was mainly due to the additional two months’ revenue in the financial year.
Revenue for FY2016 amounted to€3.3 million, which is comparably lower than normalised revenue generated
in FY2015 of €4.6 million (being €5.4 million as adjusted to reflect a 12-month period). The lower revenue
registered in FY2016 (€3.3 million as compared to €5.4 million in FY2015) is primarily the result of consolidation
of certain catering operations with other companies forming part of the Corinthia Group. In FY2017,
management is projecting revenue to amount to €3.2 million, which is broadly similar to the performance
reported for FY2016.
Buttigieg Holdings Limited (including Costa Coffee) FY2014 FY2015 FY2016 FY2017
12 months 14 months 12 months 12 months
Actual Actual Actual Forecast
Turnover
Costa Coffee (Malta) (€’000) 3,518 6,647 7,081 7,045
Costa Coffee (Spain) (€’000) 1,906 4,592 6,315
Other catering operations (€’000) 4,036 5,419 3,313 3,238
7,554 13,972 14,986 16,598
EBITDA (€’000) 651 -413 -1,231 999
EBITDA margin (%) 9 -3 -8 6
Costa Malta
No. of outlets (at end of financial year) 8 8 10 10
Costa Spain
No. of outlets (at end of financial year) 1 10 15 16
Source: Management information.
Note 1: The financial results of the Buttigieg Holdings Limited are consolidated with the results of IHI with effect from 1 July 2015.
As such, financial information in the table above relating to the period prior to 1 July 2015 has been included for comparison purposes only.
Note 2: In FY2015, IHGH changed its financial year end from 31 October 2015 to 31 December 2015. In this regard, the financial
information for FY2015 covers the 14-month period 1 November 2014 to 31 December 2015.

IHI GROUP FINANCIAL ANALYSIS SUMMARY 36
4.16 OTHER ASSETS
In December 2010, IHI acquired the ‘Corinthia’ brand from Corinthia Palace Hotel Company Limited. The
transaction provides for a two tier settlement whereby: (i) IHI initially paid the amount of €19.6 million for the
existing room stock operated under the Corinthia brand; and (ii) IHI will also pay a pre-agreed price to Corinthia
Palace Hotel Company Limited every time a Corinthia hotel opens for business until 2020. The amount of €19.6
million is recognised as an intangible asset in the balance sheet of IHI.
IHI has a 55% equity participation in Libya Hotel Development and Investment JSC, a company that acquired a
derelict building formerly known as the El-Jazeera Hotel and adjoining site in Benghazi, Libya. Libya Hotel
Development and Investment JSC will eventually develop a mixed-use project consisting of a 228-room five-star
hotel, 2,000m2 of retail space and 10,000m
2 of office space. Whilst the necessary planning permits for the
project were issued by the Benghazi planning authorities and demolition works commenced in January 2014, in
light of the prevailing situation in Libya all works on this development have been put on hold, and current plans
are due for reconsideration depending on future developments in Libya. It is anticipated that the funding
required for the project, once resumed, will be sourced from a combination of equity injected by the
shareholders and appropriate bank financing.
IHI owns 25% of the share capital of Medina Tower Joint Stock Company, a company set up for the purpose of
owning and developing the Medina Tower, in Tripoli. IHI has to date injected €13 million in the company as its
equity participation. The parcel of land, over which the project will be developed, measures circa 11,000m2 and
is situated in Tripoli’s main high street and business district. The architectural concept stems from a 4-storey
podium that will include a mix of residential, retail, commercial and conference space. A curved tower rises
from the 6th
level and peaks at the 40th
level, where a double height restaurant will complete the property. The
development will comprise a total gross floor area of circa 199,000m2.
The project designs of the Medina Tower are complete and all development approvals have been obtained
from the relevant authorities. As to the financing of the project, the equity contribution for the first phase of
this project is already fully paid up and will comprise 40% of the capital requirement for the said project. The
remaining 60% of funding will be derived from a Libyan financial institution in terms of a sanction letter that
has been approved and signed, but now needs to be reactivated. The project is on hold until Libya stabilises
and its prospects improve.
IHI owns 100% of QPM Limited, a company which specialises in construction and project management services,
both locally and overseas. QPM Limited operates independently of, and at arm’s length to, IHI and offers a
range of project, construction and cost management services and design and architectural services to a number
of international clients in various countries. In August 2012 the offices of David Xuereb and Associates and
QPM Limited merged to provide a more comprehensive list of professional services within the construction
industry, including project and construction management and architectural services. Whilst continuing to
provide services to the Corinthia Group, QPM Limited is increasing its third party client base. In FY2015, the
majority of QPM Limited’s income was derived from third party clients’ engagements.
As part of the IHGH acquisition, IHI took ownership of a plot of land at Hal Ferh measuring 83,530m2, situated
adjacent to the Radisson Blu Resort & Spa, Golden Sands, Malta. The property is valued in the balance sheet as
at 31 December 2016 of IHGH at €21.6 million (2015: €21.6 million). The Group is currently in the process of
assessing the project designs and concept and funding requirements, prior to embarking on the execution of
this project

IHI GROUP FINANCIAL ANALYSIS SUMMARY 37
5. BUSINESS DEVELOPMENT STRATEGY
The Group’s business strategy focuses on achieving positive and sustainable financial results, and appreciation
in the value of the Group’s properties and investments. In the execution of the Group’s strategy, management
aims to provide a high quality service at each hotel and treat customers to a unique hospitality experience.
Through the provision of better quality offerings the brand value is further enhanced, and leads management
to achieve its objective of improving occupancy levels and average room rates. Moreover, it enables the Group
to target higher-yielding customers, in particular from the leisure and conference & event segments.
Electronic booking portals have in recent times gained importance in generating room reservations. In this
respect, the Group is continuously optimising its website ‘Corinthia.com’, developing further its online
reservation system and investing in online marketing.
From a cost perspective, better results are being achieved through the implementation of cost-control and
energy-efficient measures at Group hotels.
The Group’s strategy focuses on the operation of hotels that are principally in the five star category and
ongoing investment in their upkeep is given due importance in order to preserve their attractiveness and
incremental value.
In addition to the aforementioned strategy for internal growth, the Group aims to grow its business externally
by further expanding the portfolio of hotels and mixed-use properties and venturing into other businesses
through:
Acquisitions, joint ventures and developments
Management remains active in growing the Group’s portfolio of hotels and mixed-use properties by
acquisition, particularly if these entail a potential for capital appreciation. In 2015, the Group acquired IHGH
which, inter alia, will enable the Group to redevelop the three hotels located near St George’s Bay, St Julian’s,
Malta into a mixed-use luxury development. This recent acquisition will also allow the Group to diversify its
revenue streams through the expansion of Costa Coffee outlets principally in Spain. Furthermore, other mixed-
use properties described elsewhere in this report are earmarked for development in the coming years, which
are expected to generate positive returns for the Group. It is projected that further acquisition opportunities
will arise as a result of the extensive network of contacts of the Directors and Chief Executives of the Corinthia
Group. If available at attractive prices and subject to funding, the Group is principally interested to acquire
hotels in its target markets, including certain European cities.
On 11 April 2016, NLI Holdings Ltd (in which IHI owns a 50% shareholding) acquired the entire issued share
capital of the Belgian hotel-owning company, Hotel Astoria S.A., resulting in the acquisition of the Grand Hotel
Astoria in Brussels. The Grand Hotel Astoria was built in 1910 by a Belgian aristocratic family and at the time it
was acquired by its last owners in 2007 it was operated as a 145 room hotel. After it was bought by the hotel’s
former owners in 2007, it closed down for business with a view to carrying out an intensive refurbishment.
However, such refurbishment failed to get underway and the asset has laid desolate for the last ten years. The
hotel, once redeveloped, will be renamed the Corinthia Grand Astoria Hotel. The refurbishment of the Grand
Hotel Astoria will add another key destination to the Corinthia brand’s growing portfolio.

IHI GROUP FINANCIAL ANALYSIS SUMMARY 38
Management contracts
Where attractive opportunities arise, the Group will seek to expand its portfolio of hotels by entering into
agreements to manage hotels for third party owners. The strength of the Corinthia brand, its reservation
system and online presence, and the quality of its existing operations has already translated into tangible
results through the introduction of third party owned hotels into the Corinthia brand offering and has placed it
in a good position to establish such relationships, as is evident with the new relationships in Dubai and Doha.
PART 3 – PERFORMANCE REVIEW
The financial information provided hereunder is extracted from the audited consolidated financial statements
of IHI for each of the years ended 31 December 2014 to 31 December 2016.
The audit report contained in the audited consolidated financial statements for the year ended 31 December
2015 includes an emphasis of matter relating to the significant political and economic uncertainties prevailing
in Libya and their impact on the Group’s results for 2015. An overview of operations situated in Libya and
related financial performance is provided in this report in sections 4.6 “Corinthia Hotel Tripoli” and 4.16 “Other
Assets”.
Note 5 to the 2016 financial statements explains the significant uncertainties and judgments surrounding the
valuation of the Group’s assets in Libya that have a bearing on the projected cash flows from the relative
operations, and which are in turn influenced by the timing of a recovery in the country. Different plausible
scenarios may impact the financial performance of the Libya operations and the valuation of related assets in a
significant matter. This matter is considered to be of fundamental importance to stakeholders because of the
potential impact that this uncertainty may have on the valuation of the Group’s assets in Libya and the
recoverability of certain debtors, which as at 31 December 2016 were carried at €192.5 million and €6.1 million
respectively.
The forecasted financial information for the year ending 31 December 2017 has been provided by management
of the Company. In the said financial year, IHI secured the right to nominate and appoint the majority of the
board of directors of NLI such that IHI can consolidate the performance of the Corinthia Hotel London in its
financial statements.
The projected financial statements relate to events in the future and are based on assumptions which IHI
believes to be reasonable. Consequently, the actual outcome may be adversely affected by unforeseen
situations and the variation between forecast and actual results may be material. With specific reference to
IHI’s operation in Libya, assessment of future performance is more difficult to forecast due to the ongoing
political instability and the ensuing economic situation in the country. In view of this state of affairs, the
actual results from the operation in Libya may vary significantly from projections.
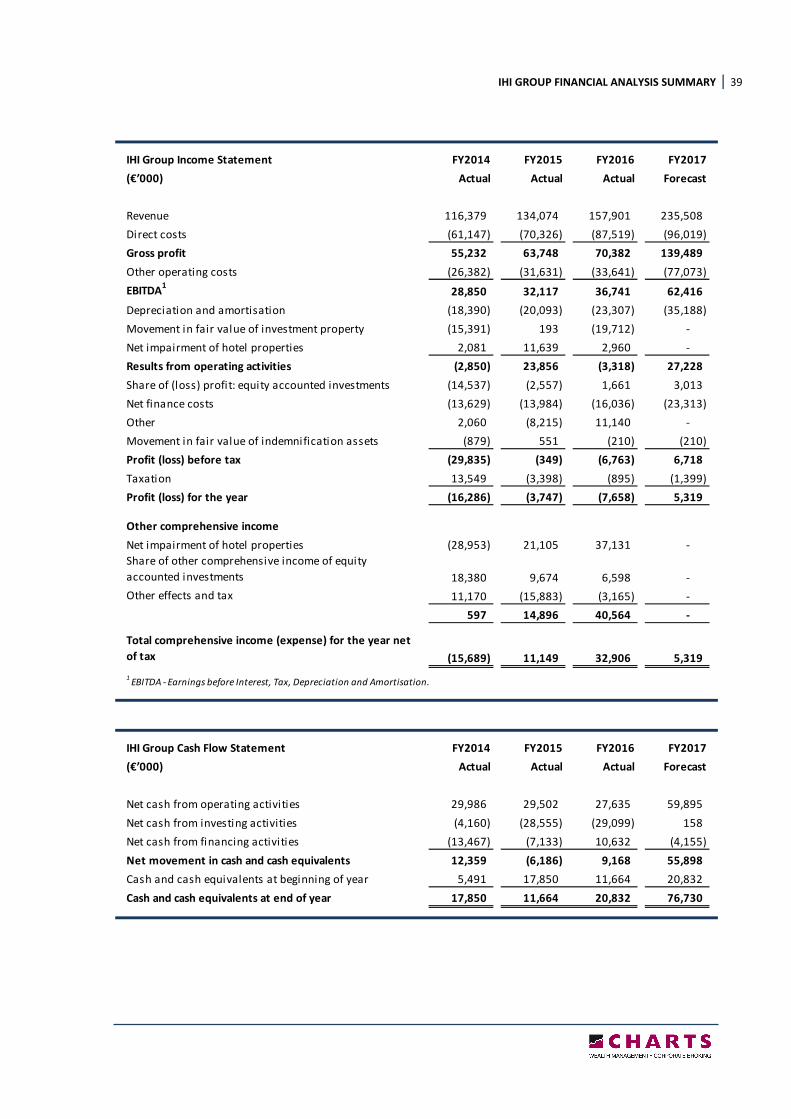
IHI GROUP FINANCIAL ANALYSIS SUMMARY 39
IHI Group Income Statement FY2014 FY2015 FY2016 FY2017
(€’000) Actual Actual Actual Forecast
Revenue 116,379 134,074 157,901 235,508
Direct costs (61,147) (70,326) (87,519) (96,019)
Gross profit 55,232 63,748 70,382 139,489
Other operating costs (26,382) (31,631) (33,641) (77,073)
EBITDA1
28,850 32,117 36,741 62,416
Depreciation and amortisation (18,390) (20,093) (23,307) (35,188)
Movement in fair value of investment property (15,391) 193 (19,712) -
Net impairment of hotel properties 2,081 11,639 2,960 -
Results from operating activities (2,850) 23,856 (3,318) 27,228
Share of (loss) profit: equity accounted investments (14,537) (2,557) 1,661 3,013
Net finance costs (13,629) (13,984) (16,036) (23,313)
Other 2,060 (8,215) 11,140 -
Movement in fair value of indemnification assets (879) 551 (210) (210)
Profit (loss) before tax (29,835) (349) (6,763) 6,718
Taxation 13,549 (3,398) (895) (1,399)
Profit (loss) for the year (16,286) (3,747) (7,658) 5,319
Other comprehensive income
Net impairment of hotel properties (28,953) 21,105 37,131 -
Share of other comprehensive income of equity
accounted investments 18,380 9,674 6,598 -
Other effects and tax 11,170 (15,883) (3,165) -
597 14,896 40,564 -
Total comprehensive income (expense) for the year net
of tax (15,689) 11,149 32,906 5,319
1EBITDA - Earnings before Interest, Tax, Depreciation and Amortisation.
IHI Group Cash Flow Statement FY2014 FY2015 FY2016 FY2017
(€’000) Actual Actual Actual Forecast
Net cash from operating activities 29,986 29,502 27,635 59,895
Net cash from investing activities (4,160) (28,555) (29,099) 158
Net cash from financing activities (13,467) (7,133) 10,632 (4,155)
Net movement in cash and cash equivalents 12,359 (6,186) 9,168 55,898
Cash and cash equivalents at beginning of year 5,491 17,850 11,664 20,832
Cash and cash equivalents at end of year 17,850 11,664 20,832 76,730

IHI GROUP FINANCIAL ANALYSIS SUMMARY 40
IHI Group Balance Sheet 31 Dec'14 31 Dec'15 31 Dec'16 31 Dec'17
(€’000) Actual Actual Actual Forecast
ASSETS
Non-current assets
Intangible assets 43,556 55,989 56,769 56,172
Indemnification assets 21,687 22,238 24,025 22,028
Investment property 176,675 166,274 164,278 211,155
Property, plant and equipment 494,971 572,103 617,765 1,108,061
Investments in associates 213,241 267,045 250,913 52,926
Loan receivable 3,208 3,728 4,570 4,494
Assets placed under trust management 7,967 3,870 1,077 2,145
961,305 1,091,247 1,119,397 1,456,981
Current assets
Inventories 5,307 6,280 6,727 10,430
Loan receivable - 7,325 12,982 -
Trade and other receivables 23,309 33,032 42,151 49,432
Taxation 2,639 2,896 4,654 4,633
Cash and cash equivalents 19,480 18,863 29,382 81,458
Assets placed under trust management - - 4,961 -
50,735 68,396 100,857 145,953
Total assets 1,012,040 1,159,643 1,220,254 1,602,934
EQUITY
Capital and reserves
Called up share capital 554,239 573,636 597,750 597,750
Reserves and other equity components 88,886 86,719 108,797 130,797
Retained earnings (48,941) (52,665) (60,323) (54,730)
Minority interest 630 598 598 199,028
594,814 608,288 646,822 872,845
LIABILITIES
Non-current liabilities
Borrowings and bonds 271,464 342,616 370,486 524,626
Other non-current l iabilities 82,938 108,740 117,365 98,411
354,402 451,356 487,851 623,037
Current liabilities
Borrowings and bonds 27,787 25,784 34,906 39,262
Other current liabil ities 35,037 74,215 50,675 67,790
62,824 99,999 85,581 107,052
417,226 551,355 573,432 730,089
Total equity and liabilities 1,012,040 1,159,643 1,220,254 1,602,934

IHI GROUP FINANCIAL ANALYSIS SUMMARY 41
In view of the prolonged instability in Libya and the political issues between Russia and Ukraine, revenue
generated at Corinthia Hotel Tripoli and Corinthia Hotel St Petersburg in FY2014 was lower than the prior year
by circa €16.1 million. Such reduction was however partly compensated by increased revenues at the other IHI
properties and therefore the overall decrease in income for the said financial year was limited to €7.4 million (a
reduction of 6%). This reduction in income inevitably impacted IHI’s EBITDA, which decreased by 18% from
€35.0 million in 2013 to €28.9 million in 2014. The depreciation charge for 2014 reduced by more than €5.4
million (from €23.8 million in 2013 to €18.4 million in 2014) as no provision was required on assets that were
fully depreciated.
In April 2014, 11 apartments in Whitehall Place London forming part of the Corinthia Hotel & Residences
London, of which IHI holds a 50% stake, were sold to third parties. The penthouse apartment was retained and
will be sold when the right opportunity arises. Except for one-off property costs resulting from the aforesaid
sale of the apartments, the disposal had no effect on IHI’s financial statements since the apartments were
already valued at their market price in 2013. A loss was registered from equity accounted investments (London
Hotel and Residences) for 2014 of €14.6 million, in consequence of building taxes, depreciation, interest and
the one-time selling costs of the 11 apartments as the hotel performance registered a marginal improvement
in performance in 2014 over 2013.
Key Accounting Ratios FY2014 FY2015 FY2016 FY2017
Gross profit margin 47% 48% 45% 59%
(Gross profit/revenue)
Operating profit margin 25% 24% 23% 27%
(EBITDA/revenue)
Interest cover (times) 2.12 2.30 1.39 2.68
(EBITDA/net finance cost)
Net profit margin -14% -3% -5% 2%
(Profit after tax/revenue)
Earnings per share (€) -0.03 -0.01 -0.01 0.01
(Profit after tax/number of shares)
Return on equity -3% -1% -1% 1%
(Profit after tax/shareholders’ equity)
Return on capital employed 3% 3% 3% 4%
(EBITDA/total assets less current liabilities)
Return on assets -2% 0% -1% 0%
(Profit after tax/total assets)
Source: Charts Investment Management Service Limited

IHI GROUP FINANCIAL ANALYSIS SUMMARY 42
Finance costs in FY2014 were lower by approximately €2.3 million (from €15.9 million in 2013 to €13.6 million
in 2014) as a result of reduced EURIBOR1 rates in 2014 coupled with the further reduction of IHI’s debt in
consequence of scheduled repayments of bank loans. After accounting for movements in fair value of
properties described hereunder, IHI recorded a loss for the year ended 31 December 2014 of €16.3 million
(2013: Profit of €0.3 million).
On a yearly basis, a value in use assessment is carried out on IHI’s hotels and investment properties by
independent advisors. This process involves the preparation of 10-year future cash flows prepared by an expert
in the hospitality industry and financial modeling by an independent accountancy firm. In 2014, the aforesaid
process was performed on all IHI properties other than the Corinthia Hotel Tripoli, due to the then current
uncertain environment prevailing in Libya which presented significant difficulty for such advisors to determine
a value in use of the property.
As such, a value in use on the Corinthia Hotel Tripoli was determined after the independent advisors presented
several scenarios and parameters to the directors for their consideration. The directors resolved to adopt the
more prudent basis of valuation by applying the model with higher country and other risk premia, and assumed
a weaker outlook on future performance. In consequence, the value of the property was impaired by €34.9
million.
As denoted in the above table, IHI was negatively impacted in 2014 by a reduction of €69.2 million in the values
of its properties in Tripoli and St Petersburg (hotels and commercial centres) in consequence of the force
majeure situation prevailing in each of the said jurisdictions and the devaluation of the Russian Rouble. On the
other hand, through the robust performance achieved by a number of IHI’s European hotels, IHI registered an
1 The Euro Interbank Offered Rate (EURIBOR) is a daily reference rate, published by the European Money Markets Institute,
based on the average interest rates at which Eurozone banks offer to lend unsecured funds to other banks in the euro wholesale money market (or interbank market).
Analysis of Movements in Property Values
for the year ended 31 December 2014 Other
(€’000) Income Comprehensive
Statement Income Total
Corinthia Hotel Lisbon 1,240 13,728 14,968
Lisbon Apartments (156) - (156)
Corinthia Hotel Budapest 10,357 - 10,357
Marina Hotel 1,766 - 1,766
Corinthia Hotel Tripoli (8,038) (26,814) (34,852)
Tripoli Commercial Centre (5,659) - (5,659)
Corinthia Hotel St Petersburg (3,243) (15,867) (19,110)
St Petersburg Commercial Centre (9,577) - (9,577)
Corinthia Hotel & Residences London - 17,933 17,933
Net movement in property values (13,310) (11,020) (24,330)
Classified in the financial statements as follows:
Movement in fair value of investment property (15,391) - (15,391)
Net impairment reversal (loss) on hotel properties 2,081 (28,953) (26,872)
Revaluation of hotel property (equity accounted investments) - 17,933 17,933
Net movement in property values (13,310) (11,020) (24,330)

IHI GROUP FINANCIAL ANALYSIS SUMMARY 43
improvement of €44.9 million in the fair values of such properties, most notably of which is the uplift in the
hotels situated in London (limited to 50% share), Lisbon and Budapest.
Overall, during the year under review, IHI reported a net impairment charge (before tax) in the fair value of its
properties of €24.3 million (2013: +€36.8 million) which is reported as to €13.3 million in the Income Statement
and €11.0 million in the Comprehensive Income Statement.
FY2015 was mainly characterised by the acquisition of IHGH in August 2015. IHGH business relates to the
ownership and operation of the Radisson Blu Resort St Julians, Island Caterers, Costa Coffee outlets in Malta
and Spain, and the operation of a number of catering contracts. IHGH also owns an 83,530m2 plot of land at Hal
Ferh, Golden Sands. Furthermore, IHGH has a 50% shareholding in the Radisson Blu Resort & Spa Golden Sands
which comprises the operation of a five-star hotel and a vacation ownership business. In view of the 50%
ownership, the results of the Radisson Blu Resort & Spa Golden Sands are included in the income statement as
share of profit from equity accounted investments (together with the Corinthia Hotel & Residences London).
IHI’s revenue for FY2015 amounted to €134.1 million, an increase of €17.7 million from a year earlier. The
increase in revenue is attributable to the increased revenues in IHI’s European operations (€9.8 million) and the
consolidation of the IHGH results for the second half of 2015 (€17.6 million). Against this, there was a
combined reduction of €9.7 million from the Group’s hotels located in St Petersburg and Tripoli.
EBITDA for 2015, excluding the consolidation of results of associate companies and in particular the London
hotel results, amounted to €32.1 million compared to €28.8 million achieved in 2014. Here again, the increase
in EBITDA is mainly attributable to the improved performance in all the Group’s hotels excluding Tripoli and the
consolidation of IHGH’s results as from the second semester of 2015. Administrative costs for the year under
review include a one-time abortive cost of €1.3 million, representing professional fees and expenses incurred in
pursuing the launch of an international bond.
Share of results from equity accounted investments comprises the 50% ownership in the Corinthia Hotel &
Residences London and the Radisson Blu Resort & Spa Golden Sands. The performance of the Corinthia Hotel &
Residences London improved significantly in the year under review with record occupancies, rates and EBITDA
earnings being achieved as this property moves closer towards its maturity. IHI’s 50% share of the hotel’s
EBITDA in 2015 amounted to €8.2 million compared to €4.5 million in 2014. The residential penthouse at 10
Whitehall Place was leased for a term of two years commencing in early 2016. With respect to the Radisson Blu
Resort & Spa Golden Sands, the hotel generated an EBITDA of €7.4 million in the period 1 July 2015 to 31
December 2015, out of which the Group’s 50% share amounted to €3.7 million.
In 2015, the Group registered net property uplifts, before tax, of €42.6 million on account of the improved
trading performance of the Group’s hotels located in Europe. This contrasts sharply with the net impairment
charge, before tax, of €24.4 million registered in 2014. As detailed below, these uplifts are reflected as to €11.8
million through the income statement (2014: impairment of €13.3 million) with the balance of €30.8 million
being recognised through the comprehensive income statement (2014: impairment of €11.1 million).

IHI GROUP FINANCIAL ANALYSIS SUMMARY 44
Net finance costs in 2015 were marginally higher than in FY2014 by €0.4 million, from €13.6 million in FY2014
to €14.0 million. The financial results for FY2015 were impacted by a charge of €8.5 million, which represented
adverse exchange differences on bank borrowings in Euro on the property in St Petersburg in consequence of
the adopting of the Rouble as the functional currency. After accounting for taxation and other items in the
comprehensive income statement, IHI reported total comprehensive income for the year, net of tax, of €11.1
million (2014: comprehensive loss, net of tax, of €15.7 million).
Revenue for FY2016 increased by €23.8 million, from €134.1 million in FY2015 to €157.9 million, mainly due to
the consolidation of a full year’s results of IHGH (+€16.2 million y-o-y). QP Management Limited, which was
acquired in July 2016, contributed €1.4 million. The remaining balance of €6.2 million is attributable to
improved performance from the European operations of the Group. In consequence of the higher revenue, the
Group reported an increase in EBITDA of €4.6 million (+14% y-o-y) to €36.7 million, which was to some extent
adversely impacted by losses from the catering operations in Spain.
In FY2016, the Group generated €1.7 million from its equity accounted investments (being the 50% ownership
in the Corinthia Hotel & Residences London and the Radisson Blu Resort & Spa Golden Sands) as compared to a
loss of €2.6 million reported in the prior year. Both operations had a positive year when compared to FY2015,
but given their exposure to the Pound Sterling, were negatively impacted on translation of their respective
financial results to the euro currency.
During the year under review, the Group registered property uplifts before tax of €47.4 million on account of
the improved trading performance of the Group’s hotels located in Europe, which was partly mitigated by an
impairment charge of €20.4 million on the value of the St Petersburg Commercial Centre (a net positive
movement of €27.0 million). Further detail of the movement in property values is provided below:
Analysis of Movements in Property Values
for the year ended 31 December 2015 Other
(€’000) Income Comprehensive
Statement Income Total
Corinthia Hotel Lisbon - (1,669) (1,669)
Lisbon Apartments 193 - 193
Corinthia Hotel St George's Bay 2,281 8,700 10,981
Corinthia Hotel Prague 10,103 992 11,095
Corinthia Hotel Budapest 3,309 6,516 9,825
Marina Hotel - 6,566 6,566
Corinthia Hotel St Petersburg (4,054) - (4,054)
St Petersburg Commercial Centre - - -
Corinthia Hotel & Residences London - 9,674 9,674
Net movement in property values 11,832 30,779 42,611
Classified in the financial statements as follows:
Movement in fair value of investment property 193 - 193
Net impairment reversal (loss) on hotel properties 11,639 21,105 32,744
Revaluation of hotel property (equity accounted investments) - 9,674 9,674
Net movement in property values 11,832 30,779 42,611

IHI GROUP FINANCIAL ANALYSIS SUMMARY 45
Net finance costs increased by €2.1 million as a result of increased bond interest costs, primarily due to the
new €55 million secured bond issued by IHI in July 2016 and the fact that IHGH’s finance costs for 2015 only
represent the charges for six months (post acquisition), whilst those for 2016 cover a full year. During the year
under review, a positive amount of €11.1 million was recorded in other movements as compared to an adverse
amount of €8.2 million in FY2015. Such movements mainly represented exchange differences on borrowings
denominated in Rouble on conversion to the Euro.
Overall, the Group incurred a loss for the year of €7.7 million (FY2015: loss of €3.7 million), but reported a total
comprehensive income for the year, net of tax, of €32.9 million (FY2015: €14.9 million).
As of FY2017, IHI has secured the right to nominate and appoint the majority of the board of directors of NLI
such that IHI can consolidate the performance of the Corinthia Hotel London in its financial statements. As
such, the projected y-o-y increase in revenue of €77.6 million is primarily a reflection of the afore-mentioned
change in accounting for NLI. Excluding this movement, revenue is projected to increase by €11.6 million (+7%)
as all hotels (including the Corinthia Hotel St Petersburg and Corinthia Hotel Tripoli) and the Costa Coffee
operations are expected to register growth over the comparable period. EBITDA is expected to increase from
€36.7 million in FY2016 to €62.4 million in FY2017, an increase of €25.7 million, on account of an increase of
€7.8 million (+21%) on a comparable basis and the remaining balance due to the inclusion of results of NLI on a
consolidated basis. Share of profits from equity accounted investments is projected to increase from €1.7
million in FY2016 to €3.0 million in FY2017.
Analysis of Movements in Property Values
for the year ended 31 December 2016 Other
(€’000) Income Comprehensive
Statement Income Total
Corinthia Hotel Lisbon - 5,702 5,702
Lisbon Apartments 680 - 680
Corinthia Hotel St George's Bay - 3,469 3,469
Corinthia Hotel Prague - 2,423 2,423
Corinthia Hotel Budapest - 18,613 18,613
Marina Hotel - 2,640 2,640
Radisson Blu Resort, St Julians - 4,284 4,284
Corinthia Hotel St Petersburg 2,960 - 2,960
St Petersburg Commercial Centre (20,392) - (20,392)
Corinthia Hotel & Residences London - 6,598 6,598
Net movement in property values (16,752) 43,729 26,977
Classified in the financial statements as follows:
Movement in fair value of investment property (19,712) - (19,712)
Net impairment reversal (loss) on hotel properties 2,960 37,131 40,091
Revaluation of hotel property (equity accounted investments) - 6,598 6,598
Net movement in property values (16,752) 43,729 26,977

IHI GROUP FINANCIAL ANALYSIS SUMMARY 46
After factoring in depreciation & amortisation (€35.2 million) and finance costs (€23.3 million), IHI is projecting
a profit before tax of €6.7 million in FY2017 (FY2016: loss of €6.8 million). Total comprehensive income for
FY2017 is projected to amount to €5.3 million (FY2016: €32.9 million).
The estimates for the forward year as presented in this document assume that the carrying values of hotel
and investment properties will remain constant in FY2017, and therefore no adjustment has been made as to
possible impairment or uplift of assets that may be booked and which may materially affect the consolidated
income statement and balance sheet values.
Other than equity, IHI is financed through bank loans, corporate bonds and other borrowings from related
companies, analysed as follows:
IHI Group Borrowings 31 Dec'14 31 Dec'15 31 Dec'16 31 Dec'17
(€’000) Actual Actual Actual Forecast
Bank borrowings
Bank loans 203,383 205,990 180,330 350,465
Bank overdrafts 1,630 7,199 8,550 4,728
205,013 213,189 188,880 355,193
Bonds
6.25% IHI Bonds 2015 - 2019 34,762
6.25% IHI Bonds 2017 - 2020 24,641 24,695 6,572
5.8% IHI Bonds 2021 19,633 19,676 19,722 19,771
5.8% IHI Bonds 2023 9,876 9,887 9,899 9,911
5.75% IHI Bonds 2025 44,060 44,138 44,220
4% IHI Secured Bonds 2026 54,230 54,182
4% IHI Unsecured Bonds 2026 39,450 39,478
6.5% IHGH Bonds 2017 - 2019 14,000 3,134
6% IHGH Bonds 2024 34,384 34,457 34,531
88,912 146,702 211,602 202,093
Other interest bearing borrowings
Parent company 5,092 3,091 - -
Related companies 234 5,418 4,910 6,602
5,326 8,509 4,910 6,602
Total borrowings and bonds 299,251 368,400 405,392 563,888
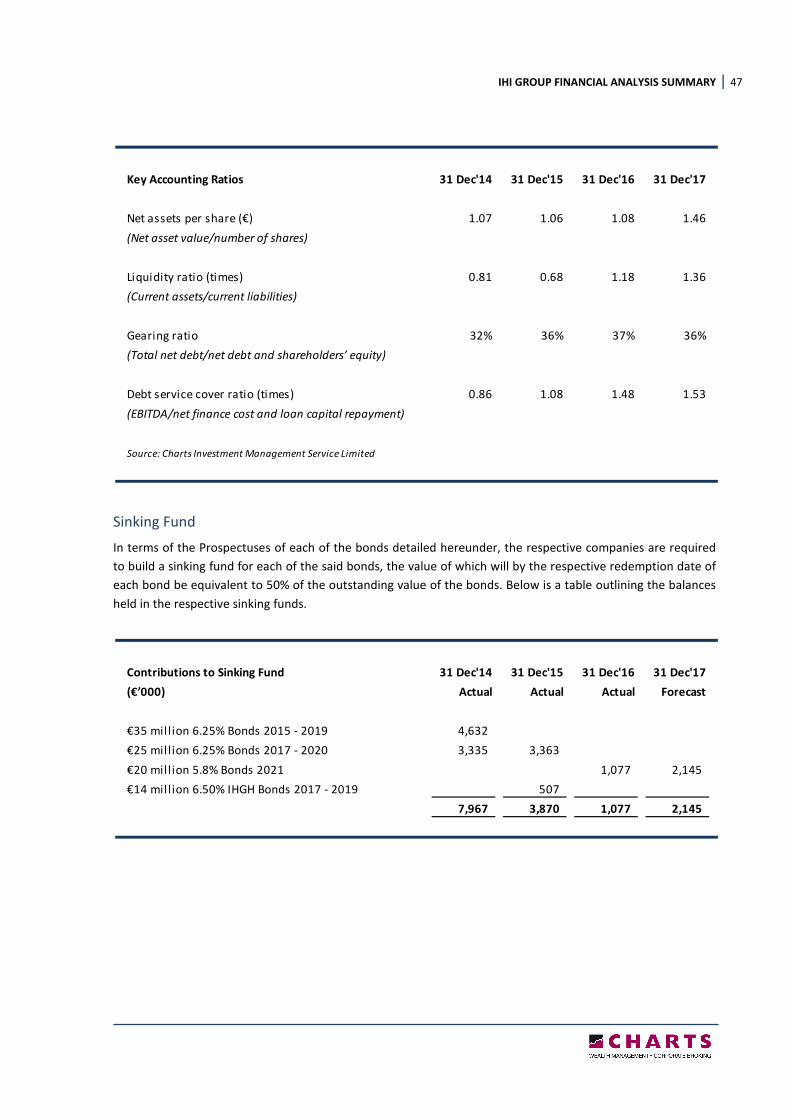
IHI GROUP FINANCIAL ANALYSIS SUMMARY 47
Sinking Fund
In terms of the Prospectuses of each of the bonds detailed hereunder, the respective companies are required
to build a sinking fund for each of the said bonds, the value of which will by the respective redemption date of
each bond be equivalent to 50% of the outstanding value of the bonds. Below is a table outlining the balances
held in the respective sinking funds.
Key Accounting Ratios 31 Dec'14 31 Dec'15 31 Dec'16 31 Dec'17
Net assets per share (€) 1.07 1.06 1.08 1.46
(Net asset value/number of shares)
Liquidity ratio (times) 0.81 0.68 1.18 1.36
(Current assets/current liabilities)
Gearing ratio 32% 36% 37% 36%
(Total net debt/net debt and shareholders’ equity)
Debt service cover ratio (times) 0.86 1.08 1.48 1.53
(EBITDA/net finance cost and loan capital repayment)
Source: Charts Investment Management Service Limited
Contributions to Sinking Fund 31 Dec'14 31 Dec'15 31 Dec'16 31 Dec'17
(€’000) Actual Actual Actual Forecast
€35 mil lion 6.25% Bonds 2015 - 2019 4,632
€25 mil lion 6.25% Bonds 2017 - 2020 3,335 3,363
€20 mil lion 5.8% Bonds 2021 1,077 2,145
€14 mil lion 6.50% IHGH Bonds 2017 - 2019 507
7,967 3,870 1,077 2,145

IHI GROUP FINANCIAL ANALYSIS SUMMARY 48
Variance Analysis
As presented in the above table, actual revenue and costs for FY2016 were higher than expected by €4.0
million and €4.4 million respectively. As a consequence, actual EBITDA was marginally lower than projected by
€0.4 million. With respect to depreciation & amortisation, actual amount was higher than forecasted by €1.6
million. Furthermore, the actual results were impacted by a pre-tax net impairment in fair value of Group
properties of €16.7 million.
Actual share of profit from equity accounted investments amounted to €1.7 million compared to the forecast
of €4.0 million, thus adversely impacting the financial results by €2.3 million. The Corinthia Hotel & Residences
London and the Radisson Blu Resort & Spa Golden Sands both had a positive year when compared to FY2015,
but given their exposure to the Pound Sterling, were negatively impacted on translation of their respective
financial results to the Euro currency, relative to the forecasted rates prevailing between the two currencies.
Net finance costs and other movements amounted to €4.8 million as compared to a forecast net charge of
€11.2 million, which resulted in a net positive movement of €6.4 million. This was mainly due to an unrealised
exchange gain (on the strengthening of the Russian Rouble against the Euro) on Euro denominated loans
funding the Group’s assets in St Petersburg.
After accounting for a lower than expected tax charge of €0.9 million (projected tax charge was of €5.8 million),
the Group reported a loss for the year of €7.7 million, compared to a forecasted profit for the year of €2.1
million.
IHI Group Income Statement FY2016 FY2016
(€’000) Actual Forecast Variance
Revenue 157,901 153,851 4,050
Direct costs (87,519) (75,083) (12,436)
Gross profit 70,382 78,768 (8,386)
Other operating costs (33,641) (41,635) 7,994
EBITDA 36,741 37,133 (392)
Depreciation and amortisation (23,307) (21,670) (1,637)
Movement in fair value of investment property (19,712) - (19,712)
Net impairment of hotel properties 2,960 - 2,960
Results from operating activities (3,318) 15,463 (18,781)
Share of (loss) profit: equity accounted investments 1,661 3,988 (2,327)
Net finance costs (16,036) (11,249) (4,787)
Other 11,140 - 11,140
Movement in fair value of indemnification assets (210) (210) -
Profit (loss) before tax (6,763) 7,992 (14,755)
Taxation (895) (5,849) 4,954
Profit (loss) for the year (7,658) 2,143 (9,801)
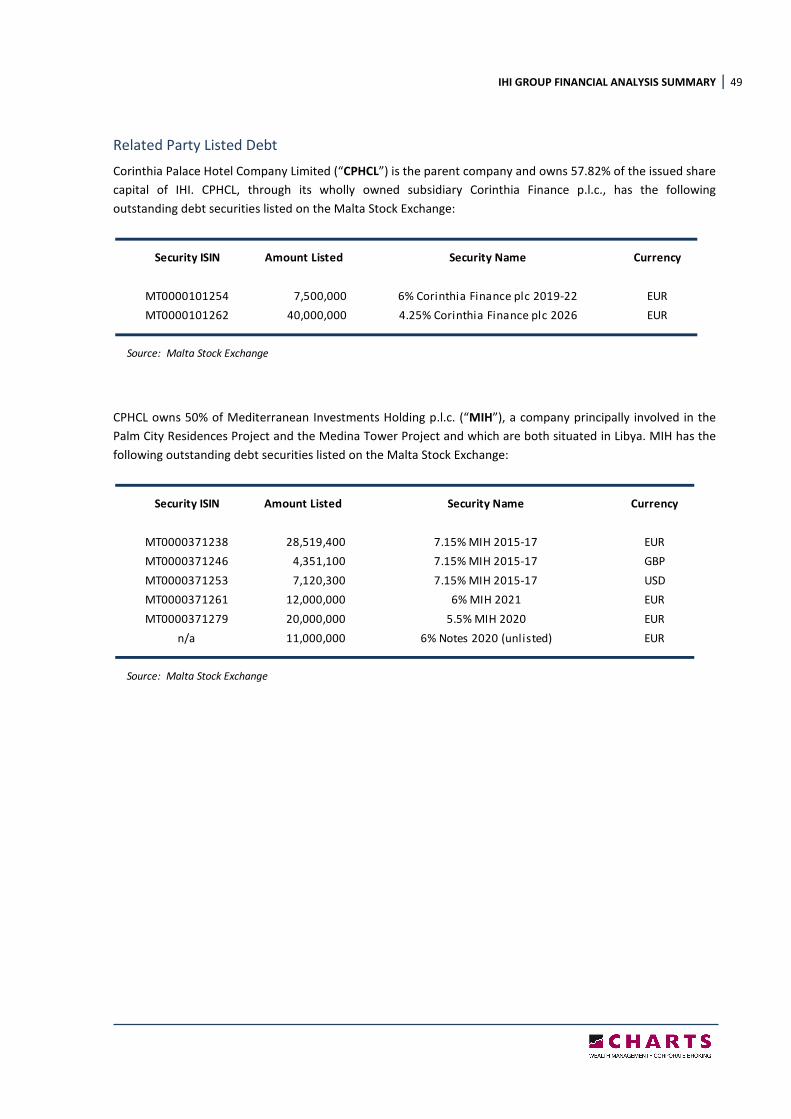
IHI GROUP FINANCIAL ANALYSIS SUMMARY 49
Related Party Listed Debt
Corinthia Palace Hotel Company Limited (“CPHCL”) is the parent company and owns 57.82% of the issued share
capital of IHI. CPHCL, through its wholly owned subsidiary Corinthia Finance p.l.c., has the following
outstanding debt securities listed on the Malta Stock Exchange:
CPHCL owns 50% of Mediterranean Investments Holding p.l.c. (“MIH”), a company principally involved in the
Palm City Residences Project and the Medina Tower Project and which are both situated in Libya. MIH has the
following outstanding debt securities listed on the Malta Stock Exchange:
Security ISIN Amount Listed Security Name Currency
MT0000101254 7,500,000 6% Corinthia Finance plc 2019-22 EUR
MT0000101262 40,000,000 4.25% Corinthia Finance plc 2026 EUR
Source: Malta Stock Exchange
Security ISIN Amount Listed Security Name Currency
MT0000371238 28,519,400 7.15% MIH 2015-17 EUR
MT0000371246 4,351,100 7.15% MIH 2015-17 GBP
MT0000371253 7,120,300 7.15% MIH 2015-17 USD
MT0000371261 12,000,000 6% MIH 2021 EUR
MT0000371279 20,000,000 5.5% MIH 2020 EUR
n/a 11,000,000 6% Notes 2020 (unlisted) EUR
Source: Malta Stock Exchange

IHI GROUP FINANCIAL ANALYSIS SUMMARY 50
PART 4 - COMPARABLES
The table below compares the Group and its bonds to other debt issuers listed on the Malta Stock Exchange
and their respective debt securities. Although there are significant variances between the activities of the
Group and other issuers (including different industries, principal markets, competition, capital requirements
etc), and material differences between the risks associated with the Group’s business and that of other issuers,
the comparative analysis provides an indication of the financial performance and strength of the Group.
Comparative Analysis Nominal Yield to Interest Total Net Asset Gearing
Value Maturity Cover Assets Value Ratio
(€) (%) (times) (€’000) (€’000) (%)
5.5% Pendergardens Dev. plc Secured € 2020 Series I 15,000,000 4.39 1.49 63,273 11,488 63.23
6% Pendergardens Dev. plc Secured € 2022 Series II 27,000,000 2.91 1.49 63,273 11,488 63.23
4.25% Gap Group plc Secured € 2023 40,000,000 3.79 2.48 57,086 6,004 86.39
5.3% United Finance Plc Unsecured € Bonds 2023 8,500,000 3.86 2.05 18,153 3,796 73.85
6% AX Investments Plc € 2024 40,000,000 4.25 3.62 270,425 163,719 27.97
6% Island Hotels Group Holdings plc € 2024 35,000,000 4.54 0.91 144,003 52,994 53.41
5.3% Mariner Finance plc Unsecured € 2024 35,000,000 4.28 4.25 72,117 30,380 52.06
5% Hal Mann Vella Group plc Secured Bonds € 2024 30,000,000 4.31 0.02- 82,096 32,298 54.54
5.1% PTL Holdings plc Unsecured € 2024 36,000,000 4.61 1.59 71,711 4,751 89.91
4.5% Hili Properties plc Unsecured € 2025 37,000,000 3.86 1.40 97,042 28,223 72.36
4.0% International Hotel Invest. plc Secured € 2026 55,000,000 3.61 2.46 1,220,254 646,822 36.39
4.0% MIDI plc Secured € 2026 50,000,000 3.61 0.59 203,780 67,359 40.62
3.75% Premier Capital plc € Unsecured Bonds 2026 65,000,000 3.37 7.60 193,351 41,630 58.76
4.35% SD Finance plc € Unsecured Bonds 2027 65,000,000 4.16 4.82 156,433 56,697 53.20
4.0% Eden Finance plc 2027 40,000,000 3.66 3.98 165,496 92,620 34.60
Source: Malta Stock Exchange, Audited Accounts of Listed Companies, Charts Investment Management Service Limited
15 June'17

IHI GROUP FINANCIAL ANALYSIS SUMMARY 51
To date, there are no corporate bonds which have a redemption date beyond 2027 and therefore a trend line
has been plotted (denoted in the above chart by the dashed line). The Malta Government Stock yield curve has
also been included since it is the benchmark risk-free rate for Malta.
-1.00
0.00
1.00
2.00
3.00
4.00
5.00
6.00
7.00
Bond Yield to Maturity
Malta Government Stock
Malta Corporate Bonds
IHI & IHGH Bonds
%
15 June 2017
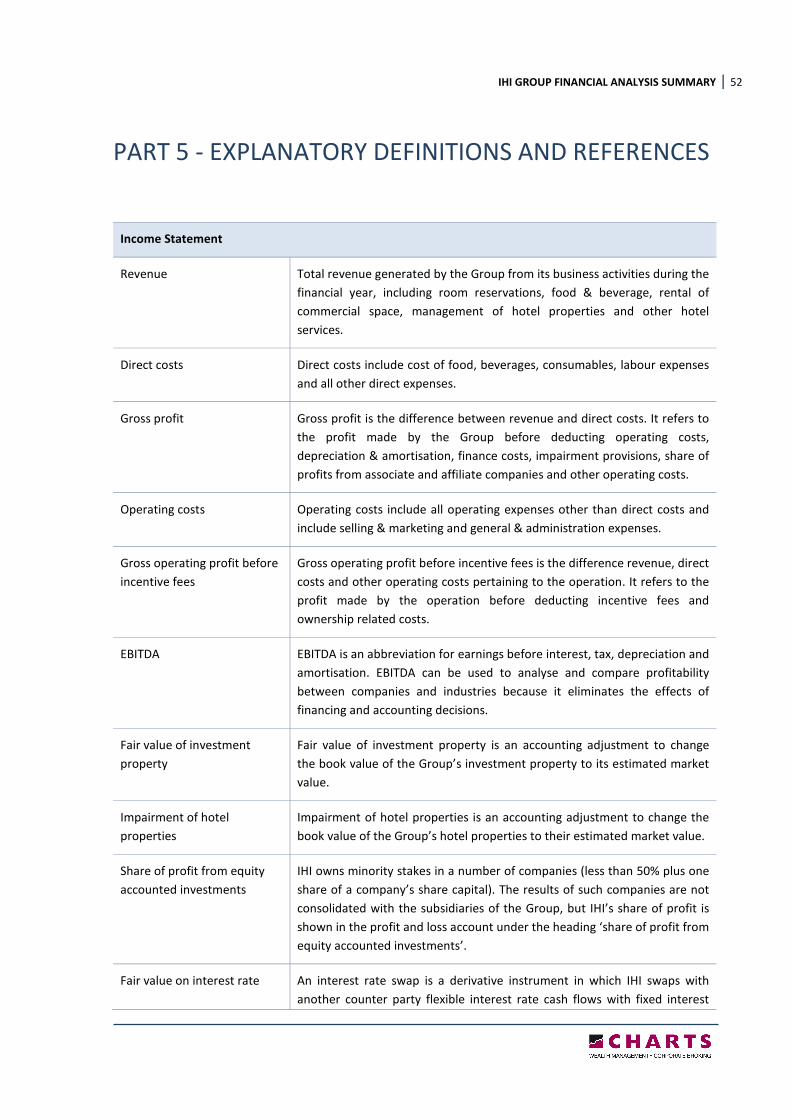
IHI GROUP FINANCIAL ANALYSIS SUMMARY 52
PART 5 - EXPLANATORY DEFINITIONS AND REFERENCES
Income Statement
Revenue Total revenue generated by the Group from its business activities during the
financial year, including room reservations, food & beverage, rental of
commercial space, management of hotel properties and other hotel
services.
Direct costs Direct costs include cost of food, beverages, consumables, labour expenses
and all other direct expenses.
Gross profit Gross profit is the difference between revenue and direct costs. It refers to
the profit made by the Group before deducting operating costs,
depreciation & amortisation, finance costs, impairment provisions, share of
profits from associate and affiliate companies and other operating costs.
Operating costs Operating costs include all operating expenses other than direct costs and
include selling & marketing and general & administration expenses.
Gross operating profit before
incentive fees
Gross operating profit before incentive fees is the difference revenue, direct
costs and other operating costs pertaining to the operation. It refers to the
profit made by the operation before deducting incentive fees and
ownership related costs.
EBITDA EBITDA is an abbreviation for earnings before interest, tax, depreciation and
amortisation. EBITDA can be used to analyse and compare profitability
between companies and industries because it eliminates the effects of
financing and accounting decisions.
Fair value of investment
property
Fair value of investment property is an accounting adjustment to change
the book value of the Group’s investment property to its estimated market
value.
Impairment of hotel
properties
Impairment of hotel properties is an accounting adjustment to change the
book value of the Group’s hotel properties to their estimated market value.
Share of profit from equity
accounted investments
IHI owns minority stakes in a number of companies (less than 50% plus one
share of a company’s share capital). The results of such companies are not
consolidated with the subsidiaries of the Group, but IHI’s share of profit is
shown in the profit and loss account under the heading ‘share of profit from
equity accounted investments’.
Fair value on interest rate An interest rate swap is a derivative instrument in which IHI swaps with
another counter party flexible interest rate cash flows with fixed interest

IHI GROUP FINANCIAL ANALYSIS SUMMARY 53
swaps rate cash flows or vice versa. The fair value is an accounting adjustment to
change the book value of the derivative to its estimated market value.
Profit after tax Profit after tax is the profit made by the Group during the financial year
both from its operating as well as non-operating activities.
Key Performance Indicators
Occupancy level Occupancy level is the percentage of available rooms that were sold during
a given period of time. It is calculated by dividing the number of rooms sold
by total number of rooms available.
Average room rate Average room rate is calculated by dividing hotel room revenue by rooms
sold. Hotels use this measure to calculate the average price at which they
are selling hotel rooms each night.
Revenue per available room
(RevPAR)
RevPAR is calculated by multiplying a hotel’s average room rate by its
occupancy rate. A hotel uses this indicator as a performance measure with
other hotels in the same category or market to determine how well the
hotel property is yielding.
Revenue generating index A revenue generating index measures a hotel’s fair market share of its
segment’s (competitive set, market, etc) revenue per available room. If a
hotel is capturing its fair market share, the index will be 1; if capturing less
than its fair market share, a hotel’s index will be less than 1; and if capturing
more than its fair market share, a hotel’s index will be greater than 1.
Profitability Ratios
Gross profit margin Gross profit margin is the difference between revenue and direct costs
expressed as a percentage of total revenue.
Operating profit margin Operating profit margin is operating income or EBITDA as a percentage of
total revenue.
Net profit margin Net profit margin is profit after tax achieved during the financial year
expressed as a percentage of total revenue.
Efficiency Ratios
Return on equity Return on equity (ROE) measures the rate of return on the shareholders’
equity of the owners of issued share capital, computed by dividing profit
after tax by shareholders’ equity.
Return on capital employed Return on capital employed (ROCE) indicates the efficiency and profitability
of a company’s capital investments, estimated by dividing operating profit
by capital employed.

IHI GROUP FINANCIAL ANALYSIS SUMMARY 54
Return on Assets Return on assets (ROA) is computed by dividing profit after tax by total
assets.
Equity Ratios
Earnings per share Earnings per share (EPS) is the amount of earnings per outstanding share of
a company’s share capital. It is computed by dividing net income available
to equity shareholders by total shares outstanding as at balance sheet date.
Cash Flow Statement
Cash flow from operating
activities
Cash generated from the principal revenue-producing activities (room
revenue, food & beverage, rental income, hotel services, etc) of the Group.
Cash flow from investing
activities
Cash generated from activities dealing with the acquisition and disposal of
long-term assets and other investments of the Group.
Cash flow from financing
activities
Cash generated from the activities that result in change in share capital and
borrowings of the Group.
Balance Sheet
Non-current assets Non-current asset are the Group’s long-term investments, which full value
will not be realised within the accounting year. Non-current assets are
capitalised rather than expensed, meaning that the Group amortises the
cost of the asset over the number of years for which the asset will be in use,
instead of allocating the entire cost to the accounting year in which the
asset was acquired. Such assets include intangible assets (goodwill on
acquisition, the Corinthia brand, website development costs, etc),
investment properties (commercial centres in St Petersburg and Tripoli,
apartments in Lisbon, etc), property, plant & equipment (hotel properties),
and investments accounted for using the equity method (investment in
Corinthia Hotel London, Medina Tower, etc).
Current assets Current assets are all assets of the Group, which are realisable within one
year from the balance sheet date. Such amounts include accounts
receivable, inventory (food, beverages, consumables, etc), cash and bank
balances.
Current liabilities All liabilities payable by the Group within a period of one year from the
balance sheet date, and include accounts payable and short-term debt,
including current portion of bank loans.
Non-current liabilities The Group’s long-term financial obligations that are not due within the
present accounting year. The Group’s non-current liabilities include long-
term borrowings, bonds and long term lease obligations.

IHI GROUP FINANCIAL ANALYSIS SUMMARY 55
Total equity Total equity includes share capital, reserves & other equity components,
retained earnings and minority interest.
Financial Strength Ratios
Liquidity ratio The liquidity ratio (also known as current ratio) is a financial ratio that
measures whether or not a company has enough resources to pay its debts
over the next 12 months. It compares a company’s current assets to its
current liabilities.
Interest cover The interest coverage ratio is calculated by dividing a company’s operating
profit of one period by the company’s interest expense of the same period.
Debt service cover ratio The debt service cover ratio measures a company’s ability to service its
current debts by comparing its net operating income with its total debt
service obligations.
Gearing ratio The gearing ratio indicates the relative proportion of shareholders’ equity
and debt used to finance a company’s assets, and is calculated by dividing a
company’s net debt by net debt plus shareholders’ equity.
References
FocusEconomics (www.focus-economics.com/countries)
Colliers International – Research & Forecast Report s (www.colliers.com)
National Statistics Office - Malta (www.nso.gov.mt)
Central Bank of Malta – Supplement to the Quarterly Review 2017:1 (www.centralbankmalta.org)
Hungarian Central Statistical Office (www.ksh.hu)
Czech Statistical Office (www.czso.cz)
Instituto Nacional de Estatistica (www.ine.pt)
Office for National Statistics - UK (www.ons.gov.uk)