Embed Size (px)
DESCRIPTION
Financial Analysis
Citation preview

A PROJECT REPORT ON
FINANCIAL ANALYSIS
SUBMITTED
TO THE UNIVERSITY OF MUMBAI
AS A PARTIAL REQUIREMENT FOR COMPLETING THE DEGREE OF
M.COM (ACCOUNTS) SEMESTER III
SUBJECT: ADVANCED FINANCIAL MANAGEMENT
SUBMITTED BY
SHUBALAXMI.UMESH.SHETTY
ROLL NO.: 42
UNDER THE GUIDANCE OF
PROFESSOR DHANABALU .R. NAIKAR

SIES COLLEGE OF COMMERCE AND ECONOMICS,
PLOT NO. 71/72, SION MATUNGA ESTATE
T.V. CHIDAMBARAM MARG,
SION (EAST), MUMBAI – 400022.
CERTIFICATE
This is to certify that SHUBALAXMI.UMESH.SHETTY of M.Com (Accounts)
Semester III (academic year 2014-2015) has successfully completed the project on
ADVANCED FINANCIAL MANAGEMENT under the Guidance PROFESSOR
DHANABALU .R. NAIKAR
_________________ ___________________
(Project Guide) (Course Co-ordinator)
___________________ ___________________
(External Examiner) (Principal)
Place: _____________
Date: _____________

DECLARATION
I, SHUBALAXMI SHETTY Student M.Com (Accounts) Semester III
(academic year 2014-2015) hereby declare that, I have Completed the project on
ADVANCED FINANCIAL MANAGEMENT.
The information presented in this project is true and original to the best of my knowledge.
___________________
SHUBALAXMI.SHETTY
Roll No.: 42
Place: _____________
Date: ______________

ACKNOWLEDGEMENT
I would like to thank the University of Mumbai, for introducing M.Com (Accounts)
course, thereby giving its students a platform to be abreast with changing business
scenario, with the help of theory as a base and practical as a solution
I am indebted to the reviewer of the project Professor Dhanabalu .R. Naikar, my project
guide and also Dr.MinuThomas who is our Principal, for her support and guidance. I
would sincerely like to thank her for all her efforts.
Last but not the least; I would like to thank my parents for giving the best education and
for their support and contribution without which this project would not have been
possible.
______________________
SHUBALAXMI.SHETTY
ROLL NO.42

TABLE OF CONTENT
SrNo: Content
1. Introduction
2. Objectives
3. Advantages Of Financial Analysis
4. Limitations Of Financial Statement Analysis
5. Types Of Financial Statement Analysis
6. Methods Of Analyzing Financial Statements
7. Uses Of Ratios
8. Functional Classification
a. Profitability Ratios
b. Turnover Ratios
c. Financial Ratios d. Market Test Ratios
9. Illustrations
10. Conculsion

I. INTRODUCTION
Introduction To Financial Statement:
Financial statements, as used in corporate business houses, refer to a set of
reports and schedules which an accountant prepares at the end of a period of time for a
business enterprise. The financial statements are the means with the help of which the
accounting system performs its main function of providing summarized information
about the financial affairs of the business. These statements comprise Balance Sheet or
Position Statement and Profit and Loss count or Income Statement. Of course to
give a full view of the financial affairs of an undertaking, in addition to the above, the
business may also prepare a Statement of Retained Earnings and a Cash Flow Statement.
In India, every company has to present its financial statements in the form and contents as
prescribed under Section 211 of the Companies Act 1956. The significance of these
statements are given below:
(i) Balance Sheet or Position Statement: Balance sheet is a statement showing
the nature and amount of a company’s assets on one side and liabilities and capital on the
other. In other words, the balance sheet shows the financial position on a particular date
usually at the end of one year period. Balance sheet shows how the money has been made
available to the business of the company and how the money is employed in the business.
(ii) Profit and Loss Account or Income Statement: Earning profit is the principal
objective of all business enterprises and Profit and Loss account or Income Statement is
the document which indicates the extent of success achieved by a business in meeting this
objective. Profits are of primary importance to the Board of directors in evaluating the
management of a company, to shareholders or potential shareholders in making
investment decisions and to banks and other creditors in judging the loan repayment
capacities and abilities of the company. It is because of this that the profit and loss or

income statement is regarded as the primary statement and commands a careful scrutiny
by all interested parties. It is prepared for a particular period which is mentioned along
with the title of these statements, which includes the name of the business firm also.
(iii) Statement of Retained Earnings: This statement is also known as Profit and Loss
Appropriation Account and is generally a part of the Profit and Loss Account. This
statement shows how the profits of the business for the accounting period have been
utilized or appropriated towards reserves and dividend and how much of the same is
carried forward to the next period. The term „retained earnings‟ means the accumulated
excess of earnings over losses and dividends. The balance shown by Profit and Loss
Account is to be transferred to the Balance Sheet through this statement after
making necessary appropriations.
(iv) Cash Flow Statement: This is a statement which summarizes for the period,
the cash available to finance the activities of an organization and the uses to which such
cash have been put. A statement of cash flow reports cash receipts and payments
classified according to the organization’s major activities i.e., operating activities,
investing activities and financing activities. This statement reports the net cash inflow or
outflow for each activity and for the overall business.
Introduction To Analysis Of Financial Statements :
Published financial statements are the only source of information about the
activities and affairs of a business entity available to the public, shareholders,
investors and creditors, and the governments. These various groups are interested in the
progress, position and prospects of such entity in various ways. But these
statements howsoever, correctly and objectively prepared, by themselves do not reveal
the significance, meaning and relationship of the information contained therein. For this
purpose, financial statements have to be carefully studied, dispassionately analysed and
intelligently interpreted. This enables a forecasting of the prospects for future earnings,

ability to pay interest, debt maturities both current as well as long- term, and probability
of sound financial and dividend policies. According to Myers, “financial statement
analysis is largely a study of relationship among the various financial factors in business
as disclosed by a single set of statements and a study of the trend of these factors as
shown in a series of statements”.
Thus, analysis of financial statements refers to the treatment of information
contained in the financial statement in a way so as to afford a full diagnosis of the
profitability and financial position of the firm concerned.
The process of analysing financial statements involves the rearranging,
comparing and measuring the significance of financial and operating data. Such a step
helps to reveal the relative significance and effect of items of the data in relation to the
time period and/or between two organisations.
Interpretation, which follows analysis of financial statements, is an attempt to reach to
logical conclusion regarding the position and progress of the business on the basis of
analysis. . Thus, analysis and interpretation of financial statements are regarded as
complimentary to each other

II. OBJECTIVES OF FINANCIAL STATEMENT ANALYSIS
Financial statement analysis is very much helpful in assessing the financial position and
profitability of a concern. The main objectives of analysing the financial statements are as
follows:
(i) The analysis would enable the present and the future earning capacity and the
profitability of the concern.
(ii) The operational efficiency of the concern as a whole as well as department wise can
be assessed. Hence the management can easily locate the areas of efficiency and
inefficiency.
(iii) The solvency of the firm, both short-term and long-term, can be determined with the
help of financial statement analysis which is beneficial to trade creditors and debenture
holders.
(iv) The comparative study in regard to one firm with another firm or one
department with another department is possible by the analysis of financial statements.
(v) Analysis of past results in respects of earning and financial position of the enterprise
is of great help in forecasting the future results. Hence it helps in preparing budgets.
(vi) It facilitates the assessments of financial stability of the concern.
(vii) The long-term liquidity position of funds can be assessed by the analysis of financial
statements. .

III. ADVANTAGES OF FINANCIAL ANALYSIS
Ratio analysis is a powerful tool of financial analysis. An absolute figure
generally conveys no meaning. It is seen that mostly figure assumes importance only in
background of other information. Ratios bring together figures which are
significantly allied to one another to portray the cause and effect relationship.
From a study of the various ratios and their practical applications, the following
advantages can be attributed to the technique of ratio analysis:
1. It helps to analyse and understand financial health and trend of a business, its past
performance, and makes it possible to forecast the future state of affairs of the
business. They diagnose the financial health by evaluating liquidity, solvency,
profitability etc. This helps the management to assess the financial requirements
and the capabilities of various business units. It serves as a media to link the past
with the present and the future.
2. It serves as a useful tool in management control process, by making a comparison
between the performance of the business and the performance of similar types of
business.
3. Ratio analysis play a significant role in cost accounting, financial accounting,
budgetary control and auditing.
4. It helps in the identification, tracing and fixing of the responsibilities of
managerial personnel at different levels.
5. It accelerates the institutionalisation and specialisation of financial
management.
6. Accounting ratios summarise and systematise the accounting figures in order to
make them more understandable in a lucid form. They highlight the inter-
relationship which exists between various segments of the business expressed
by accounting statements.

IV. LIMITATIONS OF FINANCIAL STATEMENT ANALYSIS
(i) Owing to the fact that financial statements are compiled on the basis of
historical costs, while there is a market decline in the value of the monetary unit
and resultant rise in prices, the figures in the financial statement loses its functions
as an index on current economic realities. Again the financial statements contain
both items. So an analysis of financial statements can not be taken as an indicator
for future forecasting and planning.
(ii) Analysis of financial statements is a tool which can be used profitably by an
expert analyst but may lead to faulty conclusions if used by unskilled analyst. So
the result can not be taken as judgements or conclusions.
(iii) Financial statements are interim reports and therefore can not be final
because the final gain or loss can be computed only at the termination of the
business. Financial statement reflects the progress of the position of the business so
analysis of these statements will not be a conclusive evidence of the performance
of the business.
(iv) Financial statements though expressed in exact monetary terms are not
absolutely final and accurate and it depends upon the judgement of the
management in respect of various accounting methods. If there is change in
accounting methods, the analysis may have no comparable basis and the result will
be biased.
(v) The reliability of analysis depends on the accuracy of the figures used in the
financial statements. The analysis will be vitiated by manipulations in the income
statement or balance sheet and accounting procedure adopted by the accountant for
recording.

(vi) The results for indications derived from analysis of financial statements may
be differently interpreted by different users.
(vii) The analysis of financial statement relating to a single year only will have
limited use. Hence the analysis may be extended over a number of years so that
results may be compared to arrive a meaningful conclusion.
(viii) When different firms are adopting different accounting procedures, records,
policies and different items under similar headings in the financial statements, the
comparison will be more difficult. It will not provide reliable basis to access the
performance, efficiency, profitability and financial condition of the firm as
compared to industry as a whole.

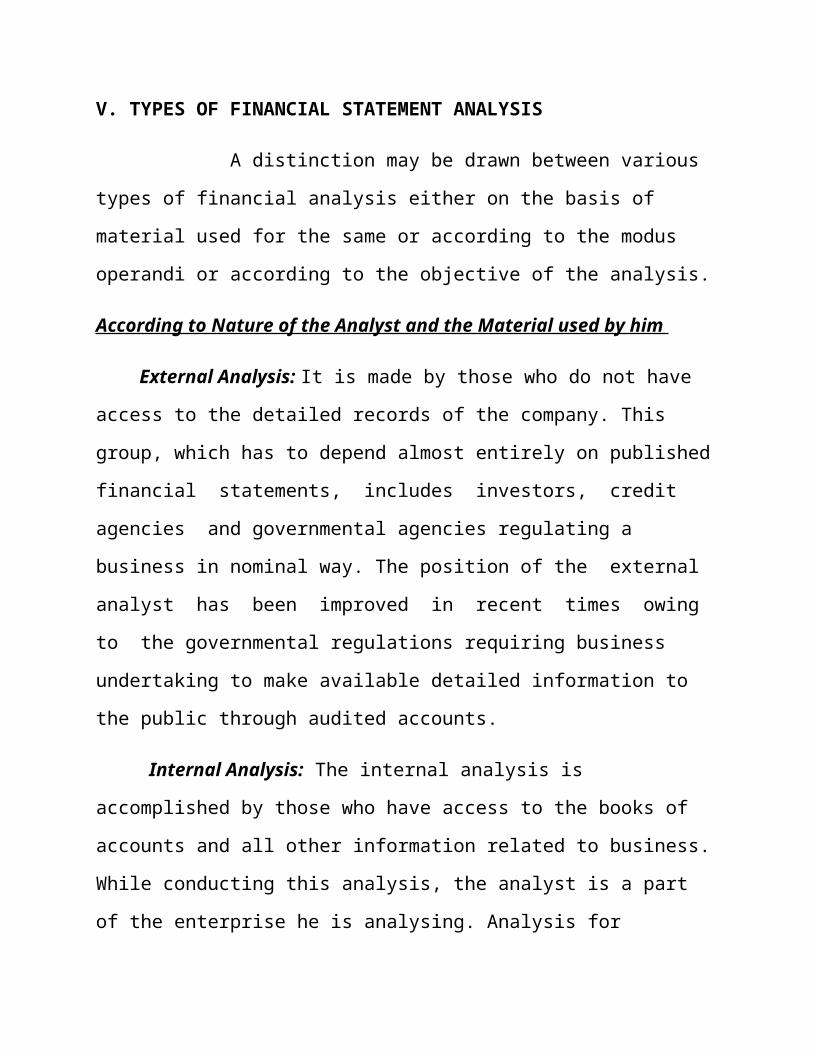
V. TYPES OF FINANCIAL STATEMENT ANALYSIS
A distinction may be drawn between various types of financial analysis
either on the basis of material used for the same or according to the modus
operandi or according to the objective of the analysis.
According to Nature of the Analyst and the Material used by him
External Analysis: It is made by those who do not have access to the detailed
records of the company. This group, which has to depend almost entirely on
published financial statements, includes investors, credit agencies and
governmental agencies regulating a business in nominal way. The position of the
external analyst has been improved in recent times owing to the
governmental regulations requiring business undertaking to make available
detailed information to the public through audited accounts.
Internal Analysis: The internal analysis is accomplished by those who have
access to the books of accounts and all other information related to business. While
conducting this analysis, the analyst is a part of the enterprise he is analysing.
Analysis for managerial purposes is an internal type of analysis and is conducted
by executives and employees of the enterprise as well as governmental and court
agencies which may have regulatory and other jurisdiction over the business.
According to Modus Operandi of Analysis
Horizontal Analysis: When financial statements for a number of years are
reviewed and analysed, the analysis is called „horizontal analysis‟. As it is based
on data from year to year rather than on one date or period of time as a whole, this
is also known as „dynamic analysis‟. This is very useful for long term trend
analysis and planning.

Vertical Analysis: It is frequently used for referring to ratios developed for
one date or for one accounting period. Vertical analysis is also called „Static
Analysis‟. This is not very conducive to proper analysis of the firm‟s financial
position and its interpretation as it does not enable to study data in
perspective. This can only be provided by a study conducted over a number of
years so that comparisons can be effected. Therefore, vertical analysis is not very
useful.
According to the Objective of the Analysis
On this basis the analysis can be long-term and short-term analysis:
Long-term Analysis: This analysis is made in order to study the long-term
financial stability, solvency and liquidity as well as profitability and earning
capacity of a business. The objective of making such an analysts is to know
whether in the long-term the concern will be able to earn a minimum amount
which will be sufficient to maintain a reasonable rate of return on the
investment so as to provide the funds required for modernisation, growth and
development of the business.
Short-term Analysis: This analysis is made to determine the short-term
solvency, stability, liquidity and earning capacity of the business. The
objective is to know whether in the short-run a business enterprise will have
adequate funds readily available to meet its short-term requirements and sufficient
borrowing capacity to meet contingencies in the near future.

VI. METHODS OF ANALYSING FINANCIAL STATEMENTS
The analysis of financial statements consists of a study of relationship and
trends, to determine whether or not the financial position and results of operations
as well as the financial progress of the company are satisfactory or unsatisfactory.
The analytical methods or devices, listed below, are used to ascertain or measure
the relationships among the financial statements items of a single set of statements
and the changes that have taken place in these items as reflected in successive
financial statements. The fundamental objective of any analytical method is to
simplify or reduce the data under review to more understandable terms.
Analytical methods and devices used in analysing financial statements are as
follows:
1. Comparative Statements
2. Common Size Statements
3. Trend Ratios
4. Ratio Analysis
1.Comparative Statements
These financial statements are so designed as to provide time perspective to the
various elements of financial position contained therein. These statements give the
data for all the periods stated so as to show:
(a) Absolute money values of each item separately for each of the periods stated.
(b) Increase and decrease in absolute data in terms of money values.
(c) Increase and decrease in terms of percentages.
(d) Comparison expressed in ratios.

(e) Percentages of totals.
Such comparative statements are necessary for the study of trends and direction of
movement in the financial position and operating results. This calls for a
consistency in the practice of preparing these statements, otherwise comparability
may be distorted. Comparative statements enable horizontal analysis of figures.
a. Comparative Balance Sheet: A comparative balance sheet shows the
balance of accounts of assets and liabilities on different dates and also the extent of
their increases or decreases between these dates throwing light on the trends and
direction of changes in the position over the periods. This helps in predicting about
the position of the business in future.
b. Comparative Profit and Loss Account or Income Statement: Comparative
income statement shows the operating results for a number of accounting periods
and changes in the data significantly in absolute periods and changes in the data
significantly in absolute money terms as well as in relative percentage.
2.Common-Size Statements
In the comparative financial statements it is difficult to comprehend the
changes over the years in relation to total assets, total liabilities and capital or total
net sales. This limitation of comparative statements make comparison between two
or more firms of an industry impossible because there is no common base of
comparison for absolute figures. Again, for an interpretation of underlying causes
of changes over time period a vertical analysis is required and this is not possible
with comparative statements.
Common size financial statements are those in which figures reported
are converted into percentages to some common base. For this, items in the

financial statements are presented as percentages or ratios to total of the
items and a common base for comparison is provided. Each percentage shows the
relation of the individual item to its respective total.
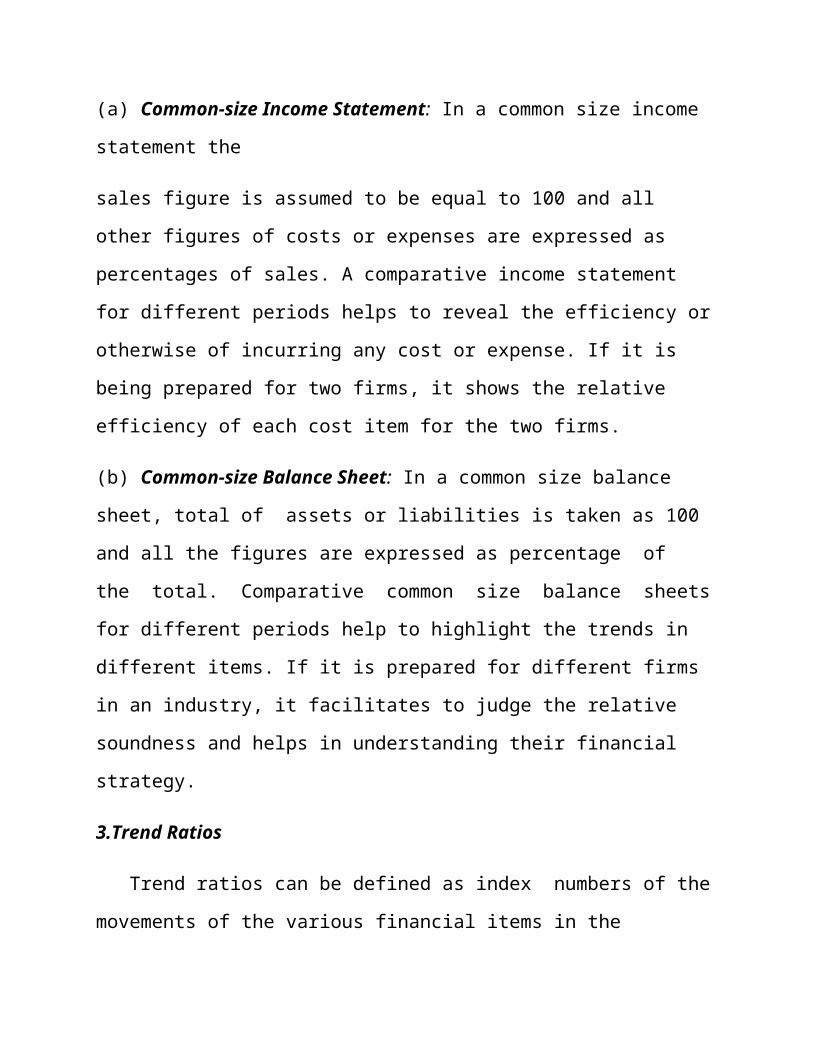
(a) Common-size Income Statement: In a common size income statement the
sales figure is assumed to be equal to 100 and all other figures of costs or expenses
are expressed as percentages of sales. A comparative income statement for
different periods helps to reveal the efficiency or otherwise of incurring any cost or
expense. If it is being prepared for two firms, it shows the relative efficiency of
each cost item for the two firms.
(b) Common-size Balance Sheet: In a common size balance sheet, total of assets
or liabilities is taken as 100 and all the figures are expressed as percentage of the
total. Comparative common size balance sheets for different periods help to
highlight the trends in different items. If it is prepared for different firms in an
industry, it facilitates to judge the relative soundness and helps in understanding
their financial strategy.
3.Trend Ratios
Trend ratios can be defined as index numbers of the movements of the various
financial items in the financial statements for a number of periods. It is a statistical
device applied in the analysis of financial statements to reveal the trend of the
items with the passage of time. Trend ratios show the nature and rate of
movements in various financial factors. They provide a horizontal analysis of
comparative statements and reflect the behaviour of various items with the passage
of time. Trend ratios can be graphically presented for a better understanding by the
management. They are very useful in predicting the behaviour of the various
financial factors in future. However, it should be noted that conclusions should not

be drawn on the basis of a single trend. Trends of related items should be carefully
studied, before any meaningful conclusion is arrived at. Since trends are sometimes
significantly affected by externalities, i.e. reasons extraneous to the organisations,
the analyst must give due weightage to such extraneous factors like
government policies, economic conditions, changes in income and its distribution,
etc.
1.Computation of Trend Percentages: For calculation of the trend of data shown
in the financial statements, it is necessary to have statements for a number of years,
and then proceed as under:
(1) Take one of the statements as the base with reference to which all other
statements are to be studied. In selection of the best statement, it should be noted
that it belongs to a normal year of business activities. Statement relating to an
abnormal year should not be selected as base, otherwise the trend calculated will
be meaningless.
(2) Every item in the base statement is stated as 100.
(3) Trend percentage of each item in other statement is calculated with reference
to same item in the base statement by using the following formula:
Limitations of Trend Ratios: It should be noted that trend ratios are not
calculated for all items. They are calculated only for logically connected
items enabling meaningful analysis. For example, trend ratios of sales become
more revealing when compared with the trend ratios of fixed assets, cost of goods
sold and operating expenses. Trend ratios have the following limitations:
(a) If the accounting practices have not been consistently followed year after year,
these ratios become incomparable and thus misleading.
(b) Trend ratios do not take into consideration the price level charges. An
increasing trend in sales might not be the result of larger sales volume, but may be
because of increased sales price due to inflation. In order to avoid this limitation,
figures of the current year should be first adjusted for price level changes from the
base year and then the trend ratios be calculated.
(c) Trend ratios must be always read with absolute data on which they are based,
otherwise the conclusions drawn may be misleading. It may be that a change in
trend ratio may represent an absolute change of 1,000 only in one item, while a
20% change in another item may mean an absolute change of 1,00,000.
(d) The trend ratios have to be interpreted in the light of certain non-financial
factors like economic conditions, government policies, management policies etc.
4.Ratio Analysis
Ratio Analysis is a form of Financial Statement Analysis that is used to obtain a
quick indication of a firm's Financial performance in several key areas. The ratios
are categorized as Short-term Solvency Ratios, Debt Management Ratios, Asset
Management Ratios, Profitability Ratios, and Market Value Ratios.
Ratio Analysis as a tool possesses several important features. The data, which
are provided by financial statements, are readily available. The computation of
ratios facilitates the comparison of firms which differ in size. Ratios can be used to
compare a firm's financial performance with industry averages. In addition, ratios

can be used in a form of trend analysis to identify areas where performance has
improved or deteriorated over time.
An absolute figure often does not convey much meaning. Generally, it is only
in the light of other information that significance of a figure is realised. A weighs
70 kg. Is he fat? One cannot answer this question unless one knows A‟s age and
height. Similarly, a company‟s profitability cannot be known unless together with
the amount of profit and the amount of capital employed. The relationship
between the two figures expressed arithmetically is called a ratio. The ratio
between 4 and 10 is 0.4 or 2:5. “0.4", ”40%" and “2:5" are ratios. Accounting
ratios are relationships, expressed in arithmetical terms, between figures which
have a cause and effect, relationship or which are connected with each other in
some other manner.
Accounting ratios are a very useful tool for grasping the true message of the
financial statements and understanding them. Ratios naturally should be worked
out between figures that are significantly related to one another. Obviously no
purpose will be served by working out ratios between two entirely unrelated
figures, such as discount on debentures and sales. Ratios may be worked out on
the basis of figures contained in the financial statements.
Ratios provide clues and symptoms of underlying conditions.They act as
indicators of financial soundness, strength, position and status of an enterprise.
Interpretation of ratios form the core part of ratio analysis. The computation of
ratio is simply a clerical work but the interpretation is a taste requiring art and skill.
The usefulness of ratios dependent on the judicious interpretations.

VII. USES OF RATIOS
A comparative study of the relationship, between various items of
financial statements, expressed as ratios, reveals the profitability, liquidity,
solvency as well as the overall financial position of the enterprises.
Ratio analysis helps to analyse and understand the financial health and trend of
a business, its past performance makes it possible to have forecast about future
state of affairs of the business. Interfirm comparison and intrafirm comparison
becomes easier through the analysis. Past performance and future projections
could be reviewed through the ratio analysis easily. Management uses the ratio
analysis in exercising control in various areas viz. budgetary control, inventory
control, financial control etc. and fixing the accountability and responsibility of
different departmental heads for accelerated and planned performance. It is useful
for all the constituents of the company as discussed under:
Management: Management is interested in ratios because they help in the
formulation of policies, decision-making and evaluating the performances and
trends of the business and its various segments.
Shareholders: With the application of ratio analysis to financial statements,
shareholders can understand not only the working and operational efficiency of
their company, but also the likely effect of such efficiency on the net worth
and consequently the price of their shares in the Stock Exchange. With the help of
such analysis, they can form opinion regarding the effectiveness or otherwise of
the management functions.
Investors: Investors are interested in the operational efficiency, earning
capacities and financial health of the business. Ratios regarding profitability,

debt-equity, fixed assets to net worth, assets turnover, etc., are some measures
useful for the investors in making decisions regarding the type of security and
industry in which they should invest.
Creditors: Creditors can reasonably assure themselves about the solvency
and liquidity position of the business by using ratio-analysis. Such analysis helps
to throw light on the repayment policy and capability of an enterprise.
Government: The Government is interested in the „financial health‟ of the
business. Carefully worked ratios will reflect the policy of the management and
its consistency or otherwise with the overall regional and national economic
policies. Such ratios help in better understanding of cost- structures and may
justify price controls by the Government to save the consumers.
Analysts: Ratio analysis is the most important technique available to the
financial analysis to study the financial statements to compare the progress and
position of various firms with each other and vis-à-vis the industry.

VIII. FUNCTIONAL CLASSIFICATION
The classification of ratios according to the purpose of its computation is known as
functional classification. On this basis ratios are categorised as follows:
(i) Profitability Ratios: Profitability ratios gives some yardstick to measure the
profit in relative terms with reference to sales, assets or capital employed. These
ratios highlight the end result of business activities. The main objective is to
judge the efficiency of the business.
(ii)Turnover Ratios or Activity Ratios: These ratios are used to measure the
effectiveness of the use of capital/assets in the business. These ratios are usually
calculated on the basis of sales or cost of goods sold and are expressed in integers
rather than as percentages.
(iii)Financial Ratios or Solvency Ratios: These ratios are calculated to judge the
financial position of the organisation from short-term as well as long-term
solvency point of view. Thus, it can be sub-divided into:
(a) Short-term Solvency Ratios (Liquidity Ratios)
(b) Long-term Solvency Ratios (Capital Structure Ratios).
(iv)Market Test Ratios:These are of course, some profitability ratios, having a
bearing on the market value of the shares.

A.PROFITABILITY RATIOS:
A measure of „profitability‟ is the overall measure of efficiency. In general terms
efficiency of business is measured by the input-output analysis. By measuring the
output as a proportion of the input, and comparing result of similar other firms or
periods the relative change in its profitability can be established.
Once this is known, the analyst compares the same with the profitability ratio
of other firms or periods. Then, when he finds some contrast, he would like to
have details of the reasons. These questions are sought to be answered by working
out relevant ratios. The main profitability ratio and all the other sub-ratios are
collectively known as profitability ratios.
Profitability ratio can be determined on the basis of either investments or sales.
Profitability in relation to investments is measured by return on capital employed,
return on shareholders‟ funds and return on assets. The profitability in relation to
sales are profit margin (gross and net) and expenses ratio or operating ratio.
1. Return on Investment
This ratio is also known as overall profitability ratio or return on capital
employed. The income (output) as compared to the capital employed (input)
indicates the return on investment. It shows how much the company is earning on
its investment.

Illustration 1:
Suppose a company has the following items on the liabilities side and it shows
underwriting commission of rs 1,00,000 on the assets side:
Its profit, after paying tax @ 50% is rs 14,00,000. Profit before interest and tax
will be rs 32,50,000 which can be calculated as shown below:
(ii) Return on Shareholders’ Funds :
It is also referred to as return on net worth. In this case it is desired to work out the
profitability of the company from the shareholders‟ point of view and it is
computed as follows:
(iii) Return on Assets :
Here the profitability is measured in terms of the relationship between net profits
and assets. It shows whether the assets are being properly utilised or not. It is
calculated as:
This ratio is a measure of the profitability of the total funds or investment of the
organisation.
(iv) Profit Ratios
(a) Gross Profit Ratio or Gross Margin : Gross profit ratio expresses the
relationship of gross profit to net sales or turnover. Gross profit is the excess
of the proceeds of goods sold and services rendered during a period over
their cost, before taking into account administration, selling and distribution
and financing charges. Gross profit ratio is expressed as follows :

(b) Net Profit Ratio: One of the components of return on capital employed is the
net profit ratio (or the margin on sales) calculated as:
(b) Operating Ratio :The ratio of all operating expenses (i.e., materials
used, labour, factory overheads, office and selling expenses) to sales is the
operating ratio. It is, therefore, necessary to break up the operating ratio into
various cost ratios. The major components of cost are: material, labour and
overheads. Therefore, it is worthwhile to classify the cost ratio as:

B. TURNOVER RATIOS :
The ratios used to measure the effectiveness of the employment of resources are
termed as activity ratios. Since these ratios relate to the use of assets for
generation of income through turnover they are also known as turnover ratios, as
we have seen already, the overall profitability of the business depends on two
factors i.e. (i) the rate of return on sales and (ii) the rate of return on capital
employed i.e. the speed at which the capital employed in the business relates.
More efficient the operations of an undertaking, the quicker and more number of
times the rotation is. Thus the overall profitability ratio is calculated as - Net Profit
Ratio x Turnover Ratio. The net profit ratio has already been discussed. Now the
important turnover ratios as regards capital employed and assets are discussed
below:
(i) Capital Turnover (Sales to Capital Employed) Ratio :
This ratio shows the efficiency of capital employed in the business and
is calculated as follows:
(ii) Total Assets Turnover Ratio :
This ratio is ascertained by dividing the net sales by the value of total assets.
A high ratio is an indicator of overtrading of total assets while a low ratio reveals
idle capacity. The total Assets Turnover Ratio can be segregated into:

(a) Fixed Assets Turnover Ratio: This ratio indicates the number of times fixed
assets are being turned over in a stated period. It is calculated as:
(b) Working Capital Turnover Ratio: This ratio shows the number of times
working capital is turned-over in a stated period. This ratio is calculated as:
(iii) Stock Turnover Ratio (Inventory Turnover Ratio)
This ratio is an indicator of the efficiency of the use of investment in stock. It is
calculated as:
Too large an inventory will depress the ratio; control over inventories and active
sales promotion will increase the ratio. If desired this ratio may be split into two
ratios, for raw materials and for finished goods:
This analysis will throw a better light on the inventory position. Average inventory
is calculated on the basis of the average inventory at the beginning and at the end
of the accounting period.

(iv) Debtors Turnover Ratio (Debtors’ Velocity)
These days some amount of sales always locked up in the form of book debts.
Efficient credit control and prompt collection of amounts due will mean
lower investments in book debts. This ratio measures the net credit sales of a firm
to the recorded trade debtors thereby indicating the rate at which cash is generated
by turnover of receivable or debtors. This ratio is calculated as:
(v) Creditors Turnover Ratio (Creditors’ Velocity)
Like debtors‟ turnover ratio, this ratio indicates the speed at which the payments
for credit purchases are made to creditors. This ratio is computed as follows:

C. FINANCIAL RATIOS
Financial statements of a firm are analysed for ascertaining its profitability as
well as financial position. A firm is said to be financially sound provided if it is
capable of meeting its commitments both short-term and long-term. Accordingly,
the ratios to be computed for judging the financial position are also known as
solvency ratios and those ratios which are computed for short-term solvency are
known as liquidity ratios.
(i) Liquidity Ratio
In a short period, a firm should be able to meet all its short-term obligations i.e.
current liabilities and provisions. It is current assets that yield funds in the short
period - current assets are those assets which the firm can convert into cash within
one year or in short run. Current assets should not only yield sufficient funds to
meet current liabilities as they fall due but also enable the firm to carry on its day
to day activities. The ratios to test the short-term solvency or liquidity
position of an enterprise are mainly the following:
(a)Current Ratio: Current ratio also known as the working capital ratio, is the most
widely used ratio. It is the ratio of total current assets to current liabilities and is
calculated by dividing the current assets by current liabilities.
(b)Liquid Ratio: This ratio is also known as Quick Ratio or Acid Test Ratio. This
ratio is calculated by relating liquid or quick assets to current liabilities. Liquid
assets mean those assets which are immediately converted into cash without much

loss. All current assets except inventories and prepaid expenses are categorised as
liquid assets. The ratio can be computed as:
Liquidity ratio may also be computed by substituting liquid liabilities in place of
current liabilities. Liquid liabilities mean those liabilities which are payable within
a short period. Bank overdraft and cash credit facilities, if they become a
permanent mode of financing are to be excluded from current liabilities to
arrive at liquid liabilities. Thus:
This ratio is an indicator of the liquid position of an enterprise. Generally, a
liquid ratio of 1:1 is considered as ideal as the firm can easily meet all current
liabilities. The main difference in current ratio and liquid ratio is on account of
inventories and therefore a comparison of two ratios leads to important
conclusions regarding inventory holding up.
(ii) Long-term Solvency Ratios
Long-term sources and uses of funds form the basic input for computation of long-
term solvency ratios. The investors i.e. shareholders and debenture holders both
present and prospective are interested in knowing the financial status of the
company so that they can take decisions for long-term investment of their funds.
The following are the main ratios in this category.
(a) Debt-Equity Ratio: Debt-equity ratio is the relation between borrowed funds
and owners‟ capital in a firm, it is also known as external-internal equity ratio.

The debt-equity ratio is used to ascertain the soundness of long-term financial
policies of the business. Debt means long-term loans i.e. debentures or long-term
loans from financial institutions. Equity means shareholders‟ funds i.e.,
preference share capital, equity share capital, reserves less loss and fictitious
assets like preliminary expenses. It is calculated in the following ways:
The main purpose of this ratio is to determine the relative stakes of outsiders and
shareholders.
(b) Proprietary Ratio: This ratio is a variant of debt-equity ratio which establishes
the relationship between shareholders funds and total assets. Shareholders‟ fund
means, share capital both equity and preference and reserves and surplus less
losses. This ratio is worked out as follows:
This ratio indicates the extent to which shareholders‟ funds have been invested in
the assets.
(c) Fixed Assets Ratio: The ratio of fixed assets to long-term funds is known as
fixed assets ratio. It focusses on the proportion of long-term funds invested in
fixed assets. The ratio is expressed as follows:

Fixed assets refer to net fixed assets (i.e. original cost-depreciation to date) and
trade investments including shares in subsidiaries. Long-term funds include share
capital, reserves and long-term loans.
(d) Debt-Service Ratio: This ratio is also known as Fixed Charges Cover or Interest
Cover. This ratio measures the debt servicing capacity of a firm in so far as fixed
interest on long-term loan is concerned. It is determined by dividing the net profit
before interest and taxes by the fixed charges on loans. Thus:
(e) Capital Gearing Ratio: The proportion between fixed interest or dividend
bearing funds and non-fixed interest or dividend bearing funds in the total capital
employed in the business is termed as capital gearing ratio. Debentures, long-term
loans and preference share capital belong to the category of fixed interest/dividend
bearing funds. Equity share capital, reserves and surplus constitute non-fixed
interest or dividend bearing funds. This ratio is calculated as follows:

D. MARKET TEST RATIOS
These ratios are calculated generally in case of such companies whose shares and
stocks are traded in the stock exchanges. Shareholders, present and probable, are
interested not only in the profits of the company but also in the appreciation of the
value of their shares in the stock market. The value of shares in the stock market,
besides other factors, also depends upon factors like dividends declared, earning
per share, the payout policy, etc., of the companies. The following ratios reflect
the effect of these factors on the market value of the shares.
(i) Earning Per Share (EPS): This is calculated as under:
(ii) Price Earning Ratio:This ratio establishes relationship between the market
price of the shares of a company and it‟s earning per share (EPS). It is calculated
as under:
(iii) Pay-out Ratio: This ratio expresses the relationship between what is available
as earnings per share and what is actually paid in the form of dividends out of
available earnings. It is a good measure of the dividend policy of the company. A
higher payout ratio may mean lower retention and ploughing back of profits, a
deteriorating liquidity position and little or no increase in the profit-earning
capacity of the company. This ratio is calculated with the help of the following
formula:

(iv) Dividend Yield Ratio: This ratio establishes the relationship between the
market price and the dividend paid per share. It is expressed as a percentage and
gives the rate of return on the market value of the shares and helps in the decision
of investors who are more concerned about returns on their investment rather than
its capital appreciation. This ratio is calculated as under:
It should be noted that in the calculation of all the above four ratios (market test)
preference shares are ignored and their dividend is adjusted against income, before
it is considered for these ratios.

IX ILLUSTRATIONS:


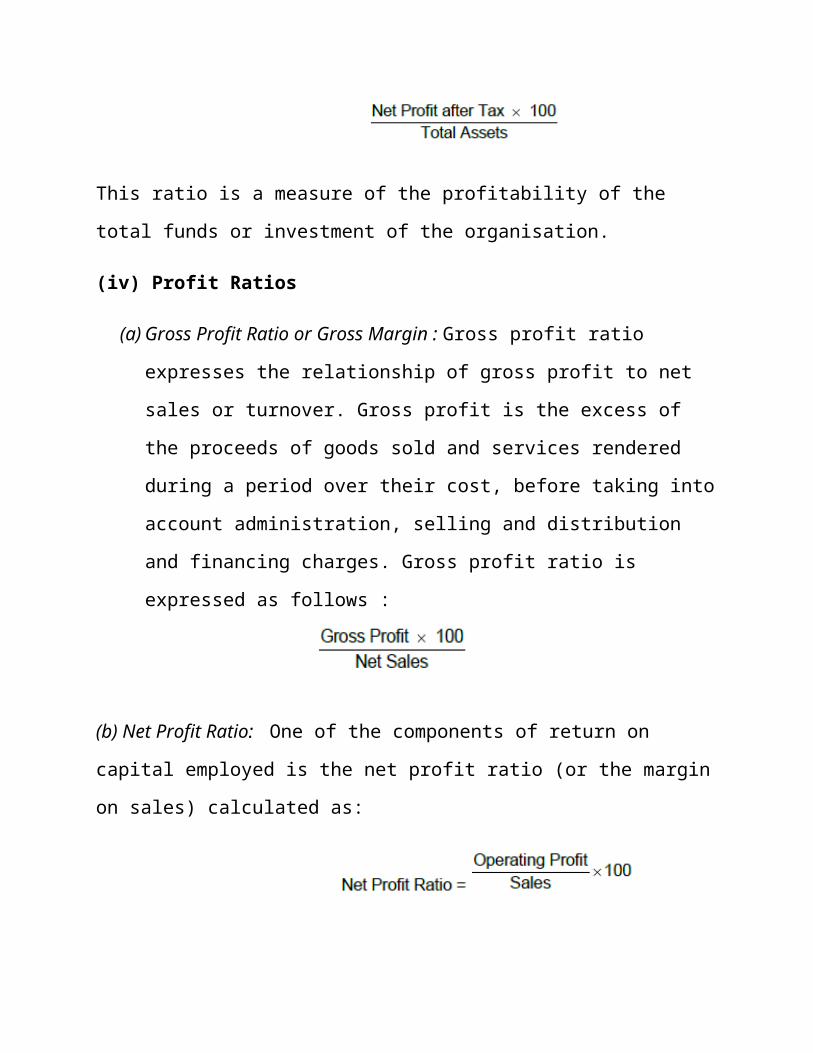
ILLUSTRATION :

X CONCULSION:
Financial statements generally refer to balance sheet or position statement
and profit and loss account or income statement. Of course, a business may also
prepare a statement of retained earnings and a cash flow statement. Financial
statements are prepared on the basis of (i) recorded facts; (ii) accounting
conventions; (iii) postulates; (iv) personal judgements, and (v) accounting
standards and guidance notes.

Attributes of financial statements cover – relevance, accuracy and freedom from
bias, comparability, analytical presentation, promptness, generally accepted
principles, consistency, authenticity and compliance with laws. Financial
statements are very much relevant to – the management, the public, the
shareholders and the lenders, the labour and trade unions, the country and
economy. In addition to the statutory requirements, the recent trends in presenting
financial statements may include - summarised profit and loss account and
balance sheet, highlights, cash flow statements, important accounting ratios,
disclosure of accounting policies, charts, graphs and diagrams, schedules,
impact of price level changes, rounding off of figures, etc. According to modus
operandi of analysis financial statement, analysis may be horizontal and vertical.
According to the objective of the analysis financial statement, analysis can be
long-term and short-term.
Analytical methods and devices used in analysing financial statements
include - comparative statements, common size statements, trend ratios, ratio
analysis and cash flow statements. Accounting ratios are relationships, expressed
in arithmetical terms, between figures which have a cause and effect relationship
or which are connected with each other in some other manner. Ratios may be
classified according to the statement upon which they are based, function and
importance. The functional ratios can be further classified into - profitability
ratios, turnover ratios or activity ratios, financial ratios or solvency ratios and
market test ratios.