Embed Size (px)
Citation preview

Financial & Audit ReportMay 31, 2012 & 2011

1
CONTENTS FINANCIAL OVERVIEW 2011 - 2012 ........................................................................................... 2 MANAGEMENT STATEMENT OF RESPONSIBILITY ............................................................... 3 INDEPENDENT AUDITOR'S REPORT ......................................................................................... 4 FINANCIAL STATEMENTS
Consolidated Statements of Financial Position ........................................................................... 5
Consolidated Statements of Activities ........................................................................................ 6
Consolidated Statements of Cash Flows ..................................................................................... 8
Notes to Consolidated Financial Statements ............................................................................... 9
INDEPENDENT AUDITOR'S REPORT ON ADDITIONAL INFORMATION ............................. 35
OTHER FINANCIAL INFORMATION (not subjected to auditing procedures)
Tuition and Fees, Room and Board 2003 - 2012 ........................................................................ 36
Student Enrollment 2002 - 2011 ................................................................................................. 37
Student Selectivity 2003 - 2012 .................................................................................................. 38
Endowment Market Value 2003 - 2012 ...................................................................................... 39
Net Assets and Liabilities 2003 - 2012 ....................................................................................... 40
ELON UNIVERSITY2
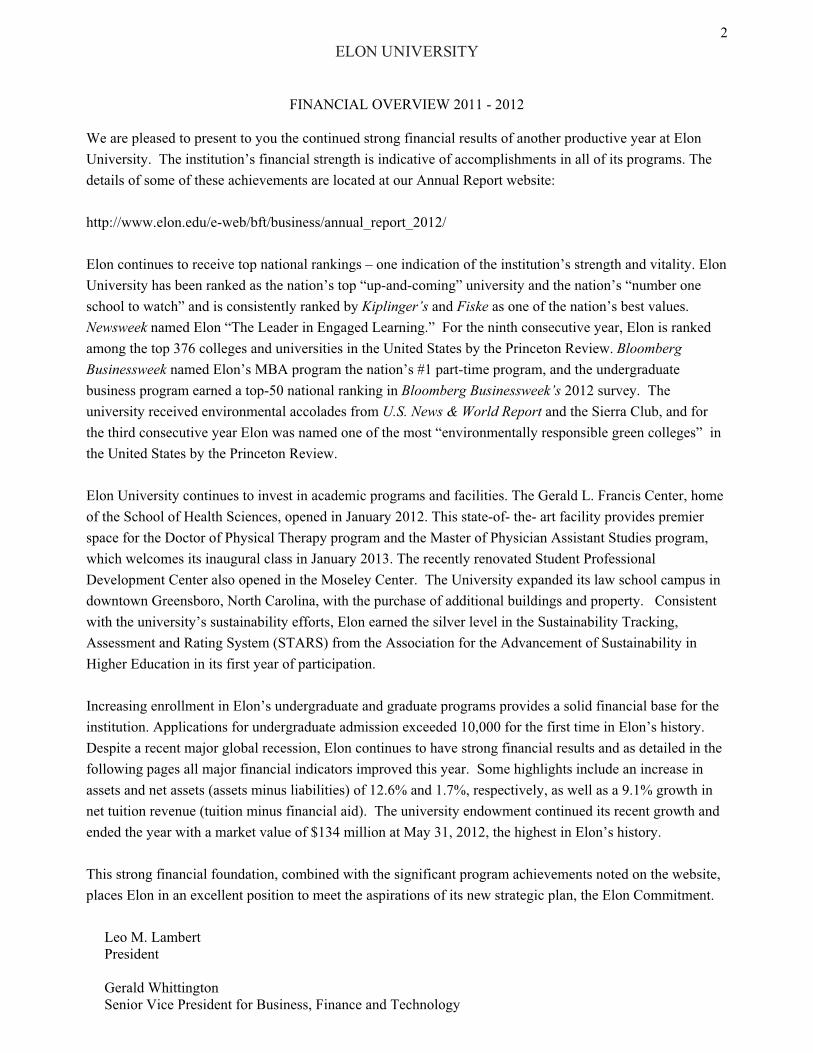
FINANCIAL OVERVIEW 2011 - 2012
We are pleased to present to you the continued strong financial results of another productive year at Elon University. The institution’s financial strength is indicative of accomplishments in all of its programs. The details of some of these achievements are located at our Annual Report website: http://www.elon.edu/e-web/bft/business/annual_report_2012/ Elon continues to receive top national rankings – one indication of the institution’s strength and vitality. Elon University has been ranked as the nation’s top “up-and-coming” university and the nation’s “number one school to watch” and is consistently ranked by Kiplinger’s and Fiske as one of the nation’s best values. Newsweek named Elon “The Leader in Engaged Learning.” For the ninth consecutive year, Elon is ranked among the top 376 colleges and universities in the United States by the Princeton Review. Bloomberg Businessweek named Elon’s MBA program the nation’s #1 part-time program, and the undergraduate business program earned a top-50 national ranking in Bloomberg Businessweek’s 2012 survey. The university received environmental accolades from U.S. News & World Report and the Sierra Club, and for the third consecutive year Elon was named one of the most “environmentally responsible green colleges” in the United States by the Princeton Review. Elon University continues to invest in academic programs and facilities. The Gerald L. Francis Center, home of the School of Health Sciences, opened in January 2012. This state-of- the- art facility provides premier space for the Doctor of Physical Therapy program and the Master of Physician Assistant Studies program, which welcomes its inaugural class in January 2013. The recently renovated Student Professional Development Center also opened in the Moseley Center. The University expanded its law school campus in downtown Greensboro, North Carolina, with the purchase of additional buildings and property. Consistent with the university’s sustainability efforts, Elon earned the silver level in the Sustainability Tracking, Assessment and Rating System (STARS) from the Association for the Advancement of Sustainability in Higher Education in its first year of participation. Increasing enrollment in Elon’s undergraduate and graduate programs provides a solid financial base for the institution. Applications for undergraduate admission exceeded 10,000 for the first time in Elon’s history. Despite a recent major global recession, Elon continues to have strong financial results and as detailed in the following pages all major financial indicators improved this year. Some highlights include an increase in assets and net assets (assets minus liabilities) of 12.6% and 1.7%, respectively, as well as a 9.1% growth in net tuition revenue (tuition minus financial aid). The university endowment continued its recent growth and ended the year with a market value of $134 million at May 31, 2012, the highest in Elon’s history. This strong financial foundation, combined with the significant program achievements noted on the website, places Elon in an excellent position to meet the aspirations of its new strategic plan, the Elon Commitment.
Leo M. Lambert President Gerald Whittington Senior Vice President for Business, Finance and Technology
3
MANAGEMENT STATEMENT OF RESPONSIBILITY The management of Elon University has prepared the accompanying financial statements in accordance with generally accepted accounting principles and is responsible for their integrity, objectivity and fair presentation. The management of Elon University maintains a system of internal control designed to provide reasonable assurance, on a cost-effective basis, that assets are safeguarded, transactions are executed in accordance with management's authorization and financial records are reliable for preparing financial statements. This system of control provides reasonable assurance that errors or irregularities that could be material to the financial statements are prevented or detected within a timely period. Key elements in the system include the communication of policies and procedures, selection and training of qualified personnel, and organizational arrangements that provide an appropriate division of responsibility. Management believes that, as of May 31, 2012 and 2011, Elon University's system of internal control was adequate to accomplish the objectives discussed herein. Elon University's Board of Trustees addresses its oversight responsibility for the financial statements through its Audit Committee, which is composed of Trustees who are independent of Elon University management. The Audit Committee meets at least three times annually with the University's management and independent auditor to review matters relating to financial reporting, auditing and internal control. To ensure auditor independence, the independent auditor has full and free access to the Audit Committee during the meetings both with management present and in executive session without management present. The independent accounting firm is engaged to audit, in accordance with auditing standards generally accepted in the United States of America, the financial statements of Elon University. The auditor was given unrestricted access to all financial records and related data including minutes of all meetings of the Board of Trustees and its committees. All representations made to the independent auditor by University management during their audit were true and accurate and to the best of their knowledge and belief.
Leo M. Lambert President Gerald Whittington Senior Vice President for Business, Finance and Technology
4
INDEPENDENT AUDITOR'S REPORT The Board of Trustees Elon University Elon, North Carolina We have audited the accompanying consolidated statements of financial position of Elon University (a nonprofit organization) as of May 31, 2012 and 2011, and the related consolidated statements of activities and cash flows for the years then ended. These financial statements are the responsibility of the University's management. Our responsibility is to express an opinion on these financial statements based on our audits. We conducted our audits in accordance with auditing standards generally accepted in the United States of America. Those standards require that we plan and perform the audit to obtain reasonable assurance about whether the financial statements are free of material misstatement. An audit includes examining, on a test basis, evidence supporting the amounts and disclosures in the financial statements. An audit also includes assessing the accounting principles used and significant estimates made by management, as well as evaluating the overall financial statement presentation. We believe that our audits provide a reasonable basis for our opinion. In our opinion, the consolidated financial statements referred to above present fairly, in all material respects, the financial position of Elon University as of May 31, 2012 and 2011, and the changes in its net assets and its cash flows for the years then ended in conformity with accounting principles generally accepted in the United States of America.
September 21, 2012
STOUTSTUART M GOWEN & KING LLP
c=
Certified Public
Accountants
Advisors to
Member of PCPS, the AICPA Alliance For CPA Firms
e-mail: [email protected]
fax 336-229-4204336-226-7343
Burlington, NC 272151233 South Church Street
Street Address:
Burlington, NC 27216-1440
P.O. Box 1440 Mailing Address:
Management
5
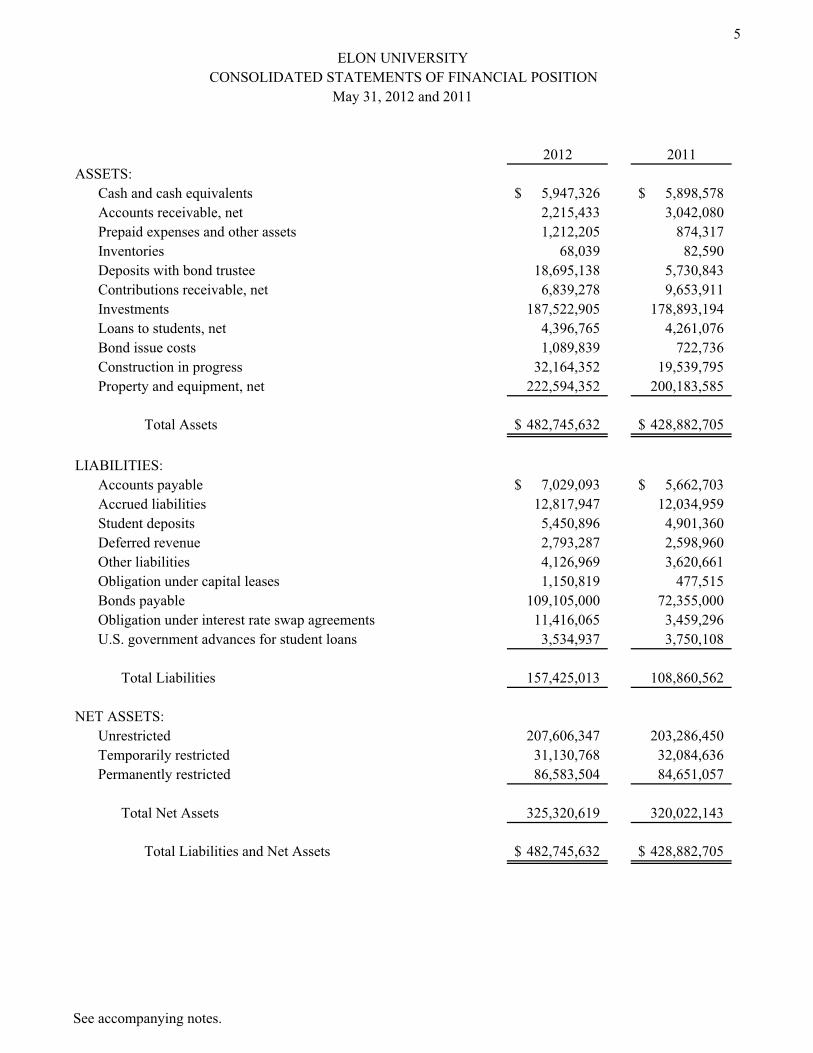
2012 2011ASSETS:
Cash and cash equivalents 5,947,326$ 5,898,578$ Accounts receivable, net 2,215,433 3,042,080 Prepaid expenses and other assets 1,212,205 874,317 Inventories 68,039 82,590 Deposits with bond trustee 18,695,138 5,730,843 Contributions receivable, net 6,839,278 9,653,911 Investments 187,522,905 178,893,194 Loans to students, net 4,396,765 4,261,076 Bond issue costs 1,089,839 722,736 Construction in progress 32,164,352 19,539,795 Property and equipment, net 222,594,352 200,183,585
Total Assets 482,745,632$ 428,882,705$
LIABILITIES:Accounts payable 7,029,093$ 5,662,703$ Accrued liabilities 12,817,947 12,034,959 Student deposits 5,450,896 4,901,360 Deferred revenue 2,793,287 2,598,960 Other liabilities 4,126,969 3,620,661 Obligation under capital leases 1,150,819 477,515 Bonds payable 109,105,000 72,355,000 Obligation under interest rate swap agreements 11,416,065 3,459,296 U.S. government advances for student loans 3,534,937 3,750,108
Total Liabilities 157,425,013 108,860,562
NET ASSETS:Unrestricted 207,606,347 203,286,450 Temporarily restricted 31,130,768 32,084,636 Permanently restricted 86,583,504 84,651,057
Total Net Assets 325,320,619 320,022,143
Total Liabilities and Net Assets 482,745,632$ 428,882,705$
ELON UNIVERSITYCONSOLIDATED STATEMENTS OF FINANCIAL POSITION
May 31, 2012 and 2011
See accompanying notes.
6
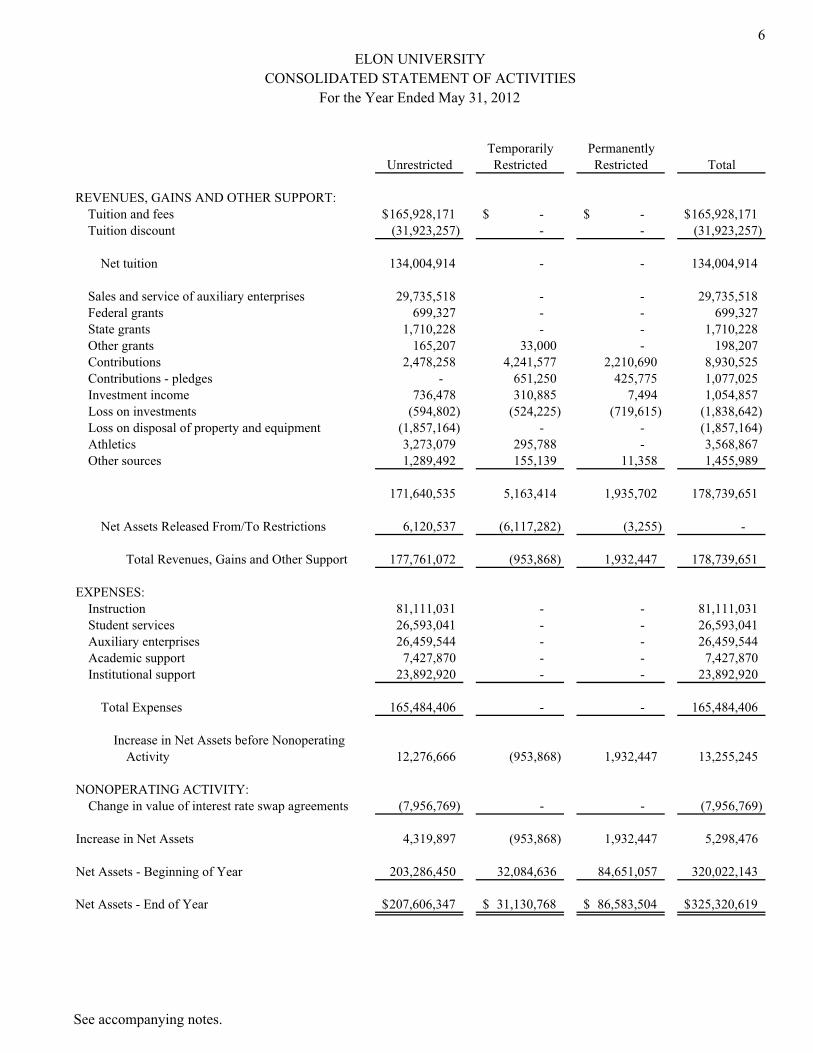
Temporarily PermanentlyUnrestricted Restricted Restricted Total
REVENUES, GAINS AND OTHER SUPPORT:Tuition and fees 165,928,171$ -$ -$ 165,928,171$ Tuition discount (31,923,257) - - (31,923,257)
Net tuition 134,004,914 - - 134,004,914
Sales and service of auxiliary enterprises 29,735,518 - - 29,735,518 Federal grants 699,327 - - 699,327 State grants 1,710,228 - - 1,710,228 Other grants 165,207 33,000 - 198,207 Contributions 2,478,258 4,241,577 2,210,690 8,930,525 Contributions - pledges - 651,250 425,775 1,077,025 Investment income 736,478 310,885 7,494 1,054,857 Loss on investments (594,802) (524,225) (719,615) (1,838,642) Loss on disposal of property and equipment (1,857,164) - - (1,857,164) Athletics 3,273,079 295,788 - 3,568,867 Other sources 1,289,492 155,139 11,358 1,455,989
171,640,535 5,163,414 1,935,702 178,739,651
Net Assets Released From/To Restrictions 6,120,537 (6,117,282) (3,255) -
Total Revenues, Gains and Other Support 177,761,072 (953,868) 1,932,447 178,739,651
EXPENSES:Instruction 81,111,031 - - 81,111,031 Student services 26,593,041 - - 26,593,041 Auxiliary enterprises 26,459,544 - - 26,459,544 Academic support 7,427,870 - - 7,427,870 Institutional support 23,892,920 - - 23,892,920
Total Expenses 165,484,406 - - 165,484,406
Increase in Net Assets before NonoperatingActivity 12,276,666 (953,868) 1,932,447 13,255,245
NONOPERATING ACTIVITY:Change in value of interest rate swap agreements (7,956,769) - - (7,956,769)
Increase in Net Assets 4,319,897 (953,868) 1,932,447 5,298,476
Net Assets - Beginning of Year 203,286,450 32,084,636 84,651,057 320,022,143
Net Assets - End of Year 207,606,347$ 31,130,768$ 86,583,504$ 325,320,619$
ELON UNIVERSITYCONSOLIDATED STATEMENT OF ACTIVITIES
For the Year Ended May 31, 2012
See accompanying notes.

6
Temporarily PermanentlyUnrestricted Restricted Restricted Total
REVENUES, GAINS AND OTHER SUPPORT:Tuition and fees 165,928,171$ -$ -$ 165,928,171$ Tuition discount (31,923,257) - - (31,923,257)
Net tuition 134,004,914 - - 134,004,914
Sales and service of auxiliary enterprises 29,735,518 - - 29,735,518 Federal grants 699,327 - - 699,327 State grants 1,710,228 - - 1,710,228 Other grants 165,207 33,000 - 198,207 Contributions 2,478,258 4,241,577 2,210,690 8,930,525 Contributions - pledges - 651,250 425,775 1,077,025 Investment income 736,478 310,885 7,494 1,054,857 Loss on investments (594,802) (524,225) (719,615) (1,838,642) Loss on disposal of property and equipment (1,857,164) - - (1,857,164) Athletics 3,273,079 295,788 - 3,568,867 Other sources 1,289,492 155,139 11,358 1,455,989
171,640,535 5,163,414 1,935,702 178,739,651
Net Assets Released From/To Restrictions 6,120,537 (6,117,282) (3,255) -
Total Revenues, Gains and Other Support 177,761,072 (953,868) 1,932,447 178,739,651
EXPENSES:Instruction 81,111,031 - - 81,111,031 Student services 26,593,041 - - 26,593,041 Auxiliary enterprises 26,459,544 - - 26,459,544 Academic support 7,427,870 - - 7,427,870 Institutional support 23,892,920 - - 23,892,920
Total Expenses 165,484,406 - - 165,484,406
Increase in Net Assets before NonoperatingActivity 12,276,666 (953,868) 1,932,447 13,255,245
NONOPERATING ACTIVITY:Change in value of interest rate swap agreements (7,956,769) - - (7,956,769)
Increase in Net Assets 4,319,897 (953,868) 1,932,447 5,298,476
Net Assets - Beginning of Year 203,286,450 32,084,636 84,651,057 320,022,143
Net Assets - End of Year 207,606,347$ 31,130,768$ 86,583,504$ 325,320,619$
ELON UNIVERSITYCONSOLIDATED STATEMENT OF ACTIVITIES
For the Year Ended May 31, 2012
See accompanying notes.
7
Temporarily PermanentlyUnrestricted Restricted Restricted Total
REVENUES, GAINS AND OTHER SUPPORT:Tuition and fees 152,729,077$ -$ -$ 152,729,077$ Tuition discount (29,956,368) - - (29,956,368)
Net tuition 122,772,709 - - 122,772,709
Sales and service of auxiliary enterprises 27,715,560 - - 27,715,560 Federal grants 911,673 - - 911,673 State grants 1,797,641 - - 1,797,641 Other grants 156,609 - - 156,609 Contributions 2,778,959 1,648,275 1,742,388 6,169,622 Contributions - pledges 27,011 2,065,470 2,208,502 4,300,983 Investment income 668,359 327,297 - 995,656 Gain on investments 6,126,701 9,055,128 3,446,103 18,627,932 Loss on disposal of property and equipment (312,430) - - (312,430) Athletics 2,991,751 165,986 - 3,157,737 Other sources 1,367,048 187,876 45,146 1,600,070
167,001,591 13,450,032 7,442,139 187,893,762
Net Assets Released From/To Restrictions 9,756,263 (9,883,659) 127,396 -
Total Revenues, Gains and Other Support 176,757,854 3,566,373 7,569,535 187,893,762
EXPENSES:Instruction 75,638,148 - - 75,638,148 Student services 24,707,004 - - 24,707,004 Auxiliary enterprises 23,049,377 - - 23,049,377 Academic support 7,323,245 - - 7,323,245 Institutional support 22,172,342 - - 22,172,342
Total Expenses 152,890,116 - - 152,890,116
Increase in Net Assets before NonoperatingActivity 23,867,738 3,566,373 7,569,535 35,003,646
NONOPERATING ACTIVITY:Change in value of interest rate swap agreements (234,539) - - (234,539)
Increase in Net Assets 23,633,199 3,566,373 7,569,535 34,769,107
Net Assets - Beginning of Year 179,653,251 28,518,263 77,081,522 285,253,036
Net Assets - End of Year 203,286,450$ 32,084,636$ 84,651,057$ 320,022,143$
ELON UNIVERSITYCONSOLIDATED STATEMENT OF ACTIVITIES
For the Year Ended May 31, 2011
See accompanying notes.
8
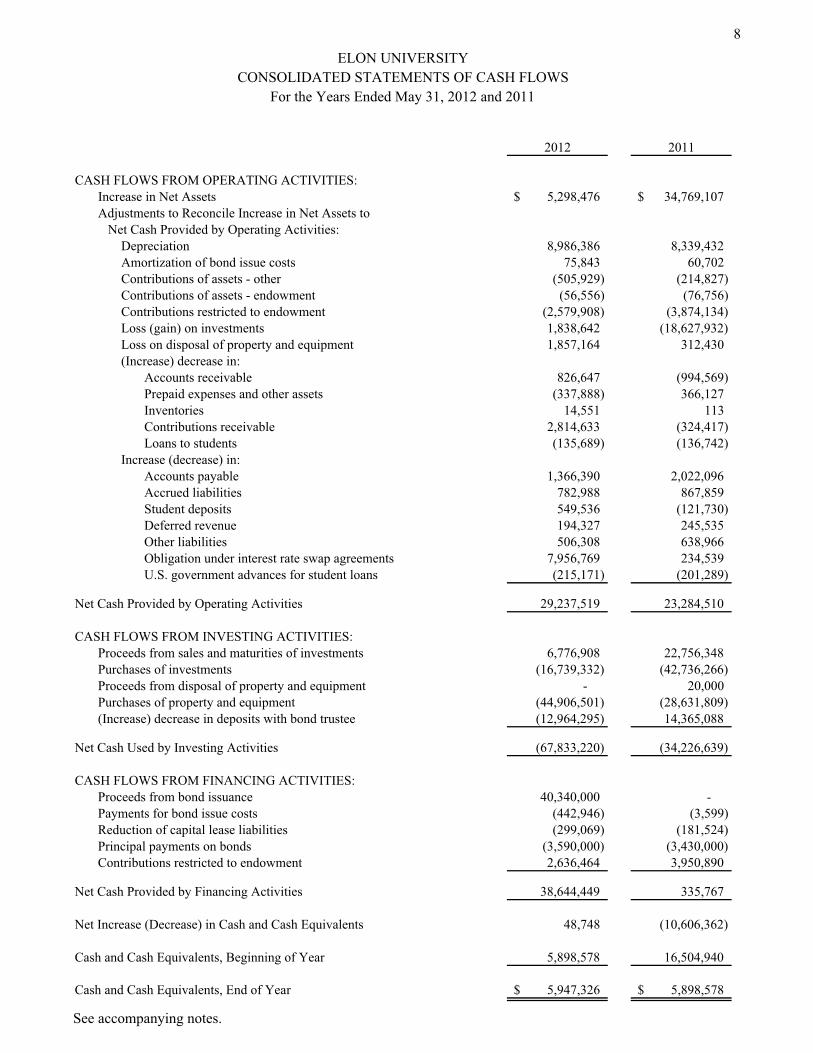
2012 2011
CASH FLOWS FROM OPERATING ACTIVITIES:Increase in Net Assets 5,298,476$ 34,769,107$ Adjustments to Reconcile Increase in Net Assets to Net Cash Provided by Operating Activities:
Depreciation 8,986,386 8,339,432 Amortization of bond issue costs 75,843 60,702 Contributions of assets - other (505,929) (214,827) Contributions of assets - endowment (56,556) (76,756) Contributions restricted to endowment (2,579,908) (3,874,134) Loss (gain) on investments 1,838,642 (18,627,932) Loss on disposal of property and equipment 1,857,164 312,430 (Increase) decrease in:
Accounts receivable 826,647 (994,569) Prepaid expenses and other assets (337,888) 366,127 Inventories 14,551 113 Contributions receivable 2,814,633 (324,417) Loans to students (135,689) (136,742)
Increase (decrease) in:Accounts payable 1,366,390 2,022,096 Accrued liabilities 782,988 867,859 Student deposits 549,536 (121,730) Deferred revenue 194,327 245,535 Other liabilities 506,308 638,966 Obligation under interest rate swap agreements 7,956,769 234,539 U.S. government advances for student loans (215,171) (201,289)
Net Cash Provided by Operating Activities 29,237,519 23,284,510
CASH FLOWS FROM INVESTING ACTIVITIES:Proceeds from sales and maturities of investments 6,776,908 22,756,348 Purchases of investments (16,739,332) (42,736,266) Proceeds from disposal of property and equipment - 20,000 Purchases of property and equipment (44,906,501) (28,631,809) (Increase) decrease in deposits with bond trustee (12,964,295) 14,365,088
Net Cash Used by Investing Activities (67,833,220) (34,226,639)
CASH FLOWS FROM FINANCING ACTIVITIES:Proceeds from bond issuance 40,340,000 - Payments for bond issue costs (442,946) (3,599) Reduction of capital lease liabilities (299,069) (181,524) Principal payments on bonds (3,590,000) (3,430,000) Contributions restricted to endowment 2,636,464 3,950,890
Net Cash Provided by Financing Activities 38,644,449 335,767
Net Increase (Decrease) in Cash and Cash Equivalents 48,748 (10,606,362)
Cash and Cash Equivalents, Beginning of Year 5,898,578 16,504,940
Cash and Cash Equivalents, End of Year 5,947,326$ 5,898,578$
ELON UNIVERSITYCONSOLIDATED STATEMENTS OF CASH FLOWS
For the Years Ended May 31, 2012 and 2011
See accompanying notes.
9 ELON UNIVERSITY
NOTES TO CONSOLIDATED FINANCIAL STATEMENTS For the Years Ended May 31, 2012 and 2011
NOTE A: Summary of Significant Accounting Policies:
(1) Organization: The university is a private institution of higher education located in Elon, North Carolina.
(2) Tax Status:
Elon University is a not-for-profit organization that is exempt from federal and North Carolina income taxes under Section 501(c)(3) of the Internal Revenue Code and is classified by the Internal Revenue Service as other than a private foundation.
(3) Consolidation: Occasionally the university will establish separate entities for use in specific investment transactions. To date, these entities have been limited in form to single-member Delaware limited liability companies (LLC), with the university as the single member. The consolidated financial statements include the accounts of the university and all such single-member LLCs. All inter-organizational balances and transactions have been eliminated.
(4) Basis of Presentation: The accompanying consolidated financial statements of the university have been prepared on the accrual basis of accounting and in accordance with the reporting principles of not-for-profit accounting. Accounting standards require unconditional promises-to-give be recorded as receivables and revenue within the appropriate net asset category.
(5) Classification of Net Assets: The accompanying consolidated financial statements have been prepared to present balances and transactions according to the existence or absence of donor-imposed restrictions. Accordingly, net assets and changes therein are classified as follows:
Unrestricted – Net assets that are not subject to donor-imposed stipulations. Unrestricted
net assets may be designated for specific purposes by actions of the Board of Trustees or may otherwise be limited by contractual agreements with outside parties.
Temporarily Restricted – Net assets whose use by the university are subject to donor-
imposed stipulations or a function of law, that can be fulfilled by actions of the university pursuant to those stipulations or that expire by the passage of time.
Permanently Restricted – Net assets subject to donor-imposed stipulations that are used for
a specific purpose, preserved and not sold or if sold, reinvested in other similar assets. Such assets primarily include the university's permanent endowment funds.
Revenues are reported as increases in unrestricted net assets unless use of the related assets is limited by donor-imposed restrictions. Expenses are reported as decreases in unrestricted net assets. Gains and losses on investments and other assets or liabilities are reported as increases or decreases in unrestricted net assets unless use is restricted by donor stipulations or by law. Expirations of donor-imposed stipulations that simultaneously increase one class of net assets and decrease another are reported as a reclassification between applicable classes of net assets (assets released from/to restriction).
10 ELON UNIVERSITY
NOTES TO CONSOLIDATED FINANCIAL STATEMENTS For the Years Ended May 31, 2012 and 2011
NOTE A: Summary of Significant Accounting Policies: (continued)
(6) Fund Accounting: In order to ensure observance of limitations and restrictions placed on the use of the resources available to Elon University, the accounts of the university are maintained in accordance with the principles of "fund accounting". This is the procedure by which resources for various purposes are classified, for accounting purposes, into funds that are in accordance with the activities or objectives specified. Separate accounts are maintained for each fund.
(7) Cash and Cash Equivalents:
For purposes of the financial statements, cash and cash equivalents consist of demand deposit accounts, money market accounts and highly liquid investment accounts. The university maintains its cash and cash equivalents with several financial institutions. Accounts at these institutions are insured by the Federal Deposit Insurance Corporation. At May 31, 2012 and 2011, non-interest bearing accounts are fully insured while interest-bearing accounts are insured up to $250,000. Non-domestic accounts along with investment accounts are uninsured. Total uninsured cash and cash equivalents are approximately $45,475,126 and $42,346,462 at May 31, 2012 and 2011, respectively. A separate demand deposit account, which holds cash for the Federal Perkins Loan Program, is required and maintained by the university. The balance in this account is $46,893 and $77,124 at May 31, 2012 and 2011, respectively.
(8) Accounts Receivable: Accounts receivable includes obligations from students in the normal course of operations and consists principally of billings for Summer Sessions I, post graduate programs and summer trips. Student receivables are stated at the amount billed, are uncollateralized and unpaid accounts bear no interest. Payment for all classes is due on or before registration day of each semester. Students are not allowed to register until payment has been made. The university does extend credit plans to its students in the normal course of business. These credit plans must be prearranged and all payments are due before the close of the semester. The total amount included in accounts receivable at May 31, 2012 past due 120 days or more is $199,260. Payments of accounts receivable are allocated to the specific student account.
The carrying amount of accounts receivable is reduced by a valuation allowance that reflects management's best estimate of the amounts that will not be collected. Management individually reviews all accounts receivable balances that exceed 180 days from the billing date and, based on an assessment of current creditworthiness, estimates the portion, if any, of the balance that will not be collected. The total of the allowance is $50,000 and $40,150 at May 31, 2012 and 2011, respectively.
(9) Inventories: Inventories are stated at the lower of cost or market. Cost is being determined on a first-in, first-out basis. Inventories consist of office supplies, computer hardware and fuel.
11 ELON UNIVERSITY
NOTES TO CONSOLIDATED FINANCIAL STATEMENTS For the Years Ended May 31, 2012 and 2011
NOTE A: Summary of Significant Accounting Policies: (continued)
(10) Deposits with bond trustee: Deposits with bond trustee consist of unexpended proceeds from the 2011 and 2010 bond issues. These funds are invested in short-term, highly liquid securities and will be used for construction of certain facilities.
(11) Contributions Receivable: Contributions receivable are stated at present value, net of an allowance for uncollectible contributions receivable. The allowance is based on management's analysis of specific promises made. Present value is calculated using a discount rate of 3.25%.
(12) Investments: The university's investments include a diverse portfolio of securities and investment vehicles. The university reports investments in marketable securities with readily determinable fair values and all investments in debt securities at fair value in the Consolidated Statements of Financial Position. Alternative investments, predominately a minority ownership interest in a limited partnership investment fund, are valued at net asset value as provided by the investees and in accordance with applicable professional literature. Management of the university believes the carrying amount of these financial instruments is a reasonable estimate of the fair value. Unrealized gains and losses are included in the change in net assets in the accompanying Consolidated Statements of Activities. The university reports its real estate investments at fair value as of the dates the investments are purchased by or donated to the university.
(13) Endowment Funds: A donor's stipulation that requires a gift to be invested in perpetuity or for a specified term creates an endowment fund. Net appreciation on endowment funds is not permanently restricted unless such net appreciation has been permanently restricted by the donor or by law. Accordingly, market appreciation on permanently restricted endowment funds is generally classified in the financial statements as part of temporarily restricted net assets. It is the practice of the university to prudently invest pooled endowment funds consistent with the endowment asset allocation policy approved by the Board of Trustees. The university's spending policy is based on the moving three year average of the market value of the pooled endowment which equated to a spending policy rate of 4.5% and 4.6% at May 31, 2012 and 2011, respectively.
(14) Split-Interest Agreements:
Split-interest agreements with donors consist primarily of irrevocable charitable remainder trusts and charitable gift annuities. Assets held in trusts are included in investments. The contribution is recognized when the agreement is signed and the institution receives the assets. Annuity and other split-interest obligations are adjusted annually at the end of each fiscal year.
(15) Loans to Students:
Loans to students include Federal Perkins and institutional loans which are reported at estimated net realizable amounts.
12 ELON UNIVERSITY
NOTES TO CONSOLIDATED FINANCIAL STATEMENTS For the Years Ended May 31, 2012 and 2011
NOTE A: Summary of Significant Accounting Policies: (continued)
(16) Bond Issue Costs: Bond issue costs are capitalized and amortized over the life of the underlying bonds using the straight-line method.
(17) Interest Rate Swap Agreements:
Cash flows from hedging transactions are classified in the same category as the cash flow of the related hedged item.
(18) Property and Equipment: It is the university's policy to capitalize property and equipment valued over $5,000. Purchased property and equipment are capitalized at cost. Donations of property and equipment are recorded as support at estimated fair value. Such donations are reported as unrestricted contributions unless the donor has restricted the donated asset to a specific purpose. Property and equipment donated with explicit restrictions on use and contributions of cash that must be used to acquire property and equipment are reported as temporarily or permanently restricted support. Absent donor stipulations regarding how long donated assets must be maintained, the university reports expirations of donor restrictions when the donated or acquired assets are placed in service. The university reclassifies temporarily restricted net assets to unrestricted net assets at that time. Property and equipment are depreciated using the straight-line method over the estimated useful lives of the assets. Works of art are capitalized by the university at cost, or fair value if donated. As these items are not subject to normal wear or obsolescence, depreciation is not recognized.
Library resources are capitalized at cost, or fair value if donated. Depreciation is recorded using the straight-line method over estimated useful lives.
(19) Contributions: Contributions are recognized when the donor makes a promise to give a gift to the university that is, in substance, unconditional. Contributions, on which the donor imposes no restrictions, are reported as increases in unrestricted net assets. All other donor-restricted contributions are reported as increases in temporarily or permanently restricted net assets, depending on the nature of the restrictions. It is the university's policy to release restrictions on contributions received for long-lived assets when the asset is acquired or put into service. If the university is able to satisfy a donor's restrictions in the same period the contribution is received, the restricted contribution is reported as unrestricted support. The expiration of a donor-imposed restriction on a contribution or on endowment income is recognized in the period in which the restriction expires and at that time the related resources are reclassified to unrestricted net assets. A restriction expires when the stipulated time has elapsed, when the stipulated purpose for which the resource was restricted has been fulfilled, or both.
13 ELON UNIVERSITY
NOTES TO CONSOLIDATED FINANCIAL STATEMENTS For the Years Ended May 31, 2012 and 2011
NOTE A: Summary of Significant Accounting Policies: (continued)
(20) Use of Estimates: The preparation of financial statements in conformity with U.S. generally accepted accounting principles requires management to make estimates and assumptions that affect the reported amounts of assets and liabilities and disclosure of contingent assets and liabilities at the date of the financial statements and the reported amounts of revenues and expenses during the reporting period. Actual results could differ from those estimates.
(21) Reclassifications:
Certain items in the 2011 report have been reclassified to conform to current year classifications. Such reclassifications had no effect on previously reported change in net assets.
NOTE B: Fair Value Measurements:
Accounting Standards Codification (ASC) 820, Fair Value Measurements and Disclosures, defines fair value, establishes a consistent framework for measuring fair value and expands disclosure about fair value measurements. It does not supersede all applications of fair value in other pronouncements, but creates a fair value hierarchy and prioritizes the inputs to valuation techniques for use in most pronouncements. It requires entities to assess the significance of an input to the fair value measurement in its entirety. ASC 820, as amended, also requires entities to disclose information to enable users of financial statements to assess the inputs used to develop the fair value measurements. The university applies the provisions of ASC 820 to financial assets and financial liabilities. ASC 820 is a technical standard which clarifies that fair value is an exit price, representing the amount that would be received to sell an asset or paid to transfer a liability in an orderly transaction between market participants. As such, fair value is a market-based measurement that should be determined based on assumptions that market participants would use in pricing an asset or liability. Valuation techniques are the market, cost or income approach.
As a basis for considering such assumptions, ASC 820 establishes a three-tier fair value hierarchy which prioritizes the inputs used in measuring fair value as follows: Level 1 - quoted prices for identical assets or liabilities in active markets,
Level 2 - quoted prices for similar assets or liabilities in active markets, quoted prices for identical or similar assets or liabilities in markets that are not active and model-based valuations in which significant inputs are corroborated by observable market data and Level 3 - valuation techniques in which significant inputs are unobservable.
14 ELON UNIVERSITY
NOTES TO CONSOLIDATED FINANCIAL STATEMENTS For the Years Ended May 31, 2012 and 2011
NOTE B: Fair Value Measurements: (continued)
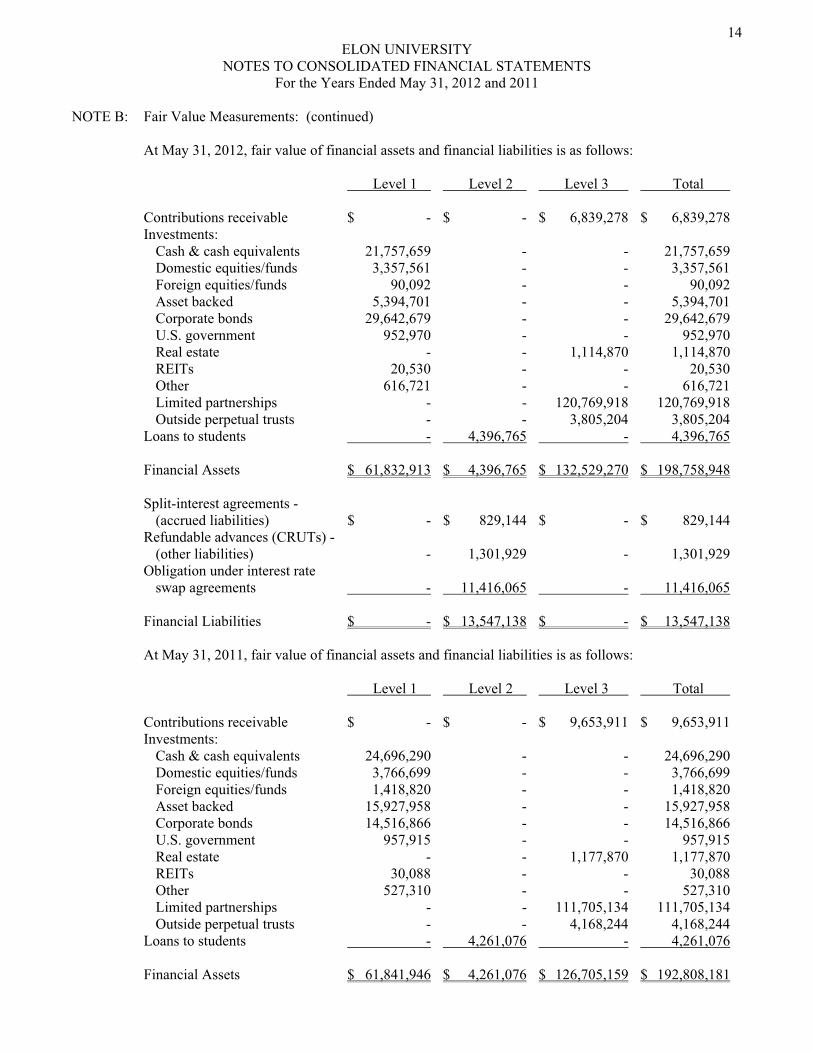
At May 31, 2012, fair value of financial assets and financial liabilities is as follows: Level 1 Level 2 Level 3 Total Contributions receivable $ - $ - $ 6,839,278 $ 6,839,278 Investments: Cash & cash equivalents 21,757,659 - - 21,757,659 Domestic equities/funds 3,357,561 - - 3,357,561 Foreign equities/funds 90,092 - - 90,092 Asset backed 5,394,701 - - 5,394,701 Corporate bonds 29,642,679 - - 29,642,679 U.S. government 952,970 - - 952,970 Real estate - - 1,114,870 1,114,870 REITs 20,530 - - 20,530 Other 616,721 - - 616,721 Limited partnerships - - 120,769,918 120,769,918 Outside perpetual trusts - - 3,805,204 3,805,204 Loans to students - 4,396,765 - 4,396,765 Financial Assets $ 61,832,913 $ 4,396,765 $ 132,529,270 $ 198,758,948 Split-interest agreements - (accrued liabilities) $ - $ 829,144 $ - $ 829,144 Refundable advances (CRUTs) - (other liabilities) - 1,301,929 - 1,301,929 Obligation under interest rate swap agreements - 11,416,065 - 11,416,065 Financial Liabilities $ - $ 13,547,138 $ - $ 13,547,138
At May 31, 2011, fair value of financial assets and financial liabilities is as follows:
Level 1 Level 2 Level 3 Total Contributions receivable $ - $ - $ 9,653,911 $ 9,653,911 Investments: Cash & cash equivalents 24,696,290 - - 24,696,290 Domestic equities/funds 3,766,699 - - 3,766,699 Foreign equities/funds 1,418,820 - - 1,418,820 Asset backed 15,927,958 - - 15,927,958 Corporate bonds 14,516,866 - - 14,516,866 U.S. government 957,915 - - 957,915 Real estate - - 1,177,870 1,177,870 REITs 30,088 - - 30,088 Other 527,310 - - 527,310 Limited partnerships - - 111,705,134 111,705,134 Outside perpetual trusts - - 4,168,244 4,168,244 Loans to students - 4,261,076 - 4,261,076 Financial Assets $ 61,841,946 $ 4,261,076 $ 126,705,159 $ 192,808,181
15 ELON UNIVERSITY
NOTES TO CONSOLIDATED FINANCIAL STATEMENTS For the Years Ended May 31, 2012 and 2011
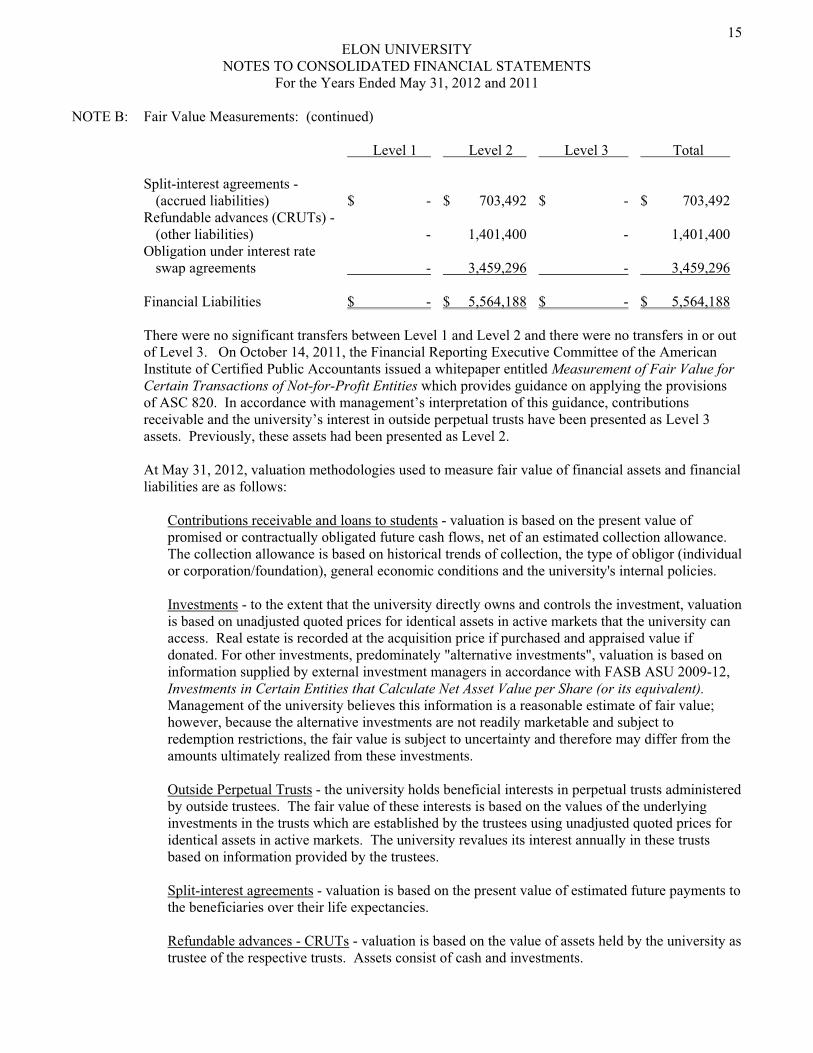
NOTE B: Fair Value Measurements: (continued) Level 1 Level 2 Level 3 Total Split-interest agreements - (accrued liabilities) $ - $ 703,492 $ - $ 703,492 Refundable advances (CRUTs) - (other liabilities) - 1,401,400 - 1,401,400 Obligation under interest rate swap agreements - 3,459,296 - 3,459,296 Financial Liabilities $ - $ 5,564,188 $ - $ 5,564,188
There were no significant transfers between Level 1 and Level 2 and there were no transfers in or out of Level 3. On October 14, 2011, the Financial Reporting Executive Committee of the American Institute of Certified Public Accountants issued a whitepaper entitled Measurement of Fair Value for Certain Transactions of Not-for-Profit Entities which provides guidance on applying the provisions of ASC 820. In accordance with management’s interpretation of this guidance, contributions receivable and the university’s interest in outside perpetual trusts have been presented as Level 3 assets. Previously, these assets had been presented as Level 2. At May 31, 2012, valuation methodologies used to measure fair value of financial assets and financial liabilities are as follows:
Contributions receivable and loans to students - valuation is based on the present value of promised or contractually obligated future cash flows, net of an estimated collection allowance. The collection allowance is based on historical trends of collection, the type of obligor (individual or corporation/foundation), general economic conditions and the university's internal policies.
Investments - to the extent that the university directly owns and controls the investment, valuation is based on unadjusted quoted prices for identical assets in active markets that the university can access. Real estate is recorded at the acquisition price if purchased and appraised value if donated. For other investments, predominately "alternative investments", valuation is based on information supplied by external investment managers in accordance with FASB ASU 2009-12, Investments in Certain Entities that Calculate Net Asset Value per Share (or its equivalent). Management of the university believes this information is a reasonable estimate of fair value; however, because the alternative investments are not readily marketable and subject to redemption restrictions, the fair value is subject to uncertainty and therefore may differ from the amounts ultimately realized from these investments. Outside Perpetual Trusts - the university holds beneficial interests in perpetual trusts administered by outside trustees. The fair value of these interests is based on the values of the underlying investments in the trusts which are established by the trustees using unadjusted quoted prices for identical assets in active markets. The university revalues its interest annually in these trusts based on information provided by the trustees. Split-interest agreements - valuation is based on the present value of estimated future payments to the beneficiaries over their life expectancies. Refundable advances - CRUTs - valuation is based on the value of assets held by the university as trustee of the respective trusts. Assets consist of cash and investments.
16 ELON UNIVERSITY
NOTES TO CONSOLIDATED FINANCIAL STATEMENTS For the Years Ended May 31, 2012 and 2011
NOTE B: Fair Value Measurements: (continued)
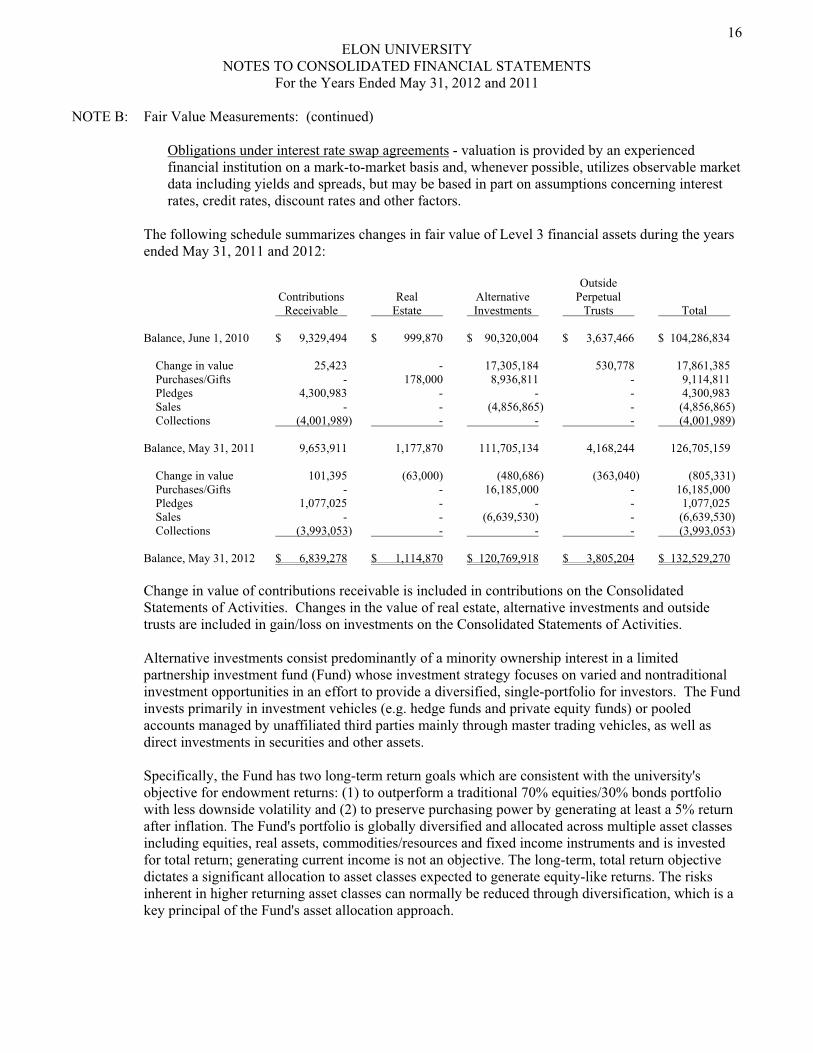
Obligations under interest rate swap agreements - valuation is provided by an experienced financial institution on a mark-to-market basis and, whenever possible, utilizes observable market data including yields and spreads, but may be based in part on assumptions concerning interest rates, credit rates, discount rates and other factors.
The following schedule summarizes changes in fair value of Level 3 financial assets during the years ended May 31, 2011 and 2012:
Outside Contributions Real Alternative Perpetual Receivable Estate Investments Trusts Total Balance, June 1, 2010 $ 9,329,494 $ 999,870 $ 90,320,004 $ 3,637,466 $ 104,286,834 Change in value 25,423 - 17,305,184 530,778 17,861,385 Purchases/Gifts - 178,000 8,936,811 - 9,114,811 Pledges 4,300,983 - - - 4,300,983 Sales - - (4,856,865) - (4,856,865) Collections (4,001,989) - - - (4,001,989) Balance, May 31, 2011 9,653,911 1,177,870 111,705,134 4,168,244 126,705,159 Change in value 101,395 (63,000) (480,686) (363,040) (805,331) Purchases/Gifts - - 16,185,000 - 16,185,000 Pledges 1,077,025 - - - 1,077,025 Sales - - (6,639,530) - (6,639,530) Collections (3,993,053) - - - (3,993,053) Balance, May 31, 2012 $ 6,839,278 $ 1,114,870 $ 120,769,918 $ 3,805,204 $ 132,529,270
Change in value of contributions receivable is included in contributions on the Consolidated Statements of Activities. Changes in the value of real estate, alternative investments and outside trusts are included in gain/loss on investments on the Consolidated Statements of Activities. Alternative investments consist predominantly of a minority ownership interest in a limited partnership investment fund (Fund) whose investment strategy focuses on varied and nontraditional investment opportunities in an effort to provide a diversified, single-portfolio for investors. The Fund invests primarily in investment vehicles (e.g. hedge funds and private equity funds) or pooled accounts managed by unaffiliated third parties mainly through master trading vehicles, as well as direct investments in securities and other assets. Specifically, the Fund has two long-term return goals which are consistent with the university's objective for endowment returns: (1) to outperform a traditional 70% equities/30% bonds portfolio with less downside volatility and (2) to preserve purchasing power by generating at least a 5% return after inflation. The Fund's portfolio is globally diversified and allocated across multiple asset classes including equities, real assets, commodities/resources and fixed income instruments and is invested for total return; generating current income is not an objective. The long-term, total return objective dictates a significant allocation to asset classes expected to generate equity-like returns. The risks inherent in higher returning asset classes can normally be reduced through diversification, which is a key principal of the Fund's asset allocation approach.
17 ELON UNIVERSITY
NOTES TO CONSOLIDATED FINANCIAL STATEMENTS For the Years Ended May 31, 2012 and 2011
NOTE B: Fair Value Measurements: (continued)
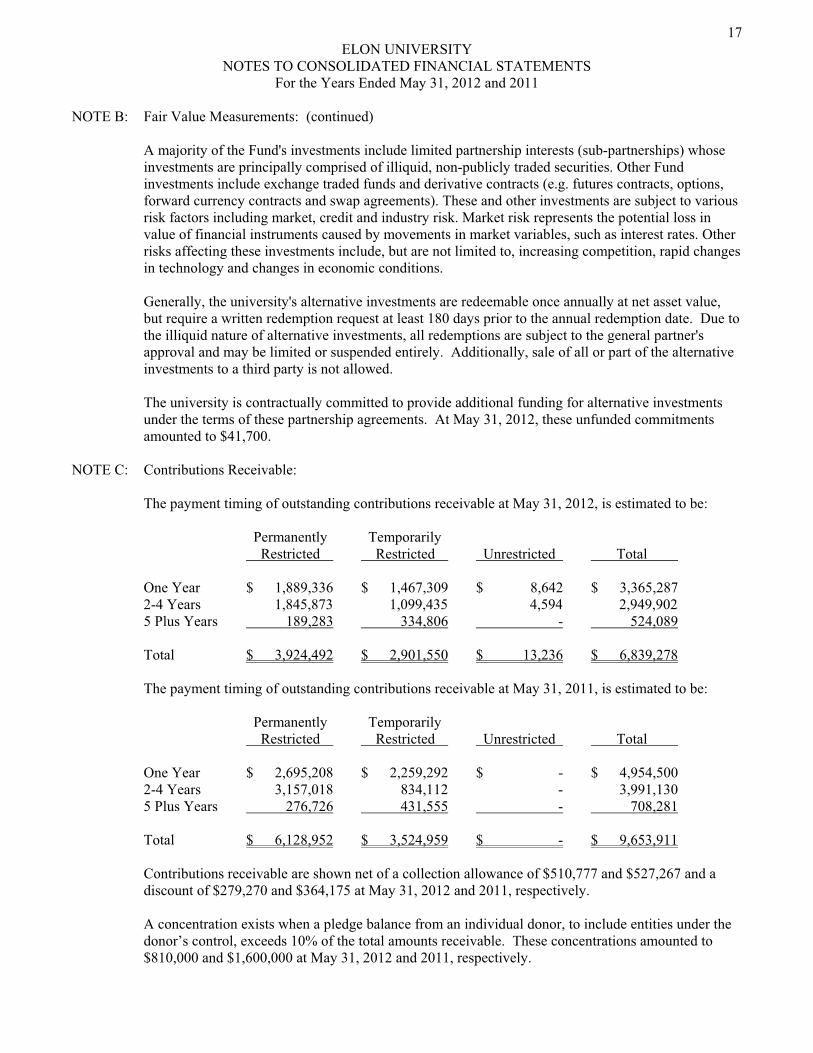
A majority of the Fund's investments include limited partnership interests (sub-partnerships) whose investments are principally comprised of illiquid, non-publicly traded securities. Other Fund investments include exchange traded funds and derivative contracts (e.g. futures contracts, options, forward currency contracts and swap agreements). These and other investments are subject to various risk factors including market, credit and industry risk. Market risk represents the potential loss in value of financial instruments caused by movements in market variables, such as interest rates. Other risks affecting these investments include, but are not limited to, increasing competition, rapid changes in technology and changes in economic conditions.
Generally, the university's alternative investments are redeemable once annually at net asset value, but require a written redemption request at least 180 days prior to the annual redemption date. Due to the illiquid nature of alternative investments, all redemptions are subject to the general partner's approval and may be limited or suspended entirely. Additionally, sale of all or part of the alternative investments to a third party is not allowed. The university is contractually committed to provide additional funding for alternative investments under the terms of these partnership agreements. At May 31, 2012, these unfunded commitments amounted to $41,700.
NOTE C: Contributions Receivable:
The payment timing of outstanding contributions receivable at May 31, 2012, is estimated to be: Permanently Temporarily Restricted Restricted Unrestricted Total One Year $ 1,889,336 $ 1,467,309 $ 8,642 $ 3,365,287 2-4 Years 1,845,873 1,099,435 4,594 2,949,902 5 Plus Years 189,283 334,806 - 524,089 Total $ 3,924,492 $ 2,901,550 $ 13,236 $ 6,839,278 The payment timing of outstanding contributions receivable at May 31, 2011, is estimated to be: Permanently Temporarily Restricted Restricted Unrestricted Total One Year $ 2,695,208 $ 2,259,292 $ - $ 4,954,500 2-4 Years 3,157,018 834,112 - 3,991,130 5 Plus Years 276,726 431,555 - 708,281 Total $ 6,128,952 $ 3,524,959 $ - $ 9,653,911
Contributions receivable are shown net of a collection allowance of $510,777 and $527,267 and a discount of $279,270 and $364,175 at May 31, 2012 and 2011, respectively.
A concentration exists when a pledge balance from an individual donor, to include entities under the donor’s control, exceeds 10% of the total amounts receivable. These concentrations amounted to $810,000 and $1,600,000 at May 31, 2012 and 2011, respectively.
18 ELON UNIVERSITY
NOTES TO CONSOLIDATED FINANCIAL STATEMENTS For the Years Ended May 31, 2012 and 2011
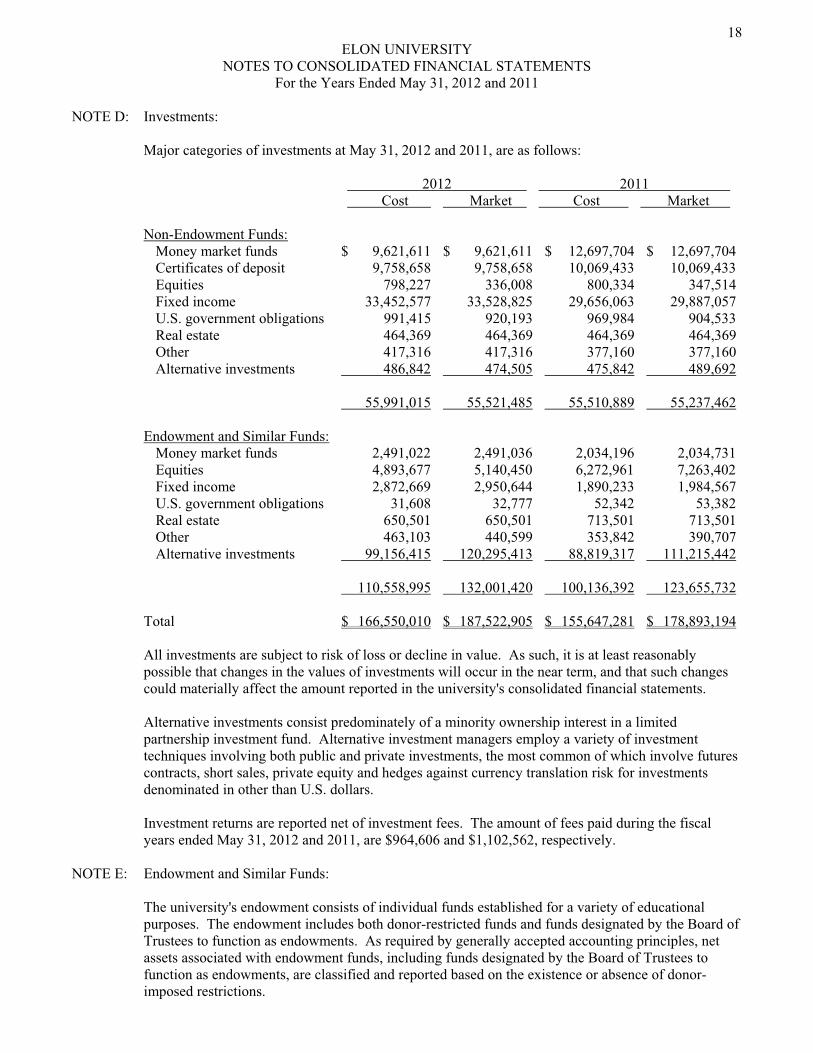
NOTE D: Investments:
Major categories of investments at May 31, 2012 and 2011, are as follows: 2012 2011 Cost Market Cost Market
Non-Endowment Funds: Money market funds $ 9,621,611 $ 9,621,611 $ 12,697,704 $ 12,697,704 Certificates of deposit 9,758,658 9,758,658 10,069,433 10,069,433 Equities 798,227 336,008 800,334 347,514 Fixed income 33,452,577 33,528,825 29,656,063 29,887,057 U.S. government obligations 991,415 920,193 969,984 904,533 Real estate 464,369 464,369 464,369 464,369 Other 417,316 417,316 377,160 377,160 Alternative investments 486,842 474,505 475,842 489,692 55,991,015 55,521,485 55,510,889 55,237,462 Endowment and Similar Funds: Money market funds 2,491,022 2,491,036 2,034,196 2,034,731 Equities 4,893,677 5,140,450 6,272,961 7,263,402 Fixed income 2,872,669 2,950,644 1,890,233 1,984,567 U.S. government obligations 31,608 32,777 52,342 53,382 Real estate 650,501 650,501 713,501 713,501 Other 463,103 440,599 353,842 390,707 Alternative investments 99,156,415 120,295,413 88,819,317 111,215,442 110,558,995 132,001,420 100,136,392 123,655,732 Total $ 166,550,010 $ 187,522,905 $ 155,647,281 $ 178,893,194
All investments are subject to risk of loss or decline in value. As such, it is at least reasonably possible that changes in the values of investments will occur in the near term, and that such changes could materially affect the amount reported in the university's consolidated financial statements.
Alternative investments consist predominately of a minority ownership interest in a limited partnership investment fund. Alternative investment managers employ a variety of investment techniques involving both public and private investments, the most common of which involve futures contracts, short sales, private equity and hedges against currency translation risk for investments denominated in other than U.S. dollars.
Investment returns are reported net of investment fees. The amount of fees paid during the fiscal years ended May 31, 2012 and 2011, are $964,606 and $1,102,562, respectively.
NOTE E: Endowment and Similar Funds:
The university's endowment consists of individual funds established for a variety of educational purposes. The endowment includes both donor-restricted funds and funds designated by the Board of Trustees to function as endowments. As required by generally accepted accounting principles, net assets associated with endowment funds, including funds designated by the Board of Trustees to function as endowments, are classified and reported based on the existence or absence of donor-imposed restrictions.
19 ELON UNIVERSITY
NOTES TO CONSOLIDATED FINANCIAL STATEMENTS For the Years Ended May 31, 2012 and 2011
NOTE E: Endowment and Similar Funds: (continued)
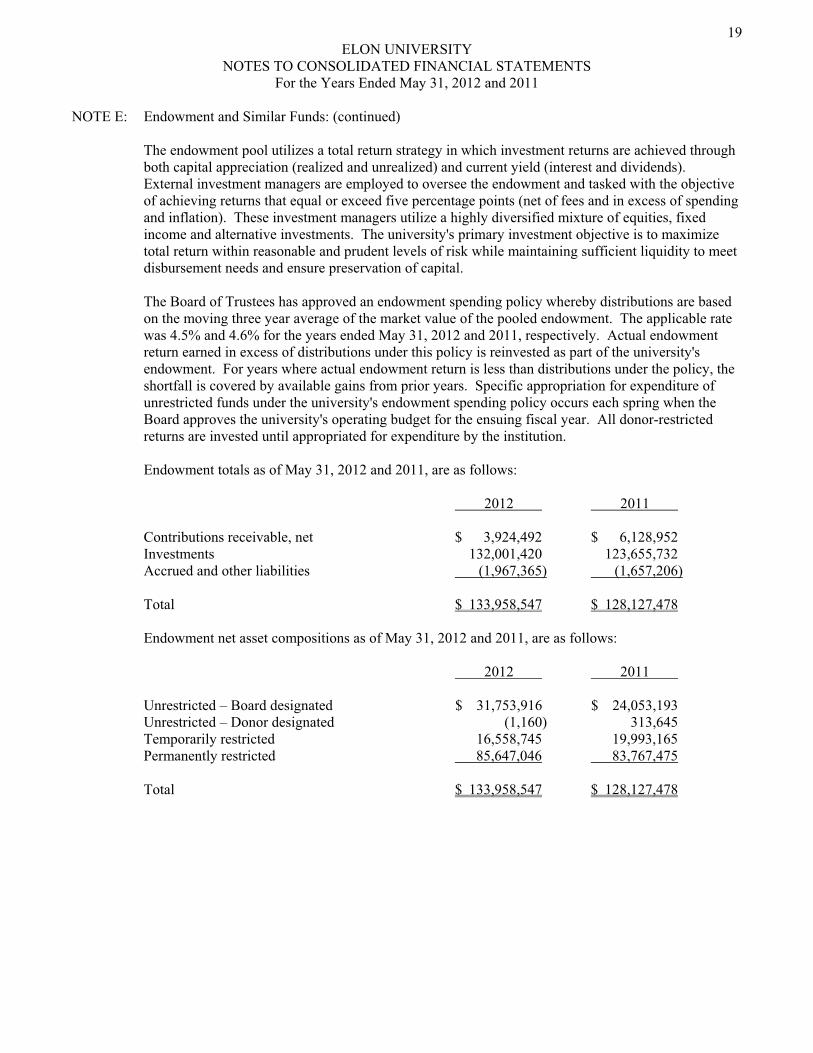
The endowment pool utilizes a total return strategy in which investment returns are achieved through both capital appreciation (realized and unrealized) and current yield (interest and dividends). External investment managers are employed to oversee the endowment and tasked with the objective of achieving returns that equal or exceed five percentage points (net of fees and in excess of spending and inflation). These investment managers utilize a highly diversified mixture of equities, fixed income and alternative investments. The university's primary investment objective is to maximize total return within reasonable and prudent levels of risk while maintaining sufficient liquidity to meet disbursement needs and ensure preservation of capital.
The Board of Trustees has approved an endowment spending policy whereby distributions are based on the moving three year average of the market value of the pooled endowment. The applicable rate was 4.5% and 4.6% for the years ended May 31, 2012 and 2011, respectively. Actual endowment return earned in excess of distributions under this policy is reinvested as part of the university's endowment. For years where actual endowment return is less than distributions under the policy, the shortfall is covered by available gains from prior years. Specific appropriation for expenditure of unrestricted funds under the university's endowment spending policy occurs each spring when the Board approves the university's operating budget for the ensuing fiscal year. All donor-restricted returns are invested until appropriated for expenditure by the institution. Endowment totals as of May 31, 2012 and 2011, are as follows: 2012 2011 Contributions receivable, net $ 3,924,492 $ 6,128,952 Investments 132,001,420 123,655,732 Accrued and other liabilities (1,967,365) (1,657,206) Total $ 133,958,547 $ 128,127,478
Endowment net asset compositions as of May 31, 2012 and 2011, are as follows:
2012 2011 Unrestricted – Board designated $ 31,753,916 $ 24,053,193 Unrestricted – Donor designated (1,160) 313,645 Temporarily restricted 16,558,745 19,993,165 Permanently restricted 85,647,046 83,767,475 Total $ 133,958,547 $ 128,127,478
20 ELON UNIVERSITY
NOTES TO CONSOLIDATED FINANCIAL STATEMENTS For the Years Ended May 31, 2012 and 2011
NOTE E: Endowment and Similar Funds: (continued)
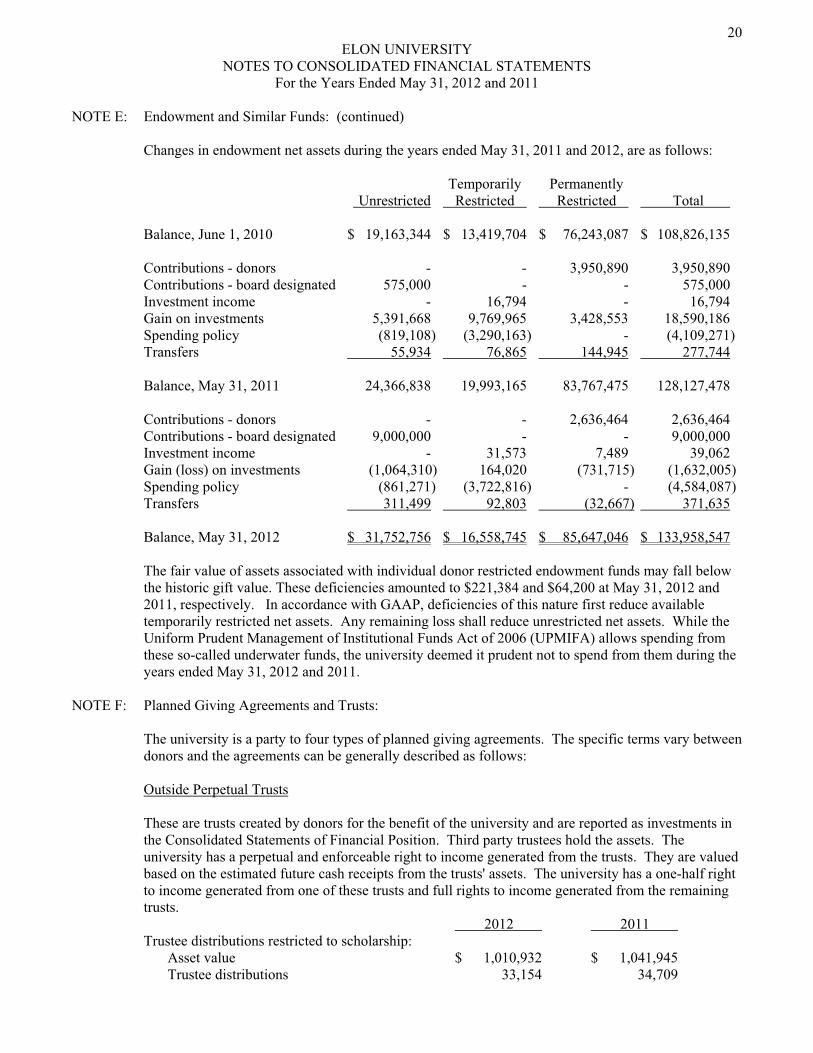
Changes in endowment net assets during the years ended May 31, 2011 and 2012, are as follows:
Temporarily Permanently Unrestricted Restricted Restricted Total Balance, June 1, 2010 $ 19,163,344 $ 13,419,704 $ 76,243,087 $ 108,826,135 Contributions - donors - - 3,950,890 3,950,890 Contributions - board designated 575,000 - - 575,000 Investment income - 16,794 - 16,794 Gain on investments 5,391,668 9,769,965 3,428,553 18,590,186 Spending policy (819,108) (3,290,163) - (4,109,271) Transfers 55,934 76,865 144,945 277,744 Balance, May 31, 2011 24,366,838 19,993,165 83,767,475 128,127,478 Contributions - donors - - 2,636,464 2,636,464 Contributions - board designated 9,000,000 - - 9,000,000 Investment income - 31,573 7,489 39,062 Gain (loss) on investments (1,064,310) 164,020 (731,715) (1,632,005) Spending policy (861,271) (3,722,816) - (4,584,087) Transfers 311,499 92,803 (32,667) 371,635 Balance, May 31, 2012 $ 31,752,756 $ 16,558,745 $ 85,647,046 $ 133,958,547
The fair value of assets associated with individual donor restricted endowment funds may fall below the historic gift value. These deficiencies amounted to $221,384 and $64,200 at May 31, 2012 and 2011, respectively. In accordance with GAAP, deficiencies of this nature first reduce available temporarily restricted net assets. Any remaining loss shall reduce unrestricted net assets. While the Uniform Prudent Management of Institutional Funds Act of 2006 (UPMIFA) allows spending from these so-called underwater funds, the university deemed it prudent not to spend from them during the years ended May 31, 2012 and 2011.
NOTE F: Planned Giving Agreements and Trusts:
The university is a party to four types of planned giving agreements. The specific terms vary between donors and the agreements can be generally described as follows:
Outside Perpetual Trusts These are trusts created by donors for the benefit of the university and are reported as investments in the Consolidated Statements of Financial Position. Third party trustees hold the assets. The university has a perpetual and enforceable right to income generated from the trusts. They are valued based on the estimated future cash receipts from the trusts' assets. The university has a one-half right to income generated from one of these trusts and full rights to income generated from the remaining trusts. 2012 2011 Trustee distributions restricted to scholarship: Asset value $ 1,010,932 $ 1,041,945 Trustee distributions 33,154 34,709
21 ELON UNIVERSITY
NOTES TO CONSOLIDATED FINANCIAL STATEMENTS For the Years Ended May 31, 2012 and 2011
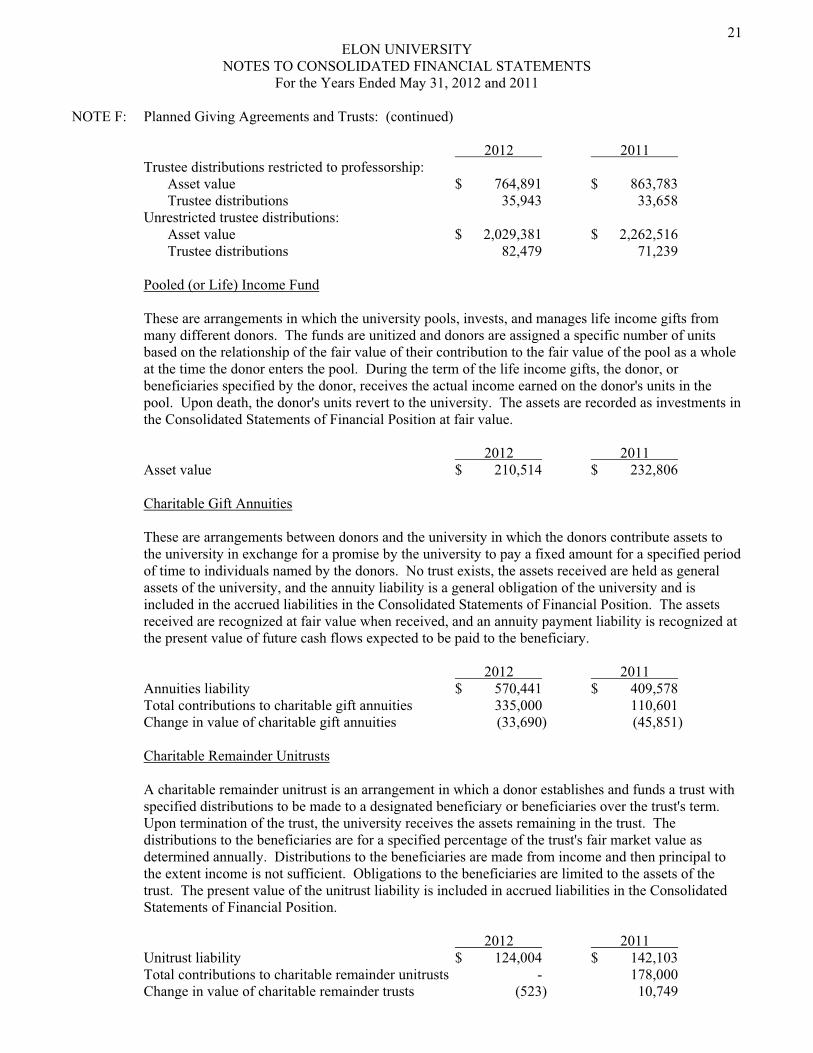
NOTE F: Planned Giving Agreements and Trusts: (continued) 2012 2011
Trustee distributions restricted to professorship: Asset value $ 764,891 $ 863,783 Trustee distributions 35,943 33,658 Unrestricted trustee distributions: Asset value $ 2,029,381 $ 2,262,516 Trustee distributions 82,479 71,239 Pooled (or Life) Income Fund These are arrangements in which the university pools, invests, and manages life income gifts from many different donors. The funds are unitized and donors are assigned a specific number of units based on the relationship of the fair value of their contribution to the fair value of the pool as a whole at the time the donor enters the pool. During the term of the life income gifts, the donor, or beneficiaries specified by the donor, receives the actual income earned on the donor's units in the pool. Upon death, the donor's units revert to the university. The assets are recorded as investments in the Consolidated Statements of Financial Position at fair value.
2012 2011
Asset value $ 210,514 $ 232,806 Charitable Gift Annuities These are arrangements between donors and the university in which the donors contribute assets to the university in exchange for a promise by the university to pay a fixed amount for a specified period of time to individuals named by the donors. No trust exists, the assets received are held as general assets of the university, and the annuity liability is a general obligation of the university and is included in the accrued liabilities in the Consolidated Statements of Financial Position. The assets received are recognized at fair value when received, and an annuity payment liability is recognized at the present value of future cash flows expected to be paid to the beneficiary. 2012 2011
Annuities liability $ 570,441 $ 409,578 Total contributions to charitable gift annuities 335,000 110,601 Change in value of charitable gift annuities (33,690) (45,851)
Charitable Remainder Unitrusts A charitable remainder unitrust is an arrangement in which a donor establishes and funds a trust with specified distributions to be made to a designated beneficiary or beneficiaries over the trust's term. Upon termination of the trust, the university receives the assets remaining in the trust. The distributions to the beneficiaries are for a specified percentage of the trust's fair market value as determined annually. Distributions to the beneficiaries are made from income and then principal to the extent income is not sufficient. Obligations to the beneficiaries are limited to the assets of the trust. The present value of the unitrust liability is included in accrued liabilities in the Consolidated Statements of Financial Position. 2012 2011 Unitrust liability $ 124,004 $ 142,103 Total contributions to charitable remainder unitrusts - 178,000 Change in value of charitable remainder trusts (523) 10,749
22 ELON UNIVERSITY
NOTES TO CONSOLIDATED FINANCIAL STATEMENTS For the Years Ended May 31, 2012 and 2011
NOTE G: Loans to Students:
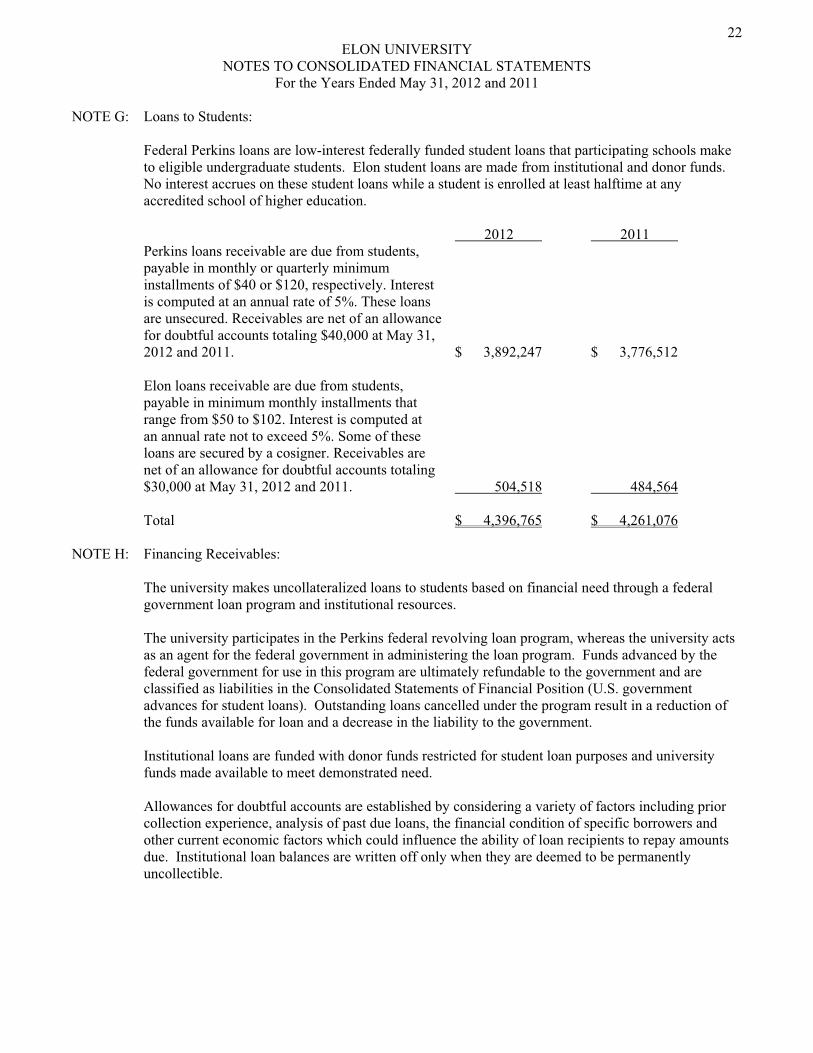
Federal Perkins loans are low-interest federally funded student loans that participating schools make to eligible undergraduate students. Elon student loans are made from institutional and donor funds. No interest accrues on these student loans while a student is enrolled at least halftime at any accredited school of higher education. 2012 2011 Perkins loans receivable are due from students, payable in monthly or quarterly minimum installments of $40 or $120, respectively. Interest is computed at an annual rate of 5%. These loans are unsecured. Receivables are net of an allowance for doubtful accounts totaling $40,000 at May 31, 2012 and 2011. $ 3,892,247 $ 3,776,512 Elon loans receivable are due from students, payable in minimum monthly installments that range from $50 to $102. Interest is computed at an annual rate not to exceed 5%. Some of these loans are secured by a cosigner. Receivables are net of an allowance for doubtful accounts totaling $30,000 at May 31, 2012 and 2011. 504,518 484,564 Total $ 4,396,765 $ 4,261,076
NOTE H: Financing Receivables:
The university makes uncollateralized loans to students based on financial need through a federal government loan program and institutional resources. The university participates in the Perkins federal revolving loan program, whereas the university acts as an agent for the federal government in administering the loan program. Funds advanced by the federal government for use in this program are ultimately refundable to the government and are classified as liabilities in the Consolidated Statements of Financial Position (U.S. government advances for student loans). Outstanding loans cancelled under the program result in a reduction of the funds available for loan and a decrease in the liability to the government. Institutional loans are funded with donor funds restricted for student loan purposes and university funds made available to meet demonstrated need. Allowances for doubtful accounts are established by considering a variety of factors including prior collection experience, analysis of past due loans, the financial condition of specific borrowers and other current economic factors which could influence the ability of loan recipients to repay amounts due. Institutional loan balances are written off only when they are deemed to be permanently uncollectible.
23 ELON UNIVERSITY
NOTES TO CONSOLIDATED FINANCIAL STATEMENTS For the Years Ended May 31, 2012 and 2011
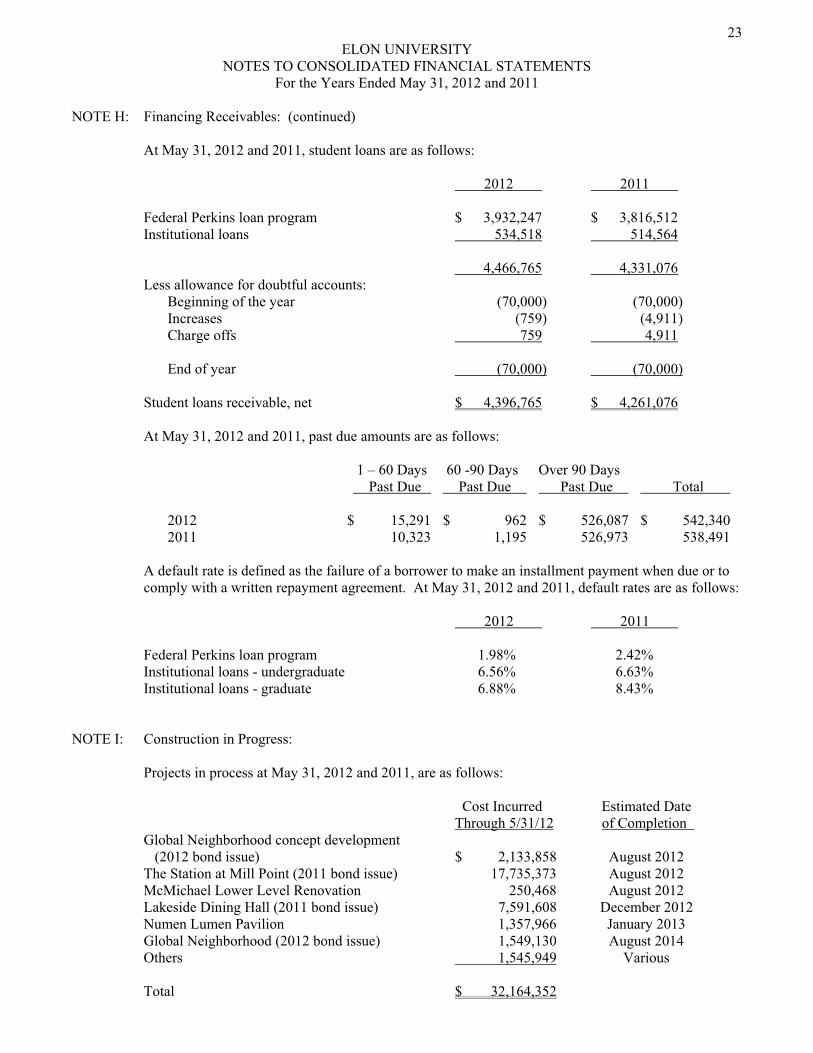
NOTE H: Financing Receivables: (continued) At May 31, 2012 and 2011, student loans are as follows: 2012 2011 Federal Perkins loan program $ 3,932,247 $ 3,816,512 Institutional loans 534,518 514,564 4,466,765 4,331,076 Less allowance for doubtful accounts: Beginning of the year (70,000) (70,000) Increases (759) (4,911) Charge offs 759 4,911 End of year (70,000) (70,000) Student loans receivable, net $ 4,396,765 $ 4,261,076 At May 31, 2012 and 2011, past due amounts are as follows:
1 – 60 Days 60 -90 Days Over 90 Days Past Due Past Due Past Due Total 2012 $ 15,291 $ 962 $ 526,087 $ 542,340 2011 10,323 1,195 526,973 538,491
A default rate is defined as the failure of a borrower to make an installment payment when due or to comply with a written repayment agreement. At May 31, 2012 and 2011, default rates are as follows: 2012 2011 Federal Perkins loan program 1.98% 2.42% Institutional loans - undergraduate 6.56% 6.63% Institutional loans - graduate 6.88% 8.43%
NOTE I: Construction in Progress:
Projects in process at May 31, 2012 and 2011, are as follows:
Cost Incurred Estimated Date Through 5/31/12 of Completion
Global Neighborhood concept development (2012 bond issue) $ 2,133,858 August 2012 The Station at Mill Point (2011 bond issue) 17,735,373 August 2012 McMichael Lower Level Renovation 250,468 August 2012 Lakeside Dining Hall (2011 bond issue) 7,591,608 December 2012 Numen Lumen Pavilion 1,357,966 January 2013 Global Neighborhood (2012 bond issue) 1,549,130 August 2014
Others 1,545,949 Various Total $ 32,164,352
24 ELON UNIVERSITY
NOTES TO CONSOLIDATED FINANCIAL STATEMENTS For the Years Ended May 31, 2012 and 2011
NOTE I: Construction in Progress: (continued)
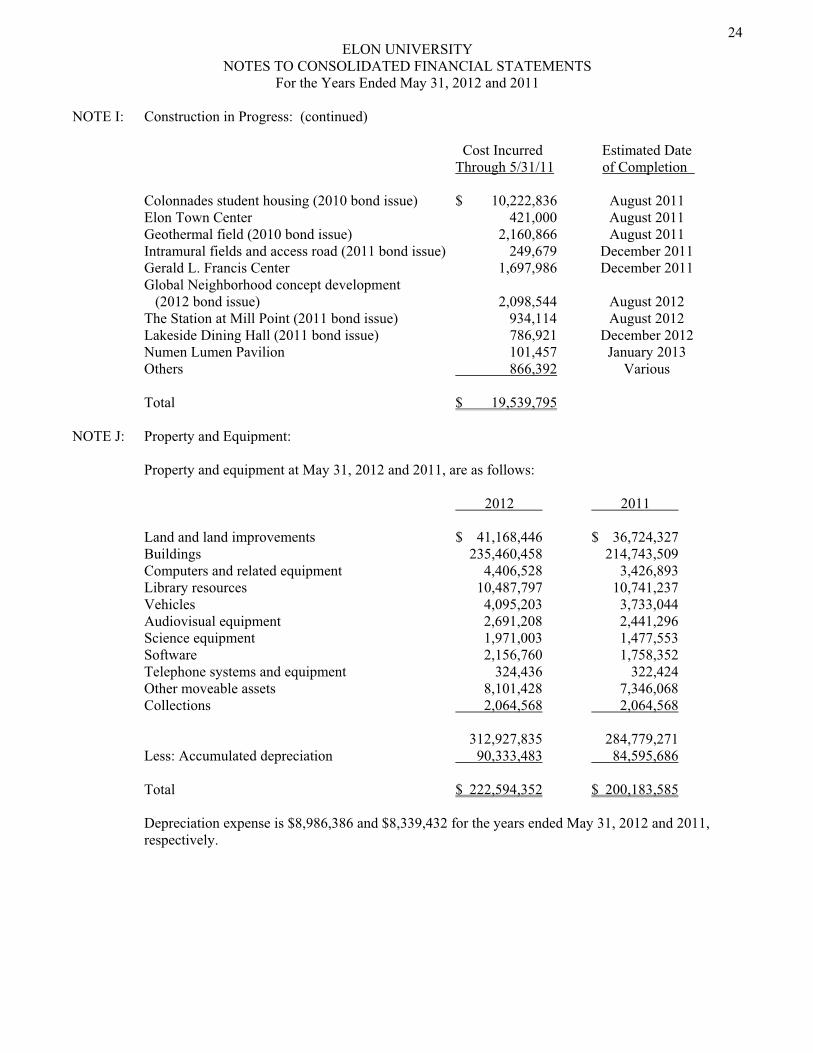
Cost Incurred Estimated Date Through 5/31/11 of Completion Colonnades student housing (2010 bond issue) $ 10,222,836 August 2011 Elon Town Center 421,000 August 2011 Geothermal field (2010 bond issue) 2,160,866 August 2011 Intramural fields and access road (2011 bond issue) 249,679 December 2011 Gerald L. Francis Center 1,697,986 December 2011 Global Neighborhood concept development (2012 bond issue) 2,098,544 August 2012 The Station at Mill Point (2011 bond issue) 934,114 August 2012 Lakeside Dining Hall (2011 bond issue) 786,921 December 2012 Numen Lumen Pavilion 101,457 January 2013
Others 866,392 Various Total $ 19,539,795
NOTE J: Property and Equipment:
Property and equipment at May 31, 2012 and 2011, are as follows: 2012 2011 Land and land improvements $ 41,168,446 $ 36,724,327 Buildings 235,460,458 214,743,509 Computers and related equipment 4,406,528 3,426,893 Library resources 10,487,797 10,741,237 Vehicles 4,095,203 3,733,044 Audiovisual equipment 2,691,208 2,441,296 Science equipment 1,971,003 1,477,553 Software 2,156,760 1,758,352 Telephone systems and equipment 324,436 322,424 Other moveable assets 8,101,428 7,346,068 Collections 2,064,568 2,064,568 312,927,835 284,779,271 Less: Accumulated depreciation 90,333,483 84,595,686 Total $ 222,594,352 $ 200,183,585 Depreciation expense is $8,986,386 and $8,339,432 for the years ended May 31, 2012 and 2011, respectively.
24 ELON UNIVERSITY
NOTES TO CONSOLIDATED FINANCIAL STATEMENTS For the Years Ended May 31, 2012 and 2011
NOTE I: Construction in Progress: (continued)
Cost Incurred Estimated Date Through 5/31/11 of Completion Colonnades student housing (2010 bond issue) $ 10,222,836 August 2011 Elon Town Center 421,000 August 2011 Geothermal field (2010 bond issue) 2,160,866 August 2011 Intramural fields and access road (2011 bond issue) 249,679 December 2011 Gerald L. Francis Center 1,697,986 December 2011 Global Neighborhood concept development (2012 bond issue) 2,098,544 August 2012 The Station at Mill Point (2011 bond issue) 934,114 August 2012 Lakeside Dining Hall (2011 bond issue) 786,921 December 2012 Numen Lumen Pavilion 101,457 January 2013
Others 866,392 Various Total $ 19,539,795
NOTE J: Property and Equipment:
Property and equipment at May 31, 2012 and 2011, are as follows: 2012 2011 Land and land improvements $ 41,168,446 $ 36,724,327 Buildings 235,460,458 214,743,509 Computers and related equipment 4,406,528 3,426,893 Library resources 10,487,797 10,741,237 Vehicles 4,095,203 3,733,044 Audiovisual equipment 2,691,208 2,441,296 Science equipment 1,971,003 1,477,553 Software 2,156,760 1,758,352 Telephone systems and equipment 324,436 322,424 Other moveable assets 8,101,428 7,346,068 Collections 2,064,568 2,064,568 312,927,835 284,779,271 Less: Accumulated depreciation 90,333,483 84,595,686 Total $ 222,594,352 $ 200,183,585 Depreciation expense is $8,986,386 and $8,339,432 for the years ended May 31, 2012 and 2011, respectively.
25 ELON UNIVERSITY
NOTES TO CONSOLIDATED FINANCIAL STATEMENTS For the Years Ended May 31, 2012 and 2011
NOTE K: Accrued Liabilities:
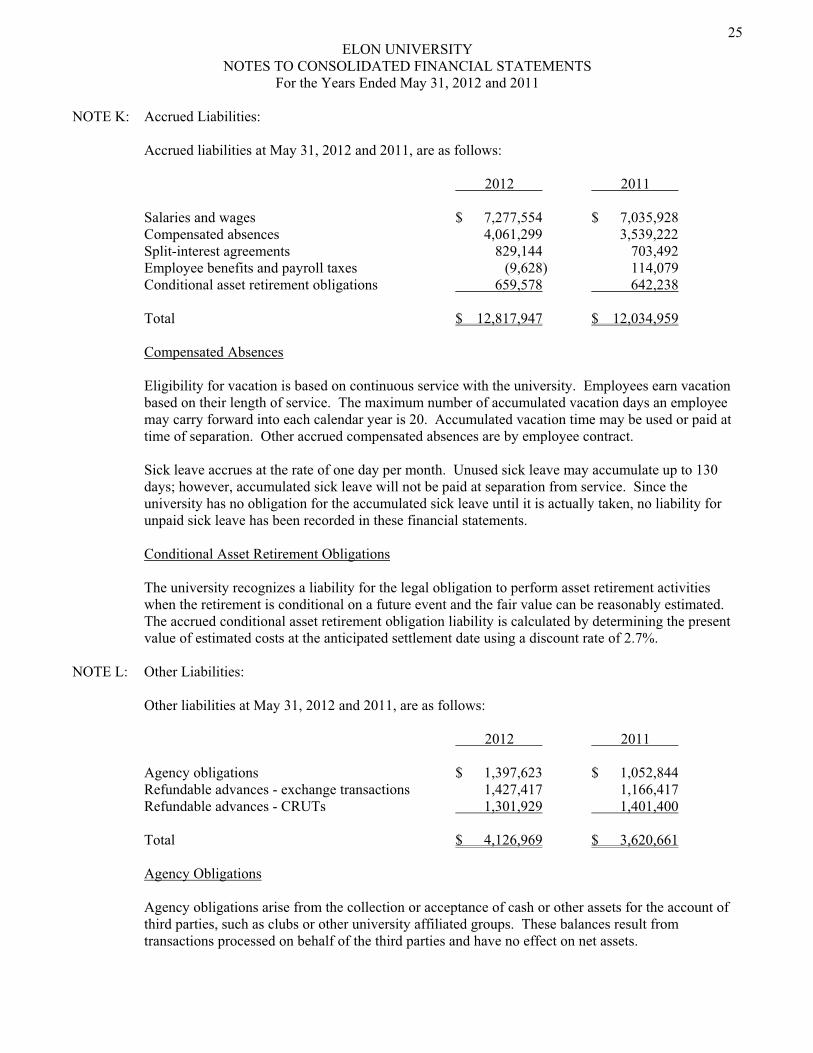
Accrued liabilities at May 31, 2012 and 2011, are as follows: 2012 2011 Salaries and wages $ 7,277,554 $ 7,035,928 Compensated absences 4,061,299 3,539,222 Split-interest agreements 829,144 703,492 Employee benefits and payroll taxes (9,628) 114,079 Conditional asset retirement obligations 659,578 642,238 Total $ 12,817,947 $ 12,034,959
Compensated Absences Eligibility for vacation is based on continuous service with the university. Employees earn vacation based on their length of service. The maximum number of accumulated vacation days an employee may carry forward into each calendar year is 20. Accumulated vacation time may be used or paid at time of separation. Other accrued compensated absences are by employee contract. Sick leave accrues at the rate of one day per month. Unused sick leave may accumulate up to 130 days; however, accumulated sick leave will not be paid at separation from service. Since the university has no obligation for the accumulated sick leave until it is actually taken, no liability for unpaid sick leave has been recorded in these financial statements. Conditional Asset Retirement Obligations The university recognizes a liability for the legal obligation to perform asset retirement activities when the retirement is conditional on a future event and the fair value can be reasonably estimated. The accrued conditional asset retirement obligation liability is calculated by determining the present value of estimated costs at the anticipated settlement date using a discount rate of 2.7%.
NOTE L: Other Liabilities:
Other liabilities at May 31, 2012 and 2011, are as follows: 2012 2011 Agency obligations $ 1,397,623 $ 1,052,844 Refundable advances - exchange transactions 1,427,417 1,166,417 Refundable advances - CRUTs 1,301,929 1,401,400 Total $ 4,126,969 $ 3,620,661
Agency Obligations
Agency obligations arise from the collection or acceptance of cash or other assets for the account of third parties, such as clubs or other university affiliated groups. These balances result from transactions processed on behalf of the third parties and have no effect on net assets.
26 ELON UNIVERSITY
NOTES TO CONSOLIDATED FINANCIAL STATEMENTS For the Years Ended May 31, 2012 and 2011
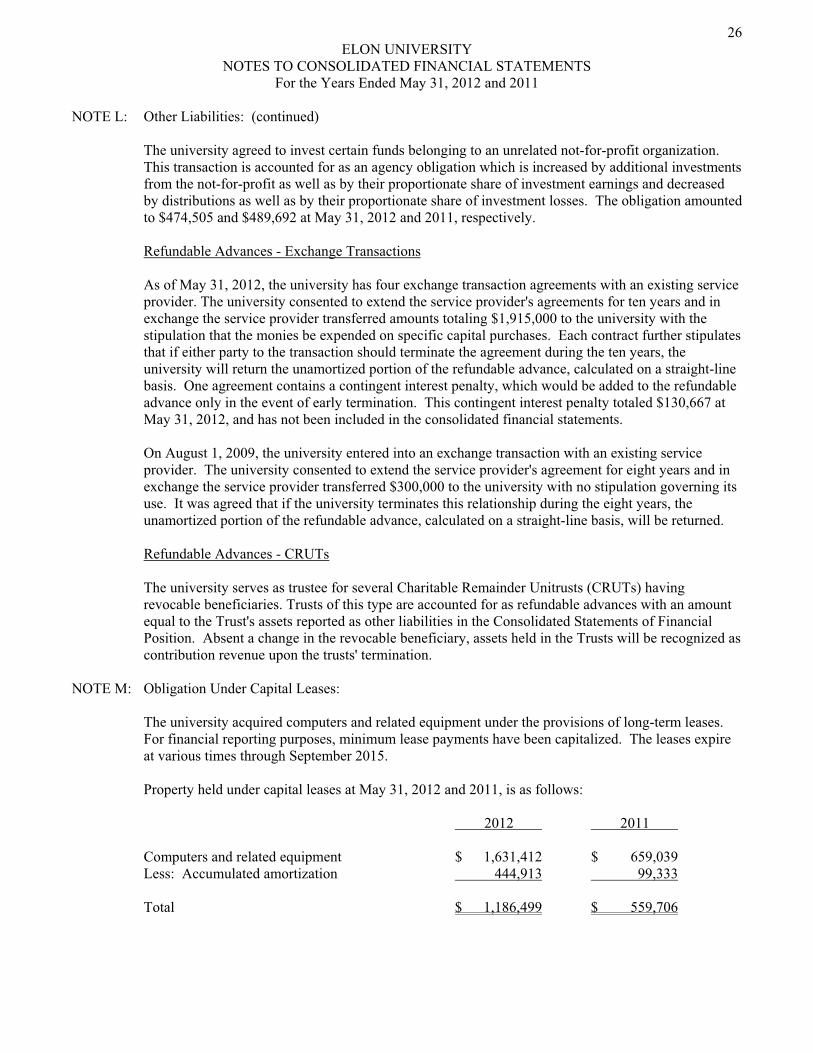
NOTE L: Other Liabilities: (continued) The university agreed to invest certain funds belonging to an unrelated not-for-profit organization. This transaction is accounted for as an agency obligation which is increased by additional investments from the not-for-profit as well as by their proportionate share of investment earnings and decreased by distributions as well as by their proportionate share of investment losses. The obligation amounted to $474,505 and $489,692 at May 31, 2012 and 2011, respectively.
Refundable Advances - Exchange Transactions
As of May 31, 2012, the university has four exchange transaction agreements with an existing service provider. The university consented to extend the service provider's agreements for ten years and in exchange the service provider transferred amounts totaling $1,915,000 to the university with the stipulation that the monies be expended on specific capital purchases. Each contract further stipulates that if either party to the transaction should terminate the agreement during the ten years, the university will return the unamortized portion of the refundable advance, calculated on a straight-line basis. One agreement contains a contingent interest penalty, which would be added to the refundable advance only in the event of early termination. This contingent interest penalty totaled $130,667 at May 31, 2012, and has not been included in the consolidated financial statements.
On August 1, 2009, the university entered into an exchange transaction with an existing service provider. The university consented to extend the service provider's agreement for eight years and in exchange the service provider transferred $300,000 to the university with no stipulation governing its use. It was agreed that if the university terminates this relationship during the eight years, the unamortized portion of the refundable advance, calculated on a straight-line basis, will be returned.
Refundable Advances - CRUTs
The university serves as trustee for several Charitable Remainder Unitrusts (CRUTs) having revocable beneficiaries. Trusts of this type are accounted for as refundable advances with an amount equal to the Trust's assets reported as other liabilities in the Consolidated Statements of Financial Position. Absent a change in the revocable beneficiary, assets held in the Trusts will be recognized as contribution revenue upon the trusts' termination.
NOTE M: Obligation Under Capital Leases:
The university acquired computers and related equipment under the provisions of long-term leases. For financial reporting purposes, minimum lease payments have been capitalized. The leases expire at various times through September 2015. Property held under capital leases at May 31, 2012 and 2011, is as follows: 2012 2011 Computers and related equipment $ 1,631,412 $ 659,039 Less: Accumulated amortization 444,913 99,333 Total $ 1,186,499 $ 559,706
27 ELON UNIVERSITY
NOTES TO CONSOLIDATED FINANCIAL STATEMENTS For the Years Ended May 31, 2012 and 2011
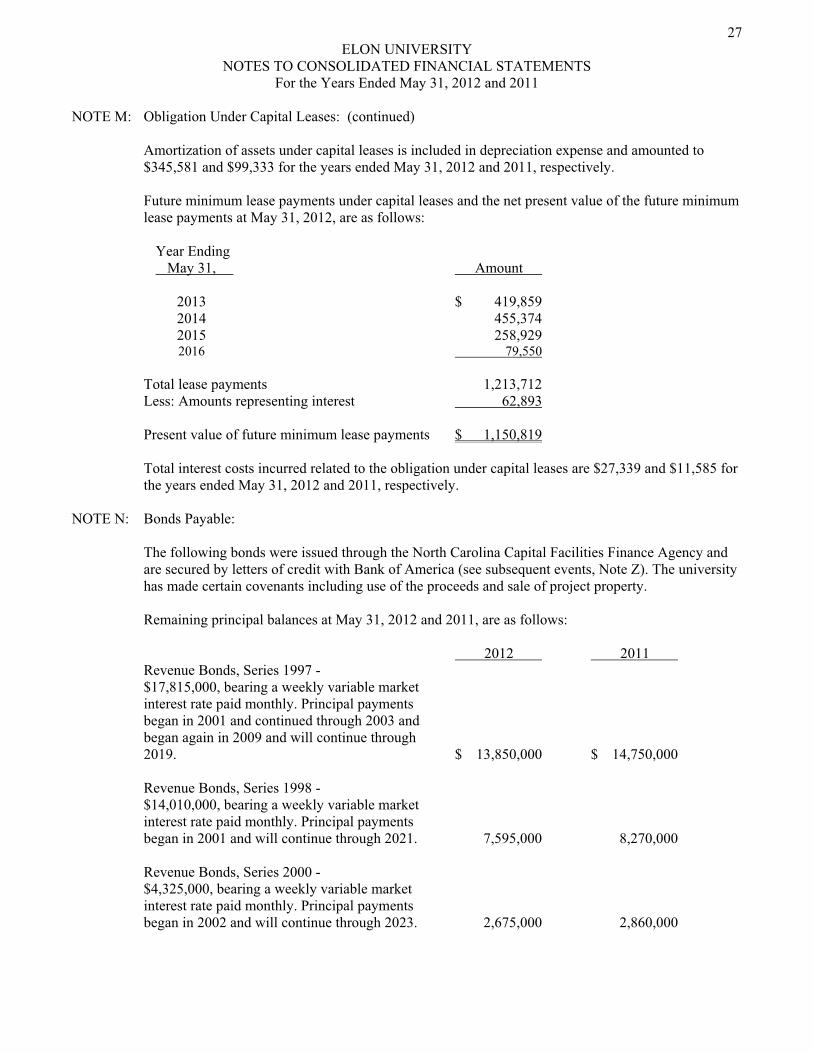
NOTE M: Obligation Under Capital Leases: (continued) Amortization of assets under capital leases is included in depreciation expense and amounted to $345,581 and $99,333 for the years ended May 31, 2012 and 2011, respectively.
Future minimum lease payments under capital leases and the net present value of the future minimum lease payments at May 31, 2012, are as follows: Year Ending May 31, Amount 2013 $ 419,859 2014 455,374 2015 258,929 2016 79,550 Total lease payments 1,213,712 Less: Amounts representing interest 62,893 Present value of future minimum lease payments $ 1,150,819
Total interest costs incurred related to the obligation under capital leases are $27,339 and $11,585 for the years ended May 31, 2012 and 2011, respectively.
NOTE N: Bonds Payable:
The following bonds were issued through the North Carolina Capital Facilities Finance Agency and are secured by letters of credit with Bank of America (see subsequent events, Note Z). The university has made certain covenants including use of the proceeds and sale of project property.
Remaining principal balances at May 31, 2012 and 2011, are as follows: 2012 2011 Revenue Bonds, Series 1997 - $17,815,000, bearing a weekly variable market interest rate paid monthly. Principal payments began in 2001 and continued through 2003 and began again in 2009 and will continue through 2019. $ 13,850,000 $ 14,750,000 Revenue Bonds, Series 1998 - $14,010,000, bearing a weekly variable market interest rate paid monthly. Principal payments began in 2001 and will continue through 2021. 7,595,000 8,270,000
Revenue Bonds, Series 2000 - $4,325,000, bearing a weekly variable market interest rate paid monthly. Principal payments began in 2002 and will continue through 2023. 2,675,000 2,860,000
28 ELON UNIVERSITY
NOTES TO CONSOLIDATED FINANCIAL STATEMENTS For the Years Ended May 31, 2012 and 2011
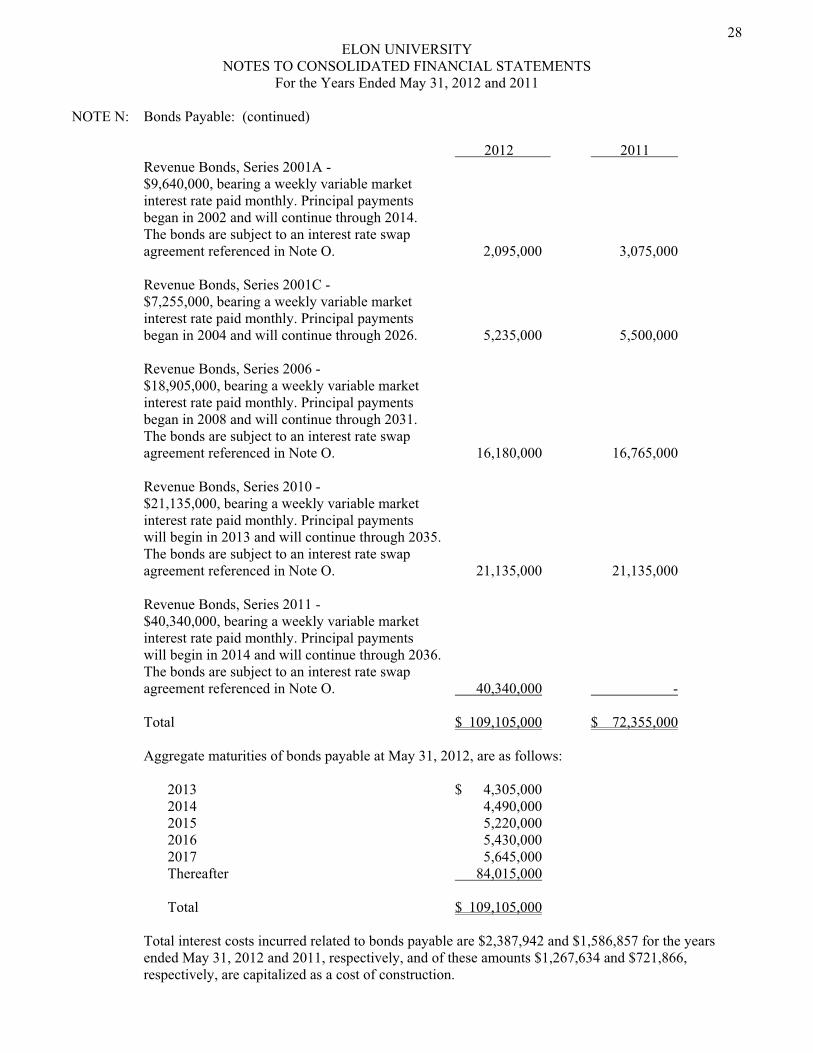
NOTE N: Bonds Payable: (continued) 2012 2011 Revenue Bonds, Series 2001A -
$9,640,000, bearing a weekly variable market interest rate paid monthly. Principal payments began in 2002 and will continue through 2014. The bonds are subject to an interest rate swap agreement referenced in Note O. 2,095,000 3,075,000
Revenue Bonds, Series 2001C - $7,255,000, bearing a weekly variable market interest rate paid monthly. Principal payments began in 2004 and will continue through 2026. 5,235,000 5,500,000 Revenue Bonds, Series 2006 - $18,905,000, bearing a weekly variable market interest rate paid monthly. Principal payments began in 2008 and will continue through 2031. The bonds are subject to an interest rate swap agreement referenced in Note O. 16,180,000 16,765,000
Revenue Bonds, Series 2010 - $21,135,000, bearing a weekly variable market interest rate paid monthly. Principal payments will begin in 2013 and will continue through 2035. The bonds are subject to an interest rate swap agreement referenced in Note O. 21,135,000 21,135,000 Revenue Bonds, Series 2011 - $40,340,000, bearing a weekly variable market interest rate paid monthly. Principal payments will begin in 2014 and will continue through 2036. The bonds are subject to an interest rate swap agreement referenced in Note O. 40,340,000 - Total $ 109,105,000 $ 72,355,000 Aggregate maturities of bonds payable at May 31, 2012, are as follows: 2013 $ 4,305,000 2014 4,490,000 2015 5,220,000 2016 5,430,000 2017 5,645,000 Thereafter 84,015,000 Total $ 109,105,000 Total interest costs incurred related to bonds payable are $2,387,942 and $1,586,857 for the years ended May 31, 2012 and 2011, respectively, and of these amounts $1,267,634 and $721,866, respectively, are capitalized as a cost of construction.
29 ELON UNIVERSITY
NOTES TO CONSOLIDATED FINANCIAL STATEMENTS For the Years Ended May 31, 2012 and 2011
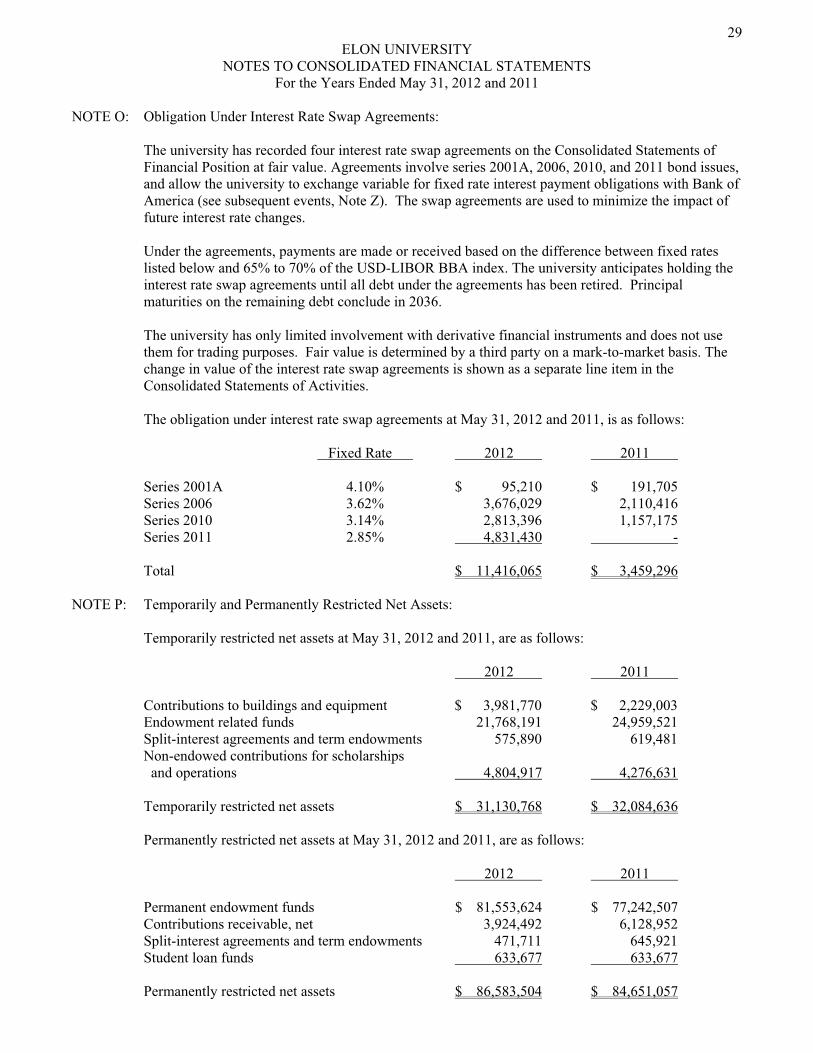
NOTE O: Obligation Under Interest Rate Swap Agreements:
The university has recorded four interest rate swap agreements on the Consolidated Statements of Financial Position at fair value. Agreements involve series 2001A, 2006, 2010, and 2011 bond issues, and allow the university to exchange variable for fixed rate interest payment obligations with Bank of America (see subsequent events, Note Z). The swap agreements are used to minimize the impact of future interest rate changes.
Under the agreements, payments are made or received based on the difference between fixed rates listed below and 65% to 70% of the USD-LIBOR BBA index. The university anticipates holding the interest rate swap agreements until all debt under the agreements has been retired. Principal maturities on the remaining debt conclude in 2036.
The university has only limited involvement with derivative financial instruments and does not use them for trading purposes. Fair value is determined by a third party on a mark-to-market basis. The change in value of the interest rate swap agreements is shown as a separate line item in the Consolidated Statements of Activities.
The obligation under interest rate swap agreements at May 31, 2012 and 2011, is as follows: Fixed Rate 2012 2011 Series 2001A 4.10% $ 95,210 $ 191,705 Series 2006 3.62% 3,676,029 2,110,416 Series 2010 3.14% 2,813,396 1,157,175 Series 2011 2.85% 4,831,430 - Total $ 11,416,065 $ 3,459,296
NOTE P: Temporarily and Permanently Restricted Net Assets:
Temporarily restricted net assets at May 31, 2012 and 2011, are as follows: 2012 2011 Contributions to buildings and equipment $ 3,981,770 $ 2,229,003 Endowment related funds 21,768,191 24,959,521 Split-interest agreements and term endowments 575,890 619,481 Non-endowed contributions for scholarships and operations 4,804,917 4,276,631 Temporarily restricted net assets $ 31,130,768 $ 32,084,636 Permanently restricted net assets at May 31, 2012 and 2011, are as follows: 2012 2011 Permanent endowment funds $ 81,553,624 $ 77,242,507 Contributions receivable, net 3,924,492 6,128,952 Split-interest agreements and term endowments 471,711 645,921 Student loan funds 633,677 633,677 Permanently restricted net assets $ 86,583,504 $ 84,651,057
30 ELON UNIVERSITY
NOTES TO CONSOLIDATED FINANCIAL STATEMENTS For the Years Ended May 31, 2012 and 2011
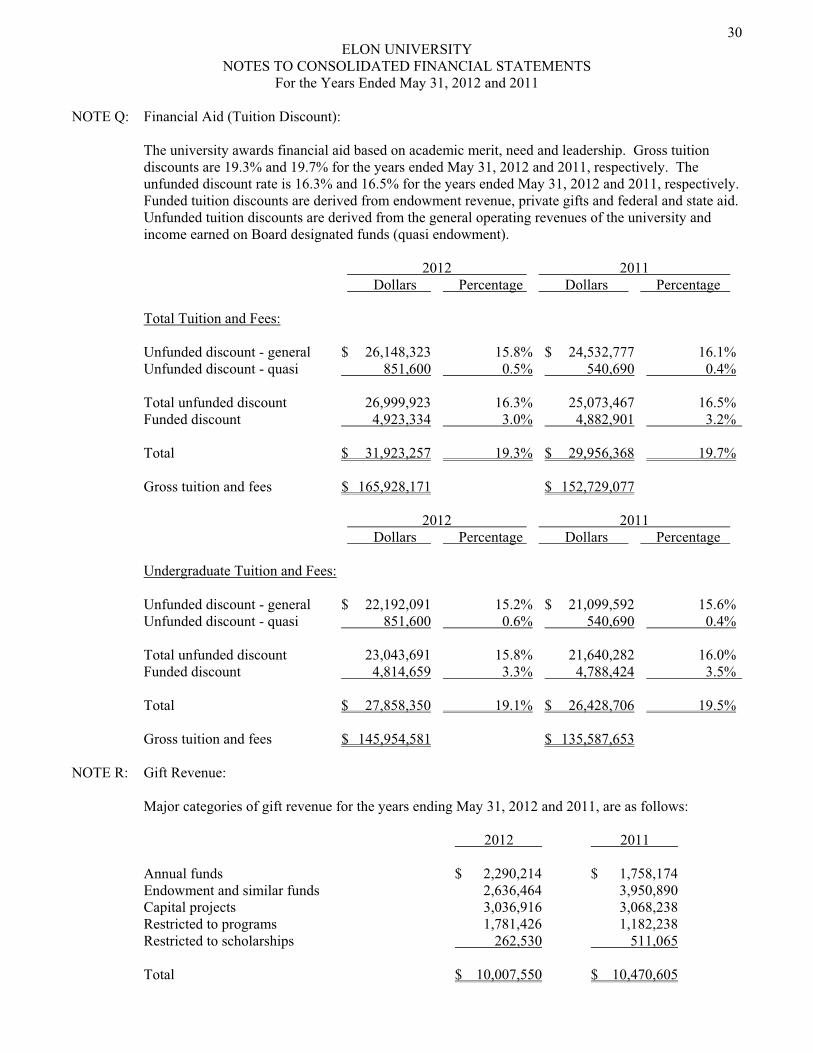
NOTE Q: Financial Aid (Tuition Discount):
The university awards financial aid based on academic merit, need and leadership. Gross tuition discounts are 19.3% and 19.7% for the years ended May 31, 2012 and 2011, respectively. The unfunded discount rate is 16.3% and 16.5% for the years ended May 31, 2012 and 2011, respectively. Funded tuition discounts are derived from endowment revenue, private gifts and federal and state aid. Unfunded tuition discounts are derived from the general operating revenues of the university and income earned on Board designated funds (quasi endowment).
2012 2011 Dollars Percentage Dollars Percentage
Total Tuition and Fees: Unfunded discount - general $ 26,148,323 15.8% $ 24,532,777 16.1% Unfunded discount - quasi 851,600 0.5% 540,690 0.4% Total unfunded discount 26,999,923 16.3% 25,073,467 16.5% Funded discount 4,923,334 3.0% 4,882,901 3.2% Total $ 31,923,257 19.3% $ 29,956,368 19.7% Gross tuition and fees $ 165,928,171 $ 152,729,077 2012 2011 Dollars Percentage Dollars Percentage Undergraduate Tuition and Fees: Unfunded discount - general $ 22,192,091 15.2% $ 21,099,592 15.6% Unfunded discount - quasi 851,600 0.6% 540,690 0.4% Total unfunded discount 23,043,691 15.8% 21,640,282 16.0% Funded discount 4,814,659 3.3% 4,788,424 3.5% Total $ 27,858,350 19.1% $ 26,428,706 19.5% Gross tuition and fees $ 145,954,581 $ 135,587,653 NOTE R: Gift Revenue:
Major categories of gift revenue for the years ending May 31, 2012 and 2011, are as follows: 2012 2011 Annual funds $ 2,290,214 $ 1,758,174 Endowment and similar funds 2,636,464 3,950,890 Capital projects 3,036,916 3,068,238 Restricted to programs 1,781,426 1,182,238 Restricted to scholarships 262,530 511,065 Total $ 10,007,550 $ 10,470,605
31 ELON UNIVERSITY
NOTES TO CONSOLIDATED FINANCIAL STATEMENTS For the Years Ended May 31, 2012 and 2011
NOTE S: Allocation of Expenses:
Expenses which are not directly charged to specific programs are allocated to those programs based on estimates. The totals of these allocations are $31,104,800 and $27,495,135 for the years ended May 31, 2012 and 2011, respectively. Allocations of specific program expenses are as follows: 2012
Physical Debt Program Plant Depreciation Service/Other Total Instruction $ 4,449,555 $ 3,494,997 $ 2,610,874 $ 10,555,426 Student services 1,984,905 1,234,357 764,301 3,983,563 Auxiliary enterprises 5,822,338 3,620,750 3,756,738 13,199,826 Academic support 663,019 412,313 419,064 1,494,396 Institutional support 312,241 223,969 1,335,379 1,871,589 Total $ 13,232,058 $ 8,986,386 $ 8,886,356 $ 31,104,800
2011 Physical Debt Program Plant Depreciation Service/Other Total Instruction $ 4,323,370 $ 3,200,796 $ 2,156,332 $ 9,680,498 Student services 1,928,615 1,230,073 645,153 3,803,841 Auxiliary enterprises 5,134,028 3,274,489 2,612,707 11,021,224 Academic support 644,217 410,882 313,754 1,368,853 Institutional support 303,386 223,192 1,094,141 1,620,719 Total $ 12,333,616 $ 8,339,432 $ 6,822,087 $ 27,495,135 NOTE T: Retirement Plan:
The university has a defined contribution pension plan covering substantially all employees. The plan has no post service benefits or further liabilities beyond the periodic contribution for each participating employee. Total contributions by the university to this plan are $5,025,480 and $4,758,365 for the years ended May 31, 2012 and 2011, respectively.
NOTE U: Fund Raising:
Fundraising costs are $4,322,608 and $4,105,299 for the years ended May 31, 2012 and 2011, respectively. These costs are included with other costs and are shown as institutional support on the Consolidated Statement of Activities.
NOTE V: Student Housing:
CHF – Elon, LLC, a 501(c)(3) corporation, is a wholly-owned subsidiary of Collegiate Housing Foundation, another 501(c)(3) organization, and exists to provide student housing for Elon University students. CHF – Elon, LLC and Collegiate Housing Foundation are independent of Elon University.

32 ELON UNIVERSITY
NOTES TO CONSOLIDATED FINANCIAL STATEMENTS For the Years Ended May 31, 2012 and 2011
NOTE V: Student Housing: (continued) In 2006, CHF – Elon, LLC, using the proceeds of a taxable bond issue with no recourse to Elon University, constructed a 516-bed student housing facility on 13.852 acres of land leased from the university. The lease, which expires in 2035, provides for annual distributions of net available cash flow as the lease payment to Elon University. Additionally, the university has contractually agreed to manage this housing project over the life of the ground lease. CHF – Elon, LLC has a June 30 fiscal year end. As such, calculation of any ground lease payment due the university (net available cash flow) will be determined after the close of CHF – Elon, LLC's fiscal year and is not earned by the university until that time. The university earned ground lease income of $544,806 and $625,901 during the years ended May 31, 2012 and 2011, respectively. While fulfilling its management functions, the university will collect rental income and incur reimbursable expenses on behalf of CHF – Elon, LLC. Unsettled balances related to these transactions amounted to a net receivable of $56,217 and $106,464 at May 31, 2012 and 2011, respectively. These balances are classified as accounts receivable in the Consolidated Statements of Financial Position.
NOTE W: Income Taxes:
The university is exempt from federal income taxes under Section 501(c)(3) of the Internal Revenue Code, except on net income derived from activities unrelated to its business purpose. The university believes that it has sufficient justification for any tax positions taken, including allocation of expenses to its unrelated business income and as such, does not have any uncertain tax positions that are material to the financial statements.
Generally, federal income tax returns are subject to examination by the Internal Revenue Service for three years after they are filed. As of the report date (September 21, 2012), the university's federal Exempt Organization Business Income Tax Returns (Form 990-T) for 2010, 2009 and 2008 remain subject to said examination.
NOTE X: Supplemental Disclosures of Cash Flow Information:
During the years ended May 31, 2012 and 2011, cash payments for interest on bonds and capital leases amounted to $1,147,647 and $876,576, respectively. These numbers are net of amounts capitalized as cost of construction. The university received noncash contributions totaling $562,485 and $291,583 during the years ended May 31, 2012 and 2011, respectively. Computers and related equipment costing $972,373 and $659,039 were acquired under the terms of capital leases during the years ended May 31, 2012 and 2011, respectively. The cost of property acquired as well as the initial lease obligations have been excluded from the consolidated statements of cash flows.
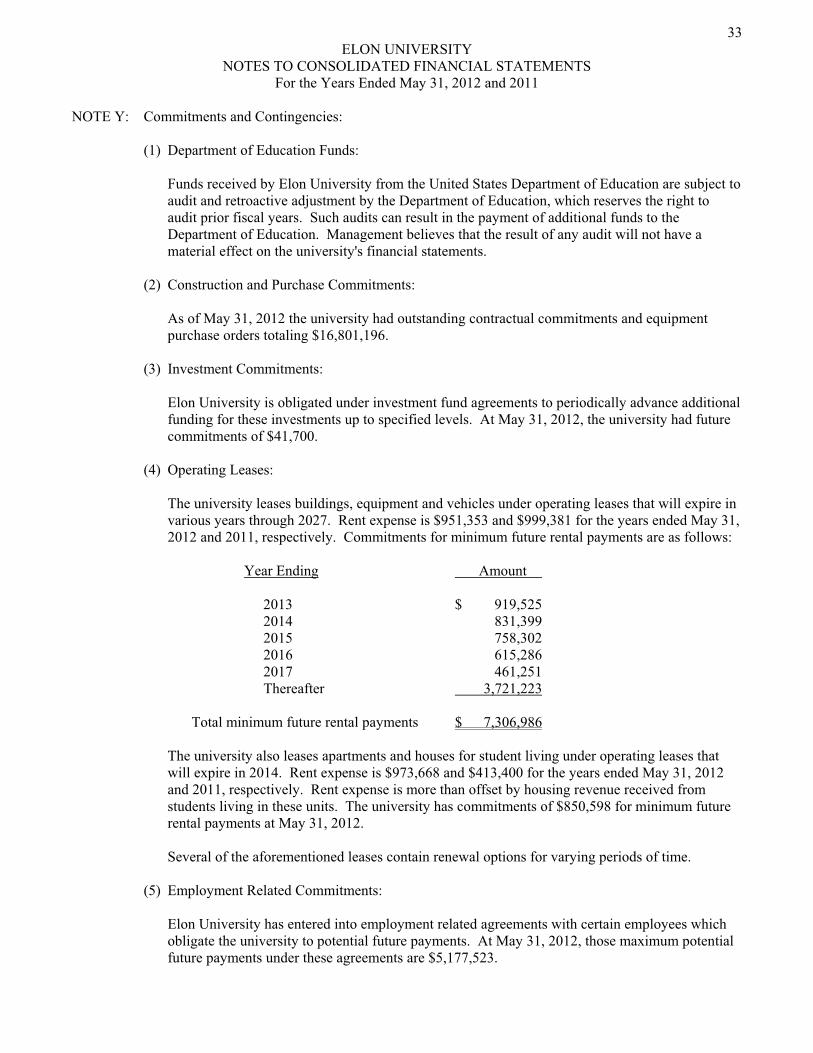
33 ELON UNIVERSITY
NOTES TO CONSOLIDATED FINANCIAL STATEMENTS For the Years Ended May 31, 2012 and 2011
NOTE Y: Commitments and Contingencies:
(1) Department of Education Funds:
Funds received by Elon University from the United States Department of Education are subject to audit and retroactive adjustment by the Department of Education, which reserves the right to audit prior fiscal years. Such audits can result in the payment of additional funds to the Department of Education. Management believes that the result of any audit will not have a material effect on the university's financial statements.
(2) Construction and Purchase Commitments:
As of May 31, 2012 the university had outstanding contractual commitments and equipment purchase orders totaling $16,801,196.
(3) Investment Commitments:
Elon University is obligated under investment fund agreements to periodically advance additional funding for these investments up to specified levels. At May 31, 2012, the university had future commitments of $41,700.
(4) Operating Leases:
The university leases buildings, equipment and vehicles under operating leases that will expire in various years through 2027. Rent expense is $951,353 and $999,381 for the years ended May 31, 2012 and 2011, respectively. Commitments for minimum future rental payments are as follows:
Year Ending Amount 2013 $ 919,525 2014 831,399 2015 758,302 2016 615,286 2017 461,251 Thereafter 3,721,223 Total minimum future rental payments $ 7,306,986
The university also leases apartments and houses for student living under operating leases that will expire in 2014. Rent expense is $973,668 and $413,400 for the years ended May 31, 2012 and 2011, respectively. Rent expense is more than offset by housing revenue received from students living in these units. The university has commitments of $850,598 for minimum future rental payments at May 31, 2012.
Several of the aforementioned leases contain renewal options for varying periods of time.
(5) Employment Related Commitments:
Elon University has entered into employment related agreements with certain employees which obligate the university to potential future payments. At May 31, 2012, those maximum potential future payments under these agreements are $5,177,523.
34 ELON UNIVERSITY
NOTES TO CONSOLIDATED FINANCIAL STATEMENTS For the Years Ended May 31, 2012 and 2011
See independent auditor's report.
NOTE Y: Commitments and Contingencies: (continued)
(6) Contingencies:
The university is involved in various legal actions occurring in the normal course of activities. While the final outcomes cannot be determined at this time, management is of the opinion that the resolution of these legal actions will not have a material effect on the university's consolidated financial position.
NOTE Z: Subsequent Events: The university has reviewed the events and transactions through September 21, 2012, the date the financial statements were issued. Obligation under interest rate swap agreements: As indicated in Note O, the university is party to four interest rate swap agreements with Bank of America as of May 31, 2012. Effective July 1, 2012, management renegotiated these agreements, under substantially similar terms, with Wells Fargo Bank. Bond issuance: On July 18, 2012, the university issued bonds totaling $54,595,000. The proceeds of this bond issue will be used for a student housing project currently referred to as the Global Neighborhood. Realized loss on disposition of property: A student housing project to be constructed with the above referenced bond issue, required the razing of antiquated facilities. Specifically, two dorms and a dining hall comprising the Harper Center are to be replaced with these new facilities. Whenever a building is destroyed before being fully depreciated, the remaining book value of that building becomes an expense in the period it is removed. The university realized a loss of $1,786,343 on the demolition of the Harper Center in July 2012. Letters of credit – bonds payable: As indicated in Note N, the bonds payable are secured by letters of credit. Effective August 1, 2012, management replaced the former provider of these letters, Bank of America, with two new lenders; TD Bank and U.S. Bank. Terms of the new letters are substantially similar to those that were replaced. Law school facility: Since inception, the university has leased a majority of its law school facility from an unrelated non-profit organization operating in Greensboro, North Carolina. On August 3, 2012, ownership of the property was gifted to the university. Real estate acquisitions: Through September 21, 2012, the university expended $4,353,000 for the purchase of real estate.
35
INDEPENDENT AUDITOR'S REPORT ON ADDITIONAL INFORMATION To the Board of Trustees Elon University Elon, North Carolina Our report on our audits of the basic consolidated financial statements of Elon University as of May 31, 2012 and 2011 appears on page 4. Our audits were conducted for the purpose of forming an opinion on the basic financial statements taken as a whole. The accompanying graphs of tuition and fees, room and board 2003 - 2012, student enrollment 2002 - 2011, student selectivity 2003 - 2012, endowment market value 2003 - 2012 and net assets and liabilities 2003 - 2012 are presented for purpose of additional analysis and are not a required part of the basic financial statements. Such information has not been subjected to the auditing procedures applied in the audit of the basic consolidated financial statements and, accordingly, we express no opinion on it.
September 21, 2012
STOUTSTUART M GOWEN & KING LLP
c=
Certified Public
Accountants
Advisors to
Member of PCPS, the AICPA Alliance For CPA Firms
e-mail: [email protected]
fax 336-229-4204336-226-7343
Burlington, NC 272151233 South Church Street
Street Address:
Burlington, NC 27216-1440
P.O. Box 1440 Mailing Address:
Management
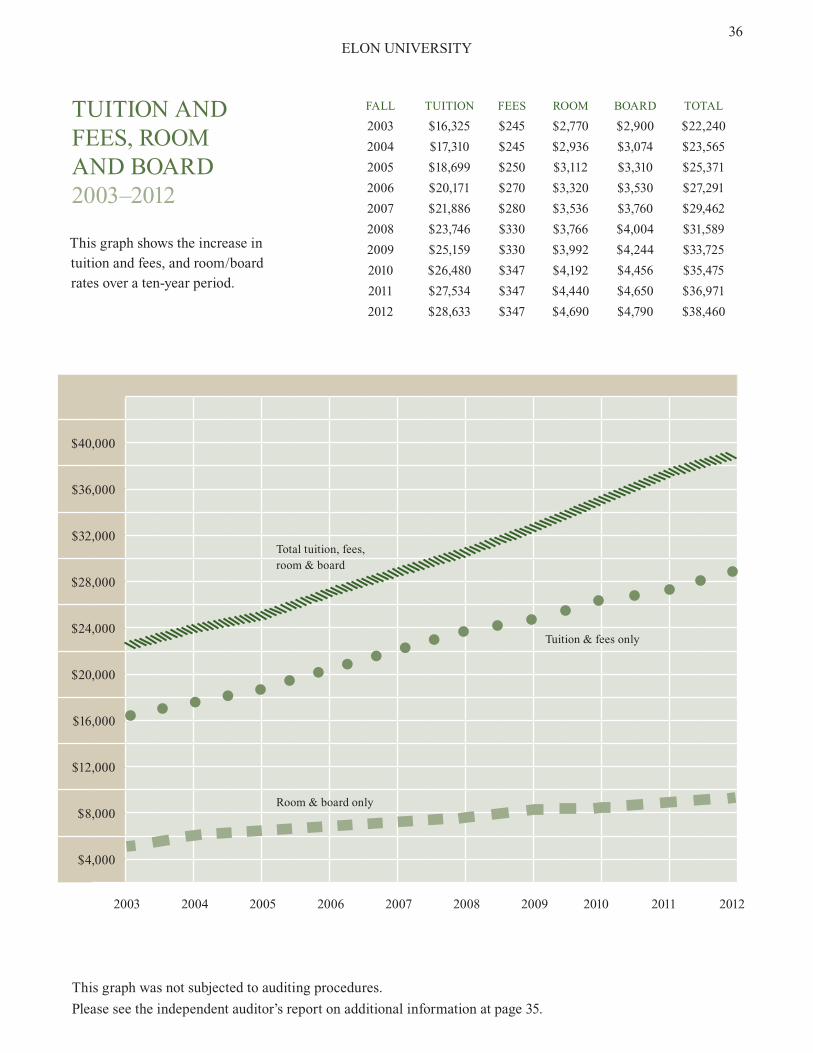
36ELON UNIVERSITY
TUITION aNd fEES, ROOm aNd BOaRd2003–2012
$40,000
$36,000
$32,000
$28,000
$24,000
$20,000
$16,000
$12,000
$8,000
$4,000
2003 2004 2005 2006 2007 2008 2009 2010 2011 2012
Tuition & fees only
Room & board only
Total tuition, fees, room & board
This graph shows the increase in tuition and fees, and room/board rates over a ten-year period.
faLL TUITION fEES ROOm BOaRd TOTaL
2003 $16,325 $245 $2,770 $2,900 $22,240
2004 $17,310 $245 $2,936 $3,074 $23,565
2005 $18,699 $250 $3,112 $3,310 $25,371
2006 $20,171 $270 $3,320 $3,530 $27,291
2007 $21,886 $280 $3,536 $3,760 $29,462
2008 $23,746 $330 $3,766 $4,004 $31,589
2009 $25,159 $330 $3,992 $4,244 $33,725
2010 $26,480 $347 $4,192 $4,456 $35,475
2011 $27,534 $347 $4,440 $4,650 $36,971
2012 $28,633 $347 $4,690 $4,790 $38,460
This graph was not subjected to auditing procedures.
Please see the independent auditor’s report on additional information at page 35.
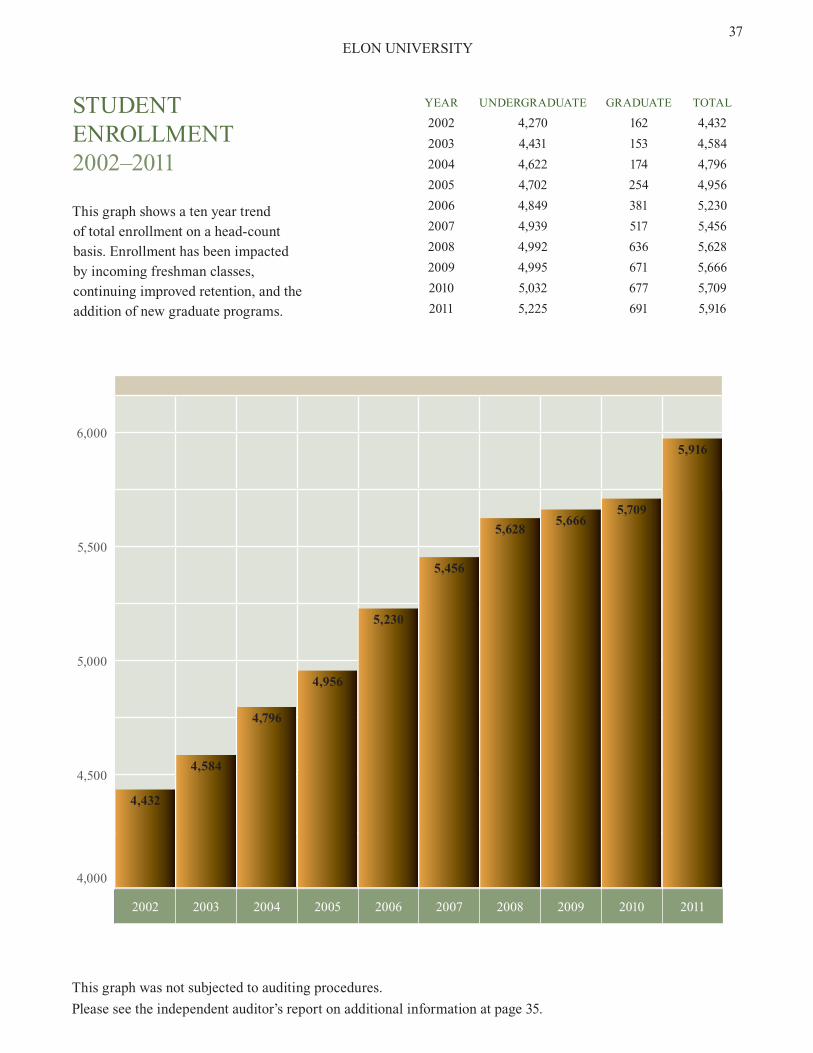
37ELON UNIVERSITY
STUdENT ENROLLmENT 2002–2011
6,000
5,500
5,000
4,500
4,000
2002 2003 2004 2005 2006 2007 2008 2009 2010 2011
This graph shows a ten year trend of total enrollment on a head-count basis. Enrollment has been impacted by incoming freshman classes, continuing improved retention, and the addition of new graduate programs.
4,432
4,584
4,796
4,956
5,230
5,456
5,6285,666
5,709
5,916
YEaR UNdERGRadUaTE GRadUaTE TOTaL
2002 4,270 162 4,432
2003 4,431 153 4,584
2004 4,622 174 4,796
2005 4,702 254 4,956
2006 4,849 381 5,230
2007 4,939 517 5,456
2008 4,992 636 5,628
2009 4,995 671 5,666
2010 5,032 677 5,709
2011 5,225 691 5,916
This graph was not subjected to auditing procedures.
Please see the independent auditor’s report on additional information at page 35.
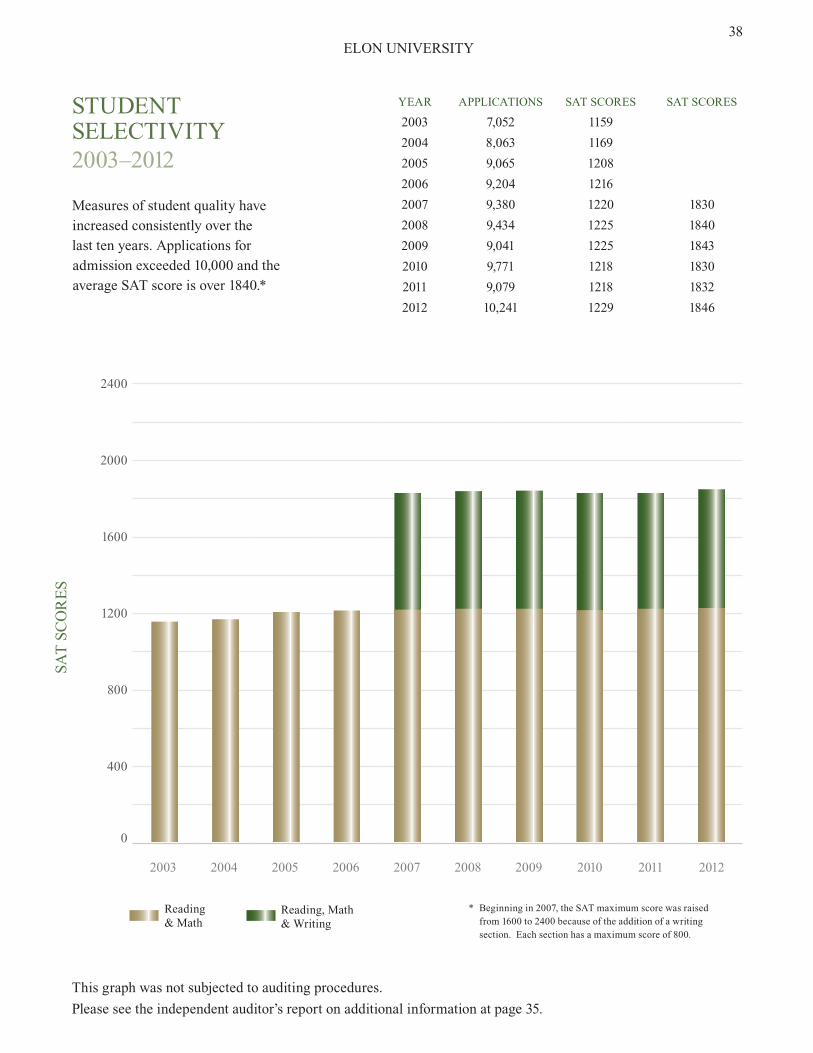
2400
2000
1600
1200
800
400
0
2003 2004 2005 2006 2007 2008 2009 2010 2011 2012
38ELON UNIVERSITY
STUdENT SELECTIVITY2003–2012
Reading & math
Reading, math & Writing
measures of student quality have increased consistently over the last ten years. applications for admission exceeded 10,000 and the average SaT score is over 1840.*
* Beginning in 2007, the SaT maximum score was raised from 1600 to 2400 because of the addition of a writing section. Each section has a maximum score of 800.
SaT
SC
OR
ES
This graph was not subjected to auditing procedures.
Please see the independent auditor’s report on additional information at page 35.
YEaR aPPLICaTIONS SaT SCORES SaT SCORES
2003 7,052 1159
2004 8,063 1169
2005 9,065 1208
2006 9,204 1216
2007 9,380 1220 1830
2008 9,434 1225 1840
2009 9,041 1225 1843
2010 9,771 1218 1830
2011 9,079 1218 1832
2012 10,241 1229 1846
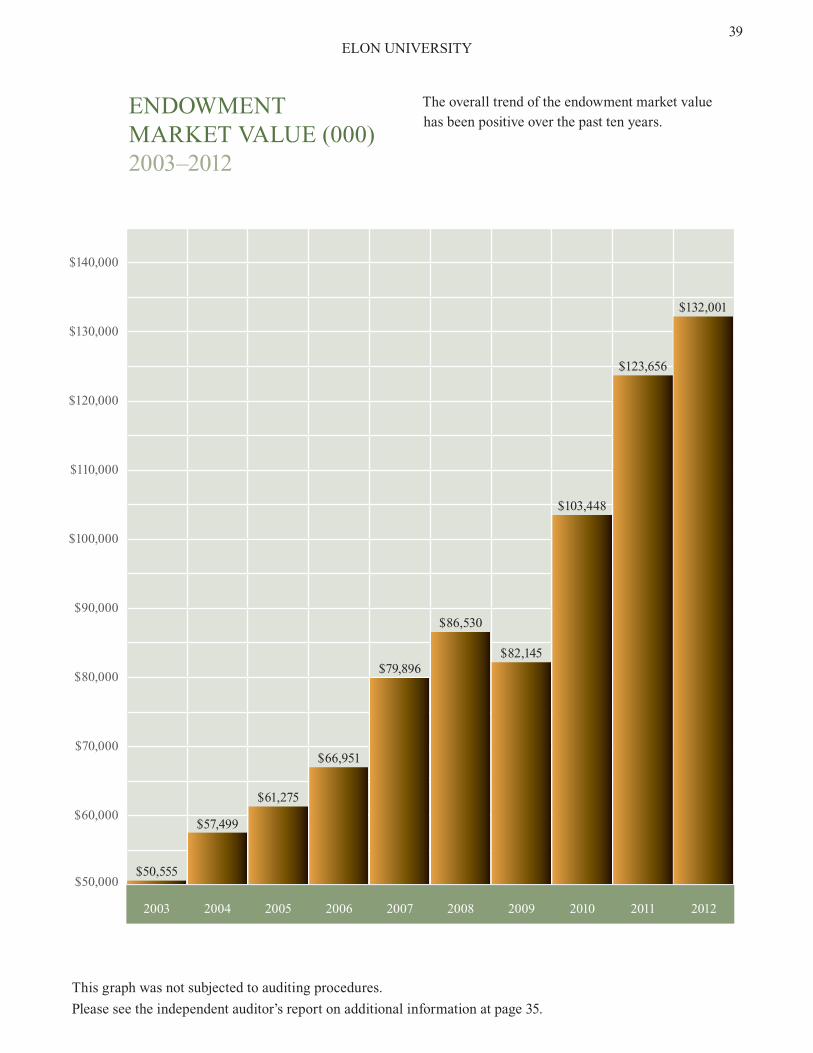
39ELON UNIVERSITY
ENdOWmENT maRkET VaLUE (000)2003–2012
$140,000
$130,000
$120,000
$110,000
$100,000
$90,000
$80,000
$70,000
$60,000
$50,000
2003 2004 2005 2006 2007 2008 2009 2010 2011 2012
$50,555
$57,499
$61,275
$66,951
$79,896
$86,530
$82,145
$103,448
$123,656
$132,001
The overall trend of the endowment market value has been positive over the past ten years.
This graph was not subjected to auditing procedures.
Please see the independent auditor’s report on additional information at page 35.
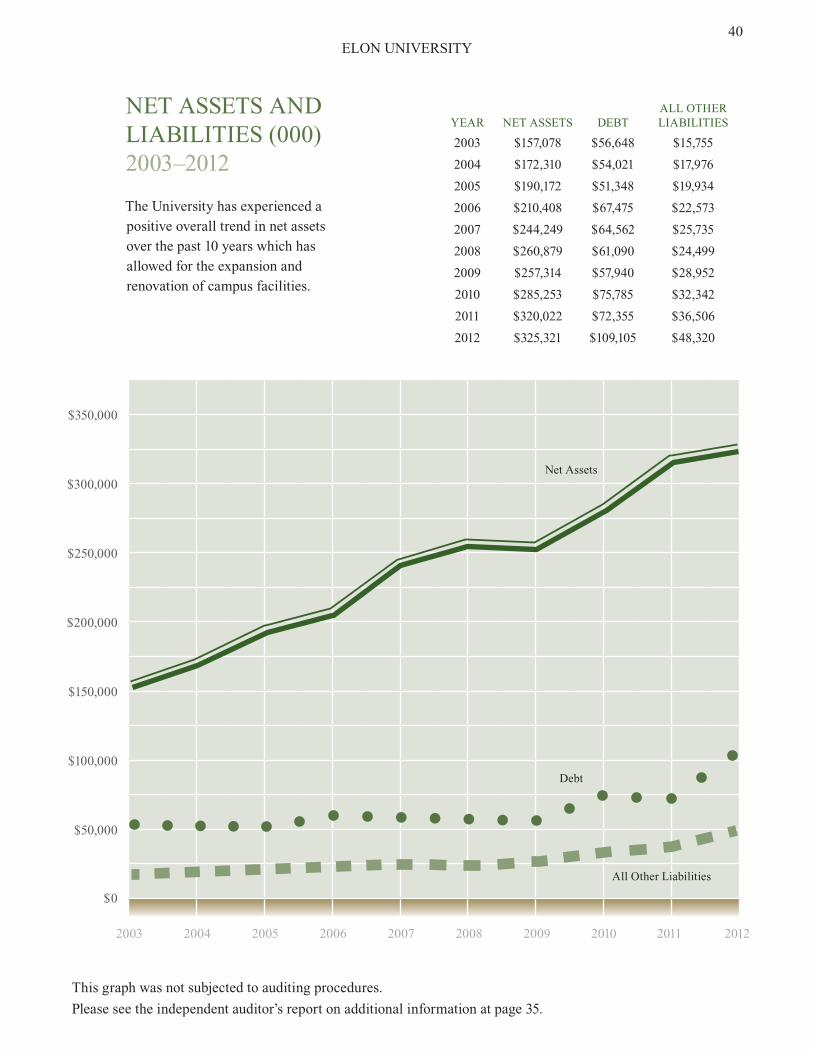
$350,000
$300,000
$250,000
$200,000
$150,000
$100,000
$50,000
$0
2003 2004 2005 2006 2007 2008 2009 2010 2011 2012
debt
all Other Liabilities
Net assets
40ELON UNIVERSITY
NET aSSETS aNd LIaBILITIES (000) 2003–2012
The University has experienced a positive overall trend in net assets over the past 10 years which has allowed for the expansion and renovation of campus facilities.
YEaR NET aSSETS dEBTaLL OTHER LIaBILITIES
2003 $157,078 $56,648 $15,755
2004 $172,310 $54,021 $17,976
2005 $190,172 $51,348 $19,934
2006 $210,408 $67,475 $22,573
2007 $244,249 $64,562 $25,735
2008 $260,879 $61,090 $24,499
2009 $257,314 $57,940 $28,952
2010 $285,253 $75,785 $32,342
2011 $320,022 $72,355 $36,506
2012 $325,321 $109,105 $48,320
This graph was not subjected to auditing procedures.
Please see the independent auditor’s report on additional information at page 35.


Financial & Audit ReportMay 31, 2012 & 2011