Embed Size (px)
Citation preview

1
FINANCE EXTERNAL CIRCULAR NOTICE NO. 2 OF 2020
Ministry of Finance
P.O. Box 395
Maseru 100
23 January, 2020
FIN/EXPDT/S.1 (2019/2020)
TO: ALL PRINCIPAL SECRETARIES
ALL HEADS OF DEPARTMENTS
CLERK TO THE SENATE
CLERK TO THE NATIONAL ASSEMBLY
SENIOR PRIVATE SECRETARY TO HIS MAJESTY
AUDITOR GENERAL
OMBUDSMAN
INDEPENDENT ELECTORAL COMMISSION
SECRETARY TO THE PUBLIC SERVICE COMMISSION
DCEO DIRECTOR GENERAL
JUDICIARY SERVICES
COPY: GOVERNMENT SECRETARY
ATTORNEY GENERAL
SENIOR PRIVATE SECRETARY TO THE PRIME MINISTER
SECRETARY TO THE TEACHING SERVICE COMMISSION
NATIONAL AIDS COMMISSION
DISTRICT COUNCIL SECRETARIES
ACCOUNTANT GENERAL
BUDGET CALL CIRCULAR 2020/2021 - 2022/2023 BUDGET ESTIMATES
PART I
1.1 The Ministry of Finance as mandated by section 112(1) of the Constitution has commenced budget
process preparation for the Financial Years 2020/21-2022/23. In this regard, Chief Accounting Officers
are requested to submit to the Ministry of Finance estimates of revenue and expenditure for the
Financial Year 2020/2021 and projections of revenue and expenditure for 2021/2022 and 2022/2023 in
accordance with the ceilings in Appendices 1 and 2. The revised estimates must be submitted to the
office of the Budget Controller by 4th February 2020. The full calendar is covered in paragraph 1.4
below.
1.2 Ministries are urged to strictly adhere to the given budget ceilings for both Recurrent and Capital
expenditure estimates. (See Appendices 1 and 2 respectively).
1.3 Ministries are also urged to find innovative ways of increasing domestic revenue and to improve on the
existing revenue channels.
1.4 It is important that the deadlines for submissions are observed to enable delivery of the budget to
Cabinet and Parliament on schedule as proposed below.
Proposed 2020/21Budget Timetable
Budget Estimates Call Circular 28th January, 2020
Submission of Budget Estimates (Revenue and Expenditure) 4th February, 2020
Presentation of Budget Estimates to Cabinet Budget Committee 10th February, 2020
Presentation of Budget Estimates to Cabinet 18th February, 2020
Presentation of Budget Estimates to Parliament 26th February, 2020

2
1.5 Part I above deals with the budget calendar which must be adhered to. Part II deals with the national
growth and development policy goals and the macroeconomic framework for 2020/21 – 2022/23. Part
III deals with macroeconomic assumptions for 2019/20 – 2020/21. Part IV provides the guidelines for
Budget Estimates for 2020/21 – 2022/23. Part V deals with the need to prepare Implementation,
Procurement and Cash Flow Plans which will be used as basis of Release of Funds. Part VI covers the
Central Budget Management System (CBMS) – Budget Entry Process. Part VII deals with the content
of budget submissions. Part VIII deals with the Budget Speech.
PART II
2.1 THE NATIONAL GROWTH AND DEVELOPMENT POLICY GOALS AND THE
MACROECONOMIC FRAMEWORK FOR 2020/21 TO 2022/2023
2.1.1 STRATEGIC PRIORITIES FOR 2020/2021 BUDGET
2.1.1.1 KEY POLICY TARGETS
The medium-term national priorities were established as part of the NSDP II. These priorities are
articulated to foster job creation and inclusive growth and are: Enhancing Inclusive and Sustainable
Economic Growth and Private Sector Job Creation; Strengthening Human Capital; Building Enabling
Infrastructure; and Strengthening National Governance and Accountability Systems.
The plan has prioritised four productive sectors for job creation and inclusive growth and they are
Agriculture, Manufacturing, Tourism and Creative Industries and Technology and Innovation. The
NSDP II emphasises private sector development and gives priority to pursuing people-centred
development. Annual national budgets provide an opportunity for Government to implement specific
strategies and allocate appropriate resources to the relevant sectors of the economy to realise these
national priorities. The 2019/2020 financial year is the second in the implementation of NSDP II, and
therefore, the proposed policies and strategies for implementation during the year, as well as the resource
allocations, should be aligned to the national priorities.
The NSDP II proposes that in developing the government budgetary plans for 2020/21 to 2022/23, the
focus should remain on job creation and promotion of inclusive growth. All public spending must
address the most binding constraints faced by the private sector in a coordinated and clustered manner.
The budget priorities for this period are derived from NSDP II and therefore, the 2020/21-2022/23 key
policy targets are:
• Creation of an estimate of 49,319 private sector jobs (23,096 from the 4 productive sectors and
26, 223 from rest of the economy) over the plan period or 9,863 jobs created each year.
• Increase economic growth to at least 5 percent growth per annum over the plan period with
gradual increase in average propensity to invest in capital formation from the current 28.2 percent
to 50.3 percent over the plan period.
• Restore macroeconomic stability to sustainable levels by reducing fiscal deficit to less than 5
percent of GDP.
• Enhance democratic governance, political stability and accountability.
• Reduce the country’s ranking on the ease of doing business from position 104 (in 2018) to at
least position 80 in the medium-term trough implementation of Investment Climate Reforms.
• Reduce TB incidence from 665 to 475 per 100,000 population.
• Reduce Mortality rate in TB/HIV from 206 to 140 per 100,000 populations.

3
• Reduce incidences of HIV/AIDS and increase coverage of Anti-Retroviral Treatment (ART) to
100 percent.
• Reduce Malnutrition especially for under 5 children by at least 5 percent and, food insecurity by
5 percent in the medium term.
• Increase efficiency in the public service delivery to support private sector initiatives.
• Provide adequate infrastructure to support private sector projects.
• Increase fuel storage capacity from 3days to 90 days to ensure security of fuel supply.
• Increase electricity generation capacity from 72MW to 172MW to reduce electricity import.
2.2 PUBLIC SECTOR EXPENDITURE STRATEGY
The Public-Sector Expenditure Strategy specifies interventions that will be implemented to achieve the
above-mentioned priority areas. The major medium to long term priority for the government is
developing and empowering the private sector as a necessary instrument for job creation. This will
involve expansion and diversification of the economic base and increase productivity in key growth
sectors and job creation sectors.
The NSDP II identifies agriculture, manufacturing, tourism and creative arts, and technology and
innovation as the strategic sectors for job creation for the period 2018/19 to 2022/23. These sectors
have potential to create jobs, but currently they have critical constraints that limit their potential and
their impact has not been substantial in the fiscal years 2018/19 and 2019/20. Therefore, the Public-
Sector Expenditure Strategy will attempt to unleash the growth and development potential of these
strategic sectors, by undertaking strategic interventions to resolve those constraints that have been
identified as most binding for businesses growth and expansion.
Ministries, Departments and Agencies (MDA’s) should give a direction on what needs to be done and
clearly indicate the change so that the change and priorities can be effected. During Budget Strategy
Paper (BSP) Cabinet Retreat, it was proposed that due to tight budget constraint, GOL should prioritise
and implement few policies and plans which targets government goals. The upcoming budget should
reflect decision made for MDA’s to show Big Fast Results (BFR).
2.3 REVIEW OF MACROECONOMIC TRENDS FOR THE YEARS 2012/13 TO 2017/18 AND
FORECAST OF THE INDICATORS THROUGH THE MEDIUM-TERM RECENT
ECONOMIC DEVELOPMENTS
Economic activity contracted during FY2017/18 and FY2018/19, against the backdrop of increasingly
challenging domestic and external environment. Increased trade tensions between USA and China
increased pressure on our mining industry and diamond exports, while prolonged dry spells and droughts
affected crop production, vegetation and pasture conditions deteriorated leading to poor livestock
production. The observed economic contractions during these periods mainly reflected weak growth of
fixed investment and net exports compounded by the accumulation of domestic public sector payment
arrears which led to reduced consumption expenditure for both household and government.
The FY2019/20 budget proposed fiscal consolidation. However, this measure has not fully addressed
the current fiscal challenges. Proposals were made to cut recurrent expenditure and increase domestic
revenue. Stronger fiscal consolidation efforts would entail rationalising the current expenditure. Such
consolidation, in addition to structural reforms, financial reforms, and the reconciliation of fiscal and

4
financing data could pave the way for robust support from development partners. This support will help
the government to cushion reserves, which have severely fallen in recent years.
Fig. 1 Contribution to GDP (2008 – 2018)
9.1 Real Sector Developments
Lesotho’s macroeconomic outlook is expected to improve in FY2019/20, following two years marked
by recession and policy uncertainty. Overall GDP growth of 0.8 percent is expected in 2019/20, up from
contraction of 0.7 percent realised in 2018/19. This improvement in outlook flows from recovery in
service sector, of which most growth will stem from government sector and professional and support
services. Gross value added in the agriculture, forestry and fishing sector growth continue to remain
weak, owing to erratic weather conditions experienced in recent years. A growth of 0.3 percent is
anticipated in FY209/20 compared to the decline of 19.8 percent realised in FY2018/19.
The industrial sector accounted for 30.8 percent of total nominal output in FY2019/20 and posted
contraction of 3.2 percent. The decline is attributed to mining and quarrying which recorded a slower
growth of 1.4 percent relative to strong 5.7 percent recorded in FY2018/19. Manufacturing contracted
by 5.2 percent, on account of textiles, clothing footwear and leader sector which contracted by 5.9
percent due to reduction in production orders following a move by government to increase wages and
salaries in that sector. The construction sector equally remains on the downside following lower capital
spending by government during the year.
The services sector is the biggest of the three broad sectors of the economy, accounting for 54.0 percent
of total output both in FY2018/19 and FY2019/20. Good performance activities related to professional
and support services, administration and support services resulted into sectoral growth of 1.7 percent
following contractions in most of the sectors within the industry in FY2019/20. Government sector
expanded by 3.0 percent amid cash shortages experienced during the year which, to some extend
contributed to poor performance of most sectors of the economy. Government sector accounts for about
19.7 percent of the nominal output in FY2019/20.
Following slow recovery in economic activity in FY2018/19 and FY2019/20, the economy is set to
record yet another poor growth of 1.3 percent compared with the previous years. Growth is expected to
be driven by recovery in agriculture, forestry and fishing at 3.4 percent, while industrial sector will
improve by 0.1 percent largely driven by mining industry at 5.8 percent. Government sector is expected
to remain constant in FY2020/21 and through the medium term.
-5,0
0,0
5,0
10,0
15,0
-20,0
-10,0
0,0
10,0
20,0
30,0
40,0
2008 2009 2010 2011 2012 2013 2014 2015 2016 2017 2018
Gross fixed capital formation
Final consumption expenditure, government
Final consumption expenditure, households
GDP at market prices

5
Fig.2 Sectoral performance 2008 – 2022/23
9.2 Monetary Policy Framework
Being the member of the Common Monetary Area (CMA), Lesotho is required to harmonise its
monetary and exchange rate policies with those of South African Reserve Bank (SARB). The Loti which
is a legal tender in Lesotho is pegged one to one with South Africa Rand, a floating currency which is
also a legal tender in Lesotho. The Central Bank of Lesotho (CBL) manages adequate level of
international reserves, usually at 5 – 6 months of import cover. Nevertheless, since FY2016/17 the
economy’s international reserves have fallen to 4.2 months of import cover with the anticipated
trajectory in FY2019/20.
According to CBL’s MPC, money supply, as measured by M2, had increased by 7.3 percent in the third
quarter of 2019 following a decline of 2.1 percent in the second quarter. This was due to an increase in
both net foreign assets and net domestic claims. Private sector credit on the other hand continued its
upward trend, increasing by 7.1 percent in September 2019. The Net International Reserves target floor
was increased from US$720 million to US$790 million, while at the same time the CBL rate was kept
unchanged at 6.5 percent per annum1.
9.3 Inflation
The inflation rate, measured by year-on-year percentage change in consumer price index (CPI), declined
from 5.1 percent in September 2019 to 4.9 percent in October 2019. The major contributors to this
position were food and non-alcoholic beverages, housing, electricity, gas and other fuels and recreation
and culture. However, risks to inflation outlook remain, emanating from the prevailing drought
conditions. Inflation is expected to average 5.2 percent in FY2020/21 and remain at 5.3 percent in the
medium term.
1 Monetary Policy Committee (MPC) Statement of the 26th November 2019
-0.2%
-0.1%
0.0%
0.1%
0.2%
0.3%
0.4%
0.5%
0.6%
0.7%
-3.0%
-2.0%
-1.0%
0.0%
1.0%
2.0%
3.0%
4.0%
09/10 10/11 11/12 12/13 13/14 14/15 15/16 16/17 17/18 18/19 19/20 20/21 21/22 22/23
GDP at constant market prices, % growth Rrimary Industries
Socondary Industrie Tertiary Industry

6
Fig.3 Annual inflation rate
2.4 FISCAL FRAMEWORK AND FISCAL STRATEGY (2017/18 – 2022/23)
Table 1A: Medium Term Fiscal Framework
MEDIUM TERM FISCAL FRAMEWORK
16/17 17/18 18/19 19/20 20/21 21/22 22/23
Act. Act. Act. Est. Proj. Proj. Proj.
Revenue 14 051,7 14 914,4 15 942,0 17 145,5 20 597,2 19 394,2 20 124,5
Taxes 6 397,4 6 314,3 7 528,9 7 892,0 8 444,0 8 906,8 9 358,7
Taxes on income, profits and capital gains 3 726,5 3 487,3 4 313,1 4 328,0 4 581,2 4 869,7 5 092,0
Payable by individuals 1 944,1 1 969,9 2 170,3 2 279,3 2 390,5 2 513,8 2 637,1
Payable by corporations and other enterprises 985,9 746,0 1 203,9 1 041,9 1 122,0 1 211,7 1 257,3
Other taxes on income, profits and capital gains796,4 771,4 938,9 1 006,8 1 068,7 1 144,2 1 197,6
Taxes on goods and services 2 669,0 2 826,2 3 211,7 3 564,0 3 861,1 4 035,0 4 265,3
Value added taxes 2 254,0 2 401,7 2 899,8 3 077,8 3 297,6 3 347,2 3 491,8
Excise taxes 388,0 406,8 305,2 477,7 547,7 668,3 755,0
Other taxes 1,9 0,9 4,1 0,0 1,7 2,0 1,3
Stamp taxes 1,9 0,9 4,1 0,0 1,7 2,0 1,3
Grants 1 229,0 822,1 1 061,3 1 242,0 1 009,6 1 198,3 1 208,3
Recurrent 367,5 211,0 232,2 226,9 250,2 262,3 271,3
Capital 861,5 611,0 829,1 1 015,1 759,4 936,0 937,0
Other revenue 1 906,3 1 623,8 1 777,8 1 785,3 1 933,5 2 079,9 2 192,0
Property income (primary income) 850,8 543,8 689,8 681,3 734,0 770,2 793,7
Interest 185,0 21,0 11,6 0,0 0,0 0,0 0,0
Dividends 361,5 212,6 318,5 401,0 376,5 390,8 393,3
Other dividends 139,9 63,6 318,5 243,0 210,3 215,8 209,0
Rent 304,3 310,2 359,7 280,3 345,3 366,5 386,9
Rent on land 53,5 6,4 3,2 2,8 3,2 3,1 3,3
Rent from royalties 250,8 303,8 356,6 277,5 342,1 363,4 383,6
Sales of current goods and services (incl Telecom lic.)1 040,9 1 069,9 1 087,5 1 102,4 1 197,9 1 308,0 1 396,4
Sales by market establishments 894,4 989,9 999,9 1 023,0 1 105,0 1 204,0 1 297,0
Electricity Muela 57,3 56,6 67,6 55,6 63,0 64,1 67,0
Water LHDA 837,1 933,3 932,3 967,4 1 042,0 1 139,8 1 230,1
Administrative fees 52,4 28,2 22,3 10,3 36,6 32,3 31,6
Incidental sales 94,0 51,8 65,3 69,1 56,2 71,7 67,8
Fines and penalties 4,2 2,6 0,5 1,6 1,7 1,8 1,9
SACU 4 519,0 6 154,2 5 542,2 6 226,2 8 981,1 7 209,2 7 365,5
0
4
8
12
16
20
1985 1990 1995 2000 2005 2010 2015 2020
Lesotho Inflation SA Inflation

7
Table 1B: Medium Term Fiscal Framework
Table 1C: Medium Term Fiscal Framework
16/17 17/18 18/19 19/20 20/21 21/22 22/23
TRANSACTIONS IN NONFINANCIAL
ASSETS - CAPITAL Act. Act. Act. Est. Proj. Proj. Proj.
O/W GOL 2 720,6 2 289,9 2 459,8 2 840,4 3 288,1 2 990,9 3 149,5
Fixed Assets 4 158,0 3 453,5 4 192,3 4 727,5 5 497,6 5 377,0 5 536,6
OVERALL BALANCE -2 729,0 -652,1
-1
525,4 -877,1 -410,6 -1 851,7 -1 863,1
As % of GDP -8,0% -1,9% -4,1% -2,6% -1,1% -4,8% -4,6%
PART III
3.1 MACROECONOMIC ASSUMPTIONS FOR 2019/20 – 2020/21
In view of recent domestic and external developments, the following macroeconomic assumptions were
adopted: In combination, these measures are expected to condense the overall fiscal deficit from 2.2
percent of GDP as projected in 2019/20 budget speech to 1.1 percent of GDP in 2020/21 but expand
further in the medium term to 4.8 and 4.6 percent in 2021/22 and 2022/23 respectively.
New Policy 2020/21
2021/22 2022/23
REVENUE MEASURES in Million Maloti
VAT on Telecommunications M30.6 M32.1
Levy on Tobacco and Alcohol M62.12 M130.2 M136.6
Oil Levy M43.5 M45.6 M47.8
SACU Revenue have been revised upwards in 2020/21 from M6,174.3
million to M8,981.1 million
2 The total projected levy is expected to be M124.2 million in 2020/21. However, due to implementation challenges we believe that by the 2nd
half of the year the levy will be implementable
16/17 17/18 18/19 19/20 20/21 21/22 22/23
Expenditure Act. Act. Act. Est. Proj. Proj. Proj.
Expense 12 622,7 12 113,0 13 275,1 13 295,0 15 510,3 15 868,8 16 451,0
Compensation of employees 5 277,4 5 436,1 5 994,7 6 441,1 7 729,5 8 122,8 8 461,5
Wages and salaries 4 884,0 4 932,9 5 469,0 5 922,1 7 181,3 7 537,7 7 838,0
Social contributions 393,4 503,2 525,6 519,0 548,2 585,1 623,5
Funded 393,4 503,2 525,6 519,0 548,2 585,1 623,5
Use of goods and services 3 465,8 2 667,3 3 112,5 2 885,8 3 338,0 3 277,1 3 436,6
Travel and transport, domestic 620,2 343,9 361,5 394,6 417,4 447,1 472,2
Travel and transport, international 173,4 151,4 164,5 174,6 186,7 197,4 209,0
Operating costs (incl. special in 2008/09) 2 672,1 2 172,0 2 586,5 2 316,5 2 733,9 2 632,6 2 755,4
Interest 246,9 327,4 451,6 497,1 566,7 598,4 626,8
To non-residents 208,6 214,4 228,9 234,1 290,0 307,0 320,0
To residents 38,3 113,0 222,7 263,0 276,7 291,4 306,8
Subsidies (almost all to public NFC) 415,1 310,3 279,2 233,5 245,6 258,6 272,3
Grants to international organisations 5,0 0,0 34,4 0,0 13,3 12,4 12,3
Grants to other general government units 1 253,1 1 111,7 837,5 832,3 818,3 861,7 907,4
Social benefits 1 415,1 1 568,2 1 939,7 1 753,7 1 786,3 1 804,2 1 822,2
Other expense 544,2 692,0 625,6 651,7 1 012,6 933,7 911,9
Students 496,6 641,1 577,0 521,6 901,9 766,8 830,1
Other 47,7 50,9 48,6 130,1 110,6 166,9 81,8

8
Additional Expenditures
In Million Maloti 2020/21 2021/22 2022/23
Child grants M13.0 n/a n/a
Region 5 AUSC 2020 Youth Games M170.0 n/a n/a
NMDS M322.0 M100.0 M100.0
National Reform Authority M30.0 n/a n/a
Public Sector payment arrears estimated at M1.0 billion will be treated as
below the line expenditure item.
The Cost of Living Adjustment (COLA) under wages and salaries for 2021/22 and 2022/23 have been
suspended.
Revenue
2020/21 total revenue has been influenced largely by SACU revenue which has recently contributed
around 43.6 percent of total revenue and averaged M8,981.1 million against a projection of 34.05 percent
which was estimated at M6,174.3 million. However, concerns have been noted about the volatility of
SACU receipts which have in the past contributed around 60 percent of total revenue. The medium-term
projections are expected to be sluggish since following the expected downward revision in SACU
revenues. This calls for the authorities’ focus on mobilising domestic revenue by reviewing the currently
low fees and charges which form part of non-tax revenue.
Expenditure
The total recurrent expenditure is estimated to record a growth of 16.7 percent in 2020/21 relative to
2019/20, and is projected to reach M15,510 million in 2020/21 which makes about 43.0 percent of GDP.
This unsustainable growth of recurrent expenditure will continue to be driven by growth in compensation
of employees.
Fi4. Composition of Recurrent spending
0
2 000
4 000
6 000
8 000
10 000
12 000
14 000
16 000
18 000
16/17 17/18 18/19 19/20 20/21 21/22 22/23
Expense Compensation of employees Use of goods and services
9
PART IV
4.1 GUIDELINES FOR BUDGET ESTIMATES FOR 2020/21– 2022/23
The 2020/2 – 2022/23 budget estimates will be prepared using the chart of accounts as per attached
Appendix 3. The 2020/21 – 2022/23 budget estimates will continue to be entered into the Central Budget
Management System (CBMS).
9.4 Revenue Estimates
All revenue collecting agencies must ensure that they submit realistic and achievable revenue estimates.
Extra efforts to collect and close loopholes in the collection systems and book-in revenues in the EPICOR
are required. Ministries should identify specific actions which will be implemented to improve
administration of all revenue collecting activities. Given the weak fiscal situation of the Government,
agencies and ministries responsible for collecting resources are instructed and encouraged to collect revenues
and mobilise them promptly. All relevant policy issues should be covered, including:
• The need to increase rates on fees and charges to keep them in line with inflation; and the
identification of possible new tax and non-tax revenue items to compensate for decline in revenue
from the traditional sources such as SACU.
• Revenue estimates should include: Actual Collection for 2018/19; projected outturn for 2019/20
based on actual collection in the first ten months of 2019/20; and targets for the financial years
2020/21 and projections for 2021/22 and 2022/23.
• The Government is in the process to engage LRA to collect non-tax revenue for MDA’s.
9.5 Recurrent Expenditure Estimates
General Issues
Sound Public Expenditure Management has three components:
• Adherence to the resource envelope defined in the fiscal framework;
• Targeting resources to activities which make the largest contribution to the attainment of national
development goals and objectives; and
• Undertaking approved activities with maximum productivity and efficiency.
The Government will continue to implement the Medium-Term Expenditure Framework (MTEF) approach
to budgeting. Ministries should produce Budget Framework Papers (BFPs), matching their ministerial
objectives and funding requirements with national development documents such as Vision 2020, Strategic
Development Goals (SDGs) and NSDP, taking into consideration issues of poverty eradication, quality
education, climate action and inclusion. Discussions on both the Budget Framework Paper (BFP) and the
Budget Estimates highlighted governments’ goals and priorities, and build consensus on the resource
allocation based on those priorities and look at allocations made to programmes and sub-programmes.
The discussions are not meant to result in increased aggregate ministerial ceilings. They are meant to provide
valuable information to assist the Ministries of Finance and of Development Planning and the Cabinet
Budget Committee to make more informed decisions about budget priorities. Discussions also increase the
focus on ways of improving effectiveness and efficiency with limited resources by identifying issues to be
addressed to improve service delivery and areas where reallocations and savings can be made within
ministries.

10
9.6 Conditions for Budget Estimates
Ministries are required to observe the following conditions pertaining to the 2020/21 – 2022/23 budget
estimates:
(i) Ministries should ensure that their budget estimates are linked to the BFPs;
(ii) Submissions must include all commitments already made by the Government which will have the
effect of incurring expenditure over the coming years;
(iii) Submissions should identify measures that will be taken to improve the policy environment and to
build-up institutional capacity to implement approved activities in a timely manner;
(iv) In view of the prevailing aggregate resource constraints, ministerial submissions should clearly
indicate the priority ranking of allocations by programmes;
(v) Ministerial submissions should include realistic estimates to meet the recurrent costs arising from
projects which are scheduled for completion in 2020/21 – 2022/23 as well as for the maintenance of
existing assets; and
(vi) In compliance with Public Financial Management and Accountability (PFMA) Act, virements will
only be allowed at 20 percent of the approved programme of the recurrent budget and 10 percent of
the capital project.
The submissions must also demonstrate that they include policy measures and/or resource allocations
required to satisfy agreements with Development Partners.
9.7 Content of Detailed Submissions
(a) Personal Emoluments (PE)
i. Chief Accounting Officers are advised to discuss their staffing situation with Ministry of the
Public Service before submission of the estimates:
ii. Requests for creation of new posts should be cleared with the Ministry of the Public Service
and funding with Ministry of Finance.
iii. Promotions should be cleared with Human Resource Department (HRD) in the Ministry of
the Public Service.
iv. Up-grading should be cleared with Remuneration and Benefits Department (RBD) in the
Ministry of the Public Service.
v. Ministries should provide information on the current status of filling of vacant positions.
Regarding the creation of new positions, strong justification should be provided to the
Ministry of Public Service, including how these positions will enhance performance of the
ministries/departments and the impact on the future wage bill.
vi. Allowances should be shown by type; numbers of employees affected and clear costing.
vii. Estimates of Personal Emoluments must be complemented by nominal roll indicating grades
and number of employees in each grade; vacancies; and gross salaries for 2018/19, 2019/20-
2021/22.
viii. Ministries should ensure that the Sub-Programme totals for Personal Emoluments estimates
match those contained in the payroll system. If estimates are placed in the wrong Sub-
Programme, warrants will be distributed to the wrong Sub-Programme, and there may be
delays in the payment of salaries until the relevant ministry is able to process virements.
Ministries are requested to take note of section 8 (1) of the PFMA Act, 2011.
ix. In respect of Teaching Service, additional information is required in the following format:
• Number of schools;
• Number of Government-paid teachers per district;
• Salaries and allowances estimate for 2020/21; and

11
• Projections for 2021/22 and 2022/23
x. The Ministry of Public Service should be given a copy of estimates of Personal Emoluments
to confirm payroll with establishment.
xi. Contract Gratuities: Contract Gratuities will be decentralised and ministries are required to
submit their estimates inclusive of all contract gratuities for 2020/21 and 2022/23.
(b) Other Charges (OC)
Ministries should use official Government prices to estimate fuel and maintenance costs (See
Appendix 4). A comprehensive list of ministerial/departmental fleet containing vehicle
descriptions and date of purchase/hire must be attached to the estimates.
• With regard to vehicles under Full Maintenance Lease, the latest hire rates must be used.
• Appropriate authority must accompany a request for purchase of new vehicles.
• A prioritised list of international trips should be attached to the estimates for International
Travel.
• Details of seminars, workshops and short courses proposed for the financial year should
be attached.
• Subscriptions to International Organisations are now classified within Operating Costs,
using Items 431027. Ministries should also attach a breakdown showing name of the
organisation and an amount to be paid. Justification and benefit for joining such
organisation is also requested. The Item will be centralised under the Head 25 of
Subscriptions to International Organisations. Ministries are advised to budget for
Subscriptions to Local Organisations and new subscribed International
Subscriptions.
• MDA’s providing subsidies/subventions to other organisations should submit a complete
and detailed budget for such institutions, in line with the Government format, including
audited accounts and annual reports for 2017/2018 and 2018/19. Parent ministries should
discuss the requested subvention with relevant institutions and agree on the level of
support proposed.
9.8 Special Funds and Trading Accounts
Ministries operating special funds and trading accounts are expected to submit their budgets along
with the parent ministries’, for approval by the Minister of Finance.
(a) Separate submissions are required for:
• Trading Accounts; and
• Special Funds
(b) Ministries should further note that:
• No Trading Accounts/Special Funds will be allowed to operate without approved budget
estimates;
• Trading Accounts/Special Funds that do not submit regular and audited financial and
non-financial reports will not be considered for approval.
9.9 Projects and Bank Accounts
Ministries must include in their submissions a list of all project bank accounts and their balances at
commercial banks and at the Central Bank of Lesotho. Ministries should also note that the balances in the
bank accounts (in respect of GOL funds) should be retired at the end of the financial year and should not be
part of the budget for the following year.

12
9.10 Capital Estimates
9.11 General Issues
Criteria for selection of Projects and/or allocation of resources
The need for more efficient public investment cannot be overemphasised. Hence a need to plan suitable
levels of investment across public sector, allocate investment to pro-growth sectors/projects and implement
projects on time and on budget. In this regard, priority will be given to projects which contribute to
sustainable and inclusive economic growth, employment creation, poverty reduction and ensuring
sustainable environment.
It is also very important that there is serious consideration for allocations under the recurrent expenditure
for covering operating and maintenance costs of public assets. National assets have often suffered waste
due to lack of maintenance and eventually become very expensive to rehabilitate or reconstruct. The
aggregate ceilings for capital expenditure for FY2020/21 and indicative ceilings for subsequent financial
years are set out on appendix 2 below:
All project submissions should indicate how the project reflects national development priorities as contained
in the National Strategic Development Plan II (NSDP II). Also, note that no new projects will be funded
unless they have been appraised by the Public-Sector Investment Committee (PSIC).
In view of prevailing aggregate resource constraints, all new project submissions should be aligned to
government priority areas. Ministries must submit their Capital Estimates for two categories of
projects:
Take note that for creation of new projects and programmes, a change request form has to be filled and
signed by Chief Accounting Officer. Ministries must ensure that minimum conditions (e.g. site
availability, appraisal, feasibility studies, etc.) have been met and provide relevant documentation to
confirm the conditions as these are critical for timely implementation of projects. Given the current
resource constraints, new projects are most likely to attract funding if they target NSDP II priorities shown
in paragraph 2 above.
9.12 Priorities in Capital Allocations
The first priority in allocating capital resources will be the requirement to address the objectives under
paragraph 2.1 and to meet counterpart obligations under financial agreements with Development Partners
and complete on-going GOL funded projects. Ministries are urged to ensure that projects are completed
over the planned period in order to give space for new initiatives.
The Capital Budget Estimates must include all projects funded through grants and loans regardless of
the funding arrangements (e.g. Project bank accounts and direct payment by Development Partner).
Balances accrued in project bank accounts must be included in the estimates of the respective projects
for the coming financial year for appropriation so that such balances do not constitute unauthorised
expenditure. In-case of GOL funding, balances are to be retired back to the Consolidated Fund at the
end of each financial year.
Guidelines for the release of on-going projects’ funds
• Cash plans and Implementation schedule
• Certificates and/or invoices

13
• Quotations or tender panel approvals
Projects with special features will be afforded appropriate treatment or consideration (e.g. costed breakdown
of all activities to be undertaken).
Information Communication Technology
Top priority should be given to internet connectivity within Government (Including districts). Reliability of
internet service providers and their ability to render resolutions to problems are critical for operations of the
Ministries.
Other issues or areas to be considered include:
• Website update and maintenance;
• Staff training in ICT service/operation; and
• Software license renewal.
Ministries should contact the ICT department of Ministry of Communications, Science and Technology for
advice and guidance in respect of infrastructure requirements relating to the development of e-governance
and associated cost estimates.
PART V
5.1 IMPLEMENTATION, CASH AND PROCUREMENT PLANS
Ministries are reminded that annual implementation, cash and procurement plans are required prior to release
of funds. It is recommended that implementation, cash and procurement plans be prepared when the budget
is being discussed in Parliament so that funds can be released on time at the start of the financial year.
Ministries are advised to take note that these plans will need quarterly adjustments to facilitate adequate
release of funds.
PART VI
6.1 CENTRAL BUDGET MANAGEMENT SYSTEM (CBMS) – BUDGET ENTRY PROCESS
For FY2020/21 budget, all ministries will prepare their revenue and expenditure budget estimates for both
BFP and Budget Estimates using the Programme Based Budgeting approach, the MTEF entry forms in
CBMS. Officers with user rights will be able to adjust according to the ceiling allocations in CBMS. Any
officer in a Ministry who does not have the appropriate CBMS user rights will not have access to enter data.
It should also be noted that it will be an offence for any officer to share his/her user rights with other
officers. Ministries should take advance action to ensure that relevant officers have the appropriate user
access rights to CBMS.
PART VII
7.1 ESTIMATES SUBMISSIONS
• Estimates submissions must cover actual expenditure in FY2018/19; approved budget for
FY2019/20; the projected outturn for FY2019/20; budget requests for FY2020/21; projections for
FY2021/22 and FY2022/23.
• Ministries are required to ensure that financial implications of decisions they make over the medium-
term are properly analysed, and included in the budget estimates.
• Line Ministries must submit A SIGNED HARD COPY of Budget Estimates (REVENUE,
RECURRENT AND CAPITAL ESTIMATES BY PROGRAMME).

14
PART VIII
8.1 BUDGET SPEECH 2020/21
Contributions to the FY2020/21 Budget Speech should be submitted with the Estimates. The contribution
should include: an assessment of expected performance in FY2019/20; and an outline of the Ministry’s
planned objectives and activities for FY2020/21, FY2021/22 and FY2022/23. The contributions should be
brief and specific, focusing on core goals, objectives and achievements of the Ministry and aligned with the
key priorities.
PART IX
9.1 SUBMISSIONS ARE CONSIDERED COMPLETE WHEN SIGNED BY THE PRINCIPAL
SESCRETARY/CHIEF ACCOUNTING OFFICER AND THE MINISTER AND COMPOSED
OF THE FOLLOWING:
• Revenue Target Estimates by programme;
• Recurrent Expenditure Estimates by programme;
• Capital Expenditure Estimates by programme;
• Contribution to the Budget Speech;
• Capital Budget physical progress report by programme for FY2019/20; and
• Procurement, Implementation and Cash Plans for FY2020/2021 budget.
• Lease Agreement for Ministerial office space rental.
__________________________________
MALESHOANE LEKOMOLA-DANZIGER
BUDGET CONTROLLER

15
Appendix 1
RECURRENT BUDGET CEILINGS 2020/21 – 2022/2023
Code Ministry/Office
Proposed
Ceiling
2020/21
Projection
2021/2022
Projection
2022/2023
001 Agriculture and Food Security 275,298,025 279,286,377 283,374,437
Personal Emoluments 159,534,064 163,522,416 167,610,476
Operating Costs 115,763,961 115,763,961 115,763,961
002 Health 2,541,893,105 2,554,489,388 2,567,400,577
Personal Emoluments 503,851,293 516,447,575 529,358,764
Operating Costs 2,038,041,813 2,038,041,813 2,038,041,813
003 Education and Training 2,676,138,896 2,732,201,690 2,789,666,053
Personal Emoluments 2,242,511,740 2,298,574,534 2,356,038,897
Operating Costs 433,627,156 433,627,156 433,627,156
004 Finance 1,088,925,109 1,093,214,128 1,097,610,372
Personal Emoluments 171,560,745 175,849,763 180,246,007
Operating Costs 917,364,364 917,364,364 917,364,364
005 Trade and Industry 42,560,227 43,255,035 43,967,214
Personal Emoluments 27,792,345 28,487,154 29,199,333
Operating Costs 14,767,882 14,767,882 14,767,882
006 Development Planning 1,009,637,588 467,407,079 469,220,809
Personal Emoluments 70,779,676 72,549,167 74,362,897
Operating Costs 938,857,912 394,857,912 394,857,912
007
Justice and Correctional
Services 230,710,112 35,520,358 240,450,860
Personal Emoluments 192,409,850 197,220,096 202,150,599
Operating Costs 38,300,262 38,300,262 38,300,262
008 Home Affairs 161,851,918 163,454,427 165,097,000
Personal Emoluments 64,100,377 65,702,886 67,345,459
Operating Costs 97,751,541 97,751,541 97,751,541
009 Prime Minister's Office 126,222,299 128,097,181 130,018,936
Personal Emoluments 74,995,292 76,870,175 78,791,929
Operating Costs 51,227,006 51,227,006 51,227,006
010
Communications, Science and
Technology 195,173,727 196,612,716 198,087,681
Personal Emoluments 57,559,580 58,998,570 60,473,534
Operating Costs 137,614,147 137,614,147 137,614,147
011 Law and Constitutional Affairs 98,750,526 99,951,469 71,182,435

16
Code Ministry/Office
Proposed
Ceiling
2020/21
Projection
2021/2022
Projection
2022/2023
Personal Emoluments 48,037,723 49,238,666 50,469,633
Operating Costs 50,712,803 50,712,803 20,712,803
012
Foreign Affairs and
International Relations 427,822,473 363,943,263 370,397,564
Personal Emoluments 322,051,252 258,172,042 264,626,343
Operating Costs 105,771,221 105,771,221 105,771,221
013 Public Works 70,305,659 65,305,659 66,494,909
Personal Emoluments 52,570,022 47,570,022 48,759,273
Operating Costs 17,735,636 17,735,636 17,735,636
014 Forestry and Land Reclamation 154,239,607 157,344,087 160,526,179
Personal Emoluments 124,179,206 127,283,686 130,465,778
Operating Costs 30,060,401 30,060,401 30,060,401
015 Energy and Meteorology 28,173,618 28,649,913 29,138,117
Personal Emoluments 19,051,829 19,528,125 20,016,328
Operating Costs 9,121,789 9,121,789 9,121,789
016 Employment and Labour 56,690,076 57,426,357 58,181,046
Personal Emoluments 29,451,248 30,187,529 30,942,218
Operating Costs 27,238,828 27,238,828 27,238,828
017
Tourism, Environment and
Culture 87,641,082 88,561,003 89,503,923
Personal Emoluments 36,796,873 37,716,795 38,659,715
Operating Costs 50,844,209 50,844,209 50,844,209
018 Auditor General's Office 31,110,454 31,761,967 32,429,767
Personal Emoluments 26,060,499 26,712,011 27,379,812
Operating Costs 5,049,955 5,049,955 5,049,955
019 His Majesty's Office 13,029,593 13,172,819 13,319,625
Personal Emoluments 5,729,027 5,872,253 6,019,059
Operating Costs 7,300,566 7,300,566 7,300,566
020 Public Service Commission 14,709,577 14,709,577 14,851,564
Personal Emoluments 5,679,499 5,679,499 5,821,487
Operating Costs 9,030,077 9,030,077 9,030,077
021 Public Debt 2,173,116,792 2,173,116,792 2,173,116,792
Operating Costs 2,173,116,792 2,173,116,792 2,173,116,792
023 Pensions and Gratuities 2,205,055,832 2,239,676,425 2,275,162,533
Personal Emoluments 1,384,823,732 1,419,444,325 1,454,930,433
Operating Costs 820,232,100 820,232,100 820,232,100

17
Code Ministry/Office
Proposed
Ceiling
2020/21
Projection
2021/2022
Projection
2022/2023
024
Statutory Salaries and
Allowances 40,044,095 39,177,198 39,621,129
Personal Emoluments 17,324,125 17,757,228 18,201,158
Operating Costs 22,719,971 21,419,971 21,419,971
025
Subscriptions to International
Organisations 84,434,160 84,434,160 84,434,160
Operating Costs 84,434,160 84,434,160 84,434,160
026 Refund to Erroneous Receipts 2,268,000 2,268,000 2,268,000
Operating Costs 2,268,000 2,268,000 2,268,000
030 Centralised Items 1,495,797,431 357,400,972 357,400,972
Personal Emoluments 332,400,972 332,400,972 332,400,972
Operating Costs 1,163,396,459 25,000,000 25,000,000
031 Contingency Fund 100,000,000 100,000,000 100,000,000
Operating Costs 100,000,000 100,000,000 100,000,000
037 Defence and National Security 590,935,103 603,173,870 615,718,607
Personal Emoluments 489,550,713 501,789,481 514,334,218
Operating Costs 101,384,390 101,384,390 101,384,390
038 National Assembly 84,385,425 86,205,900 88,071,886
Personal Emoluments 72,818,980 74,639,454.50 76,505,441
Operating Costs 11,566,445 11,566,445 11,566,445
039 Senate 20,928,301 21,338,223 21,758,394
Personal Emoluments 16,396,880 16,806,802 17,226,972
Operating Costs 4,531,421 4,531,421 4,531,421
040 Ombudsman 10,309,781 10,438,918 10,571,283
Personal Emoluments 5,165,473 5,294,610 5,426,975
Operating Costs 5,144,308 5,144,308 5,144,308
041
Independent Electoral
Commission 97,836,720 65,398,251 65,904,121
Personal Emoluments 19,741,236 20,234,766 20,740,636
Operating Costs 78,095,485 45,163,485 45,163,485
042
Local Government and
Chieftainship Affairs 474,950,642 485,094,537 495,492,029
Personal Emoluments 405,755,776 415,899,670 426,297,162
Operating Costs 69,194,866 69,194,866 69,194,866
043
Gender and Youth, Sports and
Recreation 121,507,718 122,407,370 123,329,514
Personal Emoluments 35,986,101 36,885,753 37,807,897
Operating Costs 85,521,617 85,521,617 85,521,617

18
Code Ministry/Office
Proposed
Ceiling
2020/21
Projection
2021/2022
Projection
2022/2023
044 Public Service 42,400,902 43,133,958 43,885,341
Personal Emoluments 29,322,246 30,055,302 30,806,685
Operating Costs 13,078,656 13,078,656 13,078,656
045 Judiciary 114,293,464 116,639,884 119,044,964
Personal Emoluments 93,856,791 96,203,211 98,608,291
Operating Costs 20,436,673 20,436,673 20,436,673
046 Social Development 289,753,984 290,897,350 292,069,301
Personal Emoluments 45,734,669 46,878,035 48,049,986
Operating Costs 244,019,315 244,019,315 244,019,315
047
Directorate of Corruption and
Economic Offences 25,979,196 26,373,930 26,778,532
Personal Emoluments 15,789,355 16,184,089 16,588,691
Operating Costs 10,189,841 10,189,841 10,189,841
048 Mining 28,962,052 29,421,532 29,892,499
Personal Emoluments 18,379,198 18,838,678 19,309,645
Operating Costs 10,582,854 10,582,854 10,582,854
049 Police and Public Safety 710,415,801 726,657,164 743,304,561
Personal Emoluments 649,654,519 665,895,882 682,543,279
Operating Costs 60,761,282 60,761,282 60,761,282
050
Small Business Development,
Cooperatives, and Marketing 79,703,512 80,451,555 81,218,300
Personal Emoluments 29,921,742 30,669,785 31,436,530
Operating Costs 49,781,770 49,781,770 49,781,770
051 Water 149,421,385 150,621,621 151,851,863
Personal Emoluments 48,009,441 49,209,677 50,439,919
Operating Costs 101,411,944 101,411,944 101,411,944
052 Transport 82,710,406 84,132,602 85,590,353
Personal Emoluments 56,887,846 58,310,042 59,767,793
Operating Costs 25,822,560 25,822,560 25,822,560
TOTAL PERSONAL EMOLUMENTS 8,002,221,934 8,115,580,729 8,310,160,223
TOTAL OPERATING COSTS 7,994,053,485 6,464,127,186 6,434,127,186
TOTAL RECURRENT 15,560,103,437 14,579,707,915 14,744,287,409

19
Appendix 2
CAPITAL BUDGET CEILINGS 2020/21 – 2022/2023
Code Ministry/Office
Proposed
Ceiling
2020/21
Projection
2021/2022
Projection
2022/2023
001 Agriculture and Food Security 34 800 942 36 192 980 37 640 699
002 Health 173 419 922 180 356 719 187 570 988
003 Education and Training 59 805 638 62 197 864 64 685 778
004 Finance 368 630 474 383 375 693 398 710 721
005 Trade and Industry 206 340 358 214 593 972 223 177 731
006 Development Planning 232 234 600 200 000 000 200 000 000
007 Justice and Correctional Services 74 984 000 77 983 360 81 102 694
008 Home Affairs 267 246 891 277 936 767 289 054 237
010
Communications, Science and
Technology 35 488 000 36 907 520 38 383 821
011 Law and Constitutional Affairs 6 473 600 6 732 544 7 001 846
012
Foreign Affairs and International
Relations 19 918 400 20 715 136 21 543 741
013 Public Works 381 428 312 396 685 444 412 552 862
015 Energy and Meteorology 200 614 453 208 639 031 216 984 592
017 Tourism, Environment and Culture 31 000 000 15 000 000 15 000 000
019 His Majesty’s Office 139 000 000 0 0
037 Defence and National Security 47 000 000 48 880 000 50 835 200
039 Senate 50 000 000 100 000 000 120 000 000
042
Local Government and
Chieftainship Affairs 388 135 000 403 660 400 419 806 816
043
Gender and Youth, Sports and
Recreation 39 622 174 60 701 335 63 129 388
044 Public Service 0 10 000 000 10 400 000
045 Judiciary 22 000 000 0 0
048 Mining 17 921 398 18 638 254 19 383 784
049 Police and Public Safety 63 000 000 63 000 000 63 000 000
050
Small Business Development,
Cooperatives and Marketing 71 980 527 74 859 748 77 854 138
051 Water 173 866 852 180 821 526 188 054 387
052 Transport 44 792 000 46 583 680 48 447 027
TOTAL 3 149 703 541 3 124 461 972 3 254 320 451
20
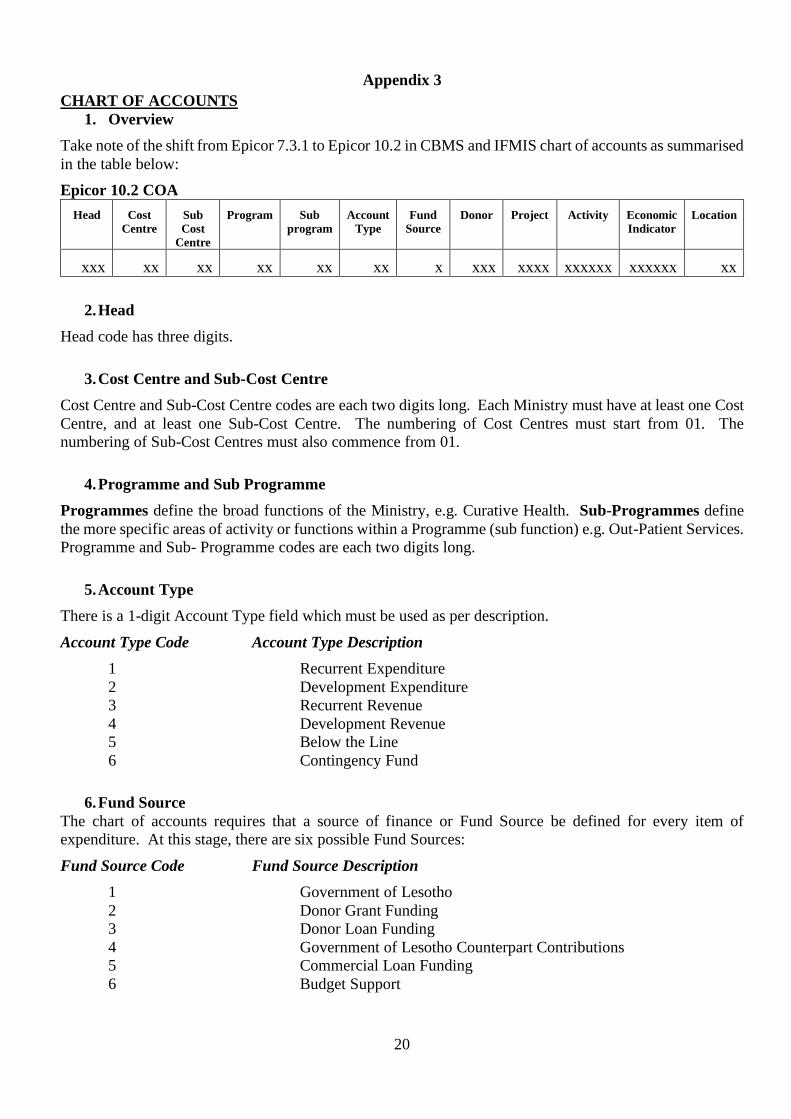
Appendix 3
CHART OF ACCOUNTS
1. Overview
Take note of the shift from Epicor 7.3.1 to Epicor 10.2 in CBMS and IFMIS chart of accounts as summarised
in the table below:
Epicor 10.2 COA
Head Cost
Centre
Sub
Cost
Centre
Program Sub
program
Account
Type
Fund
Source
Donor Project Activity Economic
Indicator
Location
xxx xx xx xx xx xx x xxx xxxx xxxxxx xxxxxx xx
2. Head
Head code has three digits.
3. Cost Centre and Sub-Cost Centre
Cost Centre and Sub-Cost Centre codes are each two digits long. Each Ministry must have at least one Cost
Centre, and at least one Sub-Cost Centre. The numbering of Cost Centres must start from 01. The
numbering of Sub-Cost Centres must also commence from 01.
4. Programme and Sub Programme
Programmes define the broad functions of the Ministry, e.g. Curative Health. Sub-Programmes define
the more specific areas of activity or functions within a Programme (sub function) e.g. Out-Patient Services.
Programme and Sub- Programme codes are each two digits long.
5. Account Type
There is a 1-digit Account Type field which must be used as per description.
Account Type Code Account Type Description
1 Recurrent Expenditure
2 Development Expenditure
3 Recurrent Revenue
4 Development Revenue
5 Below the Line
6 Contingency Fund
6. Fund Source
The chart of accounts requires that a source of finance or Fund Source be defined for every item of
expenditure. At this stage, there are six possible Fund Sources:
Fund Source Code Fund Source Description
1 Government of Lesotho
2 Donor Grant Funding
3 Donor Loan Funding
4 Government of Lesotho Counterpart Contributions
5 Commercial Loan Funding
6 Budget Support
21
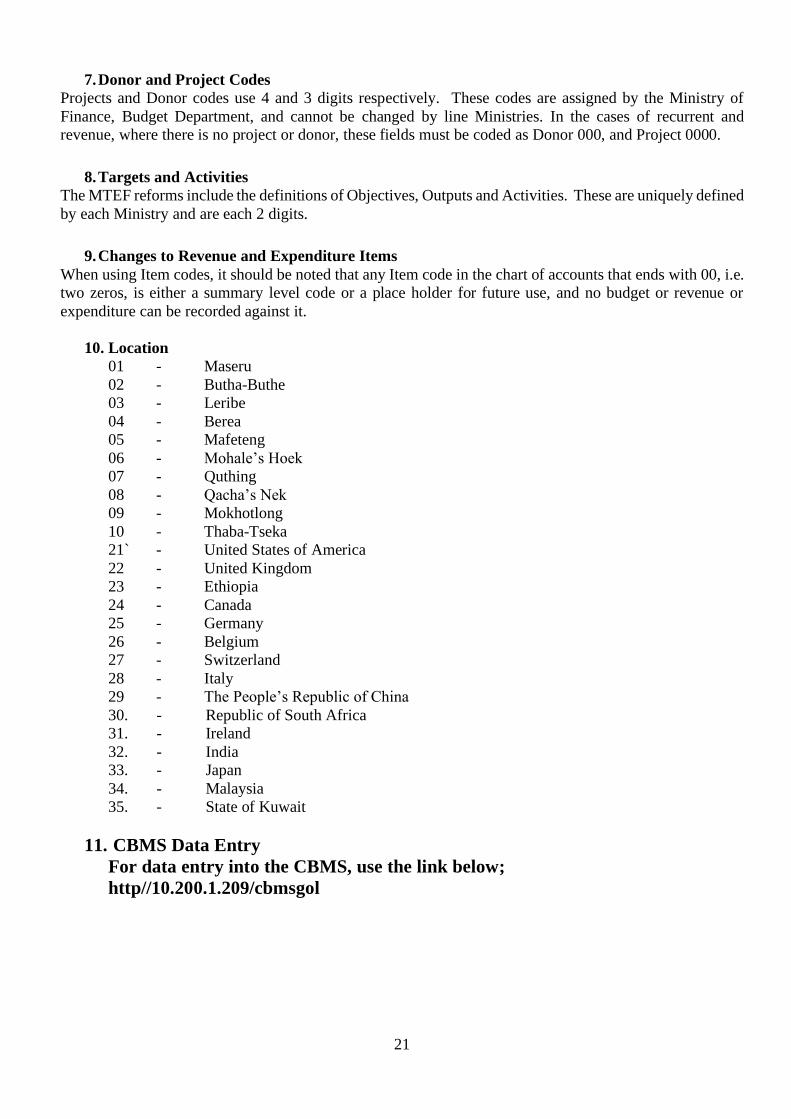
7. Donor and Project Codes
Projects and Donor codes use 4 and 3 digits respectively. These codes are assigned by the Ministry of
Finance, Budget Department, and cannot be changed by line Ministries. In the cases of recurrent and
revenue, where there is no project or donor, these fields must be coded as Donor 000, and Project 0000.
8. Targets and Activities
The MTEF reforms include the definitions of Objectives, Outputs and Activities. These are uniquely defined
by each Ministry and are each 2 digits.
9. Changes to Revenue and Expenditure Items
When using Item codes, it should be noted that any Item code in the chart of accounts that ends with 00, i.e.
two zeros, is either a summary level code or a place holder for future use, and no budget or revenue or
expenditure can be recorded against it.
10. Location
01 - Maseru
02 - Butha-Buthe
03 - Leribe
04 - Berea
05 - Mafeteng
06 - Mohale’s Hoek
07 - Quthing
08 - Qacha’s Nek
09 - Mokhotlong
10 - Thaba-Tseka
21` - United States of America
22 - United Kingdom
23 - Ethiopia
24 - Canada
25 - Germany
26 - Belgium
27 - Switzerland
28 - Italy
29 - The People’s Republic of China
30. - Republic of South Africa
31. - Ireland
32. - India
33. - Japan
34. - Malaysia
35. - State of Kuwait
11. CBMS Data Entry
For data entry into the CBMS, use the link below;
http//10.200.1.209/cbmsgol

22
Appendix 4
LIST OF STANDARDISED PRICES
1. For costing purposes’ Ministries are requested to use the following rates:
RATES TO USE DURING BUDGETING
ITEM AMOUNT (Maloti)
Exchange rate $1 15.00
Petrol 93, 1 litre 12.75
Petrol 95, 1 litre 13.15
Diesel 50, 1 litre 14.00
Cost of Plate 170.00
Accommodation (guest house) 900.00
Accommodation (hotel) 1,100.00