Embed Size (px)
Citation preview

finance
Costs

What you will learn
In today’s lesson you will learn about:The different types of costsWhat these look like when plotted on a graphWhy businesses need to know about costs

Variable costsCosts are anything that a firm has to spend its money onVariable costs are costs which change as a business produces more or lessExamples of variable costs include wages and raw materialsAs a business produces more it will have to employ more workers and therefore pay more wagesLikewise if a restaurant became more popular and sold more meals, it would have to use more ingredients for the meals, i.e. the cost of its raw materials would increase

Fixed costs
Fixed costs are costs which stay the same as a business produces more or lessExamples include rent and salaryBusinesses have to pay rent on their premises regardless of how much business they doAs far as workers who are on salaries are concerned, the business pays them this amount regardless of the output of the business

exercise
From the list below write which are fixed and which are variable costs:Rent, wages, electricity, gas, stock, raw materials, advertising, petrol, car tax, internet rental,
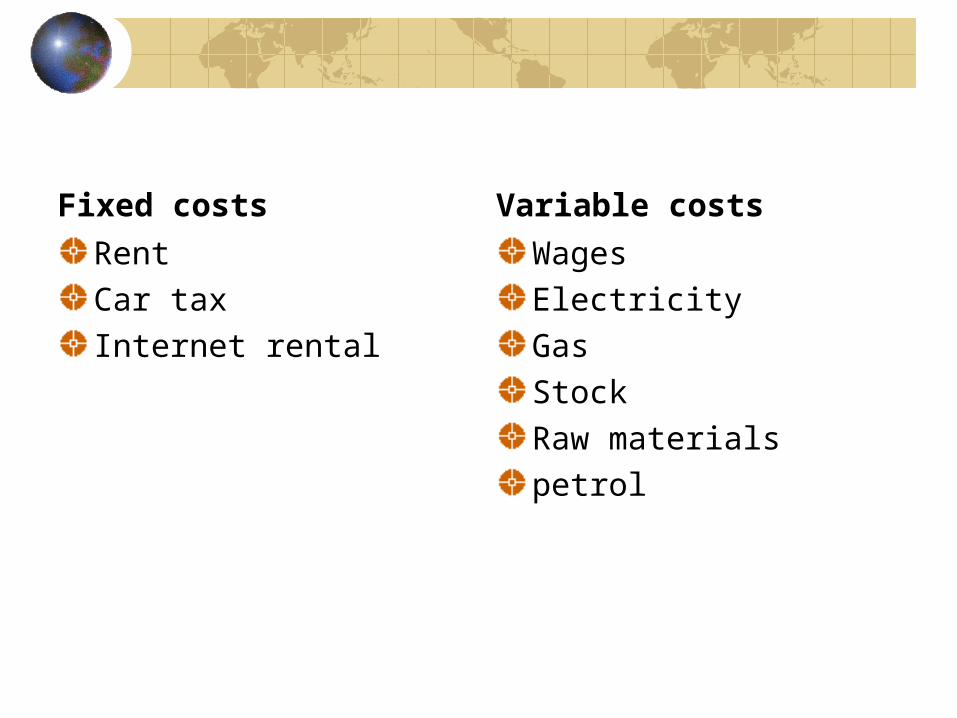
Fixed costs
Rent Car taxInternet rental
Variable costs
Wages ElectricityGasStockRaw materialspetrol

Total costs
Total costs are calculated by adding fixed and variable costs togethertotal costs = fixed costs + variable costs

Drawing cost curves for your business
“Once the table is complete the fifth task is to plot your data on a graph and draw variable, total and fixed cost curves for your business. (Use the graph paper provided)”

Drawing cost diagramsTo do this we must plot the value of a businesses’ costs against output, then we obtain series of cost curvesi.e. You need to know how much is produced or sold in your businessYou also need to know how much your costs will change as your sales increase – this is known as a cost scheduleIn business before you started trading you would title estimate this by carrying out market researchLater on we will do this, but for now here’s the information you would need to gather

Cost scheduleoutput Fixed cost Variable
costsTotal cost
0 15 15
10 15 10 25
15 20 35
20 15 45
25 15 40 55
30 15 50

Drawing Cost curves
From the cost schedule the various cost curves for the business can be drawnThese curves are normally drawn as straight lines for simplicityPlot costs on the vertical axis and output on the horizontal axisUse your graph paper to do thisYou need to fill in the gaps on the cost schedule table first

Fixed costs
Costs (£)
output
Fixed cost
The fixed cost curve is a horizontalstraight line and begins at the cost axis at the value of the fixed costs of the business
15

Variable costs
Costs(£)
Variable cost curve
output
The variable cost curves is drawn as a straight line for simplicity and slopes upwards from the origin,demonstrating that as output rises, variable costs also rise (and vice versa).
50

Total costsCosts (£)
output
Total cost
Fixed cost
The total cost line slopes upwards from the cost axis at the point where the fixed cost line starts. This demonstrates that the total cost curve consists of the fixed cost and variable costs added together. Total costs increase as output increases and vice versa.
15
65
30

Why do firms need to know about costs ?
Helps the firm to decide what price to set Most firms will set a price which covers their costs and makes a small amount of profit on top (known as cost plus pricing) Firms will need to monitor costs to ensure that profits do not fallAllows them to calculate their break even point (discussed later)

What you have learnt
In today’s lesson you have learnt about:The different types of costsHow to draw a cost schedule for a businessWhat the cost curves of a business look like when plotted on a graphWhy businesses need to know about costs
![Welcome []...• Learn about preventive care. • Find and estimate costs. • Watch a personalized video about your plan’s coverage and costs. * • See a breakdown of your claim,](https://img.dokumen.tips/doc/110x75/5ec87d53e2e8592632655e96/welcome-a-learn-about-preventive-care-a-find-and-estimate-costs-a.jpg)