Embed Size (px)
Citation preview

PO
LIT
ICA
L E
CO
NO
MY
R
ESEA
RC
H IN
ST
ITU
TE
Finance and Growth:
The Neglected Role of the Business Cycle
Simon Sturn and Gerald Epstein
First version: November 26, 2013
This version: July 28, 2014
WORKINGPAPER SERIES
Number 339

Finance and Growth: The neglected Role of the
Business Cycle
Simon Sturn« and Gerald Epstein
First version: November 26, 2013
This version: July 28, 2014
Abstract A canonical cross-‐country/time-‐series literature argues that finance, typically
measured as private credit, fuels growth. This literature aims to sweep out business
cycle effects by averaging the data over five years. We show that growth and credit
are positively correlated with output gap measures for five year averaged data.
Studies not adequately controlling for this pro-‐cyclicality overstate the long-‐run
impact of finance. We illustrate the severity of this bias in a careful reassessment of
the finance-‐growth nexus, controlling for business cycles in a panel of 130
developed and developing countries for the period 1965 to 2009. We find robust
evidence that once such short-‐run fluctuations are purged, the impact of credit
becomes considerably smaller, and less robust. Further, we present evidence that in
recent decades credit became more strongly pro-‐cyclical and the finance-‐growth
nexus much weaker. This can be explained by financial innovation and too much
finance, which are found to harm growth.
Keywords: Finance; Banking; Economic growth; Business cycle; Robustness JEL: G10; G21; O16; O40 « Department of Economics, University of Massachusetts, Amherst, MA. E-‐mail: [email protected]. ¶ Department of Economics and Political Economy Research Institute, University of Massachusetts, Amherst, MA. E-‐mail: [email protected]. Acknowledgements: We thank Philip Arestis, Michael Ash, Christian Proaño, Joao Paulo de Souza, Leonce Ndikumana, and the participants of the Finance and Growth panel at the 17th Conference of the Research Network Macroeconomics and Macroeconomic Policies (FMM) in Berlin for helpful comments. Remaining errors are ours. Financial support from the Institute for New Economic Thinking (INET) is gratefully acknowledged.
1
1. Introduction
In the cross-‐country/time-‐series literature on the impact of finance on growth the
most commonly applied proxies for financial development are total credit in percent
of GDP, bank credit in percent of GDP, and conceptually related measures. From a
theoretical perspective one would expect to find a strong positive correlation
between these proxies of financial development and growth, as there is a long
tradition in economics arguing that credit is pro-‐cyclical. First, credit demand is pro-‐
cyclical as economic downturns lead to demand shifts, i.e. firms are reluctant to
borrow and invest in a period of low aggregate demand and high uncertainty, while
the opposite is true for booms (e.g. Keynes, 1936; Bernanke, 1983; Minsky, 1986;
Pindyck, 1991; Dixit and Pindyck, 1994; Francois and Lloyd-‐Ellis, 2003). Second,
credit supply is pro-‐cyclical, as banks are less willing to lend in recessions when
bank capital is lower and borrowers have less net worth than in an upturn (e.g.
Fisher, 1933; Bernanke and Blinder, 1988; Bernanke and Gertler, 1989; Kiyotaki
and Moore, 1997; Holmstrom and Tirole, 1997). Hence finance itself is important in
the propagation of business cycles. There is further a substantial empirical literature
linking surges in credit to boom-‐and-‐bust cycles.1
Thus it is crucial to address the pro-‐cyclicality of credit in empirical studies on the
impact of finance on growth. This should be well known, especially since Beck and
Levine (2004) explicitly criticized Rousseau and Wachtel (2000) for not abstracting
from “business cycle phenomena” (p. 425) when applying annual data and
emphasized “the significance of using sufficiently low-‐frequency data to abstract
from crisis and business cycles” (p. 439). The “by-‐now-‐standard approach”
(Rousseau and Wachtel, 2011, p. 278) in panel studies to address this issue is to
transform annual data into five year non-‐overlapping periods, which allows one “to
1 See for example Demirguc-‐Kunt and Detragiache (1998), Reinhart and Kaminsky, (1999), Mendoza and Terrones (2008), Lane and Milesi-‐Ferretti (2011), Jordà et al. (2011), Schularick and Taylor (2012), Frankel and Saravelos (2012), Babecký et al. (2013), and Feldkircher (2014). 2 Studies applying the five-‐year averaging approach are e.g. De Gregorio and Guidotti (1995), Levine

2
focus on long-‐run economic growth” (Beck and Levine, 2004, p. 425).2
But it is unclear why five year averaging should successfully purge short-‐run
fluctuations from the data. According to NBER's Business Cycle Dating Committee,
the average business cycle in the U.S. from 1960 to 2009 lasted about 6½ years,
where the shortest cycle was about 2 years and the longest around 11 years.
According to the methodology defined by the German Council of Economic Experts,
German business cycles since 1970 even lasted between 6 and 11½ years, whereas
the Euro Area Business Cycle Dating Committee finds an average length of the
business cycle of 9½ years since the mid-‐1970s, with a minimum of nearly 4 years
and a maximum of more than 1½ decades. Also the output gap measures
constructed by the OECD and IMF for several rich countries show business cycles
between 2 and up to 15 years of length, which are associated with highly diverse
output losses across countries.3
Averaging the data over five year periods is therefore unlikely to smooth out cyclical
variations in growth and credit for two reasons: First, business cycles last longer
than five years on average, and second, as business cycles are not synchronized,
their length and severity vary strongly over time and between countries. We
therefore agree with Loayza and Ranciere (2006, p. 1054) that “it is not obvious that
averaging over fixed-‐length intervals effectively eliminates business-‐cycle
fluctuations.”
We aim to contribute to the existing literature along several dimensions. Fist, we
test if five year averaging sweeps out business cycle fluctuations (Section 2). We find
2 Studies applying the five-‐year averaging approach are e.g. De Gregorio and Guidotti (1995), Levine et al. (2000), Benhabib and Spiegel (2000), Rousseau and Wachtel (2002 and 2011), Favara (2003), Rioja and Valev (2004), Loayza and Ranciere (2006), Cecchetti and Kharroubi (2012), Arcand et al. (2012), Law et al. (2013), Law and Singh (2014), and Beck et al. (2014). 3 Own calculations based on the following sources: NBER: http://www.nber.org/cycles/cyclesmain.html [accessed: 2013-‐06-‐23]; Euro Area Business Cycle Dating Committee: http://www.cepr.org/data/dating/ [accessed: 2013-‐06-‐23]; German Council of Economic Experts Annual Economic Report 2007/2008; OECD Economic Outlook, No. 88; and IMF World Economic Outlook, April 2013.

3
strong evidence that this is not the case. Second, we show that the inadequate
treatment of short-‐run fluctuations in the econometric standard approach produces
biased results and overstates the true effect of finance on long-‐run growth (Section
2 and 3). Third, we carefully reassess the finance-‐growth nexus for a panel of 130
countries, and explicitly purge business cycle fluctuations (Section 3). We find
evidence that the finance-‐growth nexus became much weaker in recent decades.
This might be explained with the rise of financial innovation and bloated financial
systems in many countries, which are found to slow down growth. We conclude in
Section 4, where we also mention possible approaches to deal with high frequency
fluctuations.
2. Does five year averaging sweep out business cycle fluctuations? A look at the data
To investigate if five year averaging sweeps out business cycles, we construct a data
set with annual observations averaged over five years, including information on real
GDP per capita, private credit by banks and other financial institutions in percent of
GDP, and output-‐gap measures, a common variable to capture business cycle
fluctuations.4 If high-‐frequency fluctuations are indeed purged from five year
averaged data, the output gap measures should be uncorrelated with growth and
private credit.
To construct the output gap we follow Braun and Larrain (2005), and apply the
Hodrick-‐Prescott (HP) filter (Hodrick and Prescott, 1997) with the standard
smoothing parameter of λ=100 for annual data. Additionally, we construct further
measures using smoothing parameters of λ=25 and λ=50 for the HP filter. 5 Setting
λ=100 gives cycles up to one and a half decades (Cotis et al., 2005; Mc Morrow and
Roeger, 2001), which is consistent with the discussion on the length of business 4 See Appendix 1 for data definitions and sources. 5 λ is calculated as 1600/𝑝! , where 1600 is the standard smoothing parameter for quarterly data, p is the number of periods per quarter, and x is 3 and 2, respectively, which gives λ=25 and λ=100. Further we arbitrarily include λ=50 to get a broader variety of results.

4
cycles in Section 1. We further follow Buch et al. (2005), who prefer the Baxter-‐King
(BK) filter (Baxter and King, 1999) with values for cycle length between 2 and 8
years. Additionally, we allow for cycle length between 2 and 15 years. Our data set is
an unbalanced panel of up to 200 countries with annual information for the time
period 1965 to 2009. The annual data is averaged over non-‐overlapping five year
periods.6
Table 1 shows the pairwise correlation coefficients of growth in per capita GDP and
the logarithm of private credit in percent of GDP with the different output gap
measures. The output gap measures are consistently positively and statistically
significantly correlated with growth and private credit. Hence, our first assessment
suggests that five year averaging does not sweep out business cycle fluctuations in
the data.
Table 1: Pairwise correlation coefficients of growth in per capita GDP, the logarithm of private credit in percent of GDP, and measures of the output gap, >170 countries, 1965 to 2009, five years averaged data
Sources: World Bank WDI, AMECO, Cihak et al. (2012), Levine et al. (2000), authors calculations
To interpret this finding, consider the omitted variable bias formula. If the true
model is y!,! = 𝛽pc!,! + 𝛾og!,! + 𝜀!,! , where y!,! is growth, pc!,! is private credit, and
og!,! the output gap, where the latter is omitted, it states that !"#(!!,!,,!"!,!)!"#(!"!,!)
= 𝛽 + 𝛾′𝜎,
6 The first period is from 1960 to 1964, the second from 1965 to 1969, and so on. We drop observations if not at least three annual values are available in a five year period. We further drop the first and last five-‐year period for which GDP per capita is available for every country to address the end-‐value bias of univariate filter methods (as suggested by Baxter and King, 1999). To reduce the influence of outliers, 1.5 percent of the sample at both tails of growth and the output gap measures are winsorized, where extreme values are substituted by the next values counting inwards from the extremes. Our results, however, do not depend on this.
Growth Correlation-coefficient 0.115*** 0.087*** 0.067**-- 0.120*** 0.092***Significance-level 0.000 0.002 0.017 0.000 0.001Observations 1317 1317 1317 1317 1317
Private-credit Correlation-coefficient 0.077**-- 0.106*** 0.132*** 0.154*** 0.161***Significance-level 0.013 0.001 0.000 0.000 0.000Observations 1034 1034 1034 1034 1034
Output-gap,-HP-λ=25
Output-gap,-HP-λ=50
Output-gap,-HP-λ=100
Output-gap,-BK-2L8-yrs.
Output-gap,-BK-2L15-yrs.

5
where 𝛽 is the true coefficient of private credit, 𝛾 is the coefficient of the output gap,
and 𝜎 is the coefficient from regressions of the output gap on private credit. Table 1
thus suggests that cyclical fluctuations upwardly bias the impact of finance on long-‐
run growth when applying the standard five years averaging method. Given the
strong positive correlation of credit and growth in the short-‐run, the true long-‐run
effect of finance can thus be expected to be smaller than the estimated coefficient
when applying the standard approach.
To present further evidence on the pro-‐cyclicality of private credit in five year
averaged data, we proceed by regressing private credit on country and time
dummies, country-‐specific time trends, and, step by step, each of the output gap
measures. The specification takes the following form:
pc!,! = 𝛽′X!,! + δ!t+ δ!𝑡! + γ! + η! + 𝜀!,! for i = 1, …, N and t = 1, … T (1)
pc!,!is the logarithm of private credit in percent of GDP, Xi,t consists of the output
gap. δ!t is a country-‐specific time trend to capture institutional and policy changes in
a specific country which influence the development of private credit over time, δ!𝑡!
are squared country-‐specific time trends, and η! and γ!are country-‐ and time fixed
effects, respectively. Standard errors are clustered at the panel level to correct for
within-‐group serial correlation and heteroscedasticity (e.g. Bertrand et al., 2004;
Cameron et al., 2008). We present four different versions of this specification, with
and without country fixed effects, and with and without squared country-‐specific
time trends.
The results are shown in Table 2. The coefficients of the different output gap
measures are consistently positively correlated with private credit, and statistically
significant in most cases. The R2 varies between 0.69 and 0.94, suggesting that our
specifications are able to explain a high share of the variation of private credit.7
7 We also repeated this analysis for other financial system characteristics. Bank credit to GDP, bank credit to bank deposits, bank assets to GDP, bank assets to bank and central bank assets, and private bond market capitalization to GDP are also strongly pro-‐cyclical. Public bond market capitalization to GDP is found to be strongly counter-‐cyclical.

6
Table 2: Explaining the logarithm of private credit in percent of GDP, 1965 to 2009, five year averaged data, OLS and fixed effects estimator
Notes: p-‐values in parentheses, cluster-‐robust standard errors. *, **, *** indicate significance at the 10, 5, and 1 percent level, respectively. Sources: World Bank WDI, AMECO, Cihak et al. (2012), Levine et al. (2000), authors’ calculations
(1) (2) (3) (4) (5) (6) (7) (8) (9) (10)
0.021** 0.021*** 0.019*** 0.047*** 0.034*** 0.021** 0.012* 0.010** 0.025* 0.018*
(0.015) (0.003) (0.002) (0.007) (0.007) (0.015) (0.056) (0.048) (0.071) (0.067)
Country6dummies no no no no no no no no no no
Time6dummies yes yes yes yes yes yes yes yes yes yes
Country6specific6time6trends yes yes yes yes yes yes yes yes yes yes
Squared6country6specific6time6trends no no no no no yes yes yes yes yes
RDsquared 0.838 0.839 0.840 0.839 0.839 0.839 0.937 0.937 0.937 0.937
Observations 1,034 1,034 1,034 1,034 1,034 1,034 1,034 1,034 1,034 1,034
Countries 174 174 174 174 174 174 174 174 174 174
(11) (12) (13) (14) (15) (16) (17) (18) (19) (20)
0.013* 0.012** 0.010** 0.025** 0.018** 0.009 0.009 0.008* 0.018 0.013
(0.056) (0.034) (0.029) (0.045) (0.042) (0.203) (0.132) (0.094) (0.183) (0.178)
Country6dummies yes yes yes yes yes yes yes yes yes yes
Time6dummies yes yes yes yes yes yes yes yes yes yes
Country6specific6time6trends yes yes yes yes yes yes yes yes yes yes
Squared6country6specific6time6trends no no no no no yes yes yes yes yes
RDsquared 0.693 0.694 0.694 0.693 0.693 0.831 0.832 0.832 0.832 0.832
Observations 1,034 1,034 1,034 1,034 1,034 1,034 1,034 1,034 1,034 1,034
Countries 174 174 174 174 174 174 174 174 174 174
OLS
Output6gap,6
HP6λ=25
Output6gap,6
HP6λ=50
Output6gap,6
HP6λ=100
Output6gap,6
BK62D86yrs.
Output6gap,6
BK62D156yrs.
Output6gap,6
HP6λ=25
Output6gap,6
HP6λ=50
Output6gap,6
HP6λ=100
Output6gap,6
BK62D86yrs.
Output6gap,6
HP6λ=100
Output6gap,6
BK62D86yrs.
Output6gap,6
BK62D156yrs.
Output6gap
Output6gap,6
BK62D156yrs.
Output6gap
Fixed)effects
Output6gap,6
HP6λ=25
Output6gap,6
HP6λ=50
Output6gap,6
HP6λ=100
Output6gap,6
BK62D86yrs.
Output6gap,6
BK62D156yrs.
Output6gap,6
HP6λ=25
Output6gap,6
HP6λ=50

7
Overall, the different measures of the output gap are found to be positively and
significantly correlated with private credit and growth. Our results suggest that first,
five year averaging of data insufficiently purges short-‐run fluctuations. And second,
because of the pro-‐cyclicality of private credit in the short-‐run, the coefficient of
private credit in studies relying on the five year averaging method might be
upwardly biased.
3. Reassessing the finance-‐growth nexus without and with business cycle controls
To assess the severity of this bias we estimate standard growth regressions (see e.g.
Levine et al., 2000; Beck and Levine, 2004; Arcand et al., 2012) and include the
output gap as an additional control variable. The specification takes the following
form:
∆y!,! = 1− 𝛼 y!,!!! + 𝛽′X!,! + η! + γ! + 𝜀!,! for i = 1, …, N and t = 2, … T (2)
∆y!,! is the change in the logarithm of real GDP per capita over a five year period in
country i and time period t. y!,!!!is initial GDP at the beginning of each five year
period, Xi,t is a vector of explanatory variables measured during, or at the start of,
the period. It consists of private credit as proxy for financial development, and
standard control variables such as average years of schooling, government
expenditures to GDP, the inflation rate, and trade openness measured as share of
exports and imports to GDP. Depending on the specification, we also include one of
the output gap measures as additional regressor. η! are unobserved country-‐specific
effects, γ! are period-‐specific intercepts, and 𝜀!,! is an idiosyncratic error term.
We apply the system GMM estimator (see Arellano and Bover, 1995; Blundell and
Bond, 1998) with the asymptotically more efficient two-‐step procedure described in
Arellano and Bond (1991) and the Windmeijer (2005) finite sample correction. The
system GMM estimator seems to be best suited for the task of estimating cross-‐
country growth regressions with persistent variables, a dynamic data generating
process, arbitrarily distributed fixed effects, endogenous regressors with only

8
internal instruments available, and a data set with a small number of time periods
and a large cross-‐sectional dimension (see e.g. Bond et al., 2001). It is also the most
commonly applied estimator in the cross-‐country growth literature.
Table 3: Growth specification, 1965 to 2009, five year averaged data
Notes: p-‐values in parentheses, Windmeijer robust standard errors. *, **, *** indicate significance at the 10, 5, and 1 percent level, respectively. The regressions include time dummies that are not reported. Instruments limited to two lags. All explanatory variables except output gap in logarithms. Sources: World Bank WDI, AMECO, OECD, IFS, Cihak et al. (2012), Levine et al. (2000), authors calculations
The Hansen test of overidentifying restrictions and the Arellano-‐Bond serial
correlation test are reported with the regression results. The Hansen tests never
reject the null, and thus provide support for the validity of the instruments. All
regressions reject the null of no first order autocorrelation, and do not reject the
null of no second order autocorrelation.8 Our data set consists of 132 coutnries over
8 y!,!!! and years of schooling are treated as pre-‐determined, the remaining variables as endogenous. In a first assessment, all lags are used as instruments. Probably because of the relatively high time dimension in our sample the Hansen test of overidentifying restrictions is equal to 1.000 in most cases, indicating potential problems with instrument proliferation (Roodman, 2009; Bazzi and Clemens, 2013). Thus we limit the lag-‐length of the instrumental variables appropriately, typically allowing for two lags. The presented results are very similar if one, two, or three lags are used as instruments. Our central finding also holds if we collapse the instruments (see Footnote 11).
(1a) (1b) (1c) (1d) (1e) (1f)
*0.192 *0.073 0.047 *0.080 *0.276 *0.234(0.626) (0.815) (0.893) (0.821) (0.393) (0.479)1.283* 1.342** 1.113* 1.224** 1.436** 1.364**(0.050) (0.033) (0.074) (0.032) (0.016) (0.024)0.116 0.111 0.130 0.142 0.104 0.075(0.571) (0.588) (0.539) (0.474) (0.602) (0.718)
*2.944*** *2.397*** *2.720*** *2.760*** *2.767*** *2.939***(0.000) (0.002) (0.001) (0.000) (0.001) (0.000)2.544*** 2.146*** 2.053*** 2.197*** 2.082*** 2.023***(0.000) (0.000) (0.000) (0.000) (0.000) (0.000)0.358 0.015 *0.036 0.023 0.141 0.133(0.396) (0.968) (0.930) (0.951) (0.725) (0.745)
0.414*** 0.342*** 0.210*** 0.699*** 0.426***(0.000) (0.000) (0.000) (0.000) (0.001)
Hansen9test9(p*value) 0.798 0.983 0.971 0.980 0.982 0.978
Observations 833 833 833 833 833 833Countries 132 132 132 132 132 132
0.619 0.681 0.626
Output9gap,9BK92*89yrs.
Private9credit
Output9gap
Serial9cor.9test9(p*value9for92nd9order9corr.)
0.575 0.464 0.566
Initial9GDP
School
Inflation
Government9consumption
Trade9openness
Output9gap,9HP9λ=25
Output9gap,9HP9λ=50
Output9gap,9HP9λ=100
Output9gap,9BK92*159yrs.

9
the time period 1965 to 2009.9 Together with Arcand et al. (2012), our data set
hence constitutes the most complete one in the literature so far.
Our findings are presented in Table 3. The first specification, 1a, resembles a
standard specification for the maximum sample size. Years of schooling and trade
openness are found to increase growth, while government consumption negatively
affects growth. The coefficient of private credit is 0.36. Overall these results are
extremely similar to the findings of others, especially Arcand et al. (2012), whose
covered time and country dimension resembles ours most closely, and who report a
virtually identical and also insignificant coefficient for private credit of 0.35 for the
time period 1960 to 2010 (Table 4, p. 33).10
Specifications 1b to 1f add one output gap measure at a time as additional regressor
to the baseline regression. This decreases the coefficient of private credit
considerably, on average by more than ⅘. This indicates that specifications
following the standard approach are not robust against the inclusion of business
cycle controls, and that the estimated impact of finance on growth is smaller if high-‐
frequency variations are purged.11
9 See Appendix 1 for data definitions and sources, and Appendix 2 for summary statistics. The control variables are transformed into logarithms. We follow Arcand et al. (2012) and deal with negative and zero values by applying the inverse hyperbolic sine transformation (x = ln (x + x! + 1) in the cases of inflation and schooling. To maximize sample size, observations were obtained by interpolation in a few cases, e.g. if government consumption is missing while all other required variables are available. To address the end-‐value bias of univariate filter techniques we drop the first and last observation for every country, which limits the time period under consideration to 1965 to 2009. 10 Note that Arcand et al. (2012) explain GDP growth, while we explain GDP per capita growth. 11 In the text we focus on the system GMM results. But our central finding is robust to different estimation strategies. Appendix 3 presents results applying the difference GMM and OLS estimators. While these alternative estimators yield much lower coefficients of private credit than when estimated with system GMM, we nevertheless consistently find that the coefficient of private credit is reduced further if output gap measures are controlled for. To investigate the topic of too many instruments further (see Footnote 8), we follow the advice of Roodman (2009) and Bazzi and Clemens (2013) and additionally collapse the instruments (see Appendix 4). This reduces the instrument count considerably, resulting in 29 to 37 instruments depending on the specification. This is much lower than the cross-‐sectional dimension of 132. Collapsing has a noticeable impact on the coefficient (and significance) of private credit, rendering it much smaller. But also in this case we consistently find that the inclusion of output gap measures results in lower coefficients of private credit, thus validating the central findings of this paper.

10
In none of the specifications presented in Table 3 private credit is found to fuel
growth. This goes against conventional wisdom (see e.g. Levine, 2005), and seeks
for an explanation. In what follows we investigate several possible lines of
explanations.
3.1 Is this result especially driven by rich or poor countries?
Splitting the sample into rich and poor countries, as defined by the World Bank,
allows us to test if finance has different growth-‐impacts in poor compared to rich
countries, as well as if our finding that business cycle fluctuations upwardly bias the
coefficient of total private credit holds for both groups.
The results are presented in Table 4. Once we split the sample, the effect of finance
on growth compared to the full sample seems to decrease in the poor country group,
and increase in the rich one. But in both groups, private credit is insignificant. Thus
the results do not support the view that developments affecting only one of our
country groups explain the insignificant coefficients of private credit in Table 3.
However, for both groups of countries we consistently find that the coefficient of
private credit is strongly reduced once business cycle effects are controlled for.
3.2 Did the finance-‐growth nexus become weaker over time?
Rousseau and Wachtel (2011) and Arcand et al. (2012) show that the impact of
private credit on growth fell considerably over time. Different theoretical arguments
can explain such a diminishing finance-‐growth nexus. Aghion et al. (2005) present a
growth model where countries with developed financial markets grow at the
technological frontier, while financial constraints prevent poor countries from
taking full advantage of technology transfers. Financial development induces
catching-‐up and leads to a convergence of long-‐run growth. But our results from
Section 3.1 do not seem to favor this explanation.

11
Table 4: Growth specification, 1965 to 2009, five year averaged data, high-‐ and upper-‐middle-‐income economies and low-‐ and lower-‐middle-‐income economies
Notes: p-‐values in parentheses, Windmeijer robust standard errors. *, **, *** indicate significance at the 10, 5, and 1 percent level, respectively. The regressions include time dummies that are not reported. Instruments limited to one lag. All explainatory variables except output gap in logarithms. Sources: World Bank WDI, AMECO, OECD, IFS, Cihak et al. (2012), Levine et al. (2000), authors calculations
(2a) (2b) (2c) (2d) (2e) (2f)
*1.093*** *0.750* *1.001** *0.976** *0.897** *1.050**
(0.003) (0.090) (0.044) (0.048) (0.029) (0.018)
0.807 1.436* 1.640* 1.693* 1.826** 1.738**
(0.365) (0.068) (0.060) (0.065) (0.022) (0.039)
*0.108 *0.309 *0.365 *0.487* *0.418 *0.348
(0.629) (0.275) (0.187) (0.098) (0.200) (0.220)
*0.164 *0.966 *0.836 *1.042 *1.172 *1.106
(0.854) (0.245) (0.367) (0.256) (0.171) (0.283)
1.281*** 1.151** 1.133** 1.162** 1.103** 1.078*
(0.003) (0.013) (0.044) (0.020) (0.027) (0.051)
0.643 *0.006 0.093 *0.039 *0.140 0.207
(0.115) (0.992) (0.898) (0.945) (0.818) (0.727)
0.430*** 0.326*** 0.216*** 0.542** 0.347*
(0.003) (0.000) (0.001) (0.024) (0.063)
Hansen9test9(p*value) 0.996 1.000 1.000 1.000 1.000 1.000
Observations 484 484 484 484 484 484
Countries 73 73 73 73 73 73
(3a) (3b) (3c) (3d) (3e) (3f)
0.043 0.249 0.026 *0.172 *0.045 0.016
(0.948) (0.870) (0.972) (0.780) (0.952) (0.979)
0.607 0.436 0.914 0.886 1.139 1.269
(0.578) (0.850) (0.367) (0.377) (0.328) (0.326)
0.254 0.066 0.034 0.107 *0.008 *0.055
(0.534) (0.937) (0.921) (0.791) (0.980) (0.877)
*3.991*** *3.064 *2.743** *3.255*** *3.482*** *3.716***
(0.000) (0.380) (0.016) (0.003) (0.004) (0.003)
2.630** 2.380 2.181* 2.349** 2.735** 2.516**
(0.038) (0.290) (0.061) (0.014) (0.033) (0.018)
*0.288 *0.788 *0.809 *0.521 *0.888* *1.056
(0.558) (0.442) (0.226) (0.398) (0.086) (0.124)
0.549** 0.437*** 0.313*** 1.125*** 0.678***
(0.012) (0.001) (0.002) (0.002) (0.004)
Hansen9test9(p*value) 1.000 1.000 1.000 1.000 1.000 1.000
Observations 349 349 349 349 349 349
Countries 59 59 59 59 59 59
0.863 0.895
Output9gap
Serial9cor.9test9(p*
value9for92nd9order90.969 0.990 0.838 0.781
Initial9GDP
School
Inflation
Government9
consumption
Trade9openness
Private9credit
0.593 0.659
High*9and9upper*middle*income9economies
Low*9and9lower*middle*income9economies
Output9gap,9
HP9λ=25
Output9gap,9
HP9λ=50
Output9gap,9
HP9λ=100
Output9gap,9
BK92*89yrs.
Output9gap,9
BK92*159yrs.
Output9gap
Serial9cor.9test9(p*
value9for92nd9order90.666 0.390 0.526 0.616
Initial9GDP
School
Inflation
Government9
consumption
Trade9openness
Private9credit
Output9gap,9
BK92*159yrs.
Output9gap,9
HP9λ=25
Output9gap,9
HP9λ=50
Output9gap,9
HP9λ=100
Output9gap,9
BK92*89yrs.

12
Table 5: Growth specification, 1965 to 1999 and 1965 to 1989, five year averaged data
Notes: p-‐values in parentheses, Windmeijer robust standard errors. *, **, *** indicate significance at the 10, 5, and 1 percent level, respectively. The regressions include time dummies that are not reported. Instruments limited to two lags for sample until 1999, no lag-‐limits for sample until 1989. All explanatory variables except output gap in logarithms. Sources: World Bank WDI, AMECO, OECD, IFS, Cihak et al. (2012), Levine et al. (2000), authors calculations
(4a) (4b) (4c) (4d) (4e) (4f)
*0.024 0.212 0.182 0.190 0.003 0.038(0.955) (0.564) (0.655) (0.610) (0.994) (0.946)0.675 0.331 0.472 0.613 0.512 0.472(0.355) (0.636) (0.524) (0.392) (0.446) (0.669)0.380* 0.347 0.334 0.347 0.283 0.281(0.092) (0.104) (0.159) (0.113) (0.176) (0.321)
*2.633*** *2.258*** *2.189*** *2.377*** *2.825*** *2.857**(0.003) (0.005) (0.009) (0.002) (0.000) (0.012)2.519*** 1.861*** 1.873*** 2.080*** 1.935*** 1.918**(0.001) (0.004) (0.004) (0.000) (0.002) (0.030)0.885** 0.465 0.345 0.287 0.512 0.477(0.048) (0.256) (0.397) (0.492) (0.214) (0.458)
0.533*** 0.418*** 0.264*** 0.864*** 0.555***(0.000) (0.000) (0.000) (0.000) (0.003)
Hansen9test9(p*value) 0.616 0.798 0.801 0.842 0.866 0.849
Observations 582 582 582 582 582 582Countries 118 118 118 118 118 118
(5a) (5b) (5c) (5d) (5e) (5f)
*0.196 *0.008 *0.059 0.014 *0.167 *0.107(0.718) (0.987) (0.911) (0.982) (0.741) (0.830)0.340 0.154 0.099 *0.094 0.161 *0.030(0.691) (0.848) (0.904) (0.908) (0.848) (0.970)0.359 0.188 0.205 0.219 0.296 0.301(0.311) (0.510) (0.559) (0.458) (0.323) (0.371)*2.337* *2.627*** *2.610** *2.616** *2.809** *2.761**(0.081) (0.002) (0.018) (0.034) (0.020) (0.016)2.944*** 2.318*** 2.206** 2.298** 2.339*** 2.193**(0.001) (0.008) (0.024) (0.016) (0.004) (0.020)1.704*** 1.382** 1.490** 1.548** 1.567*** 1.573**(0.008) (0.032) (0.024) (0.026) (0.007) (0.016)
0.406*** 0.369*** 0.273*** 0.801*** 0.559***(0.004) (0.000) (0.000) (0.001) (0.001)
Hansen9test9(p*value) 0.621 0.899 0.822 0.848 0.905 0.846
Observations 367 367 367 367 367 367Countries 91 91 91 91 91 91
Initial9GDP
School
Inflation
Government9consumption
19659to91999
Output9gap,9HP9λ=25
Output9gap,9HP9λ=50
Output9gap,9HP9λ=100
Output9gap,9BK92*89yrs.
Output9gap,9BK92*159yrs.
Trade9openness
Private9credit
Output9gap
Serial9cor.9test9(p*value9for92nd9order9corr.)
0.823 0.800 0.776
19659to91989
0.563
Government9consumption
Output9gap,9BK92*159yrs.
Initial9GDP
School
Inflation
Output9gap,9HP9λ=25
Output9gap,9HP9λ=50
Output9gap,9HP9λ=100
Output9gap,9BK92*89yrs.
0.788 0.908
Trade9openness
0.528 0.363 0.376
Private9credit
Output9gap
Serial9cor.9test9(p*value9for92nd9order9corr.)
0.303 0.362 0.468

13
Rousseau and Wachtel (2011) link the diminished finance-‐growth nexus to financial
liberalizations and frequent financial crisis since the late 1980’s. Hung (2009)
argues that unproductive consumption loans can generate such an effect.
Dembiermont et al. (2013) show that household lending as a share of total credit
tripled in most of the 40 countries in their sample, from around 10 to 20 percent
since the 1990s to 30 to 60 percent more recently. Beck et al. (2012) present cross-‐
country evidence that household lending has no growth effect, while firm lending
does. We investigate this issue and present estimates of our model for shorter time
periods. Table 5 presents the results when limiting the sample until 1999 and 1989,
respectively. Most remarkable are the following three patterns: First, we confirm
the result of Rousseau and Wachtel (2011) and Arcand et al. (2012) that including
more recent observations yields much lower coefficients for private credit. The
coefficient of private credit is 1.70 and highly significant for the sample until 1989
(Specification 5a), only 0.89 and significant for the sample until 1999 (Specification
4a), and become 0.36 and insignificant for the sample until 2009 (Specification 1a).
This suggests that significant changes in the financial sector occurred in recent
decades.
Second, including an output gap measure reduces the coefficients of credit
consistently in all specifications. The impact of this can even change the overall
interpretation of the results. For example, while private credit is statistically
significant for the sample until 1989, even if we control for business cycle
fluctuations, this is no longer the case for the sample until 1999, where private
credit becomes indistinguishably different from zero once the output gap is
controlled for. Thus, our findings are robust and economically highly relevant for
different time periods.
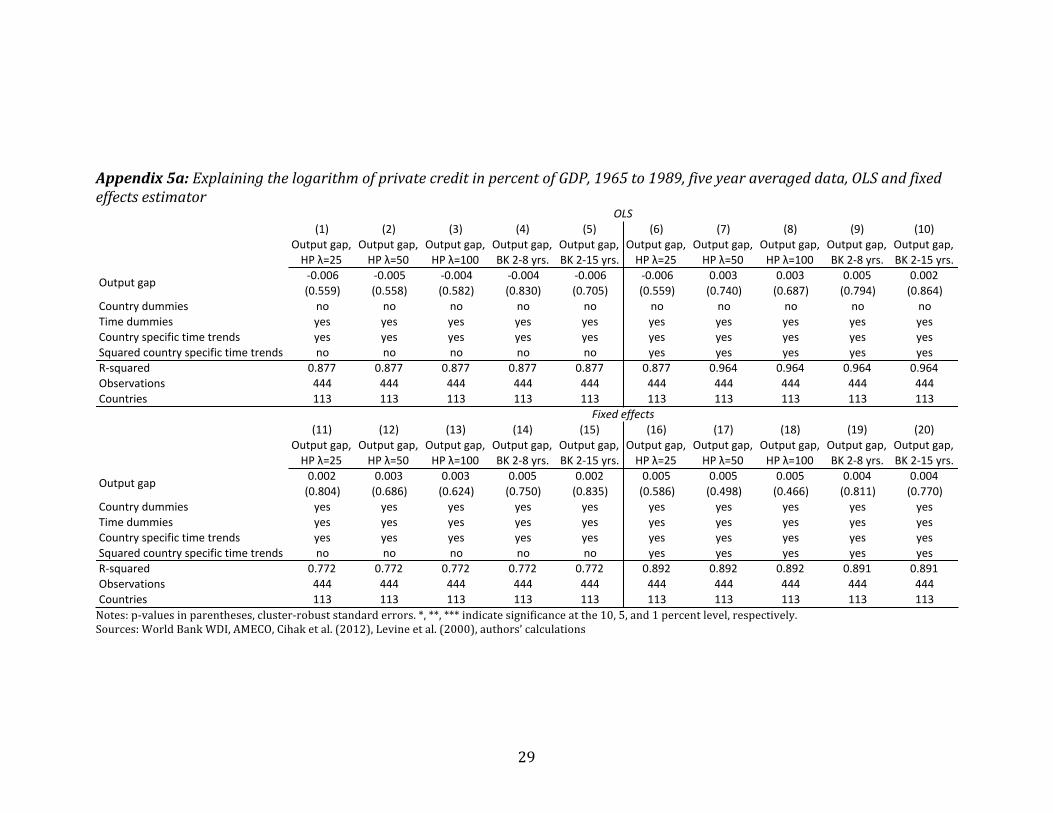
Finally, Table 4 seems to suggest that finance became more pro-‐cyclical in recent
decades. To test this explicitly, we repeat the analysis from Table 2 and explain
credit for two sub-‐periods: 1965 and 1989 and 1990 to 2009 (see Appendix 5a and

14
b). The output gap measures are indeed much higher for the sup-‐period 1990 to 2009.
Given that financial crisis became much more frequent especially in the 1990ies (e.g.
Valencia and Laeven, 2012; Reinhart and Rogoff, 2014), this result might not come
entirely as a surprise. But it can also be explained by the increasing short-‐termism of
financial markets participants (e.g. Epstein, 2005; Rappaport, 2011), and the rise of
shadow banking and other forms of financial innovation (Gennaioli et al., 2012; Adrian
and Shin, 2013). This shows that five year averaging is especially inappropriate to
determine the impact of finance on long-‐run growth in samples including more recent
observations.
3.3 Did financial innovation alter the finance-‐growth nexus?
Next we investigate if the finding of a non-‐significant growth-‐effect of finance has to
do with financial innovations in recent years. Our data allows us to split total private
credit into two components, bank credit and non-‐bank credit.12 The latter
corresponds to a broad definition of shadow banking as proposed by the FSB
(Financial Stability Board, 2011). Because many regulations do not apply for the
shadow banking system, it is often linked to high risk-‐taking and instability, and
considered to have played a major role in the recent crisis (e.g. Gorton and Metrick,
2010).
Two caveats should be highlighted here: First, our broad definition of shadow
banking might be “too broad for policy analysis” (Claessens et al., 2012), as it also
includes activities with economic values like intermediating funds from savers to
investors and risk transformation. Second, our data in several important cases, like
e.g. the Netherlands or the U.K., is not able to reproduce the figures on non-‐bank
lending from the FSB, published for a small set of countries for single years (see e.g.
Financial Stability Board, 2013). This suggests that our data is not reliably capturing
non-‐bank lending for all countries. For these two reasons our results should be
interpreted with caution.
12 Non-‐bank credit includes pension fund assets, mutual fund assets, insurance company assets, and insurance premiums (see Cihak et al., 2012).

15
Table 6: Growth specification, 1965 to 2009, five year averaged data, differentiating between bank and non-‐bank credit
Notes: p-‐values in parentheses, Windmeijer robust standard errors. *, **, *** indicate significance at the 10, 5, and 1 percent level, respectively. The regressions include time dummies that are not reported. Instruments limited to two lags. All explanatory variables except output gap in logarithms. Sources: World Bank WDI, AMECO, OECD, IFS, Cihak et al. (2012), Levine et al. (2000), authors calculations
Table 6 presents our findings. The results of specification 6a suggest that bank
credit is statistically significantly causing growth, while non-‐bank credit reduces
growth significantly. The first finding, however, is not robust against the inclusion of
the output gap measures (specifications 6b to 6f), which reduces the coefficient of
bank credit by ⅓ to ½, and renders it insignificant. The coefficient and significance
of non-‐bank credit seems hardly affected, thus indicating that financial innovation is
harming growth.13
3.4 Does too much finance harm growth?
In an in-‐depth analysis of some developed countries, Philippon and Reshef (2013, p.
92) conclude that “it is quite difficult to make a clear-‐cut case that at the margin 13 Note that it is surprising that non-‐bank credit seems rather unaffected by the inclusion of the output gap measures in Table 6. One important reason why shadow banking is suspected to increase economic instability is its pro-‐cyclicality.
(6a) (6b) (6c) (6d) (6e) (6f)
*0.304 *0.233 *0.125 *0.193 *0.302 *0.289(0.355) (0.478) (0.715) (0.551) (0.270) (0.333)1.181* 1.355** 1.101 1.273* 1.319** 1.264**(0.086) (0.040) (0.108) (0.057) (0.026) (0.043)0.195 0.176 0.205 0.221 0.126 0.193(0.383) (0.337) (0.286) (0.281) (0.499) (0.340)
*2.501*** *2.018*** *2.281*** *2.331*** *2.638*** *2.448***(0.001) (0.007) (0.001) (0.001) (0.000) (0.000)2.202*** 1.878*** 1.871*** 1.979*** 1.926*** 1.957***(0.000) (0.000) (0.000) (0.000) (0.000) (0.000)0.809** 0.433 0.386 0.430 0.560 0.545(0.016) (0.238) (0.327) (0.239) (0.120) (0.135)*0.451** *0.434** *0.434** *0.412** *0.460** *0.479**(0.032) (0.030) (0.033) (0.039) (0.025) (0.013)
0.380*** 0.313*** 0.198*** 0.569*** 0.363***(0.000) (0.000) (0.000) (0.001) (0.003)
Hansen9test9(p*value) 0.988 1.000 0.999 1.000 1.000 0.999
Observations 833 833 833 833 833 833Countries 132 132 132 132 132 132
Non*bank9credit
0.856 0.766
Output9gap
Serial9cor.9test9(p*value9for92nd9order9corr.)
0.711 0.629 0.690 0.754
Initial9GDP
School
Inflation
Government9consumption
Trade9openness
Bank9credit
Output9gap,9HP9λ=25
Output9gap,9HP9λ=50
Output9gap,9HP9λ=100
Output9gap,9BK92*89yrs.
Output9gap,9BK92*159yrs.

16
reached in high-‐income economies, the expanding financial sector increases the rate
of economic growth.”
Figure 1: Countries where private credit exceeded 90 percent of GDP on average from 2005 to 2009
Source: Cihak et al. (2012), authors calculations
Masten et al. (2008), based on a sample of European countries, find evidence for
significant non-‐linear effects, with less developed countries gaining more from
financial development. Cecchetti et al. (2011), Cecchetti and Kharroubi (2012),
Arcand et al. (2012), and Law and Singh (2014) show for panels of developing and
developed countries that the finance-‐growth nexus is non-‐linear, and that the
positive growth-‐impact of private credit peaks and turns negative after a threshold
value. All of them estimate the threshold level of private credit, for different samples
and with different estimators, to lie broadly around 90 percent of GDP. This
threshold was reached only in the last two decades by a significant amount of
mainly developed countries (see Figure 1).14
14 According to Arcand et al. (2012, Figure 3, p. 43), whose data-‐set resembles ours very closely and who cover significantly more countries over a longer time period than most previous studies, the share of observations in their sample exceeding this 90 percent threshold was around 2 to 5 percent until the mid 1980ies, and then started to rise strongly and steadily to around 10 percent in 1990, above 15 percent in 2000, and more than 30 percent in 2010.
0
50
100
150
200
250
Cyprus
Iceland
USA
Ireland
Denm
ark
Netherlands
UK
Japan
Spain
Luxembourg
Canada
Switzerland
Portugal
South Africa
Hong Kong
New Zealand
Australia
Austria
Malta
Sweden
Germany
China
Thailand
France
Malaysia
Korea
Italy
Singapore
St. Lucia
Israel

17
Table 7: Non-‐linear growth specification, 1965 to 2009, five year averaged data
Notes: p-‐values in parentheses, Windmeijer robust standard errors. *, **, *** indicate significance at the 10, 5, and 1 percent level, respectively. The regressions include time dummies that are not reported. Instruments limited to one lag. All explanatory variables except output gap, private credit and private credit squared in logarithms. Sources: World Bank WDI, AMECO, OECD, IFS, Cihak et al. (2012), Levine et al. (2000), authors calculation
We include private credit and private credit squared in levels in the specifications,
to test for a non-‐linear relationship of finance and growth.15 We present the results
of such a non-‐linear specification for the period 1965 to 2009 in Table 7. In line with
Cecchetti et al. (2011), Cecchetti and Kharroubi (2012), Arcand et al. (2012), and
Law and Singh (2014), we find that private credit is statistically significant, while
private credit squared is negatively significant. The peak value of private credit lies
at 93 percent of GDP. But again this finding is not robust against purging business
cycle effects. The inclusion of output gap variables narrows the coefficient of private 15 Because Cecchetti et al. (2011), Cecchetti and Kharroubi (2012), and Law and Singh (2014) do not apply estimation techniques which are able to deal with endogenous variables, they need to assume that finance is exogenous to growth. This is clearly at odds with the theoretical literature cited in the introduction of this paper. We thus follow Arcand et al. (2012) and apply the conventional system GMM estimator to investigate this issue. Note that Law and Singh (2014) apply the estimation approach developed by Kremer et al. (2013). This threshold framework, even though called endogenous threshold model by the authors, does not allow for endogenous regressors other than the lagged dependent variable.
(7a) (7b) (7c) (7d) (7e) (7f)
0.188 0.034 0.043 0.056 20.142 20.176
(0.596) (0.919) (0.903) (0.873) (0.678) (0.604)
0.623 0.811 0.868 0.983 1.191* 1.210*
(0.391) (0.239) (0.207) (0.149) (0.062) (0.072)
0.224 0.073 0.062 0.062 0.051 0.080
(0.332) (0.730) (0.770) (0.760) (0.805) (0.714)
23.338*** 22.764*** 22.753*** 22.902*** 22.870*** 22.985***
(0.000) (0.000) (0.000) (0.000) (0.000) (0.000)
1.981*** 1.301*** 1.255** 1.407*** 1.334*** 1.364***
(0.001) (0.009) (0.014) (0.003) (0.003) (0.004)
0.032* 0.025 0.019 0.014 0.024 0.026
(0.067) (0.127) (0.273) (0.425) (0.161) (0.147)
20.0002* 20.0001* 20.0001* 20.0001* 20.0001* 20.0001*
(0.016) (0.035) (0.113) (0.209) (0.060) (0.056)
0.513*** 0.416*** 0.275*** 0.797*** 0.462***
(0.000) (0.000) (0.000) (0.000) (0.001)
Hansen9test9(p2value) 0.294 0.450 0.441 0.481 0.488 0.623
Observations 833 833 833 833 833 833
Countries 132 132 132 132 132 132
d(growth)/d(credit)=0 93 93 88 80 95 97
Initial9GDP
School
Inflation
Government9
consumption
Trade9openness
Private9credit
Output9gap,9
HP9λ=25
Output9gap,9
HP9λ=50
Output9gap,9
HP9λ=100
Output9gap,9
BK92289yrs.
Output9gap,9
BK922159yrs.
0.717 0.663
Private9credit9squared
Output9gap
Serial9cor.9test9(p2value9
for92nd9order9corr.)0.566 0.439 0.614 0.739

18
credit (on average by ⅓), as well as private credit squared, leaving the former
insignificant. Hence, taken at face value we find that finance does not contribute to
growth at all for this period. This confirms our previous finding that omitting
business cycle controls might lead to the wrong conclusions.
In Section 3.3 we saw that the impact of non-‐bank credit seems to differ
considerably from bank credit. Thus we again split total private credit into bank
credit and non-‐bank credit, and allow bank credit to have a non-‐linear effect.16 The
results can be found in Table 8. Bank credit is found to have a significantly positive
coefficient, bank credit squared a significantly negative one. Including output gap
measures reduces the coefficients of bank credit and bank credit squared
considerably, in both cases on average by about ⅓. But this time, we find the results
to hold when sweeping out low-‐frequency variations.
Interestingly, because the output gap measures have about the same effect on bank
credit as on bank credit squared, but in opposite directions, the threshold value
after which bank credit starts to harm growth remains relatively unaffected by the
output gap measures and lies close to 90 percent in all specifications (see bottom
line of Table 8). Thus we confirm the finding of the previous literature that an
inflated financial system dampens growth. This finding holds when purging short-‐
run fluctuations. However, the result only holds for bank credit, not total private
credit.
Finally, the coefficient of non-‐bank credit consistently shows a negative sign, and is
occasionally even close to being statistically significant at the 10 percent level,
suggesting that the none-‐monotone relationship between credit and growth is not
the whole explanation for the recently faded finance-‐growth nexus, but that recent
innovations in financial systems also had an adverse effect.
16 We also tested for a non-‐linear effect of non-‐bank credit. In this case, both terms of non-‐bank credit are highly insignificant.

19
Table 8: Non-‐linear growth specification, 1965 to 2009, five year averaged data, differentiating between bank and non-‐bank credit
Notes: p-‐values in parentheses, Windmeijer robust standard errors. *, **, *** indicate significance at the 10, 5, and 1 percent level, respectively. The regressions include time dummies that are not reported. Instruments limited to one lag. All explanatory variables except output gap, private credit and private credit squared in logarithms. Sources: World Bank WDI, AMECO, OECD, IFS, Cihak et al. (2012), Levine et al. (2000), authors calculation
4. Conclusion
Because of the inherent pro-‐cyclicality of growth and the most commonly applied
proxy for financial development, private credit in percent of GDP, it is crucial to
control for business cycle fluctuations in empirical investigations on the impact of
finance on growth. The so-‐called standard approach in the empirical literature
attempts to sweep out business cycle fluctuations by averaging data over fixed
length intervals of five years. We show that both growth and private credit are
highly and positively correlated with various output gap measures for five year
averaged data. This suggests that the standard approach of dealing with cyclical
(8a) (8b) (8c) (8d) (8e) (8f)
*0.008 *0.031 *0.025 *0.050 *0.237 *0.235
(0.983) (0.932) (0.939) (0.880) (0.496) (0.501)
0.669 0.725 0.833 0.891 1.182* 1.177*
(0.357) (0.364) (0.246) (0.216) (0.063) (0.088)
0.229 0.147 0.115 0.113 0.092 0.061
(0.305) (0.470) (0.555) (0.599) (0.612) (0.729)
*3.021*** *2.654*** *2.679*** *2.811*** *2.616*** *2.663***
(0.000) (0.000) (0.000) (0.000) (0.000) (0.000)
1.763*** 1.408*** 1.357*** 1.413*** 1.454*** 1.415***
(0.001) (0.003) (0.006) (0.004) (0.003) (0.002)
0.062*** 0.044*** 0.038** 0.040** 0.046** 0.046**
(0.001) (0.005) (0.033) (0.024) (0.015) (0.013)
*0.0003*** *0.0002*** *0.0002*** *0.0002*** *0.0002*** *0.0003***
(0.000) (0.001) (0.005) (0.003) (0.001) (0.001)
*0.437* *0.287 *0.301 *0.338 *0.317 *0.347
(0.052) (0.142) (0.129) (0.116) (0.152) (0.108)
0.476*** 0.377*** 0.248*** 0.683*** 0.417***
(0.000) (0.000) (0.000) (0.001) (0.004)
Hansen9test9(p*value) 0.699 0.857 0.851 0.833 0.850 0.874
Observations 833 833 833 833 833 833
Countries 132 132 132 132 132 132
d(growth)/d(credit)=0 90 90 87 88 92 91
Bank9credit
Output9gap,9
HP9λ=25
Output9gap,9
HP9λ=50
Output9gap,9
HP9λ=100
Output9gap,9
BK92*89yrs.
Output9gap,9
BK92*159yrs.
Initial9GDP
School
Inflation
Government9
consumption
Trade9openness
0.777 0.799 0.731
Non*bank9credit
Bank9credit9squared
Output9gap
Serial9cor.9test9(p*value9
for92nd9order9corr.)0.640 0.485 0.658

20
fluctuations is inadequate, and that the impact of finance on long-‐run growth is
overstated in studies which rely on the five-‐year averaging method.
We demonstrate the relevance of these findings by including measures for the
business cycle in growth regressions for a sample of 130 countries over the time
period 1965 to 2009. We find that once the short-‐run correlation of finance and
growth is controlled for, the coefficient of private credit consistently becomes
significantly smaller. Because of the short-‐run correlation of growth and credit over
the business cycle even in five year averaged data, many findings of the
macroeconomic finance-‐and-‐growth literature therefore likely overstate the true
impact of private credit on long-‐run growth. The standard empirical approach picks
up short-‐run correlations between credit and growth and biases the results toward
the rejection of the null hypothesis.
As five year averaging has become the preferred approach to dealing with business
cycle fluctuations in the macroeconomic cross-‐country/time-‐series literature more
generally, our findings might also be relevant for other topics besides finance in this
literature.
There are different ways to tackle this issue. For example, Ndikumana (2005)
explains investment as a share of GDP and includes various finance proxies and
growth as explanatory variables. Several authors apply cointegration approaches to
determine long-‐run relationships between finance and growth.17 Arcand et al.
(2012) and Bordo and Rousseau (2012) present specifications with data averaged
over ten years, which potentially might be more successful in smoothing away
business cycles than the five year averaging method. A further possibility would be
to determine the length of every business cycle and average accordingly over the
whole cycle. Finally, one can follow the approach of this paper and include output
gap measures as control variables.
17 For example Arestis et al. (2001), Favara (2003), Christopoulos and Tsionas (2004), Loayza and Ranciere (2006), Wu et al. (2010), and Bangake and Eggoh (2011).

21
In our reassessment of the finance-‐growth nexus we demonstrated that the impact
of finance on growth weakened considerably in the last two decades, and that credit
became more strongly pro-‐cyclical in the same period. Hence, considerable changes
within the financial sector must have occurred. We present evidence that this can be
explained by inflated financial systems and destructive financial innovation, which
are found to harm long-‐run growth. Too much, and laxly regulated finance,
therefore, appears to bear considerable risks for economic development.
References
Adrian, T., Ashcraft, A.B., 2012. Shadow banking: a review of the literature. Fed. Reserv. Bank New York Staff Reports 580.
Adrian, T., Shin, H.S., 2013. Procyclical Leverage and Value-‐at-‐Risk. NBER Work. Pap. 18943.
Aghion, P., Howitt, P., Mayer-‐Foulkes, D., 2005. The Effect of Financial Development on Convergence: Theory and Evidence. Q. J. Econ. 120, 173–222.
Arcand, J.-‐L., Berkes, E., Panizza, U., 2012. Too Much Finance? IMF Work. Pap. 161.
Arellano, M., Bond, S., 1991. Some Tests of Specification for Panel Data: Monte Carlo Evidence and an Application to Employment Equations. Rev. Econ. Stud. 58, 277–97.
Arellano, M., Bover, O., 1995. Another look at the instrumental variable estimation of error-‐components models. J. Econom. 68, 29–51.
Arestis, P., Demetriades, P.O., Luintel, K.B., 2001. Financial Development and Economic Growth: The Role of Stock Markets. J. Money, Credit Bank. 33, 16–41.
Bangake, C., Eggoh, J.C., 2011. Further evidence on finance-‐growth causality: A panel data analysis. Econ. Syst. 35, 176–188.
Barro, R.J., Lee, J.W., 2013. A new data set of educational attainment in the world, 1950–2010. J. Dev. Econ. 104, 184–198.
Baxter, M., King, R.G., 1999. Measuring Business Cycles: Approximate Band-‐Pass Filters For Economic Time Series. Rev. Econ. Stat. 81, 575–593.
Bazzi, S., Clemens, M.A., 2013. Blunt Instruments: Avoiding Common Pitfalls in Identifying the Causes of Economic Growth. Am. Econ. J. Macroecon. 5, 152–86.

22
Beck, T., Büyükkarabacak, B., Rioja, F.K., Valev, N.T., 2012. Who Gets the Credit? And Does It Matter? Household vs. Firm Lending Across Countries. B.E. J. Macroecon. 12, 1–46.
Beck, T., Degryse, H., Kneer, C., 2014. Is more finance better? Disentangling intermediation and size effects of financial systems. J. Financ. Stab. 10, 50–64.
Beck, T., Levine, R., 2004. Stock markets, banks, and growth: Panel evidence. J. Bank. Financ. 28, 423–442.
Benhabib, J., Spiegel, M.M., 2000. The Role of Financial Development in Growth and Investment. J. Econ. Growth 5, 341–360.
Bernanke, B., Gertler, M., 1989. Agency Costs, Net Worth, and Business Fluctuations. Am. Econ. Rev. 79, 14–31.
Bernanke, B.S., 1983. Irreversibility, Uncertainty, and Cyclical Investment. Q. J. Econ. 98, 85–106.
Bernanke, B.S., Blinder, A.S., 1988. Credit, Money, and Aggregate Demand. Am. Econ. Rev. 78, 435–39.
Bertrand, M., Duflo, E., Mullainathan, S., 2004. How Much Should We Trust Differences-‐in-‐Differences Estimates? Q. J. Econ. 119, 249–275.
Blundell, R., Bond, S., 1998. Initial conditions and moment restrictions in dynamic panel data models. J. Econom. 87, 115–143.
Bond, S.R., Hoeffler, A., Temple, J., 2001. GMM Estimation of Empirical Growth Models. CEPR Discuss. Pap. 3048.
Bordo, M.D., Rousseau, P.L., 2012. Historical evidence on the finance-‐trade-‐growth nexus. J. Bank. Financ. 36, 1236–1243.
Braun, M., Larrain, B., 2005. Finance and the Business Cycle: International, Inter-‐Industry Evidence. J. Finance 60, 1097–1128.
Buch, C.M., Doepke, J., Pierdzioch, C., 2005. Financial openness and business cycle volatility. J. Int. Money Financ. 24, 744–765.
Cameron, A.C., Gelbach, J.B., Miller, D.L., 2008. Bootstrap-‐Based Improvements for Inference with Clustered Errors. Rev. Econ. Stat. 90, 414–427.
Cecchetti, S., Mohanty, M., Zampolli, F., 2011. The real effects of debt. BIS Work. Pap. 352.

23
Cihak, M., Demirguc-‐Kunt, A., Feyen, E., Levine, R., 2012. Benchmarking financial systems around the world. Policy Res. Work. Pap. Ser. 6175.
Claessens, S., Ratnovski, L., Singh, M., 2012. Shadow Banking: Economics and Policy. IMF Staff Discuss. Notes 12.
Cotis, J.-‐P., Elmeskov, J., Mourougane, A., 2005. Estimates of potential output : benefits and pitfalls from a policy perspectives, in: L. Reichlin (ed.): The Euro Area Business Cycles: Stylized Facts and Measurement Issues. London: Centre for Economic Policy Research. pp. 35–60.
De Gregorio, J., Guidotti, P.E., 1995. Financial development and economic growth. World Dev. 23, 433–448.
Dembiermont, C., Drehmann, M., Muksakunratana, S., 2013. How much does the private sector really borrow -‐ a new database for total credit to the private non-‐financial sector. BIS Q. Rev.
Dixit, A.K., Pindyck, R.S., 1994. Investment Under Uncertainty. Princeton University Press, Princeton, NJ.
Epstein, G.A. (Ed.), 2005. Financialization and the World Economy. Edward Elgar Publishing, Cheltenham.
Favara, G., 2003. An Empirical Reassessment of the Relationship Between Finance and Growth. IMF Work. Pap. 123.
Financial Stability Board, 2011. Shadow Banking: Scoping the Issues. http://www.financialstabilityboard.org/publications/r_110412a.pdf.
Financial Stability Board, 2013. Global Shadow Banking Monitoring Report. http://www.financialstabilityboard.org/publications/r_131114.pdf.
Fisher, I., 1933. The Debt-‐Deflation Theory of Great Depressions. Econometrica 1, 337–357.
Francois, P., Lloyd-‐Ellis, H., 2003. Animal Spirits Through Creative Destruction. Am. Econ. Rev. 93, 530–550.
Gennaioli, N., Shleifer, A., Vishny, R., 2012. Neglected risks, financial innovation, and financial fragility. J. financ. econ. 104, 452–468.
Gorton, G., Metrick, A., 2010. Regulating the Shadow Banking System. Brookings Pap. Econ. Act. 41, 261–312.
Hodrick, R.J., Prescott, E.C., 1997. Postwar U.S. Business Cycles: An Empirical Investigation. J. Money, Credit Bank. 29, 1–16.

24
Holmstrom, B., Tirole, J., 1997. Financial Intermediation, Loanable Funds, and the Real Sector. Q. J. Econ. 112, 663–91.
Hung, F.-‐S., 2009. Explaining the nonlinear effects of financial development on economic growth. J. Econ. 97, 41–65.
Jordà, Ò., Schularick, M., Taylor, A.M., 2011. Financial Crises, Credit Booms, and External Imbalances: 140 Years of Lessons. IMF Econ. Rev. 59, 340–378.
Keynes, J.M., 1936. The General Theory of Employment, Interest and Money. Macmillan, London.
Kiyotaki, N., Moore, J., 1997. Credit Cycles. J. Polit. Econ. 105, 211–48.
Kremer, S., Bick, A., Nautz, D., 2013. Inflation and growth: new evidence from a dynamic panel threshold analysis. Empir. Econ. 44, 861–878.
Law, S.H., Azman-‐Saini, W.N.W., Ibrahim, M.H., 2013. Institutional quality thresholds and the finance – Growth nexus. J. Bank. Financ. 37, 5373–5381.
Law, S.H., Singh, N., 2014. Does too much finance harm economic growth? J. Bank. Financ. 41, 36–44.
Levine, R., 2005. Finance and Growth: Theory and Evidence, in: Handbook of Economic Growth. Elsevier, Amsterdam, pp. 865–934.
Levine, R., Loayza, N., Beck, T., 2000. Financial intermediation and growth: Causality and causes. J. Monet. Econ. 46, 31–77.
Loayza, N. V., Ranciere, R., 2006. Financial Development, Financial Fragility, and Growth. J. Money, Credit Bank. 38, 1051–1076.
Masten, A.B., Coricelli, F., Masten, I., 2008. Non-‐linear growth effects of financial development: Does financial integration matter? J. Int. Money Financ. 27, 295–313.
Mc Morrow, K., Roeger, W., 2001. Potential Output : Measurement Methods, “New” Economy Influences and Scenarios for 2001-‐2010. ECFIN Econ. Pap. 150.
Mendoza, E.G., Terrones, M.E., 2008. An Anatomy Of Credit Booms: Evidence From Macro Aggregates And Micro Data. NBER Work. Pap. 14049.
Minsky, H., 1986. Stabilizing an Unstable Economy. McGraw-‐Hill, New York.
Ndikumana, L., 2005. Financial development, financial structure, and domestic investment: International evidence. J. Int. Money Financ. 24, 651–673.

25
Philippon, T., Reshef, A., 2013. An International Look at the Growth of Modern Finance. J. Econ. Perspect. 27, 73–96.
Pindyck, R.S., 1991. Irreversibility, Uncertainty, and Investment. J. Econ. Lit. 29, 1110–1148.
Rappaport, A., 2011. Saving Capitalism From Short-‐Termism: How to Build Long-‐Term Value and Take Back Our Financial Future. McGraw-‐Hill, New York.
Reinhart, C.M., Rogoff, K.S., 2014. This Time is Different: A Panoramic View of Eight Centuries of Financial Crises. Ann. Econ. Financ. 15, 1065–1188.
Rioja, F., Valev, N., 2004. Does one size fit all?: a reexamination of the finance and growth relationship. J. Dev. Econ. 74, 429–447.
Roodman, D., 2009. A Note on the Theme of Too Many Instruments. Oxf. Bull. Econ. Stat. 71, 135–158.
Rousseau, P.L., Wachtel, P., 2000. Equity markets and growth: Cross-‐country evidence on timing and outcomes, 1980-‐1995. J. Bank. Financ. 24, 1933–1957.
Rousseau, P.L., Wachtel, P., 2002. Inflation thresholds and the finance-‐growth nexus. J. Int. Money Financ. 21, 777–793.
Rousseau, P.L., Wachtel, P., 2011. What Is Happening To The Impact Of Financial Deepening On Economic Growth? Econ. Inq. 49, 276–288.
Schularick, M., Taylor, A.M., 2012. Credit Booms Gone Bust: Monetary Policy, Leverage Cycles, and Financial Crises, 1870-‐2008. Am. Econ. Rev. 102, 1029–61.
Valencia, F., Laeven, L., 2012. Systemic Banking Crises Database: An Update. IMF Work. Pap. 163.
Windmeijer, F., 2005. A finite sample correction for the variance of linear efficient two-‐step GMM estimators. J. Econom. 126, 25–51.
Wu, J.-‐L., Hou, H., Cheng, S.-‐Y., 2010. The dynamic impacts of financial institutions on economic growth: Evidence from the European Union. J. Macroecon. 32, 879–891.

26
Appendix Appendix 1: Data description and sources Variable Description and sources growth Change in logarithm of real GDP per capita in 2005 U.S. dollars. Source: World
Bank World Development Indicators (WDI) 2014, AMECO for Ireland, New Zealand, Switzerland.
private credit Claims on private sector by deposit money banks and other financial institutions divided by GDP. Source: Cihak et al. (2012) November 2013 version, augmented with data from Levine et al. (2000).
bank credit Claims on private sector by deposit money banks divided by GDP. Source: Cihak et al. (2012) November 2013 version, augmented with data from Levine et al. (2000).
non-‐bank credit
Difference between private credit and bank credit.
school Average years of schooling of males and females above 25 years of age. Source: Barro and Lee (2013), version 1.3.
government General government final consumption expenditure as a percentage of GDP. Source: WDI, 2014.
openness Exports plus imports divided by GDP. Source: WDI 2014. inflation Annual percent change of the consumer price index. Source: WDI 2014,
augmented with OECD and IFS data. output gap Cyclical deviation of trend GDP per capita in 2005 U.S. dollars, applying the
Hodrick-‐Prescott or Baxter-‐King filter . See Section 2 for details. Source: World Bank World Development Indicators (WDI) 2014, AMECO for Ireland, New Zealand, Switzerland.
Appendix 2: Summary statistics
Obs. Mean SD Min MaxGrowth 833 2.026 2.663 88.608 9.279Initial=GDP 833 8853 12130 144 80925School 833 5.841 3.131 0.156 13.190Inflation 833 22.798 127.424 85.180 2414.346Government=consumption 833 15.508 5.547 4.080 40.591Trade=openness 833 76.522 51.890 8.423 416.246Private=credit 833 42.122 39.117 0.845 228.232Bank=credit 833 38.275 35.414 0.845 208.696Output=gap,=HP=λ=25 833 80.036 1.609 85.689 4.655Output=gap,=HP=λ=50 833 80.061 2.082 87.156 6.013Output=gap,=HP=λ=100 833 80.105 2.667 810.247 7.753Output=gap,=BK=288=yrs. 833 80.121 0.949 83.814 2.776Output=gap,=BK=2815=yrs. 833 80.160 1.391 85.568 4.133

27
Appendix 3: Growth specification, 1965 to 2009, five year averaged data, difference GMM estimator and OLS
Notes: p-‐values in parentheses, Windmeijer robust and cluster-‐robust standard errors, respectively. *, **, *** indicate significance at the 10, 5, and 1 percent level, respectively. Difference GMM: Instruments limited to three lags. OLS: Within transformation to purge fixed effects. The regressions include time dummies that are not reported. All explanatory variables except output gap in logarithms. Sources: World Bank WDI, AMECO, OECD, IFS, Cihak et al. (2012), Levine et al. (2000), authors calculation
(A1a) (A1b) (A1c) (A1d) (A1e) (A1f)
+2.921* +4.245*** +5.234*** +6.833*** +5.705*** +5.770***(0.060) (0.000) (0.000) (0.000) (0.000) (0.000)+0.745 +1.978* +2.535** +3.640** +2.720** +2.774*(0.557) (0.061) (0.023) (0.011) (0.046) (0.053)
+0.753*** +0.982*** +0.882*** +0.791*** +0.900*** +0.901***(0.008) (0.000) (0.001) (0.002) (0.000) (0.000)
+3.500*** +3.258*** +2.748** +2.348** +2.785*** +2.909***(0.000) (0.002) (0.013) (0.019) (0.007) (0.002)6.518*** 6.232*** 6.279*** 5.729*** 5.506*** 5.680***(0.000) (0.000) (0.000) (0.000) (0.000) (0.000)+0.849 +1.655*** +1.874*** +1.947*** +1.625*** +1.699***(0.149) (0.000) (0.000) (0.000) (0.001) (0.001)
0.377*** 0.341*** 0.286*** 0.688*** 0.446***(0.000) (0.000) (0.000) (0.000) (0.000)
Hansen:test:(p+value) 0.138 0.683 0.625 0.459 0.559 0.606
Observations 700 700 700 700 700 700Countries 125 125 125 125 125 125
(A2a) (A2b) (A2c) (A2d) (A2e) (A2f)
+3.720*** +3.979*** +4.044*** +4.107*** +4.319*** +4.275***(0.000) (0.000) (0.000) (0.000) (0.000) (0.000)+0.726 +0.786 +0.808 +0.831 +0.844 +0.816(0.276) (0.246) (0.241) (0.236) (0.224) (0.240)+0.338** +0.361** +0.356** +0.352** +0.359** +0.359**(0.016) (0.012) (0.013) (0.014) (0.012) (0.013)
+1.920*** +1.756*** +1.732*** +1.713*** +1.700*** +1.706***(0.000) (0.001) (0.001) (0.001) (0.001) (0.001)3.546*** 3.537*** 3.539*** 3.541*** 3.514*** 3.523***(0.000) (0.000) (0.000) (0.000) (0.000) (0.000)+0.103 +0.172 +0.184 +0.195 +0.206 +0.196(0.664) (0.451) (0.422) (0.395) (0.366) (0.391)
0.207*** 0.160*** 0.127*** 0.501*** 0.297***(0.001) (0.001) (0.001) (0.000) (0.000)
R:squared 0.285 0.306 0.305 0.305 0.323 0.313Observations 833 833 833 833 833 833Countries 132 132 132 132 132 132
Private:credit
Output:gap
Difference:GMM
Initial:GDP
School
Inflation
Government:consumption
Trade:openness
OLS
Output:gap,:HP:λ=25
Output:gap,:HP:λ=50
Output:gap,:HP:λ=100
Output:gap,:BK:2+8:yrs.
Output:gap,:BK:2+15:yrs.
Output:gap,:BK:2+8:yrs.
Output:gap,:BK:2+15:yrs.
Private:credit
Output:gap,:HP:λ=25
Output:gap,:HP:λ=50
Output:gap,:HP:λ=100
Initial:GDP
School
Inflation
Government:consumption
Trade:openness
0.455 0.350
Output:gap
Serial:cor.:test:(p+value:for:2nd:order:corr.)
0.303 0.369 0.317 0.224

28
Appendix 4: Growth specification, 1965 to 2009 and 1965 to 1989, five year averaged data, system GMM estimator with collapsed instruments
Notes: p-‐values in parentheses, Windmeijer robust standard errors. *, **, *** indicate significance at the 10, 5, and 1 percent level, respectively. The regressions include time dummies that are not reported. Instruments limited to three lags and collapsed. All explanatory variables except output gap in logarithms. Sources: World Bank WDI, AMECO, OECD, IFS, Cihak et al. (2012), Levine et al. (2000), authors calculation
(A3a) (A3b) (A3c) (A3d) (A3e) (A3f)
+0.030 +1.087* +1.580** +1.567** +1.524*** +1.716***(0.965) (0.067) (0.014) (0.035) (0.004) (0.003)0.039 2.875** 3.970*** 3.886** 4.045*** 4.534***(0.975) (0.014) (0.002) (0.010) (0.000) (0.000)+0.187 +0.503 +0.433 +0.439 +0.848** +0.829*(0.688) (0.235) (0.312) (0.348) (0.037) (0.051)+3.217** +0.599 0.307 +0.524 0.387 0.863(0.042) (0.685) (0.858) (0.789) (0.775) (0.555)7.322*** 5.262*** 5.038*** 5.049*** 5.106*** 5.285***(0.000) (0.000) (0.001) (0.003) (0.000) (0.000)0.031 +0.326 +0.603 +0.768 +0.800 +0.892(0.961) (0.563) (0.324) (0.286) (0.148) (0.122)
0.880*** 0.854*** 0.593*** 1.945*** 1.416***(0.000) (0.000) (0.000) (0.000) (0.000)
Hansen:test:(p+value) 0.142 0.336 0.094 0.002 0.544 0.429
Observations 833 833 833 833 833 833Countries 132 132 132 132 132 132
(A4a) (A4b) (A4c) (A4d) (A4e) (A4f)
0.858 0.746 0.554 0.633 1.090 0.835(0.319) (0.284) (0.455) (0.428) (0.110) (0.215)+1.863 +1.299 +0.841 +0.994 +1.600 +1.140(0.322) (0.272) (0.461) (0.390) (0.193) (0.360)1.632 1.055 0.688 0.479 0.834 0.670(0.174) (0.162) (0.308) (0.518) (0.302) (0.400)+1.575 +0.720 +0.787 +1.625 +1.670 +1.374(0.460) (0.713) (0.690) (0.471) (0.465) (0.542)5.584** 3.819** 3.641** 3.669* 3.696* 3.489*(0.016) (0.037) (0.042) (0.062) (0.076) (0.095)0.722 0.792 0.479 0.349 0.559 0.528(0.653) (0.597) (0.728) (0.809) (0.732) (0.737)
0.727*** 0.709*** 0.575*** 1.266*** 1.008***(0.000) (0.000) (0.000) (0.002) (0.001)
Hansen:test:(p+value) 0.513 0.614 0.429 0.133 0.520 0.527
Observations 367 367 367 367 367 367Countries 91 91 91 91 91 91
Private:credit
1965:to:2009
Output:gap,:HP:λ=25
Output:gap,:HP:λ=50
Output:gap,:HP:λ=100
Output:gap,:BK:2+8:yrs.
Output:gap,:BK:2+15:yrs.
Initial:GDP
School
Inflation
Government:consumption
Trade:openness
Output:gap
Serial:cor.:test:(p+value:for:2nd:order:corr.)
Private:credit
1965:to:1989
Output:gap,:HP:λ=25
Output:gap,:HP:λ=50
Output:gap,:HP:λ=100
Output:gap,:BK:2+8:yrs.
Output:gap,:BK:2+15:yrs.
Initial:GDP
School
Inflation
Government:consumption
Trade:openness
Output:gap
Serial:cor.:test:(p+value:for:2nd:order:corr.)
0.072 0.201 0.447 0.782 0.216 0.272
0.231 0.222 0.683 0.718 0.790 0.618
29
Appendix 5a: Explaining the logarithm of private credit in percent of GDP, 1965 to 1989, five year averaged data, OLS and fixed effects estimator
Notes: p-‐values in parentheses, cluster-‐robust standard errors. *, **, *** indicate significance at the 10, 5, and 1 percent level, respectively. Sources: World Bank WDI, AMECO, Cihak et al. (2012), Levine et al. (2000), authors’ calculations
(1) (2) (3) (4) (5) (6) (7) (8) (9) (10)
-0.006 -0.005 -0.004 -0.004 -0.006 -0.006 0.003 0.003 0.005 0.002(0.559) (0.558) (0.582) (0.830) (0.705) (0.559) (0.740) (0.687) (0.794) (0.864)
Country6dummies no no no no no no no no no noTime6dummies yes yes yes yes yes yes yes yes yes yesCountry6specific6time6trends yes yes yes yes yes yes yes yes yes yesSquared6country6specific6time6trends no no no no no yes yes yes yes yesR-squared 0.877 0.877 0.877 0.877 0.877 0.877 0.964 0.964 0.964 0.964Observations 444 444 444 444 444 444 444 444 444 444Countries 113 113 113 113 113 113 113 113 113 113
(11) (12) (13) (14) (15) (16) (17) (18) (19) (20)
0.002 0.003 0.003 0.005 0.002 0.005 0.005 0.005 0.004 0.004(0.804) (0.686) (0.624) (0.750) (0.835) (0.586) (0.498) (0.466) (0.811) (0.770)
Country6dummies yes yes yes yes yes yes yes yes yes yesTime6dummies yes yes yes yes yes yes yes yes yes yesCountry6specific6time6trends yes yes yes yes yes yes yes yes yes yesSquared6country6specific6time6trends no no no no no yes yes yes yes yesR-squared 0.772 0.772 0.772 0.772 0.772 0.892 0.892 0.892 0.891 0.891Observations 444 444 444 444 444 444 444 444 444 444Countries 113 113 113 113 113 113 113 113 113 113
Output6gap
Output6gap
Fixed&effects
Output6gap,6HP6λ=25
Output6gap,6HP6λ=50
Output6gap,6HP6λ=100
Output6gap,6BK62-86yrs.
Output6gap,6BK62-156yrs.
Output6gap,6HP6λ=25
Output6gap,6HP6λ=50
Output6gap,6HP6λ=100
Output6gap,6BK62-86yrs.
Output6gap,6BK62-156yrs.
OLS
Output6gap,6HP6λ=25
Output6gap,6HP6λ=50
Output6gap,6HP6λ=100
Output6gap,6BK62-86yrs.
Output6gap,6BK62-156yrs.
Output6gap,6HP6λ=25
Output6gap,6HP6λ=50
Output6gap,6HP6λ=100
Output6gap,6BK62-86yrs.
Output6gap,6BK62-156yrs.

30
Appendix 5b: Explaining the logarithm of private credit in percent of GDP, 1990 to 2009, five year averaged data, OLS and fixed effects estimator
Notes: p-‐values in parentheses, cluster-‐robust standard errors. *, **, *** indicate significance at the 10, 5, and 1 percent level, respectively. Sources: World Bank WDI, AMECO, Cihak et al. (2012), Levine et al. (2000), authors’ calculations
(1) (2) (3) (4) (5) (6) (7) (8) (9) (10)
0.048*** 0.044*** 0.036*** 0.080** 0.058** 0.048*** 0.023** 0.020** 0.040 0.032*(0.002) (0.000) (0.000) (0.015) (0.014) (0.002) (0.039) (0.039) (0.159) (0.098)
Country6dummies no no no no no no no no no noTime6dummies yes yes yes yes yes yes yes yes yes yesCountry6specific6time6trends yes yes yes yes yes yes yes yes yes yesSquared6country6specific6time6trends no no no no no yes yes yes yes yesRDsquared 0.933 0.935 0.936 0.933 0.933 0.933 0.979 0.979 0.978 0.978Observations 590 590 590 590 590 590 590 590 590 590Countries 174 174 174 174 174 174 174 174 174 174
(11) (12) (13) (14) (15) (16) (17) (18) (19) (20)
0.026** 0.023*** 0.020*** 0.040* 0.032** 0.024 0.022* 0.021* 0.036 0.031(0.018) (0.008) (0.008) (0.069) (0.033) (0.138) (0.090) (0.068) (0.299) (0.188)
Country6dummies yes yes yes yes yes yes yes yes yes yesTime6dummies yes yes yes yes yes yes yes yes yes yesCountry6specific6time6trends yes yes yes yes yes yes yes yes yes yesSquared6country6specific6time6trends no no no no no yes yes yes yes yesRDsquared 0.769 0.771 0.772 0.765 0.767 0.945 0.946 0.947 0.943 0.944Observations 590 590 590 590 590 590 590 590 590 590Countries 174 174 174 174 174 174 174 174 174 174
Output6gap
Output6gap
Fixed&effects
Output6gap,6HP6λ=25
Output6gap,6HP6λ=50
Output6gap,6HP6λ=100
Output6gap,6BK62D86yrs.
Output6gap,6BK62D156yrs.
Output6gap,6HP6λ=25
Output6gap,6HP6λ=50
Output6gap,6HP6λ=100
Output6gap,6BK62D86yrs.
Output6gap,6BK62D156yrs.
OLS
Output6gap,6HP6λ=25
Output6gap,6HP6λ=50
Output6gap,6HP6λ=100
Output6gap,6BK62D86yrs.
Output6gap,6BK62D156yrs.
Output6gap,6HP6λ=25
Output6gap,6HP6λ=50
Output6gap,6HP6λ=100
Output6gap,6BK62D86yrs.
Output6gap,6BK62D156yrs.