Embed Size (px)
Citation preview
1
Final version after public consultation and ACER opinion - October 2019
2
Introduction and purpose of identification of system need During the Identification of the system needs phase, Pan-European market studies have been carried out to screen for future system needs, based on the new TYNDP 2018 2040 scenarios. The purpose of this screening is to derive a potential increase of interconnection capacity in 2040 time horizon, in order to define cross-border needs of increase in transfer capacities.
The work related to this phase involved interaction between TYNDP 2018 Network and Market study teams and SDC Regional Groups (RGs).
The results of this analyses has been published in Regional Investment Plans of all the ENTSOE Regions and in the summary report (Europe Power System 2040: completing the map & assessing the cost of non-grid).
Europe Power System 2040: completing the map & assessing the cost of non-grid report is based on market studies done on the TYNDP2018 2040 scenarios, using a common methodology described in the following chapters, considering as indicators SoS, RES and SEW, compared always to the potential costs related to the increase of cross-border infrastructure. The screening for the interconnection target as defined by European Commission for 2040 has been done.
The process also provided additional data in order to test (Task Force Inertia) the new methodology to provide indications concerning system inertia, ramping rates, etc.
Useful links:
Full Report - Europe Power System 2040: completing the map & assessing the cost of non-grid report
European Power System 2040 Appendix
Regions Investment Plans Summary
More reports and other useful information can be found through the link:
Power System 2040 site
3
1 IDENTIFICATION OF SYSTEM NEED METHODOLOGY
1.1 SCENARIO, MODELAND PERIMETER OF ANALYSIS
The identification of system need process has been conducted on the scenarios developed in the context of the TYNDP2018: Sustainable Transition, Global Climate Action and Distributed Generation. As the process should allow the identification of system needs on a long term horizon, it was chosen to analyse system needs in these scenarios for the year 2040. An additional advantage of the 2040 analysis horizon is that the results can be compared to those computed by TF Zonal Modelling using flow-based approach.
All simulations done in the context of this process were done using NTC based modelling method between different market zones.
In order for the results to be as realistic as possible and to allow an efficient screening of needs, a pre-selection of the borders analysis has been requested to the respective Regional Groups.
The identification of system need process required to take assumptions concerning a reference system (grid). The following aspects had to be considered, when deciding on the best starting assumption for the exercise:
• Availability of both market and network models• Stopping criteria of the identification of system needs process• Possibility to have a resulting capacity that is lower than the already planned capacity
Given the above mentioned criteria, it was chosen to perform the identification of system needs simulations, starting from the assumed 2030 system situation. This situation is mostly based on the 2030 reference grid resulting from the TYNDP 2016 CBA case, and is the same for all studied scenarios. Future projects were taken into account in this reference grid, depending on the project maturity at the time. Small corrections on this 2030 reference grid have been made by different TSOs, in order to take into account new evolutions and to ensure coherence between the values used for the MAF 2017 and those used in the current exercise.
4
1.2 GENERAL PROCESS
According to the feedback received from the TYNDP SG, the Identification of system Need had to be developed considering three main optimization loops:
1. Social Economic Welfare: evaluated according to the Simplified CBA criteria and the scenarioconsidered
2. Security of supply: evaluated by Expected Energy Not Supply (if any) and Remaining Capacityaccording to the scenario considered
3. Renewable Energy Sources integration: evaluated according to the CBA indicator and thescenario considered and used to appoint to the projects corresponding to the capacity increasethe “RES integration” label
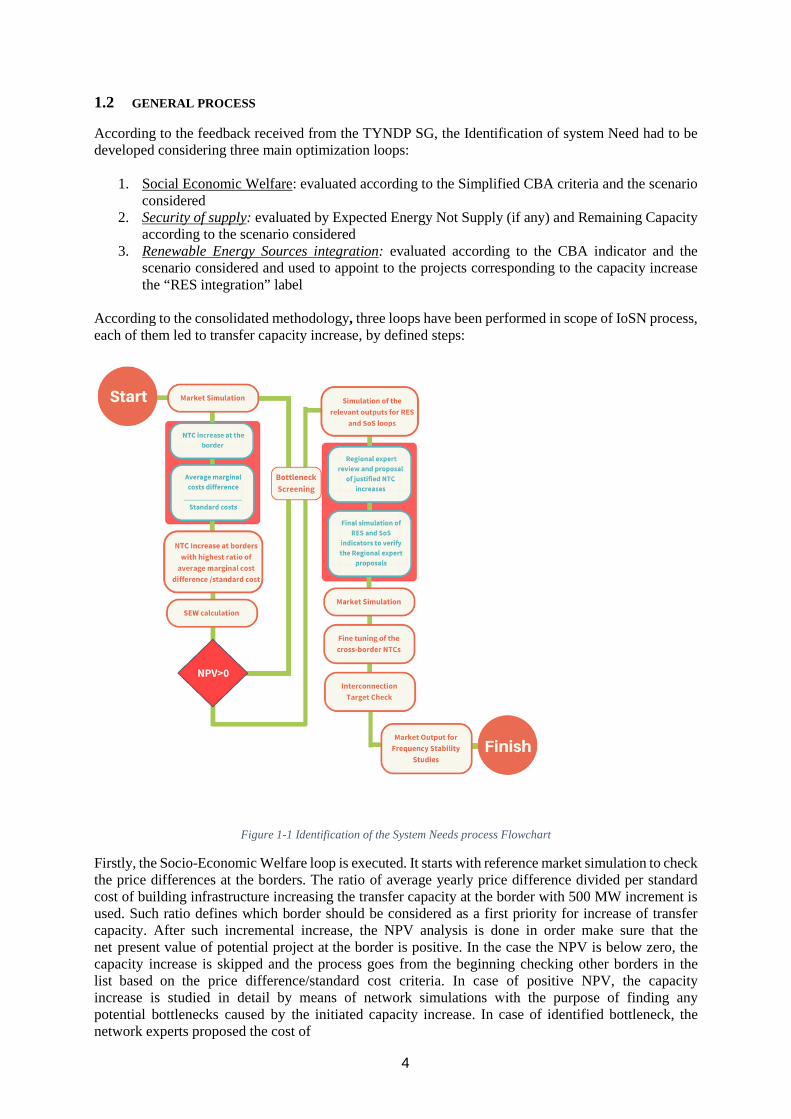
According to the consolidated methodology, three loops have been performed in scope of IoSN process, each of them led to transfer capacity increase, by defined steps:
Figure 1-1 Identification of the System Needs process Flowchart
Firstly, the Socio-Economic Welfare loop is executed. It starts with reference market simulation to check the price differences at the borders. The ratio of average yearly price difference divided per standard cost of building infrastructure increasing the transfer capacity at the border with 500 MW increment is used. Such ratio defines which border should be considered as a first priority for increase of transfer capacity. After such incremental increase, the NPV analysis is done in order make sure that the net present value of potential project at the border is positive. In the case the NPV is below zero, the capacity increase is skipped and the process goes from the beginning checking other borders in the list based on the price difference/standard cost criteria. In case of positive NPV, the capacity increase is studied in detail by means of network simulations with the purpose of finding any potential bottlenecks caused by the initiated capacity increase. In case of identified bottleneck, the network experts proposed the cost of

5
reinforcements/additional internal projects needed to be constructed in order to avoid the overloading at the ENTSO-E network. In case of negative NPV when considering such increase in the standard costs of construction for infrastructure, the border is downgraded in terms of NTC and the market simulation is repeated with transfer capacity increase on the other border.
The SEW loop is processed until the saturation1, the SoS and RES starts. For this loop experts from SDC Regional Groups were involved in order to identify additional transfer capacity increases at the borders based on the preliminary input provided.
Preliminary input consists of:
For RES loop:
Based on the market simulation done using 3 market modelling software tools, the following outputs have been arranged as input for the RES loop:
- Value of dumped energy per market area in the reference case (reference network case);
Threshold: RES (Dumped energy) > 10 GWh
For SoS loop:
Based on the market simulation done using BID market modelling software tool, the following optimization outputs have been produced as input for the SoS loop:
- Remaining capacity for each market area with DSR in relation to peak demand:
𝑅𝑅𝑅𝑅 (%) =𝐴𝐴𝐴𝐴𝐴𝐴𝐴𝐴𝐴𝐴. 𝑐𝑐𝐴𝐴𝑐𝑐𝐴𝐴𝑐𝑐𝐴𝐴𝑐𝑐𝑐𝑐(ℎ) − 𝐷𝐷𝐷𝐷𝐷𝐷𝐴𝐴𝐷𝐷𝐷𝐷 (ℎ) ± 𝐼𝐼𝑅𝑅 𝑐𝑐𝑐𝑐𝐷𝐷𝑐𝑐𝑐𝑐𝐴𝐴𝑐𝑐𝑐𝑐𝑐𝑐𝐴𝐴𝑐𝑐𝐷𝐷 (ℎ)
𝐷𝐷𝐷𝐷𝐷𝐷𝐴𝐴𝐷𝐷𝐷𝐷 (ℎ)
- Remaining capacity for each market area with DSR [MW]
𝑅𝑅𝑅𝑅 (𝑀𝑀𝑀𝑀) = 𝐴𝐴𝐴𝐴𝐴𝐴𝐴𝐴𝐴𝐴. 𝑐𝑐𝐴𝐴𝑐𝑐𝐴𝐴𝑐𝑐𝐴𝐴𝑐𝑐𝑐𝑐(ℎ) − 𝐷𝐷𝐷𝐷𝐷𝐷𝐴𝐴𝐷𝐷𝐷𝐷 (ℎ) ± 𝐼𝐼𝑅𝑅 𝑐𝑐𝑐𝑐𝐷𝐷𝑐𝑐𝑐𝑐𝐴𝐴𝑐𝑐𝑐𝑐𝑐𝑐𝐴𝐴𝑐𝑐𝐷𝐷 (ℎ)
Threshold: RC (%) < 5 %
The fine tuning of the NTC increase defined after the check of SEW, RES, SoS loops has been performed by network modelling experts conducting a year-round load flow analysis to identify the NTC duration curves. The main goal is to reach a more detailed value of NTC for each border that should be increased according to the previous steps.
As a final step, the Interconnection Targets criteria check has been done according to the last methodology proposed by the Commission Expert Group on electricity interconnection targets (ANNEX II) to verify the progress of reaching these targets on 2040 ENTSO-E Scenarios as the output of the IoSN process. The final market simulation results are finally used for the Frequency
1 In IoSN process for the SEW calculation loop, the stopping (saturation) criteria has been identified as the moment when 3/2 market modelling tools operated in parallel do not anymore show the same potential border candidates for NTC increase

6
Stability Studies performed by separate expert team within ENTSO-E (Drafting Team Planning Standards).
1.3. MULTIPLE CLIMATE CONDITIONS USE
As for most market simulations done in the context of the TYNDP 2018, three climatic years were simulated in order to capture the climatic sensitivity on the market modelling results as much as possible.
The climatic conditions (years) used in IoSN process are the same as used at the ENTSO-E scenario building phase (1982, 1984, 2007).
The final indicative input figures for each of the consecutive IoSN loops were considered in the methodology as following described:
• Social Economic Welfare: weighted average of the three years• SoS: minimum over the all three years• RES: weighted average of the three years

7
1.4. COSTS OF CAPACITY INCREASES
Preliminary to start the Identification of the System Needs process, network experts within ENTSO-E have prepared the list of standard costs for each of considered ENTSO-E borders per increment of potential transfer capacity increase (+500 MW, +1000 MW, +1500 MW). In case the border showed higher needs for the transfer capacity increase, the network experts were requested to identify the costs for the further steps (if technically and economically feasible).
Main ideas:
Three steps are defined in the table due to the fact that the costs are non-linear (investment, in general, is cheaper for Delta NTC between 0 to 500 MW than between 500 to 1000 MW).
On the other hand, if there is no predefined project on a border, the goal was to forecast the costs based: • at least on the TYNDP2016 costs• or approximately on the cost of an HVDC/HVAC of 1000 MW between the two countries ;
(indicate the number of kilometres and use the standard cost / km according to the unit costsrecommendations from ACER)
• or more accurate costs because of on-going bilateral studies;
Note: the capacities in MW defined here are Market based capacities, not linked with the physical capacities (delta GTC of projects).
8
2 INSIGHT ON THE NETWORK STUDIES METHODOLOGY In the framework of IoSN, the scope of Network Studies is to analyse, according to the market studies findings, the bottlenecks increase due to most promising borders in terms of transfer capacity increase and identify the candidate projects which would achieve such potential transfer capacity increases in a feasible and cost efficient manner.
These candidate projects, if promoters plan to include them inside the TYNDP2018 list, are further analysed in the CBA phase of the TYNDP 2018 according the CBA 2.0 Application guidelines.
The market study team provides outputs of simulations after each transfer capacity increase per border. In a meshed area (like FR-BE-NL-LU-DE), loop flows can be as high as market flows, and even in opposite direction, varying hour by hour. It is therefore crucial that Market results, providing area balances, can be translated into physical flows in order to show where reinforcements are needed.
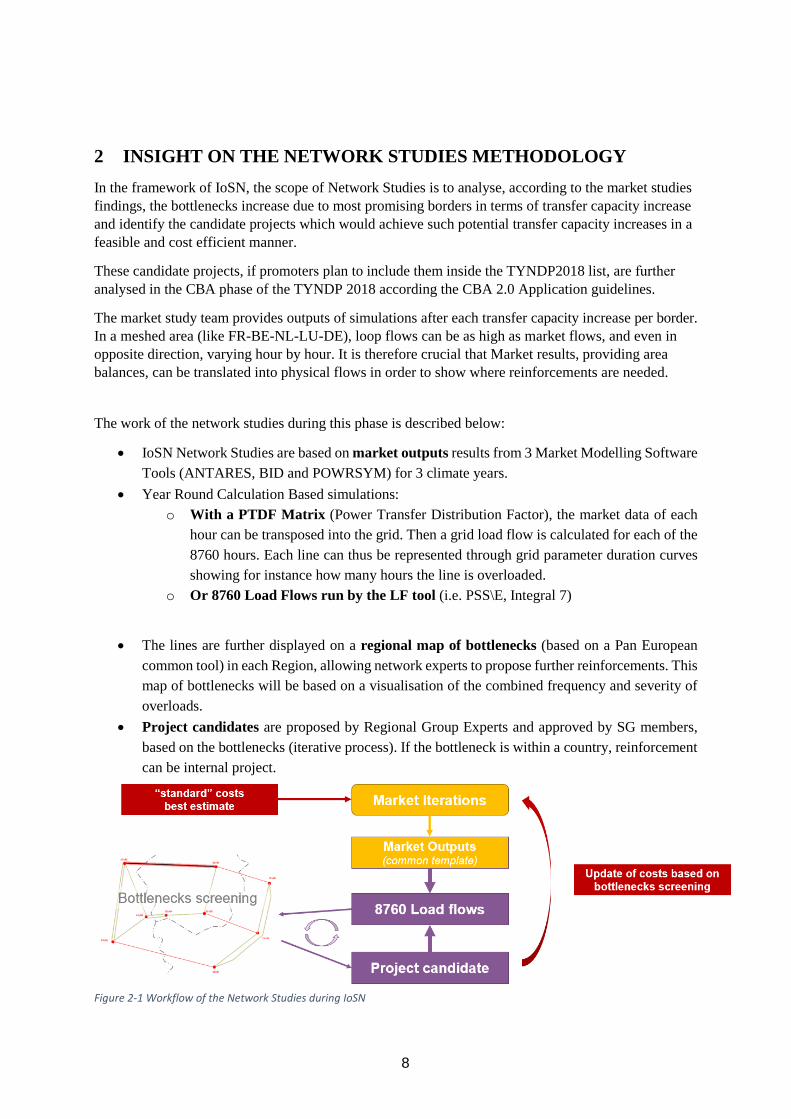
The work of the network studies during this phase is described below:
• IoSN Network Studies are based on market outputs results from 3 Market Modelling SoftwareTools (ANTARES, BID and POWRSYM) for 3 climate years.
• Year Round Calculation Based simulations:o With a PTDF Matrix (Power Transfer Distribution Factor), the market data of each
hour can be transposed into the grid. Then a grid load flow is calculated for each of the8760 hours. Each line can thus be represented through grid parameter duration curvesshowing for instance how many hours the line is overloaded.
o Or 8760 Load Flows run by the LF tool (i.e. PSS\E, Integral 7)
• The lines are further displayed on a regional map of bottlenecks (based on a Pan Europeancommon tool) in each Region, allowing network experts to propose further reinforcements. Thismap of bottlenecks will be based on a visualisation of the combined frequency and severity ofoverloads.
• Project candidates are proposed by Regional Group Experts and approved by SG members,based on the bottlenecks (iterative process). If the bottleneck is within a country, reinforcementcan be internal project.
Figure 2-1 Workflow of the Network Studies during IoSN

9
Point in Time based simulations are possible if there is at least 50 Points in Time per climatic years to match quite correctly the “real” physical flows duration curve during the year.
2.1 LOAD FLOW SIMULATIONS
First of all, the main critical activities of the network simulation is an AC convergence after a Point in Time is implemented. In light of the time at disposal performing these amounts of analysis, it is admitted to perform DC simulation as a fall-back solution.
Bottleneck identification: The following limits for N and N-1 conditions of the grid have to be met. In order to evaluate the importance of bottleneck, it is suggested to use following “FS²” criteria, where:
• F is the frequency of the occurrence (% of the year);• S is the severity of the occurrence (% of overload, so be defined as the % of load above the
threshold). It can be defined for N or N-1 situation.
Thresholds of FS² were defined to distinguish occasional bottlenecks and structural bottlenecks.
To illustrate the FS² the thresholds as shown on the Figure 2-2 in N&N-1 condition were used: - Green : FS² = 0, no bottlenecks- Yellow : occasional bottlenecks : 0 < FS² < 1000- Red : Bottlenecks 1000 < FS² < 8000 (20% Frequency * 20% Severity * 20% Severity)- Red highlight red : bottleneck in 8000 < FS² < 27000- black highlight red : bottleneck in N > 27000

10
Figure 2-2 Example map of bottlenecks
Ideally, the FS² criteria is calculated with a year-round calculation.
The reinforcement projects selection:
• will be done considering the gravity and frequency of the bottlenecks;• near the border of the increased GTC considered first;

11
3 APPENDIXES
3.1 ANNEX I
PEI calculation
The PEI will be calculated considering:
• 25 number of years;• 4% discount rate;
According to the recommendation of ACER also in use in the CBA methodology, especially will be considered:
• SEW as benefit (according to the CBA the only other monetized benefits are losses, notconsidered in IoSN process);
• Standard cost as described in 1.4.

12
3.2 ANNEX II
2030 Interconnection target Check
The Interconnection target check is performed based on the methodology proposed by the Commission Expert Group on electricity interconnection targets and specified in the report “Towards a sustainable and integrated Europe” published in November 2017 and is applied to the resulting 2040 IoSN Scenarios.
Reference to the report can be found in the following link: https://ec.europa.eu/energy/sites/ener/files/documents/report_of_the_commission_expert_group_on_electricity_interconnection_targets.pdf

13
3.3 ANNEX III
SoS, according to the SG indications will be the first indicator to be considered in the IoSN methodology. Due to the rules on the base of scenario building it will be not possible to highlight ENS values (scenarios will be adequate) and considering that deterministic approach will be applied in the IoSN (no probabilistic indicators) it is necessary to consider other possible solutions. In the former ENTSOE SOAF report was defined:
• Spare Capacity should be sufficient to cover a 1% risk of shortfall on a power system, that is, to guarantee the operation on 99% of the situations considering random fluctuations of Load and the availability of generation units
• Spare Capacity should be 5-10% of NGC
• BID tool (at least) can provide directly the Remaining Capacity optimized as following 𝑅𝑅𝑅𝑅 (ℎ) = 𝐴𝐴𝐴𝐴𝐴𝐴𝐴𝐴𝐴𝐴. 𝑐𝑐𝐴𝐴𝑐𝑐𝐴𝐴𝑐𝑐𝐴𝐴𝑐𝑐𝑐𝑐(ℎ) − 𝐷𝐷𝐷𝐷𝐷𝐷𝐴𝐴𝐷𝐷𝐷𝐷 (ℎ) + 𝐼𝐼𝑅𝑅 𝑐𝑐𝑐𝑐𝐷𝐷𝑐𝑐𝑐𝑐𝐴𝐴𝑐𝑐𝑐𝑐𝑐𝑐𝐴𝐴𝑐𝑐𝐷𝐷 (ℎ)
• In this respect it is also necessary to consider that o the NGC, due to the high RES penetration, the threshold could be very high o the main reference for SoS is load, not generation