Embed Size (px)
Citation preview

-°
NASA-CR-198050
FINAL TECHNICAL REPORT
/I_ "3.//"_:/?-.'-
Kinetics of Diffusional Droplet Growth in a Liquid/Liquid Two-
Phase System
M.E. Glicksman, V.E. Fradkov,Materials Engineering DepartmentRensselaer Polytechnic Institute
(NASA-CR-198050) KINETICS OF
OIFFUSIONAL _ROpLET GROWTH IN A
LIQUID/LIQUIO TWO-PHASE SYSTEM
Final Technical Report (Rensse|aer
Polytechnic Inst.) 26 p
G3/34
N95-24221
Unclas
0045324r
NASA, agreement No. NAG8-864
January 1, 1995
//
/
//
https://ntrs.nasa.gov/search.jsp?R=19950017801 2018-06-30T16:37:26+00:00Z

Introduction
Precipitate aging in thin films is often characterized by mixed-dimensional coarsening, when 3-D
precipitates interact through 2-D diffusion restricted to the film plane. Such processes can be physically
modeled by arranging a distribution of liquid droplets embedded in an isolated fluid layer. The average
size of the precipitated particles increases under the capillary driving force. Larger particles grow on
account of the smaller ones which shrink and vanish. This process occurs in solids, liquids and even
gases, having similar phenomenolog)/and asymptotic scaling behavior. The mechanism of mass transfer
among the particles is diffusion in the interparticle matrix space.
Although the driving force and mechanism of the process are well known, there are many
additional factors making theoretical description of the coarsening difficult. One such factor is gravity. In
a liquid or gas matrix with particles present having a different mass density gravity leads to sedimentation,
i.e. settling of the particles rather than diffusion-limited coarsening. To prevent such sedimentation,
experiments should be performed in microgravity. An alternative is to match the densities of the matrix
and the particles as closely as possible.
A new powerful experimental technique based on holographic observations, developed at the
NASA Marshall Space Flight Center, now permits observation of small liquid droplets coarsening. This
technique was developed and used for mixed-dimensional coarsening studies by our co-investigators Drs.
D.O. Frazier, W.K. Witherow, B.R. Facemire, J.P. Downey, and I.R. Rogers, of the Space Science
Laboratory. Experiments were conducted on an isopycnic two-phase alloy of succinonitrile and water,
annealed isothermally over a four-month period. The succinonitrile-rich droplets precipitate from a water-
rich liquid matrix having a density very close to that of the droplets. The matrix and droplets, however,
have different optical indices. The results of these experiments, along with the results of computer
simulation based on the quasi-static diffusion approximation developed at Rensselaer are reported below.
These results were published recently in [1, 2]. Copies of these papers are attached to this report (see
Appendices I and 17).
2

Experiment
The alloy selected for experiments exhibits total mutual solubility at relatively high temperatures,
and a critical point and miscibility gap at lower temperatures. Small (10 to 50 ktm) droplets with uniform
shapes of spherical caps precipitate on the walls of the test cell. The isothermal annealing causes
coarsening by diffusion among the droplets. The distance between the front and the back cell walls is 100
gtm, which is smaller than a typical distance between the droplets. The boundary conditions at the walls
impose a zero normal diffusion flux. Such a geometry and the boundary conditions imply that the
diffusion field among the droplets may be considered as two-dimensional. For three-dimensional objects
exchanging atoms by two-dimensional diffusion field, the dimensionality of the problem suggests the
scaling behavior R"* o_ t, where R" is a characteristic linear scale of the system, and t is the time [3]. For
example, R may be chosen as the average radius of the droplets. Fig. 1 shows the average radius of the
droplets vs. time. Because the total volume of the system is constant, NR 3 = const, where N is the
number of droplets. The consequence of this scaling behavior is that the number of droplets N depends on
time as N "4j3 o_ t (see Fig. 2).

8.0 10 I
7.0 10 I
6.0 10 I
=t. 5.0 10 a
,,q,
I_ 4.0 10 a
3.0 10 6
2.0 10 8
" 1.0 101
00
i i
I I i Z !
4.0 10 _ 8.0 10° 1.2 107
time (sec)
Z
0.016
0.014
0.012
0.01
0.008
0.006
0.004
0.002
00
• • J
Yt ] • ]12.0 10 ° 4.0 10 6.0 0 e 8.0'10 ° 1.0 10 7
time (sec)
Fig. 1. Scaling of average droplet radius with time. Fig. 2. Scaling of number of droplets with time.
The holographic experimental technique permits, for the first time, one to obtain trajectories (time
dependencies of the particle size) for each individual droplet (see Appendix I). This information allows the
direct comparison of experiment with the theoretical calculations.
Theory
General formulation
The theoretical analysis of coarsening of the droplets requires solving the moving boundary
diffusion problem (Stefan problem) with boundary conditions at the test cell walls and at the surfaces of
the droplets. The boundary condition imposed on the droplet surfaces is given by the Gibbs-Thomson
equilibrium capillary equation
kT '
4

' ( (
wherec(R) is the equilibrium concentration at the surface of the droplet with radius R, co is the equilibrium
concentration for a planar interface, _, is the surface tension, f_ is the atomic volume, k is the Boltzmann
constant, and T is the temperature. For a large number of droplets, even a numerical solution of this
extremely complex problem appears numerically unrealistic. However, if co is much lower than the
concentration inside the droplets then the characteristic diffusion time is much less than the time needed for
significant change of the droplet radius. As a consequence, one can, following Todes [4], substitute theOc
Lapacian equation V2c = 0 for the diffusion equation, _ = DV_c. This concept of quasi-stationary
diffusion was used later by Lifshitz and Slyozov [5], Wagner [6] and others in the formulation of classical
coarsening theory.
Even after such a large simplification, the problem still remains too difficult for direct numerical
analysis. Each droplet surface represents a continuum of sources/sinks for solute atoms. As the
concentration field obeys the Laplacian equation, one can use the multipole series expansion for
approximating the exact boundary conditions at the droplet surfaces. In two dimensions, the multipole
series is given by
d.7
c(7) = _'+ qlnr +--_+...
The larger is the interdroplet distance as compar_t to the droplet radii, the fewer is the number of terms of
the series needed. The logarithmic term is referred to as a "monopole" term, the next one as a "dipole"
term, etc. It is important to mention that the rate of the droplet size change is defined by the monopole
term alone:
dR = _ 2 zr _ DcoH__2 'dt ' 3a "
!
where t_ is a geometrical factor depending on the contact angle, and H is the distance between the test cell
walls.
t
Monopole Approximation
The general two-dimensional solution of the Laplacian equation in the monopole approximation is
c(7)=_-CoZqiln ,i=l Ri
where 7/and Ri axe the position of the center and the radius of the i-th droplet, respectively, and N is the
number of droplets. To obtain the values of (N+I) constants of integration _" and qi we use the Gibbs-
Thomson equilibrium boundary conditions at the particle surfaces. Neglecting the droplet radius as
compared to the interdroplet distance one substitutes the position at the surface of the droplet by the
position of its center. This procedure provides a linear set of N equations. The missing equation from the
N+I solution set corresponds to the boundary condition at infinity. In our treatment we used a mass
conservation equation instead, which provides the last equation needed to determine the solution set (see
Appendix I1").
The monopole approximation provides the rates of the droplet radii change depending on the
positions of the individual droplets. The values of qi' s are determined by the diffusion fields created at the
vicinity of the i-th droplet by the other droplets. However, we neglect the size of the droplet compared to
the interdroplet distance, resulting in the neglectof the gradients of the diffusion field. Note, that in two
dimensions the monopole term changes very slowly, as a logarithmic function. The next term in the
expansion is a dipole term accounting for the gradients in the vicinity of the droplets. This term decays as
slowly as the reciprocal of the distance to the center of the droplet and, therefore, may be important in
droplet systems with higher volume fractions.
Dipole Approximation
The general solution of the Laplacian equation incorporating the dipole terms is given by
c(?)=_'+Co_f qjln F-_'] ct)'(_-_) /
;t- --4-,+ )
6

!
.o
To satisfy the equilibrium boundary conditions for any direction of ,_,, the following two equalities have
to be met:
IkT Ri
and
Together with the mass conservation condition, this results in the full set of (3N+l) linear equations for
qi's, d, 's and _" (see Appendix ID.
During the numerical simulation, the set of ordinary differential equations for the droplets radii is
solved using a fourth-order Runge-Kutta algorithm. The values of the qi's are obtained at each time step
by solving the corresponding linear set of equations for the monopole dipole approximation. The
disappearance of a shrinking droplet causes a singularity to occur in the flux values. In order to deal with
these singularities numerically, the time step is adjusted by estimating the shortest droplet lifetime. The
droplets are eliminated from the calculation when they fall below the threshold size being much smaller
than the average droplet size in the system at that instant. The entire numerical program was tested and
verified using a two-droplet case permitting the analytical solution.
Results and Discussion
The initial state for the simulation is taken from the experimental data described above. To find the
relation between the experimental time t and the computational dimensionless time z we used the time
dependence of the number of droplets shown in Fig. 2. The results of both monopole and dipole
calculations fit the experiment well for some period of time. The deviations observed for larger times
might result from the accumulated influence of the droplets located beyond the experimental field of view.
As we already mentioned, in two dimensions the dependence of interaction between the droplets on the
distance is rather subtle, and the interacting particles are not required to be located close to each other.
!
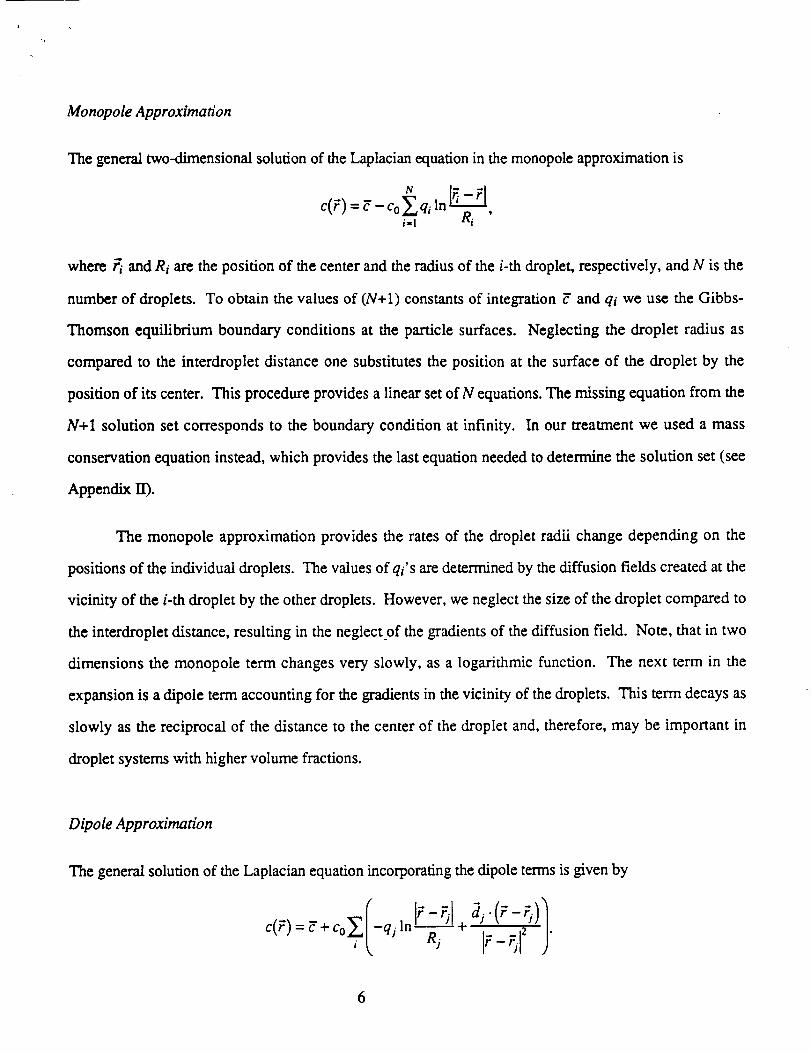
In contrast with the global behavior for the droplet population, the results of the comparison between
the experiment and the calculations for individual droplet evolution vary widely. In many cases we
observe good agreement between the experiment and both dipole and monopole approximations, as shown
in Fig. 3. In some cases the dipole calculation deviates from the monopole calculation and the dipole
results are closer to the experimental measurements (see Fig. 4). In the third group we find large
deviations between the calculations and the experimental results (see Fig. 5). We suggest that the cases in
which the dipole calculation results diverge from the monopole calculation the diffusion field contains a
strong gradient at the vicinity of the droplets. The cases with poor agreement between the calculations and
the experiment appears to be caused by the uncontrollable influence of the droplets located beyond the
experimental field of view.
0 060 60
50 50
.... i_f---i-. oooooo,:) -. .
/ "_ 1_12s (monopole) o 137 (expedrnent)
2o r \_ 1_,,4 (_,po,e) 2o --3. (mo.o_,e) _.
__ _137 (monopole)
1 0 10 _36 (dipole)
_137 (dipole)
0 0
0 2.3 10 e 4.7 10 a 7.0 10 e 0 5.0 108 1.0 107 1.S 107
time (sec) time (sec)
Fig. 3. Typical individual droplet evolution in thecase of a good agreement between the experiment and
the calculations
Fig. 4. Typical individual droplet evolution in thecase when the dipole approximation shows betteragreement with the experiment as compared to the
monopole approximation.

!
7O
6O
5O
40
20
10
0
i i
0 0
o 148 (experiment) _ \
-- 80 (monopole) _ I
...... 148 (momopole) _ I
--80 (olpol.) [ I
---- 148.(dipole) ] I
i L i i
4.0 106 8,0 106 1.2 107
time (sec)
Fig. 5. Typical individual droplet evolution in the case of a bad agreement between the experiment andthe calculations
References
1. J.R. Rogers, et al. J. of Electronic Materials, 23(10), 841 (1994).
2. V.E. Fradkov, et al. 3". of Electronic Materials, 23(10), 849 (1994).
3. W. W. Mullins. J. Appl. Phys., 28(3), 333 (1957).
4. O.M. Todes. J. Phys. Chem (Soy.), 20(7), 629 (1946).
5. I.M. Lifshitz and V. V. Slyozov. J. Phys. Chem. Solids, 19 35 (1961).
6. C. Wagner. Z. Electrochem., 65 581 (1961).
9

Appendix 1

JournM ofE]_tromc Ma_n-ls. VoJ. 23. No 10. 1994
Coarsening of Three-DimensionalTwo-Dimensional Diffusion Part I.
Droplets byExperiment
J.R.ROGERS
NationalResearch Council,Space ScienceLaboratory,NASA Marshall SpaceFlightCenter,Huntsville,AL 35812
J.P.DOWNEY, W,K. WITHEROW, B.R.FACEMIRE, and D.O. FRAZIER
Space ScienceLaboratory,NASA Marshall Space FlightCenter,Huntsville,AL 35812
V.E. FRADKOV, S.S. MANI, and M.E. GLICKSMAN
Rensselaer Polytechnic Institute, Troy, NY 12180-3590
An experimental study of diffusional coarsening, or Ostwald ripening, in aliquid-liquid two-phase system is described. An experiment performed at itsisopycnic point, 42°C, allowed observations for the long times required toinvestigate coarsening. A holographic technique was instrumental in this work.Holograms taken in situ permit investigation of details regarding both theinfluence of local environmental conditions on individual droplet size historiesand measurement of global averages. This study utilized a I00 _m pathlengthtest ceil. The discrete phase was nucleated on one wall of the cell. Thisconfiguration resembles island formation in thin film growth. Observation ofOstwald ripening over a period of I × 10; s (-4 too.) reveals that droplet numberdecays as t -°-733and the average radius increases as t -°_2_=,in the asymptotic limit.This shows good agreement with theoretical predictions for diffusional growthof spherical caps on a two-dimensional substrate which is a valid approximationfor the geometry of this experiment. Part I of this paper describes the experimen-tal results. Part II discusses a numerical model for droplet growth in acomparison with the experimental results.
Key words: Diffusion, holography, kinetics, microstructure coarsening.Ostwald ripening, phase transformation
INTRODUCTION
Ostwald ripening is the process by which largerdroplets grow at the expense of smaller ones, by"diffusion of mass away from droplets below a criticalradius toward ones above this critical size. The phe-nomenon is important in many disciplines. Of par-ticular interest to materials processing is its influ-ence on the time dependence of droplet (or particle )size distributions of a precipitated phase.
The objective of this work was to perform an ex-perimental study of the development of mi-crostructures and the growth of a second phase in a
_Received March I, 1994: revised June 8. 1994_
two-phase system. To a large extent, growth anddistribution of the discrete phase determine the me-chanical and electronic properties of an alloy. A de-tailed understanding of microstructure is essential topredicting the behavior of a material. For example.the formation and growth of clusters in semiconduc-tor thin film deposition result in microstructureswhich dictate film properties in a device application.Most modeling and experimental studies focus on theaverage particle and the late stages of growth pro-cesses. However, the behavior of the "weakest link"rather than an average property is fundamental todeveloping predictability regarding practical prob-lems such as fracture analysis in metal fatigue. Theunique capabilities provided by holographic tech-
999

I000
Rogers.... 'ney,Witherow. Facemire.Frazier.Fradkov. Mani. and Glicksman
Fig. 1. Projected image of the test cell. The whi_e OOXindicates the area
selected for analysis.
P. 760 mm Hq
i
10 4
i
I
(_ A0 20 30 40 .50 60 "_3 B0 9" tOO
Mo_ Fraction Water
Fig. 2. Succinonitrile,waterphasediagram:T and T.=orepresenttheconsoluteandexpenmenttemperatures,resoectlvety.
niques allow detailed analyses of both local dynamicbehavior within the context of a particle ensembleand resulting microstructures from a statistically
significant population.The theoretical analysis of coarsening of the drop-
lets requires solving the moving boundary diffusionproblem (Stefan problem_ with boundary conditionsat the test cell walls and at the surfaces of the
droplets. The boundary condition imposed on thedroplet surfaces is given by the linear form of theGibbs-Thompson equilibrium equation
c(R)=c,(1 -L (1,' _ R,'
where c(R} is the equilibrium concentration at thesurface of the droplet with radius R, % is the equi-librium concentration at the plane interface, and L isthe Gibbs-Thompson characteristic iength, given by
L= 2"/_ (2JkT '
L020 T
1,015 -1
1.010 i
m'- I1.005 -
_ 1.00(:)-
_ 0.995
0.990
0.985 -"
0.980
15 2_ 25 30 35 40 45 50 55 "3C
Temperature, :C
Fig. 3. Densities of equilibrium phases in succinonitrile/water asfunctions of temperature.
where 7 is the interfacial tension, _ is the molecularvolume, k is the Boltzmann constant, and T is the
temperature.In their classical studies of the ripening process
Lifshitz, Slyozov, and Wagner (LSW) L2 and Todes _
applied the steady state approximations to the diffu-sion process. This approximation is valid for the easeof very low supersaturation where the characteristicdiffusion time is much less than the time required for
a significant change in the droplet radius. Using thisapproach, they determined global scaling laws for theease of three-dimensional diffusion processes. The
length scale for the ripening process can be consid-ered to be the average droplet size which predictably
grows as t L3 for the latter stages of a three-dimen-sional diffusional growth. The decrease in the numberof droplets as a function of time for the three dimen-sional case is given by N(t) ¢- t-k _.2 Experimentalinvestigations and numerical simulations support
this scaling prediction.Ripening processes follow different scaling laws in
a two-dimensional system. An example of this is thegrowth of spherical caps on a two-dimensional sub-strate. Theoretical arguments by Chakraverty for
multiparticle diffusion between three-dimensional
particles with mass transport restricted to two-di-mensions predict N(t) o, t-* 4 and that length scales ast_.4.4 Slyozov obtained the same result for interactingthree-dimensional clusters located on a planar sub-
strateJ Both Chakraverty and Slyozov utilized themean-field approximation for their two-dimensionalconcentration field and assumed implicitly a iowvolume fraction of droplets. Their prediction has been
• observed experimentally. _ Part II of this paper de-scribes the development of a numerical model of
three-dimensional droplet growth due to two-di-mensional diffusion.
This study employed holography to record the rip-
ening processes in the experimental test cell. Theholograms, permanent records of the wavefront, maybe reconstructed and the wavefront precisely repro-duced. The reconstructed wavefront gives an exact
three-dimensional reproduction of the test cell con-

CoarseningofThree-DimensionalE letsbyTwo-DimensionalDiffusion:Part[. Experiment
tents at the instantof exposure.Eachhologramal-lows measurement of all the droplet radii in the testcell at a given instant of time. During reconstruction,the hologram image can be moved with relative ease,and the entire test cell volume can be investigated bystepping the field.of-view through a magnified recon-structed image of the test cell. A square region con-sisting of 25 fields of view (about 5% of the recordedtest cell volume), initially populated with 187 drop-lets, comprised the area selected for analysis. Figure1 shows a projection of the test cell indicating the areachosen for detailed analysis. It is important to notethat the holographic records archive a great deal ofadditional data.
MATERIALS AND METHODS
All theoretical models of the Ostwald ripening con-sider growth only due to diffusion. A test of this theoryrequired an experiment devised to study nearly purediffusional growth by simultaneously eliminatingcoalescence and convection. Solutions ofsuccinonitrile/
water (SCN/HoO) offer an experimentally convenientmodel system i_or the study. Figure 2 shows the phase
diagram for SCN/HoO.: Above the critical consolutetemperature, 56°C, _CN/H_O forms a single phase.
When compositions spanning the miscibility gap ofthe phase diagram are cooled through the coexistencecurve, the system separates into droplets of one liquid
dispersed in another. Unlike metallic alloys, both thedroplet and surrounding phases are transparent, andthe growth of the former may be followed by opticalmeans in situ. Moreover, because the phase separa-tion occurs near room temperature, elaborate fur-naces for temperature control are not required aswould be the case for metals. These experiments were
performed near the isopycnic temperature of approxi-mately 42°C IFig. 3). The droplets were located on the
inside wall of a 100 _m pathlength optical cell. Duringthe observation period which spanned about fourmonths, the droplet positions remained unchanged.
The SCN/I-_O system is well characterized as atransparent model for observations of metallicmonotectic solidification phenomena 8 and, therefore,was the system of choice for the Ostwald ripeningstudies. Succinonitrile was vacuum-distilled twice at
a measured pressure of 10-20 mm Hg. Water wasdistilled and filtered through a Millipore Milli-Q wa-
ter system giving a resistivity of 18 Mohm cm. Ap-proximately equal volumes of the two componentswere mixed in a waterjacketed separatory funnel andallowed to equilibrate at about 45°C. Aliquots of thewater-rich phase extracted from this solution, when
cooled at 42°C, resulted in SCN-rich droplets. Thisphase was selected to assure that the nucleatingphase would not wet and spread on the quartz test cell
walls. Figure 4 shows nonwetting SCN-rich dropletson a quartz plate.
Experiment Test Cell and Apparatus
A commercially available micro cylindrical spectro-photometer cell shown in Fig. 5 having an optical path
[ oo I
length of 100.am yielded particle densities low enoughto allow holographic imaging with good resolution." A6 in. length of glass tubing attached to the cell fill portpermitted sealing. Fillingthe cell consisted of extract-ing the lower phase from the reservoir thermostatedat 45°C in a heated pipette, wiping the pipette toremove excess upper phase, and expelling the solu-tion into the cell, while maintaining homogeneity bygently heating the pipette with a hot air gun. After thefilling operation, the glass extension tube was sealed.Submerging the cell body in an ice bath prevented thesolution from significantly changing composition due
to vaporization during the sealing procedure. Heatingthe cell to 46_-C for 48 h prior to the experimentassured solution homogeneity. The cell was trans-ferred to the isothermal test chamber held at 46.4:C.
Scattering of the laser light during a slow quenchdetermined the actual consolute point to be 45.01°C.After reheating to 46.3°C for 24 h, stepwise quenchinginto the miscibility gap initiated the experiment.Observations taken during the quench assured thelow volume fraction of discrete phase required foroptical resolution considerations and for comparisonto theo_'. A test chamber temperature of 42.5:C, closeto the neutral buoyancy temperature, wielded an
ii
Fig. 4. Photograph of succinonitrile-rich droplet On Quartz,
/"
/
f
]
fIi
!i •
- _00 am -
,i[,1
22 mini| ;_ 16 rr,-T_
_ T
I
i
i
Fig. 5. Tes: :eil scflernal_c sr'lowlr_g nucleated orooletS o_ t-e '_'ont wallof the ce;

_002
u _5d
J
43-
42
20 40 60 8: 100
Fig.6. Temperature historyfor the duration of the experiment.
SuDpotl
D_g_tal Roo
Thetm°m_ L
_ Sllrrer
_ II ,(---,. Heater
liJ! , - s,,.o,o.m
- ....._ . .-- Opt,cal
"" " Window. t -/
'L
it
+
Starn_ess S{'ee_'
Chamber
J
Fig. 7. Schematic of isothermal test chamber.
appropriate volume fraction and good thermal con-trol. The temperature profile for the duration of theexperiment is shown in Fig. 6.
Figure 7 is a schematic of the experimental ap-paratus. The test cell is positioned in a temperature-controlled water bath, an insulated stainless steelchamber with optical _indows. A 0.2 _m filter ele-ment removed particles from the bath water thatwould interfere with holographic images. A ther-mistor in the bath was one leg ofa ESI Model 250DEWheatstone bridge and served as the feedback mecha-nism to provide control to a resistance heater in thebath. A Brookfield counter-rotating stirrer providedadequate stirring without entraining air in the water.Using this system, temperatures in the bath werecontrolled to 0.030°C over 94% of the experiment and0.002:C for the first week of the 112-day observation.Performing the experiment near the isopycnic tem-perature minimized the effects of buoyancy.
Holographic Data
The time interval between holograms was initially2 min. As the rate of change in droplet size distribu-
Rogers. Downey. Witherow, Facemire, Frazier,
Fradkov. Mani, and Glicksrnan
tion decreased, the time interval between hologramsincreased to two per day and finally to one per day.Each hologram is a record of the wavefront receivedby the film and contains all the optical informationfrom the test cell for the instant in time when thathologram was made. When the hologram is recon-structed, the entire volume between the optical flatsof the cell can be examined using various opticalanalysis tools which were not compatible x_2th the testcell in situ. Details regarding the holographic con-struction and reconstruction systems can be found inWitherow 9 and Witherow and Facemire. _'-'This holo-
graphic system gives a resolution ofabout 5 _Jm for thereconstructed image.
Reconstructed images from the holograms projectedon the lens ofa Dage MTI 70D video camera providedinput for image analysis. The number of video fieldsrequired to span the diameter of the test cell in thereconstructed image and measurement of the test celldiameter determined the magnification factor forvideo-based droplet measurements. Using this mag-nification, the image of a single field comprised anarea of 552 × 407 _m. Although the entire volume isavailable for study, the investigation examined arepresentative region of the test cell indicated in Fig.1. One aim of this investigation, exploration of localinterparticle interactive effects on the ripening pro-cesses, dictated use of contiguous rather than randomfields. A 5 by 5 field section (25 fields), 5.617 x 10epm -_,represents a volume of 5.617 x 10⁴ cc, approximately5c_ of the observable volume located within the opticalviewing area of the test cell. Virtually all dropletsfocus in the same plane, indicating that they arelocated in the same plane. Further, they do not moveat all over the lengthy duration of the experiment.indicating attachment to the same wall of the cell.This is to be anticipated because during the quench.the front wall of the test cell experienced the coolertemperature first because of reduced cooling fluidcirculation on the sheltered back wall, Fig. 5). Thestagnant fluid in the sheltered portion of the test cellcooled more slowly than the front wall. Therefore, dropletsnucleated on the cooler, front face of the test cell.
RESULTS AND DISCUSSION
Of the 152 holograms obtained during the exper-iment, the first 25 were taken as the cell cooled to theoperating temperature. 42.5:C. The remaining holo-grams at this temperature, clearly show the ripeningof the droplet phase over time. Figure 8 shows a seriesof photographs from reconstructed holograms. Thedata reported here reflect measurements taken from14 of the 152 holograms, selected at intervals span-ning the duration of the experiment. Tab}e I lists thehologram number and recording time for each holo-gram studied. Recording time indicates time elapsedsince initiation of the quench sequence.
Calculations using density data of compositions(majority phase, 93 mole_ H:O: minority phase. 48mole_ H_,O) taken from the phase diagram tie line atthe experiment operating temperature indicate a

Coarsening of Three-Dimensional Drov .cs byTwo-Dimensional Diffuszon: Part I. Experiment I003
volume fraction of the succinonitrile rich droplet phaseof approximately 2.75_. The emphasis of this study isthe evolution of a droplet size distribution due to
diffusional growth. Therefore, quantitative analysisof this long-term growth process could not begin untilthe volume fraction of the discrete phase became
constant. Figure 9 shows the volume of the dropletphase in the _dewing volume as a function of time.Calculation of total droplet volume assumes uniformshape for the droplets. This approximation is consis-tent with observations of wetting of succinonitrile-rich phase on quartz as shown in Fig. 4. Figure 9indicates that the constant volume condition is at-
tained by the second observation (1.2 days). Onceconstant volume is achieved, the average total vol-
ume of the droplet phase within the viewing volumedid not exceed 1.4 x 10 _ cm a, the maximum deviationfrom this value is 5%. This corresponds to a maximumvolume fraction of 2.5c'c. This is, within the limits of
experimental error, in good agreement with the vol-ume fraction of 2.75c'c. calculated from the phasediagram.
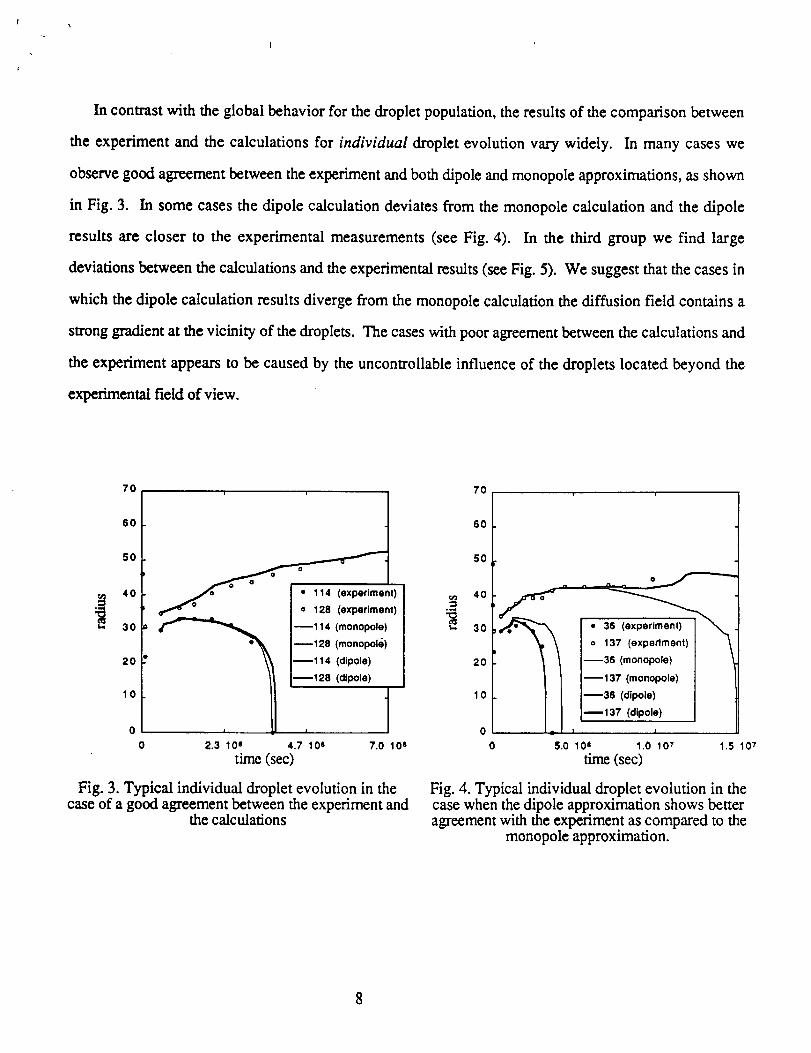
Theoretical analysis of ripening processes generallyconsiders the long-time asymptotic behavior. Figure10 is a plot of the number of droplets within the fieldof view as a function of time. Linear regression per-formed on the observations indicates that in the later
stages of the experiment, the slope of the curve achieveda value of-0.733, with a correlation coefficient of0.994. The geometry of our experiment is representedby spherical caps located on a substrate interactingthrough two-dimensional diffusion fields, as indi-cated in Figure 5. Chaklaverty 4 developed expres-sions for growth of a discrete phase of spherical capson a two-dimensional substrate due to surface diffu-
sion. His analysis indicates that N scales as t -3'4. Ourexperimental results for the rate of droplet decay arein good agreement with this value.
Figure 11 shows the change in average dropletradius as a function of time. During the reportedperiod of observations, a I38% increase in averageradius is realized. The analysis of Chakraverty 4 pre-dicts that r scales as t _ in the asymptotic limit. The
Fig. 8. Photogral:)hsfrom fC::" holograms of the same field-of-viewwhichshowd_)en=ngeffectsovera periodof severalmonths.
plot of r vs time shown in Fig. 12 reveals that in theasymptotic limit (after -2.5 weeks) the slope of thebest fit line through these data is 0.247 with a corre-lation coefficient of 0.986. Again, our experimentaldata show agreement with the trends predicted bytheory.
Statistically. self-similarity is a hallmark of theOstwald ripening effect. 1.2.6Theoretical analysis shows
I
Table L Numbers and Recording Timefor Studied Holograms
Hologram Number Time, Seconds
20 1.6 x I0 _30 1.06 x 10 s40 5.4 x lOs50 1.07 x 10661 1.5 x 10670 2.0 x l0 s80 2.5 x lOs90 3.1 x I0 s
100 3.7 x 10⁴II0 4.5 x IOs120 5.7 x i0 s130 7.2 x 10 s140 8.1 x I0 _152 9,8 x 10⁴
16
T_x
)C_
15-
14-
13-
12-
11
10
9-
8
7
9 1'0 I'1 1'2 1'3 1'4
Lnt,$
Fig. 9. Total droplet volumeasa function of time.
5.1
4.1
3,1
mmm• n
2.!
#
11,5 :2.5 13,5 14.5 15,5 _55Inl
F_g.10.Numl_erof dro01etsintheselected area as a function of t_me,
1004
55'
45"
40"," 35"
30"
25
20o _ _ _ _ _ _
t_n_l,5 x !
Fig. 11. Average raclius as a function of time.
4
3.8
3.6
3.4
3.2
3
2.8
9
= / , Slope 1 0.247 J
10 11 12 13 14 15 16[ni.$
Fig. 12. Ln average radius as a function of Ln time.
,,7
that a scaled-time-independent droplet radius distri-bution function exists2 .n Morphological configura-tions during Ostwald ripening should remain statis-tically equivalent when examined under appropri-ately scaled magnifications. Figure 13 shows photo-graphs taken directly from selected holograms duringthe ripening experiment. Photographs were taken toshow a large portion of the test cell contents (approxi-mately 50% of the area shown in hologram 151, or 1.08cm2). It is important to note that the droplets createinterference fringes on these pictures. Droplets arethe bright spots surrounded by the halo-like interfer-ence fringes. Additionally, bright spots occur insidethe small droplets, which act as lenses. The magnifi-cation factors have been scaled with the averagedroplet radii. The photographs show very similar sizedistribution characteristics. Quantitative assessmentof statistical self-similarity requires a great deal ofadditional data. Efforts to measure the size histories
of additional droplets are presently under way.Holography enables the study of local environment
effects on the rate of droplet growth. Figure 14 showsthe droplet size history of a centrally located portionof the viewing region in the vicinity of Field 19.Asterisks denote locations of droplets consumed dueto the ripening process. Field 19 contained droplets141-146, Figure 15 is a plot of the droplet diameters
Rogers, Do_.,ey, Witherow. Facemlre. Frazier.Fradkov. Mani, and G[icksman
by hologram number. Note that the curve for droplet145 intersects the curves for droplets 143 and 141.Classic ripening theory predicts that the larger drop-lets in a population should grow: the individual drop-let trajectories should not cross. A careful examina-tion of Fig. 14 reveals that droplet 145's spatiallocation favors diffusional interactions with droplet171 in Field 23; droplet 145 shrinks and eventuallydisappears due to local effects.
Local effects also become evident in an examinationof the critical radius. The critical radius at a giventime in the experiment can be considered that dropletsize at which there is no net flux of material to thedroplet, where dR/dr = 0.00. Figure 16 shows plots ofrate of change of droplet radii for selected hologramsduring the ripening stage of the experiment and thevalue of R, predicted by theory. Theory suggests asingle value for the critical radius given by
R_(t)=9 _(t).
Examination ofFig.16revealsnoobservablerateofchange in dropletradius for a range of values ofdropletradii.The localenvironment ofeach specificdropletdetermines the criticalradius within thatenvironment.This range ofvaluescouldbe consid-ered"microstructuralfluctuations"and indicatesthe
range ofdeviationsfrom theoreticalpredictions.Itisalsoevidentthat,withintheresolutionofthemethod,droplets of the same size appear to grow and shankover the same time interval. This range of deviat:_,nsmay be a better predictor of the ultimate propertiesand function of the material in applications than thetheoretical value of the =global critical radius."
CONCLUDING REMARKS
This study demonstrates limitations of mean fieldapproaches which adequately predict scaling lawsbut not local droplet behavior during Ostwald ripen-ing. Mean field theories incorporate use of a screeninglength (often suggested as 1 = 2 droplet radii). Drop-lets spaced farther apart than that distance shouldgrow or shrink only in response to differences be-tween the concentration of the diffusing species at thesurface of the droplet as defined by the Gibbs-Thomp-son equation and the mean field concentration, Thereis no direct interdroplet communication at distanceswhich exceed 1,c. Therefore, where the interdropletspacing exceeds =2 radii, all droplets larger than Rshould grow, all those smaller than R should shrink:Additionally, droplets of the same size should changesize at the same rate. Data from this experimentindicates otherwise. The mean field approach is notsufficient to describe the behavior of individual drop-lets. Droplet interactions must occur in a more directmanner than suggested by the simple mean fieldapproach.
In order to explore direct droplet interactions, thebehavior of droplets with respect to size was ex-amined. Surprisingly, the data includes observationsin which droplets larger than their nearest neighbor

i
Coarsening" ot'Three-Dimensmnai I)r. _ i-,,,-
Two-Dimensional Dil'fu_ion: Part I. Ex_,_, _ment I005
a b
c d
gig 13 Phomc, raor_s of ,es! cell at variable magn:fication for se:ecteo holograms: (al NG 90. l : 31 , 10_ S: (b_ _G 100. t ,,,3,7. 10"-s: (c) HG 120•,57_ 10+s: chHG151 t=98 , !0 _s
)
eO• goO
• OO
• O0 •
T,.="'0 _-,:'2
e• ,,;..;
'43"-'_ • 0
011)
go
S_
_O
"O .,
•O •
'44 _,.t:
-O
• • ,O
• .4 ,..O
• _,:. o '-_• . , •
q
q{
a b c
_"_''-_ ' _ " _ca _f' qea-g,g14 R_,.,.=:_r_,at_c _,c'_lets ,._ =eld_9: a -..q20.l=16, 10-'S;to "G8C :=25t=37. 1C-:..
O
-O
• . •°
,_,o"a3
• _a6
• 50u.,-- •
d
1O's:_c "+G90. I=3: • !Ss:,d_GICC
shrunk _and droplets smaller than thezr neares: neigh-bor g-rely Clearl>. these droplets were respondma tothe intluence of droplets other than their nearestneighbor The data ,_ug.,_ests that the drop-size histo-ries of individual droplet_ depend, areatly ._n the
details of the local environment. The simple approachof observing the interaction between a droplet and itsnearest neighbor quickly becomes complicated whenthat nearest neJahbor has another neighbor which iscloser In another direction. The effects uf the iocal
IO_AL PAGE 1901_ _ (_ALI'I_

• Rogers. Do_, ney. Witherow, Facemire. Frazier.I006 Fradkov. Mani. and Glicksman
100
t_
c_
8O
60
40-
20-a
0o do
14
1
14
100 150
Hologram Number
.-4-141 .-.4,-142 .-,i--143 -o-t44
Fig. 15. Individual droplet lifetime trajectones.
environment on the behavior of a specific droplet aresubtle. Understanding requires the application ofmodeling techniques which can account for the na-ture of diffusional interactions of the droplets in theensemble. An additional complicating factor which isnot addressed in the present studies is the possibleeffects of residual concentration nonuniformities asdroplets become smaller than the resolution of theobservation system. Droplets of less than approxi-mately 2-3 pm are below these limits.
This study also exemplifies the benefits of hologra-phy. Using conventional microscopy, only one field-of-_iew would be accessible during a given instant intime. Holographic microscopy allows reconstructionof the test cell image and extraction of full detailsregarding the local environment of a given dropldt.Future plans include the application of phase shiftinginterferometry to the holograms of the experiment inorder to determine the concentration field in the testcell. Direct assessment of the concentration field
should greatly enhance the understanding of dif-fusive growth processes.
Computer modeling provides an important bridgebetween theoretical predictions and experiments. PartII of this paper describes computer modeling studieswhich examine multiple droplet interactions to ac-count for the observed local effects. The model in-cludes droplet interaction parameters for the entireensemble of droplets observed during this experi-ment. Predictions from the model are compared toexperimental observations reported in this paper.
ACKNOWLEDGMENT
These studies were supported by NASA's Office ofSpace Science and Applications.
REFERENCES
1. [.M. Lifshltz and V.V. Slyozov, J. Phys, and Chem. of Solids19, 35' 1961L
$._o "4
F• . ° •
• • .°
7.t.lO 4
-4.TO't _
7
_t o= i o.'Q ;..-
-14ovO4--
-tllu _O'q_5
8=10 `4
. .
. . : . . _
33
Ra_us. _t_
o
°° . * . o .
"** . -
__
°._.IO"L--
L
.io=_c 4 --
.12,,C _ --
Rclg, u$. um
b
Fig. 16. Rate of change for droplet radii for holograms for selected_ntervals: (al HG 100-HG 1l:(b) HG 120---HG 130.
2. S.C. Wagner. Z. Electrochemic 65. 581 _1961L3. O.M. Todes. Zh. Fis. Khim. 'Sot'. J. Phys. Chem._ 20, 629
1946 _.4. B.K.Chakraverty. J. Phys. Chem, Solids 28, 2401 (1967L5. V.V. Slyozov. Fts. Tt'erd. Tela 9. 927,1967L6. M. Zinke-Allmany. L. C. Fe]dman and M. H. Grabow, Surface
Sctence Reports: A Review Journal 16 _ ,. 377 ( 1992}.7. J.E. Smith. D.O. Frazier and W.F. Kaukier, Scripta Met. 18.
677 ; 1984 _.8. D.O. Frazier and B.R. Facemire. Thermochimica Acta. I45.
301 _I989,.9. W.K. Witherow, SPE 18. 249 _19791.
10. W.K. Witherow and B.R. Facemire. J. Collmd I_terface Sci.104. 185,1985,.
11. P.W. Voorhees. Anm Rer. Mater. Sci. 22. 197 (1992).
/
Appendix 2

Jounlal of E|ec_.rom¢ Mmtenm,_. VuI 23. No lO. L.q94
Coarsening of Three-Dimensional Droplets byTwo-Dimensional Diffusion: Part II. Theory
V.E. FRADKOV, S.S.._iANI, and M.E. GLICKSMAN
Rensselaer Polytechnic Institute, Troy. x_ 12180-3590
J.R. ROGERS
National Research Council, Space Science Laboratory, NASA Marshall SpaceFlight Center, Hunts_-ille, AL 35812
J.P. DOWNEY, W.K. WITHEROW, B.R. FACEMIRE, and D.O. FRAZIER
Space Science Laboratory, NASA Marshall Space Flight Center, Huntsville.AL 35812
Theoretical modeling of coarsening among a finite cluster of precipitates isimplemented, using the multipole expansion method. This method requires thediffusion field to behave quasi-statically. Two approximate solutions weredeveloped, one to monopolar order, and other to the dipolar order. The conven-tional Gibbs-Thomson equilibrium relationship was used as the boundary.condition at the precipitate-matrix interface. Part I of this paper considers aliquid-liquid system in a mixed-dimensional geometrical configuration, whereinthree-dimensional precipitates interact via a diffusion field constrained in twodimensions. This kind of geometric configuration is often encountered in islandevolution dynamics and phase segregation in thin films. The initial experimen-tal configuration of droplets provides the initial condition for the simulation.Both monopole and dipole approximations closely follow the experimentallyobserved scaling laws, characteristic for the mixed-dimensional coarsening(N -t3 and _ 4 varied linearly with time. where N is the number of droplets in theexperimental field of view, and R is the average droplet radius}. Good agreementis observed for time evolution of radii of some individual precipitates. Certaindeviations appearing among the two approximate solutions and the experimen-tal data are discussed.
Key words: Coarsening, kinetics, microstructure coarsening, Ostwaldripening, phase transformation, quasi-stationary diffusion
LNTRODUCTION
Phase coarsening is an important process in themicrostructural evolution of dispersed multiphasesystems. The initial excess interfacial free energy, ofsuch a system is elevated due to the large number ofprecipitated particles with high cur_'atures. Duringcoarsening, the excess interfacial energy is reducedvia diffusional mass transfer from regions of higheraverage curvature to regions of lower curvature. Theaverage size of the precipitated panicles increases
,Received March 1, 1994: re_ised June 3. 1994)
with time, and the total number of particles in thesystem decreases. Larger particles tend to grow at theexpense of the smaller ones which shrink and vanish.This process, whether occurring in solids, liquids, oreven gases, has similar phenomenology and asymp-totic kinetic scaling behavior. In the case consideredhere, the mechanism of mass transfer among theparticles is diffusion in the interparticle space _ma-trix ).
Part I of this paper _presents details of the dropletcoarsening experiments, where a holographic tech-nique is used to observe in situ the size and positionof each individual precipitate in an isopycnic ¢neutral
I007

%
1008
I
I
Fig. 1. Configuration of a droplet, shaped as a sphencal cap. at theexperimental cell wall, where I is the visible radius of the droplet andR is the radius of curvature of the dropJet.
buoyancy) system. Liquid phase separation insuccinonitrile-water alloy below the critical consolutetemperature was studied in this experiment. Small(10 to 50 u m) droplets of one liquid were dispersed inthe other, attaining uniform shapes of spherical caps,as a precipitate on the walls of the test cell. Anisothermal four-month-long anneal permitted exten-sive coarsening via diffusion among the precipitateddroplets. The distance between the front and the backcell walls is 100 _m, which is smaller than the typicaldistance between the droplets. The boundary con-ditions at the walls impose a zero normal diffusionflux. Such geometry and the boundary conditions,often characteristic of coarsening in thin films, implythat the diffusion flux in the direction normal to thewalls is much smaller than the flux in the directionparallel to the walls. Thus, in the theoretical formu-lation, the diffusion field among the three-dimen-sional droplets is considered as two-dimensional.
This paper presents the mathematical treatmentfor the mixed-dimensional coarsening system studiedin Ref. 1. The theory is developed, using a muhipolarseries expansion. Two approximate solutions are dis-cussed, which are monopolar and dipolar. The resultsof the respective calculations are compared with eachother and with the experimental data.
GENERAL FORMULATION
The theoretical analysis of coarsening of dropletsrequires solving a moving boundary diffusion prob-lem fStefan problem) with boundary conditions ap-plied at the test cell walls and at the surfaces of thedroplets. The boundary condition imposed on thecurved droplet surfaces is given by the usual linearform of the Gibbs-Thomson equilibrium equation,namely
c_R}=% / L ',R i' (1_
Fradkov.. ,i. Glicksrnan. Rogers, Downey.Witherow, Facemire. and Frazier
where c_R_ is the equilibrium concentration at thesurface of the droplet with radius R. c_ is the equi-librium concentration at a planar interface, and L isthe Gibbs-Thomson characteristic length, given by
L =_2:_ (21kT '
where y is the interfacial tension, Q is the molecularvolume, k is the Boltzmann constant, and T is thetemperature. A typical value for L is 10-= cm.
A numerical solution of this problem appears unre-alistic for a large number of droplets. However, if thesupersaturation is low, then the characteristic diffu-sion time is much shorter than the time needed for a
significant change of the droplet radius. As a conse-quence, the diffusion equation,
= DV_c, (3)at
reduces to the Laplacian equation,
V-_c=0. (4)
This concept was originally suggested by Todes, 2andapplied later by Lifshitz and Slyozov, 3 Wagner, 4 andmany others. The rate of change of droplet size isgiven by
lurflce
where a is a geometrical factor relating to the dropletvolume that depends on the contact angle, O(see Fig.1), of the droplet2
a(O)= ¼(2 - 3cos O+ cos3e). (6)
The boundary conditions at the test cell walls resultin the replacement of the three-dimensional diffusionproblem by a two-dimensional one, neglecting thediffusion flux across the cell walls compared to theflux along the walls. In the resulting two-dimensionalformulation of the problem, the surface integral in Eq.(5) is rewritten as a contour integral along the visibledroplet perimeter s:
d(4_ rdO) 1_, =QDH Vcds, (7_dt[ 3 sin J0 j ;_=_
where H is the distance between the test cell walls, 1is the visible radius of the droplet shown in Fig. 1,related to the spherical radius of the droplet ( radius ofcurvature)as ] = Rsin0.From here on,we willuse l
rather than R, because l is the only measurablecharacteristicofthe dropletsizeinthe experiment.
Even afterthissimplification,the problem stillremains too difficultfordirectnumerical analysis.
Each droplet surface representsa continuum ofsources/sinksforsoluteatoms.Insofaras theconcen-
trationfieldobeys theLaplacianEq._4J,one may usea multipoleseriesexpansionto approach the exact

(_oafsening of Three-Dimensional Dro" s byTwo-Dimensional Diffusion: Part II. T, ry 1009
boundary conditions at the droplet surfaces, assum-ingthat the interdroplet distance is much larger thanthe visible droplet radii. In two dimensions, the con-centration as a function of location ? is given as
c(?)=c*+co(-qlnr+d?+.., lr2 , (81
where scalars c" and q, and vector a are the constantsof integration to be determined using the boundaryconditions. 6 Employing the electrostatic analog ofquasi-static diffusion, one finds that q corresponds toan isolated charge, and d corresponds to a dipolemoment. The larger the interdroplet distance as com-pared to the droplet radii, the fewer terms of the seriesrequired. The logarithmic term is referred to as thetwo-dimensional monopole term, the next as the di-pole term, etc. It is important to mention that the rateof the visible droplet size change is defined by themonopole term alone:
sinJ 0g_ Dc H q'' o (95Introducingthe dimensionlesspotentialq)insteadofthe concentrationc as
(C-Co)_o=_ (i0)
C O
Eq. (4)can be rewrittenas
V_q)=O (115
The theory isfirstdeveloped by neglectingtermshigherthanthemonopole,and thenincorporatingthedipoleterms.The generaltwo-dimensionalsolutionofthe Laplacianequationinthe monopole approxima-tionis
x ]?,-?l¢p(e)=_0*-_ q, ln_, (12)
*-t a
where ?, is the positionof the centerof the i-thdroplet,aisan arbitrary,constantwithdimensionality
oflength,and q)*= (c"- co)/co.The Gibbs-Thomsonboundary conditions(11areused toobtainthe valuesof (N + 1) constantsof integration,viz.cp"and qi.Neglectingthe visibledropletradiusas compared totheinterdropletdistance,one can substitutetheposi-tionatthe surfaceofthe dropletby thepositionofits
center.This resultsina linearsetofN equations
Lsin0=cp, inl_, _q_in (13)l--'_ -q a ., a
The reference experiment, see Part I, I showed thatthe total volume of the droplets did not depend on timeduring the isothermal annealing tsee Fig. 2). Massconservation, which can be written in terms of the q,using Eq. (9/is expressed as
N
_q, =0, (1411.1
and provides the last equation needed to complete theset. As a consequence of Eq. (14 _,the constant a in Eq.
(13} cancels out. and its value does not effect thesolution. We will choose a = Lsin0.
The monopole approximation neglects the size ofthe droplets, and does not account for the g'radients ofthe diffusion field in the vicinity of the droplets. Note,that in two dimensions the monopole term. a logarith-mic function, changes very slowly. The next term inthe expansion is the dipole term, which accounts forthe _adients in the vicinity of droplets. This termdecays as the reciprocal of distance. The higher orderterms, which decay faster than the dipole term, areneglected.
The general solution of the Laplacian Eq. (111incorporating the dipole terms is given by
_ .. ( i_-?l a,.(_:,r.)/ (155
]
The boundary., conditions at the surfaces of alldroplets are given by
Lsin..__._u_=¢p,-q, In l_+ d,Bm
I_ LsinO 1_
+2! .,.,-qjm Ls--_-n_n8+ [_ _p,. , (161
and hold for l, in any direction, where T is the vectororiginating at ihe center of the i-th droplet and endingat an arbitrary point on its perimeter. The potentialfield in the vicinity of the i-th droplet created by therest of the system, q)_,is given by
=_
C ln'(Pi + w)-' d'((r'+ _)- r_);(17)o* +_ -qj + ,,
7 I0 s
Au3 6 10 s
c-
.>, SI0e
4 10 5 -
v i •
3 10 _ -E
o 2 10_-¢g
B•,-, 1 10 _ -
0 2 10 _ 4 10 s 6 10 s 8 10 6 1 1,3"
time (sec)F,c 2, Total volume of the ooserved droolers calcuiated as the sum of
theircubedrad, vstime.

lOlO
where @ isa vectororiginatingatthecenterofthei-thdroplet.Rewritingtheboundary conditionEq. (16)using Eq. (17)gives
Lsin0 =q),(0)-q, I_ + d_ .T_+_, (18)q
whered -. _ -. _---=-i-_----+ j_---. (19)d@ aw dw:
To satisfyEq. (18)forany 1,,the followingtwoequalitiesmust be met:
L sin0-%(0)+q_ In =0, (20)
and
_-+_o =0. (21)
The followingsetof(3N + I)linearequationsforq_'s,d,'s,and _0"result:
_-q_ in +,., Lsin0 r_ r_-"J
-%ln_+_ = Lsin___._Oli
d,l____ (--_'2q,xJ' + rJ_- 2xi_d 2x"y'i 1,.,( rj, ri_ ,, _ d,,.=O (22)
dy _( Y_i 2yj_x_ d + r_-2yj_ dy, l=Oq, ,,]
N
_qj =0j=l
where x':,= x,-xJ;Y,=L- Y_;r__= \(x _x_)2+(y _y_)_"
DLMZENSIONLESS FORMULATION
Using the Gibbs-Thomson characteristic length Las a length scale Lsin0 as a unit of length, di-mensionless variables are introduced for convenience:
the dimensionless droplet size
k_ 1 (231= L sin'-'-'_'
the dimensionless characteristics of the droplet cen-ter positions
. x, y,(5 =_'- - • =_ 124_LsinO '_'-_'q LsinO
the dimensionless time
sin_0 12Dc,H 1 DcoHk_T _z= _t= t, (25,
2a(O)U_sin_0 16a(0_ 7'_ _
and thedimensionlessdipolemoments ofthedroplets
Fradkov.....hi.Glicksman.Rogers.Downey'.Wi_herow,Facemire.and Frazier
The monopole moments for two-dimensional diffusionfields are naturally dimensionless.Using _hese variables, Eqs. (11) and (22# reduce _o
d k, q' (26_d_ E
-qi In k, + _I -q_ In p_, '+---Z--+--23-- +_o =--
5_ -k_ - q d p_ -2_,_ 6,_-P_ 8,. =0, p_,
I . _ 2 1o' , =oN
_q_=O
(28_
where
NUMERICAL TREATMENT
The set of ordinary differential Eq. (26) is solved,using a fourth-order Runge-Kutta algorithm. Thevalues of the q_'s are obtained at each time step bysolving the sets of linear dimensionless Eq. (27) andEq. (28) for the monopole and the dipole approxima-tions, respectively, The disappearance of a shrinkingdroplet causes a singularity in the coefficient matrixfor the equation sets Eq. (27) and Eq. (28). Thisrequires the redefinition of the coefficient matrix bydropping the column and row corresponding to thevanished particle. A variable time-step was used todeal with this situation. The time-step was continu-ally chosen by estimating the shortest droplet life-time. After each time-step, the droplets smaller thana threshold size were eliminated, which allowed thecoefficient matrix to be redefined before the singular-ity occurred. This threshold value was chosen to bemuch smaller than the current average droplet size inthe system. As a droplet becomes small, it rapidlyvanishes, with the shrinking rate dk/dr increasing asU _._.Therefore, the results are stable with respect tothe chosen value of the threshold. The results ob-
tained with a threshold value of 5_ of the averagedroplet size in the system proved to be indistinguish-able from those for 2Q. within the calculation error,which never exceeded 0.01 _. The program was testedand verified using a two-droplet case which has areasonably simple analytical solution.
The initial configuration for the multi-droplet simu-

Coarsening of Three-Dimensional Dr, s bvTwo-Dimensional Diffusion: Part II. 1,._or3' I.Oll
lation is taken from the experimental data Part I.:The relationship between the experimental time tand the computational dimensionless time _ is found.using the theoretically predicted scaling behavior forthree-dimensional domains exchanging atoms via atwo-dimensional diffusion field. The dimensionalityof the problem suggests the scaling law
R 4=t, (29_
where _ is any characteristiclinear scale of the
system, for example, the average radius ofthe drop-lets,and tisthe time.7.8Since N R5 = const,where N
is the number of droplets, Eq. (29) gives the time
dependence forthe number ofdroplets N as,
N -_3 = t (301
The experimental time dependence of the number of
Z
0,016
- /
0"014 t -=.-'experiment _,r.._._monopole
0.0120,01Li _dipole
f
0 210 s 4105 610 G 8105 110' 1.2107
time (sec)Fig. 3. Scaling of a number of droplets with time. The initial state for the
simulations is the experimental state at t = 540080 s (N = 142). ,
Z
0,016
0,014 -
0,012 -
O,01 -
0,008 -
0.006 - _,
,Y
0.004 - //e
p/0.002 - d
•/
0C 2105
• experiment //F
monopole
4 105 6 10 _ 8 10_ 1 10r 1.2 10:
time (sec)Fig. 4. Scaling cf a number of aroplets with time. The initial state for tt_e
simulations is :he experimental state at t = 5697500 s (N = 43i.
droplets shown in Fig. 3. The best fit to the numericalcalculations for this dependence was obtained for ; =
5.9 It - to), which gives a value for the combination ofparameters appearing in Eq. ¢25). The time depen-dence of the number of particles calculated using bothmonopole and dipole approximations fit the experi-mental data well for part of the annealing period,after which deviation increases. This disparity be-tween the experimental and the calculated data,observed for larger times, might result from the accu-mulated influence of the droplets located beyond theexperimental field of view. As stated earlier, in two
dimensions, the decay of the interaction among thedroplets with the distance is rather subtle. Appar-ently, the effect of unobserved particles accumulateswith time. resulting in the increasing deviation be-tween the experimental and the calculated data.Figure 4 shows that the experimental behavior dur-ing the later time interval can be reproduced numeri-cally by choosing a later experimental configurationas the initial condition for the simulations.
Figure 5 shows the time dependence of the mean
8 105
"e:t,.
f,,,,
7 1G_ --_-- exDerimenl
_monopole ! I_
4 10_ - ,,. -
3 105 - / •
2 10 ="-
110: -
"/01C"
0 2 106 4 10 s 5 10 ¢ 8 t0; I 10: 1.2 10 _
time (sec)Fig. 5. Scahng of the mean droplet radius with time.
o
420
840
126o
1680
2100
w w
• • • • • • • • •• O e eO O q
• • o • o ° e o • _ • | "-._• • t
OO • • • • • • • •D • O
;" _'." , , 00 ,
• • • • eO • O •
• • eo _ • •• • Do
• O 0. • • • • • •
• :. • • •• e • • • •
• o o° • • • ° o• • •
_ • • O o • o o •
0 560 1_2C _68c 2240 2800
F{g. 6. Locat_ons ofdrooletsinthe exoenmentalfield ofview

1012Fradkov. .ani. Glicksman, Rogers, Downey.
Witherow. Facernire. and Frazier
7O
f.._ 1 t4 (exbenment)
60 128 (exbenment)114 (monopole)t 28 (monopo|e)114 (dipole)
50 128 (dipole)
.-_ 4o
3O
,o!.
,°}0 .
0 2 106 4 101 6 "tOe
time (sec)
Fig. 7, Typical individual droplet evolution in the case of a good
agreement between the expenment and the calculations.
7Oi
6o!
°°i10
oo 510 6 1 1oT 1.5 lO7
time(sec)Fig. 8. Typical individual drol_let evolution in the case when the dipole
approximation shows better agreement with the experiment as com-
pared to the monopole approximation.
radius of the droplets for the experiment and the
calculations based on both monopole and dipole ap-proximations. The simulation shows discontinuitiesat the times of droplet vanishings. Note that the meanradius decreases between two consequent vanishings.This happens due to phase volume redistributionfrom the smaller particles shrinking fast, to the largerones growing slower• However, the mean radius sud-
denly increases at the instant of a droplet vanishing,exhibiting the expected overall increase in the aver-
age. The more droplets present in the system, thesmoother is the time dependence of the mean radius.
7O
m
6O
5O
4O
30
2O
10
o o
o
o •
o
o 148 (exl_enment)
80 (monopole)
148 (monopole)
_80 (dipole)
148 (dipole)
0 f
0 4 106 8 106
time (sec)
__J
t
Ii
!1
1.2 107
Fig. 9. Typical individual droplet evolution in the case of a bad
agreement between the experiment and the calculations.
In contrast with the global behavior, the results ofthe comparison between the experimental behavior
and the calculations for individual droplet evolutionvary widely in accuracy. The individual droplet evolu-tion can be categorized in three distinguishable cases.The locations of the representative droplets are shownin Fig. 6. In certain locations, the droplets exhibitgood agreement between the experiment and both
dipole and monopole approximations, as shown inFig. 7. For some other droplets, the dipole calculationdeviates from the monopole calculation, but the di-pole results are in better agreement with theexperimental measurements (see Fig. 8). In the thirdgroup, deviations are found among the experimentalresults for both calculations (see Fig. 9). As the onlydifference between the monopole and the dipole ap-proximations is that the latter incorporates con-centration gradients, the particles exhibiting differentbehavior in the two simulations are located in a strongconcentration gradient resulting from the surround-ing environment. The cases without agreement be-tween the calculations and the experiment appears tobe caused by the uncontrollable influence of dropletslocated beyond the experimental field of view.
CONCLUSIONS
Theoretical modeling of coarsening among a finitecluster of precipitated droplets between two closelyspaced cell walls is performed based on a muhipoleexpansion method. This model calculates the timedependencies of individual droplet radii, given thedroplet locations. The theory uses a global massbalance equation rather than an external bounda_"
condition, therefore avoiding the introduction of anyadditional arbitrary length scale into the system. Twoapproximationswmonopole and dipole--are studied.An initial experimental configuration is used as the

Coarsening ofThree-Dimensional Dr,_letsbyTwo.Dimensional Diffusion:Part II.Theory I013
initial condition for the calculation. Good agreementis observed between the experimental data for thestatistically measured parameters, which are thetotal number and the mean size of the droplets.However, for larger times certain deviations develop,resulting from accumulation of the effects of dropletslocated beyond the experimental field of view.
The individual droplet evolution compared amongthe two approximations and the experiment can becategorized in three groups. The droplets in the firstgroup exhibit similar behavior in the experiment andboth approximations. The second group displays somedeviations between the monopole and the dipole ap-proximations, with the dipole approximation resultsbeing in better agreement with the experiment. Themonopole approximation accounts for the concentra-tion field, whereas the dipole approximation, addi-tionally, incorporates effects from the concentrationgradients resulting from the asymmetrical environ-ment. The third group does not show agreementbetween any of the approximations and the exper-iment, apparently due to the.limited extent of knowl-edge of the environment, i.e. the unknown locations
and sizes of the particles beyond the experimentalfield of view',
The multipolar approach explicitly requires thatthe characteristic interdroplet distance is large ascompared to indi_'idual droplet sizes, which limitstheir application to low volume fractions of the dis-persed phase. For systems with a high volume frac-tion, _chis fundamental assumption fails. Hence, themultipole approach cannot be extended to systemswith high volume fraction by merely incorporatingadditional higher-order terms of the multipolar se-lies. A fundamentally different approach appears tobe required for modeling systems with high volumefraction of the dispersed phase.
REFERENCES
i. J.R.RogerselaJ..J.ElectronMater.23.999(1994_.2. O.M.Todes,J.Phys.Chem. _Sov.j20ITs.629 {19461.3. I.M.Lifshitzand V.V.Slyozov,J.Phys.Chem. Solids19,35
(1961J.4. C. Wagner. Z. Eleetrochem. 65,581 (1961_.5. _t.K. Chakraver_y. J. Phys. Chem. Solids 28, 2401 (1967}.6. L.D. Landau and E.M. Lifshitz, The Classwal Theo_ of
Fields. 4th rev. English ed. IOxford. New York: PergamonPress,1975).
7. W.W. Mullins.J.Appl.Phys.28(3),333(1957}.8. V.V.Slyozov,Sol.StatePhys.(Soy)9.927(1967).