Embed Size (px)
Citation preview

THE STUDY ON
COUNTERMEASURES FOR SEDIMENTATIONIN
THE WONOGIRI MULTIPURPOSE DAM RESERVOIRIN
THE REPUBLIC OF INDONESIA
FINAL REPORT
JAPAN INTERNATIONAL COOPERATION AGENCY
NIPPON KOEI CO.,LTDYACHIYO ENGINEERING CO.,LTD
JULY 2007
VOLUME-III SUPPORTING REPORT I
Directorate General of Water ResourcesMinistry of Public WorksThe Republic of Indonesia

FINAL REPORT
Composition of Reports
VOLUME-I EXECUTIVE SUMMARY
VOLUME-II MAIN REPORT Part I : Master Plan Study Part II : Feasibility Study
VOLUME-III SUPPORTING REPORT I Annex No.1 Hydrology No.2 Geological Condition No.3 Assessment of Wonogiri Reservoir Sedimentation No.4 Reservoir Sedimentation Analysis No.5 Verification Test for Hydro-Suction System for Sediment Removal No.6 Turbidity Analysis for Downstream Reaches, Solo River Estuary
and Colo Weir
VOLUME-IV SUPPORTING REPORT II Annex No.7 Preliminary Design and Technical Evaluation on Structural
Sediment Management Alternatives No.8 Environmental and Social Considerations (IEE and EIA) No.9 Watershed Conservation and Management
VOLUME-V SUPPORTING REPORT III Annex No.10 Social Survey No.11 Institutional Study for Watershed Management No.12 Cost Estimate No.13 GIS User’s Manual No.14 GIS Training No.15 Dam Safety Analysis No.16 News Letters No.17 Minutes of Meetings
VOLUME-VI DATA BOOK No.1 Meteorological and Hydrological Data No.2 Water Quality and Turbidity
VOLUME-VII PHOTO BOOK
EXCHANGE RATE The exchange rate used in this Study is:
Master Plan Study US Dollar (US$) 1.00 = Indonesia Rupiah (Rp.) 10,035 = Japanese Yen (Y) 119.63 as of December 2005
Feasibility Study US Dollar (US$) 1.00 = Indonesia Rupiah (Rp.) 9,050 = Japanese Yen (Y) 118.92 as of December 2006

1000
1500
500
1000
2000
2000
500
2000
1500
Wal
ikan
Rive
r
Mt.
Mer
babu
3142
Mt.
Mer
api
2914
Mt.
Law
u32
65
Mt.
Wili
s25
63
897
Mt.
Pand
an
Mt.
Bun
tung
742
Boy
olal
iSU
RA
KA
RTA
Kla
ten
Srag
en
Won
ogir
i
Nga
wi
MA
DIU
N
Pono
rogo
Indi
an O
cean
Won
ogir
i Mul
tipur
pose
Dam
Paci
tan
Cem
ara
Riv
er
G
awe R
iver
Dengken
g R
ive
r
Jlan
tah
Riv
er
Sam
in R
iver M ungk
ung Riv
erSragen River
Sawur River
Ketong
go R
iver
Go n
dang
Riv
er
Gon
ggan
g Ri
ver Anyar River
Madiun R
iver
K
eyan
g R
iver
Asin
Rive
rCat
ur R
ive
r
Jer
owan
Riv
er
Bengaw
an S
olo
2298
Bram
ba
ng R
i ver
G
rom
pol R
iv
er
Mun
gkun
gan
Riv
er
Tem
pura
n R
iver
KE
Y M
AP
JAW
A S
EA
IND
IAN
OC
EAN
SUMATRA
KA
LIM
AN
TAN
Jaka
rta
PRO
JEC
T A
RE
A
JAW
A
N
NSC
AL
E
05
1015
2025
30 k
m
Lege
nd
Wat
ersh
ed
Riv
er
Won
ogiri
Dam
Rai
lway
Roa
d
Mou
ntai
n
City
Tow
n
Dis
trict
Prov
inci
al B
ound
ary
Loc
atio
n M
ap
Tem
on R
iver
Alang River
Benga
wan
Sol
o K ed
uang
Rive
r
Tirt
omoy
o R
iver
Ked
uang
Riv
er
Man
yara
n
Wur
yant
oro
Ero
mok
o
Prac
iman
toro
Gir
itont
ro
Gir
iwoy
o
Bat
uret
no
Ngu
ntor
onad
iN
gadi
rojo
Bat
uwar
no
KE
Y M
AP
BE
NG
AWA
N S
OL
O
Tem
on R
iver
Alang River
Benga
wan
Sol
o R
K eduan
g Rive
r
Tirt
omoy
o R
iver
Ked
uang
Rive
r
SCA
LE
015
3045
6075
90 k
m
N
BE
NG
AWA
N S
OL
O

Abbreviation (1/3)
Abbreviation Indonesian EnglishADB Bank Pembangunan Asia Asian Development BankAMDAL Analisis Mengenai Dampak Lingkungan Environmental Impact AnalysisAPBD Anggaran Pendapatan dan Belanja Daerah Provincial Government Development Budget (Provincial Budget)APBN Anggaran Pendapatan dan Belanja Negara Central Government Development Budget (National Budget)BAKOSURTANAL Badan Koordinasi Survey dan Pemetaan Nasional National Coordination Agency for Surveys and MappingBalai PSDA Balai Pengelolaan Sumber Daya Air Regional Office of Water Resources ManagementBalai PDAS Balai Pengelolaan Daerah Aliran Sungai Regional Office of Watershed ManagementBAPEDAL Badan Pengendalian Dampak Lingkungan Environmental Impact Management AgencyBAPEDALDA Badan Pengendalian Dampak Lingkungan Daerah Propinsi Provincial Office of Environmental Impact Management Agency
BAPEEDA Badan Perencanaan Pembangunan DaerahTingkat I Regional Development Planning Agency of ProvinceBAPPENAS Badan Perencanaan Pembangunan Nasional National Development Planning AgencyBB BB Brachiaria BrizanthaBBI Balai Benih Induk Seed Production enterBBLH Biro Bina Lingkungan Hidup Bureau of Environmental GuidanceB-C - Net Present ValueBD - Brachiaria DecumbensBIMAS Bimbingan Masal Mass Guideline for Agricultural DivelopmentBKPH Bagian Kesatuan Pemangkuan Hutan Forest Administration Sub-unitBMG Badan Meteorologi dan Geofisika Meteorological and Geophysical AgencyBOD - Biochemical Oxygen DemandBP2TPDAS Balai Penelitian dan Pengembangan Teknologi Pengolohan
Daerah Aliran SungaiWatershed Management Technology Centera, Ministry of Forestry
BPDAS Solo Balai Pengeloloan Daerah Aliran Sungai Solo Solo River Management Office of Ministry of ForestryBPKH Balai Pemantapan Kawasan Hutan Forest Area Consolidation BureauBPPHH Balai Pengendalian Peredaran Hasil Hutan Forestation Result of Agricultural Extension OfficeBPS Biro Pusat Statistik Central Bureau of StatisticsBPTP Terpadu Balai Pengkajian Teknologi Pertanion Integrated Agricultural Technology Assessment CenterBPTPH Balai Proteksi Tanaman Pangan dan Hortikultura Provincial Plant Protection CenterCd CadmiumCDMP - Comprehensive Developmant and Management Plan Study for Bengawan Solo
River Basin under Lower Solo River Improvement ProjectCOD Kebutuhan Oksigen untuk proses kimia Chemical Oxygen DemandCr Khrom ChromiumCu - CopperCWL Tinggi Muka Air Kendali Control Water LevelDAS Daerah Aliran Sungai Watershed, CatchmentDEM - Digital Elevation MethodDEPDAGRI Departemen Dalam Negeri Ministry of Home AffairsDEPHUT Departemen Kehutanan Ministry of ForestryDEPKES Departemen Kesehatan Ministry of HealthDEPTAN Departemen Pertanian Ministry of AgricultureDFWL Tingi Muka Air Banjir Rencana Design Flood Water LevelDG Direktorat Jendral Directorate GeneralDGLWM Direktorat Jendral Pengelolaan Lahan dan Air Directorate General for Land and Water ManagementDGWR Direktorat Jenderal Sumber Daya Air Directorate General of Water ResourcesDHF - Dengue Hemorrhagic FeverDinas LHKP Dinas Lingkungan Hidup, Kehutanan dan Pertambangan Environment, Forestry and Mining Services of kabupaten WonogiriDIP Daftar Isian Proyek Approved Project BudgetDIPERTA Dinas Pertanian Tanaman Pangan Daerah Propinsi Jawa Provincial Agricultural Service of Central JavaDO Oksigen Terlarut Dissolved OxygenDPRD Dewan Perwakilan Rakyat Daerah Regional House of RepresentativesDPU Departemen Pekerjaan Umum Ministry of Public WorksEFWL Tinggi Muka Air Banjir Ekstra Extra Flood Water LevelEIA Analisis Dampak Lingkungan Environmental Impact AssessmentEIRR - Economic Internal Rate of ReturnEU Uni Eropa European UnionFAO Badan Pangan Dunia United Nations Development Programme /Food and Agriculture OrganizationFORDA Litbang Departemen Kehutanan Forestry Research & Development AgencyGDP - Gross Domestic ProductGIS Sistem Informasi Geografis Geological Information SystemGMU Universitas Gadjah Mada Gadjah Mada University
A-1

Abbreviation (2/3)
Abbreviation Indonesian EnglishGNKPA Gerakan Nasional Kemitraan Penyelamatan Air National Movement of the Partnership for Water PreservationGNP Pendapatan Nasional Gross National ProductGOI Pemerintah Indonesia Government of IndonesiaGOJ Pemerintah Jepang Government of JapanGPS Sistem Posisi Global Global Position SystemGRDP Produk Domestik Regional Bruto Gross Regional Domestic ProductGERHAN Gerakan Nasional Rehabilitasi Hutan dan Lahan National Movement for Forest & Land RehabilitationH-A - Relation between reservoir water level and reservoir surface areaH-V - Relation between reservoir water level and reservoir capacity volumeHKTI Himpunan Kerukunan Tani Indonesia Farmer's AssociationHPI Indek Kemiskinan Human Poverty IndexIBRD (WB) Bank Dunia International Bank of Reconstruction and Development (Work Bank)IEE Pengkajian Pendahuluan Lingkungan Initial Environmental ExaminationIPAIR Iuran Pelayanan Irigasi Irrigation Service FeeIPEDA Iuran Pen Bangunan Daerah Village Land Tax,Provincial Development TaxISPA Infeksi Saluran Pernafasan Atas Upper Respiratory NasopharynxJAMALI Sistem Interkoneksi Jawa-Madura-Bali Java-Madura-Bali power generation systemJBIC - Japan Bank of International CooperationJICA - Japan International Cooperation AgencyJIS Standar Industri Jepang Japanese Industrial StandardsJPY, Yen Yen Japanese YenK2TA Kelompok Konservasi Tanah dan Air Soil and Water Conservation Farmer GroupKBD Kebun Bibit Desa Seeding Garden VillageKCI - Polassium ChlorideKESBANLINMAS Badan Kesatuan Bangsa dan Perlingdungan Masyarakat National Unity and Society Protection BoardKIMPRASWIL Departemen Pemukiman dan Prasarana Wilayah Ministry of Housing and Regional InfrastructureKPH Kesatuan Pemangkuan Hutan Forest Administration UnitKT Kelompok Tani Farmers' Group at Village LevelKUD Koperasi Unit Desa Village Cooperative UnitLHKP Wonogiri Lingkungan Hidup, Kehutanan dan Pertambangan Forestry Sub-services of Wonogiri Human Environment, Forestry and Mining
Services OfficeLKMD Lembaga Ketahanan Masyarakat Desa Village Social Activities Group, Village Welfare InstitutionLPTP NGO (Lembaga Pengembangan Teknologi Perdesaan) -LSM Lembaga Swadaya Masarahkat Nongovernmental Organization (NGO)LWL Tinggi Muka Air Rendah Low Water LevelM&E Pemantauan dan Evaluasi Monitoring and EvaluationMOU Nota Kesepahaman Memorandum of UnderstandingMT I Musim Tanam I Cropping Season IMT II Musim Tanam II Cropping Season IIMT III Musim Tanam III Cropping Season IIINGO Lembaga Swadaya Masyarakat Non Governmental OrganizationNHWL Tinggi Muka Air Normal Normal High Water LevelNO2 Nitrit Nitrogen DioxideNO3 Nitrat Nitrogen TrioxideNTU - Nephelometric Turbidity UnitO&M, O/M Operasi dan Pemeliharaan Operation and MaintenanceOtonomi daerah Otonomi Daerah -OECF - Overseas Economic Cooperation FundOTCA Lembaga Kerjasama Teknis Luar Negei Overseas Technical Cooperation AgencyP4K Pembinaan Peningkatan Pendapatan Petani-Nelayan Kecil Farmer Groups of Small-Scale FarmersPb - LeadPBS Proyek Bengawan Solo Bengawan Solo River Basin Development ProjectP2AT Proyek Pengembangan Air Tanah Groundwater Development ProjectP3A, HIPPA Perkumpulan Petani Pemakai Air, Himpunan Petani Water User's Association (WUA)PABBS Proyek Penyediaan Air Baku Bengawan Solo Bengawan Solo River Water Supply ProjectPBS Proyek Bengawan Solo Bengawan Solo River Basin Development OfficePCM Pertemuan Konsultasi Masyarakat Public Consaltaiton MeetingPDAM Perusahaan Daerah Air Minum Regional Drinking Water Supply CompanyPDAS Pengelolaan Daerah Aliran sungai Watershed ManagementPDRB Produk Domestik Regional Bruto Product Domestic Regional BruttoPerum Perusahaan Umum Public Corporation
A-2

Abbreviation (3/3)
Abbreviation Indonesian EnglishPERSEPSI NGO (Perhimpunan untuk Studi dan Pengembangan
Ekonomi dan Sosial)-
pH Nilai Keasaman pH valuePHBM Pengololaan Hutan Bersama Masyarakat Community Participated Forest ManagementPJP Pembangunan Jangka Panjang Twenty-Five Year Long Term Development PlanPIPWS Bengawan Proyek Induk Pengembangan Wilayah Sungai Bengawan Bengawan Solo River Basin Development OfficePJT Perum Jasa Tirta Public Water Service CorporationPKL Penyuluh Kuhutanan Lapangan Field Forestry Extension WorkerPKSDABS Proyek Pengembangan Konservasi Sumber Daya Air
Bengawan SoloBengawan Solo River Water Resources Conservation Development Project
PLTA Wonogiri Pusat Listrik Tenaga Air Wonogiri Wonogiri Power StationPMF Banjir Maksimum yang mungkin terjadi Probable Maximum FloodPO4 - Phosphoric TetroxidePPL Penyuluh Pertanian Lapangan Field Extension Workersppm Seper juta parts per millionPPTPA Penitia Pelaksana Tata Pengaturan Air River Basin Water Resources Management CommitteePRA Analisa Partisipatori Pedesaan Participatory Rural AppraisalPROPENAS Program Pembangunan National Five-Year National Development ProgramPSAPBBS Proyek Pengelolaan Sumber Air dan Pengendalian Banjir
Bengawan SoloBengawan Solo River Water Resources Management and Flood Control Project
PSDA Pekerjaan Umum Sumber Daya Air Water Resource ManagementPT CMA PT Citra Mandala Agritrans -PTPA Panitia Tata Pengaturan Air -PU Pekerjaan Umum Ministry of Public WorksREI - Rain Erosivity IndexRENSTRA Rencana Strategis Strategic PlanREPEDA Rancangan Peraturan Daerah Annual PlanRp. Rupiah Indonesian RupiahRPH Resort Pemangkuan Hutan Field Unit of KPHRTL Rencana Tindak Lanjut Field Technical Planning in Upper Solo Watershed Protection Project in
Wonogiri WatershedRTT Rencana Teknis Tahunan Yearly Technical Planning in Upper Solo Watershed Protection Project in
Wonogiri WatershedRUTRK-RDTRK Rencana Umum/Detail tata Ruang Kota General City Site Plan, Detailed City Site PlanRWL Muka Air Waduk Reservoir Water LevelSBRLKT Sub Balai Rehabilitasi Lahan dan Konservasi Tanah Sub Unit for Land Rehabilitation and Soil ConservationSCF Faktor Konversi Standar Standard Conversion FactorSDR Nisbah Pengantaran Sedimen Sediment Delivery RatioSEA Penilaian Lingkungan Strategis Strategic Environmental AssessmentSFC Perum Perhutani State Forest CorporationSHFD Debit banjir tertinggi standar Standard Highest Flood DischargeSI - Stress IndexSS Padatan Tersuspensi Suspended SolidSWOT Kekuatan, Kelemahan, Kesempatan, Ancaman Strength, Weakness, Opportunity, ThreatTDS Total Padatan Terlarut Total Dissolved SolidTIU Unit Pelaksana Teknis Technical Implementation UnitTOR Kerangka Acuan Kerja Terms of ReferenceTSS Total Padatan Tersuspensi Total Suspended SolidUKL Upaya Kelola Lingkungan Environmental Management EffortsUNDP/FAO Badan Pangan Dunia United Nations Development Programme /Food and Agriculture OrganizationUPL Upaya Pemantau Lingkungan Environmental Monitoring EffortsUPR Unit Pembenihan Rakyat Community Nursery UnitUPTD Unit Pelaksana Teknis Daerah Local Technical Implementation UnitUS$, USD Dollar Amerika US dollarUSAID - US Agency for International DevelopmentUSLE Persamaan Kehilangan Tanah Umum Universal Soil Loss EquationVAP Rencana Kerja Desa Village Action PlanWC3 Komite Koordinasi Konservasi DAS Watershed Conservation Coordinating CommitteeWKPP Wilayah Kerja Penyuluhan Pertanian Working Area of Agricultural ExtensionWM Pengelolaan Daerah Aliran sungai (DAS) Watershed ManagementWRM Pengelolaan Sumber Daya Air (SDA) Water Resource ManagementZn Seng Zinc
A-3
Annex No.1 Hydrology

i
THE STUDY ON COUNTERMEASURES FOR SEDIMENTATION
IN THE WONOGIRI MULTIPURPOSE DAM RESERVOIR
IN THE REPUBLIC OF INDONESIA
FINAL REPORT
SUPPORTING REPORT I
Annex No.1: Hydrology
Table of Contents
Page
CHAPTER 1 INTRODUCTION..................................................................................................1-1 CHAPTER 2 HYDRO-METEOROLOGICAL CONDITION.....................................................1-2
2.1 Climate ...........................................................................................................................1-2 2.1.1 General............................................................................................................1-2 2.1.2 Temperature ....................................................................................................1-2 2.1.3 Relative Humidity...........................................................................................1-2 2.1.4 Wind Velocity .................................................................................................1-3 2.1.5 Evaporation.....................................................................................................1-3
2.2 Rainfall...........................................................................................................................1-3 2.2.1 Availability of Daily Rainfall Record .............................................................1-3 2.2.2 Availability of Hourly Rainfall Record...........................................................1-4 2.2.3 Availability of Hourly Rainfall Record...........................................................1-4
2.3 Discharge .......................................................................................................................1-5 2.3.1 River Water Level ...........................................................................................1-5 2.3.2 Discharge Measurement, H-Q Curve and Runoff Record ..............................1-6 2.3.3 Daily Discharge ..............................................................................................1-6 2.3.4 Hourly Discharge ............................................................................................1-8
CHAPTER 3 RESULTS OF HYDROLOGIC INVESTIGATION ..............................................1-9
3.1 Purpose of the Hydrologic Investigation........................................................................1-9 3.2 Contents of Hydrologic Investigation ............................................................................1-9 3.3 Location .........................................................................................................................1-9 3.4 Observation Period.......................................................................................................1-10
3.4.1 Observation of River Water Level and Discharge Measurement..................1-10 3.4.2 Sampling of Suspended Sediment and Particle Size Analysis ......................1-11

ii
3.5 Results of the Hydrologic Investigation.......................................................................1-11 3.5.1 H-Q Curves ...................................................................................................1-11 3.5.2 Discharge on Five Major Tributaries ............................................................1-12
CHAPTER 4 RESERVOIR INFLOWS FROM FIVE MAJOR TRIBUTARIES AND
REMNANT AREA...............................................................................................1-13 4.1 Estimation of Reservoir Inflow....................................................................................1-13
4.1.1 Wonogiri Reservoir Operation Record .........................................................1-13 4.1.2 Estimation Method........................................................................................1-13 4.1.3 Estimation Result ..........................................................................................1-14
4.2 Large Flood Inflows into the Wonogiri Reservoir .......................................................1-15 4.3 Estimation of Hourly Reservoir Inflows ......................................................................1-16
4.3.1 Background and Estimation Procedure of Hourly Reservoir Inflow............1-16 4.3.2 Runoff Analysis for Hourly Discharge of five (5) Major Tributaries
During 1993 to 2004 .....................................................................................1-16 4.3.3 Total Reservoir Inflow ..................................................................................1-20
CHAPTER 5 REVIEW OF CURRENT PROBABLE MAXIMUM FLOOD (PMF)................1-22
5.1 Background of the Review Work .................................................................................1-22 5.2 Estimation of Probable Maximum Precipitation..........................................................1-22
5.2.1 Estimation Method........................................................................................1-22 5.2.2 PMP Estimation ............................................................................................1-24
5.3 Estimation of Probable Maximum Flood.....................................................................1-26 5.3.1 Estimation Method........................................................................................1-26 5.3.2 Duration of PMP to Estimate PMF ...............................................................1-26 5.3.3 Estimation Result ..........................................................................................1-27
5.4 Evaluation of Current PMF..........................................................................................1-27 5.4.1 History of Present PMF ................................................................................1-27 5.4.2 Comparison and Evaluation of Original and Reviewed PMF.......................1-27
CHAPTER 6 EVALUATION OF PAST RESERVOIR OPERATION AND DAM
SAFETY AGAINST PMF....................................................................................1-29 6.1 Performance Evaluation of Historical Reservoir Operation ........................................1-29
6.1.1 Historical Outflow from Wonogiri Reservoir ...............................................1-29 6.1.2 Reservoir Operation for Flood Control.........................................................1-29
6.2 Evaluation of Dam Safety against PMF.......................................................................1-30 6.2.1 Base Condition of Reservoir Operation for Flood Control...........................1-30 6.2.2 Simulation of Reservoir Operation against PMF under Current
Sedimentation Condition ..............................................................................1-30 6.2.3 Evaluation of Dam Safety against PMF under Past Reservoir Operation ....1-30
6.3 Evaluation of Outflow Capacity of Existing Spillway.................................................1-31 6.3.1 Determination of Peak Outflow Discharge from Spillway ...........................1-31 6.3.2 Design Standard of Spillway in Indonesia....................................................1-31

iii
6.3.3 Evaluation of Outflow Capacity of Existing Spillway..................................1-32 CHAPTER 7 RECOMMENDATIONS......................................................................................1-33
7.1 Present Condition of Hydrological Data Accumulation...............................................1-33 7.1.1 Rainfall Gauging Station...............................................................................1-33 7.1.2 Discharge Measurement................................................................................1-33 7.1.3 Data Accumulation .......................................................................................1-34
7.2 Recommendation .........................................................................................................1-34
List of Tables
Table 2.1 Mean Monthly Basin Rainfall by Major Tributary in the Wonogiri Dam Catchment (1976-2005)........................................................................................1-5
Table 2.2 Discharge Measurement Record at Major Stations on downstream of the Wonogiri Dam ......................................................................................................1-6
Table 2.3 Discharge Measurement Records in tributaries Flow into the Wonogiri Reservoir...............................................................................................................1-6
Table 3.1 Catchment Area at Observation Point.................................................................1-10 Table 3.2 Summary of Observation of Water Level and Discharge Measurement.............1-11 Table 3.3 Frequency of Suspended Sediment Sampling ....................................................1-11 Table 3.4 H-Q Curves of Tributaries ..................................................................................1-12 Table 3.5 Result of Discharge Measurement........................................................................T-1 Table 4.1 Estimated Monthly Dam Inflow .........................................................................T-15 Table 4.2 Summary of Estimated Wonogiri Reservoir Inflow Volume ..............................1-14 Table 4.3 Estimated Large Floods into the Wonogiri Reservoir.........................................1-15 Table 4.4 Thiessen Weight on Each Tributary's Basin .......................................................T-16 Table 4.5 Parameter of the Runoff Model ..........................................................................T-17 Table 4.6 Catchment Area of Each Tributary and Remnant Area ......................................1-20 Table 4.7 Estimated Mean Monthly Dam Inflow from 5 Major Tributaries and
Remnant Area (Nov. 1993 – Jun. 2005) .............................................................1-21 Table 4.8 Estimated Monthly Inflow from Major Tributaries and Remnant Area .............T-18 Table 5.1 Rainfall Data on Selected Stations .....................................................................1-23 Table 5.2 Adjusted Mean Annual Maximum Rainfall........................................................1-24 Table 5.3 Adjusted Standard Deviation..............................................................................1-25 Table 5.4 Adjusted Function of Rainfall Duration and Mean Annual Maximum
Rainfall ...............................................................................................................1-25 Table 5.5 Estimated PMP on Wonogiri Reservoir Watershed ............................................T-20 Table 5.6 Comparison of Original & Reviewed PMF........................................................1-28 Table 6.1 Monthly Dam Outflow Volume (1983 - 2005) ...................................................T-21 Table 6.2 Reservoir Operation Rule for Flood Control ......................................................1-29 Table 6.3 Annual Maximum RWL during Flood Period ....................................................T-22 Table 6.4 Determined Water Levels & Peak Discharge of Inflow & Outflow ...................1-31

iv
Table 6.5 Standard Criteria for Flood Design and Capacity for Spillway of Dam.............1-32
List of Figures
Figure 2.1 Availability of Meteorological Data in the Study Area ........................................F-1 Figure 2.2 Location of Meteorological Station in the Study Area .........................................F-2 Figure 2.3 Mean Monthly Temperature in the Study Area.....................................................1-2 Figure 2.4 Mean Monthly Humidity in the Study Area .........................................................1-3 Figure 2.5 Mean Monthly Wind Velocity in the Study Area..................................................1-3 Figure 2.6 Monthly Mean Daily Evaporation in the Study Area ...........................................1-3 Figure 2.7 Availability of Daily Rainfall on Selected Station in and around Wonogiri
Reservoir Watershed.............................................................................................F-3 Figure 2.8 Location of Selected Rainfall Station ...................................................................F-4 Figure 2.9 Availability of Hourly Rainfall Data in and around the Wonogiri Reservoir
Watershed .............................................................................................................F-5 Figure 2.10 Isohyetal Map of Annual Rainfall for the Wonogiri Dam Catchment ..................1-4 Figure 2.11 Hourly Water Level Hydrograph at Ngadipiro on the Keduang River in
February 1991.......................................................................................................1-5 Figure 2.12 Availability of Water Level and Daily Discharge Data in the Study Area............F-6 Figure 2.13 River Water Level Stations in the Study...............................................................F-7 Figure 2.14 Daily Discharge Hydrograph................................................................................F-8 Figure 2.15 Relationship between Runoff Depth and Basin Mean Rainfall on Each
Tributary ...............................................................................................................1-7 Figure 3.1 Location of Hydrological Observation and Sampling Survey............................1-10 Figure 3.3 HQ-curve Based on the Result of Discharge Measurement ...............................F-17 Figure 3.4 Hydrograph of Observed Discharge in Major Tributaries ..................................F-19 Figure 4.1 Availability of Hourly Dam Operation Record...................................................1-13 Figure 4.2 Estimated Annual Mean Dam Inflow (1983 – 2005)..........................................1-14 Figure 4.3 Estimated Mean Monthly Dam Inflow (1983 – 2005) .......................................1-15 Figure 4.4 Estimated Hydrograph of Large Flood Inflowing into the Wonogiri
Reservoir.............................................................................................................1-15 Figure 4.5 Estimation Procedure of Hourly Reservoir Inflow.............................................F-21 Figure 4.6 Thiessen Polygon over the Wonogiri Watershed ................................................1-17 Figure 4.7 Estimated Correlation Coefficient for Each Station ...........................................F-22 Figure 4.8 Long- and Short-Term Runoff Model; LST Runoff Model ................................1-18 Figure 4.9 Relation between Storage Depth and Filtration..................................................1-19 Figure 4.10 Relation between Storage Dept and Evaporation ...............................................1-19 Figure 4.11 Calibration of Runoff Model ..............................................................................F-27 Figure 4.12 Calculated Hourly Discharge by Runoff Model at Gauge Station in Major
Tributaries (Nov. 1993 - Oct. 2004) ...................................................................F-32 Figure 4.13 Estimated Hourly Discharge Hydrograph (Nov. 1993 - Apr. 2005) ...................F-37 Figure 5.1 Adjustment of Fixed Interval precipitation Amounts for number of
Observational Units within the Interval [Weiss, 1964].......................................1-23

v
Figure 5.2 Adjustment of Mean Annual Series for Maximum Observed Rainfall [Hershfield, 1961]...............................................................................................1-24
Figure 5.3 Adjustment of Mean and Standard Deviation of Annual Series for Length of Record [Hershfield, 1961]..............................................................................1-24
Figure 5.4 Adjustment of Standard Deviation of Annual Series for Maximum Observed Rainfall [Hershfield, 1961].................................................................1-25
Figure 5.5 Adjustment of Km as a Function of Rainfall Duration and Mean Annual Series for Maximum Observed Rainfall [Hershfield, 1965]...............................1-25
Figure 5.6 Area Reduction Factor in Wonogiri Reservoir Watershed..................................1-26 Figure 5.7 Timing of Maximum Hourly Rainfall in Major Storms .....................................1-26 Figure 5.8 Accumulated Rainfall Curves at Jatisrono Station .............................................F-43 Figure 5.9 Estimated PMF Hydrograph...............................................................................1-27 Figure 5.10 Relationship between PMF and Catchment Area in Jawa Island .......................1-28 Figure 6.1 Mean Monthly Outflow from Wonogiri Dam.....................................................1-29 Figure 6.2 Historical Wonogiri Reservoir Operations .........................................................F-44 Figure 6.3 Reservoir Operation for PMF under Present Condition .....................................1-30 Figure 6.4 Annual Maximum Stored Water Exceeding CWL during Flood Period ............1-31

The Study on Countermeasures for Sedimentation Final Report in the Wonogiri Multipurpose Dam Reservoir Supporting Report Annex No.1
Nippon Koei Co.,Ltd. 1-1 July 2007 Yachiyo Engineering Co.,Ltd.
CHAPTER 1 INTRODUCTION
The purpose of hydrologic investigation and analyses in the JICA study is to understand the characteristics of Wonogiri reservoir inflow. Collected and analyzed hydrological data is utilized for several analyses in the study on countermeasures for sedimentation in the Wonogiri reservoir. The analyses for study on countermeasures are reservoir sediment analysis, turbidity analysis for down stream, dam safety analysis for PMF and preliminary design of structural sediment management alternatives. The hydrologic investigation and analyses were carried out around two years from August 2004 to end of May 2006.
This supporting report presents the results of hydrological study carried out in the course of the JICA study.
The main objectives of the study are: i) To collect and evaluate existing hydrological data ii) To investigate river discharge and sediment discharge on major tributaries flow into
the reservoir iii) To estimate the reservoir inflow iv) To review Probable Maximum Flood in Wonogiri dam catchment v) To evaluate the past reservoir operation Moreover, recommendation for hydrological data accumulation is presented in final chapter.

The Study on Countermeasures for Sedimentation Final Report in the Wonogiri Multipurpose Dam Reservoir Supporting Report Annex No.1
Nippon Koei Co.,Ltd. 1-2 July 2007 Yachiyo Engineering Co.,Ltd.
CHAPTER 2 HYDRO-METEOROLOGICAL CONDITION
2.1 Climate
2.1.1 General
The climate of the Study Area is tropical and is subject to the tropical monsoon. The south-west to north-west winds prevail from November to April in ordinary year and they bring rainy season to the river basin. While in the period from July to October, the basin area is dried up by the south and south-east monsoon.
There are 6 meteorological stations scattered in the Study Area. The observation works is by several agencies such as PBS, DPMA and Indonesian Air Force. The oldest Panasan station has a period of operation since 1972. Most of the stations have duration period of the record from 1987 up to 2005 with some interruption.
Hydro-meteorological data used for this study was collected from PBS and Irrigation Services, and also taken from previous water resources development project reports. The hydro-meteorological data used to analyze the climate in the basin are collected from 6 stations. The availability of meteorological data record for each station and the location of the stations are presented in Figures 2.1 and 2.2, respectively.
2.1.2 Temperature
Mean annual temperature at the Wonogiri dam is approximately 29.3 ºC and it slightly fluctuates from the minimum mean monthly temperature of 28.3 ºC on July to the maximum mean monthly temperature of 30.4 ºC on October. Temperature in the dry season (especially from June through August) is relatively low degree. Mean monthly temperature is graphically shown in below.
26
27
28
29
30
31
Jan.
Feb.
Mar
.
Apr
.
May
Jun.
Jul.
Aug
.
Sep
.
Oct
.
Nov
.
Dec
.
TEM
PE
RA
TUR
E (℃
)
Wonogiri DamSurakarta
Figure 2.3 Mean Monthly Temperature in the Study Area
2.1.3 Relative Humidity
Annual mean relative humidity is approximately 77.4% in the dam catchment (Baturetono). The maximum mean monthly relative humidity is 79.7% in December, while the minimum of that is 75.4% in October at Baturetono. Mean monthly relative humidity is graphically shown in below.

The Study on Countermeasures for Sedimentation Final Report in the Wonogiri Multipurpose Dam Reservoir Supporting Report Annex No.1
Nippon Koei Co.,Ltd. 1-3 July 2007 Yachiyo Engineering Co.,Ltd.
65
70
75
80
85
Jan.
Feb.
Mar
.
Apr
.
May
Jun.
Jul.
Aug
.
Sep
.
Oct
.
Nov
.
Dec
.
HU
MID
ITY
(%)
BaturetonoSurakarta
Figure 2.4 Mean Monthly Humidity in the Study Area
2.1.4 Wind Velocity
Annual mean wind velocity in the dam catchment (Baturetono) is 2.31 m/s. Maximum mean monthly wind velocity at Baturetono is 3.47 m/s in October, while the minimum of that is 1.53 m/s in April.
1
2
3
4
Jan.
Feb.
Mar
.
Apr
.
May
Jun.
Jul.
Aug
.
Sep
.
Oct
.
Nov
.
Dec
.
VE
LOC
ITY
(m/s
ec)
BaturetonoSurakarta
Figure 2.5 Mean Monthly Wind Velocity in the Study Area
2.1.5 Evaporation
Annual mean evaporation rate at the Wonogiri dam is 5.3 mm/day. Evaporation in the dry season of July to November is relatively higher than that in the wet season of December to June. Monthly mean daily evaporation rate is graphically shown in below.
0
2
4
6
8
10
Jan.
Feb.
Mar
.
Apr
.
May
Jun.
Jul.
Aug
.
Sep
.
Oct
.
Nov
.
Dec
.
Eva
pora
tion
(mm
/day
)
Surakarta (1975-2005)Wonogiri Dam (1983-2005)
Figure 2.6 Monthly Mean Daily Evaporation in the Study Area
2.2 Rainfall
2.2.1 Availability of Daily Rainfall Record
The rainfall data on the Study Area are available from a number of sources. Of them, the primary one being the Irrigation Services and other sources are belong to PBS and BMG offices which operate rainfall monitoring stations in the Study Area.
Based on availability and reliability of data in and around the Wonogiri dam catchment, thirty six (36) rainfall stations are selected to analyze the rainfall condition of the Study

The Study on Countermeasures for Sedimentation Final Report in the Wonogiri Multipurpose Dam Reservoir Supporting Report Annex No.1
Nippon Koei Co.,Ltd. 1-4 July 2007 Yachiyo Engineering Co.,Ltd.
Area. The availability of daily rainfall on collected station and their location are presented in Figures 2.7 and 2.8.
2.2.2 Availability of Hourly Rainfall Record
Hourly rainfall data in and around the Wonogiri dam catchment are available on 8 stations. The record period is presented in Figure 2.9.
2.2.3 Availability of Hourly Rainfall Record
As shown in Figure 2.10, an isohyetal map of mean annual rainfall over the Wonogiri dam catchment is worked out based on the rainfall data at the selected 36 stations for the period from 1983 to 2005. Further, the basin average rainfall for each tributary is estimated by mean of the arithmetical mean method. Table below shows the estimated mean monthly basin rainfall for five (5) major tributaries. The table shows that annual rainfalls in the two (2) tributary basins, the Keduang and Tirtomoyo River basins, are considerably higher than those in other three (3) major tributary basins.
Figure 2.10 Isohyetal Map of Annual Rainfall for the Wonogiri Dam Catchment

The Study on Countermeasures for Sedimentation Final Report in the Wonogiri Multipurpose Dam Reservoir Supporting Report Annex No.1
Nippon Koei Co.,Ltd. 1-5 July 2007 Yachiyo Engineering Co.,Ltd.
Table 2.1 Mean Monthly Basin Rainfall by Major Tributary in the Wonogiri Dam Catchment (1976-2005)
(Unit: mm)Month
Tributary Basin J F M A M J J A S O N D
Annual
Keduang 393 353 326 215 90 62 32 22 30 104 236 287 2,148
Tirtomoyo 394 374 340 229 90 72 32 13 22 72 205 282 2,124
Temon 339 326 289 181 75 57 21 10 14 61 160 274 1,807Bengawan Solo 340 317 276 170 84 61 22 12 19 58 155 243 1,757Alang 326 289 256 154 66 61 24 10 18 51 159 237 1,671Remaining Area 341 315 283 181 85 61 32 15 17 77 167 236 1,812Whole Catchment 369 336 307 201 89 64 31 16 24 82 198 274 1,990
Source: JICA Study Team
2.3 Discharge
2.3.1 River Water Level
According to the CDMP report, observation of river water level had been carried out in many places along the Bengawan Solo and its tributaries. Two types gauge i.e., ordinary staff gauge and automatic water level recorder (AWLR) are commonly installed to measure the stage of water surface. The staff gauges are normally read three times a day, in the morning, afternoon and evening, and the average of these three values is applied as daily water level record. Further, in the Wonogiri dam catchment, river water level records were collected from a number of agencies, the primary one is the PBS office and the other sources belong to the Watershed Management Technology Center of Surakarta (BTPDAS) and Balai Pengelolaan Sumber Daya Air (Balai PSDA).
The hourly water level at Ngadipiro on the Keduang River in February 1991 is shown in Figure 2.11 below. The February 1991 flood is one of large floods in the year. The flood records indicate that the February 1991 flood with duration of about 24 hours is a typical flood pattern in the tributary basin. Besides, the flood concentration time is generally as short as 2 to 3 hours.
11 - 13 Feb. 1991
0.0
0.5
1.0
1.5
2.0
2.5
3.0
12:0
0
18:0
0
0:00
6:00
12:0
0
18:0
0
0:00
6:00
12:0
0
18:0
0
0:00
6:00
12:0
0
Gau
ge H
eigh
t (m
)
Source: BTP DAS
Figure 2.11 Hourly Water Level Hydrograph at Ngadipiro on the Keduang River in February 1991
Recorded charts are available stations in Keduang River, Alang River and Wuryantoro River but a lot of charts are not readable because of ink spread or thin ink lines. Any stations do not have continuous records or any recorded charts are not tabulated. Water level staff gauges are sometimes moved vertically by agencies because of river bed erosion. In addition, a lot of rapid water level changes are recorded in dry season without reasonable causes. It is noted that river water level record comprises numerous incorrect

The Study on Countermeasures for Sedimentation Final Report in the Wonogiri Multipurpose Dam Reservoir Supporting Report Annex No.1
Nippon Koei Co.,Ltd. 1-6 July 2007 Yachiyo Engineering Co.,Ltd.
data.
2.3.2 Discharge Measurement, H-Q Curve and Runoff Record
(1) Downstream of Wonogiri Dam
Discharge measurement has been made at 34 locations along the Bengawan Solo River from 1968. Table below lists the discharge measurement data at the collected major stations which period is up to end of December 2005.
Table 2.2 Discharge Measurement Record at Major Stations on downstream of the Wonogiri Dam
No. Station Period No. of Observation 1 Juranggempal 1975 –2005 65 2 Paseban 1978 –1986 25 3 Jarum 1977 –1995 120 4 Serenan 1988 –2005 104 5 Tegalgondo 1983 –1985 29 6 Peren 1979 –1990 68 7 Jurug 1969 –2005 292 8 Grompol 1983 –1989 17 9 Mungkung 1988 –1989 21 10 Kenatan 1988 –1989 15 11 Kajangan 1975 –1995 99
Source: JICA Study Team
(2) Wonogiri Dam Catchment Area
The discharge measurement had been carried out at 7 locations in major tributaries flowing into the Wonogiri reservoir as listed below which period is up to end of December 2005.
Table 2.3 Discharge Measurement Records in tributaries Flow into the Wonogiri Reservoir
No. River Station Period No. of Observation 1 Keduang Ngadipiro 1989 – 1997 88 2 Keduang Sembukan 1981 – 1987 24 3 Tirtomoyo Sulingi 1989 – 1995 68 4 Temon Duwer Lor 1989 – 1997 27 5 Bengawan Solo Ngrembang 1980 – 1995 149 6 Alang Jatisawit 1989 – 1997 27 7 Wuryantoro Tiken 1989 – 1997 22
Source: JICA Study Team
According to the information from PBS counterpart, the observation works are not carried out since 1998. In addition, only tabulated daily discharges and river water level and discharge rating curves (H-Q curve) are available and water level records are no available in some observation record because of terrible safekeeping condition and tabulating procedure. Availability of water level record and daily discharge and the location map are presented in Figures 2.12 and 2.13, respectively.
2.3.3 Daily Discharge
Figure 2.14 (1) to (3) show daily discharge hydrograph at Jarum, Jurug and Kajangan stations on Bengawan Solo. Available daily discharge hydrographs of five major tributaries in the Wonogiri catchment are examined, however as seen, these hydrograph

The Study on Countermeasures for Sedimentation Final Report in the Wonogiri Multipurpose Dam Reservoir Supporting Report Annex No.1
Nippon Koei Co.,Ltd. 1-7 July 2007 Yachiyo Engineering Co.,Ltd.
contain many unreasonable high flows and unrealistic changes from the hydrological point of view. Then reliability of the daily discharge data is examined in terms of the relationship between the annual runoff and annual basin rainfall. Plots below show the comparison results at each tributary.
In comparison the estimated runoff coefficient of the Wonogiri reservoir inflow is used. It is assumed that difference of runoff ratio between the reservoir inflow and river discharge approximately less than 0.1 in each year is hydrologically acceptable. As a result, most observed daily discharge is assessed unreliable because most of the coefficients are plotted far outside of the acceptable range.
Keduang Ngadipiro
0
1,000
2,000
3,000
4,000
5,000
0 1,000 2,000 3,000 4,000 5,000
Rainfall (mm)
Run
off D
epth
(mm
)
Max. Runoff Ratio of Dam InflowMin. Runoff Ratio of Dam Inflow
Keduang Sembukan
0
1,000
2,000
3,000
4,000
5,000
0 1,000 2,000 3,000 4,000 5,000
Rainfall (mm)
Run
off D
epth
(mm
)
Max. Runoff Ratio of Dam InflowMin. Runoff Ratio of Dam Inflow
Tirtomoyo
0
1,000
2,000
3,000
0 1,000 2,000 3,000
Rainfall (mm)
Run
off D
epth
(mm
)
Max. Runoff Ratio of Dam InflowMin. Runoff Ratio of Dam Inflow
Bengawan Solo
0
1,000
2,000
3,000
4,000
5,000
0 1,000 2,000 3,000 4,000 5,000
Rainfall (mm)
Run
off D
epth
(mm
)
Max. Runoff Ratio of Dam InflowMin. Runoff Ratio of Dam Inflow
Alang
0
1,000
2,000
3,000
0 1,000 2,000 3,000
Rainfall (mm)
Run
off D
epth
(mm
)
Max. Runoff Ratio of Dam InflowMin. Runoff Ratio of Dam Inflow
Temon
0
1,000
2,000
3,000
0 1,000 2,000 3,000
Rainfall (mm)
Run
off D
epth
(mm
)
Max. Runoff Ratio of Dam InflowMin. Runoff Ratio of Dam Inflow
Wuryantoro
0
1,000
2,000
3,000
4,000
0 1,000 2,000 3,000 4,000
Rainfall (mm)
Run
off D
epth
(mm
)
Max. Runoff Ratio of Dam InflowMin. Runoff Ratio of Dam Inflow
Figure 2.15 Relationship between Runoff Depth and Basin Mean Rainfall on Each Tributary
Both of the hourly water level and discharge records are not tabulated by any agencies and only water level chart records are available only stations in Keduang, Alang and Wuryantoro Rivers. Revision work on the existing H-Q curves is required for discharge measurement records and river cross section condition in each period. However, the number and period of discharge measurement records is quite limited and no river cross section data in each period is available. So revision work is very difficult at the current condition.

The Study on Countermeasures for Sedimentation Final Report in the Wonogiri Multipurpose Dam Reservoir Supporting Report Annex No.1
Nippon Koei Co.,Ltd. 1-8 July 2007 Yachiyo Engineering Co.,Ltd.
2.3.4 Hourly Discharge
Hourly discharge data on major tributaries are required to carry out the simulation for the reservoir sedimentation analysis, because sediment inflow volume is highly dependent on the magnitude of peak discharge of floods. Although water level records in chart at only 3 stations could be obtained in the field investigation, the available data periods and accuracy of past hydrological data observed at stream flow gauging stations on the major tributaries, it is judged that it is too hard to estimate the inflow to reservoir from each tributary based thereon. Hence, hourly reservoir inflows from five major tributaries in 1993-2005 were estimated based on the reservoir operation records. Hourly discharge records at major tributaries that were observed under the Study were available only the wet season from November 2004 to May 2005. In other period for 1993-2004, simulated hourly discharges as well as hourly reservoir operation records were used. The estimation would be discussed on section 4.3 in this report.

The Study on Countermeasures for Sedimentation Final Report in the Wonogiri Multipurpose Dam Reservoir Supporting Report Annex No.1
Nippon Koei Co.,Ltd. 1-9 July 2007 Yachiyo Engineering Co.,Ltd.
Float for flow velocity measurement
CHAPTER 3 RESULTS OF HYDROLOGIC INVESTIGATION
3.1 Purpose of the Hydrologic Investigation
The purpose of the hydrologic investigation is observation of discharge and wash load including particle size analysis on major tributaries flowing into the Wonogiri reservoir to construct relation curves between river discharge and wash load. Constructed curves would be used estimation of sediment inflow into the reservoir during the wet season.
3.2 Contents of Hydrologic Investigation
Hydrologic Investigation covers following works: i) Hydrologic investigation at the fringe of the
Wonogiri reservoir where five major tributaries flow in the reservoir.
- Installation of water level staff gauges and observation of water levels
- Observation of discharge at new water level staff gauges
- Sampling of suspended solid (wash load) and its concentration and particle size analyses
ii) Sampling survey around the intake of the Wonogiri dam and in the immediately downstream of the dam.
- Sampling of suspended solid (wash load) and its concentration and particle size analyses
3.3 Location
The Wonogiri watershed is drained by five major tributaries. They are the Upper Bengawan Solo, Keduang, Tirtomoyo, Temon and Alang Rivers. Keduang River is the largest tributary a catchment of 421 km2, or 34% of the total Wonogiri watershed rising on the western slope of Mt. Lawu. Under the current study, staff gauges were newly installed for hydrological investigation in October 2004 where these tributaries flow into the reservoir. The water level gauging station at Temon River was replaced to upstream in June 2005 because the original observation station installed in 2004 was affected by reservoir back water during the wet season. Observation of the water level, discharge measurement and sampling of suspended solid (wash load) were carried out on the places of gauging stations. On the other hand, sampling survey around the intake of the Wonogiri dam and in the immediately downstream of the dam is also carried out. Locations of the observation and sampling and catchment area at observation point are shown below,
Sampling Bottle for Density Analysis
Sampling Bucket for Particle Size Analysis

The Study on Countermeasures for Sedimentation Final Report in the Wonogiri Multipurpose Dam Reservoir Supporting Report Annex No.1
Nippon Koei Co.,Ltd. 1-10 July 2007 Yachiyo Engineering Co.,Ltd.
respectively.
Table 3.1 Catchment Area at Observation Point River Catchment Area (km2)
Keduang 397 Tirtomoyo 186 Temon 92 Bengawan Solo 183 Alang 162
Source: JICA Study Team
Source: JICA Study Team
Figure 3.1 Location of Hydrological Observation and Sampling Survey
3.4 Observation Period
3.4.1 Observation of River Water Level and Discharge Measurement
Observation of river water level and discharge measurement were carried out on two periods as below.
First period (2004/2005) : 1 November 2004 - 15 May 2005 Second period (2005/2006) : 1 June 2005 - 31 May 2006
Water level observation was made twice a day at 6:00 and 18:00 during times of non-flood and hourly reading of water level was made in times of floods. Hydrological observation is summarized below.

The Study on Countermeasures for Sedimentation Final Report in the Wonogiri Multipurpose Dam Reservoir Supporting Report Annex No.1
Nippon Koei Co.,Ltd. 1-11 July 2007 Yachiyo Engineering Co.,Ltd.
Table 3.2 Summary of Observation of Water Level and Discharge Measurement Item Cumulated Hourly Observation (hr) Nos. of Discharge Measurement
Period First
(2004/2005) Second
(2005/2006) First
(2004/2005) Second
(2005/2006) Keduang 182 131 141 27 Tirtomoyo 410 306 165 57 Temon 92 95 78 13 Bengawan Solo 183 89 133 23 Alang 162 111 67 33
Source: JICA Study Team
3.4.2 Sampling of Suspended Sediment and Particle Size Analysis
Sampling of suspended sediment (wash load) was also carried out at the same staff gauges and on the Bengawan Solo immediately downstream of the dam. Sediment concentration monitoring period was same as that of observation of water level and discharge measurement.
Sampling was made two ways; bottle sampling for concentration analysis and large bucket sampling for particle size analysis. Table 3.3 shows frequency of sediment concentration monitoring.
Table 3.3 Frequency of Suspended Sediment Sampling Item Concentration Analysis Particle Size Analysis
Period First
(2004/2005) Second
(2005/2006) First
(2004/2005) Second
(2005/2006) Keduang 174 21 49 11 Tirtomoyo 326 18 49 10 Temon 102 25 25 17 Bengawan Solo 172 9 21 1 Alang 125 13 14 6 Upstream of the dam 29 14 11 6 Downstream of the dam 482 12 15 31
Source: JICA Study Team
3.5 Results of the Hydrologic Investigation
3.5.1 H-Q Curves
The number of discharge measurements and obtained equation of H-Q curve in each tributary are summarized in Table 3.4. The H-Q curve of the Keduang, Tirtomoyo, Bengawan Solo Rivers for 2005/2006 are up dated. The H-Q curve the Temon and Alang Rivers for 2005/2006 are newly prepared by use of discharge measurement data in 2005/2006 because the gauging station in the Temon River was replaced and the condition of the river cross section at the gauging station in the Alang River is so much changed. The records of discharge measurement in each tributary are shown in Tables 3.5 (1) to (5). Figure 3.3 (1) and (2) present the obtained H-Q curves of tributaries.

The Study on Countermeasures for Sedimentation Final Report in the Wonogiri Multipurpose Dam Reservoir Supporting Report Annex No.1
Nippon Koei Co.,Ltd. 1-12 July 2007 Yachiyo Engineering Co.,Ltd.
Table 3.4 H-Q Curves of Tributaries No. River Nos.
SamplesH-Q Curve Correlation
Coefficient 2004/2005
1 2 3 4 5
Keduang Tirtomoyo Temon Bengawan Solo Alang
141 165 60
133 67
Q = 29.763 h2 + 92.848 h + 42.4 Q = 2.434 h2 + 46.151 h – 5.6 Q = 14.820 h2 + 23.175 h + 8.512 Q = 7.020 h2 + 45.549 h + 18.6 Q = 24.837 h2 + 14.690 h + 3.0 (h < 1.0 m) Q = 186.930 h2 – 356.020 h + 215.66 (h >= 1.0 m)
0.967 0.942 0.990 0.959 0.946
0.946
2005/2006 1 2 3 4 5
Keduang Tirtomoyo Temon Bengawan Solo Alang
168 222 13
156 33
Q = 50.491 h2 + 66.367 h + 41.0 Q = 3.6956 h2 + 28.308 h – 5.0 Q = 0.089 h2 + 11.959 h + 5.300 Q = 7.351 h2 + 47.284 h + 18.0 Q = 38.786 h2 + 26.073 h
0.948 0.889 0.941 0.951 0.835
Note: “h” is gauge reading (m) Source: JICA Study Team
3.5.2 Discharge on Five Major Tributaries
River discharges on five major tributaries during the observation periods are computed by use of the observed water levels and H-Q curves. The observed discharge hydrographs are shown in Figure 3.4. As seen, large floods occurred almost simultaneously over the Wonogiri watershed.

The Study on Countermeasures for Sedimentation Final Report in the Wonogiri Multipurpose Dam Reservoir Supporting Report Annex No.1
Nippon Koei Co.,Ltd. 1-13 July 2007 Yachiyo Engineering Co.,Ltd.
CHAPTER 4 RESERVOIR INFLOWS FROM FIVE MAJOR TRIBUTARIES AND REMNANT AREA
4.1 Estimation of Reservoir Inflow
4.1.1 Wonogiri Reservoir Operation Record
The reservoir operation of the Wonogiri dam has been recorded since 1983. The daily operation records comprising the reservoir water level and outflow from turbine, spillway and hollow-jet are available completely for the period from 1983 to 2005. The hourly records have been recorded by the office of the hydropower station (PLTA Wonogiri), but the complete records for the period from 1983 to 1994 are not available. Availability of hourly dam operation record is presented in Figure 4.1.
Jan. Feb. Mar. Apr. May Jun. Jul. Aug. Sep. Oct. Nov. Dec.19831984198519861987198819891990199119921993199419951996199719981999200020012002200320042005
: Complete data : No data Source: JICA Study Team
Figure 4.1 Availability of Hourly Dam Operation Record
4.1.2 Estimation Method
The net inflow into the Wonogiri reservoir is estimated on a daily basis from the reservoir operation records of the Wonogiri dam. The estimation is carried out by following equation of continuity: Ii = (Si – Si-1) + Oi – R + E where, Ii : Net reservoir inflow on i-th day Si : Reservoir storage volume on i-th day Si-1 : Reservoir storage volume on (i-1)-th day Oi : Reservoir outflow on i-th day R : Rainfall in reservoir between days from i-1 to i E : Evaporation in reservoir between days from i-1 to i Igi = Ii + R where, Igi : Gross reservoir inflow on i-th day

The Study on Countermeasures for Sedimentation Final Report in the Wonogiri Multipurpose Dam Reservoir Supporting Report Annex No.1
Nippon Koei Co.,Ltd. 1-14 July 2007 Yachiyo Engineering Co.,Ltd.
Reservoir storage is calculated by use of newly H-V curve produced under the current Study. The open pan evaporation record at the Wonogiri dam office is used for estimation of evaporation in the reservoir. The daily rainfall over the reservoir is also estimated from the average daily rainfall at nearby stations. The reservoir outflow usually comprises the water release of power generation and spill-out discharge from the spillway. During this wet season, reservoir water did not spill out from the reservoir due to smaller volume of reservoir inflow in 2004/2005.
4.1.3 Estimation Result
The estimated Wonogiri reservoir inflow volume is summarized and shown in Table 4.2 and Figure 4.2 respectively. It is noted that wet season in 2004-2005 is categorized as the dry year from the hydrological viewpoint. As for basin mean rainfall over the Wonogiri watershed in the period from November to the mid May, it is estimated 1,663 mm in 2004-2005 and 1,990 mm on mean annual rainfall of 1976-2005. The annual mean monthly inflow in to the Wonogiri reservoir for the period from 1983 to 2005 is shown in Figure 4.3.
Table 4.2 Summary of Estimated Wonogiri Reservoir Inflow Volume (Unit: million m3/year)
Period Net Inflow
Ii Gross Inflow
Igi 2004/20051 751 860 1983-20052 1,073 1,231
Source: JICA Study Team
0
200
400
600
800
1,000
1,200
1,400
1,600
1,800
1983
/84
1984
/85
1985
/86
1986
/87
1987
/88
1988
/89
1989
/90
1990
/91
1991
/92
1992
/93
1993
/94
1994
/95
1995
/96
1996
/97
1997
/98
1998
/99
1999
/00
2000
/01
2001
/02
2002
/03
2003
/04
2004
/05
Dam
Inflo
w V
olum
e (M
il. m
3 )
Hydrological Year: From November to October
Mean Annual: 1,231 million m3
Figure 4.2 Estimated Annual Mean Dam Inflow (1983 – 2005)
1 2004/2005: Cumulated inflow volume from November 1, 2004 to October 31, 2005 2 1983-2005: Average inflow volume of November 1 to October 31 which period of 1983 to 2005

The Study on Countermeasures for Sedimentation Final Report in the Wonogiri Multipurpose Dam Reservoir Supporting Report Annex No.1
Nippon Koei Co.,Ltd. 1-15 July 2007 Yachiyo Engineering Co.,Ltd.
0
50
100
150
200
250
300
Jan
Feb
Mar
Apr
May Ju
n
Jul
Aug
Sep Oct
Nov
Dec
Mea
n M
onth
ly In
flow
(Mil.
m3 )
Figure 4.3 Estimated Mean Monthly Dam Inflow (1983 – 2005)
4.2 Large Flood Inflows into the Wonogiri Reservoir
The inflow hydrograph of large flood into the reservoir are derived based on the hourly reservoir operation records for 1983-2005. The estimated large floods are presented in Table 4.3 and Figure 4.4 below:
Table 4.3 Estimated Large Floods into the Wonogiri Reservoir Year Occurrence Date Peak Discharge (m3/s) Inflow Volume (million m3)1983 April 14 to 18 2,660 80.8 1984 January 4 to 5 1,650 52.3 1985 March 6 to 9 2,720 223.0 1988 February 4 to 6 2,880 130.3 1991 February 9 to 12 1,210 94.0 1992 February 12 to 15 1,210 109.6 1994 March 7 to 10 1,760 106.1 1998 December 22 to 26 1,350 37.2 2000 February 3 to 7 1,600 26.1 2003 January 2 to 5 1,010 104.9 2004 December 3 to 4 1,330 32.0
Source: JICA Study Team
Figure 4.4 Estimated Hydrograph of Large Flood Inflowing into the Wonogiri Reservoir
As seen in the table above, the Wonogiri reservoir experienced inflow of large-scale floods with peak discharge exceeded 2,000 m3/s. One of such large-scale floods occurred immediately after completion in 1980s and the largest flood peak discharge is recorded at 2,880 m3/s on February 5, 1988, followed by the 1985 year flood of 2,720 m3/s.
06 - 09 Mar. 1985
0
500
1,000
1,500
2,000
2,500
3,000
6:00
18:0
0
6:00
18:0
0
6:00
18:0
0
6:00
18:0
0
6:00
Inflo
w (m
3 /s)
Inflow
Spillway
Total Outflow
132133134135136137138
6:00
18:0
0
6:00
18:0
0
6:00
18:0
0
6:00
18:0
0
6:00
RW
L (E
l. m
)
WL
04 - 06 Feb. 1988
0
500
1,000
1,500
2,000
2,500
3,000
0:00
12:0
0
0:00
12:0
0
0:00
12:0
0
0:00
12:0
0
0:00
Inflo
w (m
3 /s) Inflow
Spillway
Total Outflow
132133134135136137138
0:00
12:0
0
0:00
12:0
0
0:00
12:0
0
0:00
12:0
0
0:00
RW
L (E
l. m
)
WL

The Study on Countermeasures for Sedimentation Final Report in the Wonogiri Multipurpose Dam Reservoir Supporting Report Annex No.1
Nippon Koei Co.,Ltd. 1-16 July 2007 Yachiyo Engineering Co.,Ltd.
4.3 Estimation of Hourly Reservoir Inflows
4.3.1 Background and Estimation Procedure of Hourly Reservoir Inflow
Hourly wet-season reservoir inflows from major tributaries from 1993 to 2005 are required for calibration of Wonogiri reservoir sedimentation analysis model. In this calibration, accurate sediment inflow volume is crucial. Sediment inflow volume depends highly on high flows, especially flood peaks, during times of floods. As explained earlier, the collected observed hourly discharge records were evaluated low accuracy for further use.
On the other hand, available data for estimation analysis are: i) Observed hourly discharge records at five major tributaries in only one wet
season period from November 2004 to May 2005, which was undertaken by the Study,
ii) Hourly and daily Wonogiri reservoir operation records (reservoir water level, power discharge, and released discharge through spillway) from 1993 to 2005, which enables to estimate the hourly and daily reservoir inflows, and
iii) Simulated hourly discharges for five major tributaries as well as the remnant area by use of the calibrated runoff model.
Considering the available data above, hourly reservoir inflows from major tributaries from 1993 to 2005 are separately estimated. As for the wet season observation in 2004-2005, the discharges observed would inevitably contain some margin for error due to flood flows overflowing river banks, localized turbulent flows, miss observations, etc. Furthermore, the estimated hourly reservoir inflow from hourly dam operation records also inevitably contains lots of negative inflows mainly because of the data quality such as unreasonable water level drops and non-sensitive and delayed response to water level increase by flood inflows due to large size of reservoir area except some large floods indicated in section 4.2. In this regard, the daily reservoir inflow volume is set up the base for estimating the hourly reservoir inflows for the entire period of 1993-2005.
Thus observed hourly discharge records in 2004-2005 at each tributary are proportionally adjusted to the estimated daily inflow volume from the operation records. As for the hourly discharges in 1993-2004, basically the same process above was applied. The estimated hourly reservoir inflows from the hourly operation records as many as in times of floods as possible are used and allocated for each tributary. The remaining portion of hourly inflow series for each tributary is supplemented by the simulated hourly discharges by runoff model that has also been adjusted on a daily basis with the estimated daily inflow volume from the operation records. Figure 4.5 presents the estimation procedure of hourly reservoir inflow.
4.3.2 Runoff Analysis for Hourly Discharge of five (5) Major Tributaries During 1993 to 2004
(1) Rainfall Analysis
1) Thiessen Polygon Map
Thiessen polygon map over the Wonogiri watershed is prepared to estimate mean hourly rainfall over each tributary’s basin. Totally 15 rainfall stations are selected to prepare the Thiessen polygon map. Selection of rainfall station is made from the view point of availability of hourly rainfall and distribution of each location. Thiessen polygon map is given below and its weight on each tributary basin is presented in Table 4.4.

The Study on Countermeasures for Sedimentation Final Report in the Wonogiri Multipurpose Dam Reservoir Supporting Report Annex No.1
Nippon Koei Co.,Ltd. 1-17 July 2007 Yachiyo Engineering Co.,Ltd.
1 3a
5
8
12
1318
16
25
19
53
86
6
2720
Bengawan Solo
Wur
yanto
ro R
.Al
ang R
.
Bengawan Solo
Temon R
Tirtomoyo R
Keduang R
Wonogiri Dam
WonogiriReservoir
Source: JICA Study Team
Figure 4.6 Thiessen Polygon over the Wonogiri Watershed
2) Estimation of Hourly Rainfall
The missing hourly rainfall data at the selected stations were supplemented by means of the correlation analysis of monthly rainfall records between stations. For estimating the missing data, the linear regression equation is applied by assuming a simple regression as given by the following equation.
Rtarget = a x Rbase where, Rtarget : Estimated rainfall data at target station (mm) Rbase : Observed rainfall data at base station (mm)
This equation is developed on the basis of available monthly rainfall records at two stations. The estimated correlation coefficient for each station is shown in Figures 4.7 (1) to (3).
3) Basin Mean Hourly Rainfall on each Tributary’s
After the supplementation of hourly rainfall data, basin mean rainfall was estimated by the Thiessen polygon method for each tributary basin.
4) Evaporation
Open pan evaporation data at the Wonogiri dam was used for the runoff analysis.
(2) Runoff Model


The Study on Countermeasures for Sedimentation Final Report in the Wonogiri Multipurpose Dam Reservoir Supporting Report Annex No.1
Nippon Koei Co.,Ltd. 1-19 July 2007 Yachiyo Engineering Co.,Ltd.
Q5 = a5S4 where, a1 to a5 : Parameter as a size of outlet hole b2, b3 : Parameter as infiltration to lower tank Z1 to Z3 : Height of outlet hole (mm) (see Figure 4.8 above)
c) River Discharge Depth River discharge depth Q is given by summation of surface and sub-surface flows as follows:
Q = Q1 + Q2 + Q3 + Q4 + Q5 d) Filtration Filtration mechanism is built in within the top tank (see a broken line on Figure 3.8). Filtration is expressed by the following equation:
f = b1 (Z2 + Z3 – S2) The equation above is illustrated in Fig . e) Evaporation Storage on each tank decreases due to evaporation (E) as expressed by the following equations:
E = α Ep = E1 + E2 + E3 E1 =δ θ E E2 = (1 – δ) E E3 = δ (1 – θ) E θ = 1 ; S1 > 0 or S2 ≥ Z3 = S2/Z3 ; S1 = 0 and S2 < Z3 where, α : Ratio between pan evaporation
and actual evaporation (α = 1 for non-rainy day, and α = 0 for rainy day)
δ : Distribution ratio of evaporation (= 0.6) 3) Calibration of Runoff Model
Calibration of model parameters aims at verification of parameters to be used. Calibration is usually carried out to obtain the accurate/allowable fit of the observed flood hydrographs. The accuracy of calibration is mainly based on agreement of the observed and estimated flood peak discharges, shape of flood hydrographs and time to peak. The observed flood discharges used for calibration are those from hydrological investigation during the wet season in 2004-2005. Figures 4.11 (1) to (5) presents the results of calibration. Table 4.5 presents the calibrated model parameters. Further, hourly discharge data were generated by use of calibrated model parameters for the period of 1993-2004. This generation was made for the hydrological year from November to October.
In calibration, shape of hydrographs and time to peak are well reproduced for some floods. However in some events, there are significant differences. These inaccuracies might be attributed directly to the limited number of automatic rain gauges and data availability to estimate accurate storm temporal distribution over
Figure 4.9 Relation between Storage Depth and Filtration
Figure 4.10 Relation between Storage Dept and Evaporation

The Study on Countermeasures for Sedimentation Final Report in the Wonogiri Multipurpose Dam Reservoir Supporting Report Annex No.1
Nippon Koei Co.,Ltd. 1-20 July 2007 Yachiyo Engineering Co.,Ltd.
the watershed.
(3) Calculated Hourly Discharge of 5 Major Tributaries During 1993 to 2004
Figure 4.12 (1) to (5) presents calculated hourly discharge hydrograph by runoff model at gauge station in each major tributary.
4.3.3 Total Reservoir Inflow
Hourly discharge data in 2004/2005 is observation basis and in 1993/1994 to 2003/2004 are calculation basis. Both of the data are at gauge station in each major tributary.
The total Wonogiri reservoir inflow from major tributaries as well as its remnant basin is estimated by the following equations and procedures:
Qi = Qo x A / Ao where, Qi : Reservoir inflow from each tributary (m3/s) Qo : Observed discharge at the staff gauge point in each tributary (m3/s) A : Catchment area of each tributary (km2) Ao : Catchment area at the staff gauge point in each tributary (km2) QR = ∑Qo / ∑Ao x AR where, QR : Reservoir inflow from the remnant basin in western watershed (m3/s) ∑Qo : Summation of the observed discharge at the staff gauge point in each
tributary (m3/s) ∑Ao : Summation of the catchment areas at the staff gauge point in each
tributary (km2) AR : Remnant basin in western watershed (km2)
Table 4.6 below presents the applied catchment of each tributary and remnant basin.
Table 4.6 Catchment Area of Each Tributary and Remnant Area
Tributary Catchment Area
A (km2) Catchment Area at Staff Gauge
Ao (km2) Keduang 421 397.0 Tirtomoyo 231 186.0 Temon 63 46.2 Bengawan Solo 206 151.3 Alang 169 134.6 Remnant Area 152 -
Total 1,242 915.2 Source: JICA Study Team
The total Wonogiri reservoir inflow (net inflow, QW) is thus estimated as follows: QW = ∑Qi + QR
The table below shows the estimated mean monthly inflows from major tributaries on the hydrological year basis in 1993-2005.

The Study on Countermeasures for Sedimentation Final Report in the Wonogiri Multipurpose Dam Reservoir Supporting Report Annex No.1
Nippon Koei Co.,Ltd. 1-21 July 2007 Yachiyo Engineering Co.,Ltd.
Table 4.7 Estimated Mean Monthly Dam Inflow from 5 Major Tributaries and Remnant Area (Nov. 1993 – Jun. 2005)
(Unit : 106 m3 )Tributary Basin N D J F M A M J J A S O Annual
Keduang 22.9 38.7 50.0 81.1 82.6 44.6 10.7 7.5 5.0 2.2 3.2 5.9 354.3Tirtomoyo 11.6 26.7 29.9 49.0 48.5 26.9 6.3 4.4 3.4 0.6 0.3 2.8 210.4Temon 2.2 5.0 6.7 10.3 9.7 5.1 1.1 0.8 0.5 0.0 0.1 0.5 41.9Bengawan Solo 8.1 17.7 22.2 36.0 34.9 16.4 3.8 3.0 2.0 0.2 0.3 1.8 146.4Alang 7.8 15.2 18.7 27.4 30.0 12.3 3.0 2.4 1.0 0.1 0.2 1.7 119.8Remaining Area 7.0 13.6 16.5 25.5 25.0 13.7 3.5 2.5 1.7 0.4 0.6 1.8 111.7Whole Catchment 59.6 116.9 144.1 229.3 230.6 119.0 28.3 20.5 13.6 3.6 4.7 14.3 984.4
Source: JICA Study Team
Table 4.8 and Figure 4.13 (1) to (6) present estimated mean monthly inflow from major tributaries and remnant area and estimated hourly discharge hydrograph, respectively.

The Study on Countermeasures for Sedimentation Final Report in the Wonogiri Multipurpose Dam Reservoir Supporting Report Annex No.1
Nippon Koei Co.,Ltd. 1-22 July 2007 Yachiyo Engineering Co.,Ltd.
CHAPTER 5 REVIEW OF CURRENT PROBABLE MAXIMUM FLOOD (PMF)
5.1 Background of the Review Work
As of now, 25 years have passed by since the completion of Wonogiri multipurpose dam in 1981. Although it appeared under the Study that almost no change of flood control space has occurred since the dam completion. However, it might be worthy of re-evaluation of the current PMF by use of available hydrological data since the dam completion.
5.2 Estimation of Probable Maximum Precipitation
5.2.1 Estimation Method
(1) Selection of Estimation Method of PMP
The procedure described below is based on ‘Manual for Estimation of Probable Maximum Precipitation, Second Edition’ (hereafter referred to as “the Manual”) published by World Meteorological Organization (WMO) in 1986.
Statistical procedure for estimating PMP is used for the estimation because sufficient rainfall data are available in the reservoir watershed and particularly useful for making quick estimates. It is used mostly for basins of no more than about 1,000 km2, however has been used for much larger areas.
(2) Basis
PMP is estimated by the simple statistical Hershfield method using a series of the annual maximum daily rainfall records. This method is widely applied in the basin where rainfall records are available.
The Hershfield’s equation is expressed as follows:
nmnm SKXX ⋅+= where, Xm : Point value of PMP (mm) nX : Mean annual maximum rainfall (mm) Km : Function of rainfall duration and mean annual maximum rainfall Sn : Standard deviation of a series of n annual maximum rainfall
(3) Adjustment of nX , Km and Sn
1) Adjustment of nX and Sn for Maximum Observed Event
According to the manual, extreme rainfall amounts of rare magnitude or occurrence, e.g., with return period of 500 or more year, are often found to have occurred at some time during a much shorter period of record, e.g., 30 years. Such a rare event, called an outlier, may have an appreciable effect on the mean ( nX ) and standard deviation (Sn) of the annual series. The magnitude of the effect is less for long records than for short, and it varies with the rarity of the event, or outlier. This has been studied by Hershfield [1961] using hypothetical series of varying length, and Figures 5.2 to 5.4 show the adjustment to be made to nX and Sn to compensate for outlier.
2) Adjustment of Km

The Study on Countermeasures for Sedimentation Final Report in the Wonogiri Multipurpose Dam Reservoir Supporting Report Annex No.1
Nippon Koei Co.,Ltd. 1-23 July 2007 Yachiyo Engineering Co.,Ltd.
According to the manual, records of 24 hours rainfall for some 2,700 stations in the ‘climatological observation programme’ were used in the determination of an enveloping value of Km. Value of Km with mean annual maximum rainfall ( nX )is shown in Figure 5.5.
(4) Selection of Rainfall Station
Three (3) rainfall stations, i.e., Sidoharjo, Jatiroto and Jatisrono, are selected to estimate point value of PMP because of following reasons (See Figure 2.8 for location of the stations). i) The rainfall stations are located in Keduang River basin which basin has highest
annual rainfall in the reservoir watershed. Point value of PMP may mostly occur in such area from view point of rainfall record.
ii) Data availability is sufficient. Table 5.1 Rainfall Data on Selected Stations
Rainfall Station Observation Period The number of Annual Maximum Rainfall Data
n Sidoharjo 1977 - 2002 26 Jatiroto 1976 - 2005 30
Jatisrono 1973 - 1975, 1978 - 2005
31
Source: JICA Study Team
(5) Adjustment Factor (fo)
Since the recorded daily rainfall is computed based on the single fixed observation time interval (8 a.m to 8 p.m the next day), the PMP value yielded by the statistical procedure should be increased multiplying by the adjustment factor (fo). The adjustment factor curve is presented by Dr. Hersfield. Applying that the number of observation units is equal to 1, the fo value is obtained to be 113%.
Finally, the point PMP is adjusted using the adjustment factor fo as follows:
PMP = fo x Xm where, fo : Adjustment factor (= 1.13) Xm : Point value of PMP (mm)
(6) Area Reduction Factor (ARF)
In general, heavy rain storm occurs intensively in a limited area in the Wonogiri dam catchment basin. Therefore the average depth of rain storm (basin mean rainfall) is likely to be smaller than the point depth of rain storm.
Area reduction of rain storms within the Wonogiri dam catchment was analyzed based on the relationship between the basin mean daily rainfall (more than 40 mm) and its maximum point rainfall. The area reduction factor means the ratio of basin mean rainfall to point rainfall.
Source: Manual for Estimation of Probable Maximum Precipitation, Second Edition, 1986, WMO
Figure 5.1 Adjustment of Fixed Interval precipitation Amounts for number of Observational Units within the Interval [Weiss, 1964]
100
102
104
106
108
110
112
114
0 4 8 12 16 20 24
Number of Observational Units
Adj
ustm
ent F
acto
r

The Study on Countermeasures for Sedimentation Final Report in the Wonogiri Multipurpose Dam Reservoir Supporting Report Annex No.1
Nippon Koei Co.,Ltd. 1-24 July 2007 Yachiyo Engineering Co.,Ltd.
ARF = Rb / Rmax where, ARF : Area reduction factor Rb : Major basin mean daily rainfall (mm) Rmax : Maximum point rainfall (mm)
5.2.2 PMP Estimation
(1) Adjustment of Mean Annual Maximum Rainfall ( nX )
Adjusted mean annual maximum rainfalls (Xn) on three (3) stations are shown in Table 5.2.
Table 5.2 Adjusted Mean Annual Maximum Rainfall Rainfall Station Sidoharjo Jatiroto Jatisrono
Xn 93.2 84.5 84.5 Xn-m 90.4 81.0 82.0 Xn-m / Xn 0.97 0.96 0.97 Xn Adjustment Factor 1.01 0.99 1.00 Adjustment Factor (See Figure 5.2) 1.01 1.01 1.01 Adjusted Xn 95.0 84.5 85.4
Source: JICA Study Team
97
98
99
100
101
102
103
0.95 0.96 0.97 0.98
Xn-m / Xn
X n adj
ustm
ent f
acto
r (%
)
30 years record
20 years record
Sidoharjo
Jatiroto
Jatisrono
Source: Manual for Estimation of Probable Maximum Precipitation, Second Edition, 1986, WMO
Figure 5.2 Adjustment of Mean Annual Series for Maximum Observed Rainfall [Hershfield, 1961]
100
105
110
115
120
125
130
10 15 20 25 30 35 40 45 50
Length of Record (years)
Adj
ustm
ent F
acto
r (%
)
Mean
Standard Deviation
Source: Manual for Estimation of Probable Maximum Precipitation, Second Edition, 1986, WMO
Figure 5.3 Adjustment of Mean and Standard Deviation of Annual Series for Length of Record [Hershfield, 1961]

The Study on Countermeasures for Sedimentation Final Report in the Wonogiri Multipurpose Dam Reservoir Supporting Report Annex No.1
Nippon Koei Co.,Ltd. 1-25 July 2007 Yachiyo Engineering Co.,Ltd.
(2) Adjustment of Standard Deviation (Sn)
Adjusted standard deviations (Sn) on three (3) stations are shown in Table 5.3.
Table 5.3 Adjusted Standard Deviation Rainfall Station Sidoharjo Jatiroto Jatisrono
Sn 20.8 24.7 21.0 Sn-m 15.7 16.4 15.9 Sn-m / Sn 0.75 0.67 0.76 Sn Adjustment Factor 0.87 0.76 0.85 Adjustment Factor (See Figure 5.2) 1.05 1.04 1.04 Adjusted Sn 19.0 19.3 18.8
Source: JICA Study Team
70
75
80
85
90
0.65 0.70 0.75 0.80
Sn-m / Sn
S n adj
ustm
ent f
acto
r (%
)
30 years record
15 years record
Sidoharjo
Jatiroto
Jatisrono
Source: Manual for Estimation of Probable Maximum Precipitation, Second Edition, 1986, WMO
Figure 5.4 Adjustment of Standard Deviation of Annual Series for Maximum Observed Rainfall [Hershfield, 1961]
(3) Adjustment of Function of Rainfall Duration and Mean Annual Maximum Rainfall (Km)
Adjusted function of rainfall duration and mean annual maximum rainfall (Km) on three (3) stations are shown in Table 5.4.
Table 5.4 Adjusted Function of Rainfall Duration and Mean Annual Maximum Rainfall Rainfall Station Sidoharjo Jatiroto Jatisrono
Xn 93.2 84.5 84.5 Km 15.4 15.8 15.8
Source: JICA Study Team
12
14
16
18
20
0 50 100 150 200
Mean Annual Maximum Rainfall (Xn)
K m
24 hours Duration
Sidoharjo
Jatiroto
Jatisrono
Source: Manual for Estimation of Probable Maximum Precipitation, Second Edition, 1986, WMO
Figure 5.5 Adjustment of Km as a Function of Rainfall Duration and Mean Annual Series for Maximum Observed Rainfall [Hershfield, 1965]

The Study on Countermeasures for Sedimentation Final Report in the Wonogiri Multipurpose Dam Reservoir Supporting Report Annex No.1
Nippon Koei Co.,Ltd. 1-26 July 2007 Yachiyo Engineering Co.,Ltd.
(4) Area Reduction Factor (ARF)
The rainfall storms that basin average rainfall is larger than 50 mm in a day were examined to determine the area reduction factor in the Wonogiri dam catchment. Figure below presents the plots of area reduction factor. The estimated reduction factor varies from 0.400 to 0.705 and the average is 0.458 (See Table 5.5). From view point of safe, the reduction factor is preliminarily determined as 0.7 which is as maximum area reduction factor in the Wonogiri dam catchment. It is however noted that almost all the collected rain storms are relatively small and more intensive rain storms covering the entire Wonogiri dam catchment are preferably required for rainfall depth-area (D-A) analysis.
0.2
0.4
0.6
0.8
1.0
50 100 150 200 250 300
Maximum Point Daily Rainfall (mm)
Are
a R
educ
tion
Fact
or
ARF = 0.7
Figure 5.6 Area Reduction Factor in Wonogiri Reservoir Watershed
(5) PMP on Wonogiri Reservoir Watershed
Table 5.5 presents estimated PMP on Wonogiri dam catchment. As a result, the largest PMP of 307.4 mm at Jatiroto is selected as a PMP on the Wonogiri dam catchment.
5.3 Estimation of Probable Maximum Flood
5.3.1 Estimation Method
Probable Maximum Flood (PMF) is estimated by use of LST Runoff Model and its parameters of 5 major tributaries which mentioned previous section.
5.3.2 Duration of PMP to Estimate PMF
Twenty one (21) major storm records at Jatisrono rainfall station were examined to determine duration and distribution of PMP3. Timing of maximum hourly rainfall and accumulated rainfall curves at the station are presented in Figure 5.7 and 5.8, respectively. As shown in these figures, the average duration of major rainfall is approximately six (6) hours and the most of rainfall records indicate that second 1 hour rainfall in the duration is quite intense.
02468
1012
1 2 3 4 5 6 7 8 9 10
Timing of Maximum Hourly Rainfall in the Storms (Past Hour from Start)
Occ
uren
ce
Figure 5.7 Timing of Maximum Hourly Rainfall in Major Storms
3 In thee (3) rainfall stations, i.e., Sidoharjo, Jatiroto and Jatisrono, hourly rainfall has been observed in only the Jatisrono station

The Study on Countermeasures for Sedimentation Final Report in the Wonogiri Multipurpose Dam Reservoir Supporting Report Annex No.1
Nippon Koei Co.,Ltd. 1-27 July 2007 Yachiyo Engineering Co.,Ltd.
PMP is distributed as six (6) hours continuous rainfall and hourly rainfall in the duration is estimated by use of Ito-formula. Based on above tendency, maximum hourly rainfall would on second hour in the duration.
3/22424
⋅=
TRR PMP
T
where, RT : T hour rainfall in PMP (mm) RPMP : PMP (mm) T : Rainfall duration (= from 1 to 6 hours)
5.3.3 Estimation Result
Figure 5.9 presents hydrograph of estimated PMF. The peak discharge of reviewed PMF is as of 9,710 m3/s.
0
2,000
4,000
6,000
8,000
10,000
0 12 24 36
Time (hr)
Dis
char
ge (m
3 /s)
Reviewed PMFOriginal PMF
0
20
40
60
80
100
120
Rai
nfal
l (m
m)
Figure 5.9 Estimated PMF Hydrograph
5.4 Evaluation of Current PMF 5.4.1 History of Present PMF
The current PMF on the Wonogiri dam catchment was determined in its construction stage in 1977. According to the ‘Wonogiri Multipurpose Dam Project, Part II Summary Report of Detailed Engineering Services, January 1978’ prepared by Nippon Koei Co., Ltd., PMF was estimated in the ‘Engineer Report, Series No.03’. However, the detail of PMF and PMP estimation procedure is unknown because the report had been lost. On the other hand, ‘Feasibility Report on the Wonogiri Multipurpose Dam Project, Annex III Data, October 1975’ said that the abnormal flood had peak discharge of 6,200 m3/s and its rainfall depth at the flood and effective rainfall depth were 415 mm and 332 mm (flood volume is 448 million m3), respectively. The peak discharge was estimated the probable flood with 5,000-year return period.
5.4.2 Comparison and Evaluation of Original and Reviewed PMF
Table 5.6 shows feature of the original PMF and of reviewed PMF. There is no significant
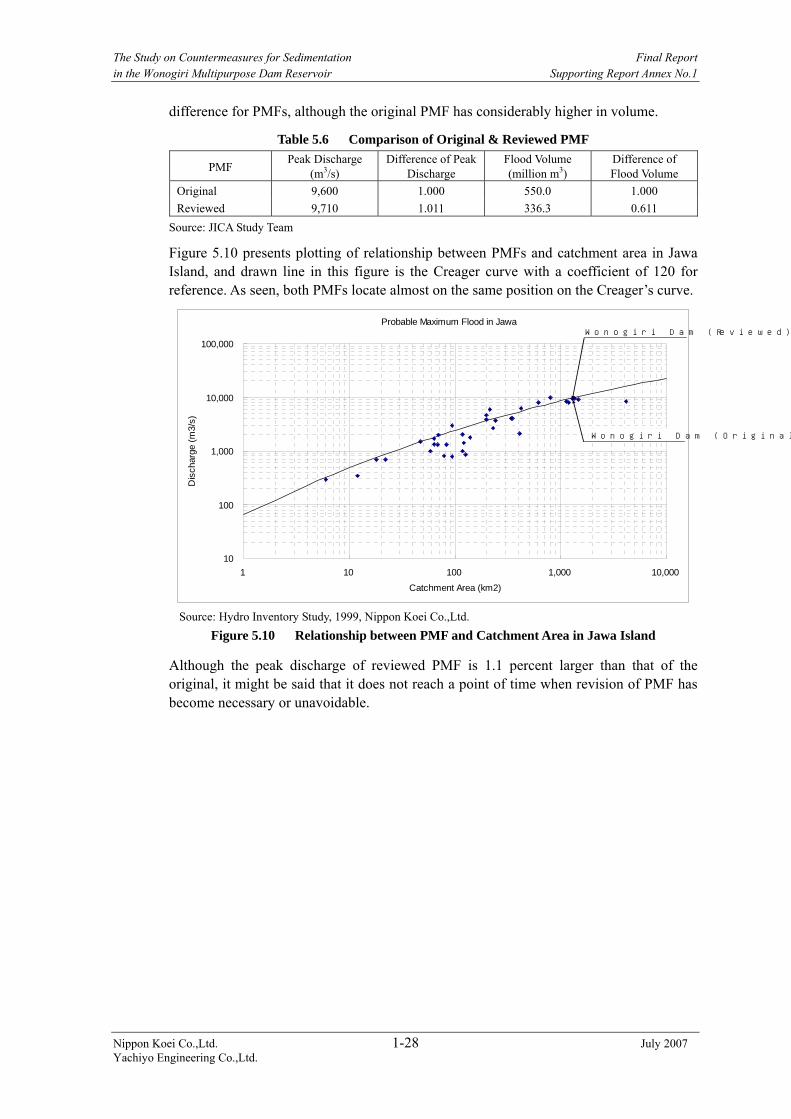
The Study on Countermeasures for Sedimentation Final Report in the Wonogiri Multipurpose Dam Reservoir Supporting Report Annex No.1
Nippon Koei Co.,Ltd. 1-28 July 2007 Yachiyo Engineering Co.,Ltd.
difference for PMFs, although the original PMF has considerably higher in volume.
Table 5.6 Comparison of Original & Reviewed PMF
PMF Peak Discharge
(m3/s) Difference of Peak
Discharge Flood Volume (million m3)
Difference of Flood Volume
Original 9,600 1.000 550.0 1.000 Reviewed 9,710 1.011 336.3 0.611
Source: JICA Study Team
Figure 5.10 presents plotting of relationship between PMFs and catchment area in Jawa Island, and drawn line in this figure is the Creager curve with a coefficient of 120 for reference. As seen, both PMFs locate almost on the same position on the Creager’s curve.
Probable Maximum Flood in Jawa
10
100
1,000
10,000
100,000
1 10 100 1,000 10,000
Catchment Area (km2)
Dis
char
ge (m
3/s)
Wonogiri Dam (Reviewed)
Wonogiri Dam (Original)
Source: Hydro Inventory Study, 1999, Nippon Koei Co.,Ltd.
Figure 5.10 Relationship between PMF and Catchment Area in Jawa Island
Although the peak discharge of reviewed PMF is 1.1 percent larger than that of the original, it might be said that it does not reach a point of time when revision of PMF has become necessary or unavoidable.

The Study on Countermeasures for Sedimentation Final Report in the Wonogiri Multipurpose Dam Reservoir Supporting Report Annex No.1
Nippon Koei Co.,Ltd. 1-29 July 2007 Yachiyo Engineering Co.,Ltd.
CHAPTER 6 EVALUATION OF PAST RESERVOIR OPERATION AND DAM SAFETY AGAINST PMF
6.1 Performance Evaluation of Historical Reservoir Operation
6.1.1 Historical Outflow from Wonogiri Reservoir
Table 6.1 presents monthly outflow volume from the reservoir in 1983-2005. Also Figure 6.1 below show mean monthly outflow from the reservoir. The outflow comprises of the water release through spillway and hydropower generation. As seen below, the mean annual water release from spillway (spillout discharge) is around 18% of the total outflow volume or 209 million m3. The remaining volume (82% or 926 million m3) has been used for hydropower generation.
0
50
100
150
200
Jan
Feb
Mar
Apr
May Jun
Jul
Aug
Sep
Oct
Nov
Dec
Mea
n M
onth
ly O
utflo
w(m
il. m
3 )
SpillwayTurbine
Figure 6.1 Mean Monthly Outflow from Wonogiri Dam
6.1.2 Reservoir Operation for Flood Control
Reservoir operation rule had been defined for flood control as Table 6.2.
Table 6.2 Reservoir Operation Rule for Flood Control Definition Elevation Remark
Control Water Level (CWL)
El. 135.3 m Reservoir water level should be maintained under CWL to secure the flood control capacity during flood period, 1st of December to April 15. Originally, it was El. 134.5 m until modification by PBS in 1993.
Normal High Water Level (NHWL)
El. 136.0 m NHWL is applied during non-flood period, May 1 to November 30 (April 16 to April 30 is defined as recovery period).
High Water Level (HWL)
El. 138.3 m Design flood as of 5,100 m3/s should be controlled under HWL.
Extra Flood Water Level (Extra FWL)
El. 139.1 m PMF as of 9,600 m3/s should be controlled under Extra FWL. Crest of impervious core in the Wonogiri dam is designed as El. 141.0 m with freeboard of 1.9 m between Extra FWL.
Source: ‘CDMP Study, Supporting Report Annex No.4, 2001’ prepared by Nippon Koei Co., Ltd.
Operation of spillway gates is basically depending on the reservoir water level. According to the current Wonogiri reservoir operation rule, during the flood period from December 1 to April 15, the reservoir water level shall be controlled so as not to exceed CWL (El. 134.5 m in the period 1983-1993, El. 135.3 m from 1994 to date) for securing safety against PMF. However, no observance of maintaining CWL has been so far made from 1983 except the dry years such as in1996 and 1997. This is revealed by the historical Wonogiri reservoir operations as presented in Figure 6.2 (1) to (3).

The Study on Countermeasures for Sedimentation Final Report in the Wonogiri Multipurpose Dam Reservoir Supporting Report Annex No.1
Nippon Koei Co.,Ltd. 1-30 July 2007 Yachiyo Engineering Co.,Ltd.
6.2 Evaluation of Dam Safety against PMF
6.2.1 Base Condition of Reservoir Operation for Flood Control
Base conditions for flood control simulation are duly based on the stipulated operation rule in both 1986 and 1993 as follows: i) Basically, starting reservoir water level for flood control operation is CWL. ii) Pre-releasing with 400 m3/s (harmless discharge) shall be made prior to the operation
of flood control to maintain CWL. iii) When the inflow discharge is bigger than 400 m3/s, the releasing discharge should be
kept constantly to be 400 m3/s until the reservoir water level reaches to SHFD water level of El. 138.2 m.
iv) In case that the reservoir water level exceeds El. 138.2 m, the releasing discharge from the spillway should be made in the free overflow condition. All the spillway gates are fully opened until the reservoir water level lowers to El. 137.7 m.
6.2.2 Simulation of Reservoir Operation against PMF under Current Sedimentation Condition
The dam safety against PMF under current sedimentation condition is simulated by use of the original PMF hydrograph and H-V curve of Wonogiri reservoir based on topographic survey in July 2005. Figure 6.3 presents reservoir operation for PMF under present condition. As seen in simulation, maximum reservoir water level resulted in El. 139.16 m. The result indicates if reservoir water level is maintained under CWL, dam safety against PMF is almost secured because the simulation shows still has freeboard of 1.84 m.
0
1,000
2,000
3,000
4,000
5,000
6,000
7,000
8,000
9,000
10,000
0 20 40 60 80 100 120 140 160 180
Time (hour)
Dis
chra
ge
(m3 /s
)
135
136
137
138
139
140
RW
L (
El.
m)
InflowOutflowReservoir WL.
Qmax=9,600m3/s
Qmax=1,370m3/s
RWLmax=El. 139.16 m
Figure 6.3 Reservoir Operation for PMF under Present Condition
6.2.3 Evaluation of Dam Safety against PMF under Past Reservoir Operation
Above mentioned simulation indicates Wonogiri reservoir is relatively ‘healthy’ from flood control point of view. Unfortunately, the reservoir operation rule has been never followed and actual operation might make result in serious situation. Table 6.3 presents annual maximum reservoir water level during flood period. In several years, reservoir water level was far and continuously exceeding CWL. Figure 6.4 shows annual maximum stored water exceeding CWL during flood period. Surprisingly, 140 million m3 of excess water was stored above CWL in March 30, 2001. Incidentally, the storage volume is

The Study on Countermeasures for Sedimentation Final Report in the Wonogiri Multipurpose Dam Reservoir Supporting Report Annex No.1
Nippon Koei Co.,Ltd. 1-31 July 2007 Yachiyo Engineering Co.,Ltd.
larger than sedimentation in reservoir since dam completion approximately 110 million m3.
0
20
40
60
80
100
120
140
160
1983
1984
1985
1986
1987
1988
1989
1990
1991
1992
1993
1994
1995
1996
1997
1998
1999
2000
2001
2002
2003
2004
2005
Exce
ss S
tora
ge (m
il. m
3)
Figure 6.4 Annual Maximum Stored Water Exceeding CWL during Flood Period
Reservoir operations against PMF under the annual maximum reservoir water level during flood period are simulated and the results are also shown in Table 6.3. As seen maximum reservoir water level would be El. 140.20 m in case of condition in March 30, 2001 which exceeds Extra FWL as 1.10 m.
6.3 Evaluation of Outflow Capacity of Existing Spillway
6.3.1 Determination of Peak Outflow Discharge from Spillway
Almost after completion of the Wonogiri Second Phase Irrigation Project, the Wonogiri reservoir operation rule was authorized by the Ministerial Decree of Public Works No. 229/KPTS/1986 on Operation and Maintenance Manual of Wonogiri Multi-purpose Dam (Keputusan Menteri Pekerjaan Umum tentang Pedoman Eksploitasi dan Pemeliharaan Bendungan Serbaguna Wonogiri) in 1986. This authorized operation rule basically adopted the provisional rule proposed in 1984, because the river improvement works on the Upper Solo River had not been initiated (construction period is 1987-1994). The determined water levels and peak discharge of inflow and outflow are as follows:
Table 6.4 Determined Water Levels & Peak Discharge of Inflow & Outflow Water Level Peak Inflow
Discharge (m3/s)Peak Outflow
Discharge (m3/s)Remarks
Extra Flood Water Level: El. 139.10 m
9,600 1,360 Probable Maximum Flood (PMF)
Design Flood Water Level: El. 138.30 m
5,100 1,170 1.2 times of 100-year flood
SHFD High Water Level (Surcharge Water Level): El. 138.20 m
4,000 400 Raised to El. 138.20 m from El. 137.70 m to provide 20% additional surcharge capacity
Source: Detailed Design Services on Wonogiri Multipurpose Dam Project, January 1978
6.3.2 Design Standard of Spillway in Indonesia
In 1994, Dewan Standarisasi Nasional (DSN) published ‘Standar Nasional Indonesia Nomber of SNI 3-3432-1994’ which is standard of design flood discharge and outflow capacity of spillway in Indonesia. The standard mentioned condition of constructed dam as follows: i) Consequence of Downstream Area

The Study on Countermeasures for Sedimentation Final Report in the Wonogiri Multipurpose Dam Reservoir Supporting Report Annex No.1
Nippon Koei Co.,Ltd. 1-32 July 2007 Yachiyo Engineering Co.,Ltd.
a) Some consequences have to be considered due to lower area condition as follows: - High consequence, if there are people, settlements (villages, cities), estates
and developing industry have to be protected when a dam gets failure - Low consequence, if there are not or only small settlement, nor industry in
the lower area b) If there is any protected cultural reservation or natural reservation, than it has to
be discussed with relating agency or people ii) Types and Level of Dam
a) Fill type - Low dam with a height lower than 40 m - Medium dam with a height between 40 m – 80 m - High dam with a height higher than 80 m
b) Concrete type
Table 6.5 presents standard criteria for flood design and capacity for spillway of dam.
Table 6.5 Standard Criteria for Flood Design and Capacity for Spillway of Dam High Consequence Low Consequence Type and
Level of Dam
Flood Design Overflow Capacity Flood Design Overflow Capacity
I. Fill Type Dam
(1) < 40 m (low)
Q1000 and maximum Allowable Flood (MAF) with standard freeboard
1) To be determined by flood routing. 2) Minimum: 15% of MAF
To be selected which is higher between Q1000 and 0.5 MAF.
1) To be determined by flood routing. 2) Minimum: 15% of Peak of Design Flood.
(2) 40-80 m (medium)
ditto 1) To be determined by flood routing. 2) Minimum: 25% of MAF
ditto 1) To be determined by flood routing. 2) Minimum: 25% of Peak of Design Flood.
(3) > 80 m (high)
ditto 1) To be determined by flood routing. 2) Minimum: 35% of MAF
ditto 1) To be determined by flood routing. 2) Minimum: 35% of Peak of Design Flood.
II. Concarete Type Dam
Q1000 Minimum: 125% Q100
0.5 Q1000 Minimum: 125% x 0.5 Q1000
Source: Translation of the standard by JICA Study Team
6.3.3 Evaluation of Outflow Capacity of Existing Spillway
The Wonogiri dam can be categorized as medium dam of fill type and there is high consequence in downstream. Based on the standard, required outflow capacity of spillway at Wonogiri dam is larger than 25% of PMF; 2,400 m3/s. Although the standard was published after completion of Wonogiri dam construction, outflow capacity of existing spillway at Wonogiri dam; 1,360 m3/s at Extra FWL is smaller than the requirement.

The Study on Countermeasures for Sedimentation Final Report in the Wonogiri Multipurpose Dam Reservoir Supporting Report Annex No.1
Nippon Koei Co.,Ltd. 1-33 July 2007 Yachiyo Engineering Co.,Ltd.
CHAPTER 7 RECOMMENDATIONS
7.1 Present Condition of Hydrological Data Accumulation
7.1.1 Rainfall Gauging Station
(1) Recent Data Collection
As mentioned in Chapter 2 of this Supporting Report, daily rainfall data of thirty six (36) rainfall gauging station are available in and around the Wonogiri dam catchment. However, daily rainfall data from 2001 comprises numerous lack of record. Especially from 2004 to 2006, some rainfall stations are not operated (See Figure 2.7 Availability of Daily Rainfall in and around the Wonogiri Dam Catchment). JICA Study Team interviewed about current circumstances of the observation works on related staffs in the Sidoharjo rainfall gauging station in January 4, 2006. According to the local goverment staffs (the rainfall gauging station is located on next to the local government office), recently rainfall gauging station at the Sidoharjo is without gauge keeper because the responsible staff had already retired and no person is available for handing over the duty.
(2) Maintenance of Investment
In 1980’s JICA Study Team for Wonogiri Dam Construction Project had installed 4 rainfall telemetry stations in the dam catchment area which locations are namely Pracimantoro, Jatisrono, Batuwarno and Tirtomoyo. However, there are two problems as follows; i) Telemetry systems are completely broken so the real time rainfall information do not
reach the Wonogiri dam management office. ii) Record paper for the hourly rainfall recorder is made in Japan and the operating
agency can not purchase the record paper. Hence, they reuse a same paper over and over again. It makes too difficult to read the record because of crossing the record lines.
(3) Location of Rainfall Gauging Station
As seen in above photograph, some rainfall gauging stations are located under the trees. It would cause smaller rainfall evaluation than that of actual volume.
7.1.2 Discharge Measurement
(1) Recent Data Collection
Several water level gauging stations have been operated in the Study Area. However, periodical discharge measurements with river cross section survey were not carried out. According to the information from PBS counterpart, the observation works in the Wonogiri dam catchment area are not carried out since 1998. Hence, the water level record can not be translated to the discharge.
Interview & Survey of Recent Rainfall Observation Works at the Sidoharjo in January 4, 2006

The Study on Countermeasures for Sedimentation Final Report in the Wonogiri Multipurpose Dam Reservoir Supporting Report Annex No.1
Nippon Koei Co.,Ltd. 1-34 July 2007 Yachiyo Engineering Co.,Ltd.
(2) Investment for Water Level Observation
During the wet season, a lot of record papers have been damaged by rainfall water. So many charts are not readable because of ink spread due to rainfall water and thin ink condition also.
7.1.3 Data Accumulation
(1) Data Tabulation
Some observations of rainfall and river water level have been carried out hourly basis. However, the data tabulation works are carried out only daily basis. In the Study, JICA Study Team read numerous hourly rainfall records for run-off analysis.
(2) Data Safekeeping
Numerous hydrological data is not available easily because of terrible safekeeping condition.
7.2 Recommendation
i) Understanding of Data Importance
If recent data collection problems’ tendency will continue and or be getting more and more, the river management and development of Bengawan Solo may be projected by based on the numerous assumptions instead of actual data. The related agencies such as PBS and PJT I should understand the importance of the hydrological data collection works.
ii) Budget Keeping
First of all, budget for the data collection is indispensable and the related agencies should strongly argue the budget to central government.
iii) Establishment and Reconstruction of System
There are a lot of observation stations in the Study Area. However, keeping of some stations might be given up because of the maintenance cost. The important observation points shall be reviewed and reconstructed the system.
Inviting the JICA short term experts is an effective measure to discuss the establishment and reconstruction of hydrological observation system.

Tables

Table 3.5 (1) Result of Discharge Measurement at Keduang (1/3)
Number of Samples 141
Correlation function is equal to Q = a h2 +b h + cZero Gauge(EL.m) a b c R
142.893 2004/2005 29.763 92.848 42.4 0.96722005/2006 50.491 66.367 41.0 0.9481
GaugeReading Water Level Discharge
h - Q(m) (EL.m) (m3/s)
K-1 Nov. 29,'04 14:25 0.05 142.94 32.53K-2 Nov. 29,'04 15:50 0.12 143.01 40.76K-3 Nov. 29,'04 16:12 0.30 143.19 86.53K-4 Nov. 29,'04 16:50 0.50 143.39 64.73K-5 Nov. 29,'04 17:35 0.20 143.09 52.92K-6 Nov. 29,'04 20:00 0.75 143.64 78.78K-7 Nov. 29,'04 20:30 0.85 143.74 89.40K-8 Nov. 29,'04 21:00 0.90 143.79 107.65K-9 Nov. 29,'04 23:00 0.70 143.59 109.76K-10 Nov. 30,'04 21:00 1.80 144.69 234.66K-11 Nov. 30,'04 22:00 2.00 144.89 312.95K-12 Nov. 30,'04 23:05 2.70 145.59 551.18K-13 Nov. 30,'04 0:00 2.40 145.29 391.98K-14 Dec. 03,'04 4:30 0.50 143.39 63.26K-15 Dec. 03,'04 5:00 0.90 143.79 125.46K-16 Dec. 03,'04 5:30 1.40 144.29 313.48K-17 Dec. 03,'04 6:25 1.30 144.19 197.52K-18 Dec. 03,'04 9:35 1.60 144.49 274.48K-19 Dec. 03,'04 10:00 1.70 144.59 306.44K-20 Dec. 03,'04 11:00 1.80 144.69 270.37K-21 Dec. 03,'04 15:20 0.70 143.59 114.03K-22 Dec. 08,'04 9:30 -0.30 142.59 6.83K-23 Dec. 14,'04 6:30 -0.20 142.69 5.72K-24 Dec. 15,'04 17:00 0.10 142.99 57.80K-25 Dec. 15,'04 18:00 0.20 143.09 52.19K-26 Dec. 15,'04 18:30 0.35 143.24 96.66K-27 Dec. 15,'04 19:00 0.30 143.19 42.76K-28 Dec. 18,'04 18:30 0.40 143.29 111.96K-29 Dec. 18,'04 18:40 0.15 143.04 42.57K-30 Dec. 18,'04 18:55 0.20 143.09 54.69K-31 Dec. 18,'04 19:30 0.30 143.19 87.67K-32 Dec. 21,'04 7:00 -0.15 142.74 6.02K-33 Dec. 25,'04 12:00 -0.25 142.64 8.05K-34 Dec. 25,'04 16:40 0.30 143.19 40.32K-35 Dec. 25,'04 17:00 1.40 144.29 284.95K-36 Dec. 25,'04 18:00 1.30 144.19 274.26K-37 Dec. 25,'04 20:00 1.00 143.89 132.02K-38 Dec. 25,'04 22:00 0.70 143.59 105.51K-39 Dec. 27,'04 18:10 0.20 143.09 42.86K-40 Dec. 27,'04 18:30 0.30 143.19 64.19K-41 Dec. 27,'04 19:00 0.40 143.29 77.82K-42 Dec. 27,'04 22:00 0.50 143.39 87.71K-43 Dec. 28,'04 0:00 0.25 143.14 53.67K-44 Jan. 01,'05 7:00 -0.65 142.24 1.23K-45 Jan. 05,'05 18:10 0.30 143.19 54.62K-46 Jan. 05,'05 17:30 1.10 143.99 180.55K-47 Jan. 05,'05 17:50 1.30 144.19 215.18K-48 Jan. 05,'05 20:05 0.50 143.39 86.04K-49 Jan. 08,'05 7:00 -0.45 142.44 6.15K-50 Jan. 15,'05 9:00 -0.70 142.19 0.35K-51 Jan. 21,'05 7:00 -0.65 142.24 3.08K-52 Jan. 22,'05 5:30 0.10 142.99 49.98
No. Date Time
T-1

Table 3.5 (1) Result of Discharge Measurement at Keduang (2/3)
GaugeReading Water Level Discharge
h - Q(m) (EL.m) (m3/s)
No. Date Time
K-53 Jan. 22,'05 6:30 0.30 143.19 81.01K-54 Jan. 22,'05 7:20 0.25 143.14 61.65K-55 Jan. 22,'05 7:40 0.20 143.09 59.58K-56 Jan. 28,'05 8:00 0.00 142.89 0.62K-57 Feb. 04,'05 7:00 -0.69 142.20 1.49K-58 Feb. 09,'05 18:30 0.45 143.34 89.69K-59 Feb. 09,'05 19:00 0.60 143.49 118.27K-60 Feb. 09,'05 19:35 0.30 143.19 48.60K-61 Feb. 09,'05 20:00 0.10 142.99 38.00K-62 Feb. 10,'05 22:00 0.25 143.14 52.47K-63 Feb. 10,'05 22:30 0.30 143.19 82.80K-64 Feb. 10,'05 23:00 0.80 143.69 154.84K-65 Feb. 10,'05 0:10 0.40 143.29 88.28K-66 Feb. 11,'05 17:00 0.25 143.14 44.98K-67 Feb. 11,'05 17:30 0.50 143.39 97.69K-68 Feb. 11,'05 18:00 1.00 143.89 178.45K-69 Feb. 11,'05 19:00 1.20 144.09 215.14K-70 Feb. 11,'05 22:00 0.30 143.19 83.08K-71 Feb. 12,'05 15:00 -0.30 142.59 6.69K-72 Feb. 17,'05 19:30 0.20 143.09 35.44K-73 Feb. 17,'05 20:00 0.40 143.29 79.55K-74 Feb. 17,'05 20:30 0.15 143.04 28.93K-75 Feb. 18,'05 10:00 -0.46 142.43 4.66K-76 Feb. 20,'05 15:50 0.10 142.99 40.81K-77 Feb. 20,'05 16:00 0.30 143.19 75.23K-78 Feb. 22,'05 15:30 0.60 143.49 113.80K-79 Feb. 22,'05 15:50 0.80 143.69 156.28K-80 Feb. 22,'05 16:00 1.00 143.89 178.68K-81 Feb. 22,'05 16:45 0.75 143.64 105.40K-82 Feb. 22,'05 18:10 0.30 143.19 67.26K-83 Feb. 23,'05 18:30 0.90 143.79 109.26K-84 Feb. 23,'05 19:00 1.10 143.99 184.59K-85 Feb. 23,'05 19:28 2.20 145.09 395.33K-86 Feb. 23,'05 20:00 1.60 144.49 208.26K-87 Feb. 23,'05 22:30 0.65 143.54 96.25K-88 Feb. 26,'05 8:00 -0.46 142.43 2.92K-89 Feb. 26,'05 15:00 0.60 143.49 111.69K-90 Feb. 26,'05 15:28 1.00 143.89 175.19K-91 Feb. 26,'05 16:00 0.90 143.79 118.62K-92 Feb. 26,'05 16:25 0.70 143.59 111.24K-93 Feb. 26,'05 17:50 0.40 143.29 77.64K-94 Feb. 27,'05 12:50 0.30 143.19 71.89K-95 Feb. 27,'05 13:30 0.85 143.74 123.19K-96 Feb. 27,'05 14:10 0.50 143.39 81.45K-97 Feb. 27,'05 14:40 0.40 143.29 56.17K-98 Mar. 05,'05 8:00 -0.30 142.59 6.66K-99 Mar. 05,'05 19:00 0.60 143.49 115.68K-100 Mar. 05,'05 19:30 1.00 143.89 160.27K-101 Mar. 05,'05 19:45 1.35 144.24 220.90K-102 Mar. 05,'05 20:00 1.60 144.49 259.56K-103 Mar. 05,'05 22:00 0.50 143.39 100.69K-104 Mar. 11,'05 7:00 -0.60 142.29 1.30K-105 Mar. 13,'05 17:00 0.90 143.79 177.77K-106 Mar. 13,'05 17:28 2.00 144.89 334.90K-107 Mar. 13,'05 17:40 2.40 145.29 437.27K-108 Mar. 13,'05 19:00 1.20 144.09 217.69K-109 Mar. 13,'05 23:00 0.40 143.29 102.41K-110 Mar. 15,'05 19:25 0.30 143.19 97.04K-111 Mar. 15,'05 20:00 0.90 143.79 180.19
T-2

Table 3.5 (1) Result of Discharge Measurement at Keduang (3/3)
GaugeReading Water Level Discharge
h - Q(m) (EL.m) (m3/s)
No. Date Time
K-112 Mar. 15,'05 20:15 0.80 143.69 146.14K-113 Mar. 15,'05 21:00 0.45 143.34 97.15K-114 Mar. 18,'05 6:15 -0.45 142.44 2.17K-115 Mar. 23,'05 8:00 0.40 143.29 90.39K-116 Mar. 23,'05 8:45 0.35 143.24 71.14K-117 Mar. 23,'05 9:30 0.20 143.09 54.31K-118 Mar. 25,'05 6:30 -0.25 142.64 8.02K-119 Mar. 28,'05 19:50 0.35 143.24 110.42K-120 Mar. 28,'05 20:25 0.80 143.69 173.18K-121 Mar. 28,'05 20:45 0.90 143.79 192.49K-122 Mar. 28,'05 21:10 0.55 143.44 115.04K-123 Mar. 30,'05 16:30 0.40 143.29 61.99K-124 Mar. 30,'05 17:00 0.20 143.09 39.24K-125 Mar. 31,'05 18:50 0.30 143.19 51.03K-126 Mar. 31,'05 19:10 0.90 143.79 152.34K-127 Mar. 31,'05 19:30 1.10 143.99 250.51K-128 Mar. 31,'05 20:00 0.80 143.69 167.64K-129 Mar. 31,'05 21:00 0.60 143.49 113.67K-130 Apr. 01,'05 7:00 -0.10 142.79 19.28K-131 Apr. 01,'05 14:00 0.70 143.59 145.21K-132 Apr. 01,'05 14:25 1.10 143.99 223.09K-133 Apr. 01,'05 16:00 1.70 144.59 340.68K-134 Apr. 01,'05 17:00 1.60 144.49 201.91K-135 Apr. 03,'05 17:00 0.30 143.19 59.92K-136 Apr. 03,'05 17:30 0.20 143.09 37.08K-137 Apr. 04,'05 16:40 0.35 143.24 55.36K-138 Apr. 04,'05 17:00 0.50 143.39 96.35K-139 Apr. 04,'05 19:00 1.00 143.89 190.57K-140 Apr. 04,'05 20:00 1.40 144.29 266.16K-141 Apr. 04,'05 21:00 1.15 144.04 197.55K-142 Jun. 22,'05 16:30 0.60 143.49 95.03K-143 Jun. 22,'05 17:00 1.00 143.89 162.14K-144 Jun. 22,'05 17:28 1.30 144.19 174.36K-145 Jun. 22,'05 19:00 0.50 143.39 82.29K-146 Dec. 02,'05 6:00 1.15 144.04 169.10K-147 Dec. 15,'05 19:00 1.00 143.89 121.90K-148 Dec. 15,'05 20:00 1.40 144.29 131.10K-149 Dec. 15,'05 21:00 1.25 144.14 106.85K-150 Dec. 16,'05 6:00 -0.20 142.69 15.62K-151 Dec. 20,'05 16:00 1.10 143.99 142.18K-152 Dec. 20,'05 17:00 1.60 144.49 422.43K-153 Dec. 20,'05 19:00 1.20 144.09 180.42K-154 Dec. 23,'05 17:00 1.15 144.04 169.10K-155 Dec. 28,'05 20:00 1.00 143.89 132.70K-156 Jan. 12,'05 16:00 1.00 143.89 136.72K-157 Jan. 27,'05 7:00 -0.65 142.24 5.32K-158 Jan. 30,'05 18:00 1.06 143.95 125.09K-159 Feb. 04,'05 14:00 1.40 144.29 233.04K-160 Feb. 04,'05 15:00 2.00 144.89 400.83K-161 Feb. 04,'05 16:00 1.60 144.49 311.02K-162 Feb. 04,'05 17:00 1.10 143.99 166.98K-163 Feb. 16,'05 17:00 1.70 144.59 288.89K-164 Feb. 16,'05 18:00 2.25 145.14 305.78K-165 Feb. 16,'05 19:00 1.65 144.54 224.45K-166 Feb. 16,'05 20:00 1.05 143.94 130.76K-167 Mar. 02,'05 18:00 2.99 145.88 933.98K-168 Mar. 02,'05 19:00 2.42 145.31 594.81
T-3


Table 3.5 (3) Result of Discharge Measurement at Temon (1/1)
Number of Samples 60
Correlation function is equal to Q = a h2 +b h + cZero Gauge(EL.m) a b c R2
136.600 2004/2005 14.82 23.175 8.51 0.9798
GaugeReading Water Level Discharge
h - Q(m) (EL.m) (m3/s)
Te-1 Dec. 03,'04 5:35 0.67 137.27 27.12Te-2 Dec. 03,'04 7:30 0.78 137.38 30.34Te-3 Dec. 03,'04 8:00 0.90 137.50 29.37Te-4 Dec. 03,'04 9:50 1.40 138.00 71.24Te-5 Dec. 03,'04 10:40 1.10 137.70 51.07Te-6 Dec. 12,'04 10:40 -1.08 135.52 0.12Te-7 Dec. 17,'04 11:30 -1.10 135.50 0.07Te-8 Dec. 20,'04 16:10 -0.05 136.55 1.33Te-9 Dec. 25,'04 14:00 -0.56 136.04 0.62Te-10 Dec. 25,'04 19:15 0.30 136.90 18.89Te-11 Dec. 25,'04 19:45 0.35 136.95 18.05Te-12 Dec. 25,'04 20:00 0.42 137.02 20.37Te-13 Dec. 25,'04 20:10 0.39 136.99 18.22Te-14 Dec. 27,'04 20:00 0.14 136.74 17.54Te-15 Dec. 27,'04 21:25 0.24 136.84 19.18Te-16 Dec. 27,'04 22:00 0.37 136.97 22.71Te-17 Dec. 27,'04 22:55 0.29 136.89 20.34Te-18 Jan. 01,'05 14:00 -0.96 135.64 0.19Te-19 Jan. 08,'05 8:00 -0.90 135.70 0.44Te-20 Jan. 15,'05 7:00 -1.10 135.50 0.14Te-21 Jan. 21,'05 10:00 -1.01 135.59 0.15Te-22 Jan. 21,'05 19:45 0.16 136.76 16.98Te-23 Jan. 21,'05 20:40 0.27 136.87 17.68Te-24 Jan. 21,'05 21:35 0.43 137.03 21.56Te-25 Jan. 21,'05 22:30 0.44 137.04 18.24Te-26 Jan. 23,'05 18:00 0.25 136.85 16.57Te-27 Jan. 23,'05 18:35 0.60 137.20 23.78Te-28 Jan. 23,'05 19:25 0.80 137.40 33.20Te-29 Jan. 23,'05 20:45 0.30 136.90 20.52Te-30 Jan. 28,'05 7:45 -1.10 135.50 0.19Te-31 Jan. 28,'05 14:10 0.27 136.87 21.76Te-32 Jan. 28,'05 14:35 0.40 137.00 24.17Te-33 Jan. 28,'05 15:15 0.75 137.35 30.41Te-34 Jan. 28,'05 15:35 0.55 137.15 19.42Te-35 Feb. 04,'05 8:00 -1.08 135.52 0.25Te-36 Feb. 11,'05 7:00 -1.11 135.49 0.17Te-37 Feb. 11,'05 19:00 0.20 136.80 16.96Te-38 Feb. 11,'05 19:30 0.40 137.00 19.43Te-39 Feb. 11,'05 20:20 0.75 137.35 29.16Te-40 Feb. 11,'05 20:55 0.55 137.15 23.28Te-41 Feb. 14,'05 16:00 0.10 136.70 16.19Te-42 Feb. 14,'05 16:30 0.25 136.85 16.90Te-43 Feb. 14,'05 17:00 0.45 137.05 22.29Te-44 Feb. 14,'05 17:30 0.30 136.90 18.91Te-45 Feb. 18,'05 7:00 -1.15 135.45 0.15Te-46 Feb. 20,'05 15:30 0.30 136.90 20.18Te-47 Feb. 20,'05 16:00 0.50 137.10 25.67Te-48 Feb. 20,'05 16:30 0.80 137.40 35.40Te-49 Feb. 20,'05 17:00 0.65 137.25 25.56Te-50 Feb. 25,'05 18:00 -1.10 135.50 0.18Te-51 Mar. 04,'05 6:00 -1.12 135.48 0.18Te-52 Mar. 06,'05 14:00 0.30 136.90 19.09Te-53 Mar. 06,'05 14:35 0.45 137.05 22.27Te-54 Mar. 06,'05 15:00 0.85 137.45 37.12
No. Date Time
T-7
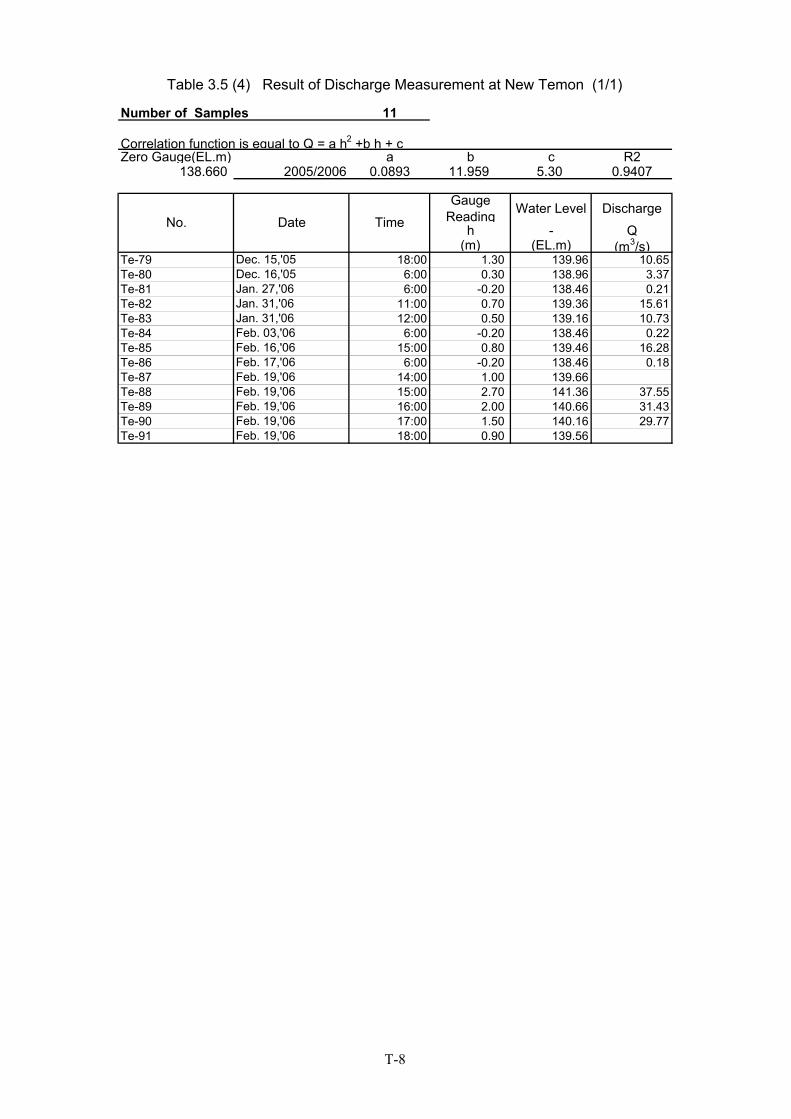
Table 3.5 (4) Result of Discharge Measurement at New Temon (1/1)
Number of Samples 11
Correlation function is equal to Q = a h2 +b h + cZero Gauge(EL.m) a b c R2
138.660 2005/2006 0.0893 11.959 5.30 0.9407
GaugeReading Water Level Discharge
h - Q(m) (EL.m) (m3/s)
Te-79 Dec. 15,'05 18:00 1.30 139.96 10.65Te-80 Dec. 16,'05 6:00 0.30 138.96 3.37Te-81 Jan. 27,'06 6:00 -0.20 138.46 0.21Te-82 Jan. 31,'06 11:00 0.70 139.36 15.61Te-83 Jan. 31,'06 12:00 0.50 139.16 10.73Te-84 Feb. 03,'06 6:00 -0.20 138.46 0.22Te-85 Feb. 16,'06 15:00 0.80 139.46 16.28Te-86 Feb. 17,'06 6:00 -0.20 138.46 0.18Te-87 Feb. 19,'06 14:00 1.00 139.66Te-88 Feb. 19,'06 15:00 2.70 141.36 37.55Te-89 Feb. 19,'06 16:00 2.00 140.66 31.43Te-90 Feb. 19,'06 17:00 1.50 140.16 29.77Te-91 Feb. 19,'06 18:00 0.90 139.56
No. Date Time
T-8
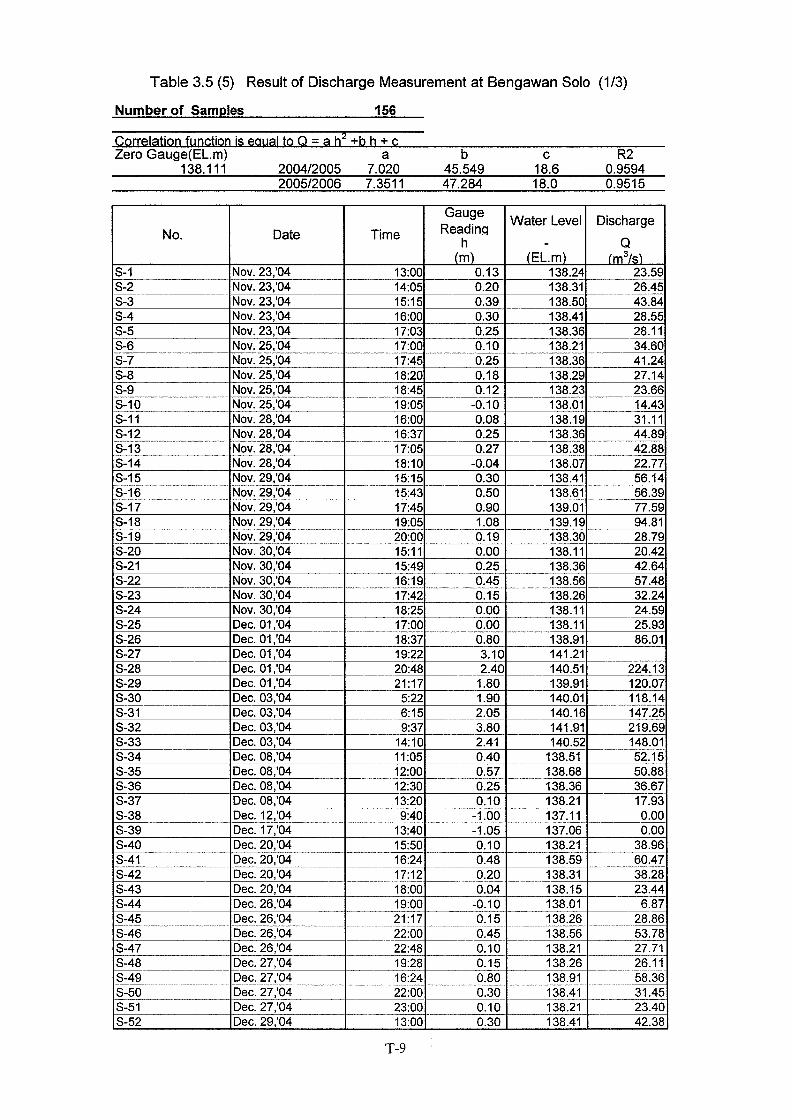


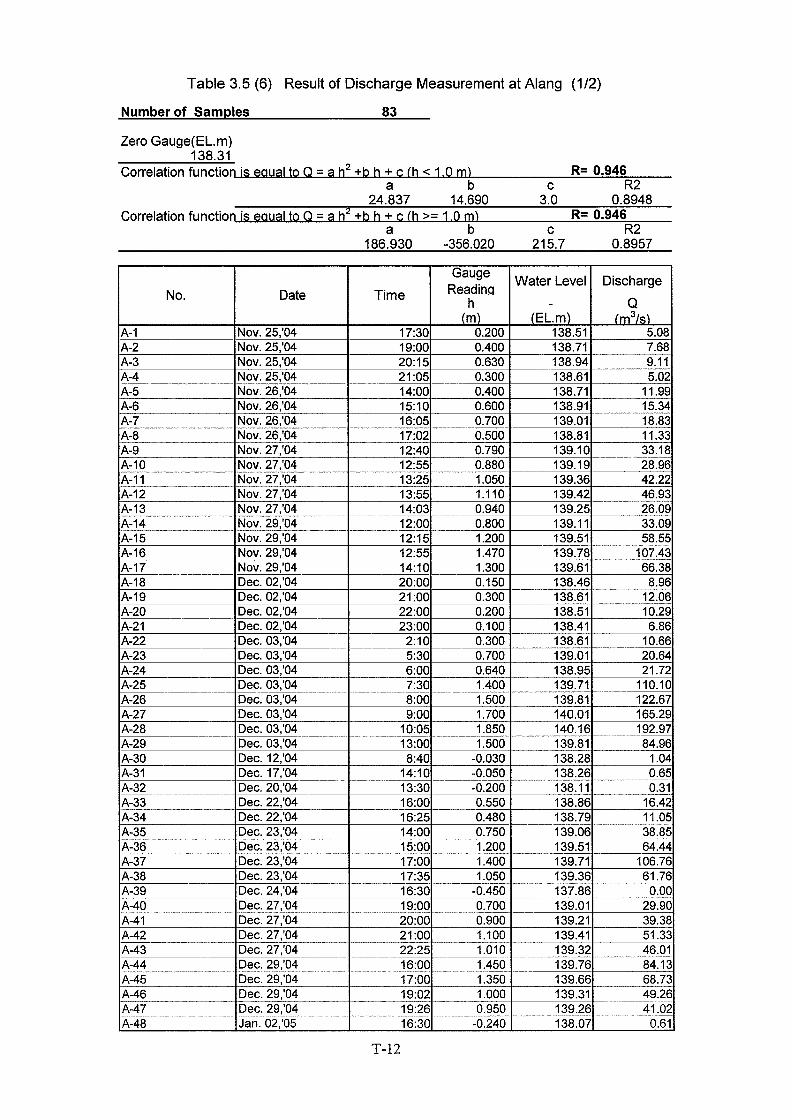

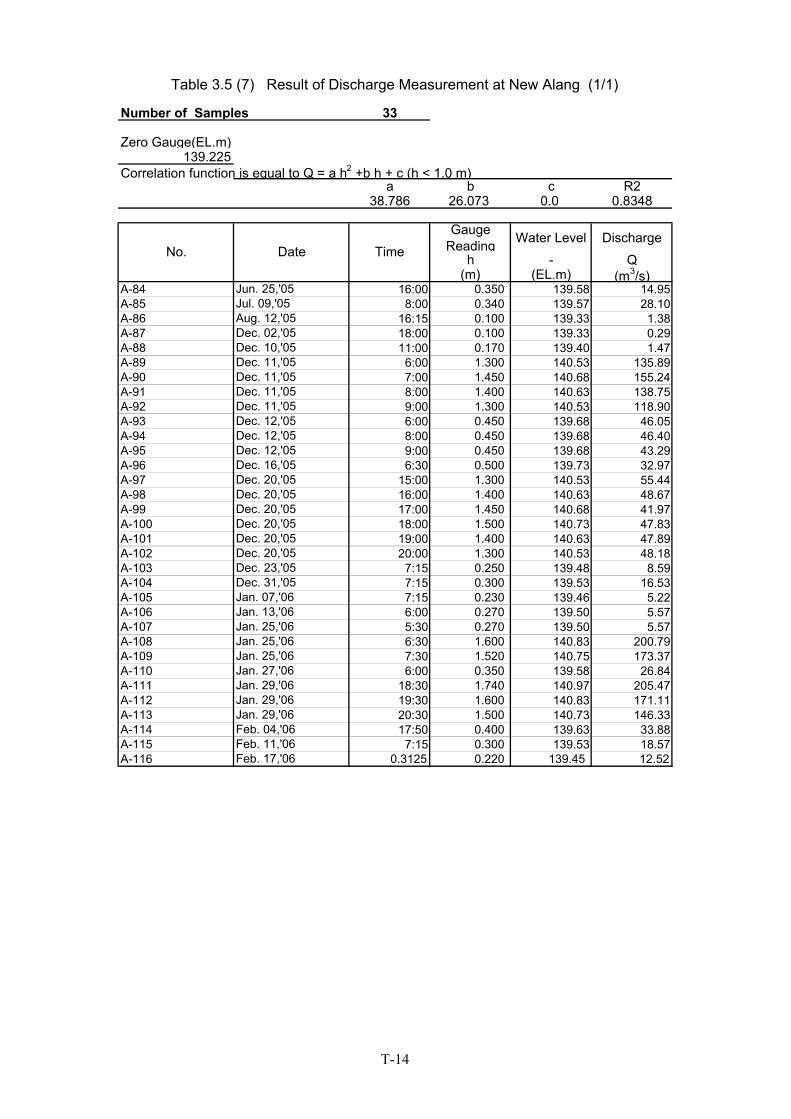
Table 3.5 (7) Result of Discharge Measurement at New Alang (1/1)
Number of Samples 33
Zero Gauge(EL.m)139.225
Correlation function is equal to Q = a h2 +b h + c (h < 1.0 m)a b c R2
38.786 26.073 0.0 0.8348
GaugeReading Water Level Discharge
h - Q(m) (EL.m) (m3/s)
A-84 Jun. 25,'05 16:00 0.350 139.58 14.95A-85 Jul. 09,'05 8:00 0.340 139.57 28.10A-86 Aug. 12,'05 16:15 0.100 139.33 1.38A-87 Dec. 02,'05 18:00 0.100 139.33 0.29A-88 Dec. 10,'05 11:00 0.170 139.40 1.47A-89 Dec. 11,'05 6:00 1.300 140.53 135.89A-90 Dec. 11,'05 7:00 1.450 140.68 155.24A-91 Dec. 11,'05 8:00 1.400 140.63 138.75A-92 Dec. 11,'05 9:00 1.300 140.53 118.90A-93 Dec. 12,'05 6:00 0.450 139.68 46.05A-94 Dec. 12,'05 8:00 0.450 139.68 46.40A-95 Dec. 12,'05 9:00 0.450 139.68 43.29A-96 Dec. 16,'05 6:30 0.500 139.73 32.97A-97 Dec. 20,'05 15:00 1.300 140.53 55.44A-98 Dec. 20,'05 16:00 1.400 140.63 48.67A-99 Dec. 20,'05 17:00 1.450 140.68 41.97A-100 Dec. 20,'05 18:00 1.500 140.73 47.83A-101 Dec. 20,'05 19:00 1.400 140.63 47.89A-102 Dec. 20,'05 20:00 1.300 140.53 48.18A-103 Dec. 23,'05 7:15 0.250 139.48 8.59A-104 Dec. 31,'05 7:15 0.300 139.53 16.53A-105 Jan. 07,'06 7:15 0.230 139.46 5.22A-106 Jan. 13,'06 6:00 0.270 139.50 5.57A-107 Jan. 25,'06 5:30 0.270 139.50 5.57A-108 Jan. 25,'06 6:30 1.600 140.83 200.79A-109 Jan. 25,'06 7:30 1.520 140.75 173.37A-110 Jan. 27,'06 6:00 0.350 139.58 26.84A-111 Jan. 29,'06 18:30 1.740 140.97 205.47A-112 Jan. 29,'06 19:30 1.600 140.83 171.11A-113 Jan. 29,'06 20:30 1.500 140.73 146.33A-114 Feb. 04,'06 17:50 0.400 139.63 33.88A-115 Feb. 11,'06 7:15 0.300 139.53 18.57A-116 Feb. 17,'06 0.3125 0.220 139.45 12.52
No. Date Time
T-14


No. Rainfall Station Kedu
ang
Riv
er B
asin
Tirto
moy
o R
iver
Bas
in
Tem
on R
iver
Bas
in
Beng
awan
Sol
o Ba
sin
Alan
g R
iver
Bas
in
Rem
nant
Are
a
3a Nawangan 0.000 0.000 0.000 0.304 0.223 0.000
1 Pracimantoro PP 115a 0.000 0.000 0.000 0.000 0.554 0.000
5 Plumbon Skt 28 0.000 0.000 0.000 0.000 0.222 0.427
8 Wuryantoro 114b 0.000 0.000 0.000 0.000 0.000 0.390
12 Beji Skat 15 0.000 0.000 0.344 0.035 0.000 0.020
13 Batuwarno PP 115a 0.000 0.068 0.656 0.611 0.000 0.000
16 Tirtomoyo 131a 0.026 0.436 0.000 0.027 0.000 0.000
18 Watugede 0.000 0.409 0.000 0.024 0.000 0.000
19 Nguntoronadi Skt 25 0.014 0.000 0.000 0.000 0.000 0.000
20 Manyaran 114a 0.000 0.000 0.000 0.000 0.000 0.163
25 Jatiroto 130a 0.297 0.087 0.000 0.000 0.000 0.000
27 Jatisrono 131 0.343 0.000 0.000 0.000 0.000 0.000
53 Girimantoro PP 125b 0.197 0.000 0.000 0.000 0.000 0.000
86 Tawangmangu No 130 0.049 0.000 0.000 0.000 0.000 0.000
MD-6 Purwantoro 132 0.072 0.000 0.000 0.000 0.000 0.000
Total 1.000 1.000 1.000 1.000 1.000 1.000
Source : JICA Study Team
Table 4.4 Thiessen Weight on Each Tributary's Basin
T-16

Keduang Tirtomoyo Temon Solo Alang
C.A (km2)* 397.0 186.0 46.2 151.3 134.6
a1 0.004 0.003 0.007 0.008 0.006
a2 0.015 0.015 0.02 0.02 0.02
a3 0.007 0.010 0.005 0.004 0.004
a4 0.0007 0.0007 0.0009 0.0007 0.0007
a5 0.00007 0.0001 0.0001 0.00003 0.00003
b1 0.03 0.03 0.03 0.04 0.03
b2 0.008 0.007 0.007 0.011 0.010
b3 0.0023 0.0025 0.002 0.004 0.004
Z1 10 10 10 10 10
Z2 80 70 50 50 60
Z3 20 17 20 25 20
* : Catchment Area at Gauge Station
Source : JICA Study Team
Table 4.5 Parameter of the Runoff Model
T-17

Table 4.8 (18) Estimated Monthly Inflow from Major Tributaries and Remnant Area
Unit: mil. m3
Hydrological Year Basin
C.A.(km2)
Nov Dec Jan Feb Mar Apr May Jun Jul Aug Sep Oct Total
1993/94 Keduang 421 8.6 50.4 66.5 54.4 171.8 39.3 6.7 2.3 4.3 6.2 8.5 0.0 419.0
Tirtomoyo 231 4.6 30.4 28.3 40.3 92.2 22.5 4.4 1.2 1.7 0.4 0.0 0.0 226.0
Temon 63 1.4 8.8 7.4 9.0 20.6 4.4 0.9 0.2 0.2 0.0 0.0 0.0 52.8
B. Solo 206 3.6 25.1 26.8 32.2 76.1 15.4 3.5 0.7 0.7 0.0 0.0 0.0 184.0
Alang 169 3.5 20.3 22.8 23.0 54.5 14.7 1.6 0.3 0.1 0.0 0.0 0.0 140.7
Remnant Area 152 3.0 18.8 19.1 20.5 42.2 13.4 2.4 0.7 1.0 0.9 1.2 0.0 123.1
Total 1,242 24.7 153.7 170.9 179.5 457.3 109.7 19.5 5.3 7.8 7.6 9.6 0.0 1,145.7
1994/95 Keduang 421 0.0 4.3 37.4 119.9 116.7 43.1 9.5 11.3 6.7 4.6 0.0 4.8 358.3
Tirtomoyo 231 0.0 4.6 28.7 87.1 67.5 25.5 5.6 7.1 4.4 1.7 0.0 1.8 234.1
Temon 63 0.0 1.2 5.5 17.3 14.0 5.1 0.9 1.1 0.6 0.0 0.0 0.4 46.1
B. Solo 206 0.0 3.9 20.5 70.1 51.2 19.4 3.5 4.4 2.6 0.3 0.0 1.6 177.6
Alang 169 0.0 1.7 11.6 47.7 37.8 12.4 1.3 2.7 1.5 0.0 0.0 1.5 118.2
Remnant Area 152 0.0 2.2 13.0 42.0 33.5 13.4 2.9 3.7 2.2 0.9 0.0 1.4 115.2
Total 1,242 0.0 17.9 116.9 384.1 320.6 118.8 23.7 30.3 18.1 7.5 0.0 11.6 1,049.5
1995/96 Keduang 421 44.3 113.9 75.6 75.9 61.8 30.6 6.5 2.3 0.4 2.7 3.7 9.7 427.3
Tirtomoyo 231 27.7 77.3 44.6 45.2 35.7 17.3 3.3 0.9 0.1 0.6 0.0 6.1 258.7
Temon 63 5.2 14.2 7.8 7.1 3.9 1.2 0.1 0.0 0.0 0.1 0.0 0.9 40.5
B. Solo 206 18.7 54.6 30.9 29.3 21.8 10.1 1.6 0.3 0.0 0.5 0.0 4.2 171.8
Alang 169 17.6 46.1 23.6 21.6 14.0 6.3 0.6 0.0 0.0 0.3 0.0 3.6 133.8
Remnant Area 152 15.8 42.7 25.5 25.0 19.1 9.1 1.7 0.5 0.1 0.6 0.5 3.4 143.9
Total 1,242 129.3 348.8 208.0 204.1 156.2 74.6 13.7 3.9 0.5 4.7 4.2 27.9 1,175.9
1996/97 Keduang 421 18.9 33.2 54.7 52.2 25.7 14.2 10.0 3.6 0.0 0.0 2.5 0.0 214.9
Tirtomoyo 231 22.7 23.6 32.7 31.2 16.6 10.1 6.9 1.3 0.0 0.0 0.0 0.0 145.3
Temon 63 2.1 4.5 5.6 5.4 2.7 1.9 0.6 0.0 0.0 0.0 0.0 0.0 22.9
B. Solo 206 8.7 18.6 19.6 19.2 9.8 7.3 2.6 0.1 0.0 0.0 0.0 0.0 85.9
Alang 169 7.0 14.4 16.1 12.8 4.7 5.1 2.1 0.0 0.0 0.0 0.0 0.0 62.1
Remnant Area 152 8.3 13.2 17.9 16.8 8.3 5.4 3.1 0.7 0.0 0.0 0.3 0.0 74.1
Total 1,242 67.7 107.6 146.6 137.6 67.8 44.0 25.4 5.8 0.0 0.0 2.8 0.0 605.2
1997/98 Keduang 421 4.8 11.3 10.3 64.3 77.9 79.0 11.8 27.6 25.5 5.1 4.2 17.4 339.3
Tirtomoyo 231 0.5 2.9 1.5 26.7 58.3 41.4 9.8 13.5 23.8 2.6 3.2 16.4 200.4
Temon 63 0.7 0.1 0.3 6.7 12.4 9.3 1.8 3.7 4.4 0.3 0.8 3.0 43.5
B. Solo 206 2.5 0.3 1.3 23.6 49.7 34.2 6.3 13.7 15.7 1.2 3.3 11.6 163.5
Alang 169 3.0 0.4 3.3 13.1 51.9 25.8 3.9 13.3 8.3 0.3 2.2 7.6 133.1
Remnant Area 152 1.6 2.1 2.3 18.6 32.1 22.6 4.7 10.0 10.8 1.3 1.9 7.8 115.9
Total 1,242 13.2 17.0 19.0 153.0 282.3 212.2 38.2 82.0 88.6 10.8 15.5 63.8 995.7
1998/99 Keduang 421 72.5 54.2 110.2 86.5 96.3 35.8 16.2 4.3 5.3 1.5 2.9 5.4 491.1
Tirtomoyo 231 45.3 29.8 60.2 54.1 53.8 40.2 11.2 2.8 2.9 0.6 0.3 0.9 302.1
Temon 63 11.0 6.7 13.1 11.6 12.2 4.5 2.5 0.5 0.5 0.0 0.0 0.1 62.6
B. Solo 206 39.2 23.4 43.8 39.6 40.6 14.8 8.0 1.6 1.6 0.2 0.0 0.2 213.0
Alang 169 30.5 17.2 32.9 27.1 37.1 12.0 5.1 0.8 0.6 0.0 0.0 0.0 163.4
Remnant Area 152 24.1 15.2 31.7 26.9 29.8 15.0 6.0 1.4 1.5 0.3 0.5 0.9 153.3
Total 1,242 222.6 146.6 291.9 245.8 269.8 122.2 49.1 11.5 12.3 2.6 3.7 7.5 1,385.5
1999/00 Keduang 421 42.0 64.7 28.8 132.8 89.0 98.8 24.0 12.2 0.0 0.0 0.0 3.4 495.8
Tirtomoyo 231 14.5 32.1 16.3 73.4 53.9 55.7 13.7 5.2 0.0 0.0 0.0 1.5 266.3
Temon 63 2.7 6.3 3.4 15.5 11.8 11.4 2.8 0.8 0.0 0.0 0.0 0.0 54.7
B. Solo 206 8.7 23.3 12.3 56.1 42.6 40.8 10.0 3.0 0.0 0.0 0.0 0.0 196.9
Alang 169 8.8 17.2 7.8 41.8 29.6 28.5 8.6 1.2 0.0 0.0 0.0 0.1 143.5
Remnant Area 152 10.2 16.1 8.3 36.1 26.5 28.2 8.2 3.1 0.0 0.0 0.0 0.7 137.5
Total 1,242 86.9 159.7 77.0 355.7 253.5 263.3 67.3 25.5 0.0 0.0 0.0 5.8 1,294.6
T-18

Table 4.8 (19) Estimated Monthly Inflow from Major Tributaries and Remnant Area
Unit: mil. m3
Hydrological Year Basin
C.A.(km2)
Nov Dec Jan Feb Mar Apr May Jun Jul Aug Sep Oct Total
2000/01 Keduang 421 47.9 18.2 58.8 77.0 72.4 52.9 12.5 13.8 5.8 3.3 4.7 8.4 375.8
Tirtomoyo 231 8.1 11.8 25.2 41.9 68.2 30.9 5.9 8.6 2.3 0.7 0.3 1.8 205.6
Temon 63 0.6 0.6 6.8 7.8 7.0 5.5 1.0 1.6 0.2 0.0 0.0 0.5 31.7
B. Solo 206 2.4 2.2 22.3 27.0 21.0 18.3 3.2 5.3 0.8 0.0 0.0 1.7 104.2
Alang 169 8.8 2.6 16.6 24.0 48.3 14.1 2.4 4.1 0.3 0.0 0.0 5.2 126.5
Remnant Area 152 9.4 4.9 16.3 21.3 30.3 16.1 3.5 4.7 1.3 0.6 0.7 2.5 111.5
Total 1,242 77.2 40.4 146.1 198.9 247.3 137.8 28.4 38.1 10.8 4.6 5.6 20.1 955.3
2001/02 Keduang 421 16.1 10.8 64.2 144.8 90.7 80.9 12.5 3.4 2.6 0.0 0.0 0.0 426.0
Tirtomoyo 231 10.7 10.5 34.5 75.6 29.1 31.8 5.5 0.9 0.3 0.0 0.0 0.0 199.0
Temon 63 2.0 2.4 8.0 17.4 6.5 6.9 0.9 0.1 0.0 0.0 0.0 0.0 44.2
B. Solo 206 6.7 8.5 27.5 62.6 22.8 23.3 3.0 0.5 0.1 0.0 0.0 0.0 154.9
Alang 169 7.9 9.0 22.6 46.4 17.7 16.4 2.3 0.2 0.0 0.0 0.0 0.0 122.5
Remnant Area 152 6.1 5.7 19.3 39.1 21.5 22.2 3.4 0.7 0.4 0.0 0.0 0.0 118.4
Total 1,242 49.4 46.9 176.0 386.0 188.4 181.4 27.6 5.8 3.4 0.0 0.0 0.0 1,064.9
2002/03 Keduang 421 0.1 16.0 41.2 73.6 91.5 4.1 6.2 1.1 1.0 0.0 0.0 0.1 235.0
Tirtomoyo 231 0.1 11.7 33.3 57.0 58.2 2.8 5.2 0.6 0.3 0.0 0.0 0.2 169.5
Temon 63 0.0 2.6 7.7 14.5 12.8 0.4 0.6 0.0 0.0 0.0 0.0 0.1 38.8
B. Solo 206 0.0 8.1 24.8 46.4 43.6 1.3 1.9 0.2 0.0 0.0 0.0 0.4 126.7
Alang 169 0.0 6.5 22.8 35.6 31.3 0.7 3.2 0.0 0.0 0.0 0.0 0.1 100.3
Remnant Area 152 0.0 6.1 17.9 31.2 28.2 1.3 2.4 0.3 0.2 0.0 0.0 0.1 87.7
Total 1,242 0.3 51.0 147.7 258.4 265.5 10.7 19.6 2.2 1.5 0.0 0.0 1.1 757.9
2003/04 Keduang 421 6.8 25.8 34.2 55.4 37.1 9.7 10.8 3.8 3.4 1.1 8.6 15.8 212.5
Tirtomoyo 231 4.0 32.8 31.6 46.1 28.0 9.2 3.2 1.8 2.1 0.2 0.0 1.7 160.8
Temon 63 0.6 4.7 7.3 5.6 6.9 0.8 0.3 0.2 0.0 0.0 0.0 0.0 26.4
B. Solo 206 1.9 15.1 23.8 19.7 23.9 3.0 1.1 0.7 0.0 0.0 0.0 0.0 89.3
Alang 169 3.8 22.4 28.2 26.7 19.5 4.3 4.5 0.6 0.0 0.0 0.0 0.0 110.1
Remnant Area 152 2.4 14.1 16.9 20.3 14.4 3.8 2.8 1.0 0.8 0.2 1.2 2.4 80.2
Total 1,242 19.4 114.9 142.0 173.9 129.8 30.8 22.6 8.1 6.3 1.6 9.8 19.9 679.2
2004/05 Keduang 421 12.8 61.4 17.9 36.1 59.7 47.3 1.6 3.9 240.8
Tirtomoyo 231 1.5 52.5 22.0 10.1 20.0 35.1 0.8 8.4 150.4
Temon 63 0.1 7.6 7.8 5.1 5.7 9.5 0.2 0.8 37.0
B. Solo 206 4.9 29.2 12.8 5.8 16.1 9.5 0.6 5.6 84.6
Alang 169 2.5 24.9 16.5 9.4 13.2 7.8 0.5 5.5 80.3
Remnant Area 152 2.8 22.0 9.7 8.4 14.4 13.7 0.5 3.4 74.8
Total 1,242 24.7 197.7 86.7 74.9 129.1 122.9 4.2 27.6 667.9
Mean Keduang 421 22.9 38.7 50.0 81.1 82.6 44.6 10.7 7.5 5.0 2.2 3.2 5.9 354.3
Tirtomoyo 231 11.6 26.7 29.9 49.0 48.5 26.9 6.3 4.4 3.4 0.6 0.3 2.8 210.4
Temon 63 2.2 5.0 6.7 10.3 9.7 5.1 1.1 0.8 0.5 0.0 0.1 0.5 41.9
B. Solo 206 8.1 17.7 22.2 36.0 34.9 16.4 3.8 3.0 2.0 0.2 0.3 1.8 146.4
Alang 169 7.8 15.2 18.7 27.4 30.0 12.3 3.0 2.4 1.0 0.1 0.2 1.7 119.8
Remnant Area 152 7.0 13.6 16.5 25.5 25.0 13.7 3.5 2.5 1.7 0.4 0.6 1.8 111.7
Total 1,242 59.6 116.9 144.1 229.3 230.6 119.0 28.3 20.5 13.6 3.6 4.7 14.3 984.4
* Data of 2004/05 is up to June 2005
Source : JICA Study Team
T-19

Table 5.5 Estimated PMP on Wonogiri Reservoir Watershed
Unit : mm
Sido
harjo
125
Jatir
oto
130a
Jatis
rono
131
Sido
harjo
125
Jatir
oto
130a
Jatis
rono
131
24 25 27 24 25 271973 91.0 8,2811974 105.0 11,0251975 161.0 25,9211976 115.0 13,2251977 102.0 107.0 10,404 11,4491978 101.0 87.0 73.0 10,201 7,569 5,3291979 84.0 62.0 69.0 7,056 3,844 4,7611980 74.0 53.0 72.0 5,476 2,809 5,1841981 129.0 65.0 92.0 16,641 4,225 8,4641982 104.0 59.0 69.0 10,816 3,481 4,7611983 87.0 73.0 83.0 7,569 5,329 6,8891984 101.0 185.0 104.0 10,201 34,225 10,8161985 91.0 96.0 104.0 8,281 9,216 10,8161986 65.0 89.0 75.0 4,225 7,921 5,6251987 96.0 72.0 75.0 9,216 5,184 5,6251988 163.0 107.0 125.0 26,569 11,449 15,6251989 107.0 84.0 90.0 11,449 7,056 8,1001990 72.0 80.0 76.0 5,184 6,400 5,7761991 73.0 77.0 88.0 5,329 5,929 7,7441992 91.0 74.0 70.0 8,281 5,476 4,9001993 84.0 81.0 112.0 7,056 6,561 12,5441994 104.0 55.0 81.0 10,816 3,025 6,5611995 118.0 90.0 93.0 13,924 8,100 8,6491996 67.0 85.0 66.0 4,489 7,225 4,3561997 102.0 63.0 67.0 10,404 3,969 4,4891998 79.0 68.0 75.0 6,241 4,624 5,6251999 84.0 68.0 90.0 7,056 4,624 8,1002000 74.0 95.0 63.0 5,476 9,025 3,9692001 88.0 85.0 64.0 7,744 7,225 4,0962002 82.0 80.0 64.0 6,724 6,400 4,0962003 70.0 63.0 4,900 3,9692004 102.0 89.0 10,404 7,9212005 107.0 71.0 11,449 5,041
9,108.8 7,743.9 7,582.5
Xn (Mean) 93.2 84.5 84.5 Sn (Mean) 20.8 24.7 21.0Xm (Max.) 163.0 185.0 161.0n 26 30 31Xn-m 90.4 81.0 82.0 Sn-m 15.7 16.4 15.9Xn-m / Xn 0.97 0.96 0.97 Sn-m / Sn 0.75 0.67 0.76
Xn Adjustment Factor : 1.01 0.99 1.00Adjustment Factor : 1.01 1.01 1.01Adjusted Xn : 95.0 84.5 85.4
Sn Adjustment Factor : 0.87 0.75 0.86Adjustment Factor : 1.05 1.04 1.04Adjusted Sn : 19.0 19.3 18.8
Km : 15.4 15.8 15.8
387.1 388.7 381.6
Adjustment factor (f0) 1.13 1.13 1.13437.5 439.2 431.2
0.70 0.70 0.70
306.2 307.4 301.9
Source : JICA Study Team
Adjusted PMP for WonogiriReservoir Watershed
x2
Adjustment of Point PMP toWonogiri Reservoir Watershed :
Adjustment of PMP :
Unadjusted Point Value ofPMP :
Annual Maximum Rainfall (x)
T-20

Unit: Mil. m3
Year Jan Feb Mar Apr May Jun Jul Aug Sep Oct Nov Dec Annual
1983 Spillway 166.4 0.0 2.6 102.2 108.8 0.0 0.0 0.0 0.0 0.0 0.0 0.0 380.0Turbine 17.0 57.9 60.3 98.6 117.9 70.9 71.1 59.0 60.6 66.1 76.1 83.1 838.6Total 183.4 57.9 62.9 200.7 226.7 70.9 71.1 59.0 60.6 66.1 76.1 83.1 1,218.5
1984 Spillway 125.6 268.7 179.6 0.0 0.0 0.0 0.0 0.0 0.0 0.0 0.0 0.0 573.8Turbine 112.2 103.6 114.3 107.7 109.5 73.1 68.8 67.8 86.8 126.7 49.3 174.2 1,194.2Total 237.8 372.2 293.9 107.7 109.5 73.1 68.8 67.8 86.8 126.7 49.3 174.2 1,767.9
1985 Spillway 0.0 0.0 226.5 0.0 0.0 0.0 0.0 0.0 0.0 0.0 0.0 0.0 226.5Turbine 177.9 159.3 156.7 115.3 82.2 53.8 60.7 62.9 62.1 69.6 67.8 178.5 1,246.7Total 177.9 159.3 383.2 115.3 82.2 53.8 60.7 62.9 62.1 69.6 67.8 178.5 1,473.3
1986 Spillway 35.4 76.6 171.1 119.2 0.0 0.0 0.0 0.0 0.0 0.0 0.0 0.0 402.3Turbine 153.8 134.6 157.1 151.6 55.8 53.4 59.8 57.0 58.4 60.9 83.6 63.4 1,089.4Total 189.2 211.2 328.3 270.7 55.8 53.4 59.8 57.0 58.4 60.9 83.6 63.4 1,491.7
1987 Spillway 0.0 82.8 30.1 0.0 0.0 0.0 0.0 0.0 0.0 0.0 0.0 0.0 112.9Turbine 169.2 143.4 156.1 55.5 43.1 52.5 41.0 34.1 46.5 31.5 29.1 129.3 931.2Total 169.2 226.2 186.1 55.5 43.1 52.5 41.0 34.1 46.5 31.5 29.1 129.3 1,044.0
1988 Spillway 0.0 124.4 0.0 0.0 0.0 0.0 0.0 0.0 0.0 0.0 0.0 0.0 124.4Turbine 142.1 141.0 66.4 43.6 46.9 50.5 65.4 63.6 67.6 60.7 112.2 161.5 1,021.4Total 142.1 265.4 66.4 43.6 46.9 50.5 65.4 63.6 67.6 60.7 112.2 161.5 1,145.8
1989 Spillway 0.0 0.0 23.9 0.0 0.0 2.2 0.0 0.0 0.0 0.0 0.0 0.0 26.0Turbine 143.6 74.7 154.7 93.9 68.4 56.0 47.0 51.4 62.6 64.8 78.6 86.2 982.2Total 143.6 74.7 178.6 93.9 68.4 58.2 47.0 51.4 62.6 64.8 78.6 86.2 1,008.2
1990 Spillway 0.0 1.6 95.4 0.0 0.0 0.0 0.0 0.0 0.0 0.0 0.0 0.0 97.0Turbine 82.5 77.7 132.1 53.0 44.6 43.6 46.3 58.5 46.3 51.4 53.0 41.5 730.4Total 82.5 79.3 227.5 53.0 44.6 43.6 46.3 58.5 46.3 51.4 53.0 41.5 827.4
1991 Spillway 0.0 244.2 0.0 0.0 0.0 0.0 0.0 0.0 0.0 0.0 0.0 0.0 244.2Turbine 62.4 130.0 99.8 75.5 85.1 68.6 56.4 53.2 54.8 57.2 53.8 66.1 862.9Total 62.4 374.1 99.8 75.5 85.1 68.6 56.4 53.2 54.8 57.2 53.8 66.1 1,107.1
1992 Spillway 18.9 0.0 81.4 33.6 0.0 0.0 0.0 0.0 0.0 0.0 0.0 0.0 133.9Turbine 77.9 92.6 149.1 124.3 59.0 51.6 53.6 53.6 85.9 77.0 63.2 151.6 1,039.4Total 96.8 92.6 230.4 157.9 59.0 51.6 53.6 53.6 85.9 77.0 63.2 151.6 1,173.2
1993 Spillway 97.1 0.0 0.0 58.3 0.0 0.0 0.0 0.0 0.0 0.0 0.0 0.0 155.4Turbine 155.4 136.6 151.7 145.1 60.1 58.3 60.3 71.6 74.5 88.7 84.4 98.9 1,185.6Total 252.6 136.6 151.7 203.4 60.1 58.3 60.3 71.6 74.5 88.7 84.4 98.9 1,341.0
1994 Spillway 0.0 0.0 161.1 23.2 0.0 0.0 0.0 0.0 0.0 0.0 0.0 0.0 184.3Turbine 124.6 145.8 137.0 89.0 56.7 53.4 49.8 46.3 66.2 67.0 59.6 32.6 928.1Total 124.6 145.8 298.1 112.3 56.7 53.4 49.8 46.3 66.2 67.0 59.6 32.6 1,112.4
1995 Spillway 0.0 41.0 139.3 0.0 0.0 0.0 0.0 0.0 0.0 0.0 0.0 232.9 413.2Turbine 29.4 116.8 150.5 114.0 51.6 49.9 54.5 58.3 76.3 82.2 78.6 165.6 1,027.7Total 29.4 157.8 289.8 114.0 51.6 49.9 54.5 58.3 76.3 82.2 78.6 398.5 1,440.9
1996 Spillway 0.0 0.0 0.0 0.0 0.0 0.0 0.0 0.0 0.0 0.0 0.0 0.0 0.0Turbine 151.0 144.4 109.7 49.2 45.0 43.0 44.4 40.3 60.6 87.6 87.4 111.3 973.7Total 151.0 144.4 109.7 49.2 45.0 43.0 44.4 40.3 60.6 87.6 87.4 111.3 973.7
1997 Spillway 0.0 0.0 0.0 0.0 0.0 0.0 0.0 0.0 0.0 0.0 0.0 0.0 0.0Turbine 95.2 99.7 66.4 45.4 47.4 32.8 19.3 32.0 36.1 42.0 24.8 6.0 547.1Total 95.2 99.7 66.4 45.4 47.4 32.8 19.3 32.0 36.1 42.0 24.8 6.0 547.1
1998 Spillway 0.0 0.0 73.1 81.8 16.7 0.0 0.0 0.0 0.0 0.0 111.2 1.1 283.8Turbine 10.8 7.4 43.0 106.2 84.6 58.4 114.9 70.1 101.4 122.4 119.6 92.7 931.4Total 10.8 7.4 116.0 188.0 101.3 58.4 114.9 70.1 101.4 122.4 230.7 93.8 1,215.2
1999 Spillway 103.6 101.7 94.9 14.2 0.0 0.0 0.0 0.0 0.0 0.0 0.0 0.0 314.4Turbine 140.6 145.9 154.9 90.9 64.9 60.9 55.8 68.6 78.7 50.5 41.0 53.8 1,006.4Total 244.3 247.6 249.8 105.1 64.9 60.9 55.8 68.6 78.7 50.5 41.0 53.8 1,320.8
2000 Spillway 0.0 106.2 225.5 148.9 0.0 0.0 0.0 0.0 0.0 0.0 0.0 0.0 480.6Turbine 104.9 134.6 106.7 93.5 52.9 57.3 84.4 85.9 73.7 43.8 39.8 62.8 940.2Total 104.9 240.8 332.3 242.3 52.9 57.3 84.4 85.9 73.7 43.8 39.8 62.8 1,420.8
2001 Spillway 2.2 0.0 123.4 44.6 0.0 0.0 0.0 0.0 0.0 0.0 0.0 0.0 170.2Turbine 43.6 72.1 75.6 135.9 62.4 67.6 75.1 79.1 82.7 41.9 42.3 54.0 832.3Total 45.8 72.1 199.0 180.5 62.4 67.6 75.1 79.1 82.7 41.9 42.3 54.0 1,002.5
2002 Spillway 0.0 272.0 0.0 12.8 0.0 0.0 0.0 0.0 0.0 0.0 0.0 0.0 284.8Turbine 19.1 138.1 97.7 144.5 71.5 70.5 75.5 65.0 62.4 34.1 5.3 3.7 787.5Total 19.1 410.1 97.7 157.3 71.5 70.5 75.5 65.0 62.4 34.1 5.3 3.7 1,072.2
2003 Spillway 0.0 46.3 104.8 0.0 0.0 0.0 0.0 0.0 0.0 0.0 0.0 0.0 151.0Turbine 50.3 97.6 159.5 71.4 57.2 69.5 68.3 49.9 50.4 22.0 3.0 105.1 804.3Total 50.3 143.9 264.3 71.4 57.2 69.5 68.3 49.9 50.4 22.0 3.0 105.1 955.3
2004 Spillway 0.0 0.0 0.0 0.0 0.0 0.0 0.0 0.0 0.0 0.0 0.0 0.0 0.0Turbine 30.7 39.0 73.1 43.3 54.3 66.5 68.4 66.1 41.9 48.2 4.8 76.3 612.7Total 30.7 39.0 73.1 43.3 54.3 66.5 68.4 66.1 41.9 48.2 4.8 76.3 612.7
2005 Spillway 0.0 0.0 0.0 0.0 0.0 0.0 0.0 0.0 0.0 0.0 0.0 0.0 0.0Turbine 103.5 49.8 23.9 75.2 65.6 70.4 66.8 78.5 69.2 36.7 16.5 13.5 669.5Total 103.5 49.8 23.9 75.2 65.6 70.4 66.8 78.5 69.2 36.7 16.5 13.5 669.5
Mean Spillway 25.0 60.0 74.0 29.0 5.7 0.1 0.0 0.0 0.0 0.0 5.1 10.6 209.4Turbine 97.6 106.6 110.8 93.2 65.0 57.4 60.9 60.1 66.1 64.1 57.8 86.7 926.3Total 122.6 166.6 184.8 122.3 70.7 57.5 60.9 60.1 66.1 64.1 62.8 97.3 1,135.7
Source : JICA Study Team
Table 6.1 Monthly Dam Outflow Volume (1983 - 2005)
T-21

Year Date AnnualMaximum RWL
ExceedingCWL*
RWL againstPMF
ExceedingExtra FWL**
(El. m) (m) (El. m) (m)
(1) (1) - 135.3 (2) (2) - 139.11983 15-Apr 136.68 1.381984 06/Feb 136.30 1.001985 09/Mar 137.04 1.741986 28-Mar 135.40 0.101987 09-Mar 135.13 -0.181988 02-04-Apr 135.13 -0.171989 10-Mar 135.20 -0.101990 01-Mar 135.92 0.621991 15-Apr 136.34 1.041992 15-Apr 137.09 1.79 140.07 0.971993 09-Apr 136.85 1.541994 27-Mar 136.67 1.361995 06-07-Apr 136.72 1.421996 27-Mar 135.64 0.341997 15-Apr 133.57 -1.741998 26-Mar 136.74 1.441999 15-Apr 136.98 1.682000 08-Apr 136.81 1.512001 30-Mar 137.23 1.93 140.20 1.102002 06-Apr 137.02 1.72 140.09 0.992003 23-Mar 136.62 1.322004 11-12-Apr 136.39 1.092005 07-Apr 136.97 1.67 140.06 0.96
* : CWL is as El. 135.3 m** : Extra FWL is as El. 139.1 mSource : JICA Study Team
Table 6.3 Annual Maximum RWL during Flood Period
T-22