Embed Size (px)
Citation preview

FINAL REPORT
On Project 25-34
Supplemental Guidance on the Application of
FHWA’s Traffic Noise Model (TNM)
APPENDIX K
Parallel Barriers
Prepared for:
National Cooperative Highway Research Program (NCHRP)
Transportation Research Board of
The National Academies
March 2014
HMMH Report No. 304780
Prepared by:
Research Topic Lead Bowlby & Associates, Inc. in association with
Environmental Acoustics Grant S. Anderson Douglas E. Barrett

Final Technical Report: NCHRP 25-34 – Supplemental Guidance on the Application of FHWA’s TNM
Appendix K Parallel Barriers
iii
Contents
Appendix K Parallel Barriers ........................................................................................................... K-5
K.1 Introduction ................................................................................................................................. K-5
K.2 Height–to-width ratio for the barriers and receiver position behind one of the barriers .... K-5
K.3 Number of FHWA TNM roadways used to represent the travel lanes ................................. K-10
K.4 Source position ......................................................................................................................... K-11
K.5 Differences in the heights (top elevations) of the two barriers ............................................ K-17
K.6 Internal vertical reflecting surface .......................................................................................... K-18
K.7 Vehicle mix (e.g., autos only vs. heavy trucks only) ............................................................. K-20
K.8 Hourly volumes of vehicles ...................................................................................................... K-21
K.9 Vehicle speed ............................................................................................................................ K-21
K.10 Noise reduction coefficient (NRC) of barrier surfaces .......................................................... K-21
K.11 Comparison of measured and modeled levels including parallel barrier sound level
increases ................................................................................................................................................ K-28
Final Technical Report: NCHRP 25-34 – Supplemental Guidance on the Application of FHWA’s TNM
Appendix K Parallel Barriers
iv
(This page intentionally left blank)

Final Technical Report: NCHRP 25-34 – Supplemental Guidance on the Application of FHWA’s TNM
Appendix K Parallel Barriers
K-5
Appendix K Parallel Barriers
K.1 Introduction
FHWA TNM 2.5 models this three-dimensional phenomenon in a separate two-dimensional Parallel
Barrier Analysis module inside the program. Input data are passed to the module from the main part of
TNM, but the computed parallel barrier sound level increases are not linked back to the Leq computed by
the main part of TNM.
The objective of this research was to investigate the sensitivity of the parallel barrier module to a variety
of factors and refine the available guidance on the use of the module. The areas that were studied relating
to the sensitivity of the computed sound level increase to the input parameters include:
Height-to-width ratio for the barriers and receiver position behind the barrier
Number of FHWA TNM roadways used to represent the travel lanes
Source position
Differences in the heights (top elevations) of the two barriers
Internal vertical reflecting surface
Vehicle mix (e.g., autos only vs. heavy trucks only)
Hourly volumes of vehicles
Vehicle speed
Noise reduction coefficient of barrier surfaces
The research also evaluated two sets of measured and modeled data for a parallel barrier project before
and after the addition of sound-absorbing panels to one of the barriers.
K.2 Height–to-width ratio for the barriers and receiver position behind one of the barriers
The sound level increase due to multiple reflections between the parallel barriers is partly a function of
the width-to-height ratio for the cross-section (distance between the noise barriers divided by their
height). In general, the smaller the ratio, the greater the sound level increase will be. For these tests, an
8-lane cross-section was developed that had a barrier-to-barrier width of 136 ft (eight 12-ft lanes) with
10-ft inside and outside shoulders in each travel direction. Each lane was modeled by an FHWA TNM
“Parallel Roadway,” which will be referred to simply as a roadway, even though it is a distinct object
different from the main FHWA TNM “Roadways.” Barrier heights were varied from 1 ft to 20 ft. The
resulting width-to-height ratios are shown in Figure 1 for heights between 6 and 20 ft, ranging from 23:1
for 6 ft to 7:1 for 20 ft. The barriers are assumed to be sound-reflecting, with a noise reduction
coefficient (NRC) of 0.05.
In the FHWA TNM parallel barrier module, the points at which the sound level increases are predicted
are called Analysis Locations. Their z-coordinates represent the elevation of the “ear.” In the main part
of FHWA TNM, the points at which levels are predicted are called “Receivers,” where the z-coordinate
represents the elevation of the ground with a height above ground entered to determine the elevation of
the ear. In this discussion, for simplicity, the point at which the level is predicted will be called a
receiver, with the understanding that it is located at the ear elevation, not the ground elevation.

Final Technical Report: NCHRP 25-34 – Supplemental Guidance on the Application of FHWA’s TNM
Appendix K Parallel Barriers
K-6
As illustrated in Figure 2, an array of receivers was modeled for six distances back from the near wall (25,
50, 100, 150, 200 and 300 ft) and at four heights relative to the roadway surface: 15 ft, 5 ft, -5 ft and 15 ft.
These heights represent an exterior second-story location in an at-grade cross-section, a typical exterior
first-floor receiver 5 ft above the ground in an at-grade cross-section, a receiver alongside a 10-ft roadway
embankment (-5 ft height minus an additional assumed 5 ft drop to the ground), and a receiver alongside a
20-ft roadway embankment (-15 ft height minus an additional assumed 5 ft drop to the ground).
Figure 1 Width-to-height ratios for the tested barrier heights for the 8-lane cross-section.
Figure 2 Illustration of receiver array, at heights of 15, 5, -5 and -15 ft relative to the roadway
surface and distances of 25, 50, 100, 150, 200 and 300 ft from the near wall.
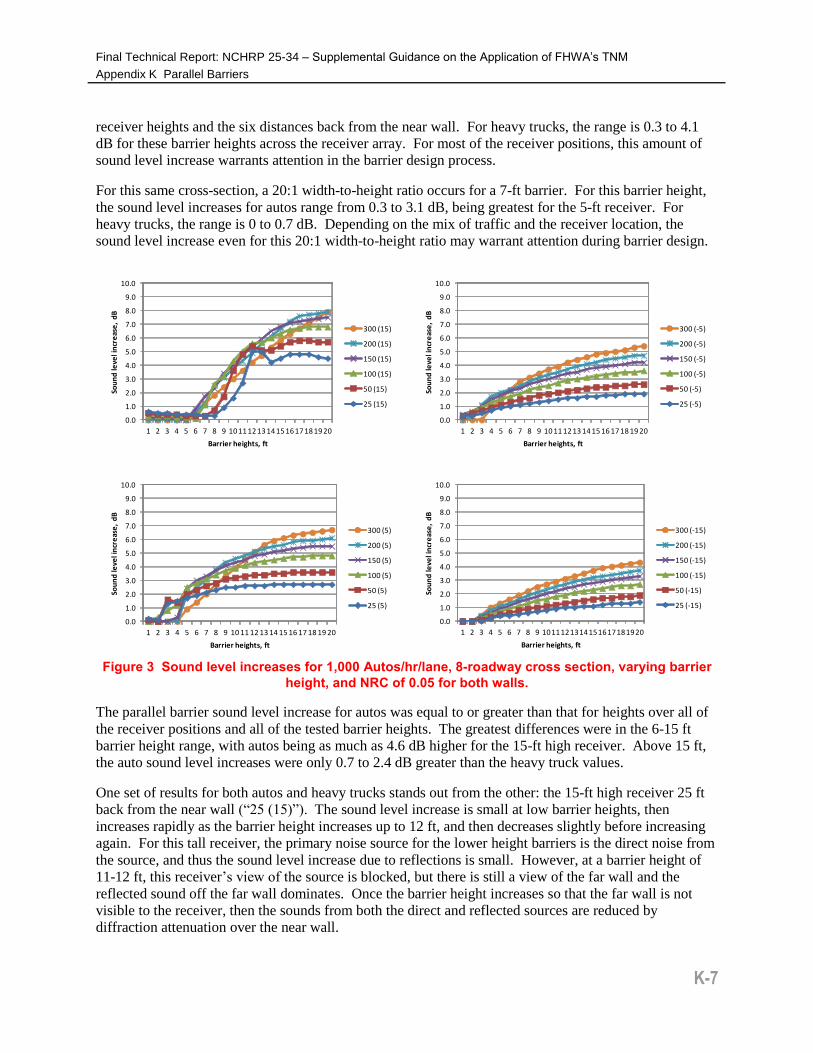
Figure 3 shows the sound level increases for autos only, and Figure 4 shows the sound level increases for
heavy trucks only. Each figure has four graphs, one for each of the four receiver heights relative to the
roadway surface: 15 ft, 5 ft, -5 ft and -15 ft. Each line on each graph is the sound level increases for
different barrier heights for a difference distance from the near wall. Both figures illustrate that the sound
level increase is a function of not only barrier height (and thus width-to-height ratio), but also receiver
height above or below the road, receiver distance back from the near wall, and vehicle type.
For this cross-section, a 10:1 width-to-height ratio occurs between the 13 and 14-ft high barrier cases.
For these barrier heights, the sound level increases for autos range from 1.0 to 6.5 dB over the four
0.0
5.0
10.0
15.0
20.0
25.0
6 8 10 12 14 16 18 20
Wid
th-t
o-h
eig
ht
rati
o
Barrier height, ft
Final Technical Report: NCHRP 25-34 – Supplemental Guidance on the Application of FHWA’s TNM
Appendix K Parallel Barriers
K-7
receiver heights and the six distances back from the near wall. For heavy trucks, the range is 0.3 to 4.1
dB for these barrier heights across the receiver array. For most of the receiver positions, this amount of
sound level increase warrants attention in the barrier design process.
For this same cross-section, a 20:1 width-to-height ratio occurs for a 7-ft barrier. For this barrier height,
the sound level increases for autos range from 0.3 to 3.1 dB, being greatest for the 5-ft receiver. For
heavy trucks, the range is 0 to 0.7 dB. Depending on the mix of traffic and the receiver location, the
sound level increase even for this 20:1 width-to-height ratio may warrant attention during barrier design.
Figure 3 Sound level increases for 1,000 Autos/hr/lane, 8-roadway cross section, varying barrier
height, and NRC of 0.05 for both walls.
The parallel barrier sound level increase for autos was equal to or greater than that for heights over all of
the receiver positions and all of the tested barrier heights. The greatest differences were in the 6-15 ft
barrier height range, with autos being as much as 4.6 dB higher for the 15-ft high receiver. Above 15 ft,
the auto sound level increases were only 0.7 to 2.4 dB greater than the heavy truck values.
One set of results for both autos and heavy trucks stands out from the other: the 15-ft high receiver 25 ft
back from the near wall (“25 (15)”). The sound level increase is small at low barrier heights, then
increases rapidly as the barrier height increases up to 12 ft, and then decreases slightly before increasing
again. For this tall receiver, the primary noise source for the lower height barriers is the direct noise from
the source, and thus the sound level increase due to reflections is small. However, at a barrier height of
11-12 ft, this receiver’s view of the source is blocked, but there is still a view of the far wall and the
reflected sound off the far wall dominates. Once the barrier height increases so that the far wall is not
visible to the receiver, then the sounds from both the direct and reflected sources are reduced by
diffraction attenuation over the near wall.
0.0
1.0
2.0
3.0
4.0
5.0
6.0
7.0
8.0
9.0
10.0
1 2 3 4 5 6 7 8 9 10 11 12 13 14 15 16 17 18 19 20
Sou
nd
leve
l in
cre
ase
, d
B
Barrier heights, ft
300 (15)
200 (15)
150 (15)
100 (15)
50 (15)
25 (15)
0.0
1.0
2.0
3.0
4.0
5.0
6.0
7.0
8.0
9.0
10.0
1 2 3 4 5 6 7 8 9 10 11 12 13 14 15 16 17 18 19 20
Sou
nd
leve
l in
cre
ase
, d
B
Barrier heights, ft
300 (5)
200 (5)
150 (5)
100 (5)
50 (5)
25 (5)
0.0
1.0
2.0
3.0
4.0
5.0
6.0
7.0
8.0
9.0
10.0
1 2 3 4 5 6 7 8 9 10 11 12 13 14 15 16 17 18 19 20So
un
d le
vel i
ncr
eas
e,
dB
Barrier heights, ft
300 (-5)
200 (-5)
150 (-5)
100 (-5)
50 (-5)
25 (-5)
0.0
1.0
2.0
3.0
4.0
5.0
6.0
7.0
8.0
9.0
10.0
1 2 3 4 5 6 7 8 9 1011121314151617181920
Sou
nd
leve
l in
cre
ase
, d
B
Barrier heights, ft
300 (-15)
200 (-15)
150 (-15)
100 (-15)
50 (-15)
25 (-15)
Final Technical Report: NCHRP 25-34 – Supplemental Guidance on the Application of FHWA’s TNM
Appendix K Parallel Barriers
K-8
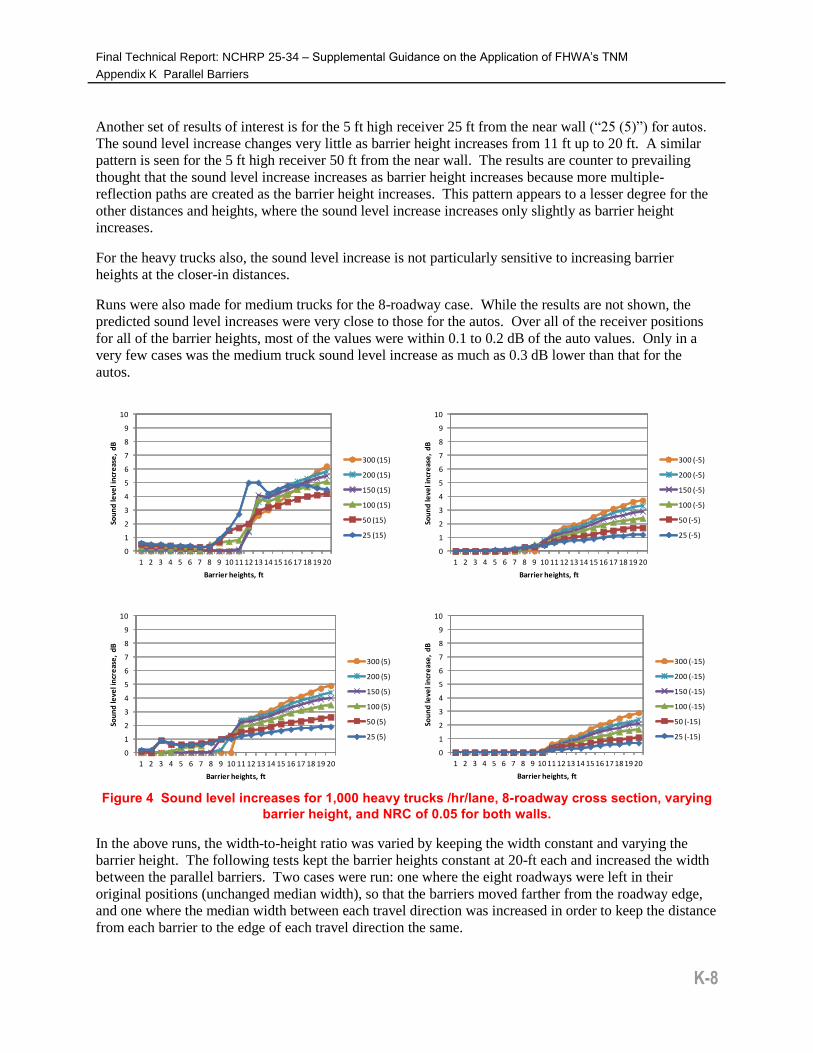
Another set of results of interest is for the 5 ft high receiver 25 ft from the near wall (“25 (5)”) for autos.
The sound level increase changes very little as barrier height increases from 11 ft up to 20 ft. A similar
pattern is seen for the 5 ft high receiver 50 ft from the near wall. The results are counter to prevailing
thought that the sound level increase increases as barrier height increases because more multiple-
reflection paths are created as the barrier height increases. This pattern appears to a lesser degree for the
other distances and heights, where the sound level increase increases only slightly as barrier height
increases.
For the heavy trucks also, the sound level increase is not particularly sensitive to increasing barrier
heights at the closer-in distances.
Runs were also made for medium trucks for the 8-roadway case. While the results are not shown, the
predicted sound level increases were very close to those for the autos. Over all of the receiver positions
for all of the barrier heights, most of the values were within 0.1 to 0.2 dB of the auto values. Only in a
very few cases was the medium truck sound level increase as much as 0.3 dB lower than that for the
autos.
Figure 4 Sound level increases for 1,000 heavy trucks /hr/lane, 8-roadway cross section, varying
barrier height, and NRC of 0.05 for both walls.
In the above runs, the width-to-height ratio was varied by keeping the width constant and varying the
barrier height. The following tests kept the barrier heights constant at 20-ft each and increased the width
between the parallel barriers. Two cases were run: one where the eight roadways were left in their
original positions (unchanged median width), so that the barriers moved farther from the roadway edge,
and one where the median width between each travel direction was increased in order to keep the distance
from each barrier to the edge of each travel direction the same.
0
1
2
3
4
5
6
7
8
9
10
1 2 3 4 5 6 7 8 9 10 11 12 13 14 15 16 17 18 19 20
Sou
nd
leve
l in
cre
ase
, d
B
Barrier heights, ft
300 (15)
200 (15)
150 (15)
100 (15)
50 (15)
25 (15)
0
1
2
3
4
5
6
7
8
9
10
1 2 3 4 5 6 7 8 9 10 11 12 13 14 15 16 17 18 19 20
Sou
nd
leve
l in
cre
ase
, d
B
Barrier heights, ft
300 (5)
200 (5)
150 (5)
100 (5)
50 (5)
25 (5)
0
1
2
3
4
5
6
7
8
9
10
1 2 3 4 5 6 7 8 9 10 11 12 13 14 15 16 17 18 19 20
Sou
nd
leve
l in
cre
ase
, d
B
Barrier heights, ft
300 (-5)
200 (-5)
150 (-5)
100 (-5)
50 (-5)
25 (-5)
0
1
2
3
4
5
6
7
8
9
10
1 2 3 4 5 6 7 8 9 10 11 12 13 14 15 16 17 18 19 20
Sou
nd
leve
l in
cre
ase
, d
B
Barrier heights, ft
300 (-15)
200 (-15)
150 (-15)
100 (-15)
50 (-15)
25 (-15)

Final Technical Report: NCHRP 25-34 – Supplemental Guidance on the Application of FHWA’s TNM
Appendix K Parallel Barriers
K-9
Figure 5 shows the results where the roadways were not moved outward and Figure 6 shows the case
where the roadways were moved outward so that the distance from the barriers to the roadway edges
remained the same. In both cases, the 6.8 width-to-height ratio represents the original 136-ft wide
separation and the 20-ft barrier heights. Four graphs are shown for each figure, one for each receiver
height. The lines on each graph are for the different width-to-height ratios for each distance back from
the near roadway.
For the unchanged roadways in Figure 5, the sound level increases are similar for the 6.8:1 and 10:1
width-to-height ratios, and then decrease as the width-to-height ratio increases. Even at 20:1, sound level
increases over 2 dB are seen for the 15-ft high receiver over all distances, and farther back from the near
wall for the 5-ft receiver. At 20:1, the sound level increases for the -5 and -15-ft receiver heights are less
than 2 dB.
For the moved roadways in Figure 6, the patterns are similar to the unmoved roadways, but there is more
aviation in effect as a function of distance back.
Untested in these cases is whether or not the sound level increases would occur in the real world. A 20:1
width-to-height ratio for 20-ft high barriers means the barriers are 400 ft apart. Meteorological effects on
the sound propagation, such as wind shear (changing wind speed with altitude) or temperature lapse rate
(changing temperature with altitude) could easily have more effect on the levels over these distances due
to refraction than would the reflected paths.
Figure 5 Sound level increases for varying width-to-height ratio for 20-ft high barriers: barriers
moved outward, roadways and median unchanged.
0
1
2
3
4
5
6
7
8
9
10
6.8 10 15 20
Sou
nd
leve
l in
cre
ase
, d
B
Width to height ratio
300(15)
200(15)
150(15)
100(15)
50(15)
25(15)
0
1
2
3
4
5
6
7
8
9
10
6.8 10 15 20
Sou
nd
leve
l in
cre
ase
, d
B
Width to height ratio
300(5)
200(5)
150(5)
100(5)
50(5)
25(5)
0
1
2
3
4
5
6
7
8
9
10
6.8 10 15 20
Sou
nd
leve
l in
cre
ase
, d
B
Width to height ratio
300(-5)
200(-5)
150(-5)
100(-5)
50(-5)
25(-5)
0
1
2
3
4
5
6
7
8
9
10
6.8 10 15 20
Sou
nd
leve
l in
cre
ase
, d
B
Width to height ratio
300(-15)
200(-15)
150(-15)
100(-15)
50(-15)
25(-15)
Final Technical Report: NCHRP 25-34 – Supplemental Guidance on the Application of FHWA’s TNM
Appendix K Parallel Barriers
K-10
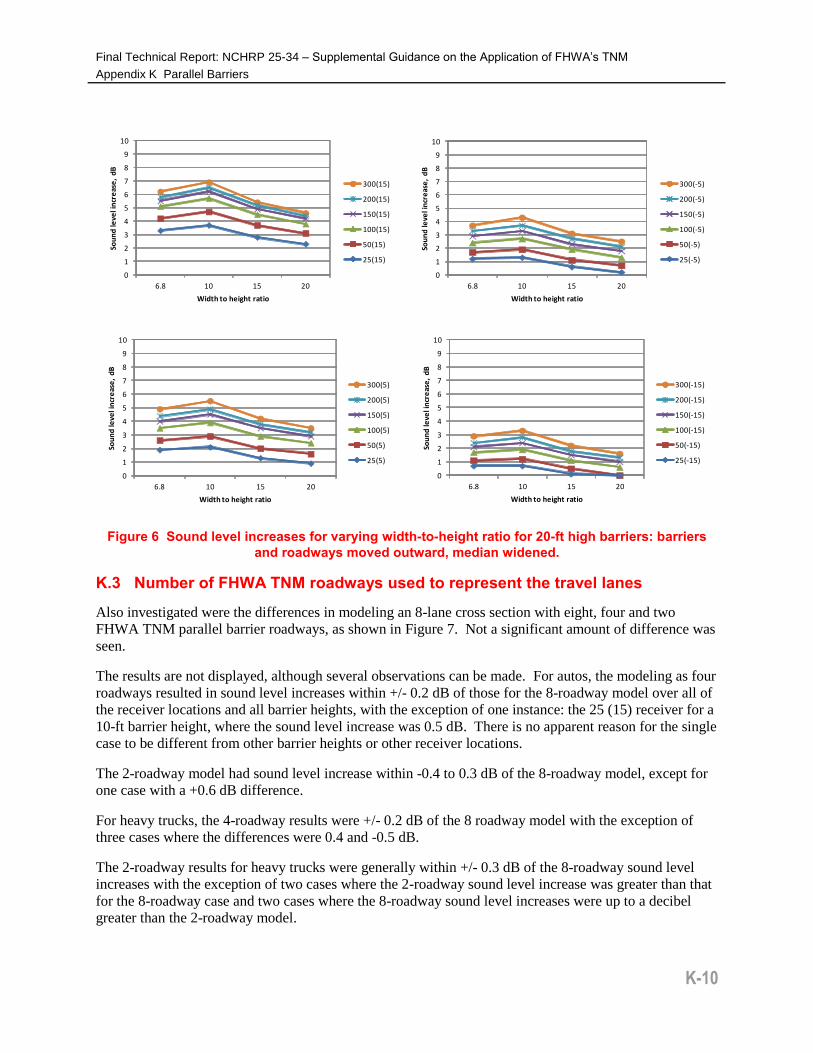
Figure 6 Sound level increases for varying width-to-height ratio for 20-ft high barriers: barriers
and roadways moved outward, median widened.
K.3 Number of FHWA TNM roadways used to represent the travel lanes
Also investigated were the differences in modeling an 8-lane cross section with eight, four and two
FHWA TNM parallel barrier roadways, as shown in Figure 7. Not a significant amount of difference was
seen.
The results are not displayed, although several observations can be made. For autos, the modeling as four
roadways resulted in sound level increases within +/- 0.2 dB of those for the 8-roadway model over all of
the receiver locations and all barrier heights, with the exception of one instance: the 25 (15) receiver for a
10-ft barrier height, where the sound level increase was 0.5 dB. There is no apparent reason for the single
case to be different from other barrier heights or other receiver locations.
The 2-roadway model had sound level increase within -0.4 to 0.3 dB of the 8-roadway model, except for
one case with a +0.6 dB difference.
For heavy trucks, the 4-roadway results were +/- 0.2 dB of the 8 roadway model with the exception of
three cases where the differences were 0.4 and -0.5 dB.
The 2-roadway results for heavy trucks were generally within +/- 0.3 dB of the 8-roadway sound level
increases with the exception of two cases where the 2-roadway sound level increase was greater than that
for the 8-roadway case and two cases where the 8-roadway sound level increases were up to a decibel
greater than the 2-roadway model.
0
1
2
3
4
5
6
7
8
9
10
6.8 10 15 20
Sou
nd
leve
l in
cre
ase
, d
B
Width to height ratio
300(15)
200(15)
150(15)
100(15)
50(15)
25(15)
0
1
2
3
4
5
6
7
8
9
10
6.8 10 15 20
Sou
nd
leve
l in
cre
ase
, d
B
Width to height ratio
300(5)
200(5)
150(5)
100(5)
50(5)
25(5)
0
1
2
3
4
5
6
7
8
9
10
6.8 10 15 20
Sou
nd
leve
l in
cre
ase
, d
B
Width to height ratio
300(-5)
200(-5)
150(-5)
100(-5)
50(-5)
25(-5)
0
1
2
3
4
5
6
7
8
9
10
6.8 10 15 20
Sou
nd
leve
l in
cre
ase
, d
B
Width to height ratio
300(-15)
200(-15)
150(-15)
100(-15)
50(-15)
25(-15)

Final Technical Report: NCHRP 25-34 – Supplemental Guidance on the Application of FHWA’s TNM
Appendix K Parallel Barriers
K-11
The trends in the differences between the auto and heavy truck sound level increases discussed earlier for
the 8-roadway model were similar to those for the 4-roadway and 2-roadway models.
Figure 7 Cross-sections of eight, four and two FHWA TNM parallel barrier roadways, all with the
same total traffic volume.
K.4 Source position
Of interest is the effect of source position in the canyon between the two parallel barriers. As shown in
Figure 8, cases were created in the 8-lane cross-section representing the four “far” lanes by four FHWA
TNM roadways and then by one roadway centered between them, and the four “near” lanes by four
roadways and then one roadway. Separate cases were run for autos and heavy trucks and for barrier
heights of 8, 12, 16 and 20 ft.

Final Technical Report: NCHRP 25-34 – Supplemental Guidance on the Application of FHWA’s TNM
Appendix K Parallel Barriers
K-12
Figure 8 Varying source position: far lanes (left) and near lanes (right) represented by four (top)
and one (bottom) FHWA TNM roadways.
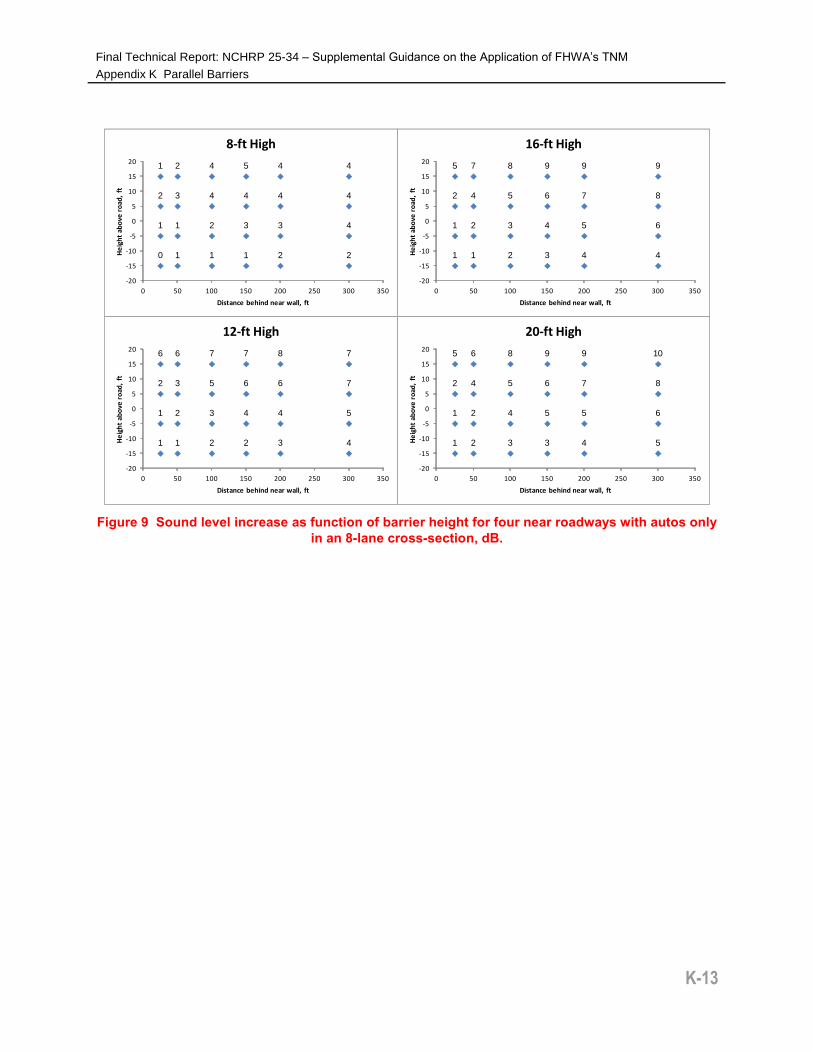
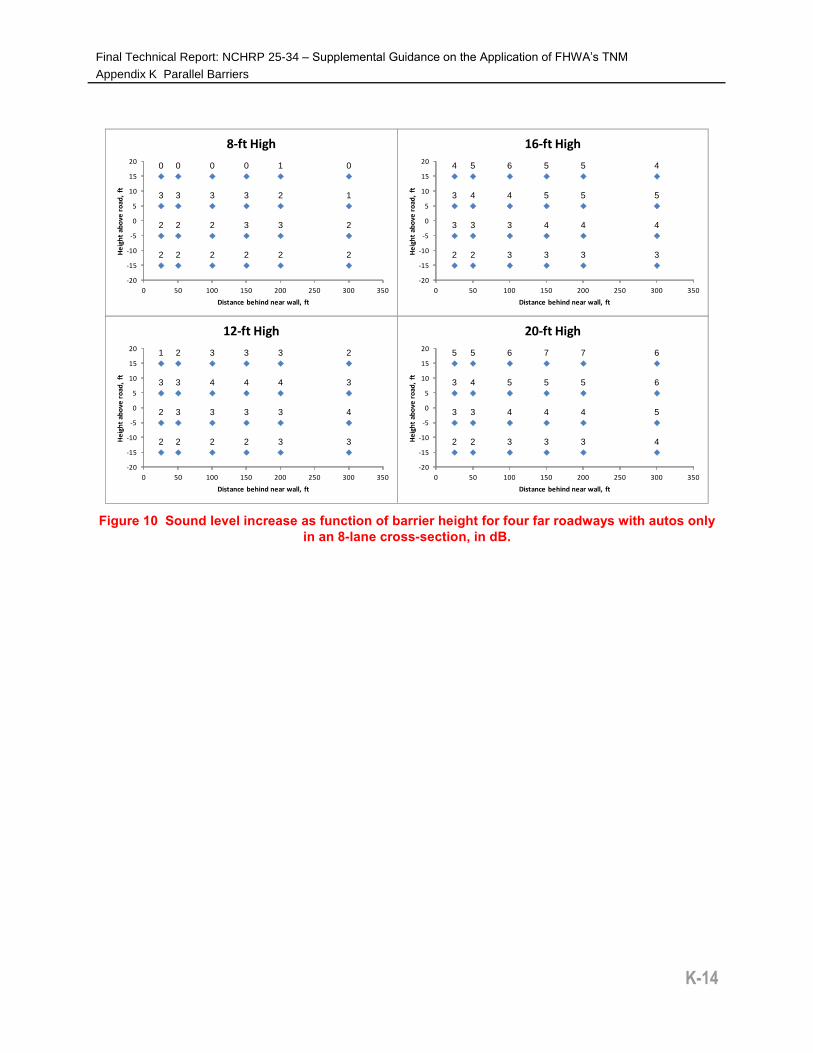
Figure 9 shows four cross-sectional views representing of the receiver array labeled with the sound level
increases rounded to the nearest decibel for the four barrier heights. These results are for autos only for
the case of four “near” roadways. In the figure, the roadways and barriers would be to the left of the
receivers. Figure 10 shows the same for the case of four “far” roadways.
Figure 11 then shows the differences in the sound level increases for autos between the four “near”
roadways case and four “far” roadways case. A positive value means that the near roadway sound level
increase is greater than the far roadway sound level increase.
First, the results confirm, as shown earlier, that the sound level increase is very dependent on the receiver
position behind the near wall, both in terms of distance and height.
Second, the results show the relative insensitivity of the sound level increase to source position within the
canyon between the two walls for many of the tested receiver positions. Source position only has a small
effect on the sound level increase for the lower receiver positions, especially close to the near wall, but
has a larger effect, in general, at the highest and more distant receiver positions. The effect is not
sensitive to receiver height, except at the 15-ft high position closer to the near wall. The difference in the
sound level increase between the four far roadways and for near roadways in within a range +/- 1 for all
but one of the receiver positions within 150 ft of the near wall for the receiver heights of -15, -5 and 5 ft.
For greater distance back and for the 15-ft high receiver, the differences in the near-roadway and far-
roadway modeling were often 2 or more dB.
While not shown, the difference for heavy trucks only between these four near roadway and four far
roadway cases are similar to the autos-only cases. The autos-only sound level increases are generally
higher than the heavy truck-only sound level increases, with the difference between vehicle types greater
for the near roadways than the far roadways, largely a function of the vertical sound energy distribution
difference in the two vehicle types.
Final Technical Report: NCHRP 25-34 – Supplemental Guidance on the Application of FHWA’s TNM
Appendix K Parallel Barriers
K-13
Figure 9 Sound level increase as function of barrier height for four near roadways with autos only
in an 8-lane cross-section, dB.
0
1
2
1
1
1
3
2
1
2
4
4
1
3
4
5
2
3
4
4
2
4
4
4
-20
-15
-10
-5
0
5
10
15
20
0 50 100 150 200 250 300 350
He
igh
t ab
ove
ro
ad,
ft
Distance behind near wall, ft
8-ft High
1
1
2
6
1
2
3
6
2
3
5
7
2
4
6
7
3
4
6
8
4
5
7
7
-20
-15
-10
-5
0
5
10
15
20
0 50 100 150 200 250 300 350
He
igh
t ab
ove
ro
ad,
ft
Distance behind near wall, ft
12-ft High
1
1
2
5
1
2
4
7
2
3
5
8
3
4
6
9
4
5
7
9
4
6
8
9
-20
-15
-10
-5
0
5
10
15
20
0 50 100 150 200 250 300 350
He
igh
t ab
ove
ro
ad,
ft
Distance behind near wall, ft
16-ft High
1
1
2
5
2
2
4
6
3
4
5
8
3
5
6
9
4
5
7
9
5
6
8
10
-20
-15
-10
-5
0
5
10
15
20
0 50 100 150 200 250 300 350
He
igh
t ab
ove
ro
ad,
ft
Distance behind near wall, ft
20-ft High
Final Technical Report: NCHRP 25-34 – Supplemental Guidance on the Application of FHWA’s TNM
Appendix K Parallel Barriers
K-14
Figure 10 Sound level increase as function of barrier height for four far roadways with autos only
in an 8-lane cross-section, in dB.
2
2
3
0
2
2
3
0
2
2
3
0
2
3
3
0
2
3
2
1
2
2
1
0
-20
-15
-10
-5
0
5
10
15
20
0 50 100 150 200 250 300 350
He
igh
t ab
ove
ro
ad,
ft
Distance behind near wall, ft
8-ft High
2
2
3
1
2
3
3
2
2
3
4
3
2
3
4
3
3
3
4
3
3
4
3
2
-20
-15
-10
-5
0
5
10
15
20
0 50 100 150 200 250 300 350
He
igh
t ab
ove
ro
ad,
ft
Distance behind near wall, ft
12-ft High
2
3
3
4
2
3
4
5
3
3
4
6
3
4
5
5
3
4
5
5
3
4
5
4
-20
-15
-10
-5
0
5
10
15
20
0 50 100 150 200 250 300 350
He
igh
t ab
ove
ro
ad,
ft
Distance behind near wall, ft
16-ft High
2
3
3
5
2
3
4
5
3
4
5
6
3
4
5
7
3
4
5
7
4
5
6
6
-20
-15
-10
-5
0
5
10
15
20
0 50 100 150 200 250 300 350
He
igh
t ab
ove
ro
ad,
ft
Distance behind near wall, ft
20-ft High
Final Technical Report: NCHRP 25-34 – Supplemental Guidance on the Application of FHWA’s TNM
Appendix K Parallel Barriers
K-15
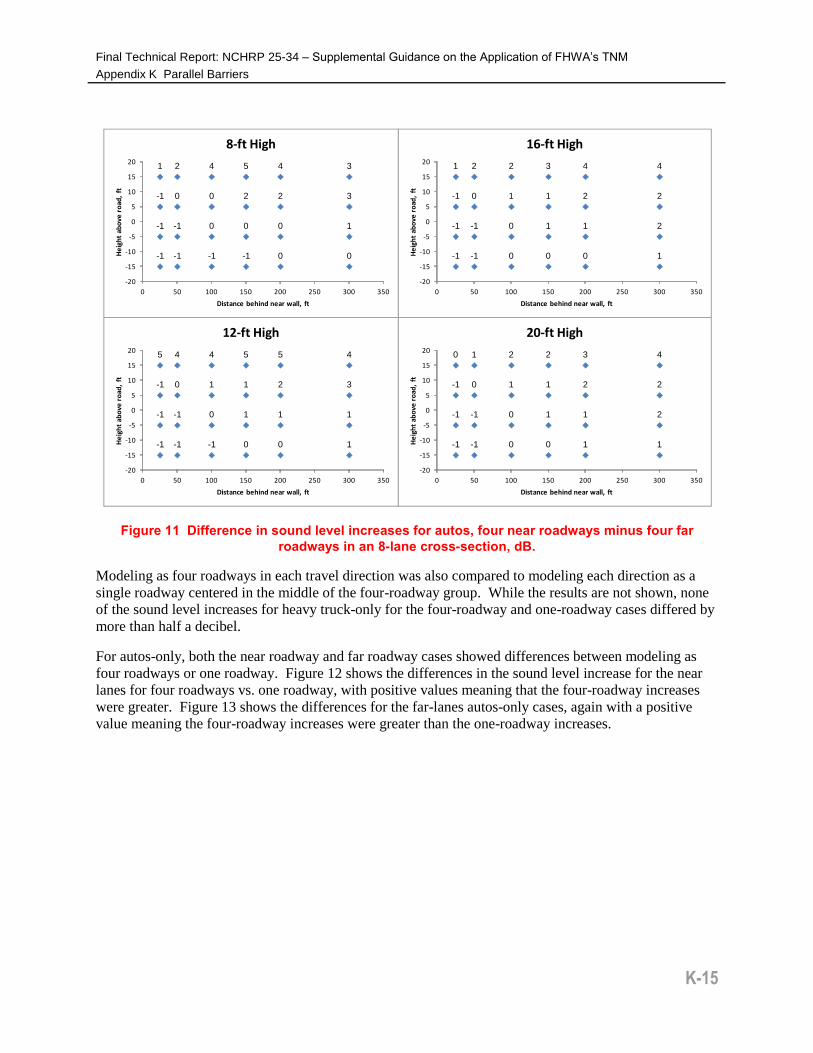
Figure 11 Difference in sound level increases for autos, four near roadways minus four far
roadways in an 8-lane cross-section, dB.
Modeling as four roadways in each travel direction was also compared to modeling each direction as a
single roadway centered in the middle of the four-roadway group. While the results are not shown, none
of the sound level increases for heavy truck-only for the four-roadway and one-roadway cases differed by
more than half a decibel.
For autos-only, both the near roadway and far roadway cases showed differences between modeling as
four roadways or one roadway. Figure 12 shows the differences in the sound level increase for the near
lanes for four roadways vs. one roadway, with positive values meaning that the four-roadway increases
were greater. Figure 13 shows the differences for the far-lanes autos-only cases, again with a positive
value meaning the four-roadway increases were greater than the one-roadway increases.
-1
-1
-1
1
-1
-1
0
2
0
0
1
2
0
1
1
3
0
1
2
4
1
2
2
4
-20
-15
-10
-5
0
5
10
15
20
0 50 100 150 200 250 300 350
He
igh
t ab
ove
ro
ad,
ft
Distance behind near wall, ft
16-ft High
-1
-1
-1
0
-1
-1
0
1
0
0
1
2
0
1
1
2
1
1
2
3
1
2
2
4
-20
-15
-10
-5
0
5
10
15
20
0 50 100 150 200 250 300 350
He
igh
t ab
ove
ro
ad,
ft
Distance behind near wall, ft
20-ft High
-1
-1
-1
1
-1
-1
0
2
-1
0
0
4
-1
0
2
5
0
0
2
4
0
1
3
3
-20
-15
-10
-5
0
5
10
15
20
0 50 100 150 200 250 300 350
He
igh
t ab
ove
ro
ad,
ft
Distance behind near wall, ft
8-ft High
-1
-1
-1
5
-1
-1
0
4
-1
0
1
4
0
1
1
5
0
1
2
5
1
1
3
4
-20
-15
-10
-5
0
5
10
15
20
0 50 100 150 200 250 300 350
He
igh
t ab
ove
ro
ad,
ft
Distance behind near wall, ft
12-ft High

Final Technical Report: NCHRP 25-34 – Supplemental Guidance on the Application of FHWA’s TNM
Appendix K Parallel Barriers
K-16
Figure 12 Difference in sound level increases for autos, four near roadways minus one near
roadway in an 8-lane cross-section, in dB.
1
1
1
2
1
1
2
3
1
2
2
4
2
2
3
4
2
3
3
4
3
3
4
4
-20
-15
-10
-5
0
5
10
15
20
0 50 100 150 200 250 300 350
He
igh
t ab
ove
ro
ad,
ft
Distance behind near wall, ft
16-ft High
1
1
1
1
1
1
1
2
1
1
2
2
1
2
2
2
2
2
2
3
2
2
2
3
-20
-15
-10
-5
0
5
10
15
20
0 50 100 150 200 250 300 350
He
igh
t ab
ove
ro
ad,
ft
Distance behind near wall, ft
20-ft High
0
1
1
0
1
1
2
1
1
2
3
3
1
3
4
4
2
3
4
4
2
4
4
4
-20
-15
-10
-5
0
5
10
15
20
0 50 100 150 200 250 300 350
He
igh
t ab
ove
ro
ad,
ft
Distance behind near wall, ft
8-ft High
1
1
1
4
1
1
2
5
2
2
3
4
2
3
3
4
3
3
4
4
3
4
4
4
-20
-15
-10
-5
0
5
10
15
20
0 50 100 150 200 250 300 350
He
igh
t ab
ove
ro
ad,
ft
Distance behind near wall, ft
12-ft High

Final Technical Report: NCHRP 25-34 – Supplemental Guidance on the Application of FHWA’s TNM
Appendix K Parallel Barriers
K-17
Figure 13 Difference in sound level increases for autos, four far roadways minus one far roadway
in an 8-lane cross-section, in dB.
K.5 Differences in the heights (top elevations) of the two barriers
As the height of one of the two parallel barrier changes, there is a change is the sound level reflection
pattern. Conceptually, as the height of the far wall decreases, the potential for many multiple-reflection
paths decreases, which could then reduce the size of the sound level increase due to reflections.
A test was made where the near wall height was held at 20 ft and the far wall height was varied from 10
to 22 ft for the 8-roadway cross-section for autos only. Figure 14 shows the results. In general, the sound
level increase due to reflections does decrease as the far wall height decreases downward from the same
height as the near wall of 20 ft. The reduction in the sound level increase is greater for the higher
receivers and the greater distances from the near wall because the actual sound level increases for the
equal wall height cases are larger for these receiver positions. However, even for the relatively low far
wall heights, the sound level increases can still be substantial enough to warrant possible mitigation.
1
1
1
1
1
1
1
1
1
1
1
2
1
1
2
2
1
1
2
2
1
2
2
2
-20
-15
-10
-5
0
5
10
15
20
0 50 100 150 200 250 300 350
He
igh
t ab
ove
ro
ad,
ft
Distance behind near wall, ft
16-ft High
1
1
1
1
1
1
1
1
1
1
1
2
1
1
1
2
1
1
2
2
1
1
2
2
-20
-15
-10
-5
0
5
10
15
20
0 50 100 150 200 250 300 350
He
igh
t ab
ove
ro
ad,
ft
Distance behind near wall, ft
20-ft High
1
1
1
0
1
1
1
0
1
1
2
0
2
2
3
0
2
2
2
1
2
1
1
0
-20
-15
-10
-5
0
5
10
15
20
0 50 100 150 200 250 300 350
He
igh
t ab
ove
ro
ad,
ft
Distance behind near wall, ft
8-ft High
1
1
1
1
1
1
1
2
1
1
2
3
1
1
2
3
1
2
2
3
2
2
2
2
-20
-15
-10
-5
0
5
10
15
20
0 50 100 150 200 250 300 350
He
igh
t ab
ove
ro
ad,
ft
Distance behind near wall, ft
12-ft High

Final Technical Report: NCHRP 25-34 – Supplemental Guidance on the Application of FHWA’s TNM
Appendix K Parallel Barriers
K-18
Figure 14 Sound level increases for autos only on the 8-roadway section with near wall height of
20 ft and varying far wall heights, NRC=0.05.
K.6 Internal vertical reflecting surface
The FHWA Traffic Noise Model: Frequently Asked Questions FAQs 1 for parallel barriers cautions about
having an internal vertical reflecting surface in the analyzed parallel barrier cross sectional surface:
“Can TNM model more than 2 parallel barriers?”
“Yes, it can be modeled as a single cross section in the Parallel Barriers module. However, keep in
mind that when a parallel barrier section contains two separate vertical surfaces offset on the same side
of a road (i.e., a retaining wall near the edge-of-pavement and a barrier at the right-of-way), (1) TNM
parallel-barrier accuracy is degraded somewhat for receivers on that same side of the roadway (TNM
may under-compute or over-compute the noise increase), and (2) TNM may under-compute the noise
increase for receivers on the opposite side of the roadway. Please refer to the diagram below:”
1 Traffic Noise Model: Frequently Asked Questions FAQs, FHWA web site at:
http://www.fhwa.dot.gov/environment/noise/traffic_noise_model/tnm_faqs/faq10.cfm#menupara1 /
0
1
2
3
4
5
6
7
8
9
10
10 11 12 13 14 15 16 17 18 19 20 21 22
Sou
nd
leve
l in
cre
ase
, d
B
Far wall barrier height, ft
300 (15)
200 (15)
150 (15)
100 (15)
50 (15)
25 (15)
0
1
2
3
4
5
6
7
8
9
10
10 11 12 13 14 15 16 17 18 19 20 21 22
Sou
nd
leve
l in
cre
ase
, d
B
Far wall barrier height, ft
300 (5)
200 (5)
150 (5)
100 (5)
50 (5)
25 (5)
0
1
2
3
4
5
6
7
8
9
10
10 11 12 13 14 15 16 17 18 19 20 21 22
Sou
nd
leve
l in
cre
ase
, d
B
Far wall barrier height, ft
300 (-5)
200 (-5)
150 (-5)
100 (-5)
50 (-5)
25 (-5)
0
1
2
3
4
5
6
7
8
9
10
10 11 12 13 14 15 16 17 18 19 20 21 22
Sou
nd
leve
l in
cre
ase
, d
B
Far wall barrier height, ft
300 (-15)
200 (-15)
150 (-15)
100 (-15)
50 (-15)
25 (-15)

Final Technical Report: NCHRP 25-34 – Supplemental Guidance on the Application of FHWA’s TNM
Appendix K Parallel Barriers
K-19
The extent of the effect on the results may depend on the source position, the heights of the noise barriers
and the internal vertical surface, the offset of the external wall from the internal vertical surface, and the
receiver position. A test was created to illustrate the problem of the internal surface reflections. As
shown in Figure 15, the cross-section on the left consisted of a 20-ft high near barrier and a 19 ft high far
barrier. The cross-section on the right was the same, except that a 1-ft high noise barrier was added offset
to the left beyond the far wall. The 19-ft high far wall thus went from being an external vertical surface to
an internal vertical surface.
Figure 15 Cross-section with 19-ft high far wall as an external vertical surface (left) and an
internal vertical surface with a 1-ft noise barrier offset 10 ft from the top of the internal vertical
surface(right).
Acoustically, there should be no difference in the calculated sound level increases. The 1-ft noise barrier
offset from the 19-ft vertical section is not in a position to reflect sound back across to diffract over the
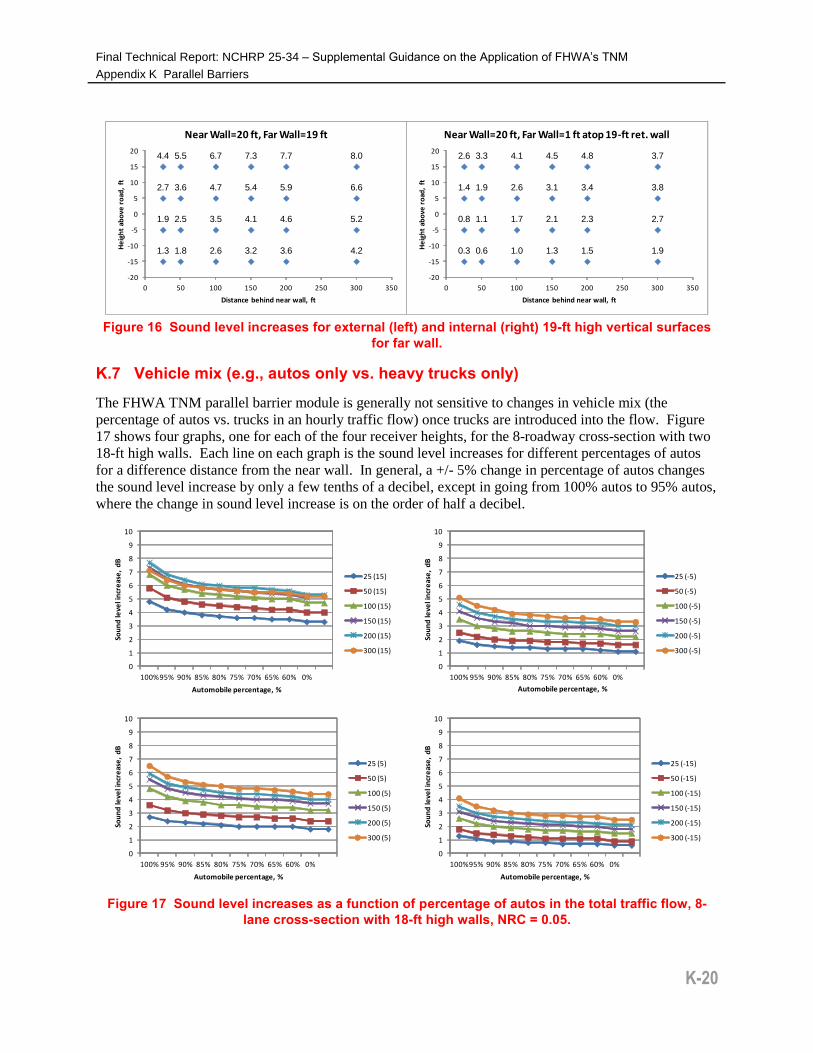
top of the near wall. However, as seen in Figure 16, there are differences, ranging from 1.0 dB in close to
over 4 dB farther back. The results on the left side of the figure are for the 19-ft high far wall, while the
results on the right are for the 19-ft high far wall with the 1-ft high barrier offset behind it.
The 1-ft noise barrier was deleted so that the cross-section ended with a horizontal segment beyond the
top of the 19-ft section. All of the sound level increases became 0 dB. The 1-ft noise barrier was restored
and the 19-ft internal far wall was assigned an NRC of 0.95. Again, all of the sound level increases
became 0 dB, showing that the 1-ft barrier was not a cause of reflections.
Final Technical Report: NCHRP 25-34 – Supplemental Guidance on the Application of FHWA’s TNM
Appendix K Parallel Barriers
K-20
Figure 16 Sound level increases for external (left) and internal (right) 19-ft high vertical surfaces
for far wall.
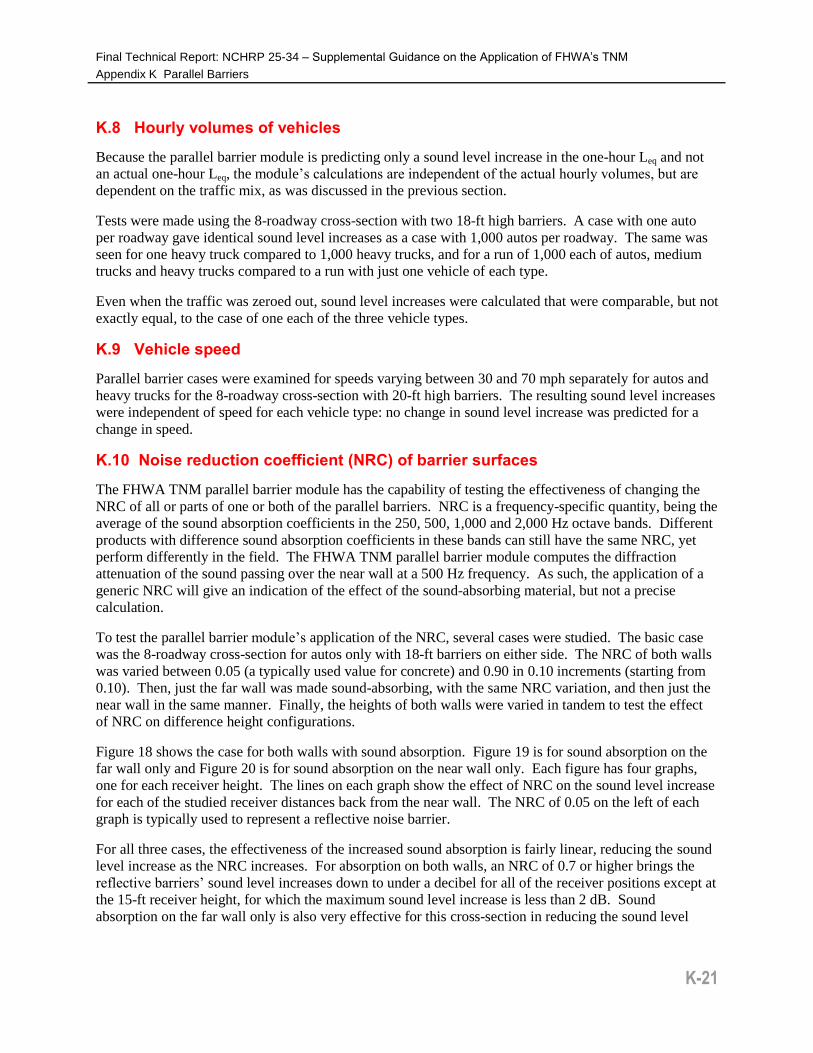
K.7 Vehicle mix (e.g., autos only vs. heavy trucks only)
The FHWA TNM parallel barrier module is generally not sensitive to changes in vehicle mix (the
percentage of autos vs. trucks in an hourly traffic flow) once trucks are introduced into the flow. Figure
17 shows four graphs, one for each of the four receiver heights, for the 8-roadway cross-section with two
18-ft high walls. Each line on each graph is the sound level increases for different percentages of autos
for a difference distance from the near wall. In general, a +/- 5% change in percentage of autos changes
the sound level increase by only a few tenths of a decibel, except in going from 100% autos to 95% autos,
where the change in sound level increase is on the order of half a decibel.
Figure 17 Sound level increases as a function of percentage of autos in the total traffic flow, 8-
lane cross-section with 18-ft high walls, NRC = 0.05.
0.3
0.8
1.4
2.6
0.6
1.1
1.9
3.3
1.0
1.7
2.6
4.1
1.3
2.1
3.1
4.5
1.5
2.3
3.4
4.8
1.9
2.7
3.8
3.7
-20
-15
-10
-5
0
5
10
15
20
0 50 100 150 200 250 300 350
He
igh
t ab
ove
ro
ad,
ft
Distance behind near wall, ft
Near Wall=20 ft, Far Wall=1 ft atop 19-ft ret. wall
1.3
1.9
2.7
4.4
1.8
2.5
3.6
5.5
2.6
3.5
4.7
6.7
3.2
4.1
5.4
7.3
3.6
4.6
5.9
7.7
4.2
5.2
6.6
8.0
-20
-15
-10
-5
0
5
10
15
20
0 50 100 150 200 250 300 350
He
igh
t ab
ove
ro
ad,
ft
Distance behind near wall, ft
Near Wall=20 ft, Far Wall=19 ft
0
1
2
3
4
5
6
7
8
9
10
100%95% 90% 85% 80% 75% 70% 65% 60% 0%
Sou
nd
leve
l in
cre
ase
, d
B
Automobile percentage, %
25 (15)
50 (15)
100 (15)
150 (15)
200 (15)
300 (15)
0
1
2
3
4
5
6
7
8
9
10
100% 95% 90% 85% 80% 75% 70% 65% 60% 0%
Sou
nd
leve
l in
cre
ase
, d
B
Automobile percentage, %
25 (5)
50 (5)
100 (5)
150 (5)
200 (5)
300 (5)
0
1
2
3
4
5
6
7
8
9
10
100% 95% 90% 85% 80% 75% 70% 65% 60% 0%
Sou
nd
leve
l in
cre
ase
, d
B
Automobile percentage, %
25 (-5)
50 (-5)
100 (-5)
150 (-5)
200 (-5)
300 (-5)
0
1
2
3
4
5
6
7
8
9
10
100%95% 90% 85% 80% 75% 70% 65% 60% 0%
Sou
nd
leve
l in
cre
ase
, d
B
Automobile percentage, %
25 (-15)
50 (-15)
100 (-15)
150 (-15)
200 (-15)
300 (-15)
Final Technical Report: NCHRP 25-34 – Supplemental Guidance on the Application of FHWA’s TNM
Appendix K Parallel Barriers
K-21
K.8 Hourly volumes of vehicles
Because the parallel barrier module is predicting only a sound level increase in the one-hour Leq and not
an actual one-hour Leq, the module’s calculations are independent of the actual hourly volumes, but are
dependent on the traffic mix, as was discussed in the previous section.
Tests were made using the 8-roadway cross-section with two 18-ft high barriers. A case with one auto
per roadway gave identical sound level increases as a case with 1,000 autos per roadway. The same was
seen for one heavy truck compared to 1,000 heavy trucks, and for a run of 1,000 each of autos, medium
trucks and heavy trucks compared to a run with just one vehicle of each type.
Even when the traffic was zeroed out, sound level increases were calculated that were comparable, but not
exactly equal, to the case of one each of the three vehicle types.
K.9 Vehicle speed
Parallel barrier cases were examined for speeds varying between 30 and 70 mph separately for autos and
heavy trucks for the 8-roadway cross-section with 20-ft high barriers. The resulting sound level increases
were independent of speed for each vehicle type: no change in sound level increase was predicted for a
change in speed.
K.10 Noise reduction coefficient (NRC) of barrier surfaces
The FHWA TNM parallel barrier module has the capability of testing the effectiveness of changing the
NRC of all or parts of one or both of the parallel barriers. NRC is a frequency-specific quantity, being the
average of the sound absorption coefficients in the 250, 500, 1,000 and 2,000 Hz octave bands. Different
products with difference sound absorption coefficients in these bands can still have the same NRC, yet
perform differently in the field. The FHWA TNM parallel barrier module computes the diffraction
attenuation of the sound passing over the near wall at a 500 Hz frequency. As such, the application of a
generic NRC will give an indication of the effect of the sound-absorbing material, but not a precise
calculation.
To test the parallel barrier module’s application of the NRC, several cases were studied. The basic case
was the 8-roadway cross-section for autos only with 18-ft barriers on either side. The NRC of both walls
was varied between 0.05 (a typically used value for concrete) and 0.90 in 0.10 increments (starting from
0.10). Then, just the far wall was made sound-absorbing, with the same NRC variation, and then just the
near wall in the same manner. Finally, the heights of both walls were varied in tandem to test the effect
of NRC on difference height configurations.
Figure 18 shows the case for both walls with sound absorption. Figure 19 is for sound absorption on the
far wall only and Figure 20 is for sound absorption on the near wall only. Each figure has four graphs,
one for each receiver height. The lines on each graph show the effect of NRC on the sound level increase
for each of the studied receiver distances back from the near wall. The NRC of 0.05 on the left of each
graph is typically used to represent a reflective noise barrier.
For all three cases, the effectiveness of the increased sound absorption is fairly linear, reducing the sound
level increase as the NRC increases. For absorption on both walls, an NRC of 0.7 or higher brings the
reflective barriers’ sound level increases down to under a decibel for all of the receiver positions except at
the 15-ft receiver height, for which the maximum sound level increase is less than 2 dB. Sound
absorption on the far wall only is also very effective for this cross-section in reducing the sound level

Final Technical Report: NCHRP 25-34 – Supplemental Guidance on the Application of FHWA’s TNM
Appendix K Parallel Barriers
K-22
increases. For any given receiver position, the sound level increases with absorption on just the far wall
range from 0 to 1.3 dB higher than for absorption on both walls. In contrast, absorption on just the near
wall is far less effective than absorption on the far wall or both walls. For any given receiver position, the
sound level increases with absorption on just the near wall range up to 3.8 dB higher than absorption on
both walls. The results suggest the importance of the first-order far wall reflections on the total sound
level at a receiver, but also show that the program is calculating multiple reflection paths back and forth
between the barriers because near wall absorption also reduces the sound level over the fully reflective
case.
Figure 18 Sound level increases as a function of NRC on two parallel 18-ft high walls on a 136-ft
wide, 8-roadway cross-section, both walls with sound absorption.
0
1
2
3
4
5
6
7
8
9
10
0.05 0.1 0.2 0.3 0.4 0.5 0.6 0.7 0.8 0.9
Sou
nd
leve
l in
cre
ase
, d
B
NRC of both walls
300 (15)
200 (15)
150 (15)
100 (15)
50 (15)
25 (15)
0
1
2
3
4
5
6
7
8
9
10
0.05 0.1 0.2 0.3 0.4 0.5 0.6 0.7 0.8 0.9
Sou
nd
leve
l in
cre
ase
, d
B
NRC of both walls
300 (5)
200 (5)
150 (5)
100 (5)
50 (5)
25 (5)
0
1
2
3
4
5
6
7
8
9
10
0.05 0.1 0.2 0.3 0.4 0.5 0.6 0.7 0.8 0.9
Sou
nd
leve
l in
cre
ase
, d
B
NRC of both walls
300 (-5)
200 (-5)
150 (-5)
100 (-5)
50 (-5)
25 (-5)
0
1
2
3
4
5
6
7
8
9
10
0.05 0.1 0.2 0.3 0.4 0.5 0.6 0.7 0.8 0.9
Sou
nd
leve
l in
cre
ase
, d
B
NRC of both walls
300 (-15)
200 (-15)
150 (-15)
100 (-15)
50 (-15)
25 (-15)

Final Technical Report: NCHRP 25-34 – Supplemental Guidance on the Application of FHWA’s TNM
Appendix K Parallel Barriers
K-23
Figure 19 Sound level increases as a function of NRC on far wall of two parallel 18-ft high walls
on an 8-roadway cross-section, sound absorption on the far wall only.
0
1
2
3
4
5
6
7
8
9
10
0.05 0.1 0.2 0.3 0.4 0.5 0.6 0.7 0.8 0.9
Sou
nd
leve
l in
cre
ase
, d
B
Far wall NRC
300 (15)
200 (15)
150 (15)
100 (15)
50 (15)
25 (15)
0
1
2
3
4
5
6
7
8
9
10
0.05 0.1 0.2 0.3 0.4 0.5 0.6 0.7 0.8 0.9
Sou
nd
leve
l in
cre
ase
, d
B
Far wall NRC
300 (5)
200 (5)
150 (5)
100 (5)
50 (5)
25 (5)
0
1
2
3
4
5
6
7
8
9
10
0.05 0.1 0.2 0.3 0.4 0.5 0.6 0.7 0.8 0.9
Sou
nd
leve
l in
cre
ase
, d
B
Far wall NRC
300 (-5)
200 (-5)
150 (-5)
100 (-5)
50 (-5)
25 (-5)
0
1
2
3
4
5
6
7
8
9
10
0.05 0.1 0.2 0.3 0.4 0.5 0.6 0.7 0.8 0.9
Sou
nd
leve
l in
cre
ase
, d
B
Far wall NRC
300 (-15)
200 (-15)
150 (-15)
100 (-15)
50 (-15)
25 (-15)

Final Technical Report: NCHRP 25-34 – Supplemental Guidance on the Application of FHWA’s TNM
Appendix K Parallel Barriers
K-24
Figure 20 Sound level increases as a function of NRC on near wall of two parallel 18-ft high walls
on an 8-roadway cross-section, sound absorption on the near wall only.
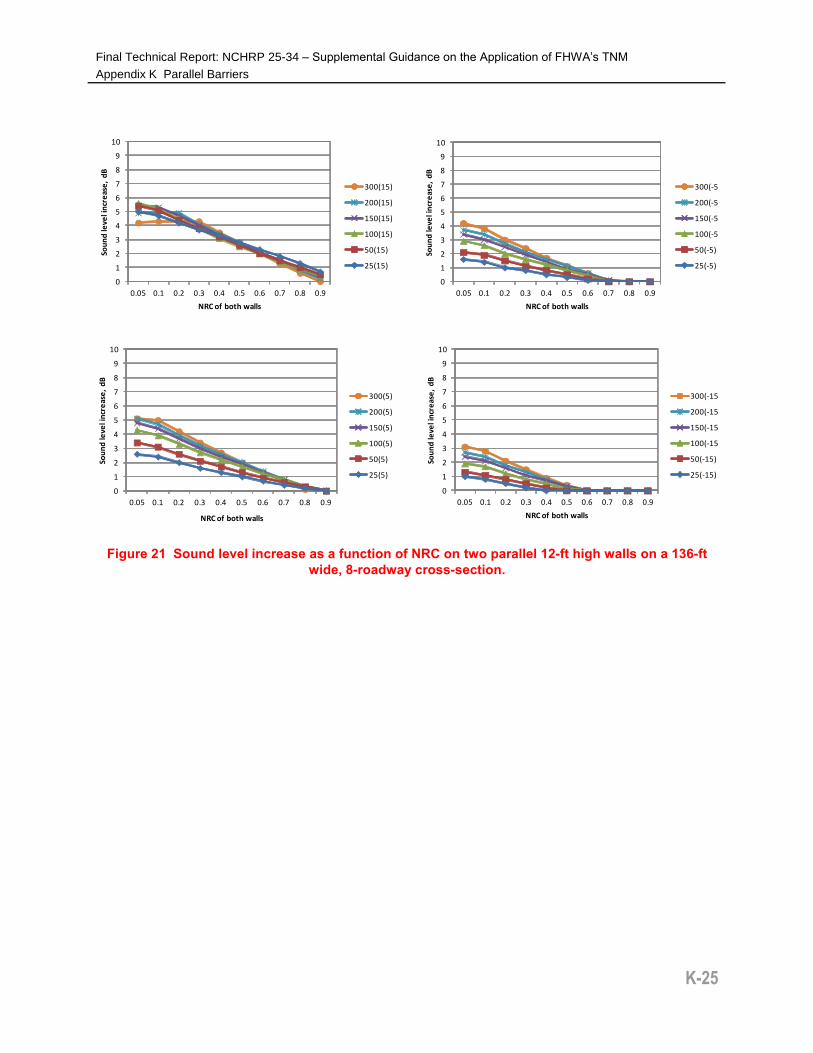
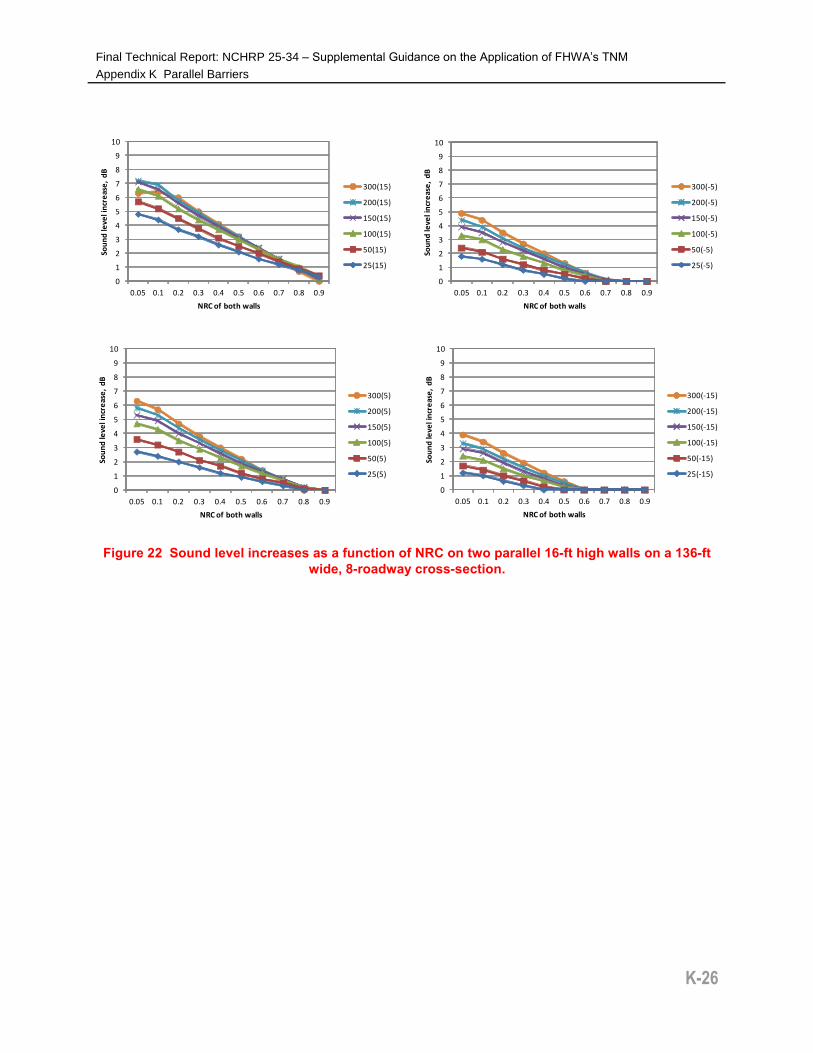
The next four figures provide a picture of how increasing the NRC reduces the sound level increases for
four different pairs of equal-height barriers:
Figure 21: 12-ft
Figure 22: 16-ft
Figure 23: 20-ft
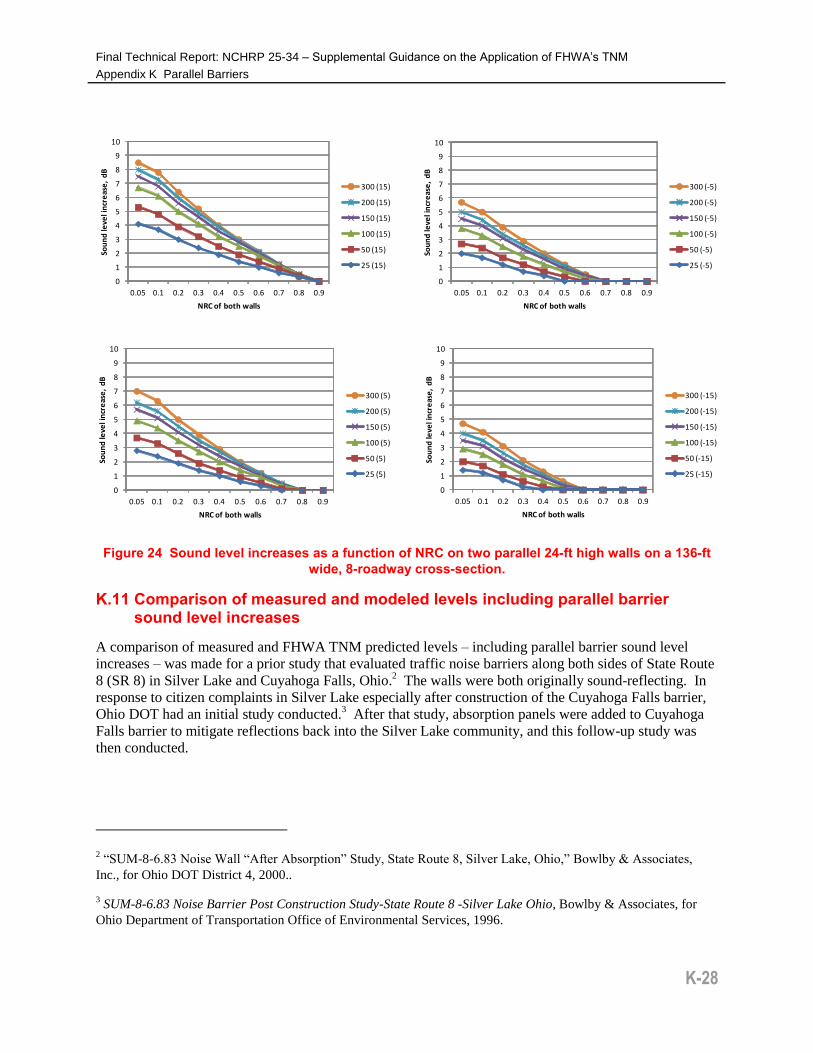
Figure 24: 24-ft
0
1
2
3
4
5
6
7
8
9
10
0.05 0.1 0.2 0.3 0.4 0.5 0.6 0.7 0.8 0.9
Sou
nd
leve
l in
cre
ase
, d
B
Near wall NRC
300 (15)
200 (15)
150 (15)
100 (15)
50 (15)
25 (15)
0
1
2
3
4
5
6
7
8
9
10
0.05 0.1 0.2 0.3 0.4 0.5 0.6 0.7 0.8 0.9
Sou
nd
leve
l in
cre
ase
, d
B
Near wall NRC
300 (5)
200 (5)
150 (5)
100 (5)
50 (5)
25 (5)
0
1
2
3
4
5
6
7
8
9
10
0.05 0.1 0.2 0.3 0.4 0.5 0.6 0.7 0.8 0.9
Sou
nd
leve
l in
cre
ase
, d
B
Near wall NRC
300 (-5)
200 (-5)
150 (-5)
100 (-5)
50 (-5)
25 (-5)
0
1
2
3
4
5
6
7
8
9
10
0.05 0.1 0.2 0.3 0.4 0.5 0.6 0.7 0.8 0.9
Sou
nd
leve
l in
cre
ase
, d
B
Near wall NRC
300 (-15)
200 (-15)
150 (-15)
100 (-15)
50 (-15)
25 (-15)
Final Technical Report: NCHRP 25-34 – Supplemental Guidance on the Application of FHWA’s TNM
Appendix K Parallel Barriers
K-25
Figure 21 Sound level increase as a function of NRC on two parallel 12-ft high walls on a 136-ft
wide, 8-roadway cross-section.
0
1
2
3
4
5
6
7
8
9
10
0.05 0.1 0.2 0.3 0.4 0.5 0.6 0.7 0.8 0.9
Sou
nd
leve
l in
cre
ase
, d
B
NRC of both walls
300(15)
200(15)
150(15)
100(15)
50(15)
25(15)
0
1
2
3
4
5
6
7
8
9
10
0.05 0.1 0.2 0.3 0.4 0.5 0.6 0.7 0.8 0.9
Sou
nd
leve
l in
cre
ase
, d
B
NRC of both walls
300(5)
200(5)
150(5)
100(5)
50(5)
25(5)
0
1
2
3
4
5
6
7
8
9
10
0.05 0.1 0.2 0.3 0.4 0.5 0.6 0.7 0.8 0.9
Sou
nd
leve
l in
cre
ase
, d
B
NRC of both walls
300(-5)
200(-5)
150(-5)
100(-5)
50(-5)
25(-5)
0
1
2
3
4
5
6
7
8
9
10
0.05 0.1 0.2 0.3 0.4 0.5 0.6 0.7 0.8 0.9
Sou
nd
leve
l in
cre
ase
, d
B
NRC of both walls
300(-15)
200(-15)
150(-15)
100(-15)
50(-15)
25(-15)
Final Technical Report: NCHRP 25-34 – Supplemental Guidance on the Application of FHWA’s TNM
Appendix K Parallel Barriers
K-26
Figure 22 Sound level increases as a function of NRC on two parallel 16-ft high walls on a 136-ft
wide, 8-roadway cross-section.
0
1
2
3
4
5
6
7
8
9
10
0.05 0.1 0.2 0.3 0.4 0.5 0.6 0.7 0.8 0.9
Sou
nd
leve
l in
cre
ase
, d
B
NRC of both walls
300(15)
200(15)
150(15)
100(15)
50(15)
25(15)
0
1
2
3
4
5
6
7
8
9
10
0.05 0.1 0.2 0.3 0.4 0.5 0.6 0.7 0.8 0.9
Sou
nd
leve
l in
cre
ase
, d
B
NRC of both walls
300(5)
200(5)
150(5)
100(5)
50(5)
25(5)
0
1
2
3
4
5
6
7
8
9
10
0.05 0.1 0.2 0.3 0.4 0.5 0.6 0.7 0.8 0.9
Sou
nd
leve
l in
cre
ase
, d
B
NRC of both walls
300(-5)
200(-5)
150(-5)
100(-5)
50(-5)
25(-5)
0
1
2
3
4
5
6
7
8
9
10
0.05 0.1 0.2 0.3 0.4 0.5 0.6 0.7 0.8 0.9
Sou
nd
leve
l in
cre
ase
, d
B
NRC of both walls
300(-15)
200(-15)
150(-15)
100(-15)
50(-15)
25(-15)

Final Technical Report: NCHRP 25-34 – Supplemental Guidance on the Application of FHWA’s TNM
Appendix K Parallel Barriers
K-27
Figure 23 Sound level increases as a function of NRC on two parallel 20-ft high walls on a 136-ft
wide, 8-roadway cross-section.
0
1
2
3
4
5
6
7
8
9
10
0.05 0.1 0.2 0.3 0.4 0.5 0.6 0.7 0.8 0.9
Sou
nd
leve
l in
cre
ase
, d
B
NRC of both walls
300 (15)
200 (15)
150 (15)
100 (15)
50 (15)
25 (15)
0
1
2
3
4
5
6
7
8
9
10
0.05 0.1 0.2 0.3 0.4 0.5 0.6 0.7 0.8 0.9
Sou
nd
leve
l in
cre
ase
, d
B
NRC of both walls
300 (5)
200 (5)
150 (5)
100 (5)
50 (5)
25 (5)
0
1
2
3
4
5
6
7
8
9
10
0.05 0.1 0.2 0.3 0.4 0.5 0.6 0.7 0.8 0.9
Sou
nd
leve
l in
cre
ase
, d
B
NRC of both walls
300 (-5)
200 (-5)
150 (-5)
100 (-5)
50 (-5)
25 (-5)
0
1
2
3
4
5
6
7
8
9
10
0.05 0.1 0.2 0.3 0.4 0.5 0.6 0.7 0.8 0.9
Sou
nd
leve
l in
cre
ase
, d
B
NRC of both walls
300 (-15)
200 (-15)
150 (-15)
100 (-15)
50 (-15)
25 (-15)
Final Technical Report: NCHRP 25-34 – Supplemental Guidance on the Application of FHWA’s TNM
Appendix K Parallel Barriers
K-28
Figure 24 Sound level increases as a function of NRC on two parallel 24-ft high walls on a 136-ft
wide, 8-roadway cross-section.
K.11 Comparison of measured and modeled levels including parallel barrier sound level increases
A comparison of measured and FHWA TNM predicted levels – including parallel barrier sound level
increases – was made for a prior study that evaluated traffic noise barriers along both sides of State Route
8 (SR 8) in Silver Lake and Cuyahoga Falls, Ohio.2 The walls were both originally sound-reflecting. In
response to citizen complaints in Silver Lake especially after construction of the Cuyahoga Falls barrier,
Ohio DOT had an initial study conducted.3 After that study, absorption panels were added to Cuyahoga
Falls barrier to mitigate reflections back into the Silver Lake community, and this follow-up study was
then conducted.
2 “SUM-8-6.83 Noise Wall “After Absorption” Study, State Route 8, Silver Lake, Ohio,” Bowlby & Associates,
Inc., for Ohio DOT District 4, 2000..
3 SUM-8-6.83 Noise Barrier Post Construction Study-State Route 8 -Silver Lake Ohio, Bowlby & Associates, for
Ohio Department of Transportation Office of Environmental Services, 1996.
0
1
2
3
4
5
6
7
8
9
10
0.05 0.1 0.2 0.3 0.4 0.5 0.6 0.7 0.8 0.9
Sou
nd
leve
l in
cre
ase
, d
B
NRC of both walls
300 (15)
200 (15)
150 (15)
100 (15)
50 (15)
25 (15)
0
1
2
3
4
5
6
7
8
9
10
0.05 0.1 0.2 0.3 0.4 0.5 0.6 0.7 0.8 0.9
Sou
nd
leve
l in
cre
ase
, d
B
NRC of both walls
300 (5)
200 (5)
150 (5)
100 (5)
50 (5)
25 (5)
0
1
2
3
4
5
6
7
8
9
10
0.05 0.1 0.2 0.3 0.4 0.5 0.6 0.7 0.8 0.9
Sou
nd
leve
l in
cre
ase
, d
B
NRC of both walls
300 (-5)
200 (-5)
150 (-5)
100 (-5)
50 (-5)
25 (-5)
0
1
2
3
4
5
6
7
8
9
10
0.05 0.1 0.2 0.3 0.4 0.5 0.6 0.7 0.8 0.9
Sou
nd
leve
l in
cre
ase
, d
B
NRC of both walls
300 (-15)
200 (-15)
150 (-15)
100 (-15)
50 (-15)
25 (-15)
Final Technical Report: NCHRP 25-34 – Supplemental Guidance on the Application of FHWA’s TNM
Appendix K Parallel Barriers
K-29
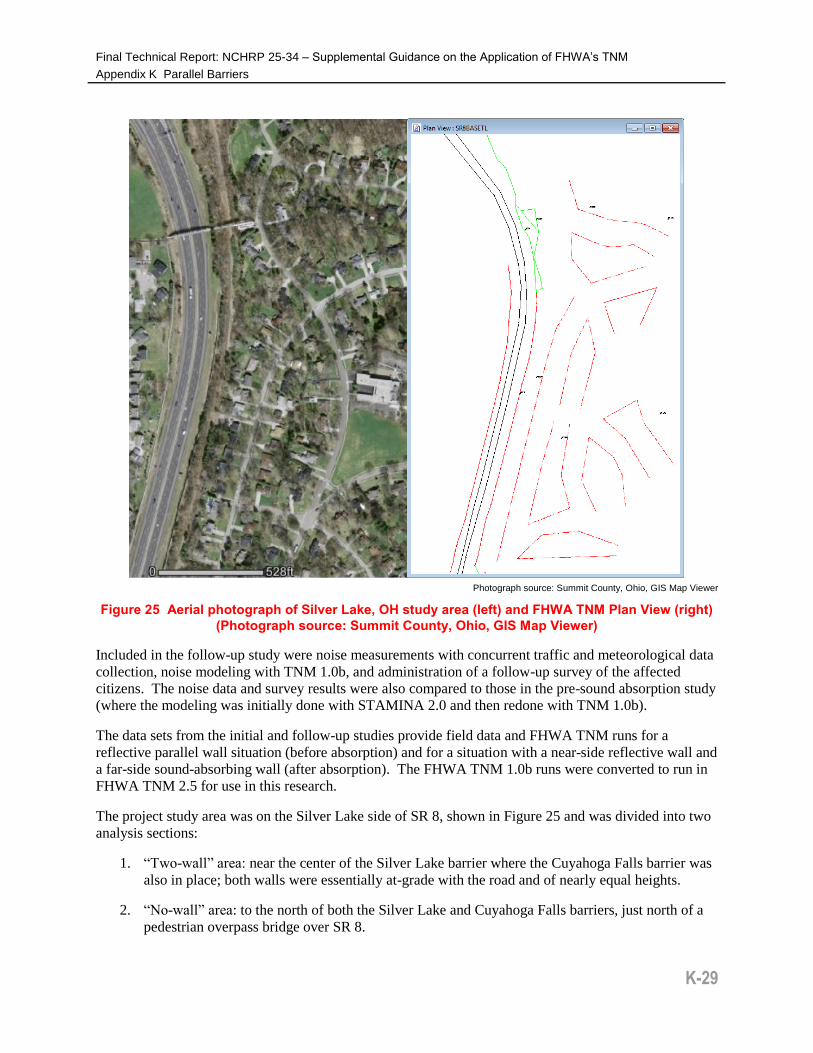
Photograph source: Summit County, Ohio, GIS Map Viewer
Figure 25 Aerial photograph of Silver Lake, OH study area (left) and FHWA TNM Plan View (right)
(Photograph source: Summit County, Ohio, GIS Map Viewer)
Included in the follow-up study were noise measurements with concurrent traffic and meteorological data
collection, noise modeling with TNM 1.0b, and administration of a follow-up survey of the affected
citizens. The noise data and survey results were also compared to those in the pre-sound absorption study
(where the modeling was initially done with STAMINA 2.0 and then redone with TNM 1.0b).
The data sets from the initial and follow-up studies provide field data and FHWA TNM runs for a
reflective parallel wall situation (before absorption) and for a situation with a near-side reflective wall and
a far-side sound-absorbing wall (after absorption). The FHWA TNM 1.0b runs were converted to run in
FHWA TNM 2.5 for use in this research.
The project study area was on the Silver Lake side of SR 8, shown in Figure 25 and was divided into two
analysis sections:
1. “Two-wall” area: near the center of the Silver Lake barrier where the Cuyahoga Falls barrier was
also in place; both walls were essentially at-grade with the road and of nearly equal heights.
2. “No-wall” area: to the north of both the Silver Lake and Cuyahoga Falls barriers, just north of a
pedestrian overpass bridge over SR 8.
Final Technical Report: NCHRP 25-34 – Supplemental Guidance on the Application of FHWA’s TNM
Appendix K Parallel Barriers
K-30
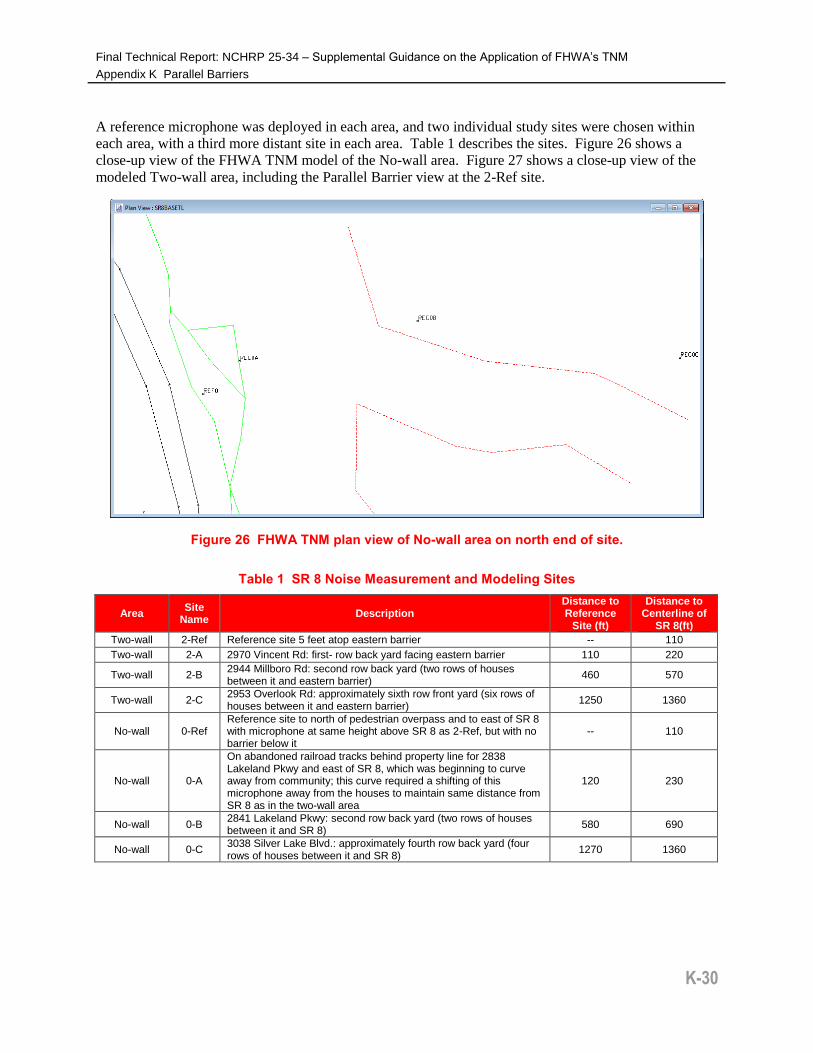
A reference microphone was deployed in each area, and two individual study sites were chosen within
each area, with a third more distant site in each area. Table 1 describes the sites. Figure 26 shows a
close-up view of the FHWA TNM model of the No-wall area. Figure 27 shows a close-up view of the
modeled Two-wall area, including the Parallel Barrier view at the 2-Ref site.
Figure 26 FHWA TNM plan view of No-wall area on north end of site.
Table 1 SR 8 Noise Measurement and Modeling Sites
Area Site
Name Description
Distance to Reference
Site (ft)
Distance to Centerline of
SR 8(ft)
Two-wall 2-Ref Reference site 5 feet atop eastern barrier -- 110
Two-wall 2-A 2970 Vincent Rd: first- row back yard facing eastern barrier 110 220
Two-wall 2-B 2944 Millboro Rd: second row back yard (two rows of houses between it and eastern barrier)
460 570
Two-wall 2-C 2953 Overlook Rd: approximately sixth row front yard (six rows of houses between it and eastern barrier)
1250 1360
No-wall 0-Ref Reference site to north of pedestrian overpass and to east of SR 8 with microphone at same height above SR 8 as 2-Ref, but with no barrier below it
-- 110
No-wall 0-A
On abandoned railroad tracks behind property line for 2838 Lakeland Pkwy and east of SR 8, which was beginning to curve away from community; this curve required a shifting of this microphone away from the houses to maintain same distance from SR 8 as in the two-wall area
120 230
No-wall 0-B 2841 Lakeland Pkwy: second row back yard (two rows of houses between it and SR 8)
580 690
No-wall 0-C 3038 Silver Lake Blvd.: approximately fourth row back yard (four rows of houses between it and SR 8)
1270 1360

Final Technical Report: NCHRP 25-34 – Supplemental Guidance on the Application of FHWA’s TNM
Appendix K Parallel Barriers
K-31
Figure 27 FHWA TNM plan view of Two-wall area in center of project (top) and Parallel Barrier
view at the 2-Ref microphone (bottom).
The results for the initial measurements, taken in June 1996 with both walls reflective, are shown in Table
2 and Table 3 The upper portion of Table 2 shows the measured 10-min Leq at each site during the
different periods. Only subsets of the sites were sampled in each period. The second portion of the table
has the FHWA TNM 2.5 predicted hourly Leq based on factored-up traffic counts during the
measurements. No adjustments for the reflections have been made. The third part of the table compares
the measured and predicted levels. In the No-wall area, the model is predicting well at 0-Ref and 0-B.
However, at 0-A, the TNM overprediction was 5.4 and 7.0 dB. In the original study in 1996, the FHWA
STAMINA 2.0 program overpredicted by 6.1 dB. When the predictions were redone with FHWA TNM
1.0b, the overpredictions were still large. The reasons for all three models’ overprediction are not clear.
At 2-A, TNM underpredicted by 1.1 to 1.9 dB. If the predicted level is adjusted by the “predicted minus
measured” differences at 2-Ref would reduce the underpredictions to 0.6 dB or less. FHQWA TNM is
slightly overpredicting at 2-B and underpredicting at 2-C, even after adjustment for the predicted-
measured reference site differences.
The Two-wall models were then studied with the FHWA TNM parallel barrier module. The computed
parallel barrier sound level increases were: 0.3 dB at 2-Ref; 2.6 dB at 2-A; 3.4 dB at 2-B; and 0 dB at 2-C.
The top portion of Table 3 shows the adjusted FHWA TNM predictions, computed by adding the
calculated sound level increase to the predicted levels in the previous table. The lower portion of Table 3
shows the difference in the adjusted predicted level and the measured level at each receiver. The 2-Ref
predictions are all now slightly closer to the measured levels, still underpredicting by 0.1 to 1.8 dB. The
predicted levels at 2-A are now higher the measured levels by 0.7 to 1.5 dB, whereas they were lower
before adding in the calculated sound level increase. Site 2-B now overpredicts the measured level by 4.1
dB, and site 2-C still has the same 3.1 dB underprediction. If the data is normalized by the 2-Ref
predicted-measured difference, the agreement grows worse at 2-A and 2-B and improves 0.8 dB at 2-C.

Final Technical Report: NCHRP 25-34 – Supplemental Guidance on the Application of FHWA’s TNM
Appendix K Parallel Barriers
K-32
In the pre-absorption study, the inclusion of the parallel barrier sound level increase did not improve the
model’s results at sites 2-A and 2-B.
Table 2 SR 8 Measured and Unadjusted Predicted Leq, Both Walls Reflective, dBA
Site: 0-Ref 0-A 0-B 0-C 2-Ref 2-A 2-B 2-C
Period Measured 10-minute Leq at Each Receiver, dBA
1 75 61.5 53
2 78.1 60.8
3 76 61 77 60
4 74 76
5 78 49
6 77.5 51.5
7 78 61
Period Predicted 10-minute Leq at Each Receiver, dBA
1 75.5 66.9 51.8
2 76.1 59.4
3 75.9 68 75.6 58.9
4 75.9 75.6
5 76.9 45.9
6 76.8 52.2
7 75.9 59.1
Period Predicted Leq Minus Measured Leq at Each Receiver, dBA
1 0.5 5.4 -1.2
2 -2.0 -1.4
3 -0.1 7.0 -1.4 -1.1
4 1.9 -0.4
5 -1.1 -3.1
6 -0.7 0.7
7 -2.1 -1.9
Table 3 SR 8 Predicted Leq, Adjusted for Sound Level Increase, Both Walls Reflective, dBA
Site: 0-Ref 0-A 0-B 0-C 2-Ref 2-A 2-B 2-C
Period Adjusted* Predicted 10-minute Leq at Each Receiver, dBA
1 No adj. No adj. No adj.
2 76.4 62.0
3 No adj. No adj. 75.9 61.5
4 No adj. 75.9
5 77.2 45.9
6 77.1 55.6
7 76.2 61.7
Period Adjusted* Predicted Leq Minus Measured Leq at Each Receiver, dBA
1 No adj. No adj. No adj.
2 -1.7 1.2
3 No adj. No adj. -1.1 1.5
4 No adj. -0.1
5 -0.8 -3.1
6 -0.4 4.1
7 -1.8 0.7
* Adjustment is the TNM 2.5 parallel barrier sound level increase in dB: 2-Ref =0.3; 2-A = 3.4; 2-B= 3.4; 2-C=0

Final Technical Report: NCHRP 25-34 – Supplemental Guidance on the Application of FHWA’s TNM
Appendix K Parallel Barriers
K-33
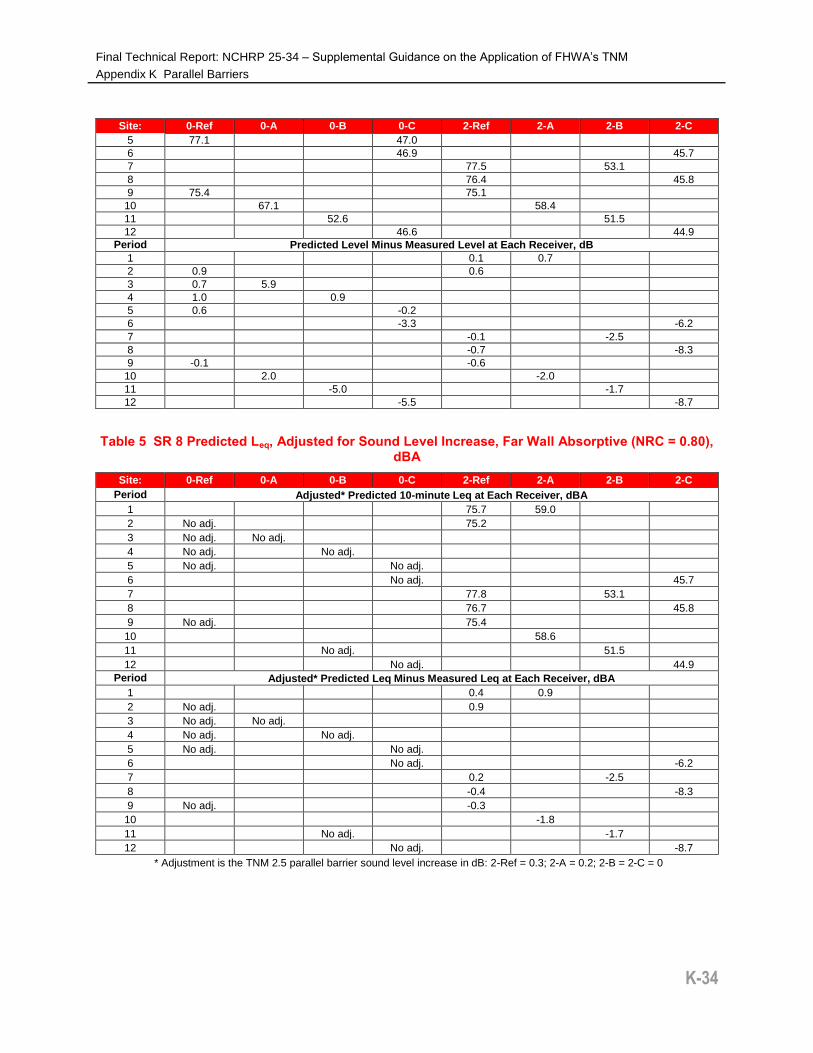
The results for the follow-up measurements and modeling, done in October 1999, with the far wall sound-
absorbing with an NRC as 0.80, are shown in Table 4 and Table 5. The upper portion of Table 4 shows
the measured 10-min Leq at each site during the different periods. The second portion of the table has the
FHWA TNM 2.5 predicted hourly Leq based on factored-up traffic counts during the measurements. No
adjustments for the reflections have been made. The third part of the table compares the measured and
predicted levels. In the No-wall area, the model is predicting within -0.1 to +1.0 dB of the measured
levels at 0-Ref. However, at 0-A, 0-B and 0-C the results are mixed. The measured levels varied
substantially between periods at each site, resulting in both good and poor agreement with the modeling.
The reasons for the variation in the measured levels were not clear.
In the Two-wall area, the model is predicting within -0.7 to +0.6 dB of the measured levels at 2-Ref.
At 2-A, FHWA TNM underpredicted by 2.0 dB and overpredicted by 0.7 dB in the two periods. At 2-B,
the model underpredicted by 2.7 and 1.7 dB in the two periods. At 2-C, the model greatly underpredicted
the levels.
The Two-wall models were then studied with the FHWA TNM parallel barrier module using an NRC of
0.80 on the far wall. The computed parallel barrier sound level increase at 2-Ref was 0.3 dB, the same as
for the “both walls reflective” case. One would have expected this value to decrease. At 2-A, the sound
level increase decreased from 2.6 dB to 0.2 dB; at 2-B, it decreased from 3.4 dB to 0 dB; and at 2-C, it
remained at 0 dB. The top portion of Table 5 shows the adjusted FHWA TNM predictions, computed by
adding the calculated sound level increase to the predicted levels in the previous table. The lower portion
of Table 5 shows the difference in the adjusted predicted level and the measured level at each receiver.
The changes from the unadjusted levels are slight because the sound level increases were small or zero.
Overall, the results of the comparisons of the measured and modeled levels in the reflective and far-wall
absorptive cases were mixed. Agreement was good at the reference microphone sites for both the No-
wall and Two-wall sites in each case, and at 2-A, the closest site behind the near wall. At the other study
sites, agreement ranged from mixed at 0-B to poor at 0-A and 2-C. One issue was with the range in the
measured sound levels at the sites, especially in the far-wall absorptive case. Site 2-C was deep into the
community, and while care was taken regarding localized noise sources and meteorological effects on
sound propagation, these factors could not be ruled out as possible causes of the sound level differences.
Table 4 SR 8 Measured and Unadjusted Predicted Leq, Far Wall Absorptive (NRC = 0.80), dBA
Site: 0-Ref 0-A 0-B 0-C 2-Ref 2-A 2-B 2-C
Period Measured 10-minute Average Sound Level at Each Receiver, dB
1 75.3 58.1
2 74.3 74.3
3 76.0 62.8
4 75.6 52.0
5 76.5 47.2
6 50.2 51.9
7 77.6 55.6
8 77.1 54.1
9 75.5 75.7
10 65.1 60.4
11 57.6 53.2
12 52.1 53.6
Period Corresponding TNM Predicted Leq at Each Receiver, dB
1 75.4 58.8
2 75.2 74.9
3 76.7 68.7
4 76.6 52.9
Final Technical Report: NCHRP 25-34 – Supplemental Guidance on the Application of FHWA’s TNM
Appendix K Parallel Barriers
K-34
Site: 0-Ref 0-A 0-B 0-C 2-Ref 2-A 2-B 2-C
5 77.1 47.0
6 46.9 45.7
7 77.5 53.1
8 76.4 45.8
9 75.4 75.1
10 67.1 58.4
11 52.6 51.5
12 46.6 44.9
Period Predicted Level Minus Measured Level at Each Receiver, dB
1 0.1 0.7
2 0.9 0.6
3 0.7 5.9
4 1.0 0.9
5 0.6 -0.2
6 -3.3 -6.2
7 -0.1 -2.5
8 -0.7 -8.3
9 -0.1 -0.6
10 2.0 -2.0
11 -5.0 -1.7
12 -5.5 -8.7
Table 5 SR 8 Predicted Leq, Adjusted for Sound Level Increase, Far Wall Absorptive (NRC = 0.80), dBA
Site: 0-Ref 0-A 0-B 0-C 2-Ref 2-A 2-B 2-C
Period Adjusted* Predicted 10-minute Leq at Each Receiver, dBA
1 75.7 59.0
2 No adj. 75.2
3 No adj. No adj.
4 No adj. No adj.
5 No adj. No adj.
6 No adj. 45.7
7 77.8 53.1
8 76.7 45.8
9 No adj. 75.4
10 58.6
11 No adj. 51.5
12 No adj. 44.9
Period Adjusted* Predicted Leq Minus Measured Leq at Each Receiver, dBA
1 0.4 0.9
2 No adj. 0.9
3 No adj. No adj.
4 No adj. No adj.
5 No adj. No adj.
6 No adj. -6.2
7 0.2 -2.5
8 -0.4 -8.3
9 No adj. -0.3
10 -1.8
11 No adj. -1.7
12 No adj. -8.7
* Adjustment is the TNM 2.5 parallel barrier sound level increase in dB: 2-Ref = 0.3; 2-A = 0.2; 2-B = 2-C = 0