Embed Size (px)
Citation preview
THROUGH LANGUAGE TO LITERACY
A Report on the Literacy Gains of Low-level and Pre-literate
Adult ESOL Learners in Literacy Classes
A Collaborative Project
National Association of ESOL Home Tutor Schemes Inc School of English and Applied Linguistics UNITEC Institute of Technology
Centre for Refugee Education Auckland University of Technology

2
THROUGH LANGUAGE
TO LITERACY
A Report on the Literacy Gains of Low-level and Pre-literate
Adult ESOL Learners in Literacy Classes
Nikhat Shameem UNITEC Institute of Technology Keryn McDermott Auckland University of Technology Jeannie Martin Blaker UNITEC Institute of Technology
ESOL Home Tutor Service Jenny Carryer UNITEC Institute of Technology
March 2002

3
TABLE OF CONTENTS
TABLE OF CONTENTS __________________________________________________ 3
LIST OF TABLES________________________________________________________ 7
LIST OF FIGURES_______________________________________________________ 8
LIST OF APPENDICES ___________________________________________________ 9
Abstract _______________________________________________________________ 11
Abbreviations used in this report___________________________________________ 13
BACKGROUND TO A STUDY OF LOW-LEVEL AND PRE-LITERATE LEARNERS ____________________________________________________________ 15
Introduction __________________________________________________________ 15
Literacy______________________________________________________________ 16 Defining literacy _____________________________________________________ 16 Literacy and ESOL ___________________________________________________ 18 Low-level, ESOL literacy ______________________________________________ 19 Low-level, ESOL, language and literacy learners____________________________ 19
Research methodologies ________________________________________________ 22 Cross-cultural research ________________________________________________ 22 Case studies _________________________________________________________ 23 Interviews __________________________________________________________ 24 Observations ________________________________________________________ 25
Assessment and evaluation ______________________________________________ 25 Assessment procedures and tools ________________________________________ 27
Competency-based assessment ________________________________________ 27 Self-assessment in language learning ___________________________________ 28
Self-assessment measures __________________________________________ 29 Performance assessment _____________________________________________ 30
Reliability and validity in performance assessment. ______________________ 31
Factors affecting literacy gains___________________________________________ 34
Literacy in Aotearoa/New Zealand _______________________________________ 36
Summary: Literature review ____________________________________________ 36
BACKGROUND TO THE PROJECT ______________________________________ 38
Introduction __________________________________________________________ 39
Background and rationale of programme __________________________________ 39
Refugees in West and Central Auckland___________________________________ 40
Language learning issues _______________________________________________ 41
Bilingual tutor training project __________________________________________ 42
The current situation in Auckland________________________________________ 44

4
METHODOLOGY ______________________________________________________ 47
Introduction __________________________________________________________ 47
Research questions ____________________________________________________ 48 Part A: Personal profiles _____________________________________________ 48
Tutors____________________________________________________________ 48 Students __________________________________________________________ 48
Part B: Self-assessment ______________________________________________ 49 Part C: Performance testing___________________________________________ 49
Hypotheses ___________________________________________________________ 50
Time span of project ___________________________________________________ 50
Research participants __________________________________________________ 51
Research participants: Case studies ______________________________________ 53
Research methods _____________________________________________________ 54 Personal profiles: Tutors (See Appendix 2) ________________________________ 54 Personal profiles: Students (See Appendix 3)_______________________________ 54 Self-assessment (See Appendix 4) _______________________________________ 55 Performance assessment (See Appendix 14)________________________________ 58 Case studies (See Appendix 11) _________________________________________ 59
Test trial _____________________________________________________________ 61 Trial of personal profiles and self-assessment_______________________________ 61
Changes made _____________________________________________________ 61 Trial of performance assessments ________________________________________ 61
Changes made _____________________________________________________ 61
Ethics concerns _______________________________________________________ 62 Information sheets (See Appendix 12) ____________________________________ 63 Consent forms (See Appendix 13) _______________________________________ 63
Issues arising that imposed limitations on the project________________________ 64 Continuity of students _________________________________________________ 64 Availability of bilingual tutors __________________________________________ 64 Time of day constraints ________________________________________________ 64 Ramadhan __________________________________________________________ 64 Cultural and social resistance to self-assessment and testing ___________________ 65
Data coding and analysis________________________________________________ 65
Summary: Methodology ________________________________________________ 66
RESULTS ______________________________________________________________ 70
TUTOR AND STUDENT PROFILES ______________________________________ 70
Introduction __________________________________________________________ 70
Section One: Tutor Profiles: Background__________________________________ 70

5
Language use and proficiency ___________________________________________ 72
Educational background________________________________________________ 77
Issues arising from teaching current literacy classes_________________________ 79
Summary: Tutor profiles _______________________________________________ 81
Section Two: Student profiles: Background________________________________ 83
Countries of origin and gender __________________________________________ 83
Age, age at arrival and length of residence _________________________________ 84
Change in socio-economic status _________________________________________ 86
Educational background________________________________________________ 88
Language use in NZ____________________________________________________ 90
Mother tongue and first language ________________________________________ 90
Home language use ____________________________________________________ 91
English study in NZ____________________________________________________ 94
Bilingual instruction ___________________________________________________ 94
Participant perception of host community attitude towards their mother tongue _ 95
Reasons for learning English in NZ_______________________________________ 95
Language proficiency __________________________________________________ 96 English Proficiency ___________________________________________________ 97 Variables affecting English literacy skills __________________________________ 97
Summary: Student profiles_____________________________________________ 101
REPORTED LITERACY________________________________________________ 104
Introduction _________________________________________________________ 104
Total sample self-assessments: Reading __________________________________ 104
Total sample self-assessments: Writing ___________________________________ 106
Student perceptions of literacy gains: Reading ____________________________ 107
Student perceptions of literacy gains: Writing _____________________________ 109
Student perceptions of literacy gains: Bilingual and English-speaking tutors ___ 110
Student perceptions of literacy gains: 2-hour and 12-hour weekly classes ______ 112
Summary: Student perceptions of literacy gains ___________________________ 115
ASSESSED LITERACY GAINS AND COMPARISON WITH SELF-ASSESSED LITERACY ___________________________________________________________ 118
Introduction _________________________________________________________ 118
Total sample test results: Reading _______________________________________ 118
Total sample test results: Writing _______________________________________ 120

6
Literacy gains: Reading _______________________________________________ 121
Literacy gains: Writing ________________________________________________ 122
Literacy gains: Bilingual and English-speaking tutors ______________________ 123
Literacy gains: 2-hour and 12-hour weekly classes _________________________ 126
A comparison – reported and assessed literacy ____________________________ 128
Summary: Assessed and reported literacy gains ___________________________ 131
CASE STUDIES _______________________________________________________ 133
Introduction _________________________________________________________ 133
Specific case studies: Research findings __________________________________ 135 Student interviews___________________________________________________ 135 Tutor interviews_____________________________________________________ 140
Classroom observations _______________________________________________ 144
Summary: Case studies________________________________________________ 146
DISCUSSION AND RECOMMENDATIONS_______________________________ 150
Recommendations derived from this report ______________________________ 153
General recommendations _____________________________________________ 155
Recommendations for further research __________________________________ 155
Conclusions _________________________________________________________ 156
REFERENCES ________________________________________________________ 158
APPENDICES _________________________________________________________ 168

7
LIST OF TABLES Table 1 Refugees in Central and West Auckland ___________________________40 Table 2 Profile of literacy students participating in project____________________45 Table 3 Research participants __________________________________________52 Table 4 English ability: Reading scale ___________________________________56 Table 5 English ability: Writing scale ____________________________________57 Table 6 Tutor profiles ________________________________________________71 Table 7 Tutor age and length of residence in NZ ___________________________73 Table 8 Home language use____________________________________________73 Table 9 Language proficiency in languages known by tutors on literacy project ___75 Table 10 Language proficiency __________________________________________76 Table 11 Educational level of tutors ______________________________________78 Table 12 Qualifications of tutors _________________________________________78 Table 13 Teaching experience of tutors on literacy project_____________________79 Table 14 Tutor issues in current literacy classes _____________________________80 Table 15 Countries of origin of research participants _________________________84 Table 16 Age of research participants _____________________________________84 Table 17 Age at time of arrival __________________________________________85 Table 18 Length of residence in NZ of participants __________________________85 Table 19 Duration of schooling in home country ____________________________89 Table 20 Duration of English study in home country _________________________90 Table 21 Mother tongues and first language identified by participants ___________91 Table 22 Home language use by key variables ______________________________92 Table 23 Gender and home language use __________________________________92 Table 24 Country of origin and home language _____________________________93 Table 25 Mother tongue and home language use ____________________________94 Table 26 English literacy and key variables ________________________________98 Table 27 Differences in first language and English literacy ____________________99 Table 28 Self-assessed proficiency: Reading _______________________________105 Table 29 Self-assessed proficiency: Writing ________________________________107 Table 30 Self-assessed reading ability: Time 1 and 3 _________________________108 Table 31 Self-assessed writing ability: Time 1 and 3 _________________________109 Table 32 Student perception of literacy gains: Bilingual and English-speaking tutors 111 Table 33 Student perception of literacy gains: 2-hour and 12-hour weekly classes __114 Table 34 Performance assessment: Reading ________________________________119 Table 35 Performance assessment: Writing_________________________________121 Table 36 Performance assessments 1 and 2: Reading _________________________122 Table 37 Performance assessments 1 and 2: Writing _________________________123 Table 38 Literacy gains in performance tests: Bilingual and English-speaking tutors 124 Table 39 Literacy gains in performance tests: 2-hour and 12-hour weekly classes __126 Table 40 Reported and assessed literacy: Pre- and post-programme _____________130
8
LIST OF FIGURES Figure 1 Timetable for research 2001 – 2002 _______________________________51 Figure 2 Classes established during research project _________________________52 Figure 3 Mean proficiency levels for tutor languages ________________________76 Figure 4 Tutor English proficiency_______________________________________77 Figure 5 Change in socio-economic status _________________________________87 Figure 6 Reasons for learning English in NZ _______________________________96 Figure 7 Student English proficiency (four skills) ___________________________97 Figure 8 Student English and first language proficiency ______________________99 Figure 9 Student first language proficiency ________________________________100 Figure 10 Student perception of literacy gains: Bilingual and English-speaking tutors 112 Figure 11 Student perception of literacy gains: 2-hour and 12-hour weekly classes __113 Figure 12 Student performance gains: Bilingual and English-speaking tutors_______125 Figure 13 Student performance gains: 2-hour and 12- hour clasess _______________127

9
LIST OF APPENDICES
Appendix 1 Course Document _____________________________________________168 Appendix 2 Personal Information Profile for Literacy Tutors _____________________170 Appendix 3 Personal Information Profile for Students __________________________173 Appendix 4 Self-assessment Schedule _______________________________________173 Appendix 5 Literacy Curriculum ___________________________________________178 Appendix 6 Test Specifications ____________________________________________180 Appendix 7 English Literacy Test Descriptors and Score Sheet ___________________182 Appendix 8 Test Syllabus_________________________________________________182 Appendix 9 Impressions from an English-Speaking Tutor _______________________189 Appendix 10 Recording Sheet______________________________________________191 Appendix 11 Case Study Instruments ________________________________________191 Appendix 12 Information Sheets____________________________________________193 Appendix 13 Consent Form________________________________________________197 Appendix 14 Literacy Tests: Accompanying Document _________________________201

10
Acknowledgements
Mahadsanid
§ The 8 tutors and 118 students at the three different sites who participated in the
research project.
§ The Ministry of Education who funded the project as part of its Adult Literacy
Strategy, 2001 and the National Association of ESOL Home Tutor Schemes Inc. for
contracting this project.
§ Judi Altinkaya, CEO – National Association of ESOL Home Tutor Schemes Inc.
whose vision for a collaborative research approach has been realised in this report.
§ Lois Bellingham, Head of School of English and Applied Linguistics, UNITEC
for her proactive support throughout the implementation of the research.
§ Julia Castles of South Auckland Home Tutor Scheme, for help with the self-
assessment schedule.
§ Sarah Hardman of UNITEC, for contribution to the section on 'Background to the
Project' and for the photographs.
§ Jainesh Sharma, research assistant, for many and odd hours of work.
§ Colleagues and friends in the School of English and Applied Linguistics at
UNITEC, for listening, support, encouragement and resources.
§ Trish Burns of UNITEC, for proof-reading and editorial assistance.
Research team March 2002

11
Abstract
The primary aim of this project was to determine literacy gains for low-level and
pre-literate ESOL students on a one-semester literacy programme. The project was
undertaken collaboratively by the National Association of ESOL Home Tutor Schemes
Inc., the Auckland University of Technology and the School of English and Applied
Linguistics, UNITEC. A majority of the student participants were refugees and the
remainder new immigrants. The students were from seven different source countries. One
hundred and eighteen students participated in Semester 2, 2001. Sixty-two students
completed most of the tasks and tests associated with the project. The research involved the
use of tutor and student profiles, use of self-assessments, the design and administration of
parallel performance tests, the use of case studies, classroom observations and personal
interviews.
The results of the study found that the students had made significant gains. Gains
were measured through the use of test descriptors which represented eight levels of literacy
ability as defined by the programme curriculum. This scale was used for both self-
assessment and performance tests. The gains were clearer on the tests than on the self-
assessments, signalling that testing, even if students from this background are unused to it,
is a worthwhile exercise. Tests, however, need to allow for some student collaboration. It is
felt that by allowing learners to work in groups of similar ability anxiety would be
significantly reduced.
Variances in test results between the classes taught by native speakers of English
and those taught by bilingual tutors were not significant, thus indicating that both types of
instruction are of equal value at this level. Two thirds of the students at the beginning of the
programme indicated that they preferred to be taught by a bilingual tutor. Therefore it is
clearly important, especially in the early stages of a course for students to have access to a
tutor who understands their language and background.
Results also indicated the significant benefits of the 12-hour weekly classes over the
2-hour ones. However, even those students in the 2-hour weekly classes had made

12
significant progress over the 20-week programme. Clearly, any instruction is better than
none, and the more intensive a programme, the greater the potential gains.

13
Abbreviations used in this report EAL - English as an additional language
ESL - English as a second language
ESOL - English for speakers of other languages
L1 - First language
L2 - Second language
NESB - Non-English speaking background
NZ - Aotearoa/New Zealand

14

15
BACKGROUND TO A STUDY OF LOW-LEVEL AND PRE-LITERATE LEARNERS
Introduction
This research is placed in two large and complex fields of applied linguistics. These
are the fields of Literacy and Assessment. In this study various assessment procedures
were used to determine literacy gains among low-level literacy (ESOL) students.
The first field, literacy, involves coming to terms with the value of literacy to
humans and the many difficulties related to arriving at an appropriate definition of that
word. For the purpose of this study, literacy must be placed specifically in the context of
ESOL (English for Speakers of other Languages) at low levels of proficiency, where
literacy in any language may not be present. The terms ESOL, (used in New Zealand), ESL
(English as a Second Language, used in Australia and USA) and NESB (non-English
speaking background) will all be used, at times, to mean people for whom English is an
additional language (EAL).
In the second field, assessment, it is necessary to look at what assessment aims to
achieve and for whom. Major tensions exist because of two linked yet distinct requirements
of assessment: the first requirement is that it is part of the learning process, with feedback
primarily to learners and teachers; and the second, that it supplies the means to evaluate a
programme, with feedback primarily to an institution or funding body. The first focuses on
individual learner gains and the second, on the numbers of people reaching pre-determined
levels.
We need then to focus on assessment in the area of low-level ESOL literacy and to
distinguish these issues from the broader concerns of adult literacy that currently occupy
governments of developed countries.
Finally, the research needs to be placed in the New Zealand (NZ) context of ESOL
language and literacy provision for low-level, adult learners, specifically addressing the

16
range of assessment measures already in place, as well as current needs and future
directions.
Literacy
The value placed on literacy by developed nations is very high. Literacy not only
impacts on a nation’s economy through educational achievement and employment
possibilities, but is also a valuable resource for the individual (Johnson, 2000).
Defining literacy
The precise meaning of literacy is not clear from the various definitions that have
surfaced in the last two decades. Grant (1986:1), in her attempt to define literacy, begins her
paper with a quote from Alice in Wonderland “When I use a word…it means just what I
choose it to mean, neither more nor less.”
The once simple distinction that literacy is the ability to read and write no longer
holds true. There is now a large degree of agreement that literacy is not an absolute or a
single standard of competence to be reached; it is not a collection of functional skills that
are context- free and unified; and it cannot guarantee economic benefits. While definitions
still include the basic skills of reading and writing at the core, they also include the ability
to use these skills creatively and appropriately, as a means of empowering people to fully
participate in society. The many definitions regard people as being on a life- long continuum
of proficiency.
Wickerts (1990:180) believes that “literacy is relative. The concept is socially
constructed… The question of definition and measurement must reflect this relativity and
also give some indication of performance across the population on a range of literacy tasks
at varying levels of difficulty.” Wickerts also points out that literacy is political and
findings about literacy will be put to political purposes.
Two English-speaking countries where the literacy issue has been researched and
developed are the United States of America and Australia. The 1989 Australian National
Survey of Adult Literacy in English No Single Measure, looked at three types of literacy

17
proficiency: document literacy, prose literacy and quantitative literacy. It recognised that
different types of literacy exist and that they are acquired in different ways and for different
purposes. Reports by the Organisation for Economic Co-operation and Development
(OECD) examined similar areas of literacy and revealed significant literacy problems for
the 22 industrialised nations of the western world. Importantly, they note that a low level of
literacy is not limited to migrants and refugees or any other marginalised group (Johnson,
2000).
In the US, the main approaches to literacy are humanistic and writing-process
oriented (Murray, 1998). These approaches are also discussed by Huerta Macias (1993)
who gives definitions of three key concepts in adult literacy that are complementary and
share basic philosophies. These are, that “the learner should inform literacy instruction, that
learners and their background knowledge and experiences should be respected and valued
and that learning activities should be relevant to learner’s personal situations” (Huerta
Macias, 1993:4). The approaches used in the US are:
q Whole Language Approach involves teaching language in real and natural contexts
and building on existing knowledge and experiences that are interesting and relevant
to the learner. It is not a specific method or strategy as much as a perspective on
language learning and teaching (Edelsky, et al. 1991 in Peyton & Crandall, 1995).
q Learner Centred Approach involves learners in both the content of the course and
the anticipated outcomes. It works closely with the whole language approach, and
extends it by emphasising that language learning is a collaborative effort between
teacher and learner.
q The Participatory Approach is an approach that was made popular through the work
of Paulo Freire, “Education and knowledge have value only insofar as they help
people liberate themselves from the social conditions that oppress them and achieve
personal and social change” (Peyton & Crandall, 1995:1). It is closely linked to the
following theory.
q Critical Literacy Theory goes beyond basic functions of reading and writing,
decoding, predicting and summarising, to a critical examination of text, focusing
also on its social, political and ideological elements. This approach holds that
practices have the capability to both reflect and shape issues and power relations in
society. Literacy seeks to empower learners and is concerned with reading the

18
ideological message within texts, and consciously accepting (or reflecting) the
message (Murray, 1998).
So far, the discussion has focused on adult literacy, referring to literacy issues of
first language speakers. Although many of the issues are equally pertinent to ESOL literacy,
the range of techniques used, and the use of the word literacy to mean acquiring basic skills
in reading and writing in English as an additional language can further confuse the issue.
We now look at reasons why it is important to identify the difference and keep it to the fore
when discussing ESOL literacy and particularly when the focus is on the very first stages of
acquisition, as it is in this study.
Literacy and ESOL
Hammond and Derewianka outline the possibility that a new focus in Australia on
literacy for all could pose a threat to the special provision needed for ESL literacy. They
conclude that, “While there are important areas of overlap between ESL and literacy
education, there are also important differences…and that these diverse needs cannot be met
by the same programmes” (Hammond and Derewianka, 1999:1). They suggest that adult
literacy usually assumes an oral basis of the language. Teaching approaches are different
when oral language proficiency is being acquired at the same time as literacy.
In Australia, in the Adult Migrant English Programme (AMEP), approaches similar
to those used in the US are combined with a unified linguistic approach, based on systemic-
functional linguistics developed by Halliday.
This theory of language provided a coherent model of language that relates language to the cultural
and social contexts in which it is used. They are divided into knowledge and learning; oral; reading
and writing, with each being des cribed in terms of elements, performance criteria, range of variables
and sample texts and assessment tasks. They incorporate learning gains other than language; relate
language to the cultural and social contexts of its use; are based on whole spoken and written texts
and describe language development in terms of learners progressively accessing increasingly
demanding contexts of language use.
Hagan, 1994:36-37

19
Low-level, ESOL literacy
As previously stated, the term ‘literacy’ has, in the past, often been misunderstood
and considered to be a simpler set of skills than is the case. In addition, as Grant (1986)
writes, low-level literacy is often confused with illiteracy (nominal or non-existent reading
and writing skills) a problem that affects only a small proportion of adults in industrialised
societies, where opportunities for literacy instruction exist in the environment, even if they
are not accessed. In addition, we also have a large number of people who are pre-literate –
they either use a language which comes from an aural/oral tradition, or they have never
acquired literacy skills because of political or social upheaval.
It should be noted that at the very lowest levels of literacy, the view that literacy can
be taught as discrete, non-contextual skills has been replaced by a view that even the
teaching of the first steps of letter recognition and formation be conducted within a relevant
context such as learning to read and write personal details rather than learning the alphabet.
There is a strong emphasis on communication and meaningful context (Wrigley, 1993).
This current research focuses on the very beginning of the literacy spectrum where the line
between pre- literacy (nominal or non-existent reading and writing skills) and literacy can be
drawn.
Low-level, ESOL, language and literacy learners
Learning English presents problems for those immigrants and refugees who have
little oral proficiency in that language, who are not literate in any language and have little
experience of formal learning. Hood (1990) discusses the need to develop appropriate
approaches and reiterates that it is possible to learn English in the formal context of a
classroom.
The relationship between oral and written language is a crucial factor in approaches
to second language literacy. Hammond (1989) writes about the Australian National
Languages and Literacy Institute's literacy project 1987-88, which identified key issues in
the relationship between spoken and written language, the role of the teacher and teaching
methodology.

20
A key question for educators is whether it is more effective for learners to first
acquire literacy in their first language, before attempting to transfer those skills to a second
language. On the efficacy of teaching literacy in L1 first, the jury is still out. Studies such as
Kalantzis (1987) concluded that there was no evidence that second language literacy cannot
be acquired without the development of first language literacy, nor that prior development
of first language is a necessary or an efficient way for adults to acquire literacy in a second
language. In a previous study, Kalantzis suggested “it is not so much that students are
unable to achieve greater literacy skills in the second language than the first. It is simply
that they do not always see the need to do so and so are unmotivated to do so” (Kalantzis et
al., 1986, in Hood, 1990:5). In contrast, Roberts (1994) stresses the value of developing
first language literacy and Rivera (1999) gives a great deal of evidence tha t developing
literacy in the first language plays a positive role in literacy acquisition of a second
language. She looks at models where literacy is concurrent (bilingual teaching of both), co-
ordinate (separate instruction of both literacies in the same time period), and sequential
(leaving ESOL until a certain level has been reached in the first language).
The use of the word ‘bilingual’ has often been used in ESOL and literacy studies to
denote proficiency in more than one language. The level of relative proficiency can range
from minimal in one of the languages, to a situation that produces a ‘balanced’ bilingual
ability in both languages so the individual may choose and use the most appropriate
language for a particular purpose and context.
In a bilingual teaching situation where English is being acquired as a second
language, it could mean teaching all subjects in the students’ first language until their
English is at a sufficient level to become the teaching medium. This definition is the focus
of current controversy in North America. In the US, the use of Spanish to teach English to
students whose first language is Spanish is being strongly questioned and opposed.
Research studies on bilingual education have a more positive view of the value of
bilingual assistance or teaching where it is available. An interpretation of bilingual teaching
is outlined in O’Grady (1987:172) referring to her research on learner use of the first
language in course provision, as the “careful, controlled use of the mother tongue for
certain purposes, such as, to contextualise a lesson, to reduce anxiety and to provide the
21
rationale for a learning activity.” O’Grady is careful to clarify that “effective bilingual
teaching uses learners’ languages as a resource, but English remains the dominant language
in the classroom.” Furthermore, she puts a strong case for enabling learners at initial stages
of learning to have the option of bilingual courses.
In the current study, bilingual teachers come from the same backgrounds as their
students, hence the frequency and purposes for which the mother tongue is used in the
classroom varies with the level of complexity needed to explain and discuss the feature of
English to be acquired. Often the use of the mother tongue in these situations shortens time
and effort needed for language acquisition. Other important reasons for initially focusing
on first language literacy would be the relative status of languages or the likelihood of first
language loss particularly among migrants and refugees who have suffered trauma and
faced a period of ‘anomie.’ Hood (1990) provides evidence that the relative socio-cultural
status of the first language and the host language affect learning outcomes. Hood also
points out that there are advantages in gaining L1 literacy first where there is a danger of
losing that language.
Apart from language learning issues such as using appropriate and relevant
materials, providing opportunities to achieve success, practising flexibility in class
scheduling and providing separate classes for those with no literacy skills, other factors that
affect the learner’s ability to progress in a formal class have been identified. Cumming
(1992) looks at why literacy programmes designed for majority populations may not be
seen as accessible or relevant by groups most in need of literacy education. He suggests
four kinds of obstacles: institutional, situational, psychosocial and pedagogical. He also
suggests that women and refugees have the greatest difficulty in accessing education.
Brod (1995:2) suggests that personal factors such as the age of the learner, low self-
esteem, pressures from work, home problems of schedule, childcare and transportation
could all affect learning. Allender (2001) identifies learning barriers such as lack of formal
education, disruptions from war and politics, first language illiteracy, use of non-roman
script in the first language, age, effects of torture and trauma, and different cultural
backgrounds as further factors mitigating against literacy in English. She suggests that
course options need to vary in length, learning pace, intensity, focus and delivery modes in
order to overcome these difficulties. Allender outlines strategies that help such as use of
22
methods that build confidence, promote success and reduce learner anxiety. These include
small classes, bilingual assistance, on-site childcare and times to suit students.
The focus of the current study is learners who have minimal oral English, little or no
literacy in their first language and who are likely to have many of the additional personal
and social blocks to learning. Information on these aspects has been gathered through our
research instruments in order to provide a comprehensive profile on the nature and
background of the learners currently undertaking the literacy programme through
community based classes organised by the ESOL Home Tutor Service. This information in
turn provides us with some indication of the factors which affect literacy gains among low-
level literacy students from an ESOL background. In order to look at literacy gains, it is
important to identify the most appropriate research methods for the targeted group.
Research methodologies
This research project needed to explore the factors that influence language and
literacy acquisition. This aspect of the project required the investigation of the learning
situations and the nature of the involvement, the characteristics, and the experiences of
students and their tutors.
Cross-cultural research
Attempts to understand the perceptions and experiences of people from other
backgrounds raise many challenging issues. To be successful, researchers must find ways to
accommodate the implications of cultural differences. Anderson (1994:51) describes
researchers as having to develop “research practices that acknowledge and take as central
the class, race and gender relations in which researchers and research subjects are situated”.
Other significant factors raised by Eckermann (1993:55) are the varying values, languages,
experiences, beliefs and mind frames that all those involved bring to the project.
Some researchers such as Stanfield and Dennis (1993:17) query that such research
can be done. They raise issues such as the power imbalance between the researcher and the
researched and the impact of colonial attitudes, ethnocentrism and positions of privilege.
However, others believe that the barriers to collaboration can be overcome. Patton
23
(1990:57) suggests that Weber’s concept of verstehen is relevant as it emphasises “the
human capacity to know and understand others through empathetic introspection and
reflection based on direct observation and interaction with people.”
Several specialists in cross-cultural research recommend inclusion of members of
the ethnic community or communities in the research team (Loo, 1982; Eckermann, 1993;
Stanfield & Dennis, 1993; Fitzgerald, 1995). Such team members can provide a cultural and
linguistic bridge, gaining access to as well as the trust of the participants. They can ensure
the research methodology is culturally appropriate and acceptable and also advise on data
interpretation. However, as Goldman and Schwartz (1987:149) warn, factors such as
knowledge and understanding of the host population, existing power relations and the
influence of politics of the past must be given careful consideration.
Case studies
“According to John Dewey, social life, defined as a process or movement, could
only be understood if the meanings assigned to it by its own actors were incorporated
within it” (Hamel et al., 1993:18). Denzin and Lincoln agree, commenting that “qualitative
researchers study things in their natural settings, attempting to make sense of, or interpret
phenomena in terms of the meanings people bring to them” (cited in Bassey, 1999: 2).
The case study is frequently used in educational research to inform “educational
judgements and decisions in order to improve educational action” (Bassey, 1999:39). It is
also a common research design in applied linguistics and the study of language
development and acquisition. Examples are Schumann (in Nunan, 1992:79) who
investigated the hypothesis that second language development will be governed by the
extent to which the learner identifies with and wishes to acculturate with the target language
community. Spada attempted to link teaching practice in second language classrooms with
learning outcomes. An advantage of this approach is that “multiple data sources illuminate
the immediate experience of the student in the lived culture of classrooms and educational
implications” (Spada, 1990:19). Thus theory and practice can be linked, identifying the
factors which promote successful learning and the barriers which prevent it.

24
Cohen and Manion (1994:150) identify the advantages of case studies and their use
in educational research. They describe case study data as “strong in reality” and therefore
interesting and aligned with the learner’s own experience. They allow generalisations based
on the “subtlety and complexity of the case in its own right.” The “embeddedness of social
truths” is acknowledged, as are the differences in participants’ perspectives. Case studies
are “a step to action” and provide the database for other research in an accessible form.
Interviews
Patton (1990:24) comments that the qualitative researcher must provide a
framework within which people can respond in order to represent accurately and thoroughly
their points of view. Thus a method commonly used in cross-cultural research is the one-to-
one, open-ended interview (Pit taway, 1991; Shadbolt, 1996).
The benefits of one-to-one interviews are that they are flexible in terms of location,
timing and privacy. As observed by McSpadden (1987:800), the method encourages trust
and open communication and provides a less threatening mode of participation for
participants who may feel afraid, mistrustful and guarded in their contributions.
In such circumstances, it is essential that the interviewer has the appropriate skills,
experience and awareness of the complexities of the situation. As McDermott (1997:46)
observes, the interviewer should have credibility with and extensive experience of working
with refugee communities in order to have gained respect and established relationships of
trust. S/he should be “sincere, understanding, tolerant, adaptive and humble as well as
competent in cross-cultural communication.”
Cohen and Manion (1994:318) concur, stating that “studies have shown that colour,
religion, social class and age can, in certain contexts, be potential sources of bias.” They
recommend that questions are carefully formulated so that the likelihood of
misinterpretation is reduced and that the characteristics of the interviewer are matched with
those of the sample. Careful consideration should also be given to the format of the
questions. These should reflect the purpose of the interview, the subject matter, the
participant’s level of education, and the depth and nature of information s/he can be
expected to have (Cohen & Manion, 1994:321).

25
Observations
Observation is a very useful method when investigating the process of education. It
can capture the immediacy of the classroom and more subtle aspects such as atmosphere,
tone and sense of purpose. It can detail the classroom behaviours of the teacher and students
as well as identify the effectiveness of the learning.
Allen, Fröhlich and Spada (1985) developed a sophisticated scheme for classroom
observation entitled The Communicative Orientation of Language Teaching (COLT) to
enable researchers to compare different language classrooms. It has two sections. The first
focuses on the description of classroom activities and includes the activity type, participant
organisation, classroom materials, lesson content and student modality. The second section
isolates communicative features such as use of sustained speech in the target language (also
see Nunan, 1992; Shameem, 2000).
The use of the COLT observation scheme in the English language classroom
attempted to link teachers’ interpretations of communicative language teaching theory with
their classroom practice. It also tried to identify the impact of different teaching practices
on learning outcomes. Whilst being very difficult to implement, such studies enhance
practitioners’ awareness of how to select teaching methods which enhance student learning
and improve their achievement. By observing classrooms, the process of good language
teaching can be better understood.
Assessment and evaluation
Two methods of assessment were used in the project – self and performance
assessment (tests). Student self-assessed proficiency was compared to the test results of
student’s actual performance on a compatible scale. An earlier study in NZ among Indo-
Fijian immigrant teenagers found that they were self-assessing their aural and oral language
proficiency in their mother tongue to a high degree of compatibility (Shameem, 1995;
1998). This testified to the validity of self-report proficiency scales when language
proficiency is tied to real and authentic language functions in the language being assessed.
However, the respondents in the earlier Wellington study were teenage first generation

26
migrants who had high levels of proficiency in their mother tongue. Moreover, reports of
their literacy ability were not validated.
Burt and Keenan (1995) define assessment as placement; measuring progress by
demonstrating improvement to learners and clarifying for educators what has been learned
and what has not. It is vital that the assessment process in no way diminishes the learning
and teaching process. Cambourne (1992:12) writing of language assessment in primary
schools, sounds some words of caution. He points out that the validity of testing is doubtful
because “the theoretical principles that guide testing as a form of assessment are not
congruent with the theoretical principles that guide literacy teaching and learning.” He does
not discount tests but warns that they can only serve useful purposes if the purpose and
value of testing is clear to students and they are combined with classroom environments
that support students and enhance self-esteem. Tests should not be used as a basis to allot
resources to a programme, hold teachers or learners accountable, or create anxiety. This is
particularly true for programmes such as those run in the institutions we have included in
the research, as they cater for the needs of already severely disadvantaged individuals.
Assessments are also used as proof of suitability for further study or job training. The chief
stakeholders in assessment are the learner and the teacher.
Programme evaluation is a way to quantify gains to verify programme effectiveness.
It assists in decisions as to whether a course needs to be modified or altered in any way so
that objectives may be achieved more effectively. It is also used to justify funding.
Evaluation refers to a wider range of processes that may or may not include assessment
data. The stakeholders are the programme designers and funders. Tensions can arise when
assessment procedures are used in isolation, to evaluate and justify the programme to
funders.
According to Wrigley, (1992) “Learner assessment is one of the most troublesome
areas of adult English as a second language”. The general response appears to be that a
range of tools must be used.

27
Assessment procedures and tools
Language teaching developments from 1970s to 1990s cover the movement from a
structure-based curriculum to a needs-based, learner-centred one, and from norm-
referenced to criterion-referenced assessment in the form of competency-based tasks.
Norm-referencing compares students to levels achieved by other students whereas criterion-
referencing assesses students against a pre-existing set of criteria, and allows for tools
ranging from tests to self-assessment.
Competency-based assessment
Competency-based assessment has been widely used in adult ESOL literacy
instruction since the mid 1970s. Its objectives are described in task-based terms such as
‘students can’ or ‘students are able to’ and include a verb describing a demonstrable skill,
for example ‘student can understand requirements in a simple form.' Competencies include
basic survival skills such as answering personal information questions or obtaining food
and shelter (Peyton & Crandall, 1995). An example of competency-based testing is found
in the Certificate in Spoken and Written English (CSWE) developed by the Adult Migrant
Education Service (AMES) in the 1990s. The CSWE models given in Assessment
Guidelines (Navarra, 1993) together with sample tasks, marking grids, suggestions for
teachers and programme managers for administering and managing assessment were used
in developing the assessment tasks used in this research.
Brindley (1998) discusses the problems of using this type of testing on a large scale.
They are related to the comparability and relative difficulty of assessment tasks, the
consistency of rater judgement and the generalisability of underlying skills within and
across competencies. Among his solutions were banks of tasks, trialed and tested in a wide
range of situations, that elicit the same type of specified performance and in which
performance criteria are clearly observable. In his opinion, the necessity of adequate
preparation for language and literacy teachers, and the ongoing opportunity for them to
develop necessary skills is a key factor, as “allocating to teachers responsibility for
designing and conducting their own assessment tasks rests on the assumption that they have
the skills required to carry out this task effectively” (Brindley, 1998: 67).

28
Self-assessment in language learning
The idea of self-assessment is not a new one. Rolfe (1990) refers to various
proponents who have used self-assessment for a range of purposes in a number of
languages. The move towards a less prescriptive, more learner-centred, negotiated
curriculum has also highlighted its importance and its contribution to the general field of
language assessment.
Despite acknowledgement of the positive contribution that self-assessment makes to
language learning, there continues to be some divergence of opinion about the validity of
self-assessment. Some of the anxieties about self-assessment have been: lack of objectivity;
that learners are not capable; and that they will rate themselves too highly or cheat. Studies
have generally shown these concerns to be unfounded. There is a need for some preparation
of students about the value and methods of self-assessment, but the tendency has been for
learners to under-rate rather than over-rate themselves. There is more evidence of cheating
in standard tests than with self-assessment.
Advantages of self-assessment include flexibility in gathering information about
learners, and measurement of what has been taught in class. Studies also note advantages
of self-assessment to both learners and teachers as including a higher sense of involvement
and responsibility for learning by the former, and ease of administration for the latter.
Lewis (in Brindley, 1990:187) concurs with these findings: “Informal self-assessment is a
natural part of language learning. Formalising self-assessment should help focus the
learners’ attention on their strengths and weaknesses.”
While self-assessment is unlikely ever to be used as a sole means of assessment for
certification, it has proven value as a method of giving individual feedback on the language
teaching and learning process, and allowing for self-perception of knowledge and skills
gained. Rolfe (1990) compared assessment ratings using both self and peer assessment in
the AMES Speaking Proficiency Descriptions, and found a significant degree of
correlation. He also refers to other studies that have found a high degree of reliability and
correlation between both teacher- and standardised test assessment and self-assessment
(LeBlanc & Painchaud, 1985; Brindley, 1989; Paltridge, 1989).
29
In NZ studies, Shameem (1998:86), testing oral and aural Fiji Hindi proficiency
among teenagers of the Wellington Indo-Fijian community found that “the results of the
performance test correlated strongly with the self-reported data, thereby demonstrating the
validity of the self-report scale.” Subsequently, Roberts (1999) uses self-assessment in the
context of studying language maintenance in the Gujarati, Samoan and Dutch speech
communities in Wellington.
Roberts (1999), Shameem (1998) and Lewis (in Brindley, 1990) all include
extensive references (LeBlanc & Painchaud, 1985; Kalantzis, 1989; Bachman, 1990;
Hakuta & D’Andrea, 1992; Bachman & Palmer, 1996) to the positive use and usefulness of
self-assessment. Self-assessment is a quick, practical and anxiety-free way for a learner and
a teacher to reach an understanding of learner competence and, if conducted at various
points over a period of time, learner progress and achievement.
Self-assessment measures
A variety of measures have been used for self-assessment purposes in applied
linguistics, although many studies have used a numerical rating, having learners indicate the
degree of ease or difficulty they experienced in completing specific tasks (LeBlanc &
Painchaud, 1985; English Language Institute Proficiency Scale, 1992; Shameem, 1995,
1998).
In the current study with low-level literacy and English language learners, a simple
five-point scale was used, ranging from ‘ability to complete a real- life literacy task with
ease’ to ‘being unable to do so at all’ for eight reading and eight writing competencies.
These same competencies were then used to create performance ‘test tasks’, which were
administered by the classroom teacher (see Shameem 1995, 1998 for a similar procedure).
The methodology section of the report details the two measures further.
The results would show whether self-assessment is a valid, relevant and appropriate
measure of literacy progress for low-level literacy learners for whom English is an
additional language. The use of performance assessment at this level is time-consuming,
and has the added disadvantage that cultural expectations and educational backgrounds can

30
make students resistant to their use. However, while the use of self-assessment instruments
to assess literacy gain might be pedagogically successful and backed by research evidence,
it may not satisfy funding bodies that require hard data, because it is difficult to quantify
outcomes without using ‘real’ tests. Employers, for instance, might prefer to see the results
from commercially available tests such as IELTS, as scores are easy to read and interpret,
and have universal application regardless of the place of study. However, commercial tests
do not adequately test individual strengths and weaknesses, especially at low-level literacy.
Nor do they necessarily measure what has been learned in class or how it has been taught,
or give priority to learner goals.
Performance assessment
A communicative performance test, being task-based, reflects language use in
realistic situations and at the same time assesses communicative appropriateness. The key
argument for this approach is that knowing a language essentially involves the ability to use
it appropriately in a range of circumstances (Spolsky, 1978, 1985; Galang, 1982; Van
Weeren, 1984). Clark (1975) suggests that the broad aim of assessment in any language is
that the process should determine the ability of the individual to receive or transmit
information in that language for some pragmatically useful purpose, within a real- life
setting. Authentic elicitation and realistic language use are particularly important.
Several writers express their reservations about taking this 'real- life' approach. They
argue that the closer the apparent replication of reality and the higher the face or 'genuine'
validity, the harder it becomes to lay claim to any other type of validity or to attain test
reliability (see Clark, 1975; Shohamy, 1983; Bachman, 1990). Stevenson (1985) points to
the uniqueness of each sociolinguistic situation and the infinite possibilities of language
choices in each situation according to domain, context, interlocutors, region, and other
factors which are unreplicable in test situations. Bachman (1990:81) too, states that
language use is ultimately context-dependent, and is therefore unique. And similarly,
Shohamy and Reves (1985) tell us that in multilingual communities, language is used for
effective communication and is rarely judged for correctness, which is normally a primary
focus in a language test. These observations had various implications for test design.
Although the ideal was to develop a real- life 'authentic' test, we were aware of the
constraints operating on such an undertaking and that at best we could elicit what might

31
sound like authentic language behaviour but which would in reality be influenced by the
participants' awareness of their involvement in a research study, as well as other factors
specific to the test situation (also see Shameem, 1995; 1998).
A communicative literacy test that included functions representing real- life
language use had the greatest degree of validity for the research sample. A further
consideration was the notion of ‘appropriateness’ of response to fulfil particular functions,
as much as correctness. Hence this was carefully taken into account in the rating process, as
among pre- literate learners particularly, even the move from the inability to formulate a
letter of the alphabet to the ability to write a misspelt, simple, one-syllable word is an
achievement worthy of credit.
In taking this approach it was essential that the procedure be perceived by test takers
and administrators as honest, fair, sensitive to gender, religion, and the varying levels of
performance ability in both the pre- and post-programme testing procedures.
It is acknowledged that allowances also need to be made for the differences between
the students and the test administrators, as some of these were bilingual and others were
native English speaking tutors. Differences such as these have influenced results in other
language tests (Bachman, 1990:350).
Reliability and validity in performance assessment.
To be valid, a test must demonstrate that it is measuring what it is purporting to
measure; to be reliable it must show stability over time and across raters. One of the
greatest tensions in language performance assessment is the one between validity and
reliability. The closer one gets to replicating reality and eliciting real- life type language use,
the more unreliable the data may become, with the absence of structural constraints and the
lack of consistency from one test-taker to another.
Despite this tension between reliability and validity in assessing language
performance, the two concepts are closely linked. For a test to be valid at all, it must be
reliable. Although the traditional view saw reliability as the precursor to validity, it is now

32
perceived to be an integral part of it. In language tests, a central concern is the
identification of the factors which affect language performance and therefore the reliability
and validity of the tests. If raters are making unreliable judgements of performance in rating
test results, then one cannot make any valid judgements on the basis of the test results.
Bachman (1990:241) suggests that reliability and validity should in fact be seen as part of a
broader concept of test 'usefulness' that might be a better measure of a good test. Because of
the tension between validity and reliability in communicative language tests, it is important
to look at each in turn in relation to assessing the performance of low-level literacy students
involved in this project.
First of all, validity has to be considered in relation to the purpose of the test and the
use that is to be made of the results. The purpose of this literacy test was to gather evidence
of the performance ability of pre- literate and low-level literacy students undertaking a
course of study. Thus, the results should give an accurate description of the ability of these
students to read and write English at the very basic 'emerging', 'survival' and 'social' literacy
phases at the beginning and end of their study programme.
The most easily achievable and most contentious type of validity is 'face' (also
known as 'genuine') validity - the test must ‘look’ right at a glance to an ordinary lay
person. Although face validity has traditionally not been taken seriously in testing literature,
it nevertheless has importance in terms of test takers' perceptions of the ir reasons for taking
the test. Since the test takers’ motivation was a serious consideration in a low-level literacy
test, it was important that the test should look right and show relevance to the stated
purpose of determining levels of survival and social literacy ability in a range of authentic
language tasks.
Content validity means ensuring that the tasks and topics which are included in the
test are representative of the larger domain in which the language is normally used. It is
quite difficult to attain content validity because it is simply not possible to cover all
possible areas and functions in which the language is used. Since the main concern of the
present survey was the collection of appropriate information on a respondent's performance,
thereby gaining a profile of performance ability among these students, content validity
could be improved by identifying the appropriate language tasks the test should include.
However, by its very nature, a test is very limiting in terms of the topics that can be
33
discussed, the method of elicitation, and the artificiality of it being a test situation, despite
the pains taken to make it as realistic as possible. Moreover, quantifying real- life language
use may lower content validity. Hence a major concern in establishing content validity is
the extent to which a low-level literacy test can provide us with a representative enough
sample of the test taker’s actual literacy ability in English in tasks and topics covered in the
curriculum – which is what the rater has eventually to judge.
A measure of concurrent validity for the test was obtained by comparing the two
literacy performance assessments with the two results of the self-report assessments
conducted at the beginning and end of the programme of instruction. Although the different
aspects of validity have been discussed discretely, as mentioned above, one needs to take an
overall view of validity in order to demonstrate the usefulness of a test in relation to the
group and language under study. Validity is invariably affected by reliability. In order to
have test reliability, one needs to manage and control those factors which might cause a
variation or distortion of performance scores. These might be features within test design,
implementation and rating.
Despite the reliability/validity tension in performance assessments, steps may be
taken to find an optimum balance between consistency and reality in a practical, systematic
way. High on the list of factors to address for test validity was the development of an
authentic communicative test which was representative of real- life language functions.
To build reliability into test design, a structure or framework was provided to
restrict the range of possible responses with each test task. The framework for the test
content included a description of tasks which could be achieved at each level, and set out a
procedure to be followed so that the respondents were provided with ample opportunity to
demonstrate performance ability, with several tasks at each level. Even if each test did not
follow exactly the same path, or have the same administrator or test site, at least a common
test provided uniform set tasks and a procedure to be followed to ensure some reliability.
Language performance with the same test paper covering the objectives and outcomes of a
similar curriculum provides a better basis for test reliability.
It was recognised that the test venue might also affect reliability; the test
environment differed widely for each group of respondents. The overriding concern

34
however, was for test validity and since the classroom was the place being used to acquire
the necessary literacy skills, it was therefore the best place for elicitation of performance.
Although one can improve the reliability of performance tests through test design
and implementation, a further important concern is that we are able to measure the
reliability of the results which are obtained from the performance test procedure, especially
since some subjective judgements are being made. In this test, reliability of ratings was
evaluated by means of inter-rater checks, which were obtained by having two raters
marking one or more class sets. A comparison was then made of the ratings. A checklist
was provided to ensure consistency of judgement during the rating process.
Factors affecting literacy gains
A third focus of the research was to collect information about additional factors that
might affect language and literacy gains among the learners under study. Since learner
assessment at low levels of ESOL literacy has been identified as one of the most
troublesome areas of adult literacy (Wrigley, 1992), it is crucial to determine which factors
might contribute to language learning and which mitigate against it. Some testing issues
are unique to ESOL learners, for example, problems with vocabulary leading to reading
difficulties, or with the cultural notions underlying the actual test items such as
understanding instructions or methods of testing (multi-choice, matching, cloze).
It is possible that assessing language gain is difficult because of the background
factors of the learners themselves and the minimal rate of progress that can be expected
from refugees and migrants who are suffering from post-traumatic stress disorders and
feelings of anomie. When low-level learners also have a refugee background, the impact of
past experiences has been shown to have a critical effect on the ability to learn, especially
in formal classroom situations. The trauma of past events often leads to chronic
psychological symptoms, memory impairment, short attention span, severe anxiety and
limited concentration. It also has an impact on confidence and self-esteem. Refugee
learners may need a longer time over which to spread their study, flexibility in attendance
and additional hours (see Abbot, 1989; Kasanji, 1994; Smith, 1994, 1997).
35
In addition, for many low-level learners, a minimal or broken education indicates a
lack of familiarity with classroom behaviours and conventions, such as test-taking, or
functional skills such as holding a pencil. For these reasons and in order to develop
effective assessment tools for a low-level ESOL language and literacy class of people from
refugee backgrounds, we must clarify what is occurring in the class and whether there are
gains other than in language and literacy that should be assessed in order to demonstrate
both student progress and effectiveness of the programme. Allender (2001) suggests that
the development of less tangible, non- linguistic skills and qualities such as confidence,
cultural awareness and learning skills are essential. It is likely that gains will be made here,
and these should be taken into account when considering programme outcomes.
It is possible to measure these gains qualitatively through teacher-student interviews
which use an initial student profile, self-assessment surveys, and needs assessment as the
basis for student-teacher discussion and goal-setting during and after the programme of
study. In the current research project, persona l profiles and case studies illuminate some of
the affective problems and perceived gains of students.
This study hopes to provide some additional data and point the way to the need for
more research in the area of low-level literacy provisions for refugees and new immigrants.
A reduced ability to keep up with the pace of a class may mean that learners need a class
that is specifically geared to their employment or other needs. Refugees are inevitably
placed in a low socio-economic group, have settlement difficulties with finance, and a high
rate of unemployment. Family commitments, such as family reunification, children’s
adjustment to school, and childcare are priorities. Even the simple question of transport can
have an effect on learning (see for example report by White, et al., 2001). Reasons for
special consideration for ESOL provision for refugees in NZ have been clearly outlined by
Altinkaya (1998).
The programme design elements that provide a suitable class for low-level learners
of refugee background include flexibility of learning pace and goals as well as continuity,
and are designed to take into account previous levels of language proficiency. Small class
size is needed, together with a safe, comfortable and supportive location close to the
learners’ community, because of the need for bilingual assistance and on-site childcare.
Times must suit learners. Content needs to integrate settlement, parenting and health

36
information with language and literacy. The classes need to be available when the learners
need them and to ensure that they are part of a process which will assist them to get families
and lives together, to heal and build up confidence in the future, to bridge cultural gaps and
to learn how to learn. A well-designed, relevant programme can do much in creating high
levels of awareness in the importance of literacy, thereby increasing student motivation and
encouraging teacher commitment.
Literacy in Aotearoa/New Zealand
The report Changing Skills for a Changing World (Johnson, 2000) that followed the
OECD surveys Literacy in the Information Age - Literacy Economy and Society and
Literacy Skills for the Knowledge Society, addresses the need to understand and define
literacy, gives an outline of the obstacles that prevent the issue of literacy being addressed,
and makes suggestions for a comprehensive strategy. The survey focuses on vocational
literacy because much of the NZ work in literacy has been workplace literacy. In the current
context however, vocational skills are only a part of the bigger picture. Low-level ESOL
literacy students are first of all concerned with survival and social literacy (the ability to
perform functions which will allow them to deal with social and health services) before
vocational skills are acquired. This may be particularly true of women in these classes, who
are the primary caregivers of children and families, while men would be concerned with
also acquiring vocational skills. It is imperative that a personal profile/needs analysis is
conducted at the start of each programme to ensure congruence between teacher, student
and programme goals.
Summary: Literature review
The scope of this project encompassed two major fields in applied linguistics:
literacy and language assessment. More specifically they concerned aspects of these fields
in relation to low-level and pre- literate learners most of whom had arrived in NZ as
refugees and dispossessed individuals with a history of persecution, and who were likely to
suffer from post-traumatic stress disorders.

37
While the original definition of literacy was rather narrow in its focus solely on
reading and writing ability, in recent times the broader definition, which includes all aspects
of communication through the written word, has become a more salient definition. It
includes numeracy ability and the ability to manipulate numeracy skills appropriately for
various purposes. Moreover, it looks at literacy in a broader context – in the ability of the
individual to use literacy skills for realistic functions and authentic purposes, with effective
and clear communication being primary objectives. It also takes into account the
background factors that students bring to the learning process and the affective gains made
in self-confidence and self-esteem.
The difficulty in measuring low-level literacy skills is acknowledged, particularly
when the students undertaking the programme have no previous experience of test-taking
situations. Ideally, a self-assessment or self-report of skills would be sufficient to indicate
performance level or progress – however in order to make this a valid system of assessment
for a group such as this, it would need to correlate with student performance. In addition,
personal factors in the background of learners such as previous education, first language
competencies and history of English learning needed to be taken into consideration in
making decisions about progress and achievement. The personal profiles, case studies and
classroom observations gave further evidence of the affective domain and environment that
learners were experiencing.
This review of literature covers the areas of pertinent concern in this current project.
The next section looks specifically at the background of the project and the issues that were
present and arose during the teaching and assessment processes.

38

39
BACKGROUND TO THE PROJECT
Introduction
Although this project involved an analysis of literacy gains in low-level literacy
classes for both refugees and first generation immigrants, it is important to look at the
refugees in particular because of their background, their language learning needs and the
contribution that the bilingual refugee tutors have made to this group.
This section is divided into three main parts. The first looks at the recent refugee
situation in Auckland in terms of literacy experience and English language level. The
second examines the language learning issues for refugees and the consequent impact on
their resettlement. Finally, a pilot training project with bilingual tutors from refugee
communities is outlined and issues which arose from the project are discussed.
Background and rationale of programme
Through an agreed quota system, NZ receives around 750 United Nations refugees
per year. In addition to this group, refugees are admitted under the Family Reunification
provisions of the Immigration Act and a large number of spontaneous refugees arrive in the
country each year. Forty percent of refugees stay in Auckland. Provision for meeting the
learning needs of pre- literate refugees in Auckland has been varied. Of refugees arriving in
NZ, 80% have less than four years of schooling. Following Davison's (1996) definition of
literacy, few refugees are able to function effectively in NZ and use literacy as part of
everyday communication. Davison’s (1996) definition of literacy is the ability to:
• read and use information
• write appropriately (in a range of contexts)
• function effectively in society
Data provided to UNITEC by Centre of Refugee Education, AUT indicates that
typical English proficiency levels of UN refugee intakes to NZ over the last four years are:
40% pre-literate; 40% semi- literate; 15% elementary to intermediate level and 5% high
intermedia te. Pre- literate refugees are considered not literate in any language and come
from a society or community where literacy plays little or no part in communication. Semi-

40
literate refugees have some literacy skills in their first language but are not confident to use
their literacy skills in a new language (Gardner et al., 1996:2).
Experience has shown that pre- literate students cannot succeed in existing beginner-
level English classes because of their use of print-based media. The initiative of training
suitable bilingual tutors to help members in their pre- literate communities achieve initial
literacy and numeracy skills in English has assisted these students to enter beginner- level
classes at tertiary institutes and in community education. This has provided a first step
towards employment for long-term unemployed refugees, as well as providing more
immediate employment opportunities for the bilingual tutors.
Starting from the premise that successful community-based training programmes for
pre-literate refugees occur when trained bilingual tutors are available, staff from UNITEC
initiated bilingual discussions with WINZ/DWI (Work and Income NZ/Department of
Work and Income, previously NZES, NZ Employment Service), along with members of the
refugee groups concerned, and advocacy organisations. These discussions resulted in an
agreement for UNITEC's School of Languages and School of English and Applied
Linguistics to deliver a pilot tutor training course as part of the WINZ 1999-2000 funding
round.
Refugees in West and Central Auckland
The statistics for Ethiopian, Eritrean, Somali and Kurdish refugees who have moved
into the Central / West Auckland area are (Table 1):
Table 1 Refugees in Central and West Auckland
Pre-literate No English literacy
Beginner English
Elementary English
Total: Elementary and
under Somali 27% 18% 33% 12% 90% Ethiopian 22% 27% 27% 18% 87% Eritrean 25% 16% 31% 10% 89% Kurdish 36% 25% 25% 10% 96% Mean 28% 22% 29% 13% 91% S.d. 0.06 0.05 0.04 0.04 0.04
(Source: Martin-Blaker and Hardman, 2001:2)
41
Since the majority of refugees and immigrants join previously established
communities in Auckland, the issues that arise consequently loom larger in Auckland than
elsewhere. Of the United Nations quota refugee intake living in West/Central Auckland,
most lack basic survival skills – they cannot read a medicine label, understand their child’s
school report, understand a power bill or get a bus to an unfamiliar destination without help,
often needing assistance from one of the few literate, English-speaking members of their
community. The English-speaking refugees usually spend many hours helping friends visit
WINZ or the doctor, and so on, since there are few paid community workers or translators.
For the pre- literate person, this is extremely disempowering.
The sense of anomie has been further heightened by the lack of employment
opportunities because the arrival of these refugees has coincided with a time in NZ’s
political history when social equity objectives were not deemed to be the responsibility of
the State.
Whereas in a different set of economic and political circumstances people with little
formal education may have been absorbed into the workforce, in the last decade they have
been considered to lack marketable job skills, including the ability to speak and understand
English. The English language, in the last decade, has been a market commodity, in that
those who lack English proficiency must pay substantial fees to acquire it. If they are
unable to do so, they may be funded by the State (through Work and Income NZ or Skill
NZ) to acquire a strictly limited degree of English proficiency. The success of fully-funded
training has been measured by the percentage of trainees who have either found jobs or who
have moved up a step on a learning pyramid of which the apex is any form of paid
employment.
Language learning issues
Several language learning issues become apparent when teaching literacy to pre-
literate and low literate level learners. Ramm’s (1992) NCELTR project in Australia,
involving learners with minimal formal education found that, for maximum benefits:
• learners should be placed in classes with others of a similar educational background;
42
• low-level literacy learners should stay in these classes until they acquire formal learning
strategies that will enable them to access other learning options;
• all teachers should receive professional development support to assist them with
appropriate methodology and teaching materials;
• low-level literacy learners need 400 hours tuition to progress one point on the ASLPR
scale (Ingram, 1981). As Survival English level on the ASLPR scale is between levels
1+/2, pre- literate learners would need between 800-1200 hours to reach this level
(equivalent to 18mths – 2 years full time study).
Surprisingly few researchers in this area have mentioned the important issue of
teacher-student communication when the teacher does not speak the learner’s language.
This issue is particularly pertinent for learners with little formal educational experience,
because they are not aware of the common expectations of the Western education system
and the relevant study skills needed to help them learn. Bilingual English teachers or
teachers from language minority communities present the ideal solution for learners in these
circumstances.
Bilingual tutor training project
When, in the mid 1990s, African and Middle Eastern refugees began to appear at
UNITEC Institute of Technology, funding was sought to provide appropriate ESOL and
literacy instruction for them. The West Auckland Home Tutor Scheme and the Auckland
Institute of Technology (now Auckland University of Technology) at the time also tried to
respond to the growing and urgent needs of these learners. As one of the greatest difficulties
was that of communication, it was decided to train bilingual and peer tutors to aid with
teaching members of their own community. The Auckland North region of WINZ funded a
training course for ten bilingual tutors at UNITEC, with the first intake of tutors completing
their training in mid-2000.
The training programme was originally designed mainly to train or re-train members
of refugee communities as tutors of basic English language and literacy skills. Accordingly,
the training focused on introducing theories of literacy, numeracy and language teaching,
theories of adult learning and practical tutoring skills (See Appendix 1 for aims and specific

43
outcomes of the course and course details). The trainees were recruited in consultation with
community organisations and were from the Somali, Ethiopian, Oromo and Iraqi
communities. They needed to have an appropriate standard of English and to have had at
least received a secondary education. This posed some problems during recruitment, since
there are few educated women in these communities yet the majority of the future students
would be women. Two Somali women started the course but one had to withdraw for
personal reasons. The other tutors were all male, and had a range of educational and
professional backgrounds. Two were ex-tertiary lecturers themselves, three were ex-
teachers and four did not have a teaching background. Both those with and those without
previous teacher training were able to become effective tutors, and it is worth noting that
other projects which used previously untrained teachers have also found that they are
effective (See D’Annunzio, 1995).
The course included some computing skills and discussion of community funding
issues. This proved to be more important for the tutors than had been expected, partly
because there was no provision to fund the classes that they were hoping to teach. However,
it was quickly realised that the application for funding was best left to administrators in
community organisations, as the tutors’ community organisations had not yet developed the
infrastructure to do this. As one tutor remarked:
We know we have to knock on doors but we don’t know which doors or how to knock.
This highlighted the key role that the tutors take when they are working with their
students: they pass on knowledge and information which their pre- literate learners
otherwise have no access to, in an equitable and empowering fashion. Yet the tutors
themselves are recently arrived and often don’t know “how things work”. Understanding
how and why WINZ was funding their training course yet was not going to fund their
subsequent teaching of actual classes was one of the issues they were concerned about. The
course lecturers of the bilingual tutors found themselves positioned as sharers of knowledge
about systems, as much as being skill developers.
The tutors have a unique approach to their teaching, primarily because they share
the students’ language and culture. During teaching practice observation, it was realised
that the shared language between the trainee and students dominated classroom talk. There

44
also seemed to be a lot of teacher talk and student questioning in process. In most of the
observed classes, a large proportion of time was taken up with teacher-dominated
discussion. In one group, students and tutors who were all from the same country shared
five languages between them, so the linguistic complexities of discussions were quite
elaborate.
It was clear that students and tutors were working hard to negotiate shared meaning
and understanding. Student evaluations of bilingual tutors who began to run community
classes showed that a majority preferred tutor explanations using their own language.
Students often brought handouts from their day class to their evening class, for discussion
and further clarification with their bilingual teacher.
Murray (1998) points out that much English and literacy teaching to adults here and
overseas has taken a narrow, functional view of literacy. If the teacher is unable to
communicate with the learners at anything above a very basic level, students will continue
to function at this level. Teachers who can communicate with students in a common
language can help acquire the higher order, more cognitively demanding literacy skills
which are needed in the NZ environment.
The current situation in Auckland
Towards the end of the tutor-training programme, the issue of funding of language
teaching classes arose. The West Auckland ESOL Home Tutors donated their Community
Education hours in term two 2000, and many other Community Education providers
donated unused hours for the remainder of that year. Meanwhile further training is urgently
needed for bilingual tutors to assist other pre- literate learners living in Hamilton,
Wellington and Christchurch.
During the course of this research project in 2001, the National Association of
ESOL Home Tutor Scheme Inc. under the Adult Literacy Strategy received under the Adult
Literacy Strategy funding to fund classes for 32 weeks for low-level literacy learners in
West and South Auckland. While the project was set up in the first semester, data gathering
was conducted in the second half when West Auckland ran four 12-hour a week and one 2-

45
hour a week classes for 20 weeks, while South Auckland was running one 12-hour class
and two 2-hour a week classes with native English-speaking teachers (See Table 2).
Table 2 Profile of literacy students participating in project
Location Tutors Hours Weeks (Semester 2)
Classes and codes
West Auckland UNITEC campus
Bilingual 12,2,12 20 Weeks 3 (C,D,E)
West Auckland Wesley Intermediate
Bilingual/English 12,12 20 Weeks 2 (A,B)
South Auckland English-speaking 2,2,12 20 Weeks 3 (F,G,H)
This funding was connected to the current project, which was measuring the gains
made in literacy by these learners. Because of the low level of literacy expected of this
group at the start of the project, and the difficulties associated with measurement of
learning at this level, a clear gain was not expected. Moreover, because students began the
course at different levels of proficiency it was expected that gains would invariably differ,
depending on the starting point of the individual student. Hence a longitudinal assessment
at the beginning and end point s of the programme would provide us with some knowledge
of the existence and nature of any literacy gains made during the 20-week period of the
research project.
46

47
METHODOLOGY
Introduction
This literacy research project was funded by the Ministry of Education through a
grant to the National Association of ESOL Home Tutor Schemes Inc., as part of the NZ
government’s Adult Literacy Strategy. The first objective of the project was to develop
measures of literacy gain for adult students with very low levels of literacy and English. It
also aimed to identify other factors which impact on learners’ progress.
A more general objective of the research was to better understand the educational
needs of Non-English Speaking Background (NESB) students at emerging levels of
literacy, and determine appropriate methodologies for effective educational provision. The
research produced generalised measures of literacy gains, which will be available for use in
courses with similar, low literacy level learners. It will also indicate the relationship
between classroom testing and students’ self-assessment.
Moreover, the research encouraged further development of the curriculum and the
provision of on going professional development support of the tutors involved in the
project. As a consequence, the findings should inform future teaching practice and course
design. An additional outcome will be the establishment of an information base to inform
the judgements and decisions of the Ministry of Education regarding policy development
and the funding of programmes.
Tests consisting of competency-based tasks linked with the curriculum were
developed and administered in August and December 2001. Students also completed three
self-assessments and a personal profile. Case studies and classroom observation
supplemented the quantitative study. While it is acknowledged that literacy has a much
broader definition than just the ability to read and write, the nature of the literacy
programme and the time span made it difficult to expand on the narrower definition of
literacy. However, other important personal variables were taken into account in the
measure of progress, as was the students' starting point in first and second language
proficiency on our own literacy measures of those who were undertaking the programme.

48
Research questions
The research questions for the project were:
Part A: Personal profiles
Tutors
1. What are the profiles of the tutors involved in the project in terms of:
- age, gender, ethnicity?
- educational and linguistic background?
- socio-economic status and change from country of origin to NZ?
- NZ length of residence and age at time of immigration?
- proficiency in first language, English and other languages?
2. Language and educational attitudes.
What beliefs do tutors have about:
- literacy?
- preferred learning styles of students?
- learner characteristics that lead to successful language learning?
- methods of classroom assessment being used in the project and informally?
Students
1. What are the ages, countries of origin and gender of current learners?
2. What was the socio-economic background of the learners in the study and what has
been their change in status in NZ?
3. What is their educational background?
4. What are their current proficiencies in English and their literacy levels in their first
language, compared to English?
5. What are their personal reasons and goals for learning English?
6. What has been the length of residence and what was the age at time of migration to NZ
of current learners?
7. What English language provision have current learners experienced in NZ?
8. Do learners have a literate background?
9. Language and social attitudes: how are these perceived by the learners:
§ from the host community of their culture, ethnicity and language and
§ in terms of their own usefulness in learning English?

49
Part B: Self-assessment
1. What are the English language reading and writing abilities of low-level literacy
learners on a range of communicative, authentic literacy tasks when compared between
points:
- at the beginning of a period of instruction
- at the mid-point
- at the end of a period of instruction
2. Has any comparative gain been made on the self-assessment scale across the period of
instruction?
3. What variables have contributed to the greatest degree of perceived gain in a) reading
ability and b) writing ability, for example, bilingual tutors, native speaking tutors and
intensity of tuition?
Part C: Performance testing
1. How valid is the learners’ self-rating of their literacy assessment when actual
performance is judged by their tutors?
2. How can language proficiency at low-level and pre- literacy stages be conceptualised so
that it may apply to adult learners needing survival and social literacy skills in English
in the NZ context?
3. Can low-level English literacy skills be meaningfully assessed and measured in terms of
performance on a range of authentic and communicative tasks?
4. Can oral self-assessment of literacy skills be used as a valid alternative to actual
performance testing among low-level and pre- literate learners?
The research questions reflect the main focus of this study – the design,
development and use of measures of literacy gain among learners who are studying English
language literacy skills in order to survive in the NZ context. It is important to
acknowledge that the learners involved come from disadvantaged backgrounds with a
history of pre- or low-level literacy in their first language. In addition they are highly likely
to suffer from anomie, post-traumatic stress syndrome and gender bias in communities

50
where men are more likely to be educated and literate than women. The following
hypotheses were formulated from the research questions.
Hypotheses
1. There will be little measurable gain after 20 weeks of 2 hours per week. There will be
measurable gain for some learners after 20 weeks of 12 hours per week
2. Unfamiliarity with testing procedures and the low level of literacy makes classroom
testing challenging. It is hoped that self-assessment measures will show a significant
correlation with performance tests.
3. Research has identified various factors affecting language learning among immigrants
such as: previous level of education, literacy in L1, proficiency in oral English, literacy
in English, time of class, frequency of class, whether there is bilingual assistance or
teaching, size of class, gender, age, socio-economic pressures, employment status (in
prior countries and in NZ), access to classes (money, transport, childcare) and mental
health, including effects of previous trauma.
4. It is a strongly-held opinion among many involved in adult literacy that there can be no
formal measurement of progress at this level and that attempting to do so can be
counter-productive. Aspects such as learning about learning, self-confidence, enjoyment
of literacy, awareness of its value in their lives, ability to use skills for personal and
work reasons may equal in value any progress in measurable language and literacy
skills. This question is beyond the scope of the current research, but points the way to
further research that is of great importance.
Time span of project
The following table (Figure 1) sets out the time span of the literacy project. A year
was allocated to the project, with much of the design, development and trial of research
instruments taking place in the first half of 2001.

51
Figure 1 Timetable for research 2001 – 2002
March – July 2001 Initial Stages March - April Formulation of research proposal March – April Gathering of research team April – July Review of literature April – May Ethics approval April – June Development and pilot testing of assessment tools July – December Implementation July Revision of assessment tools July – August Confirmed classes for project July Ensure uniformity of administration of tests
Test 1 and Self-assessment 1 Personal and tutor profiles
August Data entry and initial analysis after each testing round September Self-assessment 2 December Test 2 and Self-assessment 3 July – October Case study research December 2001 – January 2002
Data analysis Report writing
Research participants
One hundred and eighteen students from refugee and immigrant backgrounds
participated in the classes. Sixty-two students completed most aspects of the research
except the final writing tests, which 55 students completed. Students were representative of
a range of language competencies. Some students were literate in their first language whilst
others were pre- literate both in their first language and in English. Thus, the outcomes in
terms of progress in literacy and English were expected to be different.
The English classes participating in the project were confirmed in 2001. The
students on the programme came from a range of ethnic backgrounds (see Table 3). They
were: Somali, Ethiopian, Afghani, Cambodian, Vietnamese, Chinese, Indian, Iraqi or of
Macao and Hong Kong origin. Tutoring in these classes was administered and delivered by
the West and South Auckland ESOL Home Tutor Schemes. The duration and timing of the
classes varied (See Figure 2). Some were 12 hours per week whilst others were two hours
weekly. The teaching delivery in three of the 12-hour classes and one 2-hour class was
bilingual. The remaining four classes were taught by native-English speakers. Two of these

52
were 12-hour classes and the other two were 2-hours each week. All classes ran for 20
weeks during the research and assessment cycle.
Table 3 Research participants
Class Teachers:
Bilingual/ English speaking
Student ethnicities
Student numbers enrolled
in classes
Student numbers
completing project
Contact time/ week
(hours)
Duration of course (weeks)
Time of course
A English Afghani, Somali
27 17 Mon-Thurs 9.30-12.30
20 weeks Morning
B Bilingual Ethiopian, Somali
18 7 Mon-Thurs 9.00-12.00
20 weeks Morning
C Bilingual Somali 25 9 Mon-Thurs 16.00-19.00
20 weeks Evening
D Bilingual Ethiopian 8 0* Wed 17.30-19.30
20 weeks Evening
E Bilingual Ethiopian 9 6 Mon-Thurs 17.30-20.30
20 weeks Evening
F English Cambodian Vietnamese Iraqi Chinese
8 4 Wed/ Fri 13.30-14.30
20 weeks Afternoon
G English HongKongVietnameseCambodian Chinese
14 10 Wed/ Fri 12.15-13.15
20 weeks Afternoon
H English Indian VietnameseChinese Cambodian
12 9 Mon-Fri 9.00-11.25
20 weeks Morning
*One student completed the tasks but was excluded from sample as she was the only one in a two-hour bilingual class.
Figure 2 Classes established during research project
The classes involved in the project were: West Auckland: 3 x 12-hour/week classes, 1 x 2-hour/week class with bilingual teachers 1 x 12-hour/week class with an English teacher These classes had learners who spoke Amharic, Farsi, Pushto, Tigrigna and Somali as their mother tongues. All students in these classes had refugee backgrounds. South Auckland 1 x 12-hour/week classes 2 x 2-hour/week classes These classes were taught by an English speaker, and the students spoke Cantonese, Khmer, Vietnamese, Mandarin and Hindi as their mother tongues. Students were new immigrants.

53
Research participants: Case studies
Several factors influenced the case study sample selection. The research team felt
that it would be most useful to interview students and tutors from the 12-hour weekly
classes, as the more substantial provision was expected to accelerate student progress, and it
was anticipated that availability for interviews would be enhanced. This also facilitated an
exploration of the impact of bilingual and native speaker programme delivery and student
response. In addition, the choice of two contrasting groups - a community-based, Somali
bilingual class for refugees in West Auckland, and a South Auckland group consisting of
students from a variety of language groups and backgrounds - informed the qualitative
analysis of the impact of factors such as the extent of prior education, first language
literacy, ethnic background and the similarity of first language script to that of English.
Thus a class comprising 15 Somali and Ethiopian women studying English language
and literacy in a 12-hour, bilingual day class at Wesley Intermediate School in Mt Roskill
(Class 1) was selected for inclusion in the study. The second class (Class 2), located at the
South Auckland Home Tutor Scheme in Papatoetoe, consisted of men and women from
Vietnam, Cambodia and China. This group was led by a native English-speaking tutor.
The selection of students was based on the typical sampling model devised by Burns
(1994:465). He recommended the selection of three cases representative of the range of
attainment. He argued that these cases would demonstrate the profiles of students who were
least and most likely to succeed. Thus the highest, lowest and average achievers in the first
tests were selected from both classes.
Attention was also paid to ensuring that the students interviewed matched the
balance of ethnicities as well as the gender balance of the entire sample. The major ethnic
groups were Somali and Vietnamese. Three Somalis, two Vietnamese and one Cambodian
students were interviewed. Four women and two men were interviewed.
All of the women selected in Class 1 were Somali1. Two were aged over 50 and one
was between 21 and 30 years old. Time spent in NZ ranged from less than one year to
1 The Ethiopian students in Class 1 were excluded from the study as they were unable to participate in the Somali bilingual component of the programme. Tutors did, however, use Arabic to communicate with them.

54
between three and five years. The women had had no previous education and were from
refugee backgrounds.
In Class 2, two of the participants were male and one was female. Two were from
Vietnam and one was from Cambodia. All had received six to eight years of education
previously and had arrived in NZ less than one year previously. One student was aged
between 21 and 30, one was aged between 31 and 40 and one was over 50 years.
Participants had arrived under the Family Reunification programme.
Research methods
Various research methods were used in this project to enable the gathering and
processing of the comprehensive data needed to answer the research questions.
Personal profiles: Tutors (See Appendix 2)
Personal profiles of the tutors’ backgrounds provided valuable information on the
tutors who were teaching the literacy classes. These questionnaires were self-administered
by the tutors.
The bilingual tutors were bilingual in English and the predominant language of the
class they were teaching. In the tutor profiles, both bilingual and English-speaking tutors
identified the variables known to affect language proficiency among immigrants (age at
time of arrival, length of residence, home language, literacy levels in their mother tongue or
first language, educational background). In addition, they were asked about their
qualifications and teaching experience. Finally, they were asked to state the positive aspects
of the literacy programme they were participating in and the classes they were teaching, and
to identify areas in which they felt they needed further support.
Personal profiles: Students (See Appendix 3)
The use of personal profiles in the form of a questionnaire in the project determined
the background of the students involved in the survey and gave the researchers an

55
indication of some of the variables which may affect student rate of progress. These profiles
were administered verbally by tutors when necessary, with the help of the interpreters.
In the current study, the student profiles gave tutors and researchers access to
student information which helped to inform the methods and content of their teaching, and
which may prove to affect literacy gains. Independent variables included age, gender,
length of stay in NZ, place and period of stay elsewhere, educational background, and
change in occupation. Profiles also gave some indication of the current proficiencies of the
students in their own language, their language learning experiences, and the literacy level at
which they assessed their language skills in their first and subsequent languages. This data,
if it informs teaching, invariably empowers students and teachers to negotiate an
understanding of what is needed and necessary in the curriculum. It also helps researchers
to gather a maximum amount of useful data, to give structure to a study, particularly at the
beginning stages, and makes coding and data analysis easier (see Shameem, 2001).
Self-assessment (See Appendix 4)
Validation of self- report proficiency data is necessary, given the drawbacks
associated with it. In fact, caution in interpreting self-report data has been advised by
several writers who have been involved in research in this area (see for example, Nicholas,
1988; Martin-Jones, 1991; Shameem, 2001). Martin-Jones (1991:50) advises that this is
particularly so in bilingual and multilingual communities, where language use does not
necessarily fall into neat little patterns of complementary distribution across domains.
Nicholas (1988) suggests that crosschecks on self- reported data are especially
desirable in multilingual communities and gives as an example a study of the Creole-
speaking community in Britain. In this study, the quality and reliability of the data had
unavoidable limitations because, as with the students involved in the current study, the
Creole-speaking community has an uncertain political and social status in the host
community.
In the self-assessment scales which were designed, the specific areas covered were
the self-reports of reading and writing abilities, which included numeracy as a component.
Self-reported literacy ability was rated on a scale according to the real- life tasks that could
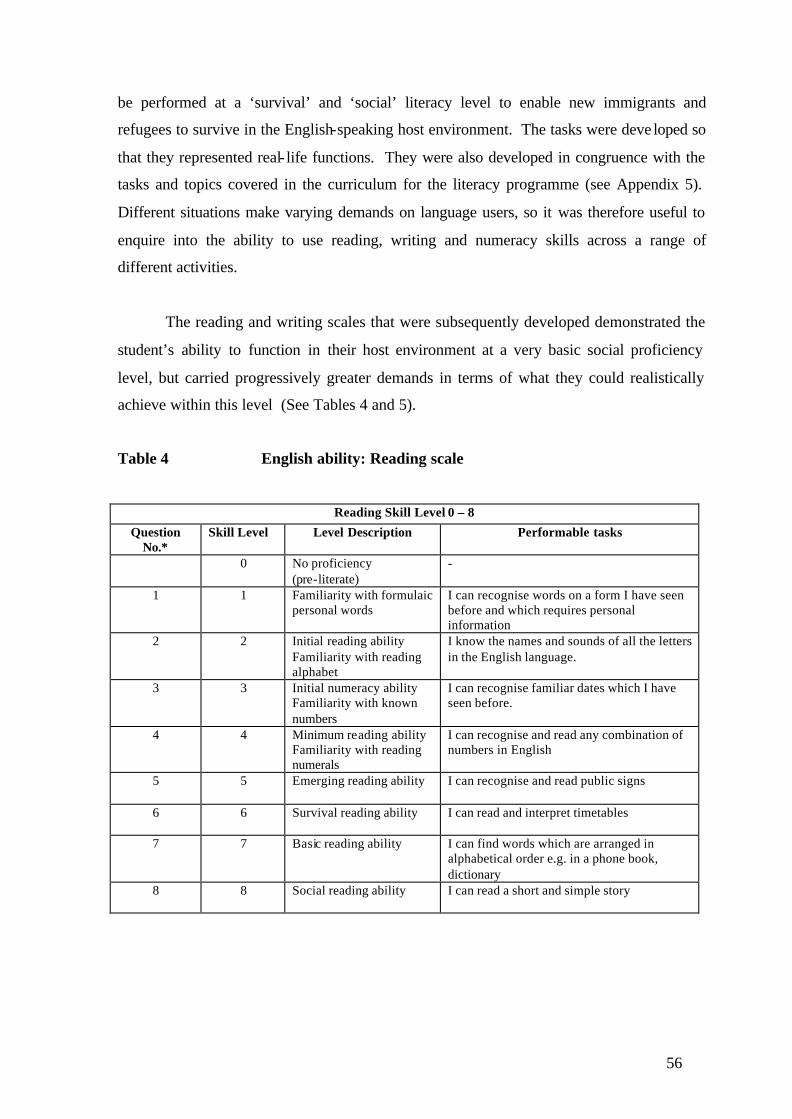
56
be performed at a ‘survival’ and ‘social’ literacy level to enable new immigrants and
refugees to survive in the English-speaking host environment. The tasks were deve loped so
that they represented real- life functions. They were also developed in congruence with the
tasks and topics covered in the curriculum for the literacy programme (see Appendix 5).
Different situations make varying demands on language users, so it was therefore useful to
enquire into the ability to use reading, writing and numeracy skills across a range of
different activities.
The reading and writing scales that were subsequently developed demonstrated the
student’s ability to function in their host environment at a very basic social proficiency
level, but carried progressively greater demands in terms of what they could realistically
achieve within this level (See Tables 4 and 5).
Table 4 English ability: Reading scale
Reading Skill Level 0 – 8
Question No.*
Skill Level Level Description Performable tasks
0 No proficiency (pre-literate)
-
1 1 Familiarity with formulaic personal words
I can recognise words on a form I have seen before and which requires personal information
2 2 Initial reading ability Familiarity with reading alphabet
I know the names and sounds of all the letters in the English language.
3 3 Initial numeracy ability Familiarity with known numbers
I can recognise familiar dates which I have seen before.
4 4 Minimum reading ability Familiarity with reading numerals
I can recognise and read any combination of numbers in English
5 5 Emerging reading ability I can recognise and read public signs
6 6 Survival reading ability I can read and interpret timetables
7 7 Basic reading ability I can find words which are arranged in alphabetical order e.g. in a phone book, dictionary
8 8 Social reading ability I can read a short and simple story

57
Table 5 English ability: Writing scale
Writing Skill Level 0 – 8
Question No.*
Skill Level Level Description Performable tasks
0 No proficiency (pre-literate)
-
10 1 Alphabet recognition I can write the upper and lower case letters of the alphabet
11 2 Initial writing ability I can write my name, address, age and the names of my family members.
12 3 Observation of writing conventions
I know when to use capital letters and full stops
13 4 Minimum writing ability Initial numeracy ability
I can write dates – days of the week, months of the year, and numerals
14 5 Emerging writing ability I can write a short letter of explanation on a personal matter.
15 6 Survival writing ability I can take/write down a phone message
16 7 Basic writing ability I can write a short piece about my personal experience and life in NZ
17 8 Social writing ability I can write a personal journal entry and keep a diary
* These question numbers correspond to question numbers on self-assessment forms and tests.
The self-assessment procedures were conducted orally at three points in time by the
tutors who were teaching each class. Interpreters were used when necessary. One self-
assessment was at the start of the programme, the second in the middle, and the final one
was held prior to the final test.
The scale used was a five point literacy one with students circling their perceived
ability on a scale of zero (I cannot do this at all) to five (I can do this very well) in
performing a range of progressively difficult literacy functions. The scale had reading and
writing parts with eight performable language functions in each one (see Appendix 7 for
descriptors).
The three self-assessments were identical. Students did not, however, look at their
earlier assessment of perceived ability when filling out the mid-point and final assessments.
Varying self- report scales differ, depending on whether learners have access to their earlier
responses and perceptions when rating their proficiencies longitudinally. In the English
Language Institute Proficiency Scale (1992) for instance, students of English report their
perceived proficiency during a 12-week intensive English programme three times during
the course. In the mid and end-of-term self-assessments they have access to their earlier

58
reports, so they are able to make a relative judgement of perceived progress. Shameem
(1995) on the other hand, during her longitudinal study of Indo–Fijian teenagers' language
proficiencies, did not supply her respondents with their earlier self-assessments.
Performance assessment (See Appendix 14)
To validate the data that was gathered from the self-report study, a performance test
was designed and administered to all the students involved in the project. As in any kind of
assessment, one can at best make judgements only about the communicative performance
of the respondents, which may or may not be a true reflection of their language abilities
(see Bachman, 1990:37). Hakuta and D’Andrea (1992) acknowledged this problem in their
Spanish/English tests with Mexican-background high school students in the United States,
when they wrote that the test performance of their respondents could not really indicate
their true potential.
The assessment was influenced by a number of practical and theoretical difficulties
involved in the development of an assessment procedure which would yield valid and
reliable data. The researchers were especially constrained by the literacy levels of the
students involved, since these ranged from pre- literacy, even in their first language, to
varying degrees of survival and social literacy ability in English. Moreover, the students
were unlikely to have ever participated in any form of literacy assessment, consequently,
the procedure had to appear non-judgemental and non-threatening, be closely tied to the
teaching and learning programme, take up a minimum period of time and be easy to
implement by both bilingual and English-only tutors, while being sensitive to the differing
abilities expected among the refugee and first-generation new immigrants participating in
this study. Given that the bilingual tutors may have had little experience in administering
English language literacy tests, instructions and rating procedures had to be clear and easy
to follow and use. Several training sessions prior to and following the performance
assessments needed to be held in order to ensure test administration and rating were
consistent across all the sites involved.
The test contained the realistic survival functions enquired about in the self-
assessment procedures. These were tasks that the students were likely to meet in their day-
to-day lives in NZ, which they needed to understand and respond to when the situation

59
demanded. A table of specifications was drawn up at the start of the test-writing process to
ensure congruence between the two performance tests that were devised and which were to
be administered at the start and the culmination of the program of study (see Appendix 6).
The test specifications, which were confidential to the test development team, cover
all aspects of the testing process, including the test design and development, administration,
and rating. It identifies the test takers and implementers, the methods of administration, the
possible content and topics to be covered, the mode of delivery, the objectives and the
rating procedures. Further performance scale descriptors were developed for delivering
comprehensive feedback to students on their performance level and its implications in terms
of directing their future learning (see Appendix 7).
In addition, a test syllabus (see Appendix 8) gave clear criteria on the content,
timing and instructions of the test, and the information was made available to all the tutors
and participants prior to the testing process. Tests were administered by the class tutors
during class time, and it is acknowledged that differences in test environment and test
administrators might have influenced performance on these tests. Appendix 9 gives a tutor
account of the test-taking processes and reactions in a class taught by an English-speaking
tutor. Bachman (1990) refers to social and environmental characteristics which influence
test results as ‘test method facets’, and some of these pertinent variables were used to look
at differences in performance in the study. However, it is difficult to attribute differences in
performance to any one factor, as the situation for each class participating in the study
varied greatly – from the ethnicity, age and educational background of the students to the
level and language of literacy at which they began their programmes. At best we can only
make assumptions about degree of progress, which is indicated by comparing individual
results. All results were recorded on a record sheet (Appendix 10), which made later
reporting and data entry easier.
Case studies (See Appendix 11)
The researcher met with the tutors of both classes prior to the commencement of the
project. The qualitative component of the project was explained, and samples of the
interview questions and the classroom observation schedule were distributed. Discussion
and feedback was encouraged. Once the procedures were understood and agreed to, the

60
tutors were asked to speak to the proposed participants to brief them on the process.
Appropriate interpreters for the student interviews were arranged. Dates were established
for the tutor interviews and classroom observations. Interview and observation schedules
for the case studies are included in Appendix 11.
The first method of data collection was one-to-one, face-to-face interviews with
students via an interpreter. The interview schedule consisted of open-ended questions.
These focussed on the reasons for studying, perceptions of progress and the outcomes of
learning literacy and English in terms of coping with life in NZ. Three students from each
class were selected in accordance with the sampling technique detailed earlier. The
interviews were conducted in the students’ classrooms and were of approximately 30
minutes’ duration. They were supported by an interpreter in all cases. The interpreter
translated the interviewer’s questions and the participant’s responses. Each interview
commenced with the reiteration of the informed consent process (see section on Ethics
concerns). The purpose of the interview was explained to all students, and assurances were
given regarding their anonymity and the confidentiality of the discussions. Participants
were asked if it was acceptable to tape-record the interviews and, in all but one instance,
they agreed. At the conclusion of the interviews, students were asked if they had any
questions.
Subsequently, tutor interviews were conducted at the two teaching locations. The
English language was used and the conversations were recorded. The questions explored
the tutors’ definitions of literacy, philosophies of English teaching, choice of appropriate
teaching methodologies, anticipated course outcomes and the range of assessment
techniques used. The discussions were generally less structured and more wide-ranging
than the student interviews.
To succeed in efforts to achieve triangulation of data collection, the second research
method used was classroom observation. The observations of Classes 1 and 2 were based
on an adaptation of the COLT model (see Fröhlich & Spada, 1995). This provided the basis
for the observation and analysis of the English and literacy classrooms, and activities
therein. Each class was observed once, for 1.5 hours.

61
Test trial
Trial of personal profiles and self-assessment
They were conducted with all the literacy classes in the first semester of 2001, and
were undertaken during the week 19-23 March.
Changes made
The personal profile was looked at by a statistician and changes were made to
ensure responses were more consistent and easier for coding and analysis. The 0 – 5 self-
assessment needed to be reversed to fit with performance assessment scoring procedures,
and the number of functions that students were asked to rate their abilities on was reduced.
Trial of performance assessments
Also in the first semester, a trial of performance tests and procedures was conducted
with classes at UNITEC during a short, ‘English Plus’ course in Reading and Writing for
Farsi speakers, taught by a native English tutor and a Farsi-speaking tutor. The students
were Farsi speakers from Iran and Afghanistan. The course was eight weeks long and ran
for eight hours per week. It was for refugees who did not have access to mainstream
courses because of their low literacy skills in English. The aim was to prepare them to
move into elementary classes.
The reading and writing trials were conducted on 19th and 20th June, 2001. The
tutors were trained in test administration procedures prior to the testing process. On each
occasion, the bilingual tutor conducted half the test, followed by the native-speaking tutor.
Changes made
For this trial, the general instructions for all the tests were given at the training
session, with specific instructions given again before each test. The tutors, however, did
not refer back to the general instructions, which led to some inconsistencies. Therefore all

62
the instructions were included on the tutor’s page for each test. For every test, a model
answer was included and testers were instructed to refer to these.
Reading test (see Appendix 14)
Test Item 1: the instructions for this were re-done because students wrote the answers in
full, instead of writing in the number only.
Test Item 2: this was re-done to make 90% of it an exercise that could be done as a class
(rather than all of it being done individually).
Test Item 4: the scope of this was reduced to include a narrower range of questions and
expected responses.
Writing test (see Appendix 14)
Test Item 10: the instructions were expanded, as the bilingual tutors were not familiar with
this process.
Test Items 14,16,17: the marking criteria and process were clarified.
Test Item 15: the tape and exercise were redone to make it more realistic for this level.
Ethics concerns
Ethical considerations were particularly important in this survey, since the literacy
project involved learners who came from disadvantaged, minority- language backgrounds;
had suffered great personal losses in their exodus from their home countries, often via
refugee camps in other, perhaps hostile, nations; and who might continue to suffer from
post-traumatic stress syndrome. Many were pre-literate even in their first language and
lingua franca, and had very little formal education in their background. For many, the
transition to NZ culture and society, and the effort of learning a new language, even for
aural and oral communicative purposes had been recent, painful and difficult. Consequently
their time in NZ was a story of financial struggle, further social upheaval and great
adjustments. Given that the students who participated in the project might be continuing to
face feelings of powerlessness and anomie, it was important that they be treated with
openness, sensitivity and honesty. The project was given the approval of the UNITEC
Research Ethics Committee after they had studied all aspects of the design of the
instruments and the methods to be used.

63
Information sheets (See Appendix 12)
Informed consent is one of the most fundamental ethics requirements, and the
student and tutor participants in the project were first of all given sufficient information on
the background and purpose of the research to enable them to make a decision whether to
participate in the project.
The information sheet explained to participants their own roles in the project; who
else was involved; and the methods that would be used to collect information. It promised
confidentiality and gave contact numbers for each of the researchers who were involved, in
order to enable participants to contact them for further clarification if they so wished.
All the information on the sheets was explained verbally to the student participants
by interpreters and bilingual tutors prior to the commencement of the project. Tutor
information was given in writing to the tutors. This also explained the background and
purpose of the project, but more specifically - so that tutors were able to understand their
own roles but also the function and purpose of the research instruments - the personal
profiles, the case studies and classroom observation components. Responders were advised
about how and when they would receive the results of the assessment procedures.
Consent forms (See Appendix 13)
Once the students and tutors had thoroughly understood the background and
implications of the project, they were asked to sign consent forms, to make their
participation official and to safeguard the interests of the participants and researchers.
Students and tutors were assured anonymity and were told that all names used in the
project would be fictitious or would use untraceable identity numbers. All consent forms
were returned to the researchers through the tutors and have been filed as required by the
UNITEC Research Ethics Committee for a period of at least six years.

64
Issues arising that imposed limitations on the project
Continuity of students
Students signing the consent form indicated their willingness to attend classes and
take the required assessment tests. However, the classes were drawn from people who live
with many external pressures and a lot of uncertainty in their lives. There was a high risk
of numbers falling off during the duration of the research project. On the other hand, the
target number for the research was 50 and 118 students had enrolled on the programme.
Availability of bilingual tutors
Four of the classes were taught by bilingual EAL tutors. There is a very limited
pool of such tutors and if any of the tutors had dropped out, it is unlikely that we could have
replaced them with another bilingual tutor. The class would have had to be taught by a
native speaker, and this could have affected attendance and the outcomes of the class.
Fortunately, this was not the case, as tutors remained with their original classes for the
duration of the project.
Time of day constraints
It was difficult for literacy tutors to be available for the possible hours during the
day. Literacy teaching tends by nature to be part-time and it is difficult for tutors with
families to commit to part-time in secure work as a priority over more secure employment.
The classes offered in the day had the highest number of women learners attending.
Ramadhan
The time frame for the whole project was not ideal. To meet project deadlines,
classes ran from July to December. Ramadhan in 2001 occurred between November 17th
and December 16th. The daytime fasting and related evening festivities affected both
attendance and progress, especially for the daytime classes. Although adjustments were
made with assessment schedules, because of the 30-day Ramadhan period, this was not
always easy to do.

65
Cultural and social resistance to self-assessment and testing
There was some resistance to self-assessment because of the unfamiliarity of the
method and its need to "speak well of yourself". Students were not used to being 'tested' as
such and therefore maintaining a 'test' environment during the formal testing sessions was
extremely difficult - tutors reported a lot of 'talking' going on (despite attempts to stop
them) during the test sessions and bilingual tutors reported student attempts to 'collaborate'
to show that they were competent in the set tasks (see Appendix 9). However, there seemed
to be less collaboration in the final tests than in the initial ones showing that students had
learnt something about the test-taking process over the 20 weeks.
During the final tests too there was a death in the Somali community, and
consequently tests were held a week later for the half that had missed the final tests. There
would undoubtedly have been some cross-checking between the two groups regarding the
content of the test questions, as the class was closely-knit.
Data coding and analysis
The data was analysed for the classes involved in the study, and combined for
pertinent computations using the SPSS software. Analysis of the data was descriptive and
quantitative regarding the social and linguistic background of the students and their tutors,
student self-assessed literacy ability and test results. For the case study and observation
portions, data was analysed qualitatively. The key quantitative tests used were:
- The Kruskal Wallis test for ordinal data, which determined the significance of
the relationship between literacy levels and the major variables believed to
affect literacy, such as age at immigration, length of NZ residence, current age
and gender.
- The Wilcoxon Matched-Pairs Signed-Ranks test for non-parametric data, which
matched the three self- reports of literacy and then compared them to
performance in the initial and final tests for individuals. This was to establish the
validity of the self-report scales. This test also established whether high literacy
levels in the first language were matched with higher literacy achievement in
English.
66
- The Fisher Exact Chi-square test for nominal data determined the existence and
strength of association between two variables, for example, home language use
and age or length of residence.
- Spearman Correlation Coefficient test which measured the strength of the
relationship between two variables, for example, reported and assessed literacy
levels at the beginning and end of the programme.
- Independent Samples T-test compared means for two groups of cases. The
subjects were assigned to two groups so that any difference in response was due
to treatment and not to other factors. For example, assessment results of a group
taught by bilingual tutors were compared to a group taught by English-speaking
tutors.
- Paired Sample T-test compared the means of two variables of a single group. It
computed the differences between values of two variables for each case and
tested whether the average differed from zero. For example, pre-and post-
programme test results for a group of students.
A p-value of 0.05 was the standard measure for statistical significance in this study.
Summary: Methodology
The most important aspect of the methodology used in this project was the
formulation of the aims, and subsequently, the research questions. The hypotheses were
formed by evaluating the research questions in relation to the nature of the programme and
the research participants.
The research instruments included a student personal profile which also functioned
as a needs analysis of the research participants, and a tutor profile for both English-
speaking and bilingual tutors. Next, self-assessment forms were designed so that students
could initially evaluate their literacy ability on a range of increasingly-difficult authentic
'survival' literacy tasks. Self-assessments were conducted at three points in the programme -
beginning, middle and end - to look at changes in perceived progress or otherwise.
Two parallel performance tests with tasks which were congruent to those on the
self-assessment forms, were designed, developed and trialled. These were administered at

67
the beginning and end of the literacy programme. In addition to the assessment measures,
case studies were conducted in two classrooms at the West and South Auckland sites. One
of these was led by a bilingual tutor and the other by a native English-speaking tutor.
The final component of the research methodology was the use of an observation
schedule to note differences and similarities in the two case study classrooms. Ethics
concerns were of utmost importance in this project, and information sheets were given out
to all participants, who subsequently signed the accompanying consent forms. Data
analysis took both descriptive and analytic procedures into account.

68

69
Sunday Star Times (ellison)
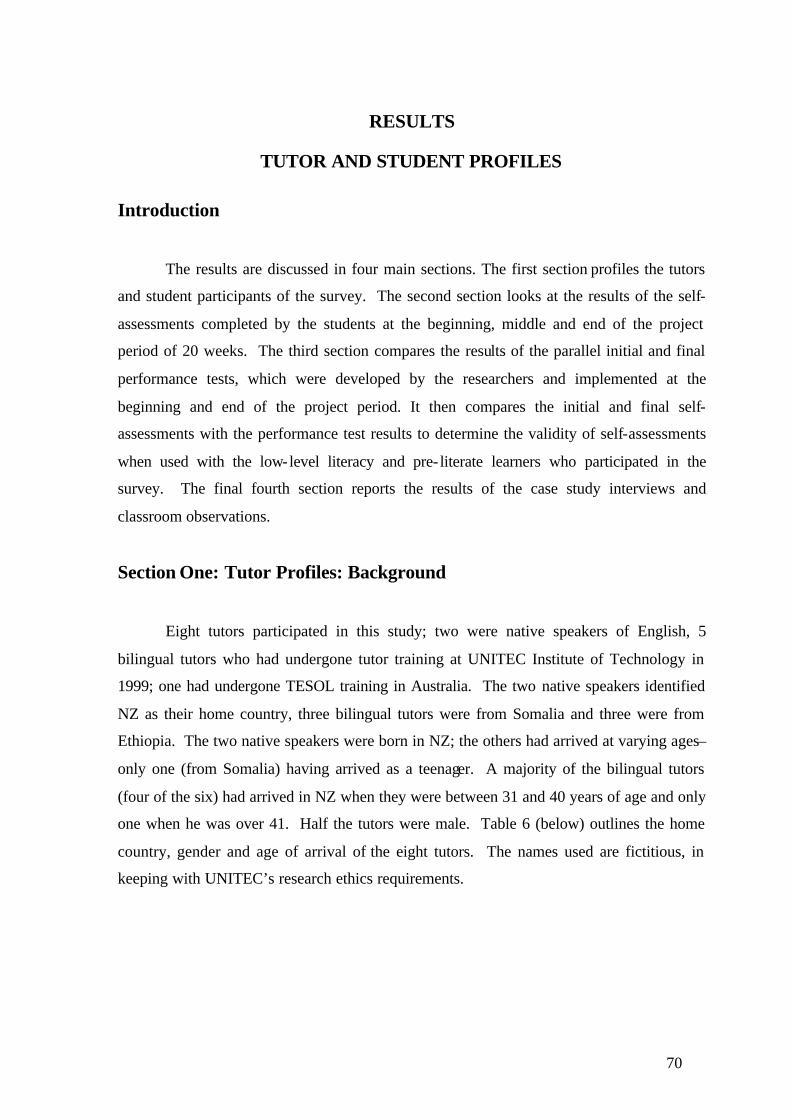
70
RESULTS
TUTOR AND STUDENT PROFILES
Introduction
The results are discussed in four main sections. The first section profiles the tutors
and student participants of the survey. The second section looks at the results of the self-
assessments completed by the students at the beginning, middle and end of the project
period of 20 weeks. The third section compares the results of the parallel initial and final
performance tests, which were developed by the researchers and implemented at the
beginning and end of the project period. It then compares the initial and final self-
assessments with the performance test results to determine the validity of self-assessments
when used with the low-level literacy and pre- literate learners who participated in the
survey. The final fourth section reports the results of the case study interviews and
classroom observations.
Section One: Tutor Profiles: Background
Eight tutors participated in this study; two were native speakers of English, 5
bilingual tutors who had undergone tutor training at UNITEC Institute of Technology in
1999; one had undergone TESOL training in Australia. The two native speakers identified
NZ as their home country, three bilingual tutors were from Somalia and three were from
Ethiopia. The two native speakers were born in NZ; the others had arrived at varying ages–
only one (from Somalia) having arrived as a teenager. A majority of the bilingual tutors
(four of the six) had arrived in NZ when they were between 31 and 40 years of age and only
one when he was over 41. Half the tutors were male. Table 6 (below) outlines the home
country, gender and age of arrival of the eight tutors. The names used are fictitious, in
keeping with UNITEC’s research ethics requirements.

71
Table 6 Tutor profiles
Name Gender Home Country Arrival Age
Jane F New Zealand Born in NZ
Joan F New Zealand Born in NZ
Siffat F Somalia Less than 20 years
Amira F Somalia 31-40 years
Hamid M Somalia 31-40 years
Khizer M Ethiopia 31-40 years
Ameen M Ethiopia 31-40 years
Reyhan M Ethiopia 41-50 years
Language proficiency data among immigrants shows that age at time of arrival is a
significant factor in contributing both to language acquisition of the host language and
language shift of the mother tongue (Clyne, 1975; Shameem, 1995). Generally, those who
arrive in the host community before 10-12 years of age tend to replace their mother tongue
skills with the host language. This was not likely to be the case with the bilingual tutors
participating in this project, as the youngest, Siffat, was older than the threshold age of 10-
12 years when she arrived here. Given this scenario, the concern would be that host
language acquisition was at the point where the tutors were comfortable in order to teach
English language literacy rather than be concerned about mother tongue maintenance. It
would be more likely that host language acquisition is linked to age and length of residence
in an English-speaking environment. This data is described in Table 7 (below).
The tutor who had arrived in NZ as a teenager was now in her 20s. The other tutors
were all over thirty years of age. One of the two over 50 and one of the three in their 40s
were native English speakers. This being the case, it could be expected that all the tutors
would be fluent users of their first language which, considering all are currently literacy
tutors, would include literacy ability. The question related to their first language
proficiency in all four skills was asked later in the questionnaires.
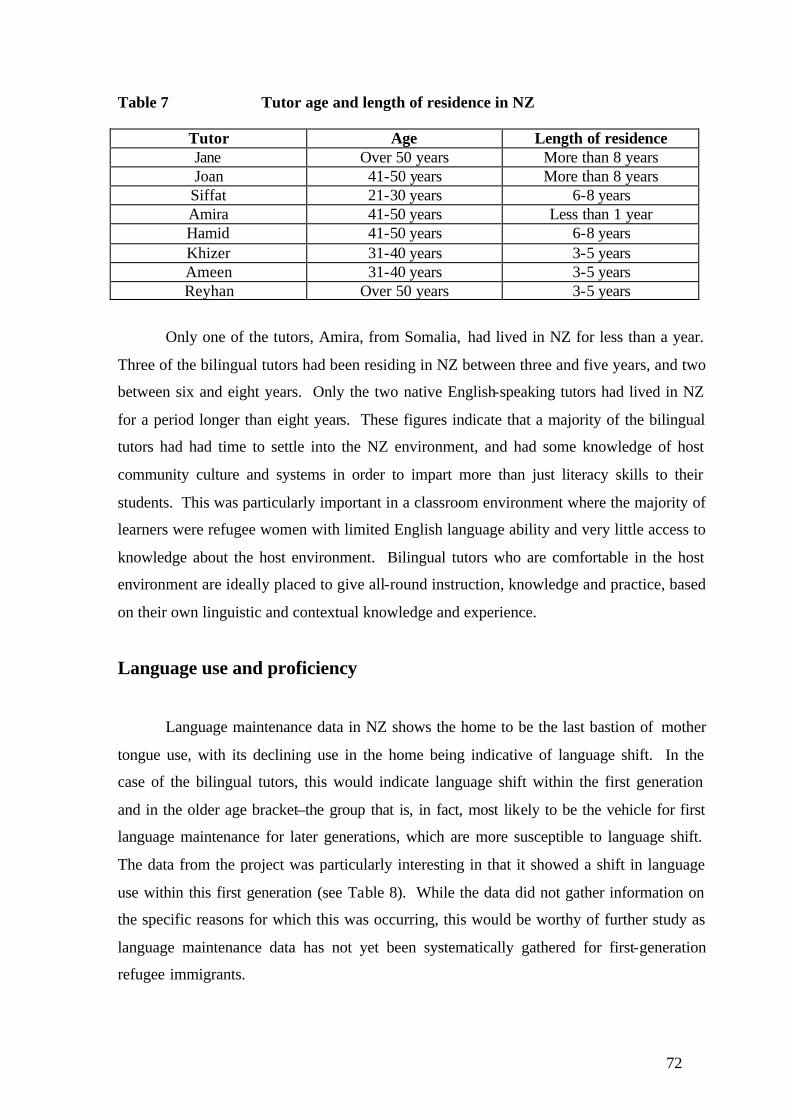
72
Table 7 Tutor age and length of residence in NZ
Tutor Age Length of residence Jane Over 50 years More than 8 years Joan 41-50 years More than 8 years Siffat 21-30 years 6-8 years Amira 41-50 years Less than 1 year Hamid 41-50 years 6-8 years Khizer 31-40 years 3-5 years Ameen 31-40 years 3-5 years Reyhan Over 50 years 3-5 years
Only one of the tutors, Amira, from Somalia, had lived in NZ for less than a year.
Three of the bilingual tutors had been residing in NZ between three and five years, and two
between six and eight years. Only the two native English-speaking tutors had lived in NZ
for a period longer than eight years. These figures indicate that a majority of the bilingual
tutors had had time to settle into the NZ environment, and had some knowledge of host
community culture and systems in order to impart more than just literacy skills to their
students. This was particularly important in a classroom environment where the majority of
learners were refugee women with limited English language ability and very little access to
knowledge about the host environment. Bilingual tutors who are comfortable in the host
environment are ideally placed to give all-round instruction, knowledge and practice, based
on their own linguistic and contextual knowledge and experience.
Language use and proficiency
Language maintenance data in NZ shows the home to be the last bastion of mother
tongue use, with its declining use in the home being indicative of language shift. In the
case of the bilingual tutors, this would indicate language shift within the first generation
and in the older age bracket–the group that is, in fact, most likely to be the vehicle for first
language maintenance for later generations, which are more susceptible to language shift.
The data from the project was particularly interesting in that it showed a shift in language
use within this first generation (see Table 8). While the data did not gather information on
the specific reasons for which this was occurring, this would be worthy of further study as
language maintenance data has not yet been systematically gathered for first-generation
refugee immigrants.

73
Table 8 Home language use
Language Frequency
Mainly English 2 (NZ-born tutors) Both English and my language 4
Mainly my language 2
Four of the six bilingual tutors were using both English and their own language at
home. Of the two bilingual tutors who continued to use mainly their own language, one
was in the 31-40 year age group, the other was in the 41-50 year group.
An important issue in literacy study and research is that of the writing script used in
the first language, and whether it uses Roman letters - making it easier to learn literacy
skills in English. Of the six tutors who had first languages other than English, the three of
Somali background used the English script, while the two who had Amharic and one who
had Tigrigna as first language (and listed Amharic as their second) used a different script.
Hence, the latter three who taught students from their own backgrounds would probably
have greater difficulty with teaching literacy skills as writing the alphabet would be a skill
they would specifically teach, while Somali tutors may not have to with their literacy
students. Although with pre-literate students the issues would be the same, Somali students
would probably still have a greater ability to recognise the alphabet if they have been
exposed to any written material such as public signs in their first language background.
The tutors who participated in the project had a diversity of languages in their
speech repertoire. Only one tutor was a monolingual English user. The bilingual tutors
ranked English as their second, third or fourth language (see Table 9).
Levels of proficiency in their second language differed. Of interest here was that the
two Amharic first language users listed Tigrigna as their second language with only one of
them stating their level of proficiency as 5 in all four-skill areas. The tutor who used
Tigrigna as his first language was equally proficient in Amharic, his second language. The
nature of bilingualism, and the purposes for which these two languages are used would
make worthwhile study among the Ethiopian refugee population.

74
For most of the Somali tutors, English was the second language, with one
nominating Italian as their second language. Arabic also featured as a third or fourth
language with four of the tutors, testifying to the important role of the religious language in
their speech repertoire. As NZ language data shows, for maintenance purposes and the
learning of languages other than English, immigrant parents often prefer their children to
learn the religious language (for example, Sanskrit, Urdu, Arabic) rather than their first
language (Shameem, 2001). Whether this will be the case among the NZ Islamic refugee
population has yet to be established, and has obvious implications for the maintenance and
roles of Somali, Amharic and Tigrigna.
Other languages known by the tutors at Level 1 in various skill areas included
French, German and Hindi. Table 10 outlines the means and standard deviations of the
various languages known by the tutors.
As Table 10 shows, the mean value in all four skill areas in the first language is
consistently placed at 5, with a standard deviation of 0. The mean values vary in subsequent
languages, with the lowest values recorded for the literacy skills. Figure 3 graphically
represents the differences in mean proficiency levels over the four skill areas in the first
three languages known by the tutors.

75
Table 9 Language proficiency in languages known by tutors on literacy project
H
amid
Som
ali
5 5 5 5
Italia
n
4 4 4 4
Ara
bic
4 3 4 4
Engl
ish
3 2 3 4
Am
een
Am
haric
5 5 5 5
Tigr
igna
4 4 3 3
Ara
bic
4 4 0 0
Engl
ish
5 5 5 5
Am
ira
Som
ali
5 5 5 5
Engl
ish
5 5 5 5
Ara
bic
5 5 5 5
Hin
di
1 1 - -
Rey
han
Am
haric
5 5 5 5
Tigr
igna
5 5 5 5
Engl
ish
4 4 4 3
Joan
Engl
ish
5 5 5 5
Khi
zer
Tigr
igna
5 5 5 5
Am
haric
5 5 5 5
Engl
ish
4 4 5 4
Ara
bic
4 4 0 0
Jane
Engl
ish
5 5 5 5
Fren
ch
1 1 1 1
Ger
man
1 1 1 1
Siff
at
Som
ali
5 5 5 5
Engl
ish
3 3 3 2
Tuto
r
Firs
t lan
guag
e
Spea
k
Und
erst
and
Rea
d
Wri
te
Seco
nd la
ngua
ge
Spea
k
Und
erst
and
Rea
d
Wri
te
Thir
d la
ngua
ge
Spea
k
Und
erst
and
Rea
d
Wri
te
Four
th la
ngua
ge
Spea
k
Und
erst
and
Rea
d
Wri
te
Key: 5 = Very well , 4 = Well, 3 = Average, 2 = So-so, 1 = A little, 0 = Not at all

76
Table 10 Language proficiency
Proficiency First language Second language Third language Mean 5.00 3.86 3.67 Speak St. dev. 0.00 1.46 1.37 Mean 5.00 3.86 3.50 Understand St. dev. 0.00 1.46 1.38 Mean 5.00 3.71 3.17 Read St. dev. 0.00 1.50 2.14 Mean 5.00 3.57 2.83 Write St. dev. 0.00 1.62 1.94
N = 8 7 6
Figure 3 Mean proficiency levels of tutor languages
Of particular concern in this project was the level of proficiency in English of the
tutors, as they were involved in English literacy teaching. These levels are represented by
the graph in Figure 4. Four of the tutors rated their English proficiency levels at 5 for all
four skills. Two of these tutors were native English-speakers. The remaining four bilingual
tutors reported varying levels of English language proficiency in the four skills. While the
Mean prof i c i ency o f tu tor language
0
1
2
3
4
5
6
S p e a k U n d e r s t a n d Read Wr i te
Skills
Fi rs t language
S e c o n d l a n g u a g e
Th i rd language

77
graph represents reported proficiency level, it may also be indicative of the level of
confidence that tutors have in their own abilities.
Figure 4 Tutor English proficiency
Educational background
All eight tutors had attended an Institute of Technology in NZ. For the six bilingual
tutors this meant attendance at UNITEC, to participate in the bilingual tutor training
programme (see Table 11).
English proficiency of the tutors
0
1
2
3
4
5
6
1 2 3 4 5 6 7 8
Tutor
Speak
Understand
Read
Write

78
Table 11 Educational level of tutors
Educational background Frequency
Primary school - Secondary school 2 Institute of Technology 8 University 3 Other 2
Two of the tutors indicated that they had attended secondary school in other
countries, and three had been to university. One of these was a native English-speaking
tutor.
When asked what qualifications they held, the tutors indicated a wide range (see
Table 12 below). Most prevalent was a certificate, and these were certificates in language
teaching, teaching literacy, and teaching. All the tutors had some qualification in teaching
or language teaching, with one bilingual tutor having completed an MA in TESOL.
Table 12 Qualifications of tutors
Qualifications Frequency Percent
1,2 1 12.5 1,2,3,4, 1 12.5
2 3 37.5 2,3 1 12.5 2,4 2 25.0
Total 8 100.0 1=Informal qualification, 2=Certificate, 3=Diploma, 4 = Degree
The tutors also stated the length of any previous teaching experience they had, and
the locations at which they had taught. This data was quite difficult to code and analyse
quantitatively, as the nature, length and location of teaching experiences varied widely even
for individuals. Hence, for the purposes of this report, the data has been summarised into
areas of teaching experience, the average years spent in each by the eight tutors, and the
location at which the experience took place (see Table 13).
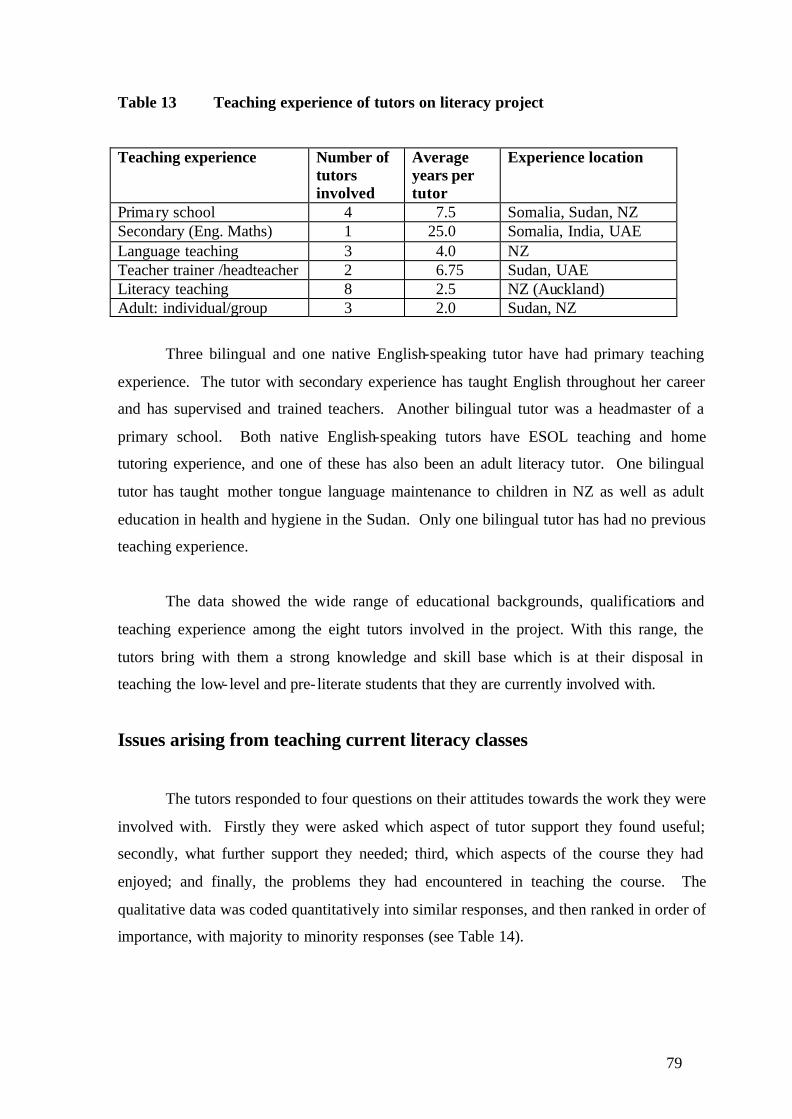
79
Table 13 Teaching experience of tutors on literacy project
Teaching experience Number of
tutors involved
Average years per tutor
Experience location
Primary school 4 7.5 Somalia, Sudan, NZ Secondary (Eng. Maths) 1 25.0 Somalia, India, UAE Language teaching 3 4.0 NZ Teacher trainer /headteacher 2 6.75 Sudan, UAE Literacy teaching 8 2.5 NZ (Auckland) Adult: individual/group 3 2.0 Sudan, NZ
Three bilingual and one native English-speaking tutor have had primary teaching
experience. The tutor with secondary experience has taught English throughout her career
and has supervised and trained teachers. Another bilingual tutor was a headmaster of a
primary school. Both native English-speaking tutors have ESOL teaching and home
tutoring experience, and one of these has also been an adult literacy tutor. One bilingual
tutor has taught mother tongue language maintenance to children in NZ as well as adult
education in health and hygiene in the Sudan. Only one bilingual tutor has had no previous
teaching experience.
The data showed the wide range of educational backgrounds, qualifications and
teaching experience among the eight tutors involved in the project. With this range, the
tutors bring with them a strong knowledge and skill base which is at their disposal in
teaching the low-level and pre- literate students that they are currently involved with.
Issues arising from teaching current literacy classes
The tutors responded to four questions on their attitudes towards the work they were
involved with. Firstly they were asked which aspect of tutor support they found useful;
secondly, what further support they needed; third, which aspects of the course they had
enjoyed; and finally, the problems they had encountered in teaching the course. The
qualitative data was coded quantitatively into similar responses, and then ranked in order of
importance, with majority to minority responses (see Table 14).
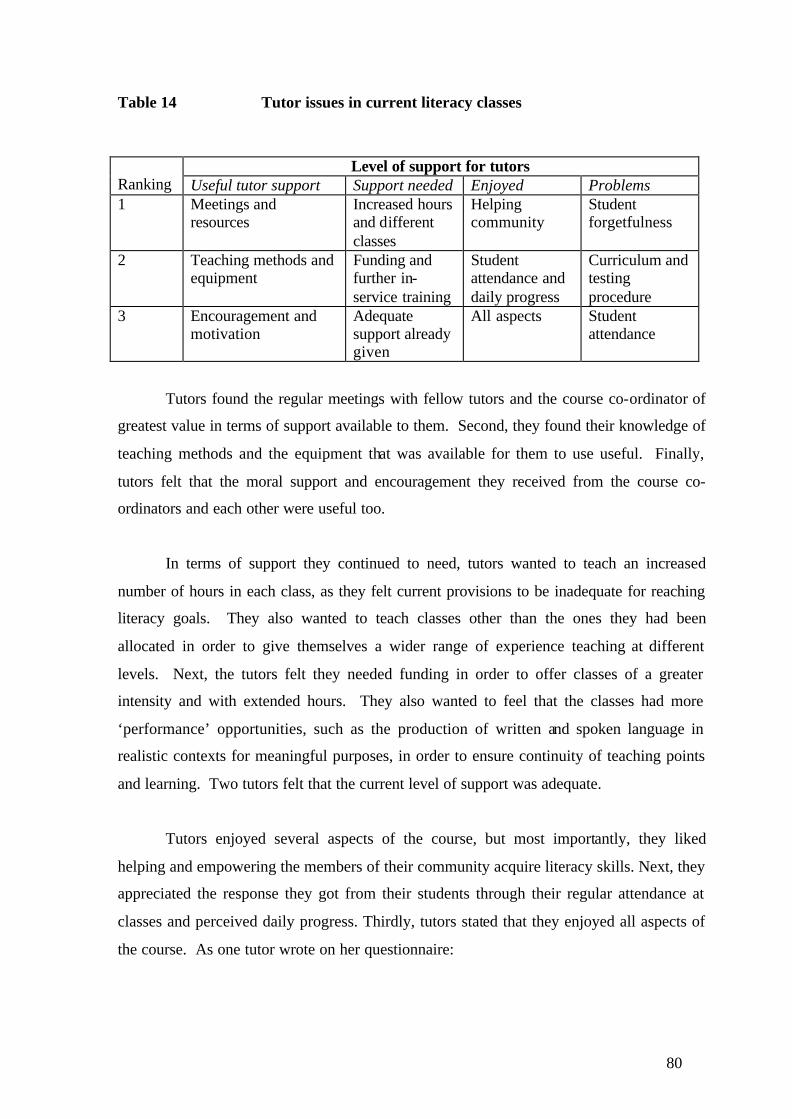
80
Table 14 Tutor issues in current literacy classes
Level of support for tutors Ranking Useful tutor support Support needed Enjoyed Problems 1 Meetings and
resources Increased hours and different classes
Helping community
Student forgetfulness
2 Teaching methods and equipment
Funding and further in-service training
Student attendance and daily progress
Curriculum and testing procedure
3 Encouragement and motivation
Adequate support already given
All aspects Student attendance
Tutors found the regular meetings with fellow tutors and the course co-ordinator of
greatest value in terms of support available to them. Second, they found their knowledge of
teaching methods and the equipment that was available for them to use useful. Finally,
tutors felt that the moral support and encouragement they received from the course co-
ordinators and each other were useful too.
In terms of support they continued to need, tutors wanted to teach an increased
number of hours in each class, as they felt current provisions to be inadequate for reaching
literacy goals. They also wanted to teach classes other than the ones they had been
allocated in order to give themselves a wider range of experience teaching at different
levels. Next, the tutors felt they needed funding in order to offer classes of a greater
intensity and with extended hours. They also wanted to feel that the classes had more
‘performance’ opportunities, such as the production of written and spoken language in
realistic contexts for meaningful purposes, in order to ensure continuity of teaching points
and learning. Two tutors felt that the current level of support was adequate.
Tutors enjoyed several aspects of the course, but most importantly, they liked
helping and empowering the members of their community acquire literacy skills. Next, they
appreciated the response they got from their students through their regular attendance at
classes and perceived daily progress. Thirdly, tutors stated that they enjoyed all aspects of
the course. As one tutor wrote on her questionnaire:

81
Before this year, my ESOL teaching has been two times one-hour lessons per week, per class. This
course has been a wonderful opportunity for me to teach for a longer duration on a daily basis. It has
been most rewarding to see the students’ daily progress, and to have the time to consolidate their
learning and to respond to the needs of the class as they arise. It has been pleasing to see all students
develop greatly in both confidence and oral communication (as well as literacy)! The students have
been very supportive of one another, and there has been a very pleasant team spirit.
The final question on the questionnaire required tutors to list the problems they had
on the course. A majority of tutors found student forgetfulness of skills and content a
difficulty. This may be partly due to the limited number of hours on the programme,
especially for the 2-hour classes. Next, tutors raised the issue of having clear curriculum
guidelines across all the classes. Although the current curriculum is literacy-based, tutors
felt they needed specific links to be drawn with topic, task-types and clear outcomes. The
testing procedures were also problematic for the duration of the project, mainly because of
test-taker unfamiliarity with tests in general and therefore lack of understanding about
content, purpose, methodology, and processes of testing. Ranked third under problems was
student attendance, and this was signalled too by the rate of student attrition during the
course of the project.
Summary: Tutor profiles
Eight tutors - two native English-speakers and six bilingual speakers - participated
in this project. All bilingual tutors had arrived in NZ as adults and had lived in NZ for
varying periods of time; the shortest period was a year and the longest, six to eight years.
Language use data showed some shift in the use of language at home among the
participating tutors. While four of the tutors (two of them native English-speaking tutors)
spoke their first language at home, four other tutors (all bilinguals) said they used their first
language in combination with English. This data warrants further investigation, as it is
fairly unusual for a newly immigrant adult population to shift so rapidly in their use of the
home language.
Language proficiency data showed that while all the tutors rated their proficiency at
the highest Level 5 in all four skill areas (speaking, understanding, reading and writing) in

82
their first language, proficiency in their second languages varied considerably. English was
the first language for the two NZ-born tutors but was the second, third or fourth language of
the bilingual tutors. The bilingual tutors' proficiency in English varied, with two rating
themselves at Level 5 in all four skill areas.
The data on the tutors' educational background and experience showed they were all
well–qualified, with at least a certificate in the teaching field, and considerable experience
in teaching in different contexts. This showed that tutors were adaptable and practised, and
would be able to bring their knowledge - base to benefit those in the community who had
been less fortunate.
When asked about the main issues arising from their teaching, the tutors revealed a
high degree of enjoyment and motivation in teaching the literacy classes. A majority felt
the support they had received was adequate, and particularly so in the area of co-ordinated
meetings; quality and quantity of available resources and equipment; knowledge about
teaching methods; and the encouragement and motivation they had received from their
institutions during their teaching period. Some concern was expressed about the continuity
of funding, the transient nature of classes, the inadequate number of hours spent each week
in the classroom, and the need for further in-service training.
A majority of tutors expressed their satisfaction at being able to help less- fortunate
members of their communities to gain knowledge and literacy skills in the NZ context.
They enjoyed watching them make progress in their learning, self-confidence and self -
esteem. However, some concern was expressed about student ‘forgetfulness,’ which may
be partly due to the nature and duration of the classes. Lack of knowledge of learning
strategies and methods of retaining learning points are also issues with pre-literate learners.
Some tutors felt the curriculum needed further work, with clearer outlines, objectives and
outcomes linked to specific topics and task-types. The test procedures, too, were difficult
because of student unfamiliarity with them. Regular attendance of students during the
whole programme was a concern, which is reflected in the number of students who
participated in the project and those who completed all aspects of the research and
assessment process.

83
Section Two: Student profiles: Background
A total of 118 students enrolled in the classes which participated in this project. Of
these, 30 students enrolled in the 2-hours-a-week class and 88 students in the 12–hours-
weekly class. Only 62 students of the total were eligible as research participants however,
being the ones who completed most aspects of the research, the personal profiles, the three
self-assessments and the two performance tests. Of these 62 students, 14 were enrolled in
the 2-hour weekly classes, and 48 in the 12-hour ones. The final writing tests were
completed by 55 students. Those students who were ineligible had either dropped out of the
programme of study, or had joined late and therefore, had not done the first test. Thus, all
data analysis included the 62 students who fulfilled a majority of the requirements of the
project. Student personal profiles were completed at the beginning of the project period.
The personal profile questionnaires indicated some of the literacy difficulties that
students at this level face, as some of the data was contradictory and in some cases not
supplied at all. This was despite the use of interpreters and bilingual tutors to ensure as full
and accurate a response as possible. Any needs analysis questionnaire to be used with low
and pre- literate students should therefore be as simple and brief as possible. The research
needs of this current project, however, necessitated the use of a more extensive profile.
Countries of origin and gender
The 62 participants listed seven different countries of origin (see Table 15). A
majority of the students were from Somalia (43.5%), followed by 11 students who were
from Vietnam. Other countries of origin were Afghanistan, Ethiopia, Cambodia, China,
and one student was from Hong Kong. Of these students, three quarters of the sample (47
students) were women, attesting to the greater demand for literacy education amongst
refugee women.

84
Table 15 Countries of origin of research participants
Afghanistan 5 8.06
Age, age at arrival and length of residence
Nearly a third of the students (19) were aged between 31 and 40 years, and 17
students were over 50 years. In fact, the statistics indicated a greater demand for literacy
education among the older age groups, with only two students being less than 20 years of
age (see Table 16). 80.6% of the participating students were over 30.
Table 16 Age of research participants
Age Frequency Percent (%) < 20 years 2 3.2 21 – 30 years 10 16.1 31 – 40 years 19 30.6 41 – 50 years 14 22.6 > 50 years 17 27.4 Total 62 100.0
As well as age being a significant factor in language acquisition, two further factors
which may influence this are age at time of arrival and length of residence in the host
country. Both of these were indicated by the research participants (see Tables 17 and 18).
Home country Frequency Percent (%)
Cambodia 7 11.29 China 4 6.45 Ethiopia 7 11.29 Hong Kong 1 1.61 Somalia 27 43.55 Vietnam 11 17.74 Total 62 100.00

85
Table 17 Age at time of arrival
Age at arrival Frequency Percent < 10 years 3 4.8 10 – 15 years 7 11.3 16 – 20 years 8 12.9 21 – 30 years 17 27.4 Over 30 years 26 41.9 No response 1 1.6 Total 62 100.0
Age at arrival in the host country is of particular importance, since generally, the
younger immigrants are quicker to adapt to the host environment. This is usually because
they have more contact with host community members, educational institutions and
systems. On the other hand, those who immigrated when they were older are better able to
maintain their own language and culture while they are acquiring the host language. Clyne
(1975) believes the cut-off age is about ten years, with those who are younger than ten at
immigration often acquiring English to a native- like level, but at the cost of productive use
of their home language. Only three of the survey participants had been less than ten years
of age when they immigrated and over two thirds of the participants had been over the age
of 21. Hence, an all-out effort to acquire English language and literacy would not be likely
to hinder language maintenance among the research participants, although the passing-on of
mother-tongue skills to the next generation may still be affected if English was being used
in the home environment.
Table 18 Length of residence in NZ of participants
Length of residence Frequency Percent (%) < one year 12 19.4
1 – 2 years 25 40.3
3 – 5 years 18 29.0
6 – 8 years 3 4.8
> 8 years 3 4.8
No response 1 1.6
Total 62 100.0

86
A majority of the participants had arrived in NZ within the last five years, with only
six of them having lived here for longer than that (Table 18). This data is in line with NZ’s
policies on accepting refugees, in particularly over the last five years, and for making
educational provisions for them.
Those who have lived in NZ for a longer period of time might also have had some
access to other types of classes by now; are now more comfortable in NZ; or already have
some form of employment and no longer feel the need to enrol in literacy classes.
Change in socio-economic status
A majority of studies among immigrant groups in NZ have indicated a change in
socio-economic status between the country of origin and the host country among research
participants. Studies looking at socio-economic status have generally dealt with new
immigrants, rather than with refugees, who have originated from countries with greater
political and social problems than new immigrants have, on the whole. The scale used in
this study was similar to the one used by Shameem (1995, 2001) in her studies of new
immigrants and minority groups in NZ. The scale used was:
1. Professional: Managerial or senior position in a company; ex-principal; accountant;
lawyer; primary or secondary school teacher; dentist; school administrator;
lecturer; educator; development officer; computer programmer; priest or monk;
professional sportsperson.
2. Self-employed: Working proprietors’ own business - dairy, shoe shop, taxi or florist
owner/operator.
3. White collar office/field workers: Clerk; bank teller; office assistant; cashier; bilingual
receptionist; secretary; computer operator; nurse; insurance salesperson; bilingual
worker; translator; tutor.
4. Skilled/trade: Carpenter; upholsterer; plumber; plasterer; mechanic; welder; electrician;
tailor.
5. Semi-skilled: Nurse-aid; shop assistant; check out operator.
6. Casual: Factory hand; packer; mail sorter; fruit picker; harvesting; unspecified.
7. Other: Student; unemployed; retired.

87
Figure 5 illustrates the change in socio-economic status between the country of
origin and NZ. While nearly two thirds of the participants (66.1%) had been unemployed
in their country of origin, 93.5% of them were now unemployed in NZ. This is illustrated
by level seven in Figure 5 below, which shows the sharp increase in rate of unemployment
between the two countries.
Figure 5 Change in socio-economic status
In fact, a recent study by White et al. (2001) found that a majority of their research
participants wished to further their English language acquisition in order to increase their
employment prospects. This is not surprising, given the data on this current project.
The 21 research participants on this project who had worked had done so in a
variety of capacities in their home countries. This ranged from being professionals such as
teachers or sportsperson (three respondents); being self-employed as shopkeepers or
farmers (five respondents); being employed as white collar workers (officers, office
12
34
56
7
0
10
20
30
40
50
60
Number of participants
Occupational category
Occupational change for participants
Home Occupation
NZ Occupation
N = 62 participants

88
assistants); and being employed in a trade or skilled position. Some of the respondents had
held semi-skilled or 'casual' positions. Unfortunately, since the respondents were not given
a list of possible occupations, housework and farmwork at home were not nominated as
possible occupations by the respondents, so that the ‘other’ category (seven) or the ‘casual’
category (six) do not include these possibilities, which earlier projects had (see Shameem,
1995, 2001). If respondents were not in paid work, they were categorised at level seven. If
they said they had worked in their home countries, but did not specify in what capacity,
they were placed at level six.
Only four participants had work in NZ. Two of these had full-time work and the
other two part-time. Of those with full- time work, one was involved in ‘harvesting’ the
other was a welder. The part-time worker was an interpreter; the other did not specify what
work they were involved in. Three of the four had been employed for less than a year; the
welder had been employed for six to eight years.
The socio-economic data showed that unemployment was high in this group in NZ
and, regardless of their hopes in their adopted country, the rate of employment was still
higher than it had been in their home countries, which they had left for a variety of political
reasons. This undoubtedly would have a further adverse effect on new immigrants who are
already suffering from low self-esteem and a sense of dislocation, as they cannot
immediately perceive a positive consequence of their immigration.
Educational background
The educational backgrounds of the participants indicated whether they had some
experience of learning, and perhaps literacy, prior to their leaving their home country. Just
over half the respondents (53.2%) had attended school in their home countries, with almost
a third of them having done so for between six and eight years (see Table 19).
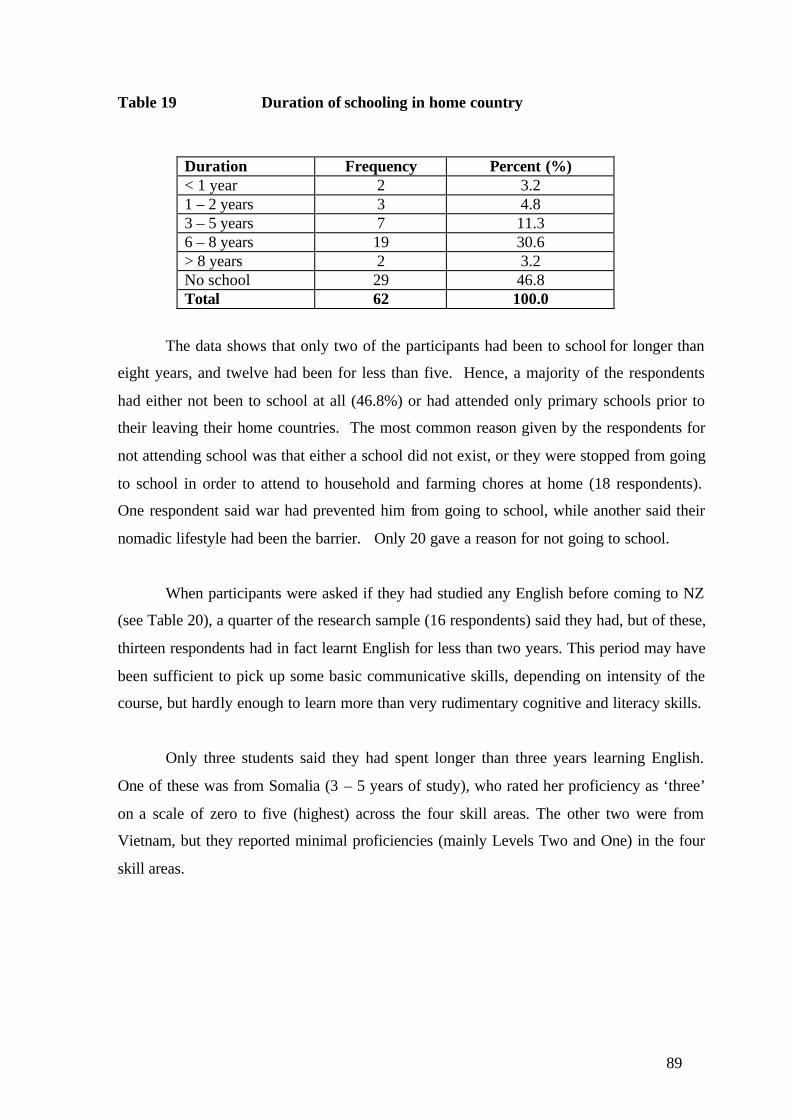
89
Table 19 Duration of schooling in home country
Duration Frequency Percent (%) < 1 year 2 3.2 1 – 2 years 3 4.8 3 – 5 years 7 11.3 6 – 8 years 19 30.6 > 8 years 2 3.2 No school 29 46.8 Total 62 100.0
The data shows that only two of the participants had been to school for longer than
eight years, and twelve had been for less than five. Hence, a majority of the respondents
had either not been to school at all (46.8%) or had attended only primary schools prior to
their leaving their home countries. The most common reason given by the respondents for
not attending school was that either a school did not exist, or they were stopped from going
to school in order to attend to household and farming chores at home (18 respondents).
One respondent said war had prevented him from going to school, while another said their
nomadic lifestyle had been the barrier. Only 20 gave a reason for not going to school.
When participants were asked if they had studied any English before coming to NZ
(see Table 20), a quarter of the research sample (16 respondents) said they had, but of these,
thirteen respondents had in fact learnt English for less than two years. This period may have
been sufficient to pick up some basic communicative skills, depending on intensity of the
course, but hardly enough to learn more than very rudimentary cognitive and literacy skills.
Only three students said they had spent longer than three years learning English.
One of these was from Somalia (3 – 5 years of study), who rated her proficiency as ‘three’
on a scale of zero to five (highest) across the four skill areas. The other two were from
Vietnam, but they reported minimal proficiencies (mainly Levels Two and One) in the four
skill areas.

90
Table 20 Duration of English study in home country
Duration Frequency Percent (%) < 1 year 8 12.9 1 – 2 years 5 8.1 3 – 5 years 1 1.6 6 – 8 years 1 1.6 > 8 years 1 1.6 No English study 46 74.2 Total 62 100.0
Language use in NZ
Various aspects of language use are discussed in this section: the reported
differences between the mother tongue and first language; language use at home in NZ and
the variables which seem to affect this; English language classes that students have taken
previously in NZ, their venue and length; whether they have been taught by a bilingual tutor
and if they found it valuable; perceived host community attitudes to their mother tongue;
and the reasons why they wish to learn English in NZ.
Mother tongue and first language
The data clearly indicated the importance of the distinction between mother tongue
and first language among ethnic minorities. When the participants were asked to nominate
their mother tongue, six of the total 62 responses did not match up with the later question
which asked them to identify their first language and state their level of literacy in this (see
Table 21).
Two participants who identified Dari, Pushto as their mother tongue when asked
about their literacy ability in their first language, elected only Pushto in their response.
Similarly, the three students from Ethiopia who had identified Tigrigna as their mother
tongue did not mention this at all in their response to the first language literacy question, for
which they elected Amharic. One student who had nominated Mandarin as his mother
tongue, called Cantonese his first language. A clear distinction between the two concepts is
important if we are to reach a greater understanding of the perceived and actual differences

91
between mother tongue and first language use (see Shameem, 2001:9, on this). It could be
that students, when identifying their mother tongue, are among minorities literally
identifying their mother's first or tribal language as their mother's tongue.
Table 21 Mother tongues and first language identified by participants
Mother tongue
Frequency Percent (%)
First language
Frequency Percent (%)
Farsi 3 4.8 Farsi 3 4.8
Dari, Pushto 2 3.2 Pushto 2 3.2
Somali 27 43.5 Somali 27 43.5
Amharic 4 6.5 Amharic 7 11.3
Tigrigna 3 4.8
Vietnamese 10 16.1 Vietnamese 10 16.1
Cantonese 8 12.9 Cantonese 9 14.5
Khmer 4 6.5 Khmer 4 6.5
Mandarin 1 1.6
Total 62 100.0 Total 62 100.0
Home language use
Language studies to date in NZ have often included a question on language use at
home. Language maintenance studies, in particular, show that language shift at home is
usually the precursor for mother tongue loss in later generations. Nearly 60 % (37) of the
participants were still mainly using their mother tongue at home, but of particular interest
are the 25 students (40.3%) who were preferring to use English bilingually with their
mother tongue. This is quite a high figure for first generation immigrants who do not feel
fully competent in English, especially in comparison with their mother tongue skills. This is
an area which needs urgent further study as, clearly, for a disadvantaged community with
low self-esteem, these results augur the possibility of language loss with the next
generation. It is particularly important to look at the reasons behind the shift, and whether

92
the parents among the sample are aware of the cognitive and social implications of
language shift and loss.
A chi-square Fisher Exact two-tailed test was applied to the data on home language
use, to determine the relationship between this and various variables which may have
contributed to the shift (see Table 22).
Table 22 Home language use by key variables
Home language use and Chi-square Fisher Exact two-tailed Gender 0.005* Length of NZ residence 0.907 Age at time of arrival in NZ 0.123 Age 0.378 Home country 0.004* Mother tongue 0.010*
* These values are significant at p < .05, N = 62 respondents
Home language use was related significantly at p<0.05 to gender, country of origin,
and participants’ mother tongue. A breakdown of this data is presented in tables 23, 24 and
25, to illustrate the distribution of participants across these variables.
Table 23 Gender and home language use
Gender English mainly Both English and mother tongue
Mother tongue mainly
Total
Female 0 14 33 47 Male 0 11 4 15 Total 0 25 37 62
None of the participants showed a preference for using mainly English at home, but
proportionately more males than females were using English bilingually at home. A
majority of the women were still showing a preference for mother tongue use at home.

93
Table 24 Country of origin and home language use
Afghanistan 0 0 5 5
Because of the variable number of participants in each ethnic group, it is appropriate
to talk about apparent trends, rather than make any generalisations. Participants from
Afghanistan, Somalia and Cambodia were showing a preference for using mainly their
mother tongue at home. There was also some evidence that the Chinese immigrants were
doing the same. On the other hand, those from Ethiopia and Vietnam seemed to show some
preference for bilingual language use at home. Further study of these trends with larger
groups is needed in order to reach more valid suppositions for each ethnicity, as well as an
understanding of possible reasons for these phenomena, if they are duplicated in those
studies.
Finally, language use at home was also significantly related to the mother tongue of
participants (see Table 25). Two thirds of Somali speakers continued to use mainly their
mother tongue at home, as did all the Farsi and Pushto speakers, and a majority of the
Cantonese and Khmer speakers. A majority of Amharic, Tigrigna and Vietnamese speakers,
on the other hand, had begun to use their mother tongues bilingually with English. Again,
these results warrant further study into the rate of language shift among new and low-level
literacy refugees and immigrants, in order to benefit this and the next generation, both
cognitively and academically.
Country of origin
English mainly Both English and mother tongue
Mother tongue mainly
Total
Somalia 0 9 18 27 Ethiopia 0 6 1 7 Vietnam 0 8 3 11 Cambodia 0 1 6 7 China 0 1 3 4 Hong Kong 0 0 1 1
Total 0 25 37 62

94
Table 25 Mother tongue and home language use
Mother tongue
English mainly
Both English and mother tongue
Mother tongue mainly
Total
Farsi 0 0 3 3 Dari, Pushto 0 0 2 2 Somali 0 9 18 27 Amharic 0 3 1 4 Tigrigna 0 3 0 3 Vietnamese 0 7 3 10 Cantonese 0 1 7 8 Khmer 0 1 3 4 Mandarin 0 1 0 1
Total 0 25 37 62
English study in NZ
More than half of the research participants (34/62) had studied English in NZ prior
to enrolling in the current classes. Of these, half (16) had studied either with home tutors or
in home tutor groups, and studied at Auckland University of Technology, and the remainder
had either attended community education classes or had studied with other small groups.
The data indicated that participants who had studied elsewhere had tried a variety of
delivery methods in different venues and for varying lengths of time. The longest lengths of
time spent in learning English were three years (one student), two years (one student), a
year and a half (one student), a year (seven students), a semester or two terms (twenty
students). Others had studied for much shorter lengths of time, ranging from two to ten
weeks. Weekly hours of study also varied a great deal, ranging from one to six hours a
week (in 42 instances,) to a full time government funded course (six instances). Most
venues and providers seem to favour an instruction time of between four to six hours a
week.
Bilingual instruction
Only 11 of the 62 participants said they had been previously taught by a bilingual
tutor, although admittedly this might have been in the first semester of their course prior to
the data gathering stage. Two thirds of the total sample said they would like to be instructed
by someone who was able to use both their mother tongue or first language, and English.

95
There was a clearly-articulated need for bilingual instruction, with only 13 students (21%)
saying they preferred to have a native English-speaking tutor. Since this part of the project
was conducted at the start of the programme, it would have been interesting and valuable to
evaluate the responses to this question at the end. Roughly half of the students had studied
with bilingual tutors over the research period.
Participant perception of host community attitude towards their mother
tongue
Participants were offered five choices in saying how they felt about speaking their
own language in front of New Zealanders. Over a third of them (23 respondents) were
comfortable and nine felt confident with it, while one said they felt both comfortable and
confident. Nearly as many respondents (nineteen) said, however, that they were not
comfortable using their mother tongue when other New Zealanders were around, while two
stated they felt uncomfortable and non-confident. Two respondents said they felt it was
impolite to use their mother tongues around other New Zealanders. Participants were
clearly ambivalent about mother tongue use in the host community, and a further interesting
area of research would be to look at a breakdown of this data by mother tongue and country
of origin, and the reasons behind the varied attitudes.
Reasons for learning English in NZ
Students were asked to nominate the reasons why they wanted to learn English, and
were offered a range of choices. The results showed that all choices seemed equally
important to the participants (see Figure 6).
Almost equal numbers of students chose the following reasons: to get a job; to fill
out forms; to talk to and understand other New Zealanders; to understand television; and get
NZ citizenship. The option ‘to study further’ was not as popular as the other choices,
however. These results are similar to the ones that White et al. (2001:15) found in their
study of refugees and new immigrants in Auckland, Wellington and Tauranga.

96
Figure 6 Reasons for learning English in NZ
Language proficiency
Students were asked to self-assess their specific literacy skills in English at the
beginning of the programme. These skills were related to upcoming course objectives and
outcomes. The results of this self-assessment are discussed in the next section. In their
personal profiles, however, students stated how well they felt they could perform in the four
skills in English, and those variables, which seemed to have a significant relationship with
English literacy, are presented and discussed.
This section of the results also presents the participants’ reported English
proficiency and compares their English and first language ability. It also compares the
average literacy proficiency in their first language and in English of each of the ethnic
groups which participated.
Reasons why the participants want to learn English
16%
14%
17%15%
16%
8%
14%
To get a job
To fill in forms
To talk to and understand NZers
To talk to and understandneighbours
To understand the T.V
To study further
To get NZ citizenship

97
English Proficiency
Reported English proficiency data followed the expected distribution over the four
skills (see Figure 7). These were ranked as understanding ability scoring the highest mean
proficiency, followed by speaking, reading, then writing.
Figure 7 Student English proficiency (four skills)
Variables affecting English literacy skills
Various variables which may have affected the participants' literacy skills were
tested for their relationship with literacy ability. They included age, age at time of arrival,
length of NZ residence, gender, previous study of English in the home country, English
study in NZ, and the use of the Roman script for the first language (see Table 26). Finally,
the relationship between literacy skills in the first language and English was determined.
English proficiency for participants
0
5
10
15
20
25
30
35
40
45
Speak (Mean = 1.42)
Understand (Mean = 1.47)
Read (Mean = 1.34)
Write (Mean = 1.27)
Skills
Very wellWellAverageSo-soA littleNot at all
N = 62

98
Table 26 English literacy and key variables
English literacy and Chi-square d.f. Significance Reading 3.37 4 .499 Age Writing 2.91 4 .573 Reading 7.34 4 .119 Age at arrival
in NZ Writing 7.32 4 .120 Reading 10.06* 4 .039 Length of NZ
residence Writing 9.89* 4 .042 Reading 4.07* 1 .044 Gender Writing 4.30* 1 .038 Reading 3.06 1 .080 Use of Roman
script in L1 Writing 2.23 1 .135 Reading 1.47 1 .228 English study
before NZ Writing 1.55 1 .213 Reading 2.69 1 .101 English study
in NZ Writing 2.24 1 .135 * Kruskal Wallis test significant @ p<.05, N = 62
The two variables which demonstrated a significant relationship with English
reading and writing ability were gender and length of NZ residence. A closer examination
of the data revealed that, generally, women demonstrated a lower mean proficiency in
English reading (1.21) than men (1.73). There was a similar trend with English writing
ability; women had a mean proficiency of 1.15, compared to men with 1.67.
A cross-tabulation of means between English reading and writing proficiency and
length of NZ residence showed a steady incline in proficiency with longer length of
residence, particularly in the three categories of less than one year residence (reading &
writing = 1.08), one to two years (reading = 1.4, writing = 1.24) and three to five years
(reading & writing = 1.78). This was true for 56 of the total research sample of 62. The six
participants who had lived in NZ for longer than six years, however, showed lower literacy
skills than even those who had arrived over the last year, showing that other possible factors
may have affected their literacy gains.
In comparing the participants’ English and their first language literacy skills, it was
clear that mean literacy in the first language for the whole group was at least a level higher
than in English, in both reading and writing (see Figure 8). The number of individual
participants who were pre- literate in their first language, however, was higher than the
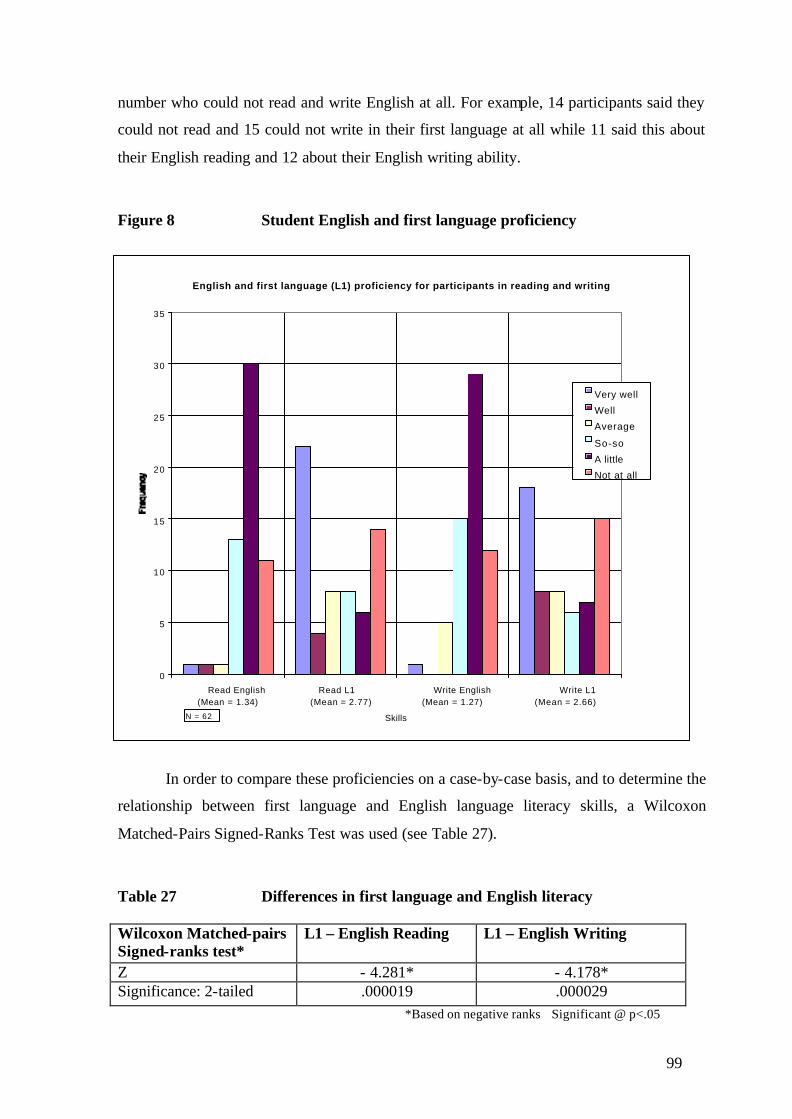
99
number who could not read and write English at all. For example, 14 participants said they
could not read and 15 could not write in their first language at all while 11 said this about
their English reading and 12 about their English writing ability.
Figure 8 Student English and first language proficiency
In order to compare these proficiencies on a case-by-case basis, and to determine the
relationship between first language and English language literacy skills, a Wilcoxon
Matched-Pairs Signed-Ranks Test was used (see Table 27).
Table 27 Differences in first language and English literacy
Wilcoxon Matched-pairs Signed-ranks test*
L1 – English Reading L1 – English Writing
Z - 4.281* - 4.178* Significance: 2-tailed .000019 .000029
*Based on negative ranks Significant @ p<.05
English and first language (L1) proficiency for participants in reading and writing
0
5
10
15
20
25
30
35
Read English (Mean = 1.34)
Read L1 (Mean = 2.77)
Write English (Mean = 1.27)
Write L1 (Mean = 2.66)
Skills
Very well
Well
Average
So-so
A little
Not at all
N = 62

100
The result showed a significant relationship between literacy in the first language
and English literacy. A majority of the participants in both reading (37 respondents) and
writing (38 respondents) showed a positive relationship between the two languages. There
were ten ties in reading and eleven ties in writing skills.
A breakdown of literacy skills in each first language nominated by the participants
showed that Cantonese-speaking students had the highest literacy ability in their own
language, followed by the Pushto group, then the Vietnamese and then the Cambodian (see
Figure 9). Those who nominated Farsi, Somali and Amharic as their first language showed
a generally lower literacy ability. The sample size in some ethnic groups such as
Cambodian (four), Pushto (two), Farsi (three) is quite small, and therefore cannot be used to
make any generalisations. It is still of interest, however, to look at the trends in data.
Figure 9 Student first language proficiency
Mean first language proficiency for participants in reading and writing
0
1
2
3
4
5
Farsi (N=3)
Pushto (N=2)
Somali (N=27)
Amharic (N=7)
Vietnamese(N=10)
Cantonese(N=9)
Khmer (N=4)
First languages
Read
Write
NOTE: Proficiency Scale0 = Not at all, 1 = A little, 2 = So-so,3 = Average, 4 = Well, 5 = Very well

101
Summary: Student profiles
Although 118 students were enrolled in the programmes during the course of the 20
weeks, only 62 of them were eligible as participants on the research project. They
originated from seven different countries, with the majority being refugees over 30 years of
age, who had arrived in NZ when they were over 21 years of age and within the last five
years. While nearly two thirds of the participants had been unemployed in their home
country, in NZ this was true for over 90% of them. However, the data showed that
prospective employment was not the only reason for their demand for English literacy.
Other reasons such as functional use of English to fill in forms, watch TV and adapt to NZ
society were just as important to them.
Half the research participants had attended primary school prior to arriving in NZ,
and most of these had received less than three years of English language instruction in their
country of origin. Moreover, more than half the participants had received at least some
English instruction in NZ before enrolling in the current classes. There was some
discrepancy in student responses to the questions regarding mother tongue and first
language, as in six cases these did not match up. Clearly, this distinction is important
among new immigrants and refugee groups who have more than three languages in their
speech repertoire.
Response to a question on home language use showed over 40% of students
preferring to use their mother tongue bilingually with English – a clear sign of language
shift within the first few years of immigration. The three variables which seemed to be
affecting the rapid shift were gender (men were shifting faster than women were), country
of origin, and mother tongue (Somali, Afghani and Cambodian participants were more
resistant to shift).
The results showed a demand for bilingual tuition on the part of two thirds of the
respondents at the beginning of the programme, although only eleven participants said they
had been taught by bilingual tutors to date. They might have received this bilingual tuition
in the first semester of the currnet programme.
102
Participants were ambivalent about host community attitudes towards their use of
the mother tongue in public, with half saying they were comfortable or confident doing so
but nearly as many being unsure of their reception if they did.
English language proficiency data followed the expected pattern, with respondents
being strongest in listening skills, followed by speaking, reading, then writing. First
language proficiency also showed reading ability to be stronger than writing. Overall,
participants’ first language literacy ability was higher than their English ability, and of
significance was the positive influence of first language literacy skills on English literacy.
English literacy was also affected by gender (women showed lower mean proficiencies) and
length of NZ residence (earlier arrivals within the last five-year span were more competent
than more recent arrivals). Different ethnicities displayed varying first language literacy
abilities.
The next section looks at the assessment data from the study and evaluates whether
literacy gains at emerging literacy level can be measured through the use of self-assessment
scales.

103
Sunday Star Times (ellison)

104
REPORTED LITERACY Introduction
Self-assessment procedures were carried out with the research participants at three
points of their programme: at the beginning, at mid-point and at the end. The scales that
were used for this assessment were at eight different levels in ascending order of
proficiency for both reading and writing. Students used a five-point scale (5 = Very well; 4
= Well; 3 = Average; 2 = So-so; 1 = A little; 0 = Not at all) to report their own perceived
proficiency on a range of real- life tasks which they would expect to be able to perform at
the end of their period of study. Hence, the self-assessment at the beginning of the
instructional period indicated what they perceived to be the gaps in their survival literacy
ability; the self-assessment in the middle indicated their progress; and the assessment at the
end gave some indication of their perceived achievement. All three self-assessments used
the same procedures and forms, and were administered in the classroom.
This section of the results presents both descriptive and comparative data on two of
the batches of self-assessments, taken from the beginning and from the end of the project
period, since we are mainly concerned with literacy gains over this period.
Computations have been carried out first for the total research sample, then
separately for the classes taught by bilingual and English-speaking tutors, and finally for the
2-hour and 12-hour weekly classes.
Total sample self-assessments: Reading
The trends in mean values of the reading self-assessment scales illuminated some
interesting patterns (see Table 28). The scales were developed by the testing team with
reference to the curriculum (see Appendix 5) and were meant to be in ascending order of
difficulty. Hence students were expected to have found the task at Level 1 easier to perform
than those at higher Levels 2 – 8.

105
Table 28 Self-assessed proficiency: Reading
Level Task description Time 1 Time 2 Time 3 Mean s.d. Mean s.d. Mean s.d.
1 I can read information on a simple form
2.82 1.55 2.90 1.30 2.92 1.37
2 I can read names and know the sounds of letters
3.11 1.47 3.29 1.33 3.40 1.18
3 I can read dates 3.63 1.41 3.53 1.31 3.61 1.17 4 I can read numerals 3.64 1.69 3.53 1.25 3.65 1.12 5 I can read public signs 2.69 1.68 2.71 1.31 2.95 1.38 6 I can read bus timetables 2.05 1.80 2.02 1.55 2.68 1.42 7 I can find words arranged in
alphabetical order 2.16 1.90 2.55 1.40 2.90 1.52
8 I can read a simple story 2.18 1.58 2.29 1.35 2.52 1.49 Total mean/40 22.29 9.18 22.82 8.41 24.62 9.15 Level (0 – 8) 4+ 4+ 4+ N 62 62 62
Mean range = 0 – 5
The results of all three self-assessments showed that students were in fact placing
their numeracy skills ‘I can read the date’ (Level 3) and ‘I can read numerals’(Level 4) at
Levels 1 and 2 respectively before their reading ability with letters. At Level 3 they felt
they could read names and knew the sounds of letters – a task which the testing team had
placed at Level 2. Of greatest interest was the consistent placing at Level 4 of the skill of
reading information on a simple form, when in fact, this had been perceived to be the
easiest task to perform, and was placed by the test team at Level 1 on the self-assessment
form. Also clearly misplaced was the students’ perceived ability to read a bus timetable,
which they almost consistently felt was the most difficult reading skill – more so than
finding words arranged in alphabetical order or reading a simple story.
Since self-perception of reading ability is an important part of learning, the mean
results give some indication that a change in emphasis in the curriculum is needed if
reading ability is to be gained progressively, and scaffolded so that easier skills are learned
and consolidated first. The difference in perception between the curriculum developers/test
writers and the students themselves of the order of difficulty of these real- life reading tasks
need to be taken into account in further courses. However, these perceptions need to be
compared with actual test results before any clear conclusions can be reached regarding

106
trends and levels of ability in the various survival reading tasks which are included in the
curriculum for pre- literate and lower literacy level students.
A look at the total mean values for each self-assessment procedure shows some
gains in perceived ability over time, however, when converted to a ‘Level’ score using the
8-point descriptors of possible performance ability (Appendix 7), students are moving
slightly higher with each self-assessment within the Level 4 band in reading.
Total sample self-assessments: Writing
The means of the students’ self-assessed writing ability also showed a variation in
the expected levels of difficulty of the tasks on the self-assessment form (Table 29). While
at Level 1, the 62 research participants consistently agreed that they had the greatest ability
in writing lower and upper case letters, in self-assessment Time 1, 2 and 3, they placed their
ability to write the date, at Level 2 rather than at Level 4, where the test and curriculum
writers had placed it. Also in Time 1, 2 and 3, the means showed that they found it easier to
use capital letters and fullstops than to write personal information on a simple form, thereby
inverting the order in which these had been included on the self-assessment form. Hence,
both the reading and writing results showed that students felt they had greater proficiency in
numeracy and writing conventions than in interpreting or providing information in a
familiar context, such as filling out a form requiring personal information.
Also different from the expected level of difficulty on the form was student ability
to write a short letter of explanation, which had been placed at Level 5 by the test
writers/curriculum developers, but which in Time 1 and 3 of the self-assessment, students
placed at the most difficult Level, 8, perceiving it to be more difficult than writing a
detailed telephone message, writing about familiar things, or keeping a diary. In Time 2,
this pattern differed slightly in that students put a letter of explanation at Level 7. Although
the ascending order of difficulty of the final three tasks (placed by students from Levels 5 –
7 rather than 6 – 8 generally held true, Time 3 results showed that, by the end of the
programme, the students were finding it easier to keep a diary than to write about familiar
things. It could be argued that they had had more practice in the former over the course of
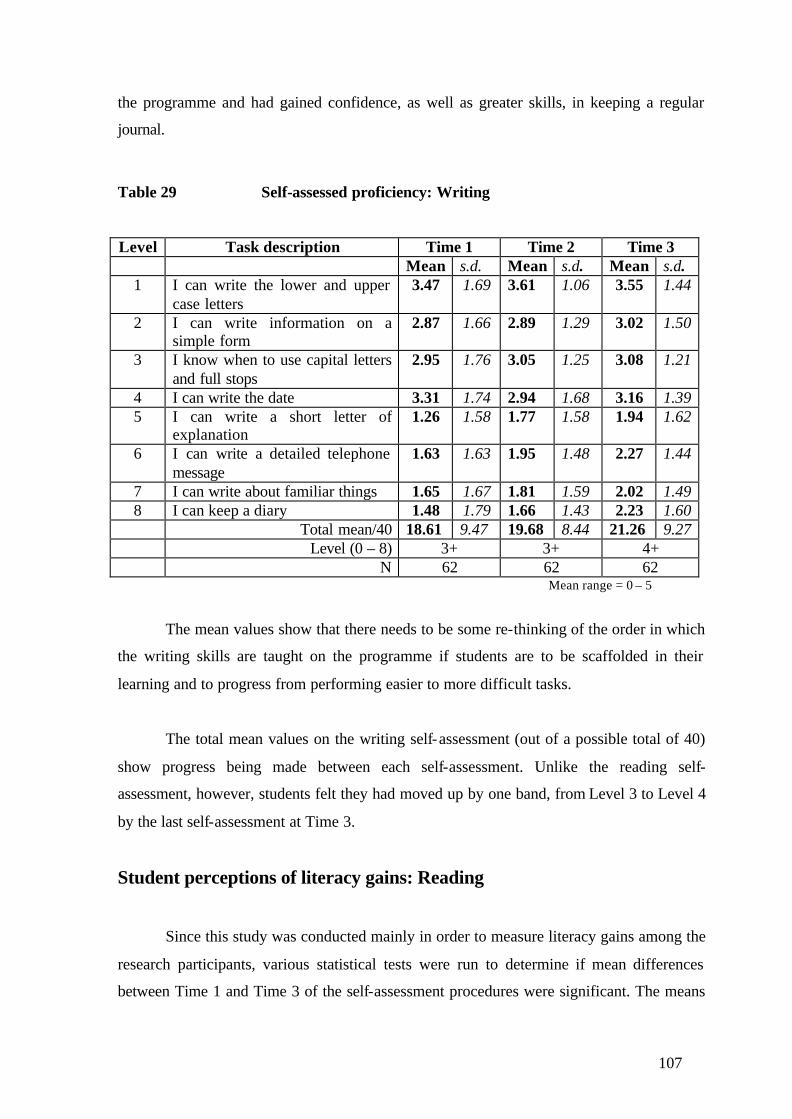
107
the programme and had gained confidence, as well as greater skills, in keeping a regular
journal.
Table 29 Self-assessed proficiency: Writing
Level Task description Time 1 Time 2 Time 3 Mean s.d. Mean s.d. Mean s.d.
1 I can write the lower and upper case letters
3.47 1.69 3.61 1.06 3.55 1.44
2 I can write information on a simple form
2.87 1.66 2.89 1.29 3.02 1.50
3 I know when to use capital letters and full stops
2.95 1.76 3.05 1.25 3.08 1.21
4 I can write the date 3.31 1.74 2.94 1.68 3.16 1.39 5 I can write a short letter of
explanation 1.26 1.58 1.77 1.58 1.94 1.62
6 I can write a detailed telephone message
1.63 1.63 1.95 1.48 2.27 1.44
7 I can write about familiar things 1.65 1.67 1.81 1.59 2.02 1.49 8 I can keep a diary 1.48 1.79 1.66 1.43 2.23 1.60
Total mean/40 18.61 9.47 19.68 8.44 21.26 9.27 Level (0 – 8) 3+ 3+ 4+ N 62 62 62
Mean range = 0 – 5
The mean values show that there needs to be some re-thinking of the order in which
the writing skills are taught on the programme if students are to be scaffolded in their
learning and to progress from performing easier to more difficult tasks.
The total mean values on the writing self-assessment (out of a possible total of 40)
show progress being made between each self-assessment. Unlike the reading self-
assessment, however, students felt they had moved up by one band, from Level 3 to Level 4
by the last self-assessment at Time 3.
Student perceptions of literacy gains: Reading
Since this study was conducted mainly in order to measure literacy gains among the
research participants, various statistical tests were run to determine if mean differences
between Time 1 and Time 3 of the self-assessment procedures were significant. The means

108
on the reading self-assessment scales generally showed consistent progress being made on
all the listed tasks, except for the numeracy skills, which remained at about the same,
perceived easiest Levels 1 and 2, with roughly equivalent mean values for all three times.
For statistical computations, each student was given a score out of a total possible
score of 40 on self-assessments at Time 1 and Time 3. Group trends are borne out by the
positive value of the Spearman correlation coefficient, which signals the strength of the
relationship between Time 1 and Time 3 results (see Table 30). Using the Wilcoxon
matched–pairs signed-ranks test, a closer look at the paired data in the two tests for
individual students showed significant gains having been made in reading by a majority of
research participants. While 22 students had placed themselves at a lower mean score in the
final self-assessment, a far greater number (36) had felt more able to cope with the listed
tasks by this time. The total paired-sample T-test, which is designed to measure the
significance gains made by the sample between Time 1 and 3, also showed a significant
result (see Table 30).
Table 30 Self-assessed reading ability: Time 1 and 3
Ranks
Self-assessment scores N Time 3 < Time 1 22
Time 3 > Time 1 36
Time 3 = Time 1 4
Total 62
Tests Values
Wilcoxon matched-pairs
signed-ranks
Z = -2.450*
Sig. (2-tailed) = 0.014
Total paired-sample
T-test (pre- and post-programme)
t = -2.203*
df = 61
Sig. (2-tailed) = 0.031
Spearman correlation
coefficient = rho
Correlation coefficient = 0.597*
* These values were significant at p < .05
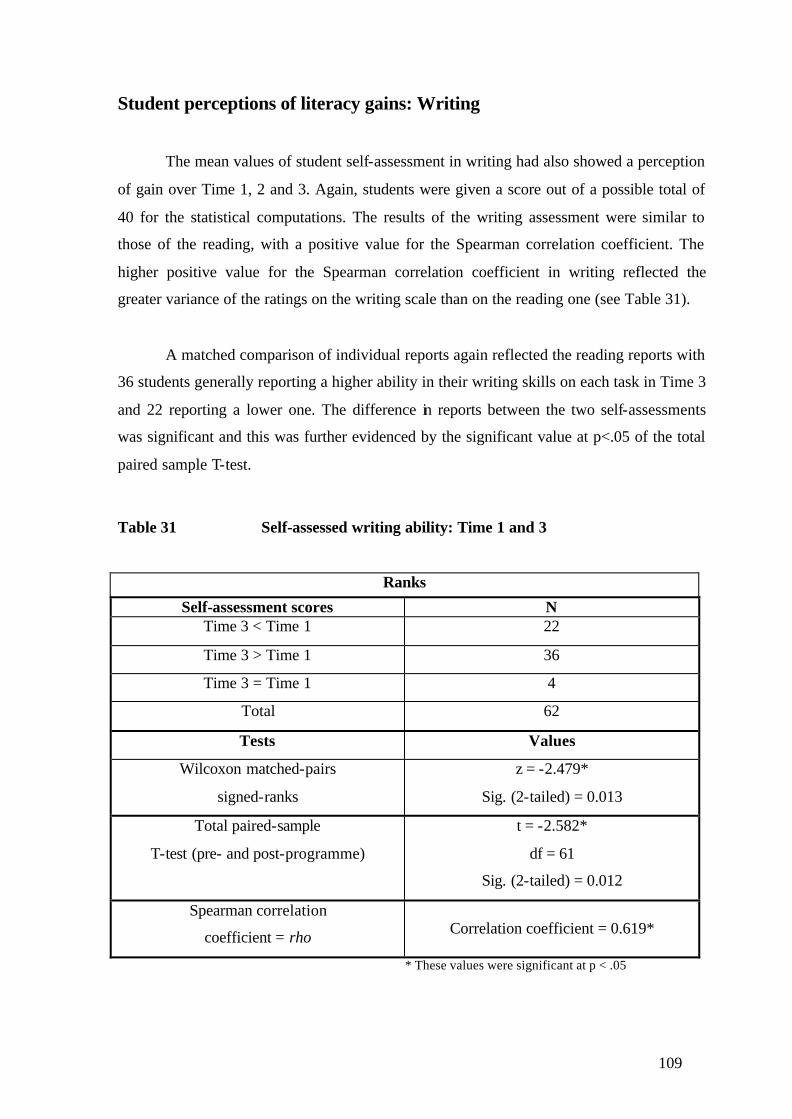
109
Student perceptions of literacy gains: Writing
The mean values of student self-assessment in writing had also showed a perception
of gain over Time 1, 2 and 3. Again, students were given a score out of a possible total of
40 for the statistical computations. The results of the writing assessment were similar to
those of the reading, with a positive value for the Spearman correlation coefficient. The
higher positive value for the Spearman correlation coefficient in writing reflected the
greater variance of the ratings on the writing scale than on the reading one (see Table 31).
A matched comparison of individual reports again reflected the reading reports with
36 students generally reporting a higher ability in their writing skills on each task in Time 3
and 22 reporting a lower one. The difference in reports between the two self-assessments
was significant and this was further evidenced by the significant value at p<.05 of the total
paired sample T-test.
Table 31 Self-assessed writing ability: Time 1 and 3
Ranks
Self-assessment scores N Time 3 < Time 1 22
Time 3 > Time 1 36
Time 3 = Time 1 4
Total 62
Tests Values
Wilcoxon matched-pairs
signed-ranks
z = -2.479*
Sig. (2-tailed) = 0.013
Total paired-sample
T-test (pre- and post-programme)
t = -2.582*
df = 61
Sig. (2-tailed) = 0.012
Spearman correlation
coefficient = rho
Correlation coefficient = 0.619*
* These values were significant at p < .05

110
It must be remembered that, as students did not have reference to their own Time 1
self-assessments at subsequent sessions, they did not have a reference point on which to
base their comparative self-assessments. It is to be expected, therefore, that a number would
place themselves at a lower level in Time 2 and 3 as, after a period of instruction, they
became more aware of the gaps which remained in their learning. These results are,
nevertheless, compared with actual test results later in the result section of this report, to see
if these perceptions are borne out by the matched literacy tests.
Student perceptions of literacy gains: Bilingual and English-speaking
tutors
The mean results showed that both groups of students – those who had been taught
by bilingual tutors (22 students) and those taught by English-speaking tutors (40 students) -
had made some gains in literacy between Time 1 and Time 3 of the self-assessments (see
Table 32). This was much more apparent, however, in the mean values of the students
taught by the English-speaking tutors. Figure 10 graphically illustrates the perceptions of
the progress made in reading and writing skills for both groups. When the student responses
in the pre- and post-programme self-assessments were matched up for each student, it was
apparent that, while the differences between the two self-assessments completed by those
who had had English-speaking tutors were significant, this was not so for those who had
had bilingual tutors. This was the case for both the reading and writing proficiencies (see
Table 32). As a breakdown of students’ individual comparative responses shows, twice as
many students in the English-speaking tutors’ classes felt they were better in the self-
assessment tasks than they had indicated in the first self-assessment. For students in the
bilingual tutors’ programmes, generally equal numbers felt they either had greater ability to
perform the literacy tasks or that they had less. This may well be due to those in the
bilingual tutors' groups becoming more aware of the gaps in their literacy knowledge than
they had been in Time 1.
An independent-samples T-test was used to determine whether the difference in
literacy gains between the groups of students - those who had been taught by bilingual
tutors and those taught by English-speaking tutors - were significant (see Table 32). Results
for the Levene’s test for equality of variances showed significance levels (p-values) to be

111
higher than 0.05 in both the reading and writing self-assessments during Time 1 and Time
3. Hence the variances of the two groups were not significantly different from one another,
thereby showing the effectiveness of literacy instruction, regardless of the language of
instruction.
Table 32 Student perception of literacy gains: Bilingual and English-speaking
tutors
Reading Writing
Means Bilingual tutors
English-speaking tutors
Bilingual tutors
English-speaking tutors
Mean S.d. Mean S.d. Mean S.d. Mean S.d. Self-assessment 1 25.73 8.75 20.40 8.96 20.50 9.15 17.58 9.59 Self-assessment 3 25.95 9.93 23.90 8.74 21.36 9.01 21.20 9.53 Range 0 – 40 N 22 40 22 40
Tests Wilcoxon matched-pairs signed-ranks test Self-assessment scores:
Self-assessment 3 < Self-assessment 1
11 11 10 12
Self-assessment 3 > Self-assessment 1
11 25 12 24
Self-assessment 3 = Self-assessment 1
0 4 0 4
Z -.130 -3.220* -.374 -2.964* Significance (2-tailed) .897 .001 .709 .003 Independent-samples T-test:
f Significance f Significance
Levene’s test for equality of variance
Self-assessment 1 .418 .520 .178 .674 Self-assessment 3 .990 .324 .203 .654 Total 62 62
* These values were significant at p<. 05.

112
Figure 10 Perceived student literacy gains: Bilingual and English-speaking tutors
Student perceptions of literacy gains: 2-hour and 12-hour weekly classes
In both classes (2- and 12-hour weekly), the research participants began with higher
perceived reading than writing abilities, and this pattern carried through to the final self-
assessments. The results also showed that the students who had been taking the 2-hour
classes began the programme with self-assessed literacy abilities which were considerably
lower than the abilities of those enrolling in the 12-hour classes. In the 2-hour classes, 14
out of 30 students completed the programme and almost all the project tasks. Forty-eight
students out of 88 did so in the 12-hour ones (see Table 33).
Student perceptions of literacy gains: Bilingual and English-speaking tutors
0
5
10
15
20
25
30
Reading: Bilingual tutors
Reading: English tutors
Writing: Bilingual tutors
Writing: English tutors
Tutor type
Mea
n pr
ofic
ienc
y
Self-assessment 1Self-assessment 3

113
The mean values indicated that perceived reading progress had been made in both
classes but that, while students rated themselves at a higher level of ability in the final
writing self-assessment in the 12-hour classes, in fact the mean fell slightly in the two- hour
ones. Figure 11 graphically illustrates these patterns for the two classes.
Figure 11 Student perception of literacy gains for 2-hour and 12-hour weekly
classes
Student perceptions of literacy gains: 2-hour and 12-hour weekly classes
0
5
10
15
20
25
30
Reading: 2-hour classes
Reading: 12-hour classes
Writing: 2-hour classes
Writing: 12-hour classes
Class type
Self-assessment 1
Self-assessment 3

114
When the data from individual students was compared using the Wilcoxon matched-
pairs signed-ranks test, it was clear that the increase in self-assessed literacy proficiency
was greater for those in the 12-hour classes (Table 33). This increase in numbers placing
themselves at a higher level of proficiency was significant. In reading, on the other hand, in
the 2-hour classes, seven of the 14 had placed their abilities at a higher level in Time 3, and
only five had done so in the writing. These increases, however, were not significant. An
independent-samples t-test for equality of variances between the two groups of students
found that the variances between them were not significant in self-assessed reading ability
in Time 1 or in Time 3 or in writing in Time 1. However, they were significantly different
in writing in Time 3, showing that the perceived writing gains in the 12-hour classes at the
end of the programme were significantly higher than in the 2-hour ones.
Table 33 Student perception of literacy gains: 2-hour and 12-hour weekly classes
Reading Writing
Means 2-hour classes
12-hour classes
2-hour classes
12-hour classes
Mean S.d. Mean S.d. Mean S.d. Mean S.d.
Self-assessment 1 14.93 5.70 24.44 8.92 12.00 6.71 20.54 9.33 Self-assessment 3 16.86 7.16 26.90 8.44 11.86 4.80 24.00 8.44 Range 0 – 40 N 14 48 14 48
Tests Wilcoxon matched-pairs signed-ranks test Self-assessment scores:
Self-assessment 3 < Self-assessment 1
6 16 6 16
Self-assessment 3 > Self-assessment 1
7 29 5 31
Self-assessment 3 = Self-assessment 1
1 3 3 1
z -1.192 -2.090* -.089 -2.705* Significance (2-tailed) .233 .037 .929 .007 Independent-samples T-test:
f Significance f Significance
Levene’s test for equality of variance
Self-assessment 1 3.276 .075 1.808 .184 Self-assessment 3 .255 .615 4.510* .038 Total 62 62
* These values were significant at p < .05

115
Summary: Student perceptions of literacy gains
The results of the self-assessment procedures showed that for future use, some
changes are needed in the order in which tasks and topics are covered in the curriculum,
and in the placing of functional tasks from easier to more difficult on the self-assessment
scales. Research participants reported higher abilities in numeracy skills than in reading and
writing. There was also some evidence that students were finding it easier to follow reading
and writing conventions than they were to use the skills in context, such as in reading
information on a simple form or in filling one out.
Group trends in data showed that a majority of students felt they had made gains in
literacy in both reading and writing skills, and this perception was found to be a
statistically-significant one. It was also apparent that students who came into the
programme with perceived higher levels of ability were also likely to complete it with a
similarly positive perception of their abilities.
When student perceptions of their gains were compared between those being taught
by bilingual tutors and those in classes with English-speaking tutors, it was found that
variances between the two groups were non-significant. However, the gains within each
group showed that a majority of individuals being taught by English-speaking tutors felt
they had a significantly higher literacy ability in the Time 3 reports at the end of the
programme than in the Time 1 ones at the beginning.
In comparing the literacy gains made between the 2-hour and 12-hour weekly
classes, it was found that variances between the two groups were significant only for
reported writing ability in Time 3. They were non-significant between them for reading
ability in Time 1 and 3 or in Time 1 reported writing ability. The data showed significant
gains made in reading and writing literacy within the 12-hour classes between Time 1 and
Time 3.
It is apparent, the refore, that a high standard of teaching, and longer contact hours
were conducive to perceived literacy gains among this group of research participants. The

116
results showed that both bilingual and English-speaking tutors have crucial roles to play,
depending on the beginning proficiency level of the students in their classes and their desire
for bilingual instruction. Perhaps exposure to both types of tutors would increase perceived
gains among the students, by allowing access to a variety of various effective role models.
The performance test results in the next section will enable a comparison to be
drawn between perceived and actual literacy gains among the research participants.

117

118
ASSESSED LITERACY GAINS AND COMPARISON WITH SELF-
ASSESSED LITERACY
Introduction
The literacy abilities of research participants were assessed at two points of the
programme – at the beginning, prior to the commencement of the programme and then
again at its closure. Parallel tests were devised for both occasions so that sound appraisals
could be made regarding student achievement. The tests were also congruent with the self-
assessment scales discussed in the previous section, so that judgements could be made on
the validity of the self-report scales, which may well be used in the future in place of actual
testing. This is particularly due to the fact that testing at this level is time-consuming and
difficult to administer, as learners have no previous experience with test-taking (see
Appendix 9 for tutor comments on testing).
The raw scores of the test were converted to discrete scores out of five for each of
the eight reading and writing levels. This was for the purpose of statistical computations
and for ease of comparison with the discrete five-point scores used in the self-assessment
scales. Hence, when it was necessary to use test totals, these were out of a total possible
score of 40 for both the reading and writing tests.
Test results are presented in three parts. The first part presents and analyses total test
results from the two tests. This is followed by a breakdown of results according to whether
students were taught by bilingual or English-speaking tutors. Thirdly, the number of hours
of weekly instruction (two or twelve hours) they were receiving is considered.
Total sample test results: Reading
The mean values at each level of the two assessments of performance had increased
between the two reading tests. There was also a clear distinction between two main areas of
ability - those covered by Levels 1 - 4 on the test scale and those between Levels 5 - 8. Test
takers found the tasks at the first four levels considerably easier to perform (See Table 34).
Just as with the self-assessments, the performance assessments showed that students were

119
not necessarily finding the level of difficulty of test tasks in the expected sequence.
However, the result did show that, with instruction, the perception of the sequencing from
easier to more difficult tasks changed among the participants, with their perception of the
sequence closer in the final tests to the levels chosen by the test writers than had been the
case in the initial tests. By the final tests, students had begun to find it easier to read
information on a simple form, whereas in the initial tests they had found it easiest to read
names and recognise the sounds of letters.
The results also showed that students were finding it easier to read a short simple
story in both tests than to perform the tasks listed at the three higher levels. The test
descriptors had placed this at the highest level (8) of the test. Students had greater difficulty
reading bus timetables and finding words arranged in alphabetical order than in reading a
story, although these tasks had become slightly easier after instruction.
Table 34 Performance assessment: Reading
Level Task description Performance Test 1 Performance Test 2 Mean s.d. Mean s.d.
1 Is able to read information on a simple form
3.31 1.47 4.57 1.06
2 Is able to read names and know the sounds of letters
3.94 0.97 4.26 0.89
3 Is able to read dates 3.06 1.52 4.28 1.05 4 Is able to read numerals 3.19 1.35 4.00 1.05 5 Is able to read public signs 2.15 1.79 2.97 1.82 6 Is able to read bus timetables .73 1.15 2.48 1.62 7 Is able to find words arranged in
alphabetical order 1.11 1.52 2.36 1.72
8 Is able to read a simple story 1.98 1.88 2.74 2.00 Total mean/40 18.90 8.6 27.38 8.11 Level (0 – 8) 3+ 5+ N 62 61
Mean range = 0 – 5
These results indicate that the level descrip tors and task order in the tests need re-
visiting and fine tuning, to allow for a scale which is more representative of student levels
of performance, particularly at the culmination of the programme of study. This would need

120
to be done with reference to and in combination with the self-assessment scales and the
curriculum.
The mean values on the two reading tests (out of the possible total of 40)
demonstrate the considerable progress students had made in their reading skills. This
translated to a difference of two levels on the 8-point scale - from a 3+ level to a 5+ level of
mean performance (Table 34).
Total sample test results: Writing
Fifty-five research participants (of the 62 who did the initial tests) completed the
writing tests at the end of the programme (see Table 35). The mean results illustrate the
difficulty in predicting progress in performing survival- level writing tasks among pre-
literate and low-level literacy students. Instruction also influences which skills are gained
more fully than others. Generally, the mean results show students had improved in their
skills at each level of performance, although the mean value of student ability to write down
a detailed telephone message had declined considerably in the final test, thereby placing
this task at the highest level (8) of difficulty, when it had been placed at Level 4 in the
initial test. This indicates that the content of this test task or the requirements for answering
this question need to be re-addressed. It may well be that the test task or instructions for its
performance are not clear, or that the task is at a higher level of difficulty due to the
wording. The order of difficulty of the test tasks correlated with the order of test descriptors
to a much greater degree in the final tests than it had in the initial ones. This showed that
instruction had made a difference in learning, particularly in the areas where students
previously had gaps and difficulties.

121
Table 35 Performance assessment: Writing
Level Task description Performance Test 1 Performance Test 2
Mean s.d. Mean s.d. 1 Is able to write lower and upper
case letters 2.57 1.35 4.02 1.15
2 Is able to write information on a simple form
3.02 1.47 3.60 1.33
3 Is able to use capital letters and full stops
1.56 1.46 2.60 1.40
4 Is able to write the date 2.56 1.68 2.98 1.69 5 Is able to write a short letter of
explanation 1.28 1.21 2.13 1.69
6 Is able to write a detailed telephone message
1.69 1.90 1.55 1.66
7 Is able to write about familiar things
1.18 1.15 1.87 1.35
8 Is able to keep a diary 1.11 1.16 1.80 1.24 Total mean/40 14.44 8.83 20.13 8.43 Level (0 – 8) 2+ 4 N 61 55
Mean range = 0 – 5
Although the mean values out of the total possible score of 40 were not as high as
they were for the reading tests, this nonetheless also represented a gain of two levels on the
8-point scale from, a Level of 2+ to Level 4.
Literacy gains: Reading
Statistical analyses were conducted to determine whether mean differences between
Tests 1 and 2 were significant. For this analysis, all students were given a test score out of a
total possible score of 40. As the results in Table 36 show, the gains made in reading were
highly significant. In fact, when total scores were matched for each individual student
between Test 1 and Test 2, 53 of the 61 participating students had gained higher scores in the
final tests. Six students' scores had declined, and it may be that other factors had a bearing on
this; irregular student attendance and the onset of Ramadhan were possible factors (see
methodology section on constraints).
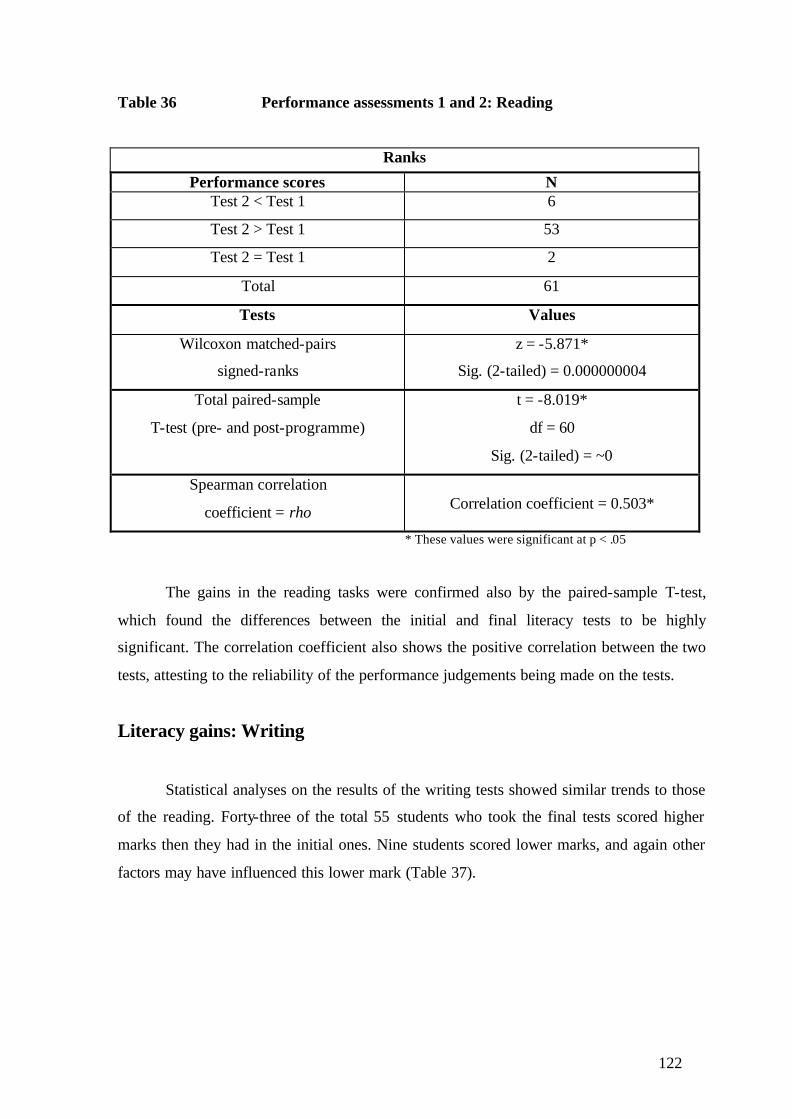
122
Table 36 Performance assessments 1 and 2: Reading
Ranks
Performance scores N Test 2 < Test 1 6
Test 2 > Test 1 53
Test 2 = Test 1 2
Total 61
Tests Values
Wilcoxon matched-pairs
signed-ranks
z = -5.871*
Sig. (2-tailed) = 0.000000004
Total paired-sample
T-test (pre- and post-programme)
t = -8.019*
df = 60
Sig. (2-tailed) = ~0
Spearman correlation
coefficient = rho
Correlation coefficient = 0.503*
* These values were significant at p < .05
The gains in the reading tasks were confirmed also by the paired-sample T-test,
which found the differences between the initial and final literacy tests to be highly
significant. The correlation coefficient also shows the positive correlation between the two
tests, attesting to the reliability of the performance judgements being made on the tests.
Literacy gains: Writing
Statistical analyses on the results of the writing tests showed similar trends to those
of the reading. Forty-three of the total 55 students who took the final tests scored higher
marks then they had in the initial ones. Nine students scored lower marks, and again other
factors may have influenced this lower mark (Table 37).
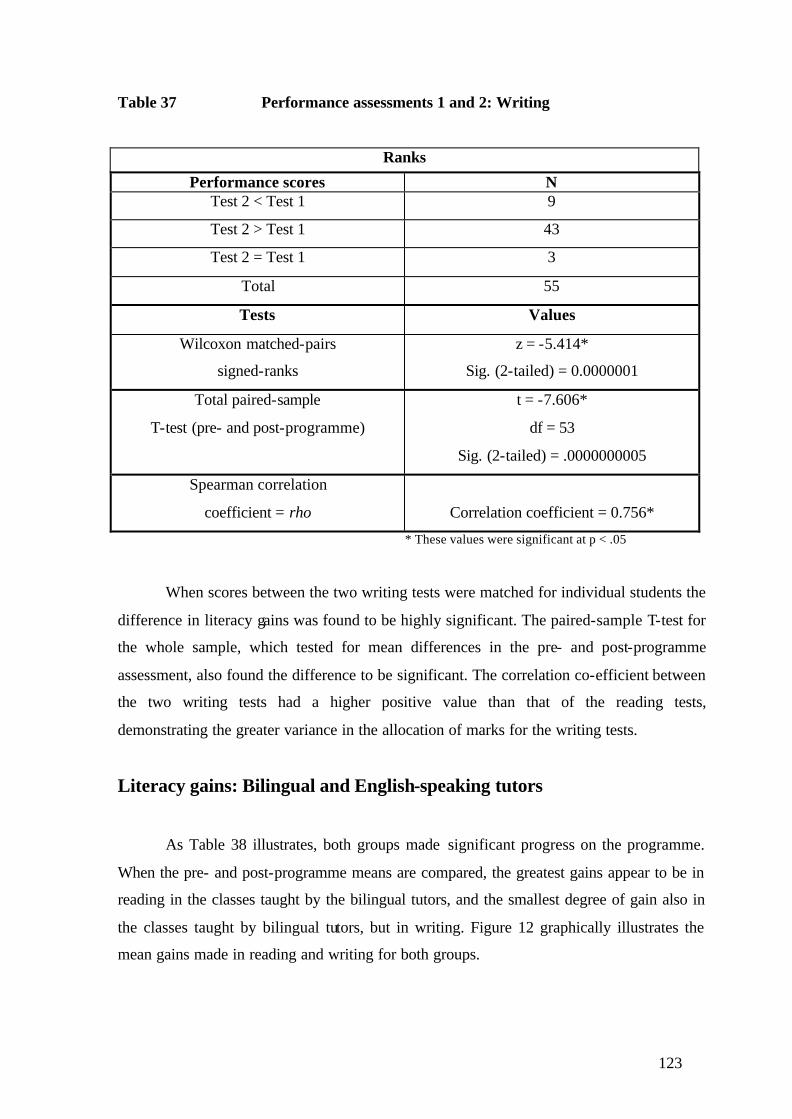
123
Table 37 Performance assessments 1 and 2: Writing
Ranks
Performance scores N Test 2 < Test 1 9
Test 2 > Test 1 43
Test 2 = Test 1 3
Total 55
Tests Values
Wilcoxon matched-pairs
signed-ranks
z = -5.414*
Sig. (2-tailed) = 0.0000001
Total paired-sample
T-test (pre- and post-programme)
t = -7.606*
df = 53
Sig. (2-tailed) = .0000000005
Spearman correlation
coefficient = rho
Correlation coefficient = 0.756*
* These values were significant at p < .05
When scores between the two writing tests were matched for individual students the
difference in literacy gains was found to be highly significant. The paired-sample T-test for
the whole sample, which tested for mean differences in the pre- and post-programme
assessment, also found the difference to be significant. The correlation co-efficient between
the two writing tests had a higher positive value than that of the reading tests,
demonstrating the greater variance in the allocation of marks for the writing tests.
Literacy gains: Bilingual and English-speaking tutors
As Table 38 illustrates, both groups made significant progress on the programme.
When the pre- and post-programme means are compared, the greatest gains appear to be in
reading in the classes taught by the bilingual tutors, and the smallest degree of gain also in
the classes taught by bilingual tutors, but in writing. Figure 12 graphically illustrates the
mean gains made in reading and writing for both groups.

124
The variances of the two groups taught by bilingual and English-speaking tutors
were found to be significantly different from one another in the initial Writing Test 1 and in
the final Reading Test 2 (see Independent samples T-test, Table 38). This showed that
students who were to be taught by bilingual tutors were in fact starting the programme with
significantly lower writing ability than those who were to be taught by English-speaking
tutors. By the end of the programme, those taught by bilingual tutors had made significant
gains in reading, and had also managed to reduce the variance in writing skills so that the
variances between the bilingual tutors' and English-speaking tutors' classes no longer
existed.
Table 38 Literacy gains in performance tests: Bilingual and English-speaking
tutors
Reading Writing Means Bilingual
tutors English-speaking
tutors
Bilingual tutors
English-speaking
tutors Mean S.d. Mean S.d. Mean S.d. Mean S.d. Performance test 1 (pre-programme)
19.91 9.81 18.35 7.98 13.91 11.39
14.74 7.15
Performance test 2 (post-programme)
30.14 5.40 25.93 8.95 18.14 8.06 21.35 8.53
Range 0 – 40 Test 1 total sample
22
40
22
39
Test 2 total sample 21 40 21 34
Tests Wilcoxon matched-pairs signed-ranks test Test scores:
Test 2 < Test 1 2 4 5 4 Test 2 > Test 1 19 34 15 28 Test 2 = Test 1 0 2 1 2 Totals 21 40 21 34 Z -3.775* -4.449* -2.990* -4.572* Significance (2-tailed) .0002 .0001 .003 .000005 Independent-samples T-test:
f Significance f Significance
Levene’s test for equality of variance
Test 1 3.733 .058 16.025* .0002 Test 2 6.610* .013 .011 .918 Total 62 62
* These values were significant at p < .05

125
On a case-by-case comparison, it was clear that substantial and significant gains had
been made in both reading and writing tests by a majority of students of both groups (see
Wilcoxon matched-pairs signed-ranks test, Table 38). A comparison with self-report data
will show whether perceived and actual gains were similar. Verbal comments by the tutors
on a somewhat ‘collaborative’ approach to the tests on the part of the students may have
skewed the results (Appendix 9). However, even if collaboration contributed to the
significant gains recorded in the tests, this is a feature that future tests will need to
accommodate, since it is clear that collaboration works well with this group of learners in
literacy tests. Students collaborated in both tests but did better in the final test. This could
show an increased ability in test-taking skills, in collaborative approaches to testing or in
performing literacy tasks by the end of the programme.
Figure 12 Student performance gains: Bilingual and English-speaking tutors
Performance gains versus bilingual and English-speaking tutors
0
5
10
15
20
25
30
35
Reading: Bilingual tutors
Reading: English tutors
Writing: Bilingual tutors
Writing: English tutors
Tutor type
Mea
n pr
ofic
ienc
y
Test 1Test 2
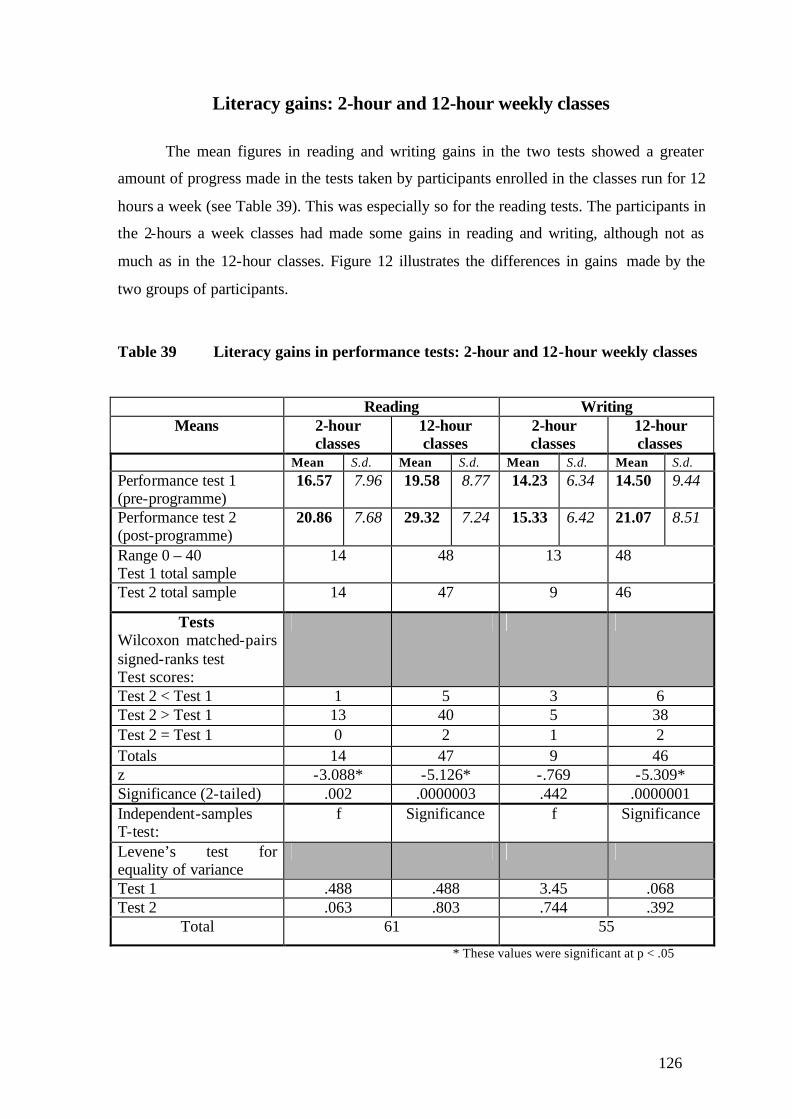
126
Literacy gains: 2-hour and 12-hour weekly classes
The mean figures in reading and writing gains in the two tests showed a greater
amount of progress made in the tests taken by participants enrolled in the classes run for 12
hours a week (see Table 39). This was especially so for the reading tests. The participants in
the 2-hours a week classes had made some gains in reading and writing, although not as
much as in the 12-hour classes. Figure 12 illustrates the differences in gains made by the
two groups of participants.
Table 39 Literacy gains in performance tests: 2-hour and 12-hour weekly classes
Reading Writing
Means 2-hour classes
12-hour classes
2-hour classes
12-hour classes
Mean S.d. Mean S.d. Mean S.d. Mean S.d. Performance test 1 (pre-programme)
16.57 7.96 19.58 8.77 14.23 6.34 14.50 9.44
Performance test 2 (post-programme)
20.86 7.68 29.32 7.24 15.33 6.42 21.07 8.51
Range 0 – 40 Test 1 total sample
14 48 13 48
Test 2 total sample 14 47 9 46
Tests Wilcoxon matched-pairs signed-ranks test Test scores:
Test 2 < Test 1 1 5 3 6 Test 2 > Test 1 13 40 5 38 Test 2 = Test 1 0 2 1 2 Totals 14 47 9 46 z -3.088* -5.126* -.769 -5.309* Significance (2-tailed) .002 .0000003 .442 .0000001 Independent-samples T-test:
f Significance f Significance
Levene’s test for equality of variance
Test 1 .488 .488 3.45 .068 Test 2 .063 .803 .744 .392
Total 61 55
* These values were significant at p < .05

127
The Wilcoxon matched-pairs test of significance matched the final test results of
individual students who had completed both tests to their initial test results (Table 39). This
test found significant progress made in both reading and writing tests by students on the 12-
hour weekly programmes, but only in the reading tests by the 14 students who had
completed the 2-hour weekly classes. In fact when the matched-pairs are compared for the
2-hour classes, 13 of the 14 students did better in the final reading test than in the initial
one. The number of students who did the final writing test in the 2-hour classes had fallen
considerably, as only nine of the 14 students who took the initial and final reading tests also
did the final writing one. Also, only five of the nine students of the 2-hour classes who took
the final writing test did better in it than in the initial test. The matched-pairs signed-ranks
figures illustrate the large number of students in the 12-hour classes who scored marks
which were higher in the final tests than in the initial ones.
Figure 13 Student performance gains: 2-hour and 12- hour classes
Performance gains versus 2-hour and 12-hour classes
0
5
10
15
20
25
30
35
Reading: 2-hour classes
Reading: 12-hour classes
Writing: 2-hour classes
Writing: 12-hour classes
Class type
Test 1
Test 2

128
The independent-sample T-test, which tested for equality of variances between the
two groups of students showed significance values of p>0.05, therefore the variances of the
groups were not significantly different from each other in any of the tests (Table 39).
The data shows, therefore, that while classes which constitute 12 hours a week of
instruction are more effective for literacy study than those which offer two hours, both are
of benefit to students. Thus, even two hours of instruction a week for a period of 20 weeks
can be effective, if attendance is consistent and other factors do not disrupt the study
programme. The graph in Figure 13 illustrates the gains made in literacy for the 2-hour and
12-hour classes.
A comparison – reported and assessed literacy
The results for both the self- and the performance assessments have so far shown the
gains made in the literacy programme undertaken by the research participants in the study.
They have also indicated ways in which the instruments could be revised and fine-tuned to
more accurately reflect the processes and order in which learning takes place.
A comparison of the means of the initial self-assessments and literacy test shows
that students were overestimating their abilities in both reading and writing (See Table 40).
A paired-samples T-test was used to compare and test the difference between the means of
the initial self- and performance assessments. The difference was significant in both reading
and writing assessments. When converted to a 'Level' score, based on the 8-point
descriptors of achievement for the programme, there was a difference of a whole level
between what the students felt they could do and the functions which they showed they
could realistically perform when tested.
By the time the programme finished however, there was a greater congruence
between reports and actual test results of writing proficiency, although students had
underestimated their reading proficiency by a level when compared to their reading test
result. This confirms the earlier premise that by the end of the programme students seemed
to have greater awareness of their shortcomings in literacy.

129
The participating students consistently showed a higher reading ability than writing
in all self-assessments and tests – a result which was expected, as it is usually easier to
acquire passive language skills than active.
In order to validate the self- report scales, the Wilcoxon matched-pairs test of
statistical significance was used to match the self-assessment and test results of each
individual student, and this is illustrated by the figures in Table 40. The result showed
significant differences between individuals' self-assessment and test results for the initial
assessments in reading and writing. They were also significantly different for the final
reading assessments. The result of the final writing self-assessment and test showed non-
significant differences, which means students were estimating their writing proficiency with
a greater degree of accuracy. This was also borne out by the results of the paired-samples
T-test, which showed non-significant variances between the two procedures for the final
writing assessments, and significant variances for the other three assessment events (see
Table 40).
Finally, the Spearman correlation coefficient indicates that generally, there was a
positive relationship between the self-assessments and the tests. This seemed to be stronger
for the reading assessments than for the writing. However, they do provide general validity
for the self-report scales, since the majority of the respondents who were reporting their
proficiency at relatively high levels were, in fact, likely to be rated higher on the
performance scales as well.

130
Table 40 Reported and assessed literacy: Time 1 and Time 3, pre - and post-
programme
Assessment: Means N Level Reading N Level Writing
Mean s.d. Mean s.d. Reported Time 1 62 4+ 22.29 9.18 62 3+ 18.61 9.46
Test 1 62 3+ 18.90 8.62 61 2+ 14.44 8.82 Reported Time 3 62 4+ 24.16 9.15 62 4+ 21.26 9.27
Test 2 61 5+ 27.38 8.11 55 4 20.13 8.43 Spearman correlation coefficient = rho
Report Time 1 – Test 1 0.570 0.268 Report Time 3 – Test 2 0.550 0.439
Wilcoxon matched-pairs signed-ranks test Time 1
Reported ability < Test 1
18
26 Reported ability > Test 1 36 34 Reported ability = Test 1 8 1
z -3.141* -2.873* Significance .002 .004
Time 3 Reported ability < Test 2
36
22
Reported ability > Test 2 22 30 Reported ability = Test 2 3 3
z -2.670* -1.135 Significance .008 .256 Paired-samples T-test
Report Time 1 – Test 1 t -3.287* -3.106*
df 61 60 Sig. (2-tailed) .002 .003
Report Time 3 – Test 2 t 2.853* -1.273
df 60 54 Sig. (2-tailed) .006 .209
*These values were significant at p<. 05.

131
Summary: Assessed and reported literacy gains
The results of the final tests indicated the significant gains made in literacy over this
programme of study. For the total test population, this represented a movement of two
levels on the 8-Level table of descriptors (Appendix 7) developed for the programme, in
both reading and writing. The research participants had entered the programme with higher
levels of reading ability than writing. They also finished the programme with better reading
than writing skills. Those who had entered the programme with higher levels of literacy
ability performed correspondingly well on the final assessments.
Analyses were performed between the two groups taught by bilingual and English-
speaking tutors and found significant gains made in both groups. Significant differences
were found in the variances between the two groups on the final reading assessments,
where those being taught by bilingual tutors appeared to have made considerable gains.
Analyses were also performed between groups having 2-hour and 12-hour weekly
instruction; the mean differences indicated that 12 hours a week of instruction benefits both
reading and writing. Two hours a week of instruction seems to benefit reading more so than
writing ability. Overall, group variances were not significantly different however, which
illustrates the general benefits of literacy instruction, regardless of the contact hours
devoted to it.
When assessed and reported literacy skills were compared, significant differences
were found in the initial reading and writing assessments, and in the final reading
assessment. By the end of the programme, students were making a more reliable estimate of
their writing abilities. The results indicate that further work is needed to fine-tune the self-
assessment scales and comparative test performance descriptors to allow greater
congruence between the two, and a more realistic grading of skills in an ascending order of
difficulty. There was evidence, however, that the mid-point at Level 5 of the descriptors
was appropriately placed, and student performance on tasks from Levels 1 - 4 and Levels 5
- 8 were generally falling on either side of this level.

132

133
CASE STUDIES: RESULTS
Introduction
The main objective of this component of the project was to determine the needs of
learners in low-level literacy and ESOL courses. It was also to identify the teaching
methodologies and course design which best support their progress.
The analysis of the data demonstrated that the needs of the students in the two
classes included in this study were very different. This was made abundantly clear in the
initial test results. The range of raw marks for Class 1 was 44 – 171, with the median mark
being 107, which was approximately half of the total score. These students had recently
arrived under the family reunification criterion. All were literate in their first language, and
all had had a reasonable amount of previous education. These characteristics would be
expected to enhance the students’ capacity to make progress. Their age range was similar to
that of Class 2. Class 1 had a native English-speaking tutor.
The range of raw marks for Class 2 was 7 – 72, with the average student achieving
44.5. The profile of the Somali women in Class 2 demonstrates the factors which may have
influenced their assessment performance. All were pre- literate and none had had any
education nor, therefore, any experience of classroom learning. This profile is consistent
with that of a considerable proportion of refugees, and has had a negative impact on their
achievement. Class 2 was being taught by a bilingual tutor.
The results of this study confirmed that there was a range of levels and needs within
the sample of students selected for literacy and ESOL courses. The fact that each group has
different starting points at the commencement of the course must be reflected in both the
course design and its delivery. Prior knowledge of the students’ first language literacy and
prior schooling should inform class placement and expectations regarding student progress
and achievement. The profiles of the two different classes reflects the differing students’
learning needs.
The data indicated that the expectations of the students in terms of the outcomes of
the course also differed. While all of the interviewees stressed the importance of learning

134
literacy and English to improve their participation and independence, Class 1 stressed that
their aim was finding employment, whilst the Somali women in Class 2 hoped to achieve
competence in everyday tasks. Both students and tutors expected that the course would
have practical outcomes. As one student commented, her ultimate goal was to have “a
happy and successful life” in NZ.
Tutors felt that it was vital that the course design was responsive to student needs. If
course materials and activities are based on real- life situations, this enhances the students’
motivation to learn, as they can see the relevance and usefulness of the language.
Both tutors identified a delay in the confirmation of the course curriculum and the
content of the first assessment. This was viewed as problematic by Tutor 1, who also felt
that the assessment became the focus of the course, which was confusing for students and
demanded a certain amount of guesswork for the tutor. At the outset of the course, Tutor 2
based her curriculum content and the introduction of literacy skills on the students’ needs.
The fact that this delay was of less significance to her perhaps reflects the lower level needs
of her students and the foundation skills which they had yet to develop.
Both tutors felt that classrooms should have a supportive and respectful atmosphere
where mutual trust has been established. They identified the essential components of course
delivery as continual repetition, and the introduction of new language in a carefully
controlled and appropriately-paced manner. They agreed that realia and pictures were the
most effective teaching resources for low-level students.
In terms of the characteristics of successful learners, the tutors ranked literacy in the
students’ first language as the crucial factor. Youth was a definite advantage, as the elderly
have difficulty in retaining new learning. Having previous education and prior familiarity
with classrooms and learning were seen as being very important. Having confidence,
motivation and study skills were the other indicators of a successful student.
The students were unanimous in their support for the timing, duration and location
of the courses. Both classes expressed appreciation of their tutors and all students were
satisfied with the progress achieved in the course. All students identified the need for

135
further study, and getting employment was the ultimate aim of most. All students had a
positive view of NZ and NZers.
The Asian students all professed a sense of it being their duty to undertake English
study, as the government was supporting them. One of them also felt reluctant to comment
on his tutor’s teaching methods, as this was perceived as disrespectful.
There was some frustration regarding admission to TOPs courses. This was
perceived as being a very slow process for those with employment aspirations, and there
were particular problems related to eligibility and level of English proficiency. Two
students suggested that the courses could be linked with employment or practical activities
such as sewing and cooking.
Specific case studies: Research findings
Student interviews
In each of classes 1 and 2, three students who had achieved at the upper, middle and
lower ends of the initial performance assessments were interviewed with the support of
interpreters. The interviews were of 30-40 minutes’ duration. Class 1 had a native English-
speaking tutor and class B a bilingual tutor.
The highest achiever in Class 1 was a young Vietnamese woman who had been in
NZ for less than a year, and had previously completed between six and eight years’
education. She was unemployed.
When asked about why she had chosen to study English, she explained that she
could not speak the language on arrival. She understood that it was essential for building a
satisfying and successful life in NZ. She had chosen this particular course because it offered
a higher number of hours of study per week. She expected to learn from her fellow students,
and hoped to learn language that would be useful in her everyday life. She felt that she had
grown in confidence during the course and that she had made good progress. She identified
learning street names, how to shop and catch a bus as useful components of the course.
136
She described her enthusiasm for attending the class and the challenge of learning
something new. Understanding NZers’ ve ry fast delivery of spoken English was her
greatest challenge. In terms of which classroom activities she found most enjoyable, she
identified listening to tapes, reading and working from pictures. She described the timing of
the course as being convenient, as transport could be a difficulty in the evening. She
commented that as the government was paying a benefit, it was her duty to study in order to
find employment.
In terms of the social outcomes of her English study, her vocabulary was becoming
more extensive, and she was learning about the NZ way of life. She commented that the
lifestyle in Asia was so completely different that everything was new in NZ and had to be
re-learnt.
When asked about how well she had settled, she responded by explaining that she
had been very lonely initially, but had found people friendly and helpful. The climate suited
her and she hoped to learn English quickly and find a job. She acknowledged, however, that
she would need to enrol in another course in order to achieve this aim.
Participant 258 achieved an average mark in the assessment task. He was a
Vietnamese man aged between 31 and 40 years, who had been in NZ for less than one year,
and had been repairing electrical appliances from home. His reasons for studying English
were to improve his interaction with NZers, and to get a job in order to support his family
rather than remaining dependent on the government. He had chosen this particular course in
order to accelerate his English learning.
He described himself as under-confident at the start of the course, but he had
improved, particularly in listening, as he could now identify individual words but had yet to
understand the structure of English. He acknowledged the inaccuracy of his pronunciation.
He felt a little dissatisfied with the pace of the lessons, describing them as too slow. He
refused to comment on the teaching techniques that he enjoyed, remarking that it was the
teacher’s role to design the lessons. He did describe the NZ style of teaching as being
different from that in Vietnam.

137
He explained that he was accustomed to working all day and that he felt nervous
and insecure about having to think and learn at this stage of his life. He suggested that an
ideal combination would be study during the day and having a job in the evening. He was
finding it difficult to make friends in the class, commenting that his fellow students
“weren’t open”. He also felt that the students would have benefited from the class being
bigger. In terms of settling into life in NZ, he felt that the course was helping him
considerably in his new life. He was now able to shop independently, and was beginning to
understand English when it was spoken to him. He described himself as feeling sad on
arrival but, with increased familiarity, he was enjoying being in NZ.
He described himself as having grown in confidence since the start of the course. He
felt the course had given him a good start, and he hoped to continue his English study. His
ultimate goal was to gain sufficient proficiency to attend a TOPs course.
Participant 261 was a Cambodian male aged over 50 years. He had completed eight
years of formal education. His was the lowest mark in the class. He described his reasons
for studying English as being to interact with NZers and to achieve a better future in this
new country.
He agreed that by being more substantial than previous courses he had taken, this
course was likely to extend his knowledge of English. He explained that it was not difficult
for him to attend class, as he had nothing else to do. He expressed thanks to the government
for providing the course.
He said that he was very glad to come to lessons, as he enjoyed interacting with
others. When asked about the learning activities he found challenging and easy, he
commented that he struggled to understand the tutor’s instructions, and that he still needed
to master the basics of English. He identified his progress as becoming more confident in
using the language and improving his listening skills.
He identified the opportunity to establish good relationships with his fellow students
as another highlight. He felt he was getting to know himself better and getting to find his
way around. He described NZ as a law-abiding country where the lifestyle is modern and
138
sophisticated, and NZers are happy. He also anticipated enrolling on another, similar course
to continue his preparation for finding work.
Participant 36, a Somali woman, achieved the highest score in Class 2. She had been
in New Zealand for less than a year and was aged between 21 and 30 years. She had no
previous education or employment.
She described her motivation for studying English as being due to the fact that
English is an international language and that she needed the language to converse with
others and to get a job. She also acknowledged that learning English for 12 hours a week
would enhance her rate of progress. She described herself as feeling happy and relaxed in
class and that the course was providing a good foundation for her English studies. Whereas
she began the course understanding no English, she was now able to fill in forms, answer
the telephone and go shopping using the new language. She could also comprehend some
English on television. She was appreciating being able to now understand others using
English, and being understood when she used it herself. She felt that with increased English
literacy and language skills, she was now better able to cope with everyday life in NZ.
She gave an enthusiastic response regarding the quality of the course, commenting
that her favourite classroom activities were multiple-choice comprehension exercises, cloze
tests, speaking and listening. She said that the timing of the class was ideal for her,
particularly as she had no children. She was appreciative of the location of the course, as
she was able to walk to class. Furthermore, she was enjoying the camaraderie of the course
and the opportunity to chat with fellow students. She said that she often received support in
solving personal problems.
She described herself as feeling happy in NZ, as it was a peaceful and beautiful
country occupied by friendly people. Her aspirations were to acquire enough English to
participate fully in life in NZ. She also hoped to continue her English study.
Participant 46 achieved in the middle of the class in the initial tests. She was a
Somali woman of over 50 years of age who had been in NZ between three and five years.
She had no previous education and had never had a job. She described her reasons for
studying English as wanting to speak the language spoken in NZ. By achieving some

139
proficiency, she hoped to gain independence in everyday tasks such as banking and
shopping.
In terms of the course, she said that longer hours were helping her learn more than
the one to two hours weekly she had previously received from a home tutor. She explained
that she had gained sufficient confidence in using the English language to answer the
telephone, fill forms, give her address and answer her children’s questions.
She felt that the bilingual delivery of the lessons provided a “short cut, has made the
study easier and has supported more rapid progress". She also commented that she would
like to learn English linked with activities such as sewing, first aid and cooking.
In terms of the classroom activities, she said that she liked taped listening exercises,
but found grammar and sentence-writing difficult. She was using television to practice her
English, and acknowledged that she appreciated the social atmosphere of the class and the
opportunity to “get together” with the other women. She said that they could talk through
problems and chat about their children. This eased tension and enhanced the women’s sense
of well-being. She also praised the convenience of the timing and location of the classes.
She described herself as feeling comfortable in NZ, as it is safe and “clean and
green”. She commented that “nobody bothers you”. At the conclusion of the course, she
wanted to continue with her studies and, some time in the future, attend university.
Participant 39 was a Somali woman who received the lowest score when assessed.
She was older than 50 years, had been in NZ for between one and two years, and had never
attended school or worked.
She wanted to attend the course as she wished to have enough English and literacy
to do practical tasks. She described becoming able to do banking and shopping as
important. She attended this particular course because she liked the bilingual teacher, and as
her children were at school during the morning, a class in the evening would present
transport problems.

140
She described herself as feeling confident in class, as the atmosphere was good and
the teacher supportive. She explained her progress by commenting that she was unable to
write her name when she arrived at the class and that she could now do that and more. In
terms of why she liked the course, she said that it was bilingual, that the students were all
African and all women. She said that these factors meant that she could get help with
problems and talk with friends.
She identified cloze tests as her favourite classroom activity and said that she had
learnt how to use English to shop, socialise, help her children and go to the doctor. She
could use her newfound literacy skills to fill the gaps in a reading passage, copy and read
some English. She hoped to attend another course.
Tutor interviews
Both of the tutors were women with considerable teaching experience. Tutor 1 had
worked for the South Auckland ESOL Home Tutor Scheme for the previous three years and
had previously taught adult literacy. Tutor 2 had worked for many years in the Ministry of
Education in Mogadishu, Somalia, before teaching ESOL in Dubai. She was working on a
part-time basis for the West Auckland Home Tutor Scheme. Tutor 1 was NZ-born and
Tutor 2 was from Somalia.
In response to the first question regarding a definition of literacy, Tutor 1 described
it as the ability to read and write in one’s own language. Tutor 2 agreed but added that
literacy in a second language meant being able to manage everyday life in the new
linguistic context.
Question two explored the tutors’ philosophies of teaching. Tutor 1 felt that it was
important to be responsive to students’ needs in terms of the curriculum. She felt that
courses should include the functional language that is useful in everyday life. This would
support the development of the students’ participation and independence. Other long-term
goals would be to enhance the students’ quality of life and enable them to socialise. It was
also seen as important to establish a friendly and supportive classroom atmosphere. If the
tutor was able to assess and target the level of the students, progress could be achieved.
Tutor 1 acknowledged the difficulties of finding appropriate resources for adults learning
141
basic English. She gave the example of finding resources for teaching the alphabet, which
could sometimes be demeaning, as they were designed for children.
Tutor 2’s response was to highlight the significance of establishing a relaxed
atmosphere in the classroom and demonstrating respect for the students. By being
supportive and responsive to their needs, the tutor could support the students’ learning. She
described the process of moving from what was within the students’ experience to the
unknown when teaching new material and using all of the senses to achieve the necessary
repetition and memorability. Tutor 2 favoured activity-based learning in real situations.
The third question was regarding the teaching methods which are most effective in
the delivery of low-level ESOL courses. Tutor 1 recommended using materials that relate to
everyday life. She felt that new language should be introduced slowly, building on previous
learning. It was vital to allow sufficient time for new learning to consolidate. There should
be a logical progression within and between curriculum topics. Realia and pictures were
useful teaching aids. She felt that matching pictures with new words was a useful exercise,
as unfamiliar concepts could be illustrated. Revision was a vital and regular component of
the programme. Due to the emphasis on developing literacy skills, she had included the
teaching of phonetics, consonant blends and diphthongs at the commencement of the
course. Finally, she thought it was important to balance the practice of the four skills.
Writing was the most challenging skill for all of her students.
Tutor 2 considered that it was invaluable to give classroom instructions in the
students’ first language, as this aided comprehension and enabled a variety of classroom
activities. This latter point was especially significant in low-level ESOL courses, as much
repetition was necessary. She was emphatic that the target language should predominate in
the bilingual classroom but that, for example, translation of a new word could enhance
student learning. She described the usual sequence when introducing an activity as giving
instructions in Somali for participating in a dialogue, and then the students conducting the
dialogue in English.
She agreed that students in English-only classrooms got bored and frustrated due to
their limited comprehension. She cited the example of delivering a language lesson in
Somalia to Home Tutor trainees. She would not allow them to write in English and refused

142
to speak English herself, which resulted in much confusion, anxiety and frustration, as the
trainees experienced how pre- literate students feel in conventional classrooms.
Tutor 2 also described how she designed many of the classroom materials herself,
especially at the beginning of the course to ensure their relevance and appropriateness for
the students. If materials were sourced elsewhere, she would modify them to reflect the
level and interests of the students. She explained that it was essential to use a large print
size in handouts as many of the students had poor eyesight.
Question four asked the tutors how they catered for the needs of low-level students.
Tutor 1 described typical classes of this kind as having at least two proficiency levels. She
commented that the impact of this was far greater in 12-hour weekly classes than in the 2-
hour ones that were previously the norm. She felt that the greatest challenge was to be
responsive to the needs of the students at the bottom end of the class. A technique she used
was to modify the level of difficulty of questions according to the student’s proficiency
level. Generally, she used the same classroom materials for all students. She had also found
it effective to vary the combinations of students in pair work. It was particularly successful
when more able students were paired with the students who were struggling. The learning
was enhanced when the pair shared the same first language. She has also found that
establishing teams based on gender created a lively competitive and dynamic atmosphere.
Tutor 2 addressed the pastoral element of her role in terms of catering for student
needs. She described how she often changed the timing of her students’ appointments and
accompanied them to meetings or appointments, acting as an interpreter and mentor. The
class also had discussions about current events such as the possible repercussions of the
September 11th disaster. They were all very afraid of a potential backlash, and discussed
how they should behave should they or family members be abused in any way. Using
emergency telephone services was recommended and became an activity practised in class.
When asked to detail the characteristics of students most likely to succeed in their
literacy and English learning, Tutor 1 responded that those students who were willing to
practice and revise would do well. They needed to be able to listen carefully and make the
necessary changes. They should be relaxed about making mistakes, accept the inevitability
of confusion, and test themselves in terms of their language learning. They should have

143
good powers of concentration and an understanding of the teacher’s expectations and
classroom routines. Having confidence, being young and having a good education were
perceived as significantly beneficial factors. The successful student also needed stable
personal circumstances, as illness in the family or responsibility for many children could
interfere with attendance and concentration.
Tutor 2 agreed that the younger students were more likely to succeed, as the older
students had poor memories and had difficulty retaining new knowledge. She commented
that the younger students were benefiting from the longer hours of study and the enhanced
opportunities for revision. They also had input into the content of the course and they
requested topics such as catching the bus, using the telephone and going shopping. The
tutor’s responsiveness to their needs had increased their motivation to learn. Being literate
in their first language was identified as a critical indicator of potential success. This
provided the foundation for learning a new script and set of language rules. Being able to
use the first language to teach the sounds and shapes of the letters in the alphabet was also
advantageous.
The fifth question was regarding outcomes for the students at the conclusion of the
course. Tutor 1 responded that some of the students were disappointed with their progress
and most wished to continue their English study. While their confidence in using English
had improved, few were sufficiently proficient or eligible for a TOPs course. Several had
made sufficient progress to successfully compose a letter to a school explaining an absence.
Tutor 2 hoped that her students would leave the course with mastery of some simple
tasks in English. They had learnt to write appointments and the date, make a shopping list
and fill in forms with personal information. They could use a calendar and identify days of
the week and months of the year. They understood alphabetical order and had experience of
using a dictionary. They had been introduced to reading maps, and could identify where
they lived and ask for directions. They had learnt to tell the time and would experience
catching a bus and reading simple timetables before the end of the course.
Question six related to the assessments being used in the course and their
relationship with curriculum development. Tutor 1 suggested that there could be a danger in
putting too great an emphasis on assessment, as the test becomes “an end in itself”. To

144
avoid this, she had endeavoured to incorporate the teaching of the necessary skills within
the topics. There was some concern that the topics were too broadly-defined. Examples
given were “write about familiar things” and “read a simple story”. Furthermore, the actual
public signs that students should be able to read were not identified. Delivery of the
curriculum would have been facilitated by a more prescriptive outline of appropriate course
content. The tutor felt that the students did not understand the purpose of the test. Concern
was also expressed about the curriculum not being available prior to the initial test, and that
considerable time was lost teaching the language of tests such as “underline”, “circle” and
“match”.
Tutor 2 acknowledged the relevance of the assessment to the curriculum, but
pointed out that the latter was not formalised until after the commencement of the course.
She did not see this as problematic, as a teacher of literacy is experienced and well-
equipped in terms of the content of the teaching and appropriate teaching materials. She
commented, “When you have a student who can’t read and write, who doesn’t know the
sounds or systems of the letters, that is where you start…. There is so much for the students
to learn, and this provides the basis of a curriculum”. The content Tutor 2 chose to teach
was reflected in the items included in the assessment.
When asked if any additional forms of assessment had been utilised, Tutor 1
described the informal assessment she used daily in the form of monitoring the
effectiveness of students’ learning. Tutor 2 also used informal tests such as matching the
sounds and shapes of letters, and dictation to check the students’ progress and allow for
reinforcement of new learning.
Classroom observations
Literacy classes were being delivered as blocks of three hours in the mornings from
Monday to Thursday.
Class 1 consisted of 11 students, six being female and five male. Eight were from
Vietnam, and there was one student from each of the following countries: Cambodia, China

145
and Iran. Students were seated at desks arranged as three sides of a rectangle and the tutor
led the class from the front. The teacher was a native speaker of English.
Class 2 consisted of 13 students. The majority were from Somalia and there were
two students from Ethiopia. The tutor’s first language was Somali but she was also fluent in
Arabic, which she could use with the Ethiopian students. The classroom was arranged in the
conventional manner with rows of desks facing the whiteboard from where the teacher led
the class.
The content, resources and related activities of Class 1’s lesson were as follows:
There was a brief discussion about fireworks at the commencement of the class. The
students then revised the use of “how long does it take to…” as a whole class exercise, with
one student questioning another using a prompt provided on individual slips. An overhead
transparency (OHT) was used to introduce the concept of safety, as well as the use of the
auxiliary verb ‘should’ plus an infinitive. This was practised orally, using a handout with
partial sentences. The students then completed this individually. The teacher then modelled
the use of the negative form 'shouldn't'. The class was asked to think of the advice they
would give to a new student attending this class for the first time. They worked in groups,
wrote their sentences on the board and the class worked together to make corrections.
Class 2 was revising dates of birth and dates of arrival in NZ. They began with pair
work, asking their neighbour about their date of birth. Their tutor then worked one-to-one
with students to check the accuracy of their reading of dates. The tutor then demonstrated
how to express a date in figures. The class completed a handout to practice. They then
listened to a tape and circled the appropriate date on a work sheet. These exercises were to
be followed by form-filling, using the new learning.
Both tutors attempted to link the prior experience of students to the content of the
lesson. Tutor 1 checked which side of the road was used for driving in the different
countries of the students and referred to the commencement of the course as a lead- in to the
work on ‘should’ and ‘shouldn’t’. There was an emphasis on speaking and listening in
Class 1’s lesson, but students also did some writing and reading. Practice of the skills of
reading and listening predominated in Class 2, but some writing and speaking did occur.
146
The level, content and pace of the lessons differed. Class 1 focused on the structure
of English, and the content was generally at a higher level. The pace of Class 2’s lesson was
slower and geared to student comprehension. There was more one-to-one interaction
between tutor and student. There was greater attention to repetition and the successful
learning of individual students. Apart from one occurrence, where the mother tongue was
used to explain a new word and clarify instructions, both teacher and students in Class 1
used the target language only. However, the issue was raised by the students, when they
were referring to the class rules to be passed on to new students, that not speaking your own
language was preferable. Class 2 used Somali and English, with the teacher using Arabic to
clarify instructions and the lesson content for the Ethiopians on an individual basis. The
proportion of English versus first language speaking was approximately 60% to 40%.
The tone of the classes was different. The students in Class 2 were very involved in
their work and had been trained to do revision when the teacher was marking individual
work. They were motivated, attentive, and clearly felt some sense of achievement from
their learning and the completion of tasks. Class 1 was equally interactive, but the range of
students’ English proficiency and the lack of reference to first languages did alter the
energy level and degree of participation.
Summary: Case studies
This research project used multiple data sources to “illuminate the immediate
experience of the student in the lived culture of classrooms” (Nunan, 1992). It linked
educational theory and practice to identify the factors which promote successful learning.
The case study methodology provided data which revealed the detail of the educative
process: students’ experience of the course, the learning situations, tutors’ teaching styles
and classroom practice.
As described in the literature review, cross-cultural research is fraught with
difficulties. To undertake such research demands particular characteristics of the initiator.
Of crucial importance is an understanding of the culture and traditions of the participants,
and having long-term involvement with them in order to develop credibility with the
communities concerned. The researcher conducting the case studies had established

147
working relationships with refugee communities, had developed cross-cultural research
methodologies for working with vulnerable groups and had managed on-arrival education
programmes for refugee families.
The research design and data collection was further strengthened by the use of
interpreters from the same ethnic background as the interviewees. Participants could
express their opinions in their first language and the cultural appropriateness of the
methodology could be checked and the accuracy of interpretation of questions and answers
confirmed. The bilingual interviews achieved a depth of detail regarding students’
perceptions of their learning not readily available to educators. The method provided
access to individual student’s motivation for study, their own perceptions of progress, the
experience of arriving and surviving life in NZ, and their aspirations. Such invaluable
information regarding beginning students of English is generally not available to their
tutors, due to their limited English proficiency.
The use of the tutor as the interpreter for the Somali interviews may have influenced
the range of student responses. However, it could also be argued that her familiarity and
support may have alleviated the formality of the unfamiliar situation, and the fear and
mistrust which could be associated with interviews.
The case study aimed to describe, understand and explain the processes of literacy
gain by focussing on the perspectives of the people involved, and the natural context of the
interactions. The consultative approach used in the project successfully identified the
expectations, perceptions and experiences of the students and tutors involved in the literacy
and ESOL course. Their contribution to the study was to provide a “rich, descriptive, real-
life, holistic account” (Burns, 1994: 479) of the process of English teaching and learning.
This has the potential to inform and improve future educational action.
Another aspect of the study which requires further comment is the utilisation of
bilingual delivery for pre- literate students. Clearly, there are often practical difficulties
which preclude this choice, such as the lack of suitably-qualified staff, and student numbers
not justifying an ethno-specific class. However, the case study does confirm the benefits of
this approach.

148
The bilingual tutor's class chosen in this study consisted of Somali and Ethiopian
women. As they themselves said, this created a relaxed and friendly atmosphere which was
conducive to the efforts of new learners. In addition, the bilingual delivery of instructions
facilitated a variety of teaching and learning activities. This also made it possible to link
new language features to the characteristics of the students’ first language. These features
of the bilingual classroom enhanced the students’ learning, and considerably reduced the
frustration and boredom evident in many low-level ESOL classrooms.
The Somali class also had a holistic quality in that, in addition to literacy and ESOL
learning, current issues could be addressed, practical support offered and cultural
orientation taught. It was possible to discuss the attitudes and practices of the host society,
and address problems common to all students in the class. In addition, the students
benefited from the interpreting, advisory and practical support offered by the tutor.

149

150
DISCUSSION AND RECOMMENDATIONS
The main purpose of the study was to gauge if literacy gains were being made on a
20-week literacy programme for pre- literate and low-level literacy adult ESOL students in
Auckland. The students were being taught at three different sites – managed by the West
Auckland and South Auckland ESOL Home Tutor Schemes. The students were receiving
instruction from bilingual and native English-speaking tutors, with a majority attending 12-
hour weekly classes and a minority, 2-hour weekly classes. Although there were 118
students enrolled in the programme over the course of the semester, 62 students completed
most of the tasks which were set as part of this project and, for the purpose of data analysis,
these 62 participants were selected.
Four main methods were used to study the students, the programme, and to
determine literacy gains. These included personal information profiles of the students, case-
study procedures, self-assessment procedures which were conducted at the beginning, the
mid-point and the end of the programme, and literacy tests which were conducted at the
beginning and end of the programme. The self-assessment tasks and the literacy test tasks
were parallel to each other in order to obtain a realistic comparison and to validate the self-
assessment scales, which could then be used instead of actual tests in future programmes. In
addition, six case studies were undertaken to enable a qualitative look at the programme.
At the beginning of the programme, tutors and students were asked to fill in
personal profile forms, which provided an insight into some of the factors affecting
teaching, learning, and literacy gains among pre- literate and low-level literacy learners who
come from disadvantaged and often traumatic backgrounds. Eight tutors participated in the
project – two native English-speakers and six bilingual tutors. All the bilingual tutors had
arrived in NZ as adults and English was their second, third or fourth language. Despite this,
four of the bilingual tutors preferred to speak English bilingually with their own language at
home – an area that needs further investigation as language shift within the first few years
of immigration is fairly unusual amongst adult immigrants.
The tutors were well-qualified and experienced, and all were highly motivated to
teach those in their community who needed literacy help. They were very happy with the
level of support they had received from the ESOL Home Tutor Schemes and staff they were

151
working with, but expressed concern about continuity of funding, the transient nature of
classes, irregular student attendance, the inadequate number of hours spent each week in the
classroom, and the need for further in-service training. Some tutors were also worried about
student attention-span and forgetfulness – which may partly be due not only to the nature
and duration of classes but also to the background of the students. Finally, tutors wanted to
see a further revision of the curriculum, with clearer outlines, objectives and outcomes
linked to specific topics and task-types. They also wanted easier assessment procedures
because of student difficulty with these. A majority of students had never previously
experienced a test-taking session. Collaborative work on the tests and the process of getting
self-reports of literacy were perceived as real problems, needing to be worked into future
test procedures with learners of similar backgrounds at this level.
The student personal profiles also served to provide information about the students’
current perceptions of their English language proficiency, and their hopes and expectations
of the programme at its inception. All the students were first-generation immigrants and
refugees; most had arrived in NZ when they were over 21 years of age and had lived here
for less than five years. They had varied first languages and mother tongues, and wide-
ranging first language literacy levels. They originated from seven different countries.
Over 90% of them had been unemployed in NZ, and prospective employment as
well as the need to use English in a range of survival situations such as filling out forms,
understanding TV, and adapting to NZ society had prompted them to attend the literacy
classes. Only half the participants had received a primary school education.
As with the bilingual tutors, the students too, showed evidence of language shift, as
over 40 percent of them stated that they preferred to use English bilingually with their first
language/mother tongue at home. Gender, country of origin and mother tongue seemed to
be the three variables most affecting language shift. Somali, Afghani and Cambodian
participants were most likely to maintain their home languages.
Bilingual tuition seemed to be in demand for over two thirds of the participants at
the start of the course – a question that would have been good to follow up during final
course evaluations. Participants were divided in their opinion of how the host community
perceived them if they spoke their home language in public. Half were comfortable with it,

152
but the others felt uncertain. Both English and first language proficiencies showed the
passive skills (listening and reading) being stronger than the active skills (speaking and
writing). First language literacy was stronger than English literacy, and had a significant
positive effect on the acquisition of English literacy. English literacy was also affected by
gender, with women displaying weaker abilities. Finally, the newest arrivals had less
competence than those who had arrived earlier in NZ, showing that length of residence had
a significant effect on English literacy in this group.
While it is acknowledged that ‘literacy’ means a great deal more than just reading,
writing and numeracy skills, for the purposes of assessment, these were the primary skills
assessed. Other aspects of literacy, particularly those influenced by the affective domain
and background variables, were covered in the personal profiles and case studies. These
included a gain in confidence in social interaction and progress towards the students’ aims
of preparing for further study, employment and providing more effective support of their
families. They increased their independence by developing coping skills for everyday life
such as using public transport and the telephone. The students also benefited from the
advice and mentoring provided by their tutors, and their cultural orientation was
strengthened in terms of their increased familiarization with the NZ lifestyle and
contemporary issues.
Although all three self-assessments were useful in this study for perceived literacy
gains, it was apparent that having two – the initial and the final would have yielded similar
information. However, having a self-assessment at mid-point allowed the follow-through of
trends in perceived gains by the students. The use of the scale in the initial self-assessment
showed that students tended to feel they were more able to perform numeracy tasks and
meet de-contextualised language demands than to produce language for real functions such
as the filling out of forms. This had, however, changed by the final self-assessments, with
student reports of progress matching their results to a far greater extent.
Students felt they had made significant gains in both reading and writing. An
independent-samples T-test showed that variances in perception of literacy gains between
those taught by English-speaking and bilingual tutors were non-significant, although gains
made by individuals within each group using a Wilcoxon matched-pairs test showed that a

153
majority of students taught by English-speaking tutors felt they had significantly improved
in their literacy ability by the end of the programme.
Variances in reports between the two groups receiving 2-hour and 12-hour weekly
instruction were significant only for the final writing self-assessment, with students in the
12-hour group feeling they had made significant gains in literacy in both reading and
writing.
When the students were actually tested, there was clear evidence of significant gains
having been made in literacy during the research period for the wider research sample as
well as for both groups: those taught by bilingual and English-speaking tutors. For the total
sample, this represented an increase of two levels on the 8-point descriptor scale developed
for this project. Reading skills were consistently better than writing in all tests for this
research sample.
Analyses performed between the groups receiving the 2- and 12-hour weekly
instruction indicated the benefits of having more contact time for literacy education.
However group variances between the two were not significant, which would indicate not
only the general importance of but also the gains to be made from any literacy instruction,
regardless of the number of contact hours.
When assessed and reported literacy skills were compared, the closest match was
between the final writing test and self-assessments. Twenty weeks of instruction, and
awareness of the content of literacy education had meant that students were able to assess
their writing ability with a greater degree of accuracy. There was evidence that the test and
self-report descriptors were generally working quite well by the end of the programme, and
the accuracy of the mid-point on the scales was clearly confirmed.
Recommendations derived from this report
1. That student personal profiles at the beginning of the programme be retained for
planning purposes, so that student needs are appropriately and adequately catered

154
for, given the background, previous education, gender, length of NZ residence and
first language literacy.
2. That the sequence of tasks in this curriculum be re-visited in the light of student
initial self assessment, so that skills they perceive to be easier are consolidated
before more difficult ones are introduced. This will reduce anxiety among students.
3. That bilingual and native-English speaking tutors be retained, and further training be
offered to address their current needs. That tutors be encouraged to have a greater
role in curriculum and assessment design and development, lesson delivery, and in
identifying ways in which to enhance student motivation and retention.
4. That classes have access to bilingual, English-speaking and EAL tutors so that they
have realistic models to work with, given the plurilingual, multi-cultural nature of
the NZ environment. All have their strengths in teaching various aspects of the
curriculum, and it is important that this resource be utilised for all students. Two
thirds of the students indicated they would like bilingual teaching at the start of the
programme, and this is clearly a preferred option at the beginning stages when
student language needs require special scaffolding, and especially when they face
insecurities with language learning, given their traumatic backgrounds. Older
women in particular – who made up the bulk of this sample – are insecure about
beginning literacy and language learning skills.
5. That students are given practice in whichever form is chosen to measure their
achievement (self assessment and /or testing). These students need to be given
practice in all aspects of self-assessment and testing methods, including timing, so
that test anxiety is reduced and results reflect their real knowledge.
6. That funding be obtained for regular 12-hour weekly classes in preference to 2-hour
ones, but having a smaller number of hours as an option for students who are unable
to attend for more hours per week. Some literacy instruction is preferable to none at
all, as students made gains in the 2-hour classes, although not as significantly as
those in the 12-hour classes. All students in these 2-hour classes however, had some

155
primary school education – it is presumed the gains would not have been as great in
these classes if they had had no previous schooling.
General recommendations
1. That first language and literacy skills be encouraged and supported, as there is a
significant relationship with English literacy skills.
2. That students and tutors be made aware that home use of the mother tongue is
crucial for cognitive development and that a shift to bilingual language use with
English may threaten acquisition of both languages, particularly among younger
children and in the NZ-born generation.
3. That low-level literacy and ESOL programmes:
• Acknowledge that the diversity of learners requires a range of educational responses
• Use a curriculum responsive to student needs
• Use classroom materials and activities based on relevant, useful and real- life situations
• Formulate curriculum and assessment tasks stemming from the profiles of students at
the beginning of the course
4. That the student be given a progress and achievement report at the end of the
programme which clearly signals the areas in which the student is now competent.
This will comprise the final test results along with the test descriptors. It will give
the next teacher a clear indication of student ability.
Recommendations for further research
1. That further work be done looking specifically at the variables which affect
language literacy and English literacy gains among refugee pre-literate and low-
literacy ESOL students, so that tutors are made aware of the factors which might
intrude on or further motivate their students and encourage greater gains.

156
2. Collaborative learning is appropriate to the culture of these learners and therefore
methods of collaborative test-taking could be explored.
3. The use and shift of home languages be documented and the variables which seem
to contribute to this be explored.
Conclusions
This research project was useful and worthwhile in that it allowed the gathering of
sufficient data for making sound judgements about literacy gains for 62 students enrolled
in a programme for pre- literate and low-level literacy ESOL students. It was clear at the
outset that test anxiety meant that testing procedures were not as stringent as they could
have been, as students often worked collaboratively in order to ‘do well’ for their teacher.
However, by the end of the programme students were more aware of the testing
procedures, and the self-assessments and test results were more evenly correlated. The
following aspects of the assessment procedures used will be valuable in future
programmes: student personal information profiles which gather pertinent background
information on the students; a revised initial self-assessment which could form part of the
profile and which reflects prior knowledge; a fina l self-assessment and/or literacy test to
acknowledge progress and literacy gains; and a clear reporting procedure which reflects
student achievement and reports their ability to perform functional tasks in the real world.
This would be helpful for both record-keeping and for passing on to the next class teacher.
This report indicated the very real and significant literacy gains that learners on this
programme made. It is therefore important that the issues of student retention, continuation
of funding, on-going training of bilingual tutors, and continuity of learning for the students
be addressed so that these gains are not lost in the long term.
.

157

158
REFERENCES
Abbot, M. 1989. Refugee Resettlement and Wellbeing. Based on national conference on
refugee mental health in NZ, Wellington 12-15 May, 1988. Wellington: Mental
Health Foundation.
Allen, P., M. Fröhlich and N. Spada. 1984. The communicative orientation of language
teaching: An observation scheme. In Handscombe, J., R.A. Orem and B. Taylor
(eds.) On TESOL: '83: The Question of Control. Alexandria, Virginia: Teachers of
English to Speakers of Other Languages, Inc.
Allender, S. C. 2001. Adult ESL Learners with Special Needs: Learning from the Australian
perspective. Victoria: NCLE, Adult Multicultural Education Services.
Adelman, C., D. Jenkins and S. Kemmis. 1976. Rethinking case study: notes from the 2nd
Cambridge Conference, Cambridge Journal of Education, 6, 3: 139-150.
Altinkaya, J. 1998. Briefing paper to Interdepartmental Committee on Refugees - Access to
English language support (ESOL). Wellington: National Home Tutor Association
Inc. Unpublished paper.
Anderson, A. 1994. Studying across differences. In Denzin, N. and Y. Lincoln (eds.)
Handbook of Qualitative Research. California: Sage.
Bachman, L.F. 1990. Fundamental Considerations in Language Testing. Oxford University
Press.
Bachman, L.F. and A.S. Palmer. 1996. Language Testing in Practice. Oxford University
Press.
Bassey, M. 1999. Case Study Research in Educational Settings. Buckingham: Open
University Press.
Brindley, G. 1989. Assessing learner achievement in the AMEP. Prospect, 4, 3: 9-23.
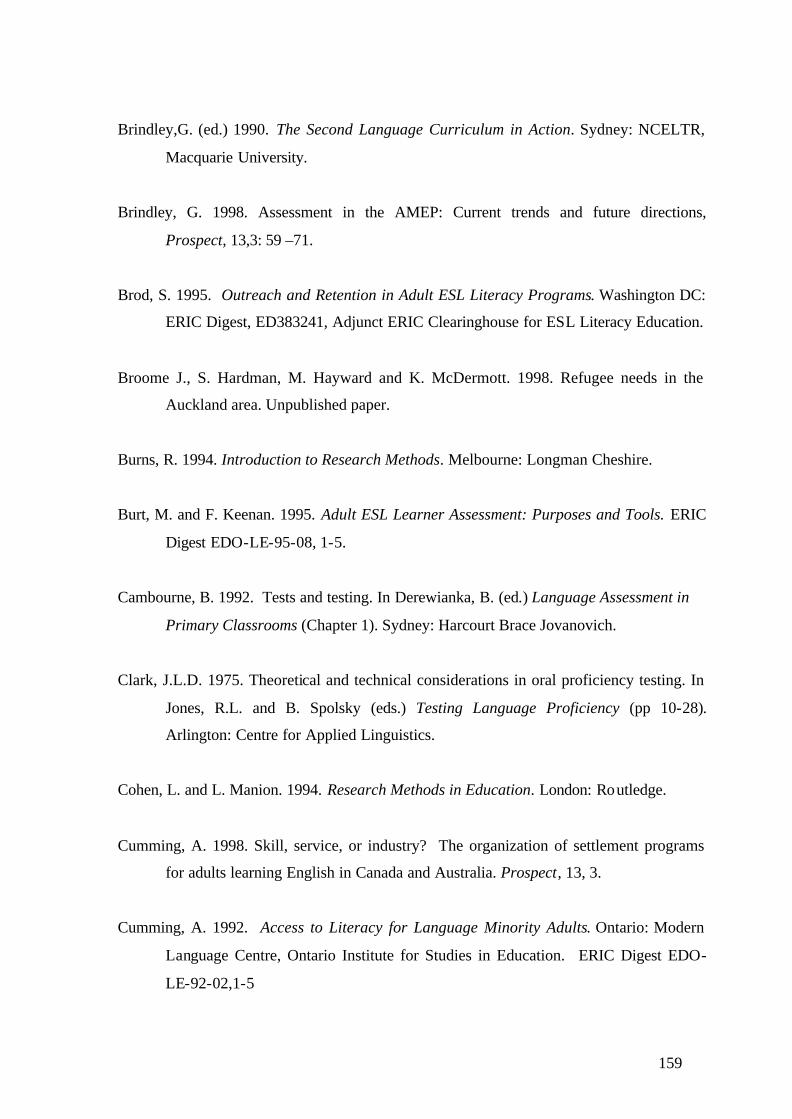
159
Brindley,G. (ed.) 1990. The Second Language Curriculum in Action. Sydney: NCELTR,
Macquarie University.
Brindley, G. 1998. Assessment in the AMEP: Current trends and future directions,
Prospect, 13,3: 59 –71.
Brod, S. 1995. Outreach and Retention in Adult ESL Literacy Programs. Washington DC:
ERIC Digest, ED383241, Adjunct ERIC Clearinghouse for ESL Literacy Education.
Broome J., S. Hardman, M. Hayward and K. McDermott. 1998. Refugee needs in the
Auckland area. Unpublished paper.
Burns, R. 1994. Introduction to Research Methods. Melbourne: Longman Cheshire.
Burt, M. and F. Keenan. 1995. Adult ESL Learner Assessment: Purposes and Tools. ERIC
Digest EDO-LE-95-08, 1-5.
Cambourne, B. 1992. Tests and testing. In Derewianka, B. (ed.) Language Assessment in
Primary Classrooms (Chapter 1). Sydney: Harcourt Brace Jovanovich.
Clark, J.L.D. 1975. Theoretical and technical considerations in oral proficiency testing. In
Jones, R.L. and B. Spolsky (eds.) Testing Language Proficiency (pp 10-28).
Arlington: Centre for Applied Linguistics.
Cohen, L. and L. Manion. 1994. Research Methods in Education. London: Routledge.
Cumming, A. 1998. Skill, service, or industry? The organization of settlement programs
for adults learning English in Canada and Australia. Prospect, 13, 3.
Cumming, A. 1992. Access to Literacy for Language Minority Adults. Ontario: Modern
Language Centre, Ontario Institute for Studies in Education. ERIC Digest EDO-
LE-92-02,1-5

160
D’ Annunzio, A. 1995. The training of bilingual tutors in an English as a second language
program. Adult Basic Education, 5, 1, Spring.
Davison, C. 1996. The multiple meanings of literacy in the TESOL and adult literacy
professions: Problems of perspective? Prospect, 11, 2, August.
Denzin, N. and Y. Lincoln.1999. Case Study Research in Educational Settings.
Buckingham: Open University Press.
Eckermann, A. K. 1993. Research methods in social investigations: Qualitative methods,
Unit AMC 550. (Lecture notes). Armidale: University of New England.
Eckermann, A. K., D. Roberts and G. Kaplan. 1993. The role of participatory action
research in Aboriginal education. Conference paper presented to the World
Indigenous People’s Education Conference, Woolongong.
English Language Institute, 1992. ELI Proficiency Scale. Wellington: English Language
Institute, Victoria University of Wellington.
Fitzgerald, M. 1995. Using cultural informants in research project development. (Seminar
Notes). Sydney: Sydney University.
Galang, R.G.1982. Native Language Assessment of Asian American Children. Los
Alamitos, California: National Centre for Bilingual Research. ERIC Document
Production Service, Document No. 219 973.
Gardner, S., E. Polyzoi and Y. Rampaul. 1996. Individual variables, literacy history and
ESL progress among Kurdish and Bosnian immigrants. TESL Canada Journal,14, 1
Winter.
Goldman, A. and S. McDonald. 1987. The Group Depth Interview. New Jersey: Prentice
Hall.

161
Grant, A. 1986. Defining literacy; Common myths and alternative readings. Australian
Review of Applied Linguistics, 9, 2: 21-22.
Hagan, P. 1994. Competency-based curriculum: the NSW AMES experience. Prospect, 9,
2: 30-40.
Hakuta, K. and D. D’Andrea. 1992. Some properties of bilingual maintenance and loss in
Mexican background high-school students. Applied Linguistics, 13, 1: 72-99.
Hamel, J., S. Dufour and D. Fortin. 1993. Case Study Methods: Qualitative Research Series
32. California: Sage.
Hammond, J. 1989. The NCELTR literacy project. Prospect, 5, 1: 23-30.
Hammond, J. and B. Derewianka. 1999. ESL and literacy education: Revisiting the
relationship. Prospect, 14, 2: 25-39
Hood, S. 1990. Second language literacy: Working with non- literate learners. Prospect, 5,
3: 52-61.
Huerta Macias, A. 1993. Current Terms in Adult ESL Literacy. ERIC Digest, ED359750 1-
5
Ingram, D.E. 1981. Testing practical language skills. Paper presented at the 1981 FIPLV
Congress‚Second and Foreign Languages in Education, University of Ibadan,
Nigeria, August 23rd - 29th, 1981.
Ingram, D.E. 1981. Australian Second Language Proficiency Ratings (ASLPR). In J. Read
(ed.) Directions in Language Testing (pp 108-138). Anthology Series 9 Singapore:
SEAMEO Regional Language Centre.
Johnson, A. 2000. Changing Skills for a Changing World: Recommendations for Adult
Literacy Policy in Aotearoa/New Zealand. Wellington: Ian Axford NZ Fellowships
in Public Policy.

162
Kalantzis, M., R. Gurney and B. Cope. 1986, A study of the relationship between first
language literacy and second language acquisition. Unpublished report, Canberra
DIEA cited in Hood, S. 1990. Second language literacy: Working with non- literate
learners. Prospect, 5, 3: 52-61.
Kalantzis, M. 1987. From first language illiteracy to second language literacy: NESB Adult
Learning. Prospect, 3, 1: 35-43.
Kalantzis, M., Cope, B. and Slade, D. 1989. Minority Languages and Dominant Culture.
London: Falmer Press.
Kasanji, L. 1994. Community language schools and their future. Paper delivered at the Fourth
Community Languages and ESOL Conference, Christchurch,1st - 4th September, 1994.
Kettle, M. 1998. Bilingualism bites the dust, in ‘Washington Diary,’ Guardian Weekly.
California, June 14th, p6.
LeBlanc, R. and G. Painchaud. 1985. Self-assessment as a second language placement
instrument. TESOL Quarterly, 19, 4: 673-87.
Lewis, J. 1990. Self-assessment in the classroom. In G. Brindley (ed.) The Second
Language Curriculum in Action. Sydney: NCELTR, Macquarie University.
Loo, C. 1982. Vulnerable populations: Case studies in crowding research. In J. Seiber (ed.)
The Ethics of Social Research: Surveys and Experiments. New York: Springer
Verlag.
Martin-Blaker, J. and S. Hardman. 2001. Jumping the Barriers: Language Learning with
Refugee Groups in New Zealand. Unpublished paper.
McDermott, K. 1997. A methodological journey: the evolution of a research model
appropriate for an exploration of the factors facilitating resettlement for government

163
quota refugees in Auckland, New Zealand. M.Ed. Thesis. Armidale:University of
New England.
McSpadden, L. 1987. Ethiopian resettlement in the Western United States: Social context
and psychological well-being. International Migration Review, 21, 3: 796-819.
Majka, L. 1994. A Review of Research on Refugees in the Austroasian Region. Melbourne:
La Trobe University.
Martin-Jones, M. 1991. Sociolinguistic surveys as a source of evidence in the study if
bilingualism: a critical assessment of survey work conducted among linguistic
minorities in three British cities. International Journal of the Sociology of
Language, 90, 37-55.
Murray, D.E. 1998. An agenda for literacy for adult second language learners. Prospect, 13,
3: 42-49.
Navarra, D. 1993. Literacy Assessment Tasks for Placement and Referral. Sydney, NSW:
AMES.
Nicholas, J. 1988. British language diversity surveys (1977-87): A critical examination.
Language and Education, 2 : 15-33.
Nunan, D. 1992. Research Methods in Language Learning. Cambridge University Press.
O’Grady, C. 1987. Use of the learner’s first language in adult migrant education. Prospect,
2, 2:171-181.
Paltridge, B. 1989. Placement testing: A study in self-assessment. Prospect, 4, 3: 27-38.
Patton, M. (ed.) 1990. Qualitative Evaluation and Research Methods. California: Sage.
Peyton, J. and J. Crandall. 1995. Philosophies and Approaches in Adult ESL Literacy
Instruction. ERIC Digest ED 3869608, 1-5.

164
Pittaway, E. 1991. Refugee Women - Still At Risk in Australia. Canberra: Australian
Government Publishing Service.
Ramm, J. 1993. Learners With Minimal Formal Education. Victoria: NCELTR, AMES.
Reason, P. 1990. Qualitative evaluation and research methods. In M. Patton (ed.)
Qualitative Evaluation and Research Methods. California: Sage.
Rivera, K. 1999. Native Language Literacy and Adult ESL Instruction, ERIC Digest,
EDO—LE-99-04, 1-5.
Roberts, C. 1994. Transferring literacy skills from L1 to L2: From theory to practice.
Journal of Educational Issues of Language Minority Students, 13, 209-221.
Roberts, M. L. 1999. Immigrant language maintenance and shift in the Gujarati, Dutch and
Samoan communities of Wellington. PhD thesis. Wellington: Victoria University.
Rolfe, T. 1990. Self- and peer-assessment in the classroom: A case study. In G. Brindley
(ed.) The Second Language Curriculum in Action (pp187-287). Sydney: NCELTR,
Macquarie University.
Schumann, J. 1978. Cited in D. Nunan. 1992, Research Methods in Language Learning.
Cambridge University Press.
Shadbolt, M. 1996. The longest journey: the resettlement of Ethiopian and Eritrean refugees
in Auckland. M. Phil.Thesis. Hamilton: University of Waikato.
Shameem, N. 1995. Hamai log ke boli. Language shift in an immigrant community: The
Wellington Indo-Fijians. PhD thesis. Wellington: Victoria University.
Shameem, N. 1998. Validating self-reported language proficiency by testing performance
in an immigrant community: the Wellington Indo-Fijians. Language Testing,15,
1:86-108.

165
Shameem, N. 2000. Methodology in a study of school language use in Fiji. New Zealand
Studies in Applied Linguistics, 6, 67-88.
Shameem, N. 2001. Many Languages, Diverse Peoples, One Nation, Aotearoa: A report on
education needs of community language teachers in Auckland, Aotearoa/New
Zealand. Auckland: School of English and Applied Linguistics, UNITEC.
Shohamy, E. 1983. The stability of oral proficiency assessment on the oral interview testing
procedures. Language Learning, 33, 4 :527-540.
Shohamy, E. and T. Reves. 1985. Authentic language tests: where from and where to?
Language Learning, 8, 1: 23-40.
Smith, H.A. 1994. English Language Acquisition in the Lao Refugee Community of
Wellington, New Zealand. MA Thesis. Wellington: Victoria University of
Wellington.
Smith, H. A. 1997. Ngeun dtem pha bo panya dtem phoung: Social network analysis and
the acquisition of English in the Lao refugee community of Wellington. New
Zealand Studies in Applied Linguistics, 3: 21-45.
Spada, N. 1990. Observing classroom behaviours and learning outcomes in different second
language programmes. In Richards, J. and D. Nunan (eds.) Second Language
Teacher Education. New York: Cambridge University Press.
Spada, N. and M. Fröhlich. 1995. COLT, Communicative Orientation of Language
Teaching Observation Scheme: Coding Conventions and Applications. Sydney:
NCELTR, Macquarie University.
Spolsky, B. (ed.) 1978. Approaches to Language Testing: Advances in Language Testing
Series: 2. Arlington Centre for Applied Linguistics.

166
Stanfield, H. and R. Dennis. 1993. Race and Ethnicity in Research Methods. California:
Sage.
Stevenson, D.K. 1985. Pop validity and performance testing. Language Testing, 2, 1: 41-
47.
Van Weeren, J. 1984. Language Testing: Making a Decision on the Basis of Observed
Behaviour and ‘Tapped’ Knowledge. In Practice and Problem in Language Testing
the Interuniversitare Sprachtestgruppe. ERIC Document Reproduction Service,
Document No. 266 643.
White, C., N. Watts and A. Trlin. 2001. Immigrant and Refugee Experience of ESOL
Provision in New Zealand: Realities and Responsibilities. Palmerston North:
Massey University New Settlers Programme, Occasional publication No. 5.
Wickerts, R. 1990. Putting No Single Measure into the wider literacy picture. Prospect, 5,
3: 17- 26.
Wrigley, H. 1992. Learner Assessment in Adult ESL Literacy. ERIC Digest, EDO-LE-92 1-
5
Wrigley, H. 1993. Innovative Programs and Promising Practices in Adult ESL
Literacy.ERIC Digest, EDO-LE-93-07 NCLE.1-5
Newspaper collage items from:
Central Leader
New Zealand Herald
West Weekly
Sunday Star Times
Indian Newslink

167
Sunday Star Times

168
APPENDICES Appendix 1 Course Document
COURSE TITLE: Bilingual Tutor Training Course UNITEC Course Type: Assessed Short Course LEVEL: 4 CREDITS: 30 STUDENT LEARNING TIME: 300 hours AIM
To provide trained bilingual tutors from a refugee background to teach essential language and literacy, numeracy, and learning skills to small groups in schools and the community. PURPOSES OF COURSE The stated aims in the programme contract are as follows: • To recruit and train suitable applicants to become tutors within their own community • To build job search techniques and to develop knowledge and experience of the NZ
work place • For participants to gain work experience in the NZ labour market CONTENT OUTLINE:
Life stages and learning; learning styles and backgrounds; needs analysis; tutoring approaches for literacy, numeracy, learning skills; managing tutor groups; materials development; using a/v equipment; understanding NZ schools and communities. COURSE OBJECTIVES The trainees will be able to: 1. Identify characteristics of adult and teenage learners and describe the basic concepts of
learning and teaching. 2. Identify and assess learning needs and respond appropriately. 3. Implement current approaches to language, literacy and numeracy teaching. 4. Work as bilingual tutors in the community. INSTRUCTION This course involves 300 hours of student learning: • 120 hours class contact (six 20 – 25 hr block courses over 18 weeks max.) • 20 hours supervised tutoring practice • 160 hours of self directed learning
SPECIFIC OUTCOMES • At least one literacy class would be established in each community • Course graduates would be employed in their communities within three months of
course completion • Quota refugees would gain access to first step provision
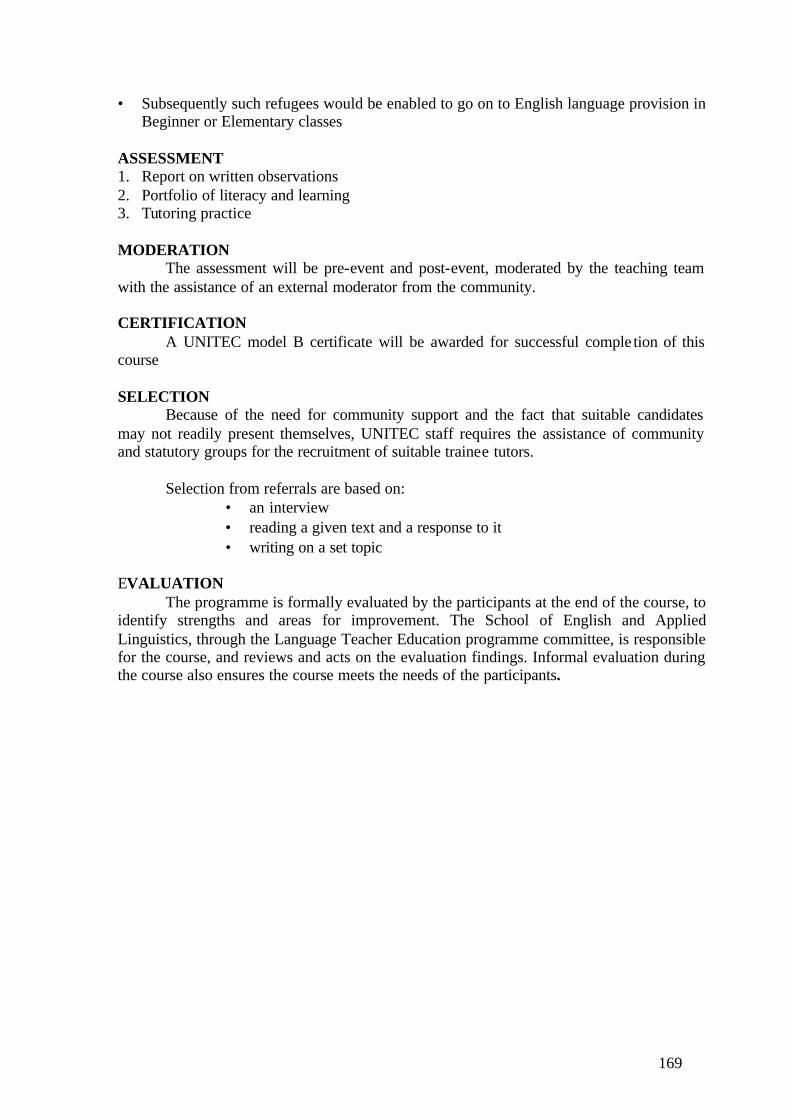
169
• Subsequently such refugees would be enabled to go on to English language provision in Beginner or Elementary classes
ASSESSMENT 1. Report on written observations 2. Portfolio of literacy and learning 3. Tutoring practice MODERATION
The assessment will be pre-event and post-event, moderated by the teaching team with the assistance of an external moderator from the community. CERTIFICATION A UNITEC model B certificate will be awarded for successful comple tion of this course SELECTION
Because of the need for community support and the fact that suitable candidates may not readily present themselves, UNITEC staff requires the assistance of community and statutory groups for the recruitment of suitable trainee tutors.
Selection from referrals are based on: • an interview • reading a given text and a response to it • writing on a set topic
EVALUATION
The programme is formally evaluated by the participants at the end of the course, to identify strengths and areas for improvement. The School of English and Applied Linguistics, through the Language Teacher Education programme committee, is responsible for the course, and reviews and acts on the evaluation findings. Informal evaluation during the course also ensures the course meets the needs of the participants.

170
Appendix 2 Literacy Research Project: Personal Information Profile for Literacy
Tutors
Circle the answers where there are choices. Write an answer where there is a space ________________________________________________________________________
1 Circle how old you are Less than 20 21-30 31-40 41-50 Over 50
2 What is your country of origin? _________________________________________
3 What gender are you? Male Female
4 Circle how old you were when you arrived in New Zealand?
Born in NZ Less than 20 years 21 –30 years 31-40 41-50 Over 50 years 5 `Circle how many years you have lived in New Zealand
Less than 1 year 1- 2 years 3 – 5 years 6 – 8 years more than 8 years
LANGUAGES 6 What language(s) do you prefer to use at home?
Mainly English Both English and my language Mainly my language
7 Does your first language use the same letters as English? Yes No

171
8 Below, write the name of all languages you know and choose a number to show how well you can use the skills below in each language.
Language Speaking Understanding Reading Writing
a. …………………… __ __ __ __ b. …………………… __ __ __ __ c. …………………… __ __ __ __ d. …………………… __ __ __ __
EDUCATION 9 What is your educational level?
Primary School Secondary School Institute of Technology University Other
10 What are your qualifications and in what field? Informal qualification in _____________________Certificate in_________________ Diploma in ________________________________Degree in __________________
11 What teaching experience do you have? (In any country) What? When / How long? Where?
5.= Very well; 4.= Well; 3. = Average; 2. = So-so; 1.= A little; 0. = Not at all

172
12 Level of support for teachers: a What aspects of tutor support have been useful to you? ________________________________________________________________________________________________________________________________________________________________________________________________________________________________________________________________________________________________________________________________________________________________________________________________________________________________________________________________________________________________________________________ b What further support do you need? ________________________________________________________________________________________________________________________________________________________________________________________________________________________________________________________________________________________________________________________________________________________________________________________________________________________________________________________________________________________________________________________________________________________________________________________________
c What aspects of teaching this course have you enjoyed? ________________________________________________________________________________________________________________________________________________________________________________________________________________________________________________________________________________________________________________________________________________________________________________________________________________________________________________________________________________________________________________________________________________________________________________________________
d What problems have you encountered teaching this course?
________________________________________________________________________________________________________________________________________________________________________________________________________________________________________________________________________________________________________________________________________________________________________________________________________________________________________________________________________________________________________________________________________________________________________________________________

173
Appendix 3 Literacy Research Project: Personal Information Profile for Students
Literacy Research Project
Personal Information Profile Code # __________ Circle the answers where there are choices For example Yes No Write an answer where there is a space or where you circle ‘other’ 1. What is your first name? _________________________________________
2. What is your last name? _________________________________________
3. What name do you like to be called? _________________________________________
4. Circle how old you are Less than 20 21-30 31-40 41-50 over 50
5. What is your country of origin? _________________________________________
6. What is your current address? _________________________________________
7. What is your phone number? _________________________________________
8. What gender are you? Male Female 9. Circle how old you were when you arrived in New Zealand
Less than 20 years 21 –30 31-40 41-50 Over 50 years
10. Circle how many years you have lived in New Zealand
Less than 1 year 1- 2 years 3 – 5 years 6 – 8 years more than 8 years _______________________________________________________________
LANGUAGES 11. What language(s) do you prefer to use at home?
Mainly English Both English and my language Mainly my language
12. What is your first language (mother tongue)? ________________________________________
13. Does your first language use the same letters as English? Yes No
No
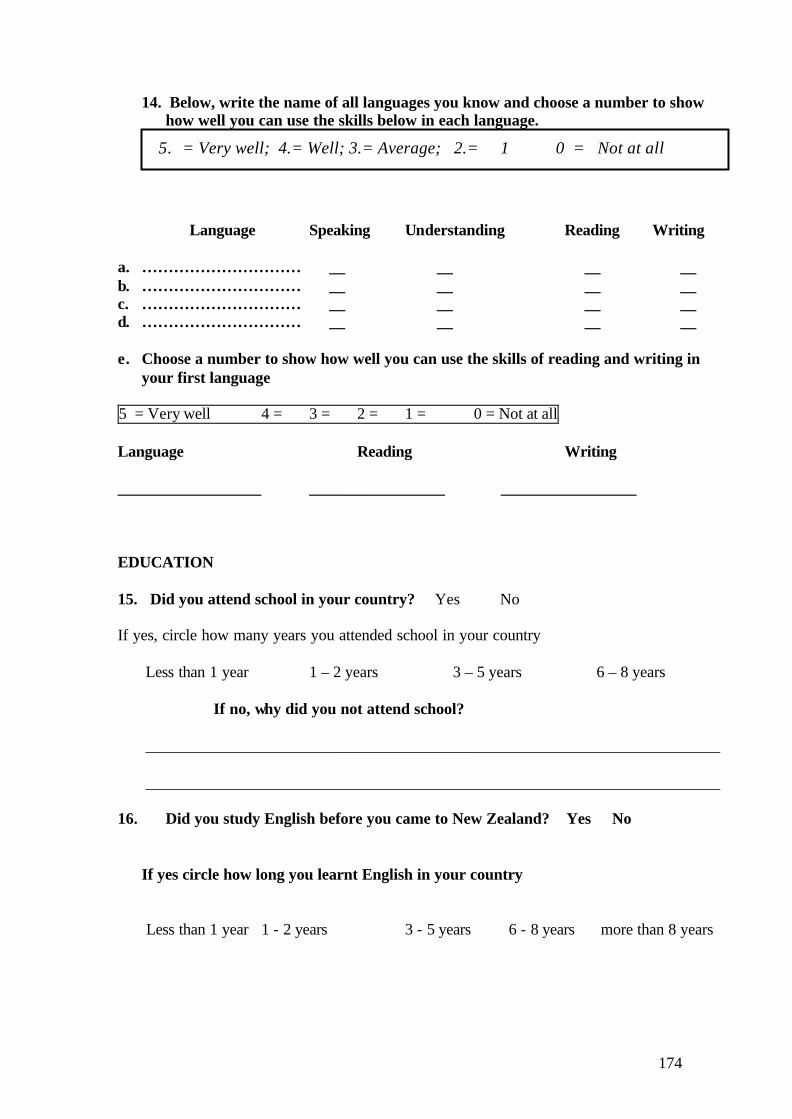
174
14. Below, write the name of all languages you know and choose a number to show how well you can use the skills below in each language.
Language Speaking Understanding Reading Writing
a. ………………………… __ __ __ __ b. ………………………… __ __ __ __ c. ………………………… __ __ __ __ d. ………………………… __ __ __ __ e. Choose a number to show how well you can use the skills of reading and writing in
your first language 5 = Very well 4 = 3 = 2 = 1 = 0 = Not at all Language Reading Writing __________________ _________________ _________________ EDUCATION 15. Did you attend school in your country? Yes No If yes, circle how many years you attended school in your country
Less than 1 year 1 – 2 years 3 – 5 years 6 – 8 years If no, why did you not attend school? ________________________________________________________________________ ________________________________________________________________________
16. Did you study English before you came to New Zealand? Yes No
If yes circle how long you learnt English in your country
Less than 1 year 1 - 2 years 3 - 5 years 6 - 8 years more than 8 years
5. = Very well; 4.= Well; 3.= Average; 2.= 1 0 = Not at all
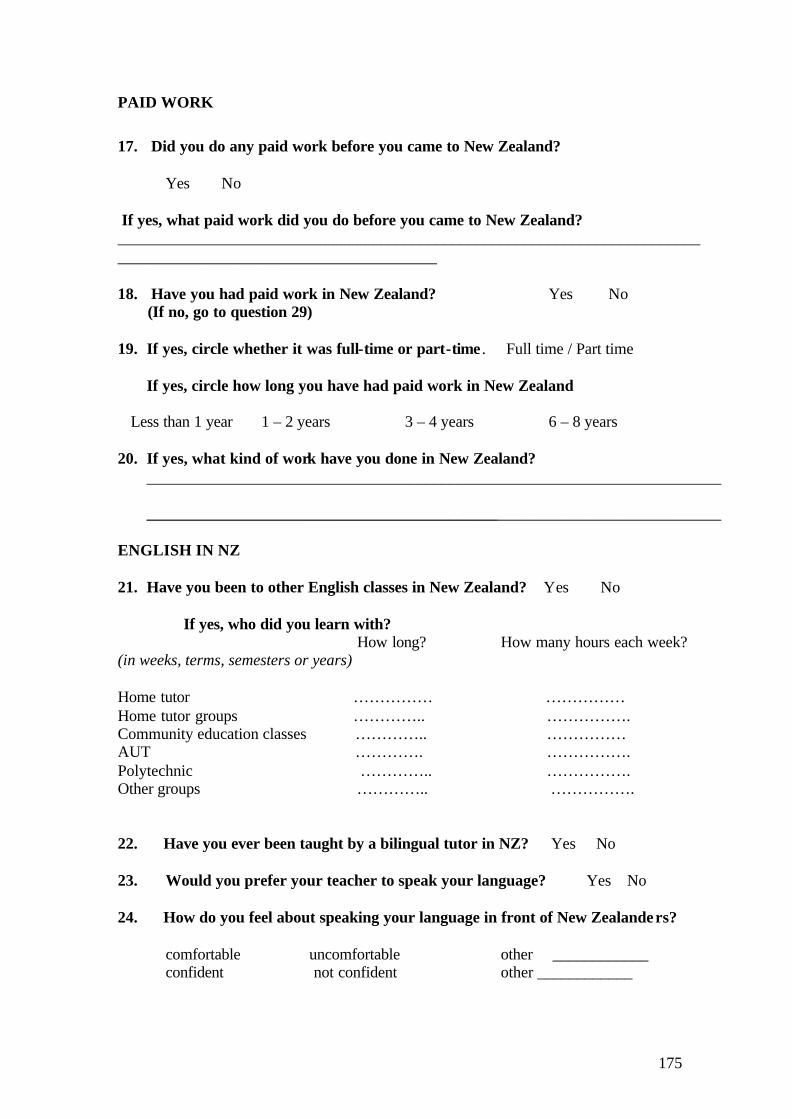
175
PAID WORK
17. Did you do any paid work before you came to New Zealand?
Yes No If yes, what paid work did you do before you came to New Zealand? _________________________________________________________________________________________________________________
18. Have you had paid work in New Zealand? Yes No
(If no, go to question 29)
19. If yes, circle whether it was full-time or part-time . Full time / Part time
If yes, circle how long you have had paid work in New Zealand Less than 1 year 1 – 2 years 3 – 4 years 6 – 8 years 20. If yes, what kind of work have you done in New Zealand?
________________________________________________________________________ ________________________________________________________________________
ENGLISH IN NZ 21. Have you been to other English classes in New Zealand? Yes No
If yes, who did you learn with? How long? How many hours each week? (in weeks, terms, semesters or years)
Home tutor …………… …………… Home tutor groups ………….. ……………. Community education classes ………….. …………… AUT …………. ……………. Polytechnic ………….. ……………. Other groups ………….. …………….
22. Have you ever been taught by a bilingual tutor in NZ? Yes No 23. Would you prefer your teacher to speak your language? Yes No 24. How do you feel about speaking your language in front of New Zealanders?
comfortable uncomfortable other ____________ confident not confident other ____________

176
25.Circle why you want to learn English:
To get a job
To fill out forms
To talk and understand New Zealanders
To talk and understand neighbours
To understand the T.V
To study further
To get New Zealand Citizenship
Other .

177
Appendix 4 Self-Assessment Schedule
NB
: Thi
s sc
ale
will
nee
d m
odifi
catio
n in
ligh
t of r
esul
ts o
n se
lf-as
sess
men
ts
NB
: Thi
s sc
ale
will
nee
d m
odifi
catio
n in
ligh
t of r
esul
ts o
n se
lf-as
sess
men
ts

178
Appendix 5 Literacy Curriculum
CURRICULUM FOR LITERACY PROJECT 2001 § Write in the date as you complete these § Remember to teach these in a context
TOPIC Teach Review Review Review Personal information: • Answering questions • Reading the words • Filling it in
Alphabet: • Spelling own name S/W • Spelling address • Writing other names L/W • Matching capital/small • Ordering capital/small • Circling letters • Guessing how to say a word (using the sounds of letters)
Date: • Days of week + abbrev • Months of year +abbrev • Use a month calendar • Use a year calendar • Match no. & date with words • Know dates of birth/arrival • Know when? How long?
Appointments: • Understand when • Day/time • Listen and write down
Numerals: • Phone numbers:
-recognise written -repeat what hear -write what hear -say/write own
• Prices: -recognise, find, say
• Bills: -power, phone, water, Dr -find how much -find when you pay
• Medicines: -read how much -read how often
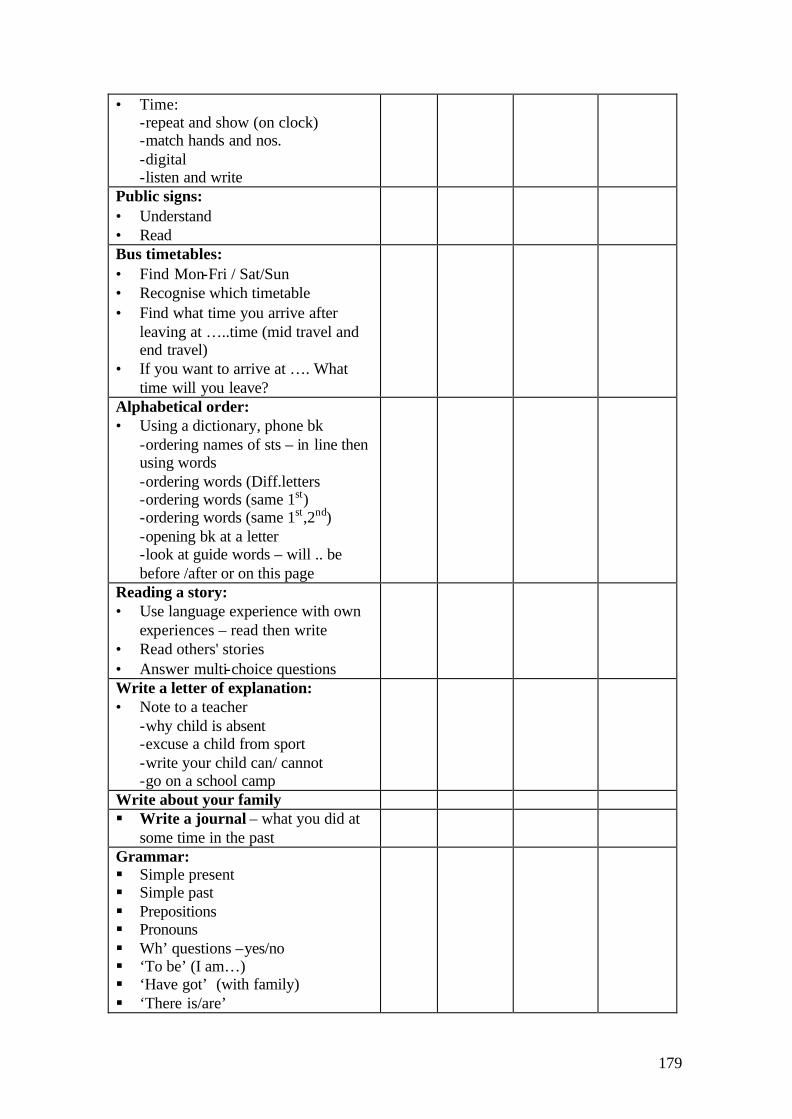
179
• Time: -repeat and show (on clock) -match hands and nos. -digital -listen and write
Public signs: • Understand • Read
Bus timetables: • Find Mon-Fri / Sat/Sun • Recognise which timetable • Find what time you arrive after
leaving at …..time (mid travel and end travel)
• If you want to arrive at …. What time will you leave?
Alphabetical order: • Using a dictionary, phone bk
-ordering names of sts – in line then using words -ordering words (Diff.letters -ordering words (same 1st) -ordering words (same 1st,2nd) -opening bk at a letter -look at guide words – will .. be before /after or on this page
Reading a story: • Use language experience with own
experiences – read then write • Read others' stories • Answer multi-choice questions
Write a letter of explanation: • Note to a teacher
-why child is absent -excuse a child from sport
-write your child can/ cannot -go on a school camp
Write about your family § Write a journal – what you did at
some time in the past
Grammar: § Simple present § Simple past § Prepositions § Pronouns § Wh’ questions –yes/no § ‘To be’ (I am…) § ‘Have got’ (with family) § ‘There is/are’

180
Appendix 6 Test Specifications
Purpose § To test the literacy gains made by low-level literacy learners who speak English as
an additional language, and who participate in classes over 20 weeks § To develop generalised measures of literacy gain that can be used with similar low-
level literacy learners across similar programmes. Constructs § Understanding written language in survival English contexts § Producing written language in survival English contexts
Focus On language useful in day-to-day life in New Zealand, § understanding authentic reading texts § producing contextualised written text.
Test Objectives § To test the ability of students to understand written language in familiar text types § To test students’ ability to write English in everyday contexts
Test-takers Adult learners of English who may have: § little or no literacy in their own language § little or no schooling in their own language § attended previous English classes in New Zealand
Level § low-level literacy in English § generally low oral skills in English
Topics Personal and familiar topics studied in class which are appropriate to context: § personal information, dates and numerals, public signs, bus timetables, alphabetical
order, basic punctuation, understanding a simple story, writing sentences about familiar things and taking a telephone message.
Register Formal and semi-formal Input Written and authentic, where appropriate
181
Content Reading: Identification of:
- letters of English - personal information words - numerals - public signs - alphabetical order Comprehension of: - a bus timetable - a simple story
Writing:
- alphabetical letters of English - personal information responses - basic punctuation (capital letters and full stops) - dates - basic telephone messages - short letters of explanation - about familiar things, places, events - a diary entry
Text Types Authentic where appropriate Test Methodology § Test instructions are on a separate page in the tutors' information booklet. § All tutors attend a training session and go through instructions for each test § Tests are conducted by tutors who also teach the classes § Where appropriate, bilingual tutors give the instructions in their own language § The instructions include the varying number of times that questions are read aloud by
tutors, depending on whether the tutor is bilingual or native English-speaking. This is clearly indicated in the instructions
§ Time for students to complete is signalled for each test Marking § Answer booklets are provided § Writing tests are marked by trained ESOL teachers § The same markers mark both the initial and the final tests § All test scripts are moderated

182
Appendix 7 English Literacy Test Descriptors and Score Sheet*
A scale of 0 – 5 is used at each skill level, both on the self-assessment procedures and to score the performance tests in reading and writing. 0 signifies no proficiency at each level while 5 means the student is able to perform the required task ‘very well’. The tests have eight skill levels, with specific tasks at each level at which students are required to state and demonstrate their ability. Student name:______________________ Class:____________
Score Reading Not at all
Very well
Level 0 1 2 3 4 5
0 No understanding of English writing. Unable to demonstrate reading ability at even the most basic level.
1 Familiarity with formulaic words related to personal information. Shows ability to recognise key words on a form requiring personal information already known and easily identifiable.
2 Initial reading ability, familiarity with letters, sounds and shapes of letters of the alphabet placed in any combination of letters to spell out names.
3 Initial numeracy ability. Familiarity with known dates and written forms of the months of the year. Is able to identify appropriate abbrevia ted forms of the months of the year and circle familiar dates known on a calendar.
4 Minimum reading ability. Understands numbers placed in any combination. Able to identify numerals used for familiar purposes i.e. phone numbers, prices of goods and services, numerical information on prescriptions, bills.
5 Emerging reading ability. Able to recognise and read public signs for different purposes and essential services i.e. doctor, supermarket, warnings.
6 Survival reading ability. Is able to read numerals and words placed in an information table. Able to identify and access meaning of numerals and simple words used for familiar purposes i.e. destinations and times in bus and train timetables, class timetable.
7 Basic reading ability. Is able to identify and locate words and letters arranged in alphabetical order. Is able to use numerals to demonstrate order of letters as in a dictionary, an index of street names, a phone book.
8 Social reading ability. Is able to read a short simple story within the first 500 word level and with familiar place names, within the context of own experience. Is able to read, understand and interpret numerals embedded within the text. Understanding of text is at factual recall level only i.e. answers require recall of clearly stated information in the text and are either right or wrong.
* These descriptors will need fine-tuning in the light of the research results of the tests and self-assessments.

183
Score Writing Not at all
Very well
Level 0 1 2 3 4 5
0 Pre-literate in English. Unable to demonstrate writing ability at even the most basic level.
1 Alphabet recognition. Ability to recognise letters of the alphabet and the difference between upper case (capitals) and lower case letters.
2 Initial writing ability. Ability to accurately fill out a familiar personal information form requiring essential information about own background and life.
3 Observation of writing conventions. Is able to appropriately use basic writing conventions (capital letters and full stops) in a meaningful, familiar context and within the appropriate vocabulary range.
4 Minimum writing ability. Initial numeracy ability. Ability to identify and write dates, days of the week, months of the year. Ability to translate numerical order of months of the year to the appropriate word form and vice versa. Ability to identify and write key aspects of appointment times where numerical understanding is required (day, date, time).
5 Emerging writing ability. Ability to write a short meaningful letter of explanation on a personal matter to a realistic audience/recipient. Content clearly reflects reasons/excuse. Grammar and punctuation do not affect meaning. Appropriate use of vocabulary. Le tter reflects ability to write at some length.
6 Survival writing ability. Ability to accurately take down a short cryptic message in an unseen situation e.g. a telephone message when the context is not embedded in the discourse and non-verbal communication is not a part of the situation. Interlocutor, topic and accent may be unfamiliar but all aspects of the message are included accurately.
7 Basic writing ability. Ability to write more extended prose freely on a familiar topic which falls within personal and social experience. Accuracy reflected by appropriate use of punctuation and grammar. Fluency reflected by appropriate length of text. Appropriate use of vocabulary.
8 Social writing ability. Demonstrates ability to write extended and sustained prose on a regular basis for a longer length of time (10 minutes), with fluency (length), interest (content) and accuracy (punctuation and grammar). Appropriate and accurate use of vocabulary.

184
READING TEST SYLLABUS Section Parts to question No. of
questions Time Type of question Possible score
1. Reading personal information words on a form
Tutor asks students to identify 5 words found on the form by asking where they would write their family name etc.
5 Bilingual tutors say questions twice; English tutors say questions 5 times
Write a number in a circle
5
2. Knowing the names and sounds of the letters
1. Students circle names of 5 letters
2. Students circle letters as
they hear 5 sounds 3. Students individually
spell out one name 4. Students individually
pronounce one name
5 5 1 1
Tutors repeat twice Tutors repeat twice Response in 5 seconds and assess …/5 0=not at all 5= easily
Circle letter Circle letter Spell name Say name
5 5 5 5 Total_ /20> _/5
3. Reading the date
A. Match the abbreviations with the word
B. Circle the date on a
calendar from an oral and written sentence
C. Circle the date on a
calendar from dates written in numerals
4 4 2
1 minute Tutors read out sentences 2 times, then give 30secs to circle each. 1 minute
Match Circle the date from oral/written information Circle the date from a numerical date
4 4 2 Total _/10>_/5
Appendix 8
Test Syllabus

185
Section Parts to question No. of questions
Time Type of question Possible score
4. Reading numerals
A. Identify phone numbers and prices
B. Reading a bill C. Reading a medicine label
7 2 2
Bilingual tutors say questions 2 times; English tutors say questions 5 times Tutors read the questions and give 2 minutes Tutors read the questions and give 2 minutes
Write a number in a circle Write the answers Write the answers
7 2 2 Total_10>_/5
5. Reading public signs
Tutor asks students to identify 5 public signs by reading a sentence describing each one.
5 Bilingual tutors say questions 2 times; English tutors say questions 4 times. Leave one minute between questions
Write a number in the box
5
6. Reading a bus timetable
1 & 2. Identify the correct timetable 3 & 4. Identify time of arrival 5. Identify time to catch
bus when arrival time is designated
5 Bilingual tutors say questions twice; native English tutors say questions 4 times. Leave one minute after 1 & 2 and 2 minutes after 3-5
1 & 2 Identify the correct timetable by writing the number 3 - 5 Write time of arrival
5
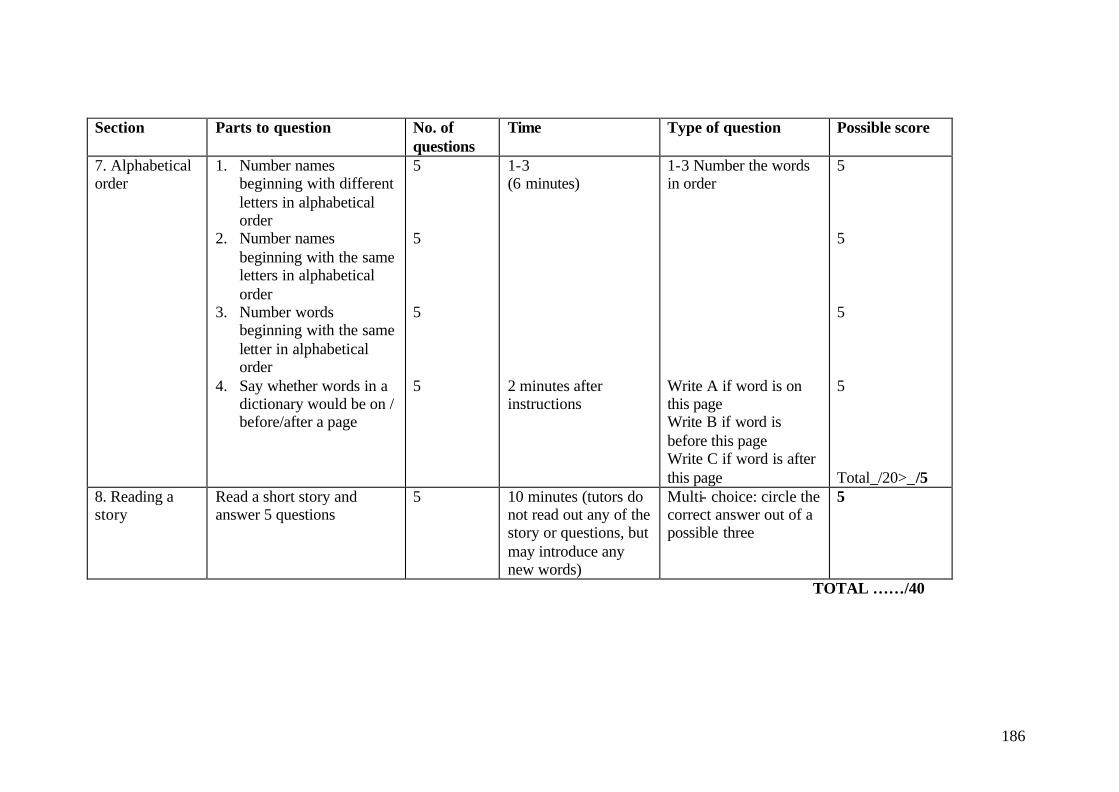
186
Section Parts to question No. of questions
Time Type of question Possible score
7. Alphabetical order
1. Number names beginning with different letters in alphabetical order
2. Number names beginning with the same letters in alphabetical order
3. Number words beginning with the same letter in alphabetical order
4. Say whether words in a dictionary would be on / before/after a page
5 5 5 5
1-3 (6 minutes) 2 minutes after instructions
1-3 Number the words in order Write A if word is on this page Write B if word is before this page Write C if word is after this page
5 5 5 5 Total_/20>_/5
8. Reading a story
Read a short story and answer 5 questions
5 10 minutes (tutors do not read out any of the story or questions, but may introduce any new words)
Multi- choice: circle the correct answer out of a possible three
5
TOTAL ……/40

187
WRITING TEST SYLLABUS Section Parts to question No. of
questions Time Type of question Possible score
10. Writing the letters of the alphabet
A. Write a dictated sentence (aim is to write small letters accurately) B. Write familiar words (aim is to write capital letters accurately)
1 1
Tutors dictate sentence once, then say each word once and spell it twice
A. Write a sentence that is dictated and in which each word spelt
B. Rewrite the above
sentence or write personal information in capital letters
5 (0=no letters correct 5= all correct) 5 (0= no letters correct 5= all correct) Total_/10 >_/5
11. Writing personal information on a form
Write answers to as many prompts on the form as possible (including -- where the answer is "No").
1 10 minutes Complete personal information
15 > _/5
12. Using capital letters and full stops
Mark capital letters and full stops in a story
1 Tutors read the story once then give students 5 minutes
Mark capital letters and full stops in a story
20 > _/5
13. Writing the date
1. Fill in the missing parts of the dates (words / numbers)
2. Listen to day, date and time and fill in an appointment card
4 6
4 minutes Tutors read out appointment information three times
1. Complete words / numbers in the dates
2. Fill in the information
on an appointment card after listening
4 6 Total _/10 > _/5

188
Section Parts to question No. of questions
Time Type of question Possible score
14. Writing a short letter of explanation
Write a short letter of explanation including address, date, greeting, body, farewell.
1 5 minutes Write a short letter of explanation
Content _/5 Grammar_/5 Punctuation _/5 Spelling _/5 Length _/5 Total /25 > /5
15. Writing a telephone message
Listen to phone message and write appropriate details
1 Play tape through once (no writing) then three more times
Write: • who the message is to • who the message is
from (selecting one name from written options) • the phone number
2 for each name 1 for phone number _/5
16. Writing about a familiar thing
Write about a given topic familiar to oneself
1 Tutors and students discuss the given topic for 2 minutes then students write for 10 minutes
Write about a given familiar topic
Content _/5 Grammar _/5 Punctuation_/5 Spelling* _/5 Length _/5 Total_/25 >_/5
17. Writing a journal
Write a diary entry
1 Elicit possible answers then give 5 minutes to write
Write for 5 minutes about an experience or event in the past
Content _/5 Grammar _/5 Punctuation_/5 Spelling* _/5 Length _/5 Total_/25 >_/5
TOTAL …/40 * Spelling to be changed to vocabulary

189
Appendix 9 Impressions from an English-Speaking Tutor
The concept of testing produced anxiety in my students - they were concerned that
they wouldn’t perform well enough, perhaps they were worried that they wouldn’t be able to continue in the class or that they would disappoint me. I repeatedly explained to them why they were being tested and that it didn’t matter if they couldn’t do or complete a task. I also explained to them that for research purposes we wanted individual work. During testing, I separated the desks, continually monitored and reinforced that they must not help each other, but it was an impossible task. It was not just that the learners who were having difficulty with the task were asking more competent learners for information; the more competent learners were offering information to others. However, there did seem to be less collaboration in the second test than the first.
Learners without previous formal education are especially discouraged if they can’t achieve a task. In class they always work collaboratively- the more competent learners explaining and helping the others. At the beginning of the project I always explained every worksheet using the white board or OHP and reinforced this individually. By the end some of the class were able to cope with just oral instructions in some instances. The learners without formal education tended to have the most difficulty with abstract concepts and transferring skills from one task to another, which made coping with a different task format in the testing difficult. This seemed to be more so with age. e.g. alphabetical order. Some tasks that they had reviewed frequently and in various ways in class, they still had difficulty with in the tests. For some learners retention of information is very difficult, as well as the speed that they can listen and then process oral information into written form.
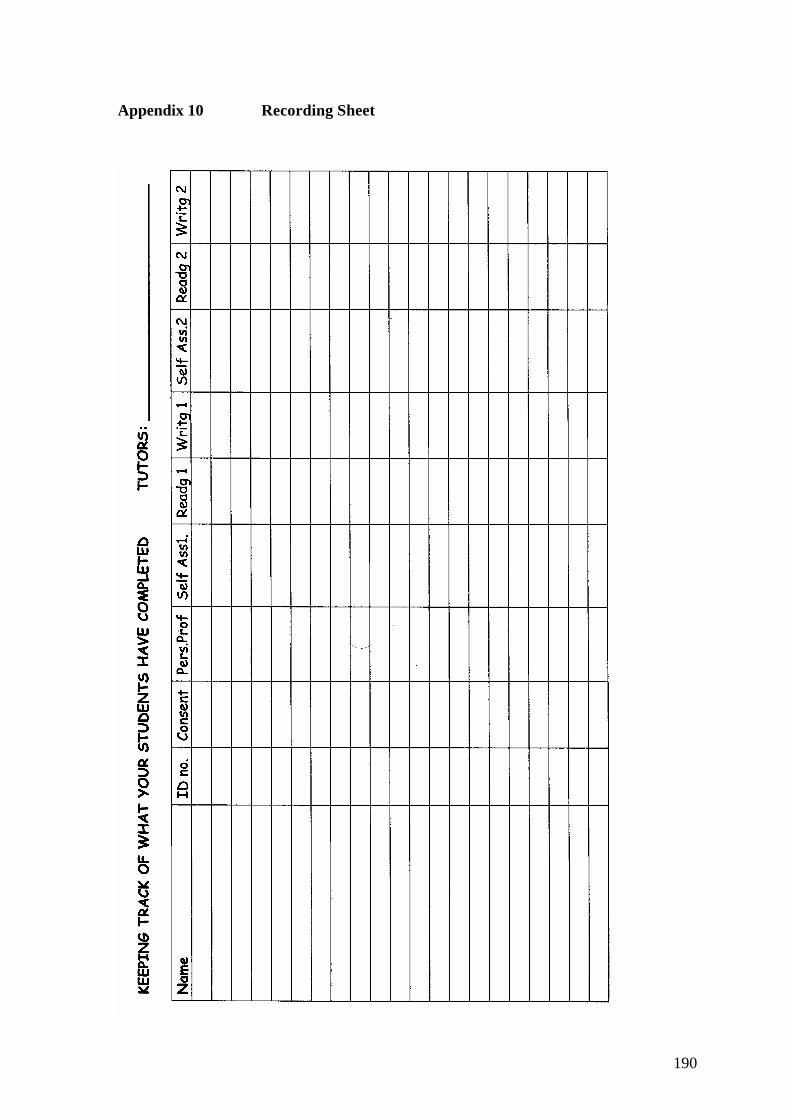
190
Appendix 10 Recording Sheet
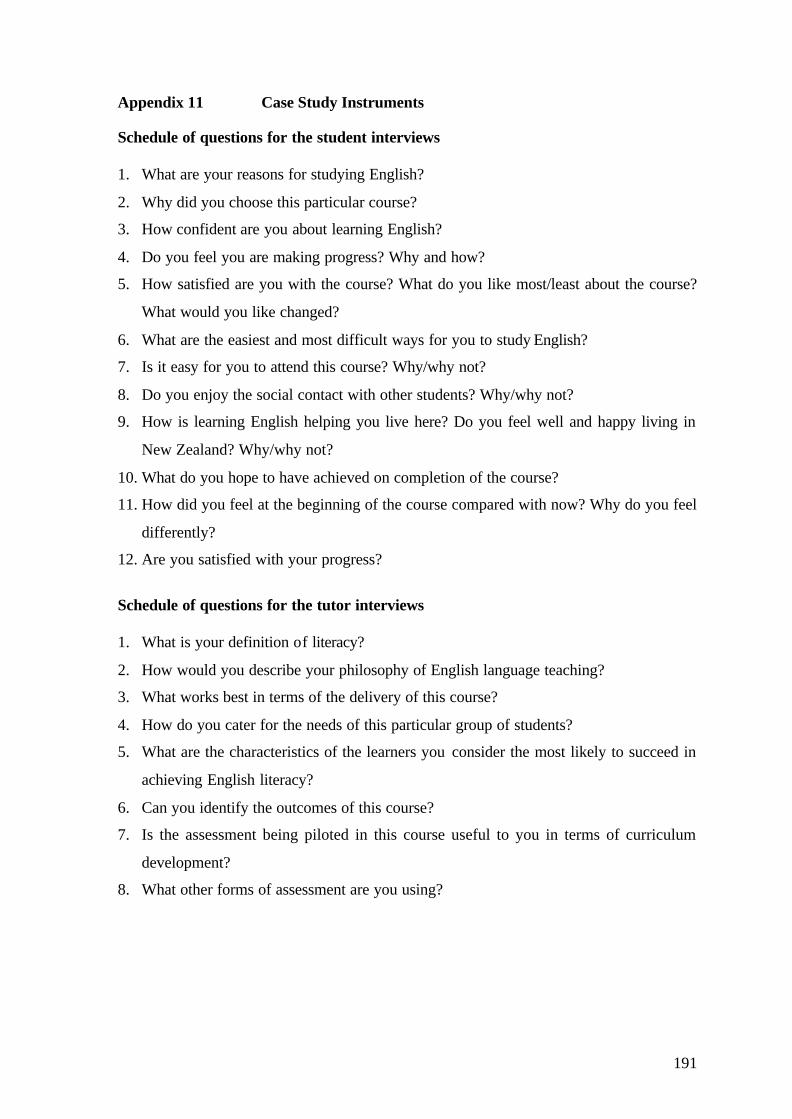
191
Appendix 11 Case Study Instruments
Schedule of questions for the student interviews 1. What are your reasons for studying English?
2. Why did you choose this particular course?
3. How confident are you about learning English?
4. Do you feel you are making progress? Why and how?
5. How satisfied are you with the course? What do you like most/least about the course?
What would you like changed?
6. What are the easiest and most difficult ways for you to study English?
7. Is it easy for you to attend this course? Why/why not?
8. Do you enjoy the social contact with other students? Why/why not?
9. How is learning English helping you live here? Do you feel well and happy living in
New Zealand? Why/why not?
10. What do you hope to have achieved on completion of the course?
11. How did you feel at the beginning of the course compared with now? Why do you feel
differently?
12. Are you satisfied with your progress?
Schedule of questions for the tutor interviews 1. What is your definition of literacy?
2. How would you describe your philosophy of English language teaching?
3. What works best in terms of the delivery of this course?
4. How do you cater for the needs of this particular group of students?
5. What are the characteristics of the learners you consider the most likely to succeed in
achieving English literacy?
6. Can you identify the outcomes of this course?
7. Is the assessment being piloted in this course useful to you in terms of curriculum
development?
8. What other forms of assessment are you using?

192
The framework for the classroom observations* Time, frequency and size of class
Native speaker or bilingual tutor
Description of classroom activities
Participant organization
Lesson content
Student modality
Classroom materials
Use of the target language
Reference to students’ prior experience
Balance of English skill development
* Adapted from COLT Model (Allen, Fröhlich & Spada, 1984; Spada and Fröhlich,
1995)
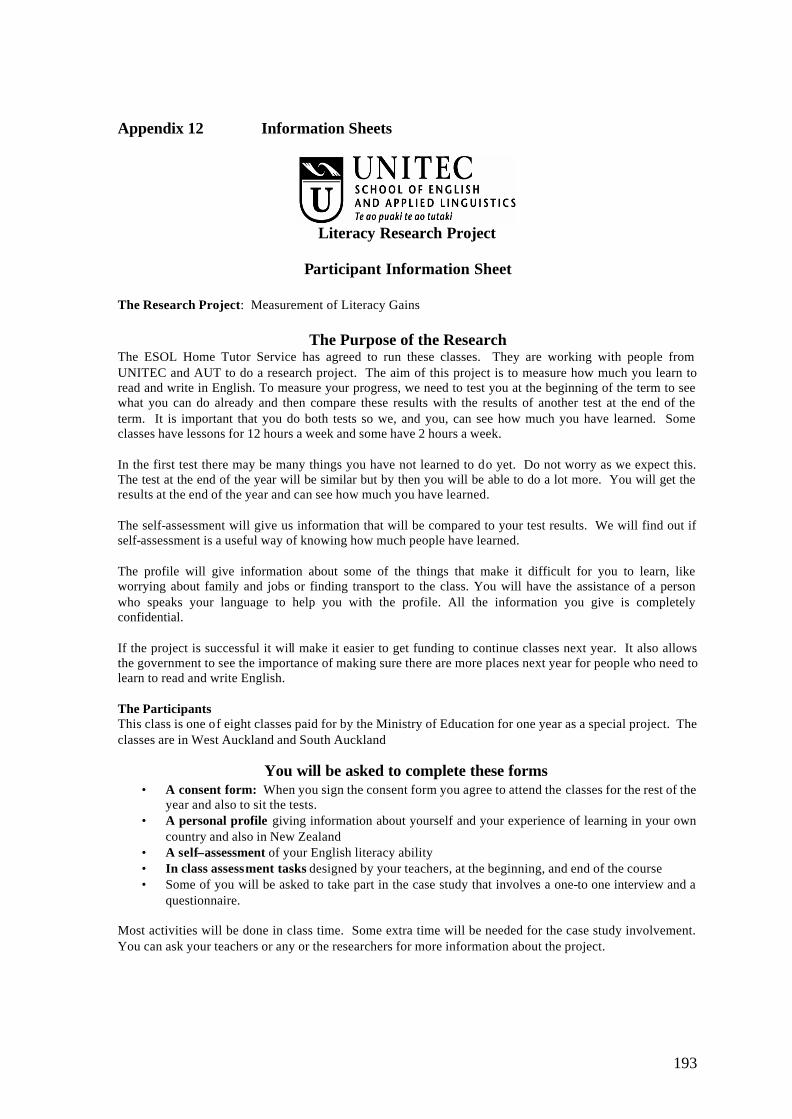
193
Appendix 12 Information Sheets
Literacy Research Project
Participant Information Sheet
The Research Project: Measurement of Literacy Gains
The Purpose of the Research
The ESOL Home Tutor Service has agreed to run these classes. They are working with people from UNITEC and AUT to do a research project. The aim of this project is to measure how much you learn to read and write in English. To measure your progress, we need to test you at the beginning of the term to see what you can do already and then compare these results with the results of another test at the end of the term. It is important that you do both tests so we, and you, can see how much you have learned. Some classes have lessons for 12 hours a week and some have 2 hours a week. In the first test there may be many things you have not learned to do yet. Do not worry as we expect this. The test at the end of the year will be similar but by then you will be able to do a lot more. You will get the results at the end of the year and can see how much you have learned. The self-assessment will give us information that will be compared to your test results. We will find out if self-assessment is a useful way of knowing how much people have learned. The profile will give information about some of the things that make it difficult for you to learn, like worrying about family and jobs or finding transport to the class. You will have the assistance of a person who speaks your language to help you with the profile. All the information you give is completely confidential. If the project is successful it will make it easier to get funding to continue classes next year. It also allows the government to see the importance of making sure there are more places next year for people who need to learn to read and write English. The Participants This class is one of eight classes paid for by the Ministry of Education for one year as a special project. The classes are in West Auckland and South Auckland
You will be asked to complete these forms • A consent form: When you sign the consent form you agree to attend the classes for the rest of the
year and also to sit the tests. • A personal profile giving information about yourself and your experience of learning in your own
country and also in New Zealand • A self–assessment of your English literacy ability • In class assessment tasks designed by your teachers, at the beginning, and end of the course • Some of you will be asked to take part in the case study that involves a one-to one interview and a
questionnaire. Most activities will be done in class time. Some extra time will be needed for the case study involvement. You can ask your teachers or any or the researchers for more information about the project.

194
Confidentiality The information received will be available only to the researchers. No one else will see the forms or use the information for any other purpose. There will be nothing in the final report that could identify you individually. All the information gathered (test forms, personal profile, and self-assessments) will be kept in a locked cabinet at the School of English and Applied Linguistics, UNITEC, Building 131. The information will be kept for five years and then it will be destroyed Researchers The research is being contracted by: Judi Altinkaya , (ESOL Home Tutor Service). She is responsible to the government for this project. Jeannie Martin Blaker (contact 8463098, [email protected]) of West Auckland ESOL Home Tutors and UNITEC; Julia Castles , (contact 2789099, [email protected]) of South Auckland ESOL Home Tutors; They are organising the tutors, writing the tests to measure literacy gain, the personal profiles and the self-assessment form and overseeing the administration of the tests. Keryn McDermott, (contact 3079999 ext 6666 [email protected]) of AUT Centre for Refugee Education; She is going to interview some people (who volunteer to be interviewed), in order to write case studies Lois Bellingham (contact 8154321 Ext 8711) Head of the School of English and Applied Linguistics has overall responsibility for UNITEC’s participation in the project Jenny Carryer (contact 8154321 ext 8171, [email protected]) of The School of English and Applied Linguistics, UNITEC. She is overseeing the management of the project, writing the literature review, gaining ethics approval from the UNITEC Ethics Approval Committee and assisting with data gathering. Dr Nikhat Shameem, School of English and Applied Linguistics,(contact 8154321 ext 8173), of UNITEC is supervising this project. She is also responsible for collating and writing the final report. The research is funded through a grant from the Ministry of Education to the National Association of ESOL Home Tutors. This study has been approved by the UNITEC Research Ethics committee from August 15, 2001 to March 3, 2002. UREC Ref: 013-2001. If you have any complaints or reservations about the ethical conduct of this research, you may contact the Committee through the Secretary (ph: 09 815 4321 Ext 8571). Any issues you raise will be treated in confidence and investigated fully, and you will be informed of the outcome.
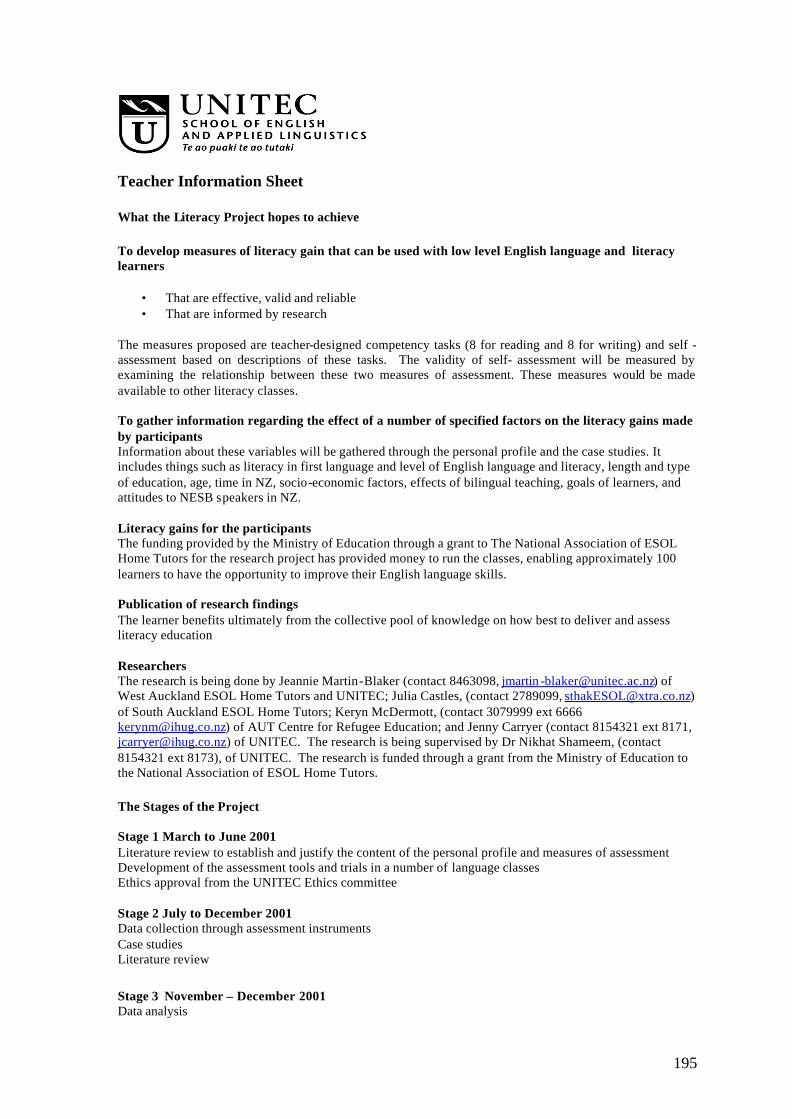
195
Teacher Information Sheet What the Literacy Project hopes to achieve To develop measures of literacy gain that can be used with low level English language and literacy learners
• That are effective, valid and reliable • That are informed by research
The measures proposed are teacher-designed competency tasks (8 for reading and 8 for writing) and self - assessment based on descriptions of these tasks. The validity of self- assessment will be measured by examining the relationship between these two measures of assessment. These measures would be made available to other literacy classes. To gather information regarding the effect of a number of specified factors on the literacy gains made by participants Information about these variables will be gathered through the personal profile and the case studies. It includes things such as literacy in first language and level of English language and literacy, length and type of education, age, time in NZ, socio-economic factors, effects of bilingual teaching, goals of learners, and attitudes to NESB speakers in NZ. Literacy gains for the participants The funding provided by the Ministry of Education through a grant to The National Association of ESOL Home Tutors for the research project has provided money to run the classes, enabling approximately 100 learners to have the opportunity to improve their English language skills. Publication of research findings The learner benefits ultimately from the collective pool of knowledge on how best to deliver and assess literacy education Researchers The research is being done by Jeannie Martin-Blaker (contact 8463098, jmartin [email protected]) of West Auckland ESOL Home Tutors and UNITEC; Julia Castles, (contact 2789099, [email protected]) of South Auckland ESOL Home Tutors; Keryn McDermott, (contact 3079999 ext 6666 [email protected]) of AUT Centre for Refugee Education; and Jenny Carryer (contact 8154321 ext 8171, [email protected]) of UNITEC. The research is being supervised by Dr Nikhat Shameem, (contact 8154321 ext 8173), of UNITEC. The research is funded through a grant from the Ministry of Education to the National Association of ESOL Home Tutors.
The Stages of the Project
Stage 1 March to June 2001 Literature review to establish and justify the content of the personal profile and measures of assessment Development of the assessment tools and trials in a number of language classes Ethics approval from the UNITEC Ethics committee Stage 2 July to December 2001 Data collection through assessment instruments Case studies Literature review
Stage 3 November – December 2001 Data analysis

196
Stage 4 January 2002 Report Writing This study has been approved by the UNITEC Research Ethics committee from August 15, 2001 to March 3, 2002. UREC Ref: 013-2001. If you have any complaints or reservations about the ethical conduct of this research, you may contact the Committee through the Secretary (ph: 09 815 4321 Ext 8571). Any issues you raise will be treated in confidence and investigated fully, and you will be informed of the outcome.

197
Appendix 13 Consent Form
Literacy Research Project: Consent form
This project looks at how we assess literacy gains of people with low levels of English language and literacy. It also aims to collect information on factors that influence literacy learning. The research is a joint programme between UNITEC, AUT and the National Association of ESOL Home Tutors. The research coordinator is Jenny Carryer and she can be contacted at UNITEC Building 136, Phone 8494180 ext 8172 email [email protected]
Please read, fill in and sign the consent form
• I have read and understood the information sheet about this research project • I have had an opportunity to ask questions about this project, and have them
answered. • I have had enough time to think about whether I want to take part in this project. • I undertake to take part in the classroom tests, self-assessment and supply a
personal profile • I understand that the information I have given will be used in this project and for
no other purposes. • I understand that no information I give will, in any way, affect my participation or
assessments of work done in the course • I understand that the information I have given is confidential and that nothing that
is written in the final report will identify me. • I understand that I can withdraw from the project without this affecting my access
to any services provided by any of the research bodies (UNITEC, AUT and National Association of ESOL Home Tutors). If I choose to withdraw, all information that I have given will be destroyed.
• I understand that copies of the final report will be available at West Auckland and
South Auckland ESOL Home Tutor offices, The Centre for Refugee Education,
198
Mangere (AUT) and The School of English and Applied Linguistics (UNITEC). A copy will be lodged in the UNITEC library.
Name of participant: ________________________________________________ Signature: ___________________________ Date: ________ The project was explained to me by ___________________________________ Signature: __________________________ Date: _________ This study has been approved by the UNITEC Research Ethics committee from August 15, 2001 to March 3, 2002. UREC Ref: 013-2001. If you have any complaints or reservations about the ethical conduct of this research, you may contact the Committee through the Secretary (ph: 09 815 4321 Ext 8571). Any issues you raise will be treated in confidence and investigated fully, and you will be informed of the outcome.

199
Appendix 14 Literacy Tests: Accompanying Document
Includes: 1. Initial and Final Tests for Reading and Writing
2. Tutor Information