Embed Size (px)
Citation preview

Final report - Hydrometers Comparison
between SIM Laboratories SIM.M.D-K4
CENAM – 2009/06/26 1/51
FINAL REPORT OF COMPARISON OF THE CALIBRATIONS OF HYDROMETERS FOR LIQUID DENSITY DETERMINATION BETWEEN SIM LABORATORIES
SIM.M.D-K4
Luis Omar Becerra Centro Nacional de Metrología, Querétaro México
1. Introduction Hydrometers are instruments widely used for different levels of precision to measure density, specific gravity, alcoholic strength, sugar concentration, milk density etc. of a liquid. The aim of this SIM comparison is to check the stated uncertainty levels and degrees of equivalence of NMI laboratories for hydrometer calibrations in the density range between 600 kg/m3 and 1 300 kg/m3 at 20 ºC and to check liquid density measuring instruments used for this purpose. This comparison followed the guidelines of the Euromet project 702 “Comparison of the calibration of high resolution hydrometers for liquid density determinations” carried out in 2003-2004. The comparison is intended to be a regional key comparison according to the Mutual Recognition Arrangements. It should also support provisional entries for the CMC tables in this sub-field and anticipate the planned CMC key comparison on hydrometers CCM.D-K4. The participating laboratories were invited to participate as proposed by CENAM, taking into account their intention to participate in this exercise expressed in the Questionnaire of density circulated in 2004. CENAM accepted to act as the pilot laboratory in this SIM comparison.
2. Participant laboratories The participant laboratories are listed in table 1. NMIs from all SIM sub-regions participated in this comparison.
Table 1. Participants of hydrometer comparison
National Institute of Metrology Acronym Country/
SIM Subregion Technical Contact(s)
Bureau of Standards of Jamaica, Kingston Jamaica
BSJ Jamaica / CARIMET
Sheldon Walker Tweedsmuir Mitchell Mairy Sanz
Centro Nacional de Metrología, Querétaro, México
CENAM Mexico /
NORAMET
Luis Omar Becerra Arturo Daued Luis Manuel Peña
Final report - Hydrometers Comparison
between SIM Laboratories SIM.M.D-K4
CENAM – 2009/06/26 2/51
Centro Nacional de Metrología de Panamá Panamá, Rep. de Panamá
CENAMEP Panama / CAMET
Saul García
CESMEC Ltda. Santiago, Chile
CESMEC Chile /
SURAMET
Francisco García Raúl Hernández Fernando Leyton
Instituto Boliviano de Metrología, La Paz, Bolivia
IBMETRO Bolivia /
ANDIMET
María del Carmen Vega Orlando Alvarez Gerson Vallejos John Zurita
Instituto Nacional de Defensa de la Competencia y de la Protección de la Propiedad Intelectual, Lima, Perú
INDECOPI Peru /
ANDIMET Abed Morales Juan Villadeza
Instituto Ecuatoriano de Normalización, Quito, Ecuador
INEN Ecuador / ANDIMET
Manuel Salazar Wilson Gallegos
Instituto Nacional de Metrologia, Normalização e Qualidade Industrial, Xerem, Brazil
INMETRO Brazil /
SURAMET
Dalni Malta José Julio Pinheiro Paulo Roberto Marteleto
Instituto Nacional de Tecnologia Industrial Buenos Aires, Argentina
INTI Argentina / SURAMET
Héctor Méndez
Laboratorio Costarricense de Metrología, San José, Costa Rica
LACOMET Costa Rica /
CAMET Sandra M. Rodríguez Olman Ramos
Laboratorio Tecnológico del Uruguay, Montevideo, Uruguay
LATU Uruguay /
SURAMET Claudia Santo Joselaine Cáceres
National Institute of Standards and Technology, Gaithersburg, United States
NIST United States /
NORAMET John D. Wright
National Research Council, Institute for National Measurement Standards, Ottawa, Canada
NRC Canada /
NORAMET Claude Jacques
Superintendencia de Industria y Comercio, Bogota, Colombia
SIC Colombia / ANDIMET
Luis Carlos Castro
Final report - Hydrometers Comparison
between SIM Laboratories SIM.M.D-K4
CENAM – 2009/06/26 3/51
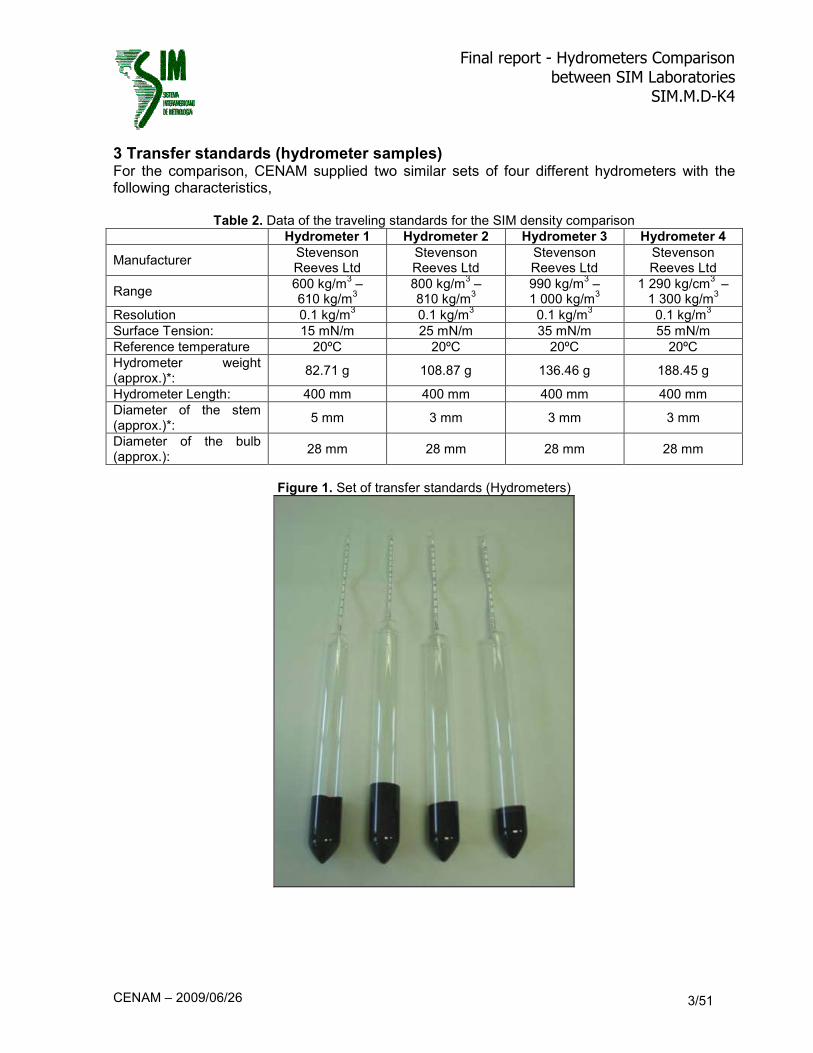
3 Transfer standards (hydrometer samples) For the comparison, CENAM supplied two similar sets of four different hydrometers with the following characteristics,
Table 2. Data of the traveling standards for the SIM density comparison
Hydrometer 1 Hydrometer 2 Hydrometer 3 Hydrometer 4
Manufacturer Stevenson Reeves Ltd
Stevenson Reeves Ltd
Stevenson Reeves Ltd
Stevenson Reeves Ltd
Range 600 kg/m
3 –
610 kg/m3
800 kg/m3 –
810 kg/m3
990 kg/m3 –
1 000 kg/m3
1 290 kg/cm3 –
1 300 kg/m3
Resolution 0.1 kg/m3 0.1 kg/m
3 0.1 kg/m
3 0.1 kg/m
3
Surface Tension: 15 mN/m 25 mN/m 35 mN/m 55 mN/m
Reference temperature 20ºC 20ºC 20ºC 20ºC
Hydrometer weight (approx.)*:
82.71 g 108.87 g 136.46 g 188.45 g
Hydrometer Length: 400 mm 400 mm 400 mm 400 mm
Diameter of the stem (approx.)*:
5 mm 3 mm 3 mm 3 mm
Diameter of the bulb (approx.):
28 mm 28 mm 28 mm 28 mm
Figure 1. Set of transfer standards (Hydrometers)
Final report - Hydrometers Comparison
between SIM Laboratories SIM.M.D-K4
CENAM – 2009/06/26 4/51
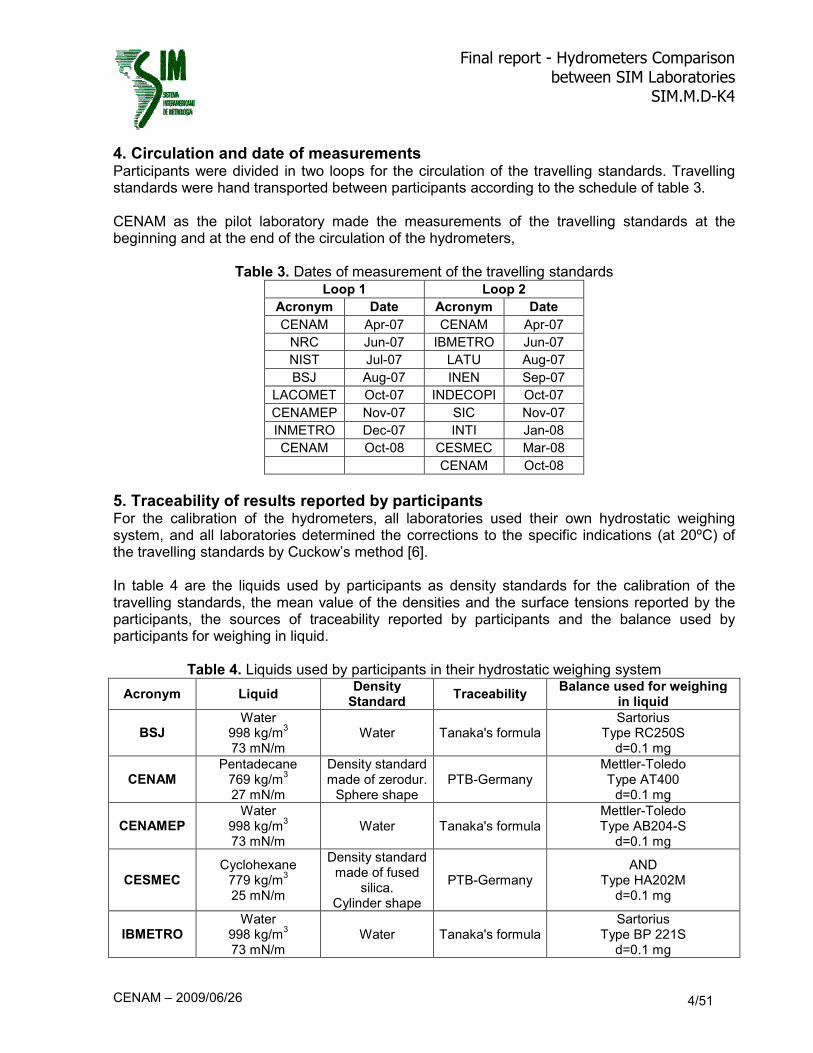
4. Circulation and date of measurements Participants were divided in two loops for the circulation of the travelling standards. Travelling standards were hand transported between participants according to the schedule of table 3. CENAM as the pilot laboratory made the measurements of the travelling standards at the beginning and at the end of the circulation of the hydrometers,
Table 3. Dates of measurement of the travelling standards Loop 1 Loop 2
Acronym Date Acronym Date
CENAM Apr-07 CENAM Apr-07
NRC Jun-07 IBMETRO Jun-07
NIST Jul-07 LATU Aug-07
BSJ Aug-07 INEN Sep-07
LACOMET Oct-07 INDECOPI Oct-07
CENAMEP Nov-07 SIC Nov-07
INMETRO Dec-07 INTI Jan-08
CENAM Oct-08 CESMEC Mar-08
CENAM Oct-08
5. Traceability of results reported by participants For the calibration of the hydrometers, all laboratories used their own hydrostatic weighing system, and all laboratories determined the corrections to the specific indications (at 20ºC) of the travelling standards by Cuckow’s method [6]. In table 4 are the liquids used by participants as density standards for the calibration of the travelling standards, the mean value of the densities and the surface tensions reported by the participants, the sources of traceability reported by participants and the balance used by participants for weighing in liquid.
Table 4. Liquids used by participants in their hydrostatic weighing system
Acronym Liquid Density Standard
Traceability Balance used for weighing
in liquid
BSJ Water
998 kg/m3
73 mN/m Water Tanaka's formula
Sartorius Type RC250S
d=0.1 mg
CENAM Pentadecane
769 kg/m3
27 mN/m
Density standard made of zerodur.
Sphere shape PTB-Germany
Mettler-Toledo Type AT400
d=0.1 mg
CENAMEP Water
998 kg/m3
73 mN/m Water Tanaka's formula
Mettler-Toledo Type AB204-S
d=0.1 mg
CESMEC Cyclohexane
779 kg/m3
25 mN/m
Density standard made of fused
silica. Cylinder shape
PTB-Germany AND
Type HA202M d=0.1 mg
IBMETRO Water
998 kg/m3
73 mN/m Water Tanaka's formula
Sartorius Type BP 221S
d=0.1 mg

Final report - Hydrometers Comparison
between SIM Laboratories SIM.M.D-K4
CENAM – 2009/06/26 5/51
INDECOPI Water
998 kg/m3
73 mN/m Water Kell's formula
Mettler-Toledo Type AE 163
d=0.1 mg
INEN Water
998 kg/m3
XXX mN/m1
Water Tanaka's formula
Mettler-Toledo Type XP8002S
d=10 mg
INMETRO Alcohol
806 kg/m3
23 mN/m
Density standard made of silicon.
Ring shape NMIJ-Japan
Sartorius Type CC3000
d=0.1 mg
INTI Water
998 kg/m3
56 mN/m Water Tanaka's formula
Sartorius Type BP 301S
d=0.1 mg
LACOMET
Iso octane 692 kg/m
3
20 mN/m (for the range of
600 to 610 kg/m3);
Water 998 kg/m
3
73 mN/m (for the others ranges)
Vibrating tube Density meter,
Water
Density meter calibrated with liquid density
standards with traceability to
DKD, Tanaka's formula
Mettler-Toledo Type AT261
d=0.1 mg
LATU n-Tridecane 756 kg/m
3
27 mN/m
Solid density standard
PTB-Germany Mettler-Toledo Type AG204
d=0.1 mg
NIST n-Tridecane 756 kg/m
3
25 mN/m
Solid density standard made of
stainless steel. Sphere shape
Formula of Patterson and Morris for the
Water's density
Mettler-Toledo Type AT201
d=0.1 mg
NRC Water
998 kg/m3
61 mN/m Water Tanaka's formula
Mettler-Toledo Type XP205DR
d=0.01 mg
SIC Nonane
718 kg/m3
26 mN/m
Density standard made of fused silica. Cylinder
shape
Tanaka's formula Mettler-Toledo Type AT400
d=0.1 mg
6. Results and uncertainties 6.1 Results reported by participants For each hydrometer, the protocol specified three nominal values for which the participants had to report the density corrections and the associated uncertainties at the specific temperature of 20 ºC. The pilot laboratory made the measurements at the beginning and at the end of the circulation of the travelling standards. The corrections and their uncertainties reported by participants are listed in table 5. The rows with successive entries of “CENAM” in Table 5 divide data from the two loops and the two hydrometers of each loop.
1 Surface tension of the reference liquid used was not reported by the participant.

Final report - Hydrometers Comparison
between SIM Laboratories SIM.M.D-K4
CENAM – 2009/06/26 6/51
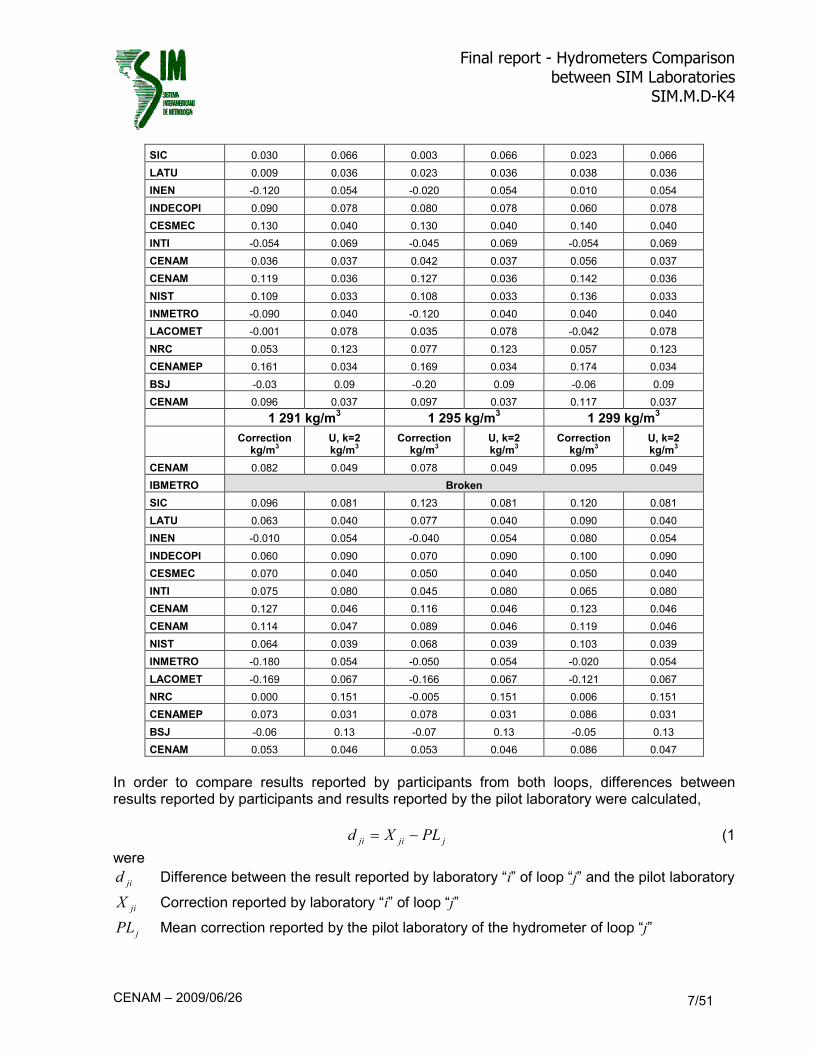
Table 5. Corrections and associated uncertainties reported by participants.
601 kg/m3 605 kg/m
3 609 kg/m
3
NMIs Correction kg/m
3
U, k=2 kg/m
3
Correction kg/m
3
U, k=2 kg/m
3
Correction kg/m
3
U, k=2 kg/m
3
CENAM 0.000 0.025 -0.012 0.025 -0.005 0.026
IBMETRO 0.340 0.061 0.340 0.061 0.390 0.061
SIC 0.007 0.047 0.000 0.047 0.028 0.047
LATU 0.030 0.033 -0.005 0.033 -0.007 0.033
INEN 0.140 0.054 0.200 0.054 0.200 0.054
INDECOPI 0.010 0.053 0.000 0.053 -0.010 0.053
CESMEC 0.000 0.050 -0.020 0.050 -0.020 0.050
INTI -0.010 0.060 -0.040 0.060 -0.050 0.060
CENAM 0.005 0.027 -0.019 0.027 -0.031 0.028
CENAM 0.077 0.025 0.069 0.025 0.064 0.025
NIST 0.085 0.023 0.072 0.023 0.076 0.023
INMETRO 0.040 0.030 0.068 0.030 0.122 0.030
LACOMET -0.200 0.069 -0.147 0.069 -0.181 0.070
NRC Withdraw
CENAMEP 0.144 0.035 0.137 0.035 0.136 0.035
BSJ -0.19 0.07 -0.25 0.07 -0.01 0.07
CENAM Broken
801 kg/m3 805 kg/m
3 809 kg/m
3
Correction kg/m
3
U, k=2 kg/m
3
Correction kg/m
3
U, k=2 kg/m
3
Correction kg/m
3
U, k=2 kg/m
3
CENAM 0.019 0.031 0.008 0.031 0.019 0.032
IBMETRO 1.020 0.080 1.030 0.080 1.020 0.080
SIC 0.037 0.056 0.038 0.056 0.059 0.056
LATU 0.039 0.034 0.027 0.034 0.037 0.034
INEN 0.120 0.054 0.030 0.054 0.030 0.054
INDECOPI 0.120 0.065 0.090 0.065 0.100 0.065
CESMEC 0.080 0.030 0.110 0.030 0.110 0.030
INTI 0.100 0.067 0.030 0.067 0.030 0.067
CENAM 0.060 0.032 0.049 0.032 0.046 0.033
CENAM 0.033 0.030 0.033 0.031 0.048 0.031
NIST 0.061 0.026 0.052 0.026 0.067 0.026
INMETRO -0.081 0.034 -0.090 0.034 -0.034 0.034
LACOMET -0.043 0.068 -0.089 0.068 -1.177 0.068
NRC -0.012 0.110 0.033 0.110 0.109 0.110
CENAMEP 0.106 0.037 0.094 0.037 0.092 0.037
BSJ -0.09 0.12 0.05 0.12 -0.02 0.12
CENAM (PL) 0.042 0.032 0.040 0.032 0.037 0.033
991 995 999
Correction kg/m
3
U, k=2 kg/m
3
Correction kg/m
3
U, k=2 kg/m
3
Correction kg/m
3
U, k=2 kg/m
3
CENAM 0.048 0.037 0.073 0.038 0.080 0.037
IBMETRO -0.216 0.052 -0.229 0.052 -0.224 0.052
Final report - Hydrometers Comparison
between SIM Laboratories SIM.M.D-K4
CENAM – 2009/06/26 7/51
SIC 0.030 0.066 0.003 0.066 0.023 0.066
LATU 0.009 0.036 0.023 0.036 0.038 0.036
INEN -0.120 0.054 -0.020 0.054 0.010 0.054
INDECOPI 0.090 0.078 0.080 0.078 0.060 0.078
CESMEC 0.130 0.040 0.130 0.040 0.140 0.040
INTI -0.054 0.069 -0.045 0.069 -0.054 0.069
CENAM 0.036 0.037 0.042 0.037 0.056 0.037
CENAM 0.119 0.036 0.127 0.036 0.142 0.036
NIST 0.109 0.033 0.108 0.033 0.136 0.033
INMETRO -0.090 0.040 -0.120 0.040 0.040 0.040
LACOMET -0.001 0.078 0.035 0.078 -0.042 0.078
NRC 0.053 0.123 0.077 0.123 0.057 0.123
CENAMEP 0.161 0.034 0.169 0.034 0.174 0.034
BSJ -0.03 0.09 -0.20 0.09 -0.06 0.09
CENAM 0.096 0.037 0.097 0.037 0.117 0.037
1 291 kg/m3 1 295 kg/m
3 1 299 kg/m
3
Correction kg/m
3
U, k=2 kg/m
3
Correction kg/m
3
U, k=2 kg/m
3
Correction kg/m
3
U, k=2 kg/m
3
CENAM 0.082 0.049 0.078 0.049 0.095 0.049
IBMETRO Broken
SIC 0.096 0.081 0.123 0.081 0.120 0.081
LATU 0.063 0.040 0.077 0.040 0.090 0.040
INEN -0.010 0.054 -0.040 0.054 0.080 0.054
INDECOPI 0.060 0.090 0.070 0.090 0.100 0.090
CESMEC 0.070 0.040 0.050 0.040 0.050 0.040
INTI 0.075 0.080 0.045 0.080 0.065 0.080
CENAM 0.127 0.046 0.116 0.046 0.123 0.046
CENAM 0.114 0.047 0.089 0.046 0.119 0.046
NIST 0.064 0.039 0.068 0.039 0.103 0.039
INMETRO -0.180 0.054 -0.050 0.054 -0.020 0.054
LACOMET -0.169 0.067 -0.166 0.067 -0.121 0.067
NRC 0.000 0.151 -0.005 0.151 0.006 0.151
CENAMEP 0.073 0.031 0.078 0.031 0.086 0.031
BSJ -0.06 0.13 -0.07 0.13 -0.05 0.13
CENAM 0.053 0.046 0.053 0.046 0.086 0.047
In order to compare results reported by participants from both loops, differences between results reported by participants and results reported by the pilot laboratory were calculated,
jjiji PLXd −= (1
were
jid Difference between the result reported by laboratory “i” of loop “j” and the pilot laboratory
jiX Correction reported by laboratory “i” of loop “j”
jPL Mean correction reported by the pilot laboratory of the hydrometer of loop “j”

Final report - Hydrometers Comparison
between SIM Laboratories SIM.M.D-K4
CENAM – 2009/06/26 8/51
As the pilot laboratory measured the travelling standards at the beginning and at the end of the circulation, the value of the pilot laboratory (PL) is the mean of both measurements (at the
beginning and at the end of the circulation). The uncertainty of the difference dji was calculated as following,
( ) ( ) ( )jjiji PLrepuXudu ,22 += (2
where
( )jidu standard uncertainty of the difference
( )jiXu standard uncertainty reported by the participant2
( )jPLrepu , 3 uncertainty contribution due to the reproducibility of the measurements done by
the pilot laboratory
The standard uncertainty due to the reproducibility of the pilot laboratory was calculated considering the difference of the measurements of the pilot laboratory (at the beginning and at the end of the circulation of the travelling standards) and taking this difference as an interval of uniform probability density.
( )12
,21 jj
j
PLPLPLrepu
−= (3
The standard uncertainties due to the reproducibility of the pilot laboratory measurements are listed in table 6.
Table 6. Standard uncertainties due to the reproducibility of the pilot laboratory
Nominal Value u (rep, PL), kg/m3 ( k=1)
kg/m3 Loop 1 Loop 2
601 0.002 0.002
605 0.002 0.002
609 0.008 0.008
801 0.003 0.012
805 0.002 0.012
809 0.003 0.008
991 0.007 0.004
995 0.009 0.009
2 Uncertainties related to the transfer standard itself other than reproducibility, i.e. uncertainty in the
thermal expansion coefficient of the hydrometer glass, were included in the uncertainty analyses of each participating laboratory, are already included in u(Xji), or were negligible, and therefore are not listed separately in formula 2. 3 The pilot laboratory made a slight change in the hydrostatic weighing system between measurements,
which consisted in the change of the source of light (the use of LEDs instead of a fluorescent bulb) for the optical system for positioning the mark of the hydrometers). The differences between both measurements of the pilot laboratory were within the calibration uncertainty; however these differences were taken into account for the analysis of uncertainty.

Final report - Hydrometers Comparison
between SIM Laboratories SIM.M.D-K4
CENAM – 2009/06/26 9/51
999 0.007 0.007
1291 0.018 0.013
1295 0.011 0.011
1299 0.010 0.008
All differences are reported in tables 7 to 10 and plotted in figures 2 to 5. 6.2 Contributions to the uncertainties The accuracy of the values reported by the participants depends on all their systems, and as this SIM comparison was performed with hydrometers of high accuracy (resolution of 0.1 kg/m
3), participants
should take special attention to these contributions to uncertainties that are usually hidden by the resolution of the instruments. Some of the input quantities for the hydrometers calibration by Cuckow’s method are:
• Density of the transfer liquid
o Thermal expansion coefficient of the transfer liquid
o Isothermal compressibility coefficient of the transfer liquid
o Temperature of the transfer liquid
� Characteristics of the measurement instrument
� Stability of the liquid temperature
� Temperature gradients in the liquid
o Pressure of the transfer liquid
� Characteristics of the measurement instrument
� Pressure gradients in the liquid
• Surface tension of the transfer liquid
• Diameter of the stem
• Mass measurements of the hydrometer (both in air and in liquid)
o Repeatability and reproducibility of the mass measurements
o Resolution of the balance
o Indication error of the balance
• Positioning of the mark
o Resolution of the hydrometer
o Alignment of the hydrometer
• Air density
o Air Temperature
� Characteristics of the measurement instrument
� Stability of the air temperature
o Atmospheric pressure
� Characteristics of the measurement instrument
o Relative humidity
� Characteristics of the measurement instrument
� Stability of the relative humidity
• Local gravity
• Others

Final report - Hydrometers Comparison
between SIM Laboratories SIM.M.D-K4
CENAM – 2009/06/26 10/51
7. Reference values The proposed reference values (for each nominal value) were evaluated using procedure A (weighted mean), procedure B (median) according to Cox [2002] [1] and the weighted mean of the largest consistent subset according to Cox [2007] [2]. 7.1 Weighted mean (Procedure A) The use of the weighted mean as a reference value could be applied only if all values reported by participants are consistent. The consistency of results reported by participants was evaluated by the chi-squared test,
( ){ } 05.0Pr22 <> obsχυχ .
No consistency among participants was found for all nominal values. Some values reported by participants were found as “anomalous” according to chi-squared test at an approx. 95% of confidence level. 7.2 Median (Procedure B) As some of the values reported by participants were found as “anomalous”, a proposed reference value was calculated using procedure B of Cox [2002] [1]. This proposed reference value was evaluated by numerical simulation as the median of the differences of results reported by participants and results reported by pilot laboratory. Each reference value calculated by numerical simulation (Monte Carlo method [5]) was evaluated with 1x10⁶ trials. For the numerical simulation, the inputs are the probability density functions (pdfs) of the differences between reported values by participants and reported values by the pilot laboratory and their associated uncertainties as the mean and the standard deviations of normal pdfs
( )sx� , .
Those pdfs were combined according to the mathematical model (median) and the mean and the standard deviation of the pdf resulting from the numerical simulation were taken as the reference value and its associated uncertainty for each nominal value. Proposed reference values by procedure B (medians) are reported in tables 7 to 10 and shown in figures 2 to 5.
Final report - Hydrometers Comparison
between SIM Laboratories SIM.M.D-K4
CENAM – 2009/06/26 11/51
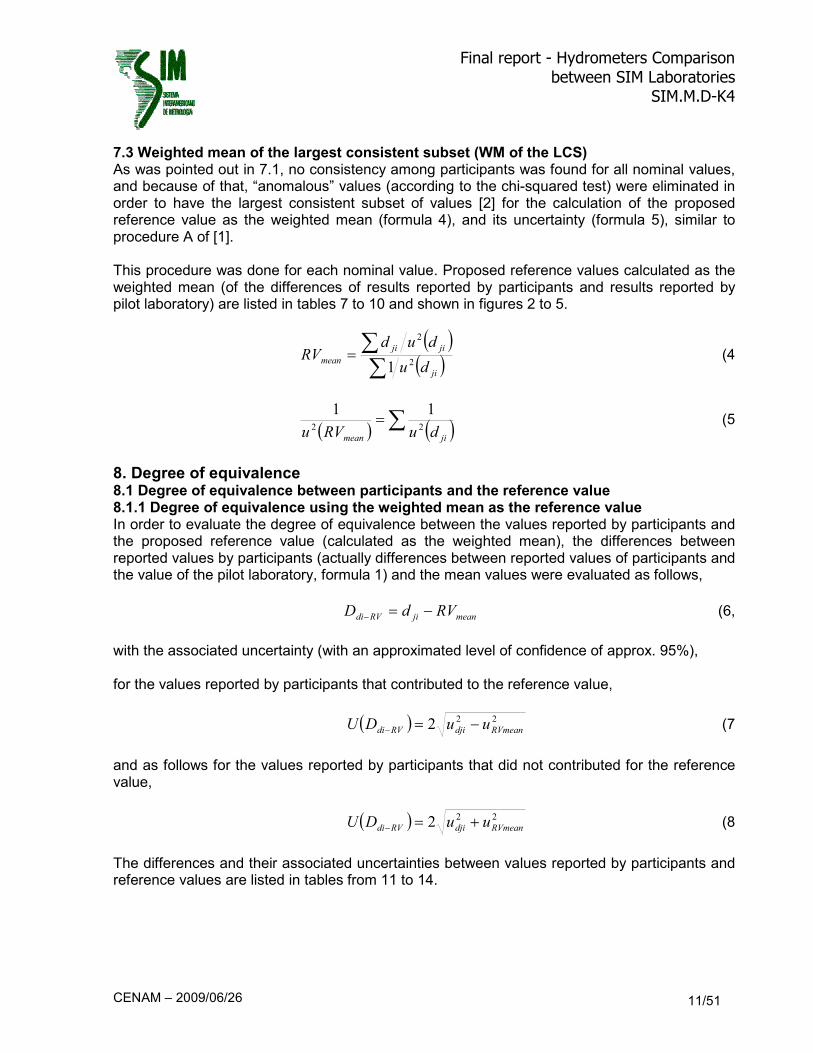
7.3 Weighted mean of the largest consistent subset (WM of the LCS) As was pointed out in 7.1, no consistency among participants was found for all nominal values, and because of that, “anomalous” values (according to the chi-squared test) were eliminated in order to have the largest consistent subset of values [2] for the calculation of the proposed reference value as the weighted mean (formula 4), and its uncertainty (formula 5), similar to procedure A of [1]. This procedure was done for each nominal value. Proposed reference values calculated as the weighted mean (of the differences of results reported by participants and results reported by pilot laboratory) are listed in tables 7 to 10 and shown in figures 2 to 5.
( )( )∑
∑=
ji
jiji
meandu
dudRV
2
2
1 (4
( ) ( )∑=jimean duRVu 22
11 (5
8. Degree of equivalence 8.1 Degree of equivalence between participants and the reference value 8.1.1 Degree of equivalence using the weighted mean as the reference value In order to evaluate the degree of equivalence between the values reported by participants and the proposed reference value (calculated as the weighted mean), the differences between reported values by participants (actually differences between reported values of participants and the value of the pilot laboratory, formula 1) and the mean values were evaluated as follows,
meanjiRVdi RVdD −=− (6,
with the associated uncertainty (with an approximated level of confidence of approx. 95%), for the values reported by participants that contributed to the reference value,
( ) 222 RVmeandjiRVdi uuDU −=− (7
and as follows for the values reported by participants that did not contributed for the reference value,
( ) 222 RVmeandjiRVdi uuDU +=− (8
The differences and their associated uncertainties between values reported by participants and reference values are listed in tables from 11 to 14.
Final report - Hydrometers Comparison
between SIM Laboratories SIM.M.D-K4
CENAM – 2009/06/26 12/51
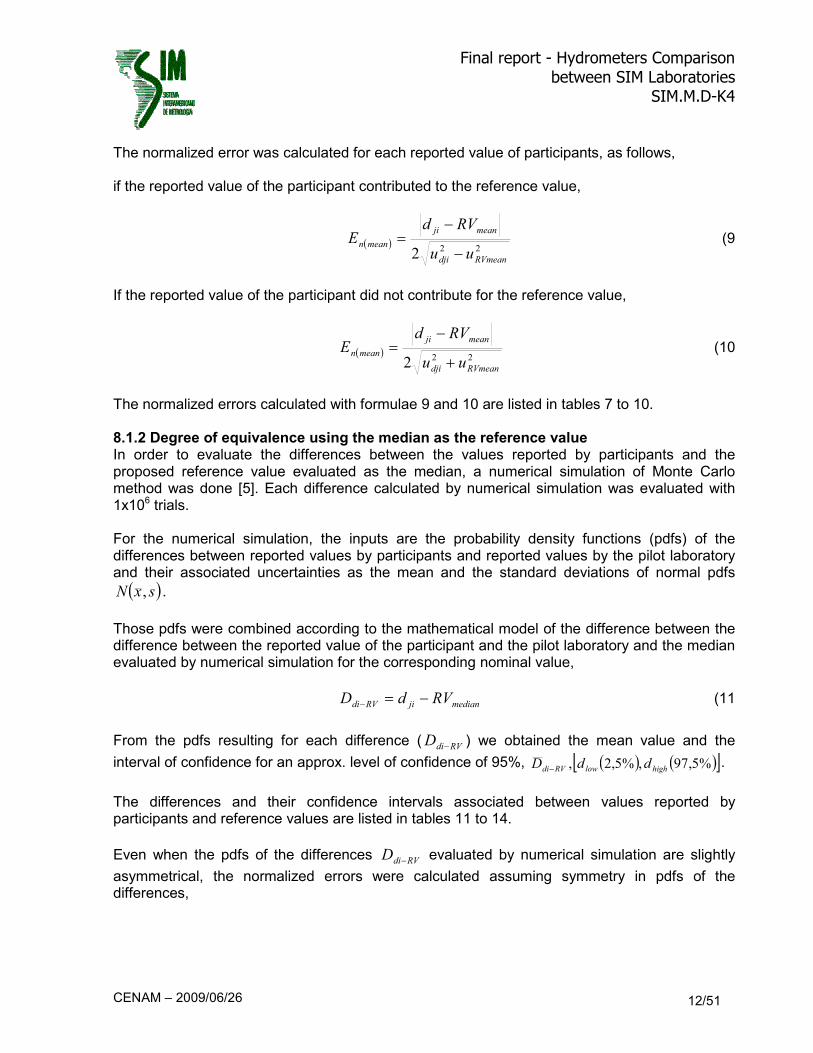
The normalized error was calculated for each reported value of participants, as follows, if the reported value of the participant contributed to the reference value,
( )22
2 RVmeandji
meanji
meann
uu
RVdE
−
−= (9
If the reported value of the participant did not contribute for the reference value,
( )22
2 RVmeandji
meanji
meann
uu
RVdE
+
−= (10
The normalized errors calculated with formulae 9 and 10 are listed in tables 7 to 10. 8.1.2 Degree of equivalence using the median as the reference value In order to evaluate the differences between the values reported by participants and the proposed reference value evaluated as the median, a numerical simulation of Monte Carlo method was done [5]. Each difference calculated by numerical simulation was evaluated with 1x10⁶ trials. For the numerical simulation, the inputs are the probability density functions (pdfs) of the differences between reported values by participants and reported values by the pilot laboratory and their associated uncertainties as the mean and the standard deviations of normal pdfs
( )sx� , .
Those pdfs were combined according to the mathematical model of the difference between the difference between the reported value of the participant and the pilot laboratory and the median evaluated by numerical simulation for the corresponding nominal value,
medianjiRVdi RVdD −=− (11
From the pdfs resulting for each difference ( RVdiD − ) we obtained the mean value and the
interval of confidence for an approx. level of confidence of 95%, ( ) ( )[ ]%5,97,%5,2, highlowRVdi ddD −.
The differences and their confidence intervals associated between values reported by participants and reference values are listed in tables 11 to 14.
Even when the pdfs of the differences RVdiD − evaluated by numerical simulation are slightly
asymmetrical, the normalized errors were calculated assuming symmetry in pdfs of the differences,

Final report - Hydrometers Comparison
between SIM Laboratories SIM.M.D-K4
CENAM – 2009/06/26 13/51
( )
( )lowhigh
medianji
mediann
dd
RVdE
−
−=
2
1 (12
The normalized errors calculated with formula 12 are listed in tables 7 to 10. 8.2 Degree of equivalence between participants The degree of equivalence among participant laboratories was calculated as the difference between the values reported by participants. In order to do this the values reported by the pilot laboratory were used as pivot values. Degree of equivalence between participant laboratories of the same loop is,
( ) ( )
jBjABA
jjBjjABA
jBjABA
XXD
PLXPLXD
ddD
−=
−−−=
−=
−
−
−
(13
with the expanded uncertainty as follows,
( ) ( ) ( ) ( )jjBjABA PLrepududuDu ,2222 −+=− (14
Degree of equivalence between participant laboratories of different loops is,
( ) ( )
kCjACA
kkCjjACA
kCjACA
XXD
PLXPLXD
ddD
−=
−−−=
−=
−
−
−
(15
with the expanded uncertainty as follows,
( ) ( ) ( )( ) ( )
2
,,2
22
22 kj
kCjACA
PLrepuPLrepudududD
+−+=− (16
The degrees of equivalence between participants are listed in tables 15 to 26.

Final report - Hydrometers Comparison
between SIM Laboratories SIM.M.D-K4
CENAM – 2009/06/26 14/51
9. Conclusions The main objectives of this SIM comparison were:
• to evaluate the degree of equivalence between SIM NMIs in the calibration of hydrometers of high accuracy within the range of 600 kg/m3 to 1 300 kg/m3,and
• to anticipate to the CCM KC on hydrometers calibration and eventually to link the results
of SIM NMIs with Key Comparison Reference Value (KCRV) of CCM.D-K4 In order to reach such objectives, two sets of four hydrometers each were circulated between fourteen NMIs of SIM. For the circulation of the travelling standards the NMIs were divided in two petals, linked only by the results of the pilot laboratory. All measurements were carried out from April 2007 to October 2008. For the measurements each laboratory used their own hydrostatic weighing system with their own respective standard liquid such as: water, pentadecane, cyclohexane, alcohol, iso-octane and n-tridecane. The traceabilities of the density standard liquids are either from PTB’s density standard, from NMIJ’s density Standard, or from different formulae to calculate the density of water (Tanaka’s formula and others formulae). The degree of equivalence between participants in the scope of this comparison are calculated from the results reported by each participants in table 5. They are reported in tables 15 to 26. Two sets of reference values, for each nominal value, were proposed to the participants: the weighed mean of the largest consistent subset [2] and the median [1]. The participant laboratories agreed to use of the weighed mean of the largest consistent subset as the reference value for this comparison. The differences (and its associated uncertainty) between the participant laboratories and the agreed reference value Ddi-RVmean, for each nominal value are listed in tables 11 to 14 and
shown in figures 6 to 9. The normalized errors calculated for each result reported by participants are listed in tables 7 to 10. These normalized errors were calculated with a level of confidence of approximately 95% (k=2). The distributions of the normalized errors to the reference values calculated from all participants are,
• 63.6 % below to 1, for the four ranges, from 600 kg/m3 to 1 300 kg/m3, • 80.3 % below to 2 for the four ranges, from 600 kg/m3 to 1 300 kg/m3, • 85.2 % below to 3 for the four ranges, from 600 kg/m3 to 1 300 kg/m3,
• 56.4 % below to 1 within the range of 600 kg/m3 to 610 kg/m3, • 69.1 % below to 1 within the range of 800 kg/m3 to 810 kg/m3,

Final report - Hydrometers Comparison
between SIM Laboratories SIM.M.D-K4
CENAM – 2009/06/26 15/51
• 50.0 % below to 1 within the range of 990 kg/m3 to 1 000 kg/m3, • 79.5 % below to 1 within the range of 1 290 kg/m3 to 1 300 kg/m3.
Reference [1] Cox, M. - The evaluation of key comparison data - Metrologia, 2002, 39, 589-595 [2] Cox, M. – The evaluation of the key comparison data: determining the largest consistent
subset – Metrologia 44 (2007) 187-200 [3] Lorefice, S et al. – EUROMET.M.D-K4 / EUROMET Project 702: Comparison of the
calibration of high resolution hydrometers for liquid density determinations – Metrologia, 2008, 45, Tech. Suppl., 07008. EUROMET.M.D-K4 Final Report, 2008.
[4] JCGM 100:2008 - Evaluation of measurement data — Guide to the expression of uncertainty in measurement -
[5] JCGM 101:2008 - Evaluation of measurement data — Supplement 1 to the “Guide to the expression of uncertainty in measurement” — Propagation of distributions using a Monte Carlo method
[6] Cuckow F W - A new method of high accuracy for the calibration of reference standard hydrometers J. Soc. Chem. Indust. 68 44–9, 1949

Final report - Hydrometers Comparison
between SIM Laboratories SIM.M.D-K4
CENAM – 2009/06/26 16/51
Table 7. Differences between results reported by participant laboratories and pilot laboratory for the hydrometer with range 600 kg/m3 to 610 kg/m3 . The normalized errors calculated against the mean and against the median are listed too. Values are reported in kg/m3
601 kg/m3 605 kg/m
3 609 kg/m
3
d U, k=2 En (W. Mean) En (Median) d U, k=2 En (W. Mean) En (Median) d U, k=2 En (W. Mean) En (Median)
CENAM 0.000 0.027 0.30 0.18 0.000 0.028 0.15 0.21 0.000 0.032 0.29 0.49
IBMETRO 0.338 0.062 5.25 5.28 0.356 0.062 5.59 5.61 0.408 0.063 6.14 6.01
SIC 0.005 0.047 0.06 0.02 0.016 0.047 0.27 0.21 0.046 0.049 0.80 0.63
LATU 0.028 0.033 0.68 0.66 0.011 0.033 0.23 0.14 0.011 0.036 0.09 0.13
INEN 0.138 0.054 2.34 2.36 0.216 0.054 3.80 3.77 0.218 0.056 3.61 3.45
INDECOPI 0.008 0.053 0.01 0.05 0.016 0.053 0.24 0.19 0.008 0.055 0.00 0.15
CESMEC -0.002 0.050 0.20 0.16 -0.004 0.050 0.17 0.21 -0.002 0.052 0.20 0.36
INTI -0.012 0.060 0.33 0.31 -0.024 0.060 0.48 0.52 -0.032 0.062 0.67 0.81
NIST 0.008 0.023 0.03 0.09 0.003 0.023 0.01 0.10 0.012 0.028 0.16 0.13
INMETRO -0.037 0.030 1.64 1.23 -0.001 0.030 0.15 0.21 0.058 0.034 1.34 1.08
LACOMET -0.277 0.069 4.05 4.03 -0.216 0.069 3.12 3.19 -0.245 0.072 3.46 3.58
NRC
CENAMEP 0.067 0.035 1.60 1.59 0.068 0.035 1.74 1.66 0.072 0.038 1.56 1.33
BSJ -0.268 0.074 3.64 3.64 -0.317 0.074 4.24 4.33 -0.078 0.076 1.16 1.22
W. mean 0.007 0.013 0.004 0.013 0.008 0.015
median 0.005 0.019 0.006 0.016 0.016 0.020
The values in bold were taken into account for the calculation of the reference value according to WM of the LCS (weighted mean). For the reference value calculated by procedure B (median) were taking into account values reported by all participants.

Final report - Hydrometers Comparison
between SIM Laboratories SIM.M.D-K4
CENAM – 2009/06/26 17/51
Table 8. Differences between results reported by participant laboratories and pilot laboratory for the hydrometer with range 800 kg/m3 to 810 kg/m3 . The normalized errors calculated against the mean and against the median are listed too. Values are reported in kg/m3
801 kg/m3 805 kg/m
3 809 kg/m
3
d U, k=2 En (W. Mean) En (Median) d U, k=2 En (W. Mean) En (Median) d U, k=2 En (W. Mean) En (Median)
CENAM 0.000 0.040 0.68 0.50 0.000 0.040 0.70 0.32 0.000 0.036 0.90 0.49
IBMETRO 0.981 0.083 11.29 11.46 1.001 0.083 11.52 11.65 0.988 0.081 11.60 11.76
SIC -0.002 0.061 0.46 0.38 0.009 0.061 0.29 0.06 0.027 0.058 0.06 0.17
LATU 0.000 0.041 0.66 0.49 -0.002 0.042 0.71 0.34 0.005 0.037 0.72 0.34
INEN 0.081 0.059 0.98 1.03 0.001 0.059 0.43 0.20 -0.002 0.056 0.59 0.37
INDECOPI 0.081 0.069 0.83 0.92 0.061 0.069 0.52 0.72 0.068 0.067 0.58 0.78
CESMEC 0.041 0.038 0.45 0.59 0.081 0.038 1.54 1.57 0.078 0.034 1.54 1.54
INTI 0.061 0.071 0.52 0.63 0.001 0.071 0.36 0.17 -0.002 0.069 0.48 0.30
NIST 0.024 0.026 0.05 0.18 0.015 0.026 0.50 0.08 0.024 0.026 0.25 0.23
INMETRO -0.118 0.034 3.81 3.48 -0.127 0.034 4.13 3.46 -0.077 0.035 2.88 2.38
LACOMET -0.081 0.068 1.51 1.43 -0.125 0.068 2.18 1.96 -1.220 0.068 17.96 17.68
NRC -0.049 0.111 0.68 0.66 -0.004 0.111 0.27 0.16 0.066 0.111 0.33 0.46
CENAMEP 0.069 0.037 1.10 1.21 0.057 0.037 0.91 1.07 0.049 0.037 0.55 0.82
BSJ -0.126 0.119 1.26 1.23 0.009 0.119 0.15 0.04 -0.067 0.119 0.82 0.75
W. mean 0.025 0.015 0.026 0.014 0.030 0.013
median 0.019 0.021 0.013 0.023 0.018 0.021
The values in bold were taken into account for the calculation of the reference value according to WM of the LCS (weighted mean). For the reference value calculated by procedure B (median) were taking into account values reported by all participants.

Final report - Hydrometers Comparison
between SIM Laboratories SIM.M.D-K4
CENAM – 2009/06/26 18/51
Table 9. Differences between results reported by participant laboratories and pilot laboratory for the hydrometer with range 990 kg/m3 to 1000 kg/m3 . The normalized errors calculated against the mean and against the median are listed too. Values are reported in kg/m3
991 kg/m3 995 kg/m
3 999 kg/m
3
d U, k=2 En (W. Mean) En (Median) d U, k=2 En (W. Mean) En (Median) d U, k=2 En (W. Mean) En (Median)
CENAM 0.000 0.039 0.40 0.92 0.000 0.042 0.73 0.95 0.000 0.040 0.46 1.03
IBMETRO -0.258 0.052 4.38 3.45 -0.287 0.055 4.45 3.85 -0.292 0.054 4.83 3.97
SIC -0.012 0.066 0.03 0.53 -0.054 0.068 0.41 0.12 -0.045 0.067 0.44 0.08
LATU -0.033 0.037 0.61 0.29 -0.034 0.040 0.20 0.28 -0.030 0.039 0.40 0.47
INEN -0.162 0.054 2.57 1.85 -0.077 0.057 0.93 0.55 -0.058 0.056 0.79 0.15
INDECOPI 0.048 0.078 0.82 1.12 0.023 0.080 0.64 0.88 -0.008 0.079 0.11 0.56
CESMEC 0.088 0.041 2.27 2.52 0.073 0.044 2.08 2.24 0.072 0.042 1.91 2.36
INTI -0.096 0.069 1.24 0.78 -0.102 0.071 1.09 0.79 -0.121 0.070 1.45 0.99
NIST 0.001 0.036 0.50 0.98 -0.004 0.037 0.73 0.94 0.006 0.036 0.73 1.20
INMETRO -0.198 0.042 3.97 2.85 -0.232 0.044 4.31 3.50 -0.090 0.042 1.58 0.85
LACOMET -0.109 0.079 1.17 0.84 -0.077 0.080 0.64 0.41 -0.172 0.079 1.90 1.46
NRC -0.054 0.124 0.33 0.09 -0.035 0.124 0.06 0.10 -0.073 0.124 0.47 0.21
CENAMEP 0.053 0.037 1.63 1.97 0.057 0.038 1.98 2.13 0.044 0.037 1.46 1.98
BSJ -0.140 0.089 1.39 1.06 -0.309 0.090 3.07 2.81 -0.190 0.089 1.90 1.51
W. mean -0.014 0.019 -0.027 0.019 -0.016 0.019
median -0.044 0.035 -0.047 0.032 -0.049 0.031
The values in bold were taken into account for the calculation of the reference value according to WM of the LCS (weighted mean). For the reference value calculated by procedure B (median) were taking into account values reported by all participants.
Final report - Hydrometers Comparison
between SIM Laboratories SIM.M.D-K4
CENAM – 2009/06/26 19/51
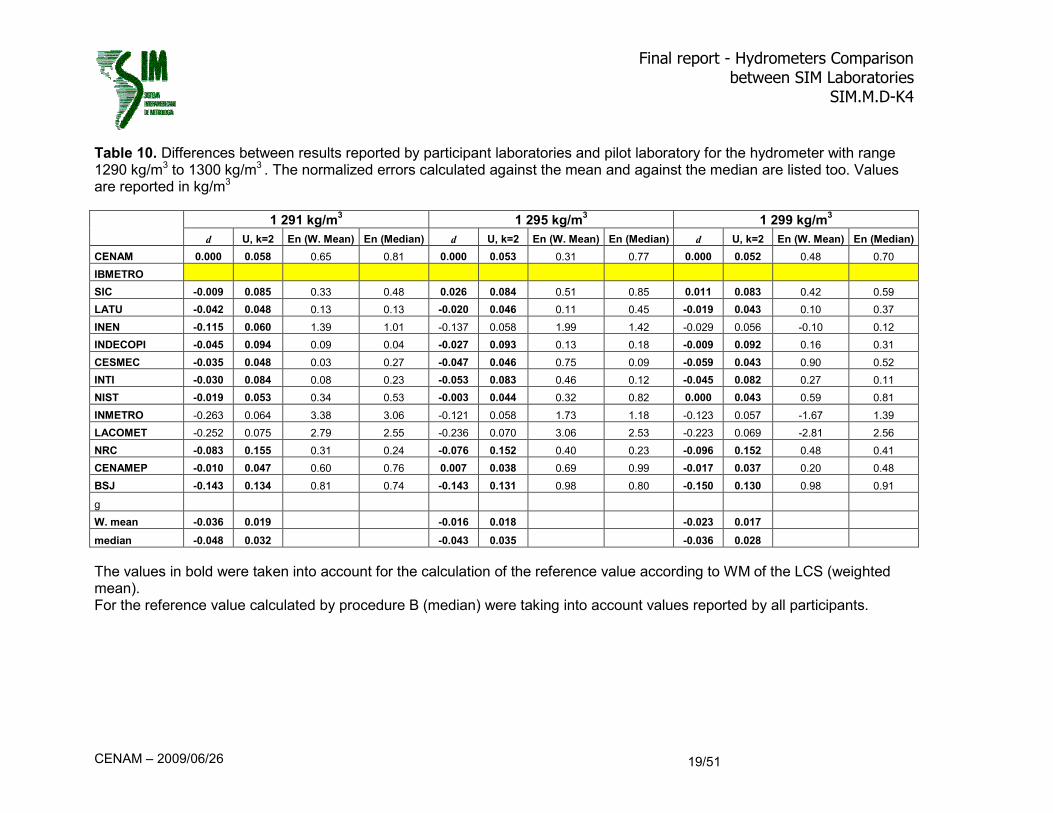
Table 10. Differences between results reported by participant laboratories and pilot laboratory for the hydrometer with range 1290 kg/m3 to 1300 kg/m3 . The normalized errors calculated against the mean and against the median are listed too. Values are reported in kg/m3
1 291 kg/m3 1 295 kg/m
3 1 299 kg/m
3
d U, k=2 En (W. Mean) En (Median) d U, k=2 En (W. Mean) En (Median) d U, k=2 En (W. Mean) En (Median)
CENAM 0.000 0.058 0.65 0.81 0.000 0.053 0.31 0.77 0.000 0.052 0.48 0.70
IBMETRO
SIC -0.009 0.085 0.33 0.48 0.026 0.084 0.51 0.85 0.011 0.083 0.42 0.59
LATU -0.042 0.048 0.13 0.13 -0.020 0.046 0.11 0.45 -0.019 0.043 0.10 0.37
INEN -0.115 0.060 1.39 1.01 -0.137 0.058 1.99 1.42 -0.029 0.056 -0.10 0.12
INDECOPI -0.045 0.094 0.09 0.04 -0.027 0.093 0.13 0.18 -0.009 0.092 0.16 0.31
CESMEC -0.035 0.048 0.03 0.27 -0.047 0.046 0.75 0.09 -0.059 0.043 0.90 0.52
INTI -0.030 0.084 0.08 0.23 -0.053 0.083 0.46 0.12 -0.045 0.082 0.27 0.11
NIST -0.019 0.053 0.34 0.53 -0.003 0.044 0.32 0.82 0.000 0.043 0.59 0.81
INMETRO -0.263 0.064 3.38 3.06 -0.121 0.058 1.73 1.18 -0.123 0.057 -1.67 1.39
LACOMET -0.252 0.075 2.79 2.55 -0.236 0.070 3.06 2.53 -0.223 0.069 -2.81 2.56
NRC -0.083 0.155 0.31 0.24 -0.076 0.152 0.40 0.23 -0.096 0.152 0.48 0.41
CENAMEP -0.010 0.047 0.60 0.76 0.007 0.038 0.69 0.99 -0.017 0.037 0.20 0.48
BSJ -0.143 0.134 0.81 0.74 -0.143 0.131 0.98 0.80 -0.150 0.130 0.98 0.91
g
W. mean -0.036 0.019 -0.016 0.018 -0.023 0.017
median -0.048 0.032 -0.043 0.035 -0.036 0.028
The values in bold were taken into account for the calculation of the reference value according to WM of the LCS (weighted mean). For the reference value calculated by procedure B (median) were taking into account values reported by all participants.
Final report - Hydrometers Comparison
between SIM Laboratories SIM.M.D-K4
CENAM – 2009/06/26 20/51
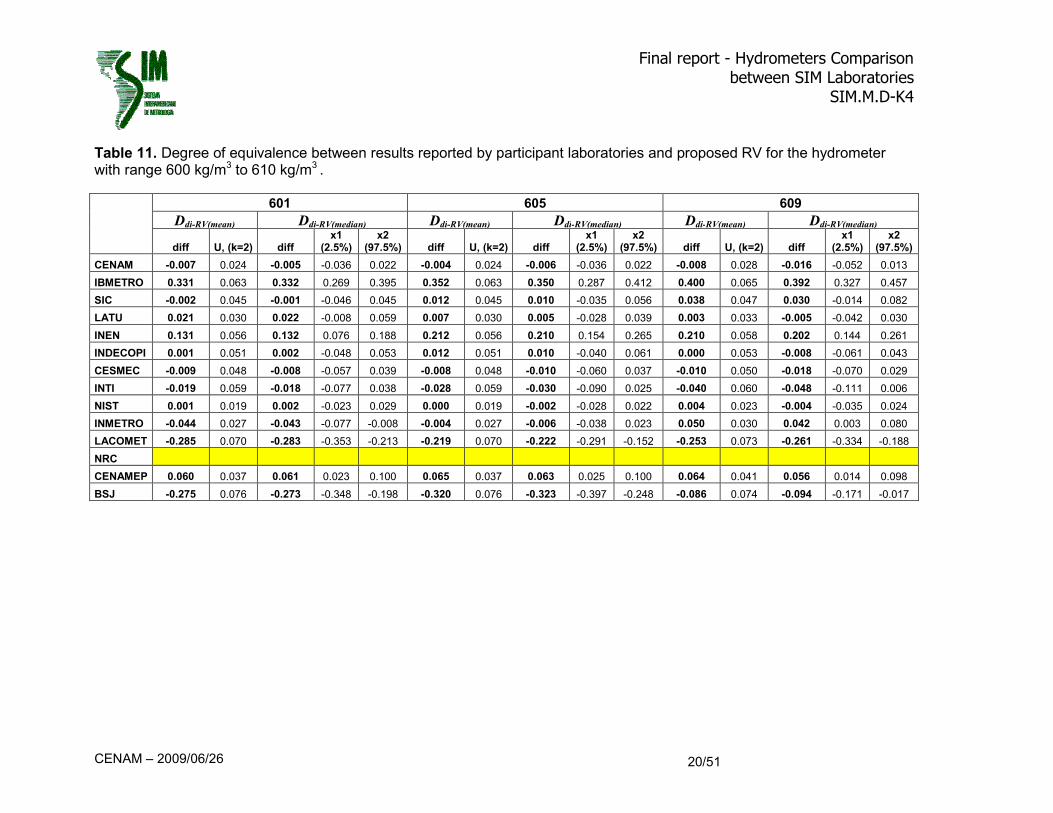
Table 11. Degree of equivalence between results reported by participant laboratories and proposed RV for the hydrometer with range 600 kg/m3 to 610 kg/m3 .
601 605 609
Ddi-RV(mean) Ddi-RV(median) Ddi-RV(mean) Ddi-RV(median) Ddi-RV(mean) Ddi-RV(median)
diff U, (k=2) diff x1
(2.5%) x2
(97.5%) diff U, (k=2) diff x1
(2.5%) x2
(97.5%) diff U, (k=2) diff x1
(2.5%) x2
(97.5%)
CENAM -0.007 0.024 -0.005 -0.036 0.022 -0.004 0.024 -0.006 -0.036 0.022 -0.008 0.028 -0.016 -0.052 0.013
IBMETRO 0.331 0.063 0.332 0.269 0.395 0.352 0.063 0.350 0.287 0.412 0.400 0.065 0.392 0.327 0.457
SIC -0.002 0.045 -0.001 -0.046 0.045 0.012 0.045 0.010 -0.035 0.056 0.038 0.047 0.030 -0.014 0.082
LATU 0.021 0.030 0.022 -0.008 0.059 0.007 0.030 0.005 -0.028 0.039 0.003 0.033 -0.005 -0.042 0.030
INEN 0.131 0.056 0.132 0.076 0.188 0.212 0.056 0.210 0.154 0.265 0.210 0.058 0.202 0.144 0.261
INDECOPI 0.001 0.051 0.002 -0.048 0.053 0.012 0.051 0.010 -0.040 0.061 0.000 0.053 -0.008 -0.061 0.043
CESMEC -0.009 0.048 -0.008 -0.057 0.039 -0.008 0.048 -0.010 -0.060 0.037 -0.010 0.050 -0.018 -0.070 0.029
INTI -0.019 0.059 -0.018 -0.077 0.038 -0.028 0.059 -0.030 -0.090 0.025 -0.040 0.060 -0.048 -0.111 0.006
NIST 0.001 0.019 0.002 -0.023 0.029 0.000 0.019 -0.002 -0.028 0.022 0.004 0.023 -0.004 -0.035 0.024
INMETRO -0.044 0.027 -0.043 -0.077 -0.008 -0.004 0.027 -0.006 -0.038 0.023 0.050 0.030 0.042 0.003 0.080
LACOMET -0.285 0.070 -0.283 -0.353 -0.213 -0.219 0.070 -0.222 -0.291 -0.152 -0.253 0.073 -0.261 -0.334 -0.188
NRC
CENAMEP 0.060 0.037 0.061 0.023 0.100 0.065 0.037 0.063 0.025 0.100 0.064 0.041 0.056 0.014 0.098
BSJ -0.275 0.076 -0.273 -0.348 -0.198 -0.320 0.076 -0.323 -0.397 -0.248 -0.086 0.074 -0.094 -0.171 -0.017

Final report - Hydrometers Comparison
between SIM Laboratories SIM.M.D-K4
CENAM – 2009/06/26 21/51
Table 12. Degree of equivalence between results reported by participant laboratories and proposed RV for the hydrometer with range 800 kg/m3 to 810 kg/m3 .
801 805 809
Ddi-RV(mean) Ddi-RV(median) Ddi-RV(mean) Ddi-RV(median) Ddi-RV(mean) Ddi-RV(median)
diff U, (k=2) diff x1
(2.5%) x2
(97.5%) diff U, (k=2) diff x1
(2.5%) x2
(97.5%) diff U, (k=2) diff x1
(2.5%) x2
(97.5%)
CENAM -0.025 0.037 -0.019 -0.061 0.014 -0.026 0.038 -0.013 -0.057 0.026 -0.030 0.034 -0.018 -0.057 0.015
IBMETRO 0.956 0.085 0.962 0.878 1.046 0.975 0.085 0.988 0.904 1.073 0.958 0.083 0.970 0.888 1.053
SIC -0.027 0.059 -0.021 -0.081 0.031 -0.017 0.059 -0.004 -0.081 0.031 -0.003 0.057 0.009 -0.045 0.066
LATU -0.025 0.038 -0.019 -0.063 0.015 -0.028 0.039 -0.015 -0.059 0.025 -0.025 0.035 -0.013 -0.053 0.022
INEN 0.056 0.057 0.062 0.003 0.123 -0.025 0.057 -0.012 -0.071 0.044 -0.032 0.055 -0.020 -0.076 0.031
INDECOPI 0.056 0.067 0.062 -0.002 0.132 0.035 0.068 0.048 -0.015 0.119 0.038 0.066 0.050 -0.010 0.118
CESMEC 0.016 0.035 0.022 -0.011 0.063 0.055 0.036 0.068 0.025 0.112 0.048 0.031 0.060 0.021 0.099
INTI 0.036 0.069 0.042 -0.020 0.113 -0.025 0.070 -0.012 -0.081 0.056 -0.032 0.067 -0.020 -0.087 0.043
NIST -0.001 0.021 0.005 -0.021 0.034 -0.011 0.022 0.003 -0.028 0.034 -0.006 0.023 0.007 -0.021 0.038
INMETRO -0.143 0.038 -0.137 -0.177 -0.098 -0.153 0.037 -0.139 -0.180 -0.099 -0.107 0.037 -0.094 -0.134 -0.055
LACOMET -0.105 0.070 -0.100 -0.169 -0.030 -0.152 0.070 -0.138 -0.209 -0.068 -1.250 0.070 -1.237 -1.307 -1.167
NRC -0.074 0.110 -0.068 -0.177 0.030 -0.030 0.110 -0.017 -0.124 0.088 0.036 0.110 0.049 -0.054 0.157
CENAMEP 0.044 0.040 0.050 0.009 0.091 0.031 0.034 0.045 0.003 0.087 0.019 0.035 0.032 -0.004 0.073
BSJ -0.151 0.120 -0.145 -0.263 -0.027 -0.017 0.118 -0.004 -0.118 0.110 -0.097 0.118 -0.085 -0.202 0.025

Final report - Hydrometers Comparison
between SIM Laboratories SIM.M.D-K4
CENAM – 2009/06/26 22/51
Table 13. Degree of equivalence between results reported by participant laboratories and proposed RV for the hydrometer with range 990 kg/m3 to 1000 kg/m3 .
991 995 999
Ddi-RV(mean) Ddi-RV(median) Ddi-RV(mean) Ddi-RV(median) Ddi-RV(mean) Ddi-RV(median)
diff U, (k=2) diff x1
(2.5%) x2
(97.5%) diff U, (k=2) diff x1
(2.5%) x2
(97.5%) diff U, (k=2) diff x1
(2.5%) x2
(97.5%)
CENAM 0.014 0.034 0.044 0.000 0.096 0.027 0.037 0.047 0.001 0.099 0.016 0.035 0.049 0.003 0.099
IBMETRO -0.244 0.056 -0.213 -0.275 -0.151 -0.260 0.058 -0.240 -0.302 -0.177 -0.276 0.057 -0.242 -0.303 -0.181
SIC 0.002 0.064 0.033 -0.021 0.103 -0.027 0.066 -0.008 -0.074 0.054 -0.029 0.065 0.005 -0.056 0.069
LATU -0.019 0.031 0.012 -0.024 0.056 -0.007 0.036 0.012 -0.027 0.060 -0.014 0.034 0.020 -0.017 0.067
INEN -0.148 0.058 -0.117 -0.180 -0.053 -0.050 0.054 -0.031 -0.093 0.019 -0.042 0.052 -0.008 -0.064 0.042
INDECOPI 0.062 0.076 0.093 0.011 0.177 0.050 0.078 0.069 -0.005 0.153 0.008 0.077 0.042 -0.025 0.123
CESMEC 0.102 0.045 0.133 0.081 0.186 0.100 0.048 0.119 0.067 0.173 0.088 0.046 0.122 0.070 0.173
INTI -0.083 0.067 -0.052 -0.127 0.007 -0.075 0.069 -0.055 -0.131 0.009 -0.105 0.073 -0.072 -0.147 -0.002
NIST 0.015 0.030 0.046 0.002 0.096 0.023 0.032 0.043 0.000 0.091 0.022 0.031 0.056 0.010 0.103
INMETRO -0.184 0.046 -0.153 -0.206 -0.099 -0.205 0.048 -0.185 -0.238 -0.132 -0.074 0.047 -0.040 -0.092 0.003
LACOMET -0.095 0.082 -0.064 -0.148 0.004 -0.050 0.078 -0.030 -0.111 0.039 -0.156 0.082 -0.122 -0.206 -0.038
NRC -0.041 0.123 -0.010 -0.121 0.099 -0.008 0.123 0.011 -0.103 0.129 -0.057 0.123 -0.024 -0.142 0.089
CENAMEP 0.067 0.041 0.098 0.049 0.148 0.084 0.043 0.104 0.056 0.153 0.060 0.041 0.094 0.047 0.141
BSJ -0.126 0.091 -0.096 -0.189 -0.008 -0.282 0.092 -0.263 -0.356 -0.169 -0.173 0.091 -0.140 -0.233 -0.047

Final report - Hydrometers Comparison
between SIM Laboratories SIM.M.D-K4
CENAM – 2009/06/26 23/51
Table 14. Degree of equivalence between results reported by participant laboratories and proposed RV for the hydrometer with range 1290 kg/m3 to 1300 kg/m3 .
1291 1295 1299
Ddi-RV(mean) Ddi-RV(median) Ddi-RV(mean) Ddi-RV(median) Ddi-RV(mean) Ddi-RV(median)
diff U, (k=2) diff x1
(2.5%) x2
(97.5%) diff U, (k=2) diff x1
(2.5%) x2
(97.5%) diff U, (k=2) diff x1
(2.5%) x2
(97.5%)
CENAM 0.036 0.055 0.048 -0.005 0.113 0.016 0.050 0.043 -0.005 0.106 0.023 0.049 0.036 -0.010 0.093
IBMETRO
SIC 0.027 0.083 0.039 -0.038 0.126 0.042 0.082 0.069 -0.005 0.157 0.034 0.081 0.047 -0.028 0.131
LATU -0.006 0.044 0.006 -0.043 0.059 -0.004 0.042 0.023 -0.021 0.079 0.004 0.040 0.017 -0.025 0.066
INEN -0.079 0.057 -0.067 -0.132 0.000 -0.121 0.061 -0.094 -0.160 -0.027 -0.006 0.059 0.007 -0.048 0.064
INDECOPI -0.009 0.092 0.003 -0.086 0.094 -0.011 0.091 0.016 -0.070 0.106 0.014 0.090 0.027 -0.057 0.118
CESMEC 0.001 0.044 0.013 -0.034 0.068 -0.031 0.042 -0.004 -0.056 0.044 -0.036 0.040 -0.023 -0.072 0.017
INTI 0.006 0.082 0.018 -0.060 0.101 -0.037 0.081 -0.010 -0.091 0.068 -0.021 0.080 -0.008 -0.088 0.069
NIST 0.017 0.049 0.029 -0.020 0.088 0.013 0.040 0.040 -0.001 0.096 0.024 0.040 0.036 -0.003 0.087
INMETRO -0.227 0.067 -0.215 -0.285 -0.144 -0.105 0.061 -0.078 -0.144 -0.011 -0.099 0.060 -0.087 -0.149 -0.024
LACOMET -0.216 0.078 -0.204 -0.284 -0.124 -0.221 0.072 -0.194 -0.270 -0.117 -0.200 0.071 -0.187 -0.260 -0.114
NRC -0.047 0.154 -0.035 -0.185 0.110 -0.061 0.151 -0.033 -0.181 0.108 -0.073 0.151 -0.060 -0.209 0.082
CENAMEP 0.026 0.043 0.038 -0.006 0.094 0.023 0.033 0.050 0.000 0.101 0.007 0.032 0.019 -0.016 0.065
BSJ -0.107 0.132 -0.095 -0.229 0.028 -0.127 0.129 -0.100 -0.232 0.018 -0.127 0.129 -0.114 -0.244 0.006
Final report - Hydrometers Comparison
between SIM Laboratories SIM.M.D-K4
CENAM – 2009/06/26 24/51
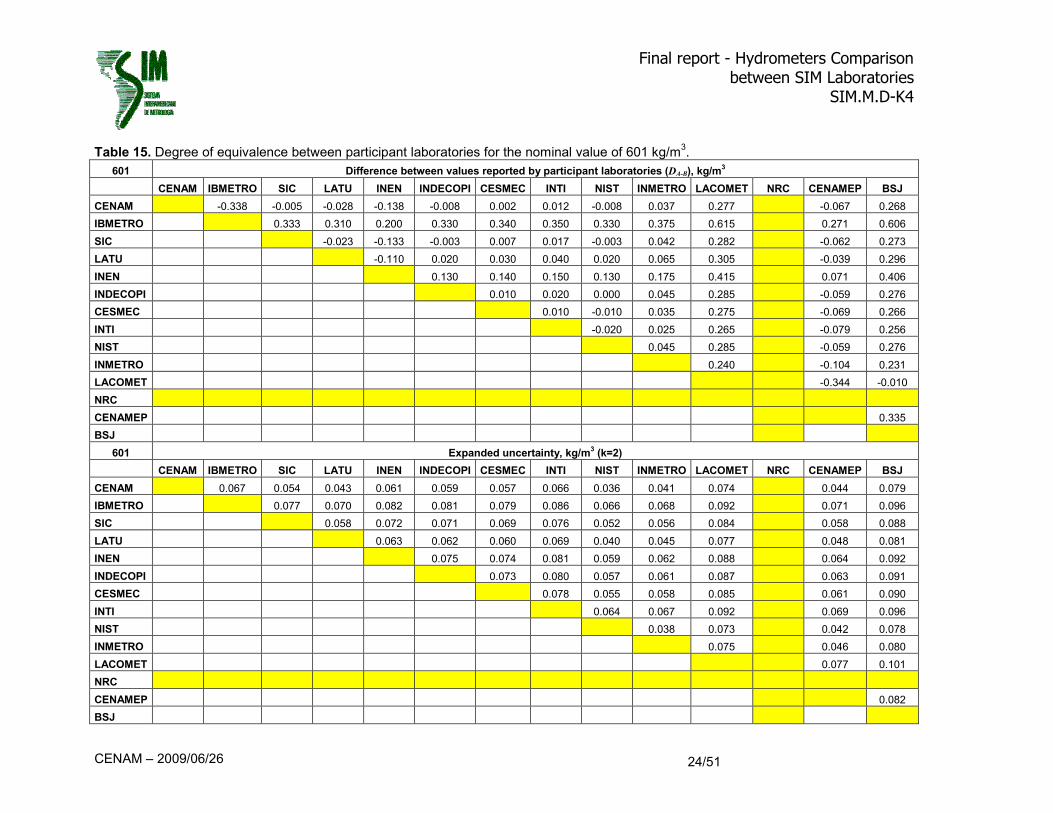
Table 15. Degree of equivalence between participant laboratories for the nominal value of 601 kg/m3.
601 Difference between values reported by participant laboratories (DA-B), kg/m3
CENAM IBMETRO SIC LATU INEN INDECOPI CESMEC INTI NIST INMETRO LACOMET NRC CENAMEP BSJ
CENAM -0.338 -0.005 -0.028 -0.138 -0.008 0.002 0.012 -0.008 0.037 0.277 -0.067 0.268
IBMETRO 0.333 0.310 0.200 0.330 0.340 0.350 0.330 0.375 0.615 0.271 0.606
SIC -0.023 -0.133 -0.003 0.007 0.017 -0.003 0.042 0.282 -0.062 0.273
LATU -0.110 0.020 0.030 0.040 0.020 0.065 0.305 -0.039 0.296
INEN 0.130 0.140 0.150 0.130 0.175 0.415 0.071 0.406
INDECOPI 0.010 0.020 0.000 0.045 0.285 -0.059 0.276
CESMEC 0.010 -0.010 0.035 0.275 -0.069 0.266
INTI -0.020 0.025 0.265 -0.079 0.256
NIST 0.045 0.285 -0.059 0.276
INMETRO 0.240 -0.104 0.231
LACOMET -0.344 -0.010
NRC
CENAMEP 0.335
BSJ
601 Expanded uncertainty, kg/m3 (k=2)
CENAM IBMETRO SIC LATU INEN INDECOPI CESMEC INTI NIST INMETRO LACOMET NRC CENAMEP BSJ
CENAM 0.067 0.054 0.043 0.061 0.059 0.057 0.066 0.036 0.041 0.074 0.044 0.079
IBMETRO 0.077 0.070 0.082 0.081 0.079 0.086 0.066 0.068 0.092 0.071 0.096
SIC 0.058 0.072 0.071 0.069 0.076 0.052 0.056 0.084 0.058 0.088
LATU 0.063 0.062 0.060 0.069 0.040 0.045 0.077 0.048 0.081
INEN 0.075 0.074 0.081 0.059 0.062 0.088 0.064 0.092
INDECOPI 0.073 0.080 0.057 0.061 0.087 0.063 0.091
CESMEC 0.078 0.055 0.058 0.085 0.061 0.090
INTI 0.064 0.067 0.092 0.069 0.096
NIST 0.038 0.073 0.042 0.078
INMETRO 0.075 0.046 0.080
LACOMET 0.077 0.101
NRC
CENAMEP 0.082
BSJ

Final report - Hydrometers Comparison
between SIM Laboratories SIM.M.D-K4
CENAM – 2009/06/26 25/51
Table 16. Degree of equivalence between participant laboratories for the nominal value of 605 kg/m3.
605 Difference between values reported by participant laboratories (DA-B), kg/m3
CENAM IBMETRO SIC LATU INEN INDECOPI CESMEC INTI NIST INMETRO LACOMET NRC CENAMEP BSJ
CENAM -0.356 -0.016 -0.011 -0.216 -0.016 0.004 0.024 -0.003 0.001 0.216 -0.068 0.317
IBMETRO 0.340 0.345 0.140 0.340 0.360 0.380 0.352 0.356 0.571 0.287 0.672
SIC 0.005 -0.200 0.000 0.020 0.040 0.012 0.016 0.231 -0.053 0.332
LATU -0.205 -0.005 0.015 0.035 0.007 0.011 0.226 -0.058 0.327
INEN 0.200 0.220 0.240 0.212 0.216 0.431 0.147 0.532
INDECOPI 0.020 0.040 0.012 0.016 0.231 -0.053 0.332
CESMEC 0.020 -0.008 -0.004 0.211 -0.073 0.312
INTI -0.028 -0.024 0.191 -0.093 0.292
NIST 0.004 0.219 -0.065 0.320
INMETRO 0.215 -0.069 0.316
LACOMET -0.284 0.101
NRC
CENAMEP 0.385
BSJ
605 Expanded uncertainty, kg/m3 (k=2)
CENAM IBMETRO SIC LATU INEN INDECOPI CESMEC INTI NIST INMETRO LACOMET NRC CENAMEP BSJ
CENAM 0.067 0.055 0.043 0.061 0.059 0.057 0.066 0.036 0.041 0.074 0.044 0.079
IBMETRO 0.078 0.070 0.082 0.081 0.079 0.086 0.066 0.069 0.093 0.071 0.097
SIC 0.058 0.072 0.071 0.069 0.076 0.053 0.056 0.084 0.059 0.088
LATU 0.064 0.062 0.060 0.069 0.040 0.045 0.077 0.048 0.081
INEN 0.076 0.074 0.081 0.059 0.062 0.088 0.064 0.092
INDECOPI 0.073 0.080 0.057 0.061 0.087 0.063 0.091
CESMEC 0.078 0.055 0.059 0.085 0.061 0.090
INTI 0.064 0.067 0.092 0.069 0.096
NIST 0.038 0.073 0.042 0.078
INMETRO 0.075 0.046 0.080
LACOMET 0.077 0.102
NRC
CENAMEP 0.082
BSJ

Final report - Hydrometers Comparison
between SIM Laboratories SIM.M.D-K4
CENAM – 2009/06/26 26/51
Table 17. Degree of equivalence between participant laboratories for the nominal value of 609 kg/m3.
609 Difference between values reported by participant laboratories (DA-B), kg/m3
CENAM IBMETRO SIC LATU INEN INDECOPI CESMEC INTI NIST INMETRO LACOMET NRC CENAMEP BSJ
CENAM -0.408 -0.046 -0.011 -0.218 -0.008 0.002 0.032 -0.012 -0.058 0.245 -0.072 0.078
IBMETRO 0.362 0.397 0.190 0.400 0.410 0.440 0.396 0.350 0.653 0.336 0.486
SIC 0.035 -0.172 0.038 0.048 0.078 0.034 -0.012 0.291 -0.026 0.124
LATU -0.207 0.003 0.013 0.043 -0.001 -0.047 0.256 -0.061 0.089
INEN 0.210 0.220 0.250 0.206 0.160 0.463 0.146 0.296
INDECOPI 0.010 0.040 -0.004 -0.050 0.253 -0.064 0.086
CESMEC 0.030 -0.014 -0.060 0.243 -0.074 0.076
INTI -0.044 -0.090 0.213 -0.104 0.046
NIST -0.046 0.257 -0.060 0.090
INMETRO 0.303 -0.014 0.136
LACOMET -0.317 -0.167
NRC
CENAMEP 0.150
BSJ
609 Expanded uncertainty, kg/m3 (k=2)
CENAM IBMETRO SIC LATU INEN INDECOPI CESMEC INTI NIST INMETRO LACOMET NRC CENAMEP BSJ
CENAM 0.070 0.058 0.048 0.064 0.063 0.061 0.069 0.041 0.046 0.078 0.049 0.082
IBMETRO 0.080 0.073 0.084 0.083 0.082 0.088 0.069 0.071 0.095 0.073 0.099
SIC 0.061 0.074 0.073 0.072 0.079 0.056 0.059 0.087 0.062 0.090
LATU 0.066 0.065 0.063 0.071 0.045 0.049 0.080 0.052 0.084
INEN 0.078 0.077 0.083 0.062 0.065 0.091 0.067 0.094
INDECOPI 0.075 0.082 0.061 0.064 0.090 0.066 0.093
CESMEC 0.081 0.059 0.062 0.088 0.064 0.092
INTI 0.067 0.070 0.094 0.072 0.098
NIST 0.043 0.076 0.046 0.080
INMETRO 0.079 0.050 0.083
LACOMET 0.081 0.104
NRC
CENAMEP 0.084
BSJ

Final report - Hydrometers Comparison
between SIM Laboratories SIM.M.D-K4
CENAM – 2009/06/26 27/51
Table 18. Degree of equivalence between participant laboratories for the nominal value of 801 kg/m3.
801 Difference between values reported by participant laboratories (DA-B), kg/m3
CENAM IBMETRO SIC LATU INEN INDECOPI CESMEC INTI NIST INMETRO LACOMET NRC CENAMEP BSJ
CENAM -0.981 0.002 0.000 -0.081 -0.081 -0.041 -0.061 -0.024 0.118 0.081 0.049 -0.069 0.126
IBMETRO 0.983 0.981 0.900 0.900 0.940 0.920 0.957 1.099 1.061 1.030 0.912 1.107
SIC -0.002 -0.083 -0.083 -0.043 -0.063 -0.026 0.116 0.078 0.047 -0.071 0.124
LATU -0.081 -0.081 -0.041 -0.061 -0.024 0.118 0.080 0.049 -0.069 0.126
INEN 0.000 0.040 0.020 0.057 0.199 0.161 0.130 0.012 0.207
INDECOPI 0.040 0.020 0.057 0.199 0.161 0.130 0.012 0.207
CESMEC -0.020 0.017 0.159 0.121 0.090 -0.028 0.167
INTI 0.037 0.179 0.141 0.110 -0.008 0.187
NIST 0.142 0.104 0.073 -0.045 0.150
INMETRO -0.038 -0.069 -0.187 0.008
LACOMET -0.031 -0.149 0.046
NRC -0.118 0.077
CENAMEP 0.195
BSJ
801 Expanded uncertainty, kg/m3 (k=2)
CENAM IBMETRO SIC LATU INEN INDECOPI CESMEC INTI NIST INMETRO LACOMET NRC CENAMEP BSJ
CENAM 0.091 0.071 0.056 0.070 0.079 0.054 0.080 0.047 0.052 0.078 0.117 0.054 0.125
IBMETRO 0.102 0.092 0.101 0.108 0.091 0.109 0.087 0.090 0.107 0.138 0.091 0.145
SIC 0.072 0.084 0.091 0.071 0.093 0.065 0.069 0.091 0.126 0.071 0.133
LATU 0.071 0.080 0.055 0.081 0.048 0.053 0.079 0.118 0.055 0.126
INEN 0.090 0.070 0.091 0.064 0.068 0.090 0.125 0.069 0.132
INDECOPI 0.078 0.098 0.073 0.077 0.097 0.130 0.078 0.137
CESMEC 0.080 0.045 0.051 0.078 0.117 0.052 0.125
INTI 0.075 0.078 0.098 0.131 0.080 0.138
NIST 0.043 0.073 0.114 0.045 0.122
INMETRO 0.076 0.116 0.050 0.124
LACOMET 0.130 0.078 0.137
NRC 0.117 0.162
CENAMEP 0.125
BSJ

Final report - Hydrometers Comparison
between SIM Laboratories SIM.M.D-K4
CENAM – 2009/06/26 28/51
Table 19. Degree of equivalence between participant laboratories for the nominal value of 805 kg/m3.
805 Difference between values reported by participant laboratories (DA-B), kg/m3
CENAM IBMETRO SIC LATU INEN INDECOPI CESMEC INTI NIST INMETRO LACOMET NRC CENAMEP BSJ
CENAM -1.001 -0.009 0.002 -0.001 -0.061 -0.081 -0.001 -0.015 0.127 0.125 0.004 -0.057 -0.009
IBMETRO 0.992 1.003 1.000 0.940 0.920 1.000 0.986 1.128 1.127 1.005 0.944 0.993
SIC 0.011 0.008 -0.052 -0.072 0.008 -0.006 0.136 0.135 0.013 -0.048 0.001
LATU -0.003 -0.063 -0.083 -0.003 -0.017 0.125 0.124 0.002 -0.059 -0.010
INEN -0.060 -0.080 0.000 -0.014 0.128 0.127 0.005 -0.056 -0.007
INDECOPI -0.020 0.060 0.046 0.188 0.187 0.065 0.004 0.053
CESMEC 0.080 0.066 0.208 0.207 0.085 0.024 0.073
INTI -0.014 0.128 0.127 0.005 -0.056 -0.007
NIST 0.142 0.141 0.019 -0.042 0.007
INMETRO -0.001 -0.123 -0.184 -0.135
LACOMET -0.122 -0.183 -0.134
NRC -0.061 -0.013
CENAMEP 0.049
BSJ
805 Expanded uncertainty, kg/m3 (k=2)
CENAM IBMETRO SIC LATU INEN INDECOPI CESMEC INTI NIST INMETRO LACOMET NRC CENAMEP BSJ
CENAM 0.092 0.072 0.057 0.070 0.079 0.054 0.081 0.047 0.052 0.079 0.117 0.054 0.125
IBMETRO 0.103 0.092 0.102 0.108 0.091 0.109 0.087 0.090 0.107 0.138 0.091 0.145
SIC 0.073 0.084 0.092 0.071 0.093 0.066 0.069 0.091 0.126 0.071 0.133
LATU 0.071 0.080 0.055 0.082 0.048 0.053 0.079 0.118 0.055 0.126
INEN 0.090 0.070 0.092 0.064 0.068 0.090 0.125 0.069 0.132
INDECOPI 0.078 0.099 0.074 0.077 0.097 0.130 0.078 0.137
CESMEC 0.080 0.046 0.051 0.078 0.117 0.053 0.125
INTI 0.075 0.079 0.098 0.131 0.080 0.138
NIST 0.043 0.073 0.114 0.045 0.122
INMETRO 0.076 0.116 0.050 0.124
LACOMET 0.130 0.077 0.137
NRC 0.117 0.162
CENAMEP 0.124
BSJ
Final report - Hydrometers Comparison
between SIM Laboratories SIM.M.D-K4
CENAM – 2009/06/26 29/51
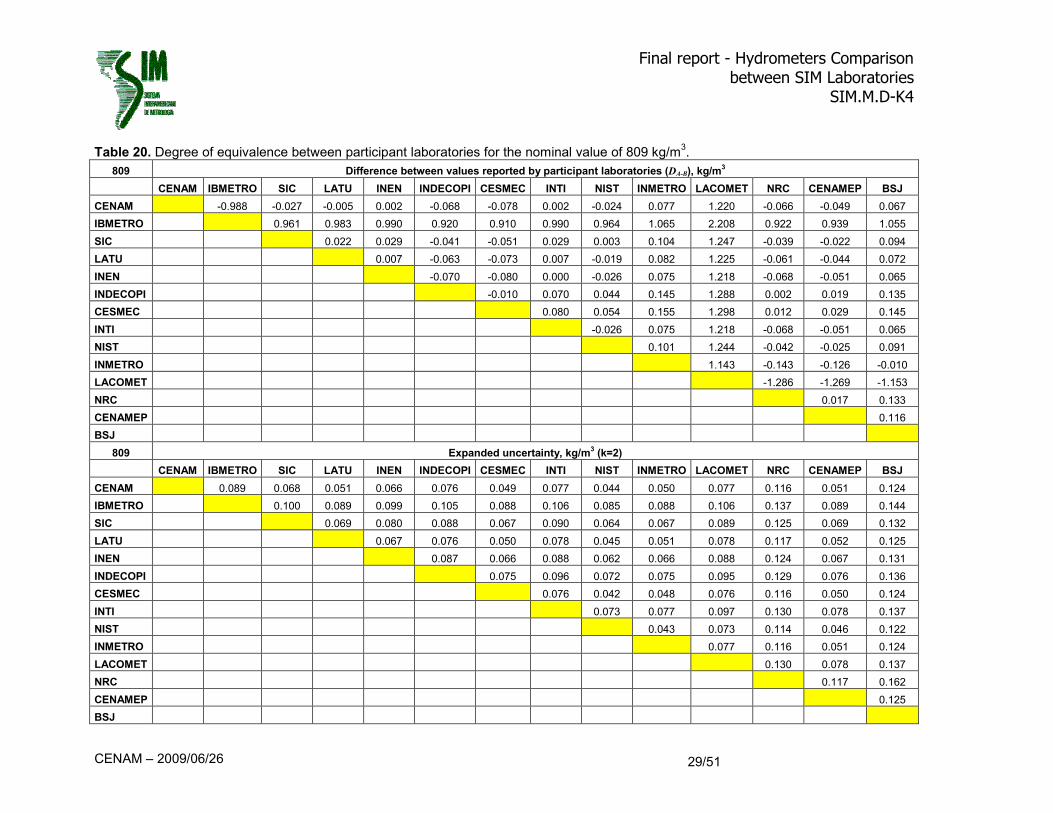
Table 20. Degree of equivalence between participant laboratories for the nominal value of 809 kg/m3.
809 Difference between values reported by participant laboratories (DA-B), kg/m3
CENAM IBMETRO SIC LATU INEN INDECOPI CESMEC INTI NIST INMETRO LACOMET NRC CENAMEP BSJ
CENAM -0.988 -0.027 -0.005 0.002 -0.068 -0.078 0.002 -0.024 0.077 1.220 -0.066 -0.049 0.067
IBMETRO 0.961 0.983 0.990 0.920 0.910 0.990 0.964 1.065 2.208 0.922 0.939 1.055
SIC 0.022 0.029 -0.041 -0.051 0.029 0.003 0.104 1.247 -0.039 -0.022 0.094
LATU 0.007 -0.063 -0.073 0.007 -0.019 0.082 1.225 -0.061 -0.044 0.072
INEN -0.070 -0.080 0.000 -0.026 0.075 1.218 -0.068 -0.051 0.065
INDECOPI -0.010 0.070 0.044 0.145 1.288 0.002 0.019 0.135
CESMEC 0.080 0.054 0.155 1.298 0.012 0.029 0.145
INTI -0.026 0.075 1.218 -0.068 -0.051 0.065
NIST 0.101 1.244 -0.042 -0.025 0.091
INMETRO 1.143 -0.143 -0.126 -0.010
LACOMET -1.286 -1.269 -1.153
NRC 0.017 0.133
CENAMEP 0.116
BSJ
809 Expanded uncertainty, kg/m3 (k=2)
CENAM IBMETRO SIC LATU INEN INDECOPI CESMEC INTI NIST INMETRO LACOMET NRC CENAMEP BSJ
CENAM 0.089 0.068 0.051 0.066 0.076 0.049 0.077 0.044 0.050 0.077 0.116 0.051 0.124
IBMETRO 0.100 0.089 0.099 0.105 0.088 0.106 0.085 0.088 0.106 0.137 0.089 0.144
SIC 0.069 0.080 0.088 0.067 0.090 0.064 0.067 0.089 0.125 0.069 0.132
LATU 0.067 0.076 0.050 0.078 0.045 0.051 0.078 0.117 0.052 0.125
INEN 0.087 0.066 0.088 0.062 0.066 0.088 0.124 0.067 0.131
INDECOPI 0.075 0.096 0.072 0.075 0.095 0.129 0.076 0.136
CESMEC 0.076 0.042 0.048 0.076 0.116 0.050 0.124
INTI 0.073 0.077 0.097 0.130 0.078 0.137
NIST 0.043 0.073 0.114 0.046 0.122
INMETRO 0.077 0.116 0.051 0.124
LACOMET 0.130 0.078 0.137
NRC 0.117 0.162
CENAMEP 0.125
BSJ

Final report - Hydrometers Comparison
between SIM Laboratories SIM.M.D-K4
CENAM – 2009/06/26 30/51
Table 21. Degree of equivalence between participant laboratories for the nominal value of 991 kg/m3.
991 Difference between values reported by participant laboratories (DA-B), kg/m3
CENAM IBMETRO SIC LATU INEN INDECOPI CESMEC INTI NIST INMETRO LACOMET NRC CENAMEP BSJ
CENAM 0.258 0.012 0.033 0.162 -0.048 -0.088 0.096 -0.001 0.198 0.109 0.054 -0.053 0.140
IBMETRO -0.246 -0.225 -0.096 -0.306 -0.346 -0.162 -0.259 -0.060 -0.149 -0.203 -0.311 -0.118
SIC 0.021 0.150 -0.060 -0.100 0.084 -0.013 0.186 0.097 0.043 -0.065 0.128
LATU 0.129 -0.081 -0.121 0.063 -0.034 0.165 0.076 0.022 -0.086 0.107
INEN -0.210 -0.250 -0.066 -0.163 0.036 -0.053 -0.107 -0.215 -0.022
INDECOPI -0.040 0.144 0.047 0.246 0.157 0.103 -0.005 0.188
CESMEC 0.184 0.087 0.286 0.197 0.143 0.035 0.228
INTI -0.098 0.101 0.013 -0.042 -0.150 0.044
NIST 0.199 0.110 0.056 -0.052 0.142
INMETRO -0.089 -0.143 -0.251 -0.057
LACOMET -0.054 -0.162 0.031
NRC -0.108 0.086
CENAMEP 0.194
BSJ
991 Expanded uncertainty, kg/m3 (k=2)
CENAM IBMETRO SIC LATU INEN INDECOPI CESMEC INTI NIST INMETRO LACOMET NRC CENAMEP BSJ
CENAM 0.065 0.077 0.053 0.067 0.087 0.056 0.080 0.053 0.057 0.088 0.130 0.053 0.097
IBMETRO 0.085 0.064 0.076 0.094 0.066 0.087 0.063 0.067 0.095 0.135 0.064 0.103
SIC 0.076 0.086 0.102 0.078 0.096 0.075 0.078 0.103 0.141 0.076 0.111
LATU 0.066 0.086 0.055 0.078 0.051 0.056 0.087 0.129 0.052 0.096
INEN 0.095 0.068 0.088 0.065 0.069 0.096 0.135 0.065 0.104
INDECOPI 0.088 0.104 0.086 0.089 0.111 0.146 0.086 0.118
CESMEC 0.080 0.054 0.058 0.089 0.130 0.054 0.098
INTI 0.078 0.081 0.105 0.142 0.078 0.113
NIST 0.055 0.087 0.129 0.051 0.096
INMETRO 0.090 0.131 0.055 0.099
LACOMET 0.147 0.087 0.119
NRC 0.129 0.153
CENAMEP 0.096
BSJ

Final report - Hydrometers Comparison
between SIM Laboratories SIM.M.D-K4
CENAM – 2009/06/26 31/51
Table 22. Degree of equivalence between participant laboratories for the nominal value of 995 kg/m3.
995 Difference between values reported by participant laboratories (DA-B), kg/m3
CENAM IBMETRO SIC LATU INEN INDECOPI CESMEC INTI NIST INMETRO LACOMET NRC CENAMEP BSJ
CENAM 0.287 0.054 0.034 0.077 -0.023 -0.073 0.102 0.004 0.232 0.077 0.035 -0.057 0.309
IBMETRO -0.232 -0.252 -0.209 -0.309 -0.359 -0.185 -0.283 -0.055 -0.210 -0.252 -0.344 0.022
SIC -0.020 0.023 -0.077 -0.127 0.048 -0.051 0.177 0.023 -0.019 -0.112 0.255
LATU 0.043 -0.057 -0.107 0.068 -0.031 0.197 0.043 0.001 -0.092 0.275
INEN -0.100 -0.150 0.025 -0.074 0.154 0.000 -0.042 -0.135 0.232
INDECOPI -0.050 0.125 0.026 0.254 0.100 0.058 -0.035 0.332
CESMEC 0.175 0.076 0.304 0.150 0.108 0.015 0.382
INTI -0.098 0.130 -0.025 -0.067 -0.159 0.207
NIST 0.228 0.073 0.031 -0.061 0.305
INMETRO -0.155 -0.197 -0.289 0.077
LACOMET -0.042 -0.134 0.232
NRC -0.092 0.274
CENAMEP 0.366
BSJ
995 Expanded uncertainty, kg/m3 (k=2)
CENAM IBMETRO SIC LATU INEN INDECOPI CESMEC INTI NIST INMETRO LACOMET NRC CENAMEP BSJ
CENAM 0.069 0.080 0.057 0.070 0.090 0.060 0.082 0.055 0.060 0.090 0.131 0.056 0.099
IBMETRO 0.087 0.068 0.079 0.097 0.070 0.090 0.066 0.070 0.097 0.136 0.066 0.105
SIC 0.079 0.089 0.105 0.081 0.099 0.077 0.081 0.105 0.142 0.078 0.113
LATU 0.069 0.089 0.059 0.082 0.054 0.059 0.089 0.131 0.055 0.098
INEN 0.098 0.072 0.091 0.068 0.071 0.098 0.137 0.068 0.106
INDECOPI 0.091 0.107 0.088 0.090 0.113 0.148 0.088 0.120
CESMEC 0.083 0.057 0.061 0.091 0.132 0.058 0.100
INTI 0.080 0.083 0.107 0.143 0.080 0.114
NIST 0.057 0.088 0.130 0.053 0.097
INMETRO 0.091 0.132 0.057 0.100
LACOMET 0.148 0.088 0.120
NRC 0.130 0.153
CENAMEP 0.097
BSJ

Final report - Hydrometers Comparison
between SIM Laboratories SIM.M.D-K4
CENAM – 2009/06/26 32/51
Table 23. Degree of equivalence between participant laboratories for the nominal value of 999 kg/m3.
999 Difference between values reported by participant laboratories (DA-B), kg/m3
CENAM IBMETRO SIC LATU INEN INDECOPI CESMEC INTI NIST INMETRO LACOMET NRC CENAMEP BSJ
CENAM 0.292 0.045 0.030 0.058 0.008 -0.072 0.121 -0.006 0.090 0.172 0.073 -0.044 0.190
IBMETRO -0.247 -0.262 -0.234 -0.284 -0.364 -0.170 -0.298 -0.202 -0.120 -0.218 -0.336 -0.102
SIC -0.015 0.013 -0.037 -0.117 0.077 -0.051 0.045 0.127 0.029 -0.089 0.145
LATU 0.028 -0.022 -0.102 0.092 -0.036 0.060 0.142 0.044 -0.074 0.160
INEN -0.050 -0.130 0.064 -0.064 0.032 0.114 0.016 -0.102 0.132
INDECOPI -0.080 0.114 -0.014 0.082 0.164 0.066 -0.052 0.182
CESMEC 0.194 0.066 0.162 0.244 0.146 0.028 0.262
INTI -0.128 -0.032 0.050 -0.048 -0.166 0.068
NIST 0.096 0.178 0.079 -0.038 0.196
INMETRO 0.082 -0.017 -0.134 0.100
LACOMET -0.098 -0.216 0.018
NRC -0.117 0.116
CENAMEP 0.234
BSJ
999 Expanded uncertainty, kg/m3 (k=2)
CENAM IBMETRO SIC LATU INEN INDECOPI CESMEC INTI NIST INMETRO LACOMET NRC CENAMEP BSJ
CENAM 0.067 0.078 0.055 0.068 0.088 0.058 0.081 0.053 0.058 0.089 0.130 0.054 0.098
IBMETRO 0.086 0.066 0.077 0.095 0.068 0.088 0.064 0.068 0.096 0.135 0.065 0.104
SIC 0.077 0.087 0.104 0.079 0.097 0.076 0.079 0.104 0.141 0.077 0.112
LATU 0.067 0.088 0.057 0.080 0.052 0.057 0.088 0.130 0.053 0.097
INEN 0.096 0.070 0.090 0.066 0.070 0.097 0.136 0.066 0.105
INDECOPI 0.089 0.106 0.086 0.089 0.112 0.147 0.087 0.119
CESMEC 0.082 0.055 0.060 0.090 0.131 0.056 0.099
INTI 0.079 0.082 0.106 0.142 0.079 0.114
NIST 0.055 0.087 0.129 0.051 0.096
INMETRO 0.090 0.131 0.056 0.099
LACOMET 0.147 0.087 0.119
NRC 0.129 0.153
CENAMEP 0.096
BSJ
Final report - Hydrometers Comparison
between SIM Laboratories SIM.M.D-K4
CENAM – 2009/06/26 33/51
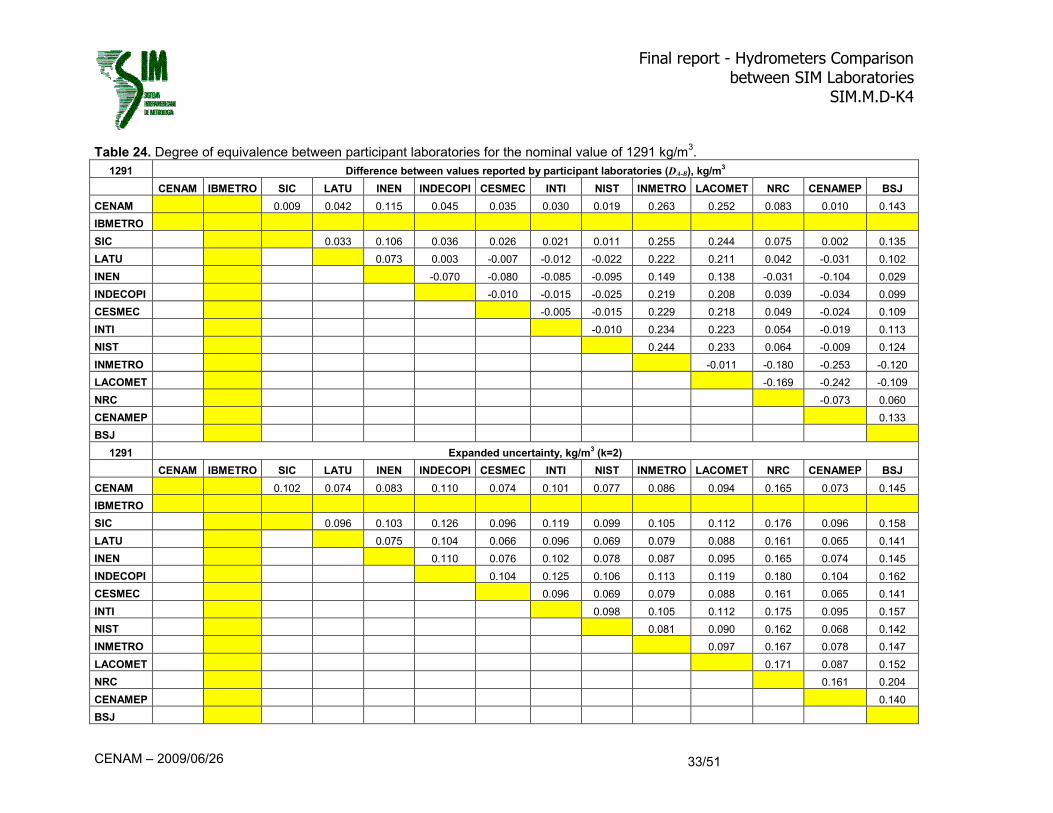
Table 24. Degree of equivalence between participant laboratories for the nominal value of 1291 kg/m3.
1291 Difference between values reported by participant laboratories (DA-B), kg/m3
CENAM IBMETRO SIC LATU INEN INDECOPI CESMEC INTI NIST INMETRO LACOMET NRC CENAMEP BSJ
CENAM 0.009 0.042 0.115 0.045 0.035 0.030 0.019 0.263 0.252 0.083 0.010 0.143
IBMETRO
SIC 0.033 0.106 0.036 0.026 0.021 0.011 0.255 0.244 0.075 0.002 0.135
LATU 0.073 0.003 -0.007 -0.012 -0.022 0.222 0.211 0.042 -0.031 0.102
INEN -0.070 -0.080 -0.085 -0.095 0.149 0.138 -0.031 -0.104 0.029
INDECOPI -0.010 -0.015 -0.025 0.219 0.208 0.039 -0.034 0.099
CESMEC -0.005 -0.015 0.229 0.218 0.049 -0.024 0.109
INTI -0.010 0.234 0.223 0.054 -0.019 0.113
NIST 0.244 0.233 0.064 -0.009 0.124
INMETRO -0.011 -0.180 -0.253 -0.120
LACOMET -0.169 -0.242 -0.109
NRC -0.073 0.060
CENAMEP 0.133
BSJ
1291 Expanded uncertainty, kg/m3 (k=2)
CENAM IBMETRO SIC LATU INEN INDECOPI CESMEC INTI NIST INMETRO LACOMET NRC CENAMEP BSJ
CENAM 0.102 0.074 0.083 0.110 0.074 0.101 0.077 0.086 0.094 0.165 0.073 0.145
IBMETRO
SIC 0.096 0.103 0.126 0.096 0.119 0.099 0.105 0.112 0.176 0.096 0.158
LATU 0.075 0.104 0.066 0.096 0.069 0.079 0.088 0.161 0.065 0.141
INEN 0.110 0.076 0.102 0.078 0.087 0.095 0.165 0.074 0.145
INDECOPI 0.104 0.125 0.106 0.113 0.119 0.180 0.104 0.162
CESMEC 0.096 0.069 0.079 0.088 0.161 0.065 0.141
INTI 0.098 0.105 0.112 0.175 0.095 0.157
NIST 0.081 0.090 0.162 0.068 0.142
INMETRO 0.097 0.167 0.078 0.147
LACOMET 0.171 0.087 0.152
NRC 0.161 0.204
CENAMEP 0.140
BSJ
Final report - Hydrometers Comparison
between SIM Laboratories SIM.M.D-K4
CENAM – 2009/06/26 34/51
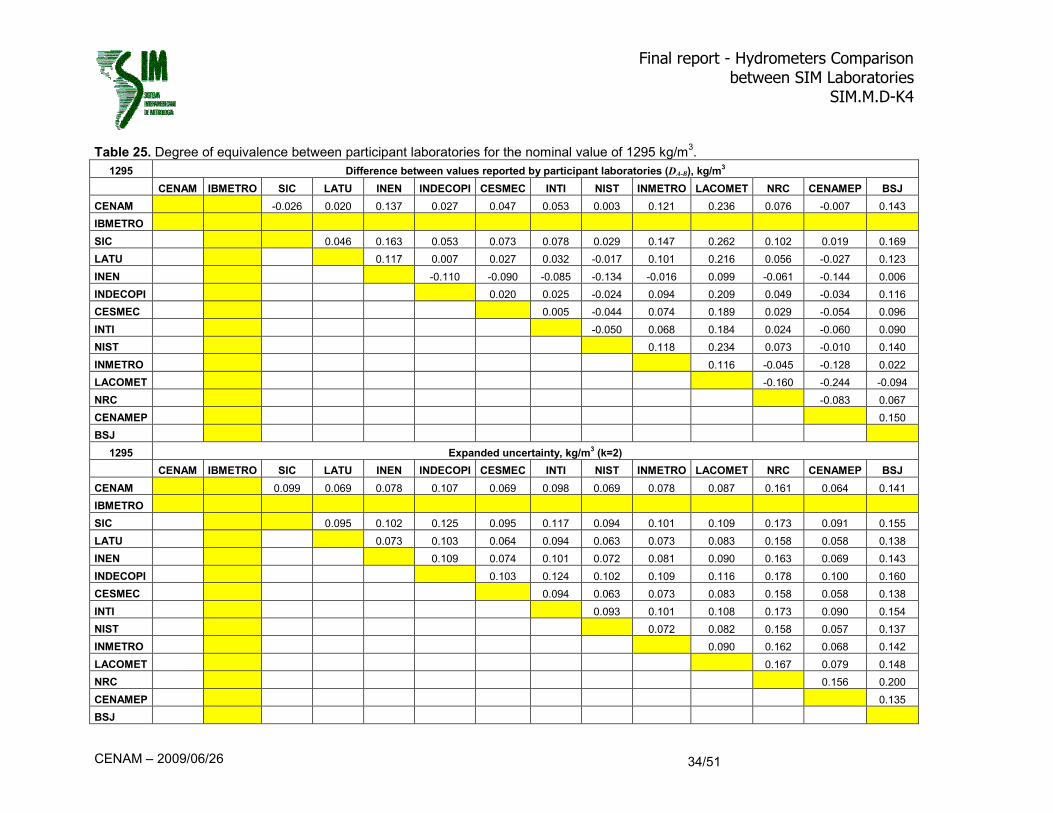
Table 25. Degree of equivalence between participant laboratories for the nominal value of 1295 kg/m3.
1295 Difference between values reported by participant laboratories (DA-B), kg/m3
CENAM IBMETRO SIC LATU INEN INDECOPI CESMEC INTI NIST INMETRO LACOMET NRC CENAMEP BSJ
CENAM -0.026 0.020 0.137 0.027 0.047 0.053 0.003 0.121 0.236 0.076 -0.007 0.143
IBMETRO
SIC 0.046 0.163 0.053 0.073 0.078 0.029 0.147 0.262 0.102 0.019 0.169
LATU 0.117 0.007 0.027 0.032 -0.017 0.101 0.216 0.056 -0.027 0.123
INEN -0.110 -0.090 -0.085 -0.134 -0.016 0.099 -0.061 -0.144 0.006
INDECOPI 0.020 0.025 -0.024 0.094 0.209 0.049 -0.034 0.116
CESMEC 0.005 -0.044 0.074 0.189 0.029 -0.054 0.096
INTI -0.050 0.068 0.184 0.024 -0.060 0.090
NIST 0.118 0.234 0.073 -0.010 0.140
INMETRO 0.116 -0.045 -0.128 0.022
LACOMET -0.160 -0.244 -0.094
NRC -0.083 0.067
CENAMEP 0.150
BSJ
1295 Expanded uncertainty, kg/m3 (k=2)
CENAM IBMETRO SIC LATU INEN INDECOPI CESMEC INTI NIST INMETRO LACOMET NRC CENAMEP BSJ
CENAM 0.099 0.069 0.078 0.107 0.069 0.098 0.069 0.078 0.087 0.161 0.064 0.141
IBMETRO
SIC 0.095 0.102 0.125 0.095 0.117 0.094 0.101 0.109 0.173 0.091 0.155
LATU 0.073 0.103 0.064 0.094 0.063 0.073 0.083 0.158 0.058 0.138
INEN 0.109 0.074 0.101 0.072 0.081 0.090 0.163 0.069 0.143
INDECOPI 0.103 0.124 0.102 0.109 0.116 0.178 0.100 0.160
CESMEC 0.094 0.063 0.073 0.083 0.158 0.058 0.138
INTI 0.093 0.101 0.108 0.173 0.090 0.154
NIST 0.072 0.082 0.158 0.057 0.137
INMETRO 0.090 0.162 0.068 0.142
LACOMET 0.167 0.079 0.148
NRC 0.156 0.200
CENAMEP 0.135
BSJ

Final report - Hydrometers Comparison
between SIM Laboratories SIM.M.D-K4
CENAM – 2009/06/26 35/51
Table 26. Degree of equivalence between participant laboratories for the nominal value of 1299 kg/m3.
1299 Difference between values reported by participant laboratories (DA-B), kg/m3
CENAM IBMETRO SIC LATU INEN INDECOPI CESMEC INTI NIST INMETRO LACOMET NRC CENAMEP BSJ
CENAM -0.011 0.019 0.029 0.009 0.059 0.045 0.000 0.123 0.223 0.096 0.017 0.150
IBMETRO
SIC 0.030 0.040 0.020 0.070 0.055 0.010 0.133 0.234 0.107 0.027 0.161
LATU 0.010 -0.010 0.040 0.025 -0.020 0.103 0.204 0.077 -0.003 0.131
INEN -0.020 0.030 0.015 -0.030 0.093 0.194 0.067 -0.013 0.121
INDECOPI 0.050 0.035 -0.010 0.113 0.214 0.087 0.007 0.141
CESMEC -0.015 -0.060 0.063 0.164 0.037 -0.043 0.091
INTI -0.045 0.078 0.179 0.052 -0.028 0.105
NIST 0.123 0.224 0.097 0.017 0.150
INMETRO 0.101 -0.026 -0.106 0.027
LACOMET -0.127 -0.207 -0.074
NRC -0.080 0.054
CENAMEP 0.133
BSJ
1299 Expanded uncertainty, kg/m3 (k=2)
CENAM IBMETRO SIC LATU INEN INDECOPI CESMEC INTI NIST INMETRO LACOMET NRC CENAMEP BSJ
CENAM 0.097 0.067 0.076 0.105 0.067 0.096 0.067 0.077 0.086 0.160 0.063 0.140
IBMETRO
SIC 0.093 0.100 0.123 0.093 0.116 0.093 0.100 0.107 0.173 0.090 0.154
LATU 0.071 0.101 0.061 0.092 0.061 0.071 0.081 0.158 0.056 0.137
INEN 0.107 0.071 0.099 0.071 0.080 0.089 0.162 0.067 0.142
INDECOPI 0.101 0.122 0.101 0.108 0.114 0.177 0.098 0.159
CESMEC 0.092 0.061 0.071 0.081 0.158 0.056 0.137
INTI 0.092 0.099 0.107 0.172 0.089 0.153
NIST 0.071 0.081 0.158 0.056 0.137
INMETRO 0.089 0.162 0.067 0.142
LACOMET 0.167 0.078 0.147
NRC 0.156 0.200
CENAMEP 0.135
BSJ

Final report - Hydrometers Comparison
between SIM Laboratories SIM.M.D-K4
CENAM – 2009/06/26 36/51
Figure 2. Difference between results reported by participant laboratories and pilot laboratory for the hydrometer with range 600 kg/m3 to
610 kg/m3
600 kg/m3 - 610 kg/m
3
-0.500
-0.400
-0.300
-0.200
-0.100
0.000
0.100
0.200
0.300
0.400
0.500
0.600
CE
NA
M
IBM
ET
RO
SIC
LA
TU
INE
N
IND
EC
OP
I
CE
SM
EC
INT
I
NIS
T
INM
ET
RO
LA
CO
ME
T
NR
C
CE
NA
ME
P
BS
J
W.
mean
media
n
NMIs
NM
I-P
L (
kg/m
3)
601
605609

Final report - Hydrometers Comparison
between SIM Laboratories SIM.M.D-K4
CENAM – 2009/06/26 37/51
Figure 2A. Difference between results reported by participant laboratories and pilot laboratory for the hydrometer with range 600 kg/m3 to
610 kg/m3 (the scale of the graph is limited to ± two times the resolution of the hydrometer).
600 kg/m3 - 610 kg/m
3
-0.200
-0.150
-0.100
-0.050
0.000
0.050
0.100
0.150
0.200
CE
NA
M
IBM
ET
RO
SIC
LA
TU
INE
N
IND
EC
OP
I
CE
SM
EC
INT
I
NIS
T
INM
ET
RO
LA
CO
ME
T
NR
C
CE
NA
ME
P
BS
J
W.
me
an
med
ian
NMIs
NM
I-P
L (
kg/m
3)
601
605609
Final report - Hydrometers Comparison
between SIM Laboratories SIM.M.D-K4
CENAM – 2009/06/26 38/51
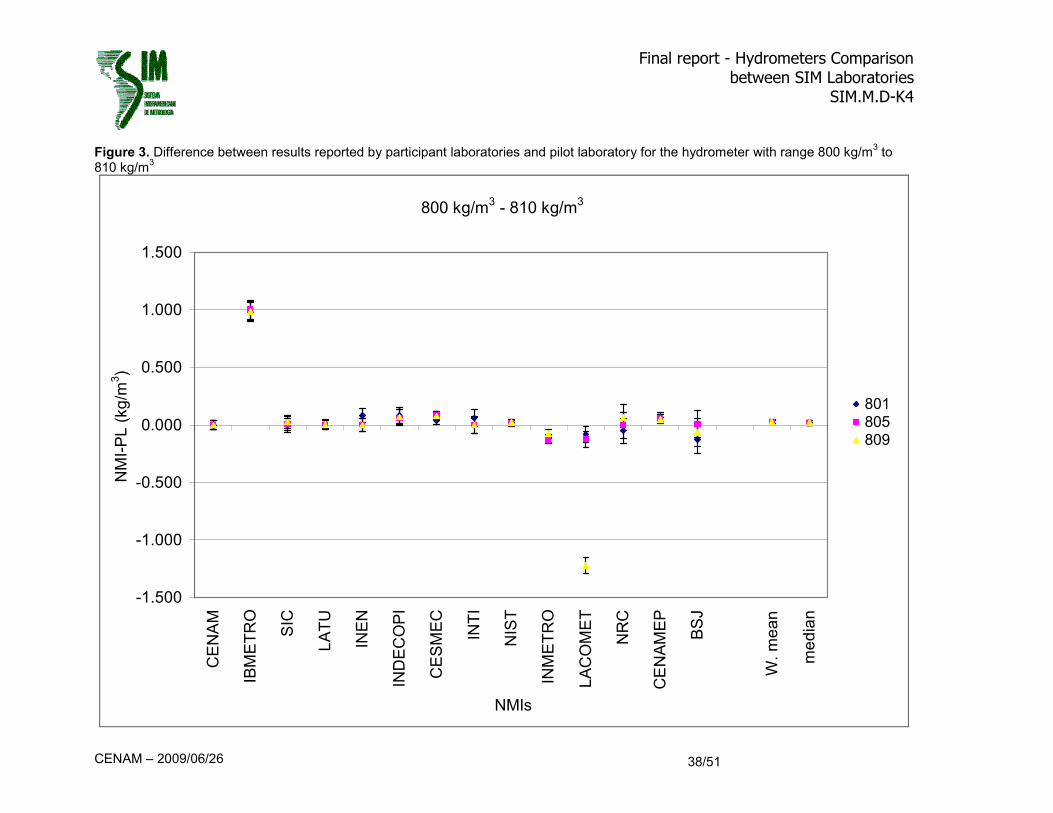
Figure 3. Difference between results reported by participant laboratories and pilot laboratory for the hydrometer with range 800 kg/m3 to
810 kg/m3
800 kg/m3 - 810 kg/m
3
-1.500
-1.000
-0.500
0.000
0.500
1.000
1.500
CE
NA
M
IBM
ET
RO
SIC
LA
TU
INE
N
IND
EC
OP
I
CE
SM
EC
INT
I
NIS
T
INM
ET
RO
LA
CO
ME
T
NR
C
CE
NA
ME
P
BS
J
W. m
ea
n
me
dia
n
NMIs
NM
I-P
L (
kg
/m3)
801
805809
Final report - Hydrometers Comparison
between SIM Laboratories SIM.M.D-K4
CENAM – 2009/06/26 39/51
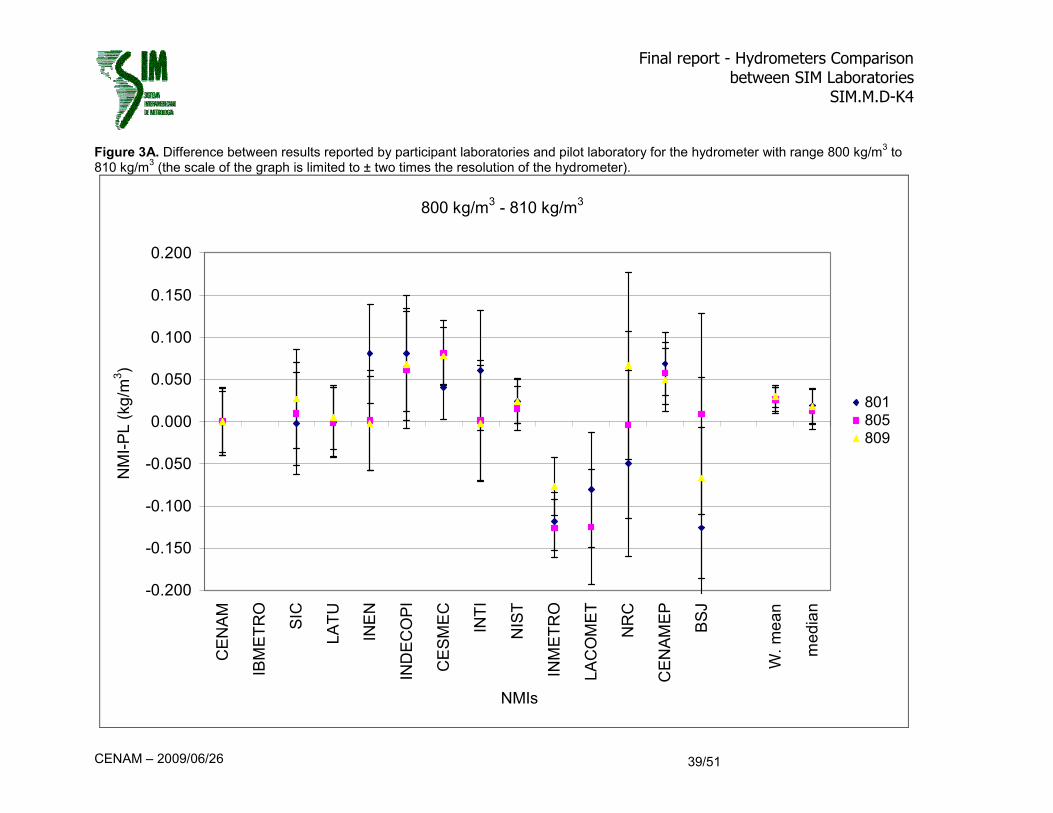
Figure 3A. Difference between results reported by participant laboratories and pilot laboratory for the hydrometer with range 800 kg/m3 to
810 kg/m3 (the scale of the graph is limited to ± two times the resolution of the hydrometer).
800 kg/m3 - 810 kg/m
3
-0.200
-0.150
-0.100
-0.050
0.000
0.050
0.100
0.150
0.200
CE
NA
M
IBM
ET
RO
SIC
LA
TU
INE
N
IND
EC
OP
I
CE
SM
EC
INT
I
NIS
T
INM
ET
RO
LA
CO
ME
T
NR
C
CE
NA
ME
P
BS
J
W.
me
an
me
dia
n
NMIs
NM
I-P
L (
kg
/m3)
801
805809

Final report - Hydrometers Comparison
between SIM Laboratories SIM.M.D-K4
CENAM – 2009/06/26 40/51
Figure 4. Difference between results reported by participant laboratories and pilot laboratory for the hydrometer with range 990 kg/m3 to
1000 kg/m3
990 kg/m3 - 1000 kg/m
3
-0.500
-0.400
-0.300
-0.200
-0.100
0.000
0.100
0.200
CE
NA
M
IBM
ET
RO
SIC
LA
TU
INE
N
IND
EC
OP
I
CE
SM
EC
INT
I
NIS
T
INM
ET
RO
LA
CO
ME
T
NR
C
CE
NA
ME
P
BS
J
W.
me
an
me
dia
n
NMIs
NM
I-P
L (
kg
/m3)
991
995999
Final report - Hydrometers Comparison
between SIM Laboratories SIM.M.D-K4
CENAM – 2009/06/26 41/51
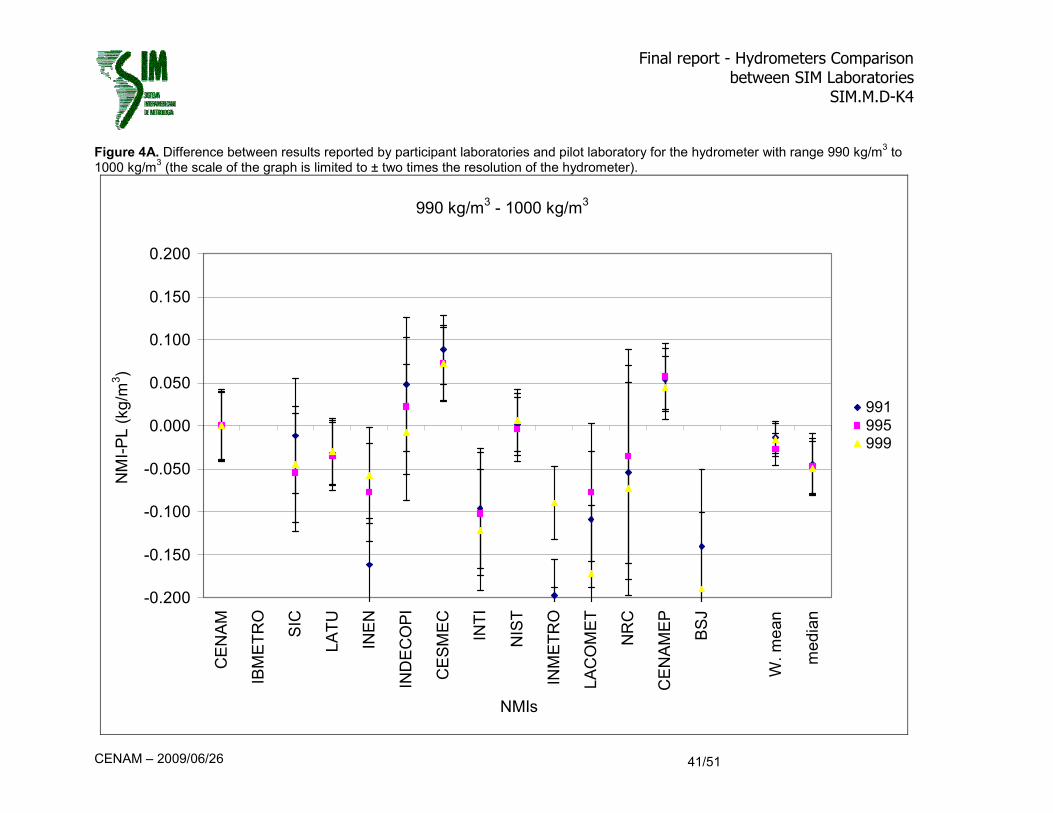
Figure 4A. Difference between results reported by participant laboratories and pilot laboratory for the hydrometer with range 990 kg/m3 to
1000 kg/m3 (the scale of the graph is limited to ± two times the resolution of the hydrometer).
990 kg/m3 - 1000 kg/m
3
-0.200
-0.150
-0.100
-0.050
0.000
0.050
0.100
0.150
0.200
CE
NA
M
IBM
ET
RO
SIC
LA
TU
INE
N
IND
EC
OP
I
CE
SM
EC
INT
I
NIS
T
INM
ET
RO
LA
CO
ME
T
NR
C
CE
NA
ME
P
BS
J
W.
me
an
me
dia
n
NMIs
NM
I-P
L (
kg
/m3)
991
995999

Final report - Hydrometers Comparison
between SIM Laboratories SIM.M.D-K4
CENAM – 2009/06/26 42/51
Figure 5. Difference between results reported by participant laboratories and pilot laboratory for the hydrometer with range 1 290 kg/m3 to
1 300 kg/m3
1290 kg/m3 - 1300 kg/m
3
-0.350
-0.300
-0.250
-0.200
-0.150
-0.100
-0.050
0.000
0.050
0.100
0.150
CE
NA
M
IBM
ET
RO
SIC
LA
TU
INE
N
IND
EC
OP
I
CE
SM
EC
INT
I
NIS
T
INM
ET
RO
LA
CO
ME
T
NR
C
CE
NA
ME
P
BS
J
W. m
ean
media
n
NMIs
NM
I-P
L (
kg/m
3)
1291
12951299
Final report - Hydrometers Comparison
between SIM Laboratories SIM.M.D-K4
CENAM – 2009/06/26 43/51
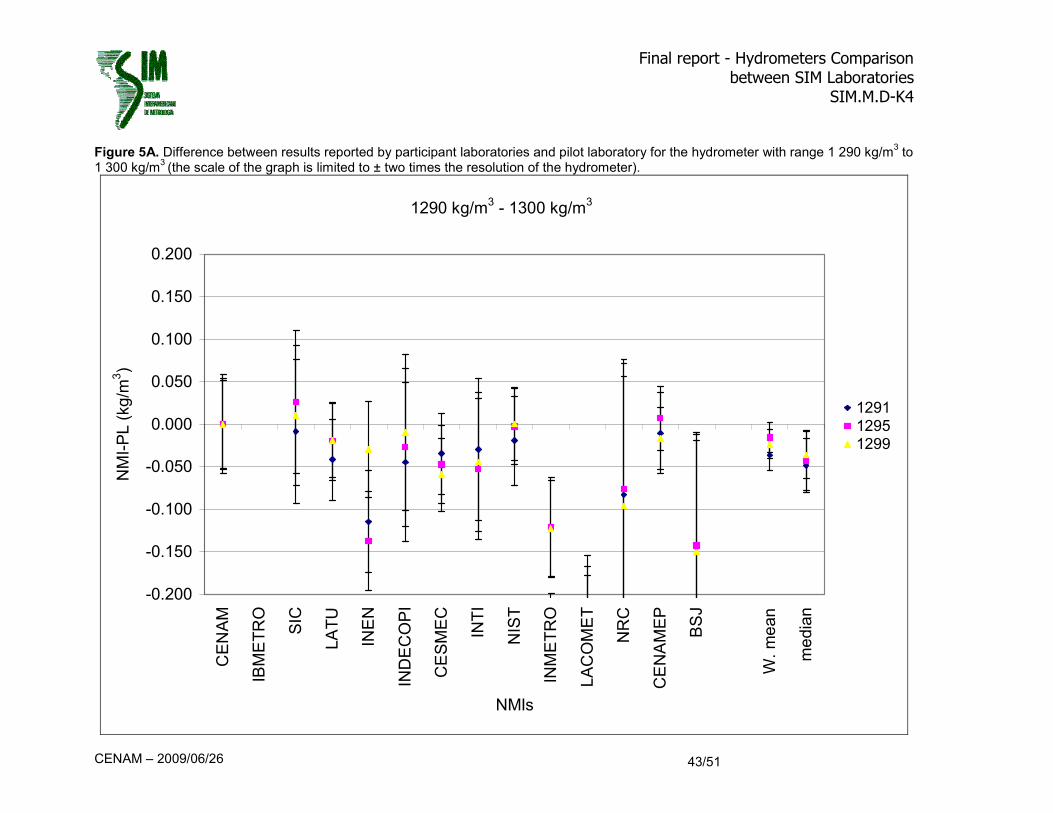
Figure 5A. Difference between results reported by participant laboratories and pilot laboratory for the hydrometer with range 1 290 kg/m3 to
1 300 kg/m3 (the scale of the graph is limited to ± two times the resolution of the hydrometer).
1290 kg/m3 - 1300 kg/m
3
-0.200
-0.150
-0.100
-0.050
0.000
0.050
0.100
0.150
0.200
CE
NA
M
IBM
ET
RO
SIC
LA
TU
INE
N
IND
EC
OP
I
CE
SM
EC
INT
I
NIS
T
INM
ET
RO
LA
CO
ME
T
NR
C
CE
NA
ME
P
BS
J
W.
me
an
me
dia
n
NMIs
NM
I-P
L (
kg/m
3)
1291
12951299

Final report - Hydrometers Comparison
between SIM Laboratories SIM.M.D-K4
CENAM – 2009/06/26 44/51
Figure 6. Difference between results reported by participant laboratories and the Reference Value for the hydrometer with range 600 kg/m3
to 610 kg/m3
600 kg/m3 - 610 kg/m
3
-0.500
-0.400
-0.300
-0.200
-0.100
0.000
0.100
0.200
0.300
0.400
0.500
0.600
CE
NA
M
IBM
ET
RO
SIC
LA
TU
INE
N
IND
EC
OP
I
CE
SM
EC
INT
I
NIS
T
INM
ET
RO
LA
CO
ME
T
NR
C
CE
NA
ME
P
BS
J
NMIs
NM
I- R
V (
kg
/m3)
601
605
609
Final report - Hydrometers Comparison
between SIM Laboratories SIM.M.D-K4
CENAM – 2009/06/26 45/51
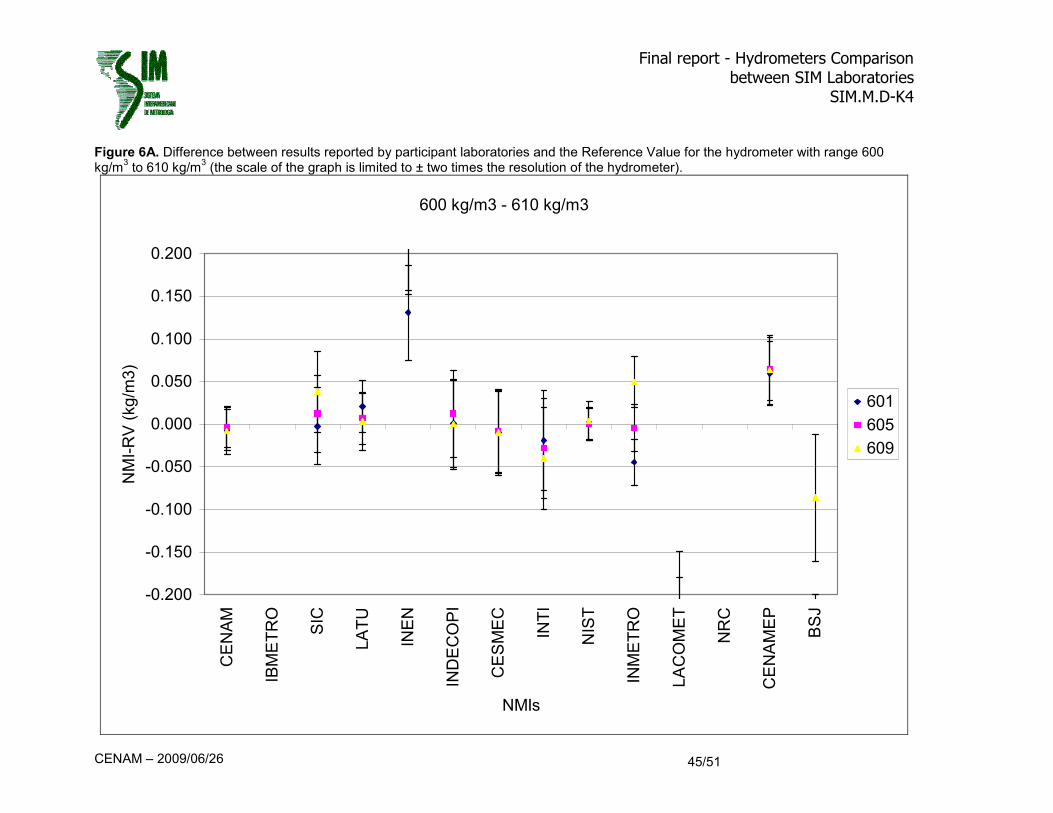
Figure 6A. Difference between results reported by participant laboratories and the Reference Value for the hydrometer with range 600 kg/m
3 to 610 kg/m
3 (the scale of the graph is limited to ± two times the resolution of the hydrometer).
600 kg/m3 - 610 kg/m3
-0.200
-0.150
-0.100
-0.050
0.000
0.050
0.100
0.150
0.200
CE
NA
M
IBM
ET
RO
SIC
LA
TU
INE
N
IND
EC
OP
I
CE
SM
EC
INT
I
NIS
T
INM
ET
RO
LA
CO
ME
T
NR
C
CE
NA
ME
P
BS
J
NMIs
NM
I-R
V (
kg/m
3)
601
605
609

Final report - Hydrometers Comparison
between SIM Laboratories SIM.M.D-K4
CENAM – 2009/06/26 46/51
Figure 7. Difference between results reported by participant laboratories and the Reference Value for the hydrometer with range 800 kg/m3
to 810 kg/m3
800 kg/m3 - 810 kg/m
3
-1.500
-1.000
-0.500
0.000
0.500
1.000
1.500
CE
NA
M
IBM
ET
RO
SIC
LA
TU
INE
N
IND
EC
OP
I
CE
SM
EC
INT
I
NIS
T
INM
ET
RO
LA
CO
ME
T
NR
C
CE
NA
ME
P
BS
J
NMIs
NM
I-R
V (
kg/m
3)
801
805
809

Final report - Hydrometers Comparison
between SIM Laboratories SIM.M.D-K4
CENAM – 2009/06/26 47/51
Figure 7A. Difference between results reported by participant laboratories and the Reference Value for the hydrometer with range 800 kg/m
3 to 810 kg/m
3 (the scale of the graph is limited to ± two times the resolution of the hydrometer).
800 kg/m3 - 810 kg/m
3
-0.200
-0.150
-0.100
-0.050
0.000
0.050
0.100
0.150
0.200
CE
NA
M
IBM
ET
RO
SIC
LA
TU
INE
N
IND
EC
OP
I
CE
SM
EC
INT
I
NIS
T
INM
ET
RO
LA
CO
ME
T
NR
C
CE
NA
ME
P
BS
J
NMIs
NM
I-R
V (
kg/m
3)
801
805
809

Final report - Hydrometers Comparison
between SIM Laboratories SIM.M.D-K4
CENAM – 2009/06/26 48/51
Figure 8. Difference between results reported by participant laboratories and the Reference Value for the hydrometer with range 990 kg/m3
to 1 000 kg/m3
990 kg/m3 - 1000 kg/m
3
-0.400
-0.300
-0.200
-0.100
0.000
0.100
0.200
CE
NA
M
IBM
ET
RO
SIC
LA
TU
INE
N
IND
EC
OP
I
CE
SM
EC
INT
I
NIS
T
INM
ET
RO
LA
CO
ME
T
NR
C
CE
NA
ME
P
BS
J
NMIs
NM
I-R
V (
kg/m
3)
991
995
999

Final report - Hydrometers Comparison
between SIM Laboratories SIM.M.D-K4
CENAM – 2009/06/26 49/51
Figure 8A. Difference between results reported by participant laboratories and the Reference Value for the hydrometer with range 990 kg/m
3 to 1 000 kg/m
3 (the scale of the graph is limited to ± two times the resolution of the hydrometer).
990 kg/m3 - 1000 kg/m
3
-0.200
-0.150
-0.100
-0.050
0.000
0.050
0.100
0.150
0.200
CE
NA
M
IBM
ET
RO
SIC
LA
TU
INE
N
IND
EC
OP
I
CE
SM
EC
INT
I
NIS
T
INM
ET
RO
LA
CO
ME
T
NR
C
CE
NA
ME
P
BS
J
NMIs
NM
I-R
V (
kg/m
3)
991
995
999
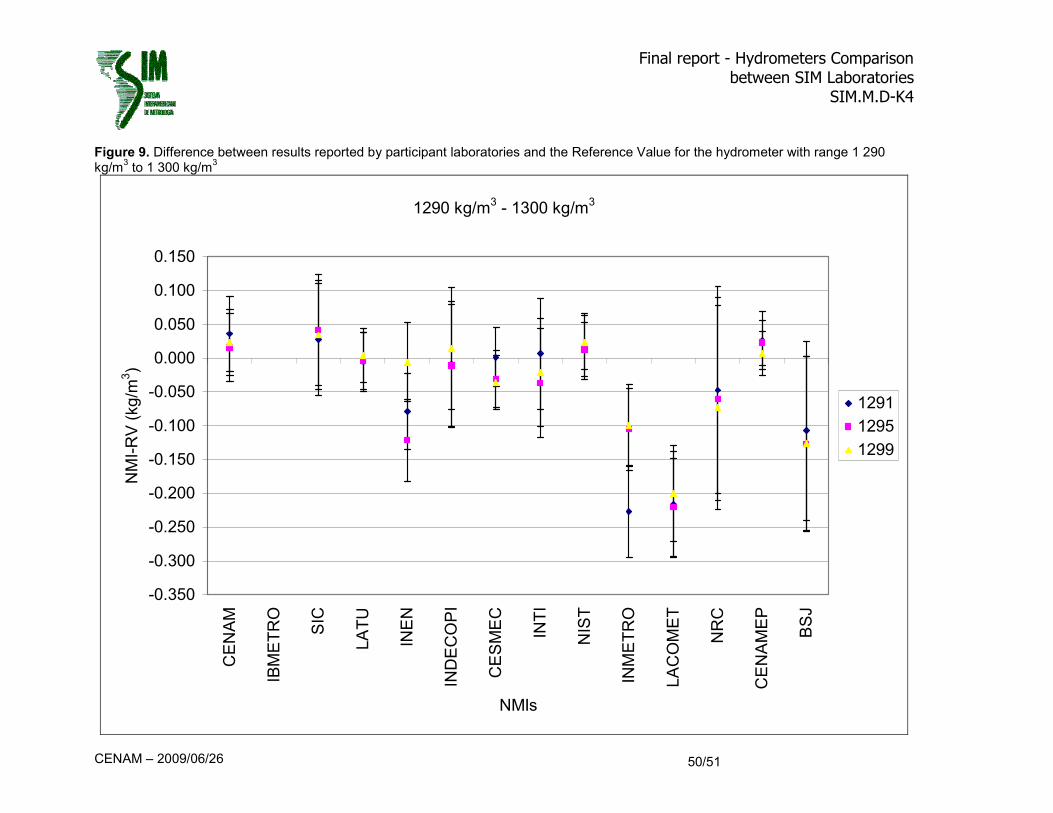
Final report - Hydrometers Comparison
between SIM Laboratories SIM.M.D-K4
CENAM – 2009/06/26 50/51
Figure 9. Difference between results reported by participant laboratories and the Reference Value for the hydrometer with range 1 290 kg/m
3 to 1 300 kg/m
3
1290 kg/m3 - 1300 kg/m
3
-0.350
-0.300
-0.250
-0.200
-0.150
-0.100
-0.050
0.000
0.050
0.100
0.150
CE
NA
M
IBM
ET
RO
SIC
LA
TU
INE
N
IND
EC
OP
I
CE
SM
EC
INT
I
NIS
T
INM
ET
RO
LA
CO
ME
T
NR
C
CE
NA
ME
P
BS
J
NMIs
NM
I-R
V (
kg/m
3)
1291
1295
1299
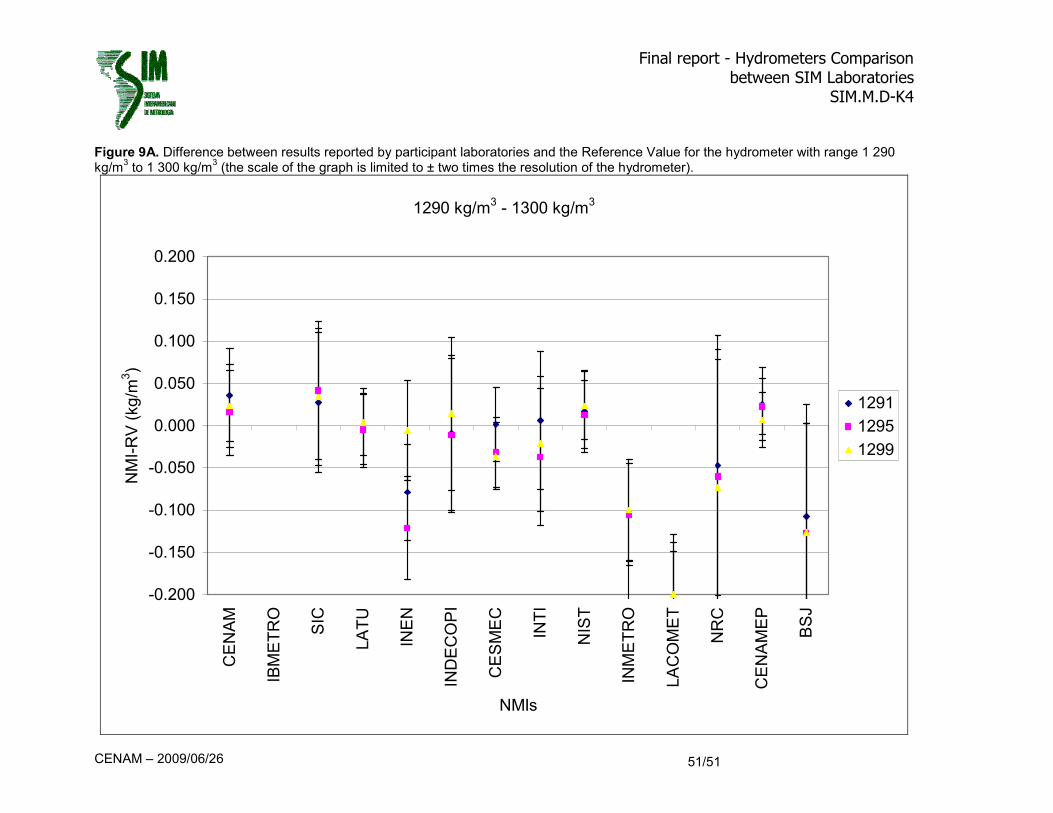
Final report - Hydrometers Comparison
between SIM Laboratories SIM.M.D-K4
CENAM – 2009/06/26 51/51
Figure 9A. Difference between results reported by participant laboratories and the Reference Value for the hydrometer with range 1 290 kg/m
3 to 1 300 kg/m
3 (the scale of the graph is limited to ± two times the resolution of the hydrometer).
1290 kg/m3 - 1300 kg/m
3
-0.200
-0.150
-0.100
-0.050
0.000
0.050
0.100
0.150
0.200
CE
NA
M
IBM
ET
RO
SIC
LA
TU
INE
N
IND
EC
OP
I
CE
SM
EC
INT
I
NIS
T
INM
ET
RO
LA
CO
ME
T
NR
C
CE
NA
ME
P
BS
J
NMIs
NM
I-R
V (
kg/m
3)
1291
1295
1299

![Draft Report of SIM comparison - BIPM · CENAM can be used as pivot values to link them with the comparison SIM.M.D-S1 [2], SIM.M.D-K4 [3] and CCM.D-K4 [1]. INACAL – 2017/06 2/56](https://img.dokumen.tips/doc/110x75/5f3517a08660844d131c5353/draft-report-of-sim-comparison-bipm-cenam-can-be-used-as-pivot-values-to-link.jpg)