Embed Size (px)
Citation preview

Final Report
City of Los Angeles Integrated Resources Plan Summary Report December 2006
Prepared for City of Los Angeles Department of Public Works Bureau of Sanitation and Department of Water and Power Prepared By: CH:CDM, A Joint Venture

Acknowledgements
Project Director Adel Hagekhalil, Bureau of Sanitation Tom Erb, Department of Water and Power (DWP) Kellene Burn-Roy, CDM Project Managers Debbie Pham, Bureau of Sanitation William Van Wagoner, DWP Heather Boyle VanMeter, CDM Kathleen Bullard, CH2M Hill
Facilities Plan Task Managers Reina Pereira, Bureau of Sanitation Judi Miller, CH2M Hill
Financial Plan Task Managers Lisa Mowery, Bureau of Sanitation Dan Rodrigo, CDM Mike Matichich, CH2M Hill
Public Outreach Task Managers Hyginus Mmeje, Bureau of Sanitation Chris Harris, Harris & Company
Environmental Task Managers Ara Kasparian, Bureau of Engineering Jawahar Shah, Bureau of Sanitation Louis Utsumi, Envicraft, LLC Christine Roberts, CH2M Hill
Stakeholder Facilitator Paul Brown, CDM

Management Advisory Committee and Technical Advisory Committee Varouj Abkian/BOE Sam Alavi/BOS Ralph Avila/Planning Ron Bagel/LAUSD Vik Bapna/LACDPW Bob Birk/BOS Melinda Bartlett/DEA Allison Becker/CD13 Angelo Bellomo/LAUSD Barry Berggren/BOS Dale Burgoyne/BOS Bee Campbell/CAO Jeff Catalano/CD9 Jeanne Chang/CD4 Emeverto Cheng/BOS Donna Chen/BOS Dan Comorre/BOE Froy Cornejo/BOS Johne Crosse/CD11 Joseph Cruz/BSS Patricia Cruz/BOS Paula Daniels/Board of Public Works Steve Davis/RAP Gus Dembegiotes/BOS Ed Demesa/USACE John De Witt/Rec & Parks Mark Dierkin/CD7 John Dierking/Office of Finance Rebecca Drayse/Tree People Jim Doty/BOE Tom Erb/DWP Kurt Erikson/City of Glendale Doug Failing/Caltrans Darryl Ford/RAP
Yolanda Fuentes/Board of Public Works Jose Gardea/CD1 Maria Gomez/BOS Dan Griset/SCAG Aaron Gross/CD11 Gerald Gubatan/CD1 Keith Hanks/BOE Daniel Hackney/BOS Adel Hagekhalil/BOS Chris Harris/Harris & Company Bill Hartnett/EED Tim Haug/BOE Patricia Huber/CAO David Jensen/LAUSD Robert Jensen/RAP Josh Kamensky/CD13 Ara Kasparian/BOE Shahram Kharaghani/BOS Rod Kubomoto/LACDPW Wayne Lawson/BOE Julie Lee/CD8 Andy Lipkis/TreePeople Brent Lorscheider/BOS Carmelo Martinez/BOS Mark Mackowski/ULARA Watermaster Jim Marchese/BOS Laura McLennan/CD7 Jon Mukri/RAP Carl Mills/BOE Traci Minamide/BOS Hyginus Mmeje/BOS Omar Moghaddam/BOS Lisa Mowery/BOS
Mike Mullin/BOS Joe Mundine/BOS Greg Nelson/DONE Hiddo Netto/BOS Reina Pereira/BOS Mark Pestrella/LACDPW Susan Pfann/CAO Debbie Pham/BOS Randy Price/BOS Rafael Prieto/CLA Ken Redd/BOE Phil Richardson/BOE Rita Robinson/BOS Dan Rosales/CD7 Bill Rosendahl/CD11 Cynthia Ruiz/ BPW Brian Sasaki/LACDPW Shahrouzeh Saneie/BOS Jawahar Shah/BOS Susan Shu/BOE Michael Shull/RAP Cathy Shuman/USACE Siegmund Shyu/CAO Jill Sourial/CD1 Mike Spiker/LAG Mark Starr/BOS William Steele/US Bureau of Reclamation Nancy Sutley/Mayor’s Office Raja Takidin/City of Glendale Wing Tam/BOS Robert Tanowitz/BOS Paul Thakur/Caltrans Chuck Turhollow/BOS Herman Van Buren/CLA – Planning

Lupe Vela/CD1 Bill Van Wagoner/DWP Camille Walls/RAP Doug Walters/BOS Deborah Weintraub/BOE
Chris Westhoff/CAO Judy Wilson/JW & Associates Robb Whitaker/Water Replenishment District of Southern California
Don Wolfe/LACDPW Robert Wu/Caltrans Clayton Yoshida/BOS Steve Zurn/City of Glendale

Contributing Staff and Consultants Wastewater Management
TreatmentChuck Turhollow, Bureau of Sanitation Tim Haug, Bureau of Engineering Varouj Abkian, Bureau of Sanitation Ken Redd, Bureau of Engineering Steve Fan, Bureau of Sanitation Bob Birk, Bureau of Sanitation
Curt Roth, CH2M Hill Hector Ruiz, CH2M Hill Heather Boyle VanMeter, CDM Glen Daigger, CH2M Hill Ilknur Ahmad, CH2M Hill Gary Guyll, CH2M Hill
Collection SystemFarsheed Farhang, Bureau of Sanitation Betty Dong, Bureau of Sanitation
John Wang, Bureau of Sanitation Devang Parikh, MapVision Judi Miller, CH2M Hill
BiosolidsDiane Gilbert Jones, Bureau of Sanitation Omar Mogahaddam, Bureau of Sanitation
Ruth Roxburgh, CH2M Hill Sava Nedic, CDM Fred Soroushian, CH2M Hill
Water ManagementWilliam Van Wagoner, DWP Tom Gackstetter, DWP Alvin Bautista, DWP Victoria Cross, DWP Jennifer Barrack, DWP Mike Mullin, Bureau of Sanitation
Dan Rodrigo, CDM Scott Lynch, CH2M Hill Megan Laetsch, CH2M Hill Bob Kemmerle, E2 Kathleen Higgins, CH2M Hill Mike Savage, CDM
Runoff ManagementShahram Kharaghani, Bureau of Sanitation Morad Sedrak, Bureau of Sanitation Robert Vega, Bureau of Sanitation Mike Mullin, Bureau of Sanitation Wing Tam, Bureau of Sanitation Hampik Dekermenjian, CDM
Jennifer Gronberg, CDM Don Schroeder, CDM Judi Miller, CH2M Hill Curt Roth, CH2M Hill Andy Lipkis, TreePeople Bob Kemmerle, E2
Decision ScienceDan Rodrigo, CDM Enrique Lopez-Calva, CDM
Regulatory ForecastTraci Minamide, Bureau of Sanitation Shahram Kharaghani, Bureau of Sanitation Adel Hagekhalil, Bureau of Sanitation Donna Toy Chen, Bureau of Sanitation Diane Gilbert Jones, Bureau of Sanitation Lisa Mowery, Bureau of Sanitation Reina Pereira, Bureau of Sanitation
William Van Wagoner, DWP Carrie Takayama, DWP Chris Westhoff, City Attorney’s Office Judy Wilson, JW & Associates Ruth Roxburgh, CH2M Hill Heather Boyle VanMeter, CDM

i Summary Report Table of Contents
Contents
Section 1 Introduction .................................................................................................. 1-1 1.1 Background ...............................................................................................................1-1 1.2 Stakeholder Driven Facilities Planning Process ...................................................1-3 1.3 Overview of Document ...........................................................................................1-3
Section 2 Wastewater Management ........................................................................... 2-1 2.1 Introduction...............................................................................................................2-1 2.2 Planning Parameters ................................................................................................2-1
2.2.1 Wastewater Service Area..........................................................................2-2 2.2.2 Population and Employment Projections ..............................................2-2 2.2.3 Regulatory Requirements.........................................................................2-5
2.3 Guiding Principles Affecting Wastewater Management ....................................2-7 2.4 Wastewater Flow Projections..................................................................................2-8 2.5 Existing Collection System......................................................................................2-9 2.6 Collection System Options ....................................................................................2-10 2.7 Existing Treatment Facilities.................................................................................2-14
2.7.1 Hyperion Treatment Plant .....................................................................2-15 2.7.2 Donald C. Tillman Water Reclamation Plant (TWRP) .......................2-17 2.7.3 Los Angeles-Glendale Water Reclamation Plant ................................2-19 2.7.4 Terminal Island Treatment Plant ..........................................................2-21
2.8 Treatment Options..................................................................................................2-23 2.8.1 HTP Treatment Option...........................................................................2-24 2.8.2 WRP Treatment Options ........................................................................2-25 2.8.3 LAG Treatment Options.........................................................................2-27 2.8.4 TITP Options ............................................................................................2-29 2.8.5 New Water Reclamation Plant Options ...............................................2-29
2.9 Biosolids Management...........................................................................................2-32 2.10 Alternatives Analysis .............................................................................................2-37
Section 3 Water Management...................................................................................... 3-1 3.1 Introduction...............................................................................................................3-1 3.2 Planning Parameters ................................................................................................3-2 3.3 Potable Water ............................................................................................................3-2
3.3.1 Demands.....................................................................................................3-2 3.3.2 Supply .........................................................................................................3-4
3.4 Water Conservation..................................................................................................3-5 3.4.1 Existing and Planned Conservation Measures......................................3-6 3.4.2 Potential Additional Conservation Measures .......................................3-7
3.5 Recycled System .......................................................................................................3-8 3.5.1 Existing Recycled Water System and Demands ...................................3-8

Contents Summary Report
ii Summary Report Table of Contents
3.5.2 Potential Demands for Recycled Water ...............................................3-10 3.5.2.1 Identifying DWP Top Water
Customers...............................................................................3-10 3.5.2.2 Mapping Potential Recycled Water Customers ................3-12
3.6 Summary..................................................................................................................3-14
Section 4 Runoff Management .................................................................................. 4-1 4.1 Introduction...............................................................................................................4-1
4.1.1 Runoff Service Area ..................................................................................4-1 4.2 Planning Parameters ................................................................................................4-3
4.2.1 IRP Guiding Principles .............................................................................4-3 4.2.2 Regulatory Drivers ....................................................................................4-4 4.2.3 Runoff Planning Sheds .............................................................................4-5
4.3 Approach ...................................................................................................................4-5 4.4 Dry Weather Runoff ................................................................................................4-8
4.4.1 Dry Weather Runoff Volume...................................................................4-8 4.4.2 Dry Weather Runoff Quality .................................................................4-10 4.4.3 Local/Neighborhood Solutions ............................................................4-11 4.4.4 Regional Solutions...................................................................................4-12 4.4.4.1 Diversion to Wastewater system.........................................4-12 4.4.4.2 Diversion to Urban Runoff Plants, Including Reuse ........4-13 4.4.4.3 Diversion to Wetlands ..........................................................4-16
4.5 Wet Weather Runoff...............................................................................................4-16 4.5.1 Wet Weather Runoff Volume ................................................................4-16 4.5.2 Wet Weather Runoff Quality .................................................................4-18 4.5.3 Local/Neighborhood Solutions ............................................................4-20 4.5.3.1 New/Redevelopment Areas – Onsite treatment/
discharge.................................................................................4-20 4.5.3.2 New/Redevelopment Areas – On site percolation ..........4-20 4.5.3.3 Retrofit Area – Cisterns ........................................................4-21 4.5.3.4 Retrofit Areas – Onsite Percolation.....................................4-22 4.5.3.5 Neighborhood Recharge ......................................................4-22 4.5.4 Regional Solutions.................................................................4-22 4.5.4.1 Non-Urban Regional Recharge............................................4-22 4.5.4.2 Treatment and Discharge or Beneficial Use ......................4-23 4.5.4.2.1 Treatment and Discharge ...................................4-23 4.5.4.2.2 Treatment and Beneficial Use ............................4-24
4.6 Summary..................................................................................................................4-26

Contents Summary Report
iii Summary Report Table of Contents
Section 5 Alternatives Development and Analysis ................................................ 5-1 5.1 Approach for Developing and Evaluating Alternatives ....................................5-1 5.2 IRP Objectives, Sub-Objectives and Performance Measures..............................5-1 5.3 Preliminary Alternatives .........................................................................................5-2
5.3.1 Evaluation of Preliminary Alternatives .................................................5-4 5.4 Hybrid Alternatives .................................................................................................5-4
5.4.1 Evaluation of Hybrid Alternatives..........................................................5-8 5.5 Recommended Draft Alternatives for Environmental Analysis........................5-8 5.6 Recommend Alternative........................................................................................5-10
Section 6 Adaptive Capital Improvement Plan (CIP)............................................. 6-1 6.1 Introduction...............................................................................................................6-1 6.2 Implementation Strategy .........................................................................................6-1 6.3 Capital Cost Data Assumptions .............................................................................6-2
6.3.1 Cost Factors ................................................................................................6-2 6.3.2 Construction Cost Index Updates...........................................................6-3
6.4 Wastewater Projects .................................................................................................6-3 6.4.1 Wastewater Go-Projects ...........................................................................6-4 6.4.2 Wastewater Go If Triggered Projects......................................................6-6 6.4.3 Wastewater Leadership Projects .............................................................6-8 6.4.4 Baseline Project Timing ............................................................................6-8
6.5 Runoff Management Projects..................................................................................6-8 6.5.1 Runoff Management Programmatic Projects ........................................6-9 6.5.2 Proposition O Conceptual Projects .........................................................6-9
6.6 Recycled Water .......................................................................................................6-10 6.6.1 Potential Recycled Water Projects.........................................................6-11 6.6.2 Parallel Projects Underway and Conceptual Projects ........................6-12
6.7 Water Conservation Projects.................................................................................6-12 6.8 Implementation Tracking ......................................................................................6-13
6.8.1 Trigger Tracking Tools ...........................................................................6-13 6.8.2 IRP Progress Reporting ..........................................................................6-15
Section 7 Public Participation ..................................................................................... 7-1 7.1 Introduction...............................................................................................................7-1 7.2 Roles of Stakeholders in the IRP Project................................................................7-1 7.3 Steering, Advisory, and Information Groups.......................................................7-2 7.4 Stakeholders and Focused Outreach Related to the Environmental
Impact Report............................................................................................................7-2 7.5 Public Hearings to Certify the Final EIR ...............................................................7-3

Contents Summary Report
iv Summary Report Table of Contents
Section 8 Environmental Impact Report ................................................................... 8-1 8.1 Introduction...............................................................................................................8-1 8.2 Draft EIR ....................................................................................................................8-1 8.3 Final EIR.....................................................................................................................8-3 8.4 Recommended Alternative .....................................................................................8-3
8.4.1 Final Selected Alternative ........................................................................8-5
Acknowledgements
List of Figures Figure 1-1 Overall Approach......................................................................................1-2 Figure 1-2 Final IRP Documentation .........................................................................1-3 Figure 2-1 Wastewater Service Area..........................................................................2-2 Figure 2-2 Los Angeles Service Area and Contract Agencies................................2-4 Figure 2-3 IRP Objectives ............................................................................................2-7 Figure 2-4 Interceptor Sewers in City of Los Angeles...........................................2-11 Figure 2-5 Wastewater System Flows and Capacity Gaps in Year 2020 ............2-12 Figure 2-6 Hyperion Treatment Plant .....................................................................2-16 Figure 2-7 Tillman Water Reclamation Plant Site Plan.........................................2-18 Figure 2-8 Los Angeles-Glendale Water Reclamation Plant Site Plan................2-20 Figure 2-9 Terminal Island Treatment Plant Existing Site Plan...........................2-22 Figure 2-10 Interrelationship of Upstream Plants with Hyperion Treatment
Plant...........................................................................................................2-25 Figure 2-11 Initial General Areas for a New Water Reclamation Plant................2-31 Figure 2-12 Biosolids Management Task Approach ...............................................2-33 Figure 3-1 DWP Historical and Projected Water Demand and Population.........3-3 Figure 3-2 Principal Water Supply Sources..............................................................3-4 Figure 3-3 Summary of Water Supply for the Average of 10 Years......................3-4 Figure 3-4 City Wastewater Plants and Sewersheds...............................................3-8 Figure 3-5 Potential Recycled Water Demand .......................................................3-11 Figure 3-6 Potential Recycled Water Customers ...................................................3-13 Figure 4-1 Citywide Land Use....................................................................................4-1 Figure 4-2 Runoff Watersheds for Los Angeles .......................................................4-2 Figure 4-3 Runoff Management Options ..................................................................4-5 Figure 4-4 Runoff Planning Sheds .............................................................................4-6 Figure 4-5 Non-Potable Demands Near Potential Runoff Treatment
Locations...................................................................................................4-15 Figure 4-6 Soils Map ..................................................................................................4-21 Figure 5-1 IRP Alternatives Analysis Process Chart ...............................................5-1 Figure 5-2 IRP Primary Objectives.............................................................................5-2

Contents Summary Report
v Summary Report Table of Contents
Figure 5-3 Decision Modeling ....................................................................................5-4 Figure 5-4 Wastewater Components in Hybrid Alternatives ................................5-7 Figure 5-5 IRP Recommended Draft Alternatives.................................................5-12 Figure 5-6 Hybrid Alternatives Costs and Benefits...............................................5-13 Figure 6-1 Overview of Treatment Plants, Service Area, and Proposed
Sewer Lines ................................................................................................6-5 Figure 6-2 Possible Schedules.....................................................................................6-7 Figure 6-3 Permit Flow Chart ...................................................................................6-13 Figure 7-1 Role of Stakeholders in the IRP ...............................................................7-1 Figure 8-1 Final Selected Alternative: Alternative 4 - Tillman Expansion...........8-6
List of Tables Table 1-1 Summary Report .......................................................................................1-4 Table 2-1 Summary of Agencies and Businesses that Contract with the City of
Los Angeles for Wastewater Service ......................................................2-3 Table 2-2 Summary of Population Projections and Percent Increase
Compared to 2000 .....................................................................................2-5 Table 2-3 Summary of Employment Projections and Percent Increase
Compared to 2000 .....................................................................................2-6 Table 2-4 Summary of Priority Regulations and Key Policy Issues for the
Wastewater Program ................................................................................2-6 Table 2-5 Summary of Average Dry Weather Flow (ADWF) Projections
ADWF (mgd)..............................................................................................2-9 Table 2-6 Tillman WRP Options for the Year 2020 ..............................................2-27 Table 2-7 Los Angeles-Glendale Water Reclamation Plant Options for the
Year 2020...................................................................................................2-28 Table 2-8 Criteria for New and Upgraded Facilities ...........................................2-29 Table 2-9 New Water Reclamation Plant Options for the Year 2020 ................2-32 Table 2-10 Summary of Initial Screening of Biosolids Product
Technologies.............................................................................................2-34 Table 2-11 Summary of Initial Screening of Biosolids Product
Technologies.............................................................................................2-35 Table 3-1 Projected Water Demands for Each Customer Class in Thousands of
Acre-/ft1......................................................................................................3-3 Table 3-2 Potable Water Forecasts for the City of Los Angeles ...........................3-5 Table 3-3 Existing Recycled Water Use in City of Los Angeles .........................3-10 Table 4-1 Summary of Runoff Planning Shed Areas.............................................4-7 Table 4-2 Runoff throughout City Based on Estimated Runoff Rates ................4-9 Table 4-3 Dry Weather Flows by Runoff Planning Shed ......................................4-9 Table 4-4 Summary of Reported Dry Weather Runoff Water Quality Data ....4-10 Table 4-5 Currently Available Treatment Plant Capacity ..................................4-13 Table 4-6 Potential Non-Potable Water Demands Met with Treated Runoff ..4-14

Contents Summary Report
vi Summary Report Table of Contents
Table 4-7 Estimated Wet Weather Runoff Volume..............................................4-17 Table 4-8 Wet Weather Flows by Runoff Planning Shed....................................4-18 Table 4-9 Water Quality Data in Ballona Creek and the Los Angeles River
General Chemicals and Minerals ..........................................................4-18 Table 4-10 Wet Weather Runoff Managed by On-Site Percolation .....................4-22 Table 4-11 Proposed Coastal Treatment Plants......................................................4-24 Table 4-12 Underground Storage Potential throughout the City ........................4-25 Table 5-1 Objectives, Sub-objectives and Performance Measures
for the IRP...................................................................................................5-3 Table 5-2 Integrated Resources Plan (IRP) – Preliminary Alternatives
Matrix ..........................................................................................................5-5 Table 5-3 Integrated Resources Plan (IRP) – Hybrid Alternatives Matrix .........5-9 Table 6-1 IRP Recommended Alternative Wastewater Estimated Capital Costs –
Go-Projects .................................................................................................6-4 Table 6-2 IRP Alternative Four Wastewater Estimated Capital Costs – Go if
Triggered Projects......................................................................................6-6 Table 6-3 IRP Alternative Four Runoff Management Estimated
Capital Costs ............................................................................................6-10 Table 6-4 IRP Recommended Alternative Recycled Water Estimated Capital
Costs ..........................................................................................................6-11 Table 6-5 Plant Scenario...........................................................................................6-14 Table 6-6 IRP Go-Policy Directions........................................................................6-16
1-1
Section 1 Summary Report
Section 1 Introduction
This Summary Report provides a brief description of the key facilities planning documents for the Integrated Resources Plan (IRP). The summaries provide an overview of each key documentation area, with more detailed information provided in the full volume of each report.
1.1 Background The City of Los Angeles (City) has developed a wastewater facilities plan that utilized a unique approach of technical integration and community involvement to guide policy decisions and water resources facilities planning. The IRP has integrated a future vision of wastewater, water, and urban runoff management in the City that explicitly recognizes the complex relationships that exist among all of the City’s water resources activities and functions. Addressing and integrating the wastewater, water, and runoff needs of the City in the year 2020, the IRP also takes an important step towards comprehensive basin-wide water resources planning in the Los Angeles area. This integrated process is a departure from the City’s traditional single-purpose planning efforts for separate agency functions, and it will result in greater efficiency and additional opportunities for citywide benefits, including potential overall cost savings. This integrated process also highlights the benefits of establishing partnerships with other citywide and regional agencies, City departments, and other associations, both public and private.
The IRP sought to accomplish two basic goals as part of developing an implementable facilities plan:
Integrate water supply, water conservation, water recycling, and runoff management issues with wastewater facilities planning through a regional watershed approach; and
Enlist the public in the entire planning and design development process at a very early stage beginning with the determination of policy recommendations to guide planning.
The IRP is a multi-phase program:
Phase I [Integrated Plan for the Wastewater Program (IPWP)] (completed in 2001): Focused on defining the future vision for the City by developing a set of guiding principles to direct future, more-detailed water resources planning.
Phase II (Integrated Resources Plan): Focuses on the more detailed planning required to develop in a facilities plan, environmental impact report and financial plan.

Section 1 Introduction
1-2 Summary Report Section 1
Projects (Implementation) (2005 and beyond): Includes future concept reports, studies, and design and construction projects to implement the capital improvement program (CIP) developed as part of Phase II.
The City is facing many challenges, including: the dynamic nature of current and projected regulations affecting the wastewater, recycled water, runoff programs; potential community concerns with siting new wastewater, runoff and recycled water facilities in neighborhoods, potential funding needs for the proposed facilities and programs, and the importance of inter-agency coordination to handle jurisdictional issues. By addressing these challenges now as part of the IRP, the City has improved the tools and organizational and policy structure to better adapt to changing conditions in the future.
The combination of Phases I and II constitute the documentation and overall implementation plan for the IRP, which is intended as an integration of the City’s wastewater (collection, treatment and biosolids), water (water reuse/recycling and water conservation), and runoff (dry weather and wet weather) service functions. By using this integrated approach, the City has established a framework for a sustainable future for the Los Angeles basin, one where there are sufficient wastewater services, adequate water supply, and proper and proactive protection and restoration of the environment. Figure 1-1 illustrates the facilities planning approach and its relationship with the financial and environmental planning tasks.
Envir
onm
enta
lPl
anni
ng
BaselineData
BaselineData
AlternativeDescriptionsAlternative
Descriptions
PerformEnviron-mental
Analysis
PerformEnviron-mental
Analysis
DevelopDraft
EIR/EIS
DevelopDraft
EIR/EISCertify
EIRCertify
EIR
Fina
ncial
Plan
ning Identify
Funding Options
Identify Funding Options
Perform Preliminary
Financial Analysis
Perform Preliminary
Financial Analysis
Evaluate Rate
Impacts
Evaluate Rate
Impacts
Prepare Financial
Plan
Prepare Financial
Plan
Facil
ities
Plan
ning
Develop Preliminary Alternatives
and do Initial
Screenings
Develop Preliminary Alternatives
and do Initial
Screenings
Develop Hybrid
Alternatives
Develop Hybrid
Alternatives
Prepare CIP &
Implemen-tationPlan
Prepare CIP &
Implemen-tationPlan
Develop & Confirm
Data:General
and ElementSpecific
Develop & Confirm
Data:General
and ElementSpecific
IdentifyShortfalls& Options
to Meet
IdentifyShortfalls& Options
to Meet
Screen toFinal
Alternatives
Screen toFinal
Alternatives
Publ
ic Ou
treac
h an
d Ed
ucat
ion
Envir
onm
enta
lPl
anni
ng
BaselineData
BaselineData
AlternativeDescriptionsAlternative
Descriptions
PerformEnviron-mental
Analysis
PerformEnviron-mental
Analysis
DevelopDraft
EIR/EIS
DevelopDraft
EIR/EISCertify
EIRCertify
EIR
Envir
onm
enta
lPl
anni
ng
BaselineData
BaselineData
AlternativeDescriptionsAlternative
Descriptions
PerformEnviron-mental
Analysis
PerformEnviron-mental
Analysis
DevelopDraft
EIR/EIS
DevelopDraft
EIR/EISCertify
EIRCertify
EIR
Fina
ncial
Plan
ning Identify
Funding Options
Identify Funding Options
Perform Preliminary
Financial Analysis
Perform Preliminary
Financial Analysis
Evaluate Rate
Impacts
Evaluate Rate
Impacts
Prepare Financial
Plan
Prepare Financial
Plan
Facil
ities
Plan
ning
Develop Preliminary Alternatives
and do Initial
Screenings
Develop Preliminary Alternatives
and do Initial
Screenings
Develop Hybrid
Alternatives
Develop Hybrid
Alternatives
Prepare CIP &
Implemen-tationPlan
Prepare CIP &
Implemen-tationPlan
Develop & Confirm
Data:General
and ElementSpecific
Develop & Confirm
Data:General
and ElementSpecific
IdentifyShortfalls& Options
to Meet
IdentifyShortfalls& Options
to Meet
Screen toFinal
Alternatives
Screen toFinal
Alternatives
Publ
ic Ou
treac
h an
d Ed
ucat
ion
Publ
ic Ou
treac
h an
d Ed
ucat
ion
Figure 1-1Overall Approach

Section 1 Introduction
1-3
Section 1 Summary Report
1.2 Stakeholder Driven Facilities Planning Process One of the most striking characteristics of the IRP is that it was a stakeholder driven process where members of the community, interested stakeholders, and agency representatives comprised various formal groups that provided the City with valuable input throughout the IRP process and participated in the alternatives development and evaluation process. This stakeholder driven process is currently unparalleled in the City’s facilities planning history.
1.3 Overview of Document The IRP documentation includes a series of volumes that comprise of an Executive Summary, Summary Report, Facilities Plan (5 volumes), Final Environmental Impact Report/Environmental Impact Statement (EIR), Financial Plan, and Public Outreach report. Figure 1-2 illustrates the organization of these volumes.
This Final Summary Report summarizes each section of the IRP as listed in Figure 1-2.
Figure 1-2Final IRP Documentation

Section 1 Introduction
1-4 Summary Report Section 1
Table 1-1 provides a description of each of the sections of this Summary Report.
Table 1-1 Summary Report
Section Description
1 – Introduction Study objectives and background.
2 – Wastewater Management Summarizes the Wastewater service function needs and options for addressing those needs, as described in Volume 1 of the Facilities Plan.
3 – Water Management
Summarizes the Water service function (recycled water) needs, and options for addressing those needs, and discusses the stand-alone Recycled Water Master Plan, as described in Volume 2 of the Facilities Plan.
4 – Runoff Management Summarizes the Runoff service function needs and options for addressing those needs, as described in Volume 3 of the Facilities Plan.
5 – Alternatives Development and Analysis
Summarizes the process undertaken to integrate the needs of the three service functions into integrated alternatives that address these needs, and that identified the project alternatives evaluated in the Environmental Impact Report, as described in Volume 4 of the Facilities Plan.
6 – Adaptive Capital Improvement Program (CIP)
Summarizes the anticipated costs and implementation timing of the facilities that would be required (based on the approved Project Alternative), as described in Volume 5 of the Facilities Plan.
7 – Public Participation Summarizes the public outreach activities and focus conducted throughout the IRP process, as described in the Outreach Volume.
8 – Environmental Impact Report
Summarizes the environmental process undertaken for the IRP, the alternatives analyzed in the EIR, and the selection of the Recommended Alternative that was approved for implementation.
References Summarizes the sources of data, information, and contributions of others.
2-1
Section 2 - Wastewater.doc Summary Report
Section 2 Wastewater Management
2.1 Introduction The Los Angeles Department of Public Works (LADPW) provides the services for the City’s wastewater, stormwater and solid waste program needs. Within the LADPW, the Bureau of Sanitation (Bureau) is responsible for managing and operating the wastewater, stormwater and solid waste programs. The Bureau’s mission is:
To protect the public and environment through legal, efficient, and effective collection, treatment, reuse, and disposal of liquid and solid wastes while enhancing relationships with the community, co-workers, elected and appointed officials, and business.
This section summarizes the wastewater management component of the IRP Facilities Plan - Volume 1: Wastewater Management, which focuses on the elements below. Refer to Volume 1 for detailed information.
Projecting wastewater flow quantities and constituent concentrations.
Identifying current and projecting future regulatory requirements.
Determining the current capacity of existing collection and treatment facilities.
Identifying the “gaps” between the projected flows and the current system capacities.
Developing options to address the identified gaps for each system.
Combining these options to form wastewater alternatives for collection and treatment.
Integrating the wastewater alternatives with the recycled water needs/demands and runoff needs/demands.
2.2 Planning Parameters In planning for the management of future wastewater flows, planning parameters were developed in order to estimate or projected the wastewater flow throughout the service area for the future planning horizon year (2020).
Section 2 Wastewater Management
2-2 Summary Report Section 2 - Wastewater.doc
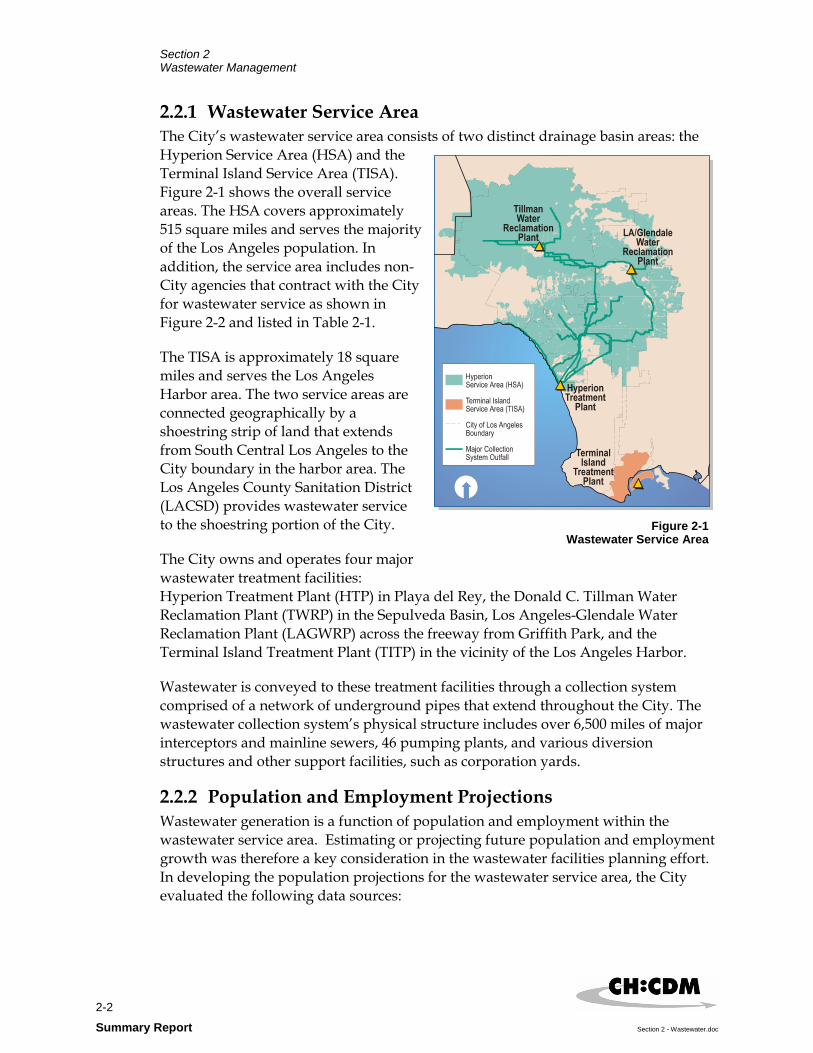
2.2.1 Wastewater Service Area The City’s wastewater service area consists of two distinct drainage basin areas: the Hyperion Service Area (HSA) and the Terminal Island Service Area (TISA). Figure 2-1 shows the overall service areas. The HSA covers approximately 515 square miles and serves the majority of the Los Angeles population. In addition, the service area includes non-City agencies that contract with the City for wastewater service as shown in Figure 2-2 and listed in Table 2-1.
The TISA is approximately 18 square miles and serves the Los Angeles Harbor area. The two service areas are connected geographically by a shoestring strip of land that extends from South Central Los Angeles to the City boundary in the harbor area. The Los Angeles County Sanitation District (LACSD) provides wastewater service to the shoestring portion of the City.
The City owns and operates four major wastewater treatment facilities: Hyperion Treatment Plant (HTP) in Playa del Rey, the Donald C. Tillman Water Reclamation Plant (TWRP) in the Sepulveda Basin, Los Angeles-Glendale Water Reclamation Plant (LAGWRP) across the freeway from Griffith Park, and the Terminal Island Treatment Plant (TITP) in the vicinity of the Los Angeles Harbor.
Wastewater is conveyed to these treatment facilities through a collection system comprised of a network of underground pipes that extend throughout the City. The wastewater collection system’s physical structure includes over 6,500 miles of major interceptors and mainline sewers, 46 pumping plants, and various diversion structures and other support facilities, such as corporation yards.
2.2.2 Population and Employment Projections Wastewater generation is a function of population and employment within the wastewater service area. Estimating or projecting future population and employment growth was therefore a key consideration in the wastewater facilities planning effort. In developing the population projections for the wastewater service area, the City evaluated the following data sources:
Figure 2-1Wastewater Service Area

Section 2 Wastewater Management
2-3
Section 2 - Wastewater.doc Summary Report
Table 2-1 Summary of Agencies and Businesses that
Contract with the City of Los Angeles for Wastewater Service
Per attached map
1. Aneta Street Sewer Maintenance District
2. City of Beverly Hills
3. City of Burbank
4. County Sanitation District #1
5. County Sanitation District #4
6. County Sanitation District #6
7. County Sanitation District #8
8. County Sanitation District #18
9. County Sanitation District #27
10. Crescenta Valley Water District
11. Culver City
12. City of El Segundo
13. City of Glendale
14. City of Hidden Hills
15. City of Long Beach
16. City of Marina Del Rey
17. City of San Fernando
18. City of Santa Monica
19. Federal Facilities
20. Las Virgenes Municipal Water District – 1, 2, 3, and 4
21. Topanga Sewer Maintenance District
22. Triunfo County Sanitation District
23. Universal City
24. US Naval Base
25. VA Hospital
Others listed in IRP document
1. County Sanitation District #5
2. County Sanitation District #9
3. County Sanitation District #11
4. County Sanitation District #16
Others listed in Air Quality Master Plan
1. Barrington Post Office
2. California National Guard
3. County Sanitation District #5
4. County Sanitation District #9
5. County Sanitation District #11
6. Federal Office Building
7. Karl Hoton Camp
8. U.S. Army Reserve Center
9. U.S. Army Reserve Training Center
10. Veterans Memorial Park
11. West Los Angeles Community College

Section 2 Wastewater Management
2-4 Summary Report Section 2 - Wastewater.doc
Figure 2-2Los Angeles Service Area and Contract Agencies

Section 2 Wastewater Management
2-5
Section 2 - Wastewater.doc Summary Report
United States Census Bureau
Southern California Associations of Governments (SCAG)
City of Los Angeles Department of City Planning
State of California Department of Finance
Based on the analysis of population projections and uncertainties associated with them, the SCAG 2001 population projection was selected as the best single source of data to use for the IRP. This data source has population projections through year 2020 for the City and its wastewater contract agencies.
Table 2-2 summarizes the population growth projected to occur at key time intervals in the HSA and the TISA, as well as the growth percentage the increases represent.
Table 2-2 Summary of Population Projections and Percent Increase Compared to 2000
Population Projection for IRP1 Tributary Area
2000 2005 2010 2015 2020 Hyperion Service Area 4,138,567 4,331,109 4,485,054 4,641,928 4,854,483 Terminal Island Service Area (TISA) 139,589 147,567 154,227 160,144 170,504 Total (HSA + TISA) 4,278,156 4,478,676 4,639,281 4,802,072 5,024,987
Estimated Percent Increase In Population Compared to Year 2000 Tributary Area
2000 2005 2010 2015 2020 Hyperion Service Area -- 5% 8% 12% 17% Terminal Island Service Area -- 6% 10% 15% 22% Total (HSA + TISA) -- 5% 8% 12% 17%
1. Based upon SCAG-01 projections
To estimate future employment, the City utilized employment data in the SCAG 2001 Regional Transportation Plan. Table 2-3 presents a summary of the wastewater service area employment projections for years 2000, 2005, 2010, 2015, and 2020; and the percent increase of these projections, compared to year 2000.
2.2.3 Regulatory Requirements In addition to population and employment growth, the City also considered the regulatory framework (existing and future) as a facilities planning parameter. Table 2-4 provides a summary of the resulting priority issues identified for the IRP at the time of alternative development (Spring 2003). The IRP team recognizes that these issues continue to change in status and priority. Also refer to the document titled, “Regulatory Forecast Technical Memorandum” (CH:CDM, May 2003) is included in the Facilities Plan Volume 1: Wastewater Management, which provides detailed discussion of these issues.

Section 2 Wastewater Management
2-6 Summary Report Section 2 - Wastewater.doc
Table 2-3 Summary of Employment Projections and Percent Increase Compared to 2000
Employment Projection for IRP1 Tributary Area
2000 2005 2010 2015 2020 Hyperion Service Area 2,284,126 2,382,000 2,475,451 2,538,351 2,584,503 Terminal Island Service Area 45,383 47,691 49,728 51,092 51,995 Total (HSA + TISA) 2,329,509 2,429,691 2,525,179 2,589,443 2,636,498
Estimated Percent Increase In Employment Compared to Year 2000 Tributary Area
2000 2005 2010 2015 2020 Hyperion Service Area -- 4% 8% 11% 13% Terminal Island Service Area -- 5% 10% 13% 15% Total (HSA + TISA) -- 4% 8% 11% 13% 1Based upon SCAG-01 projections
Table 2-4 Summary of Priority Regulations and Key Policy Issues for the Wastewater Program
Priority Issues1 Revised Phase of
Program Timing of Issue Beneficial use designations for all water bodies and narrative standards in the Basin Plan Current
As National Pollutant Discharge Elimination System (NPDES) Permits are Renewed
Clean Water Act 303(d) listings for all water bodies (including urban lakes)
Current/ Proposed Every 4 Years
Total Maximum Daily Load (TMDL) Development - Draft Strategy for Developing TMDLs and Attaining Water Quality Standards in the Los Angeles Region
Current and Proposed
Per Consent Decree – with a proposal to bundle different pollutant TMDLs for the same watershed and as NPDES Permits are Renewed
Clean Water Enforcement and Pollution Prevention Act of 1999, as amended in 2000 by SB2165
Current
Current and ongoing for all effluent limits in NPDES permits unless Time Schedule Order (TSO) in place
California Toxics Rule and the State Implementation Plan for the Inland Surfaces Waters and the Enclosed Bays and Estuaries of California Emerging As NPDES Permits are Renewed Local County Ordinances on land application of Biosolids – Must be Class A/May have even stricter restrictions on quality and application—Exceptional Quality Current/Emerging 1 to10 years Prohibition of bypass of the headworks for sanitary sewage and promulgation of Sanitary Sewer Overflow regulation for management of sanitary collection systems
Current and Proposed New Regulation ~18 months
Sanitary System Management Plans in NPDES Permits Emerging As NPDES Permits are Renewed Enforcement of Pretreatment requirements and standards on satellite systems Proposed As NPDES Permits are Renewed Groundwater Recharge, notification levels, requirements and public health goals for nitrogen and TOC; new pollutants, endocrine disrupters and pharmaceutically active chemicals
Proposed/ Crystal Ball With Adoption of SSO Rule early in 2005
VOCs & Ammonia from Biosolids Composting Facilities (Rule 1133) consistent with AB 1450 Current/Emerging 1-5 years Odor as a result of VOCs & H2S from treatment plants and collection systems General Order # 034 from AQMD and potential for requirements from LARWQCB in NPDES permits
Current/ Crystal Ball 2-20 years
1See IRP Facilities Plan – Volume 1: Wastewater Management for detailed discussion of these priority issues
Section 2 Wastewater Management
2-7
Section 2 - Wastewater.doc Summary Report
Additionally, the potential changes to the discharge permits for Tillman, LAG, and Hyperion, as well as current and future regulations related to the wastewater collection system were considered.
2.3 Guiding Principles Affecting Wastewater Management
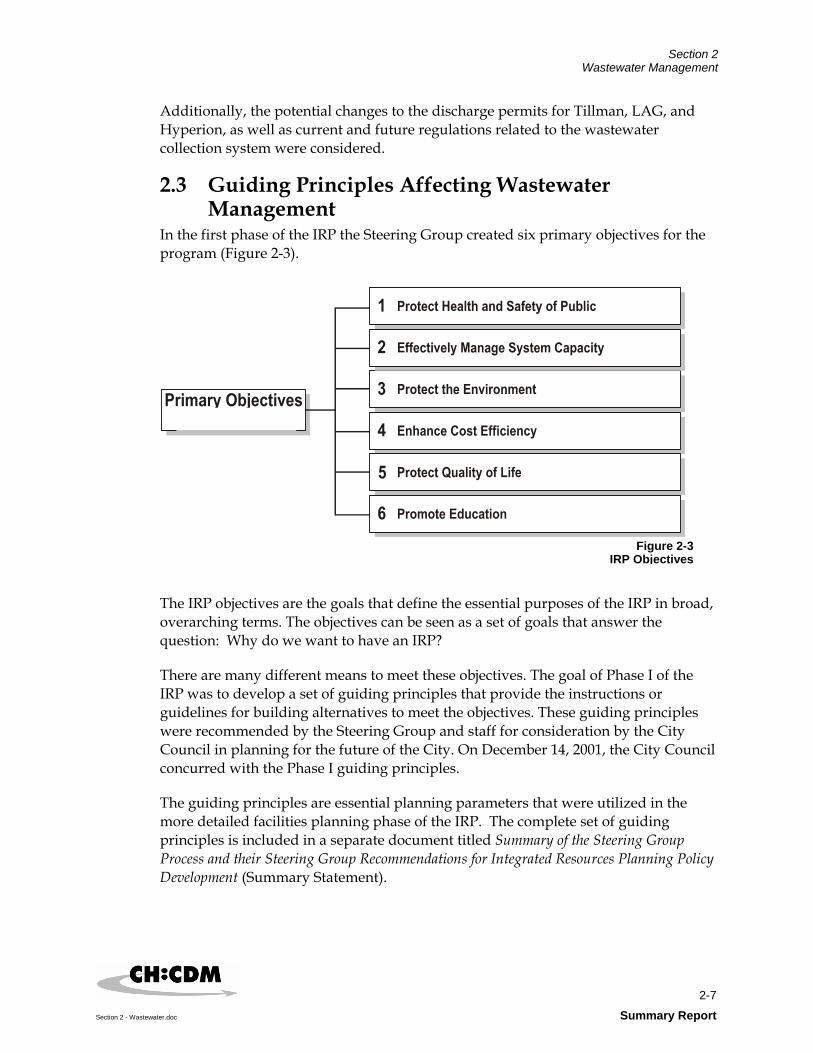
In the first phase of the IRP the Steering Group created six primary objectives for the program (Figure 2-3).
The IRP objectives are the goals that define the essential purposes of the IRP in broad, overarching terms. The objectives can be seen as a set of goals that answer the question: Why do we want to have an IRP?
There are many different means to meet these objectives. The goal of Phase I of the IRP was to develop a set of guiding principles that provide the instructions or guidelines for building alternatives to meet the objectives. These guiding principles were recommended by the Steering Group and staff for consideration by the City Council in planning for the future of the City. On December 14, 2001, the City Council concurred with the Phase I guiding principles.
The guiding principles are essential planning parameters that were utilized in the more detailed facilities planning phase of the IRP. The complete set of guiding principles is included in a separate document titled Summary of the Steering Group Process and their Steering Group Recommendations for Integrated Resources Planning Policy Development (Summary Statement).
Figure 2-3IRP Objectives

Section 2 Wastewater Management
2-8 Summary Report Section 2 - Wastewater.doc
The wastewater planning effort focused on the several of the guiding principles that are specific to wastewater management, as follows:
Building new wastewater facilities “upstream” in the system
Under all conditions, there will be a need to construct and operate new or expanded wastewater facilities. Through the IPWP process, it has been shown that facilities placed upstream in the system offer greater opportunities for system operational flexibility, for beneficial reuse of treated effluent, and for reducing dependency on imported water for such uses as irrigation, industrial use, etc. Because there are adequate solids treatment processes downstream at the HTP and TITP, it was assumed that these new upstream treatment facilities would not include solids treatment processes.
Producing and using as much recycled water as possible from the existing and planned facilities
Reducing the amount of rainfall-dependent inflow and infiltration as much as possible
Beneficially reusing biosolids
Focusing on lower-cost solutions within the framework of the policy elements noted above
2.4 Wastewater Flow Projections To plan for future wastewater conveyance and treatment needs, it was necessary to estimate the amount of wastewater that will be generated. In developing wastewater flow estimates, the IRP considered three distinct categories of wastewater flow. Their definitions, and how they are used in the IRP, are as follows:
Average Dry Weather Flow (ADWF) – ADWF represents the estimated annual average flows for residential and commercial sanitary flows, average groundwater infiltration (GWI), and industrial flows. Historical residential and employment per capita flow rates were used to develop the ADWFs, which were estimated using the City’s Sewer Flow Estimating Model (SFEM). The ADWF were used to evaluate treatment plant process capacities.
Peak Dry Weather Flow (PDWF) – PDWF represents the diurnal flow patterns typically found in wastewater collection systems. PDWFs are estimated using the City’s Model of Urban Sewer System (MOUSE), which includes and has been calibrated to the City’s primary sewer system. PDWF is the basis for selecting pipe size in the IRP planning studies when increased conveyance capacity is needed. These sizes should be refined in more detailed studies and designs. See Section 2.4.

Section 2 Wastewater Management
2-9
Section 2 - Wastewater.doc Summary Report
Peak Wet Weather Flow (PWWF) – PWWF is the sum of the PDWF and the rainfall-dependent infiltration and inflow (RDI/I), which occurs during storm events. A 10-year storm and an estimate of the magnitude of RDI/I into the system are used for estimating future PWWFs. RDI/I includes two components: stormwater inflow (SWI) and rainfall dependent infiltration (RDI). PWWF is used for the analysis of collection system and treatment plant hydraulic capacities. See Section 2.4.
A summary of the projected ADWF in the HSA (including major sub basins in the service area) and TISA is provided in Table 2-5.
Table 2-5 Summary of Average Dry Weather Flow (ADWF) Projections ADWF (mgd)
Tributary Area 2000 2005
Percent of Total Flow Increase in
20051 2010
Percent of Total Flow Increase in
20101 2015
Percent of Total Flow Increase in
20151 2020
Percent of Total Flow Increase in
20201 Hyperion Service Area (HSA) TWRP Shed 88.3 92.4 21% 96.1 22% 99.8 23% 104.4 23% Valley Spring Lane / Forman Avenue Shed 47.5 49.5 10% 51.7 12% 53.7 12% 56.1 12% LAGWRP Shed 30.3 31.9 8% 32.9 7% 33.7 7% 34.8 6% Tunnel Shed 41.6 43.1 8% 44.5 8% 45.9 8% 47.8 9% Coastal Interceptor Sewer Shed 22.7 23.6 5% 24.2 4% 24.8 4% 25.5 4% Metro Shed 212.6 221.3 45% 227.9 43% 234.5 43% 243.0 43% Total HSA 443.1 461.8 96% 477.3 96% 492.3 96% 511.5 96% Terminal Island Service Area (TISA) 17.1 17.8 4% 18.4 4% 19.0 4% 19.9 4% Total (HSA + TISA) 460.2 479.6 100% 495.7 100% 511.3 100% 531.4 100%
Note: 1 % increase is from year 2000 of Total (HSA + TISA) Example calculation: [104.4-88.3)/(531.4-460.2)] x 100 = 23%
2.5 Existing Collection System The City's wastewater collection system includes approximately 6,500 miles of major interceptors and mainline sewers, 46 pumping plants, and various other support facilities, such as maintenance yards and diversion structures. Approximately 650 miles of the City’s sewers are primary sewers, which by definition range in size from 16-inches to over 12½ feet in height or diameter. The rest of the sewers (approximately 5,850 miles) are smaller secondary sewers that by definition range in diameter from 6-inches to 15-inches. The backbone of the City's collection system is comprised of the major interceptor and outfall sewers in the HSA.

Section 2 Wastewater Management
2-10 Summary Report Section 2 - Wastewater.doc
Figure 2-4 shows the major interceptor and outfall sewers and treatment/reclamation plants within HSA. The collection system in the TISA includes numerous pumping plants and force mains.
The PDWF evaluation of the existing collection system identified the major interceptor and outfall sewers in the wastewater service area and the percent full they would operate under during PDWF conditions (see Figure 2-5).
The City also has ongoing conditions assessment programs to monitor and evaluate the hydraulic flow and structural condition of the collection system.
2.6 Collection System Options Collection system planning for the IRP focused on the City's major interceptor and outfall sewers within the HSA. The ability of the collection system to convey wastewater flows in the year 2020 is a function of the other hydraulic elements of the system, such as treatment, storage, and flow routing. To determine future system needs and develop options to address these needs, a step-wise approach to evaluating the sewer capacities under various hydraulic scenarios was conducted using MOUSE hydraulic model runs for dry and wet weather scenarios for current and future flow conditions.
The initial identification of collection system needs to accommodate the projected year 2020 PWWFs was based on the City’s standard practice of collection system planning as defined Sewer Design Manual, Section F250, stated as follows:
"Sewers shall be sized so the depth of the PDWF, projected for the design period, shall be no more than one half the pipe diameter (d/D = 0.5). Where upstream treatment and/or storage reservoirs are planned or available, their effect on reducing peak flows shall be considered in sizing downstream sewers."
Using this planning parameter and the various treatment scenarios (including upstream treatment expansion, expanding Tillman, expanding LAG, or constructing a new reclamation plant), initial options for addressing year 2020 major collection system needs were developed by modeling "bookends" of potential options using the MOUSE model. Bookend Option 1 reflects a system configuration with the maximum anticipated upstream flow diversions (additional treatment and storage capacity), which would minimize the downstream collection system needs. Bookend Option 2 reflects a system configuration with minimum anticipated upstream flow diversions, where maximum flow is conveyed through the downstream collection system to HTP.

������������������ ��������������
��������������������������������������������
����������������� �!"� !"#"$��$""#�$��"#%�&"�'�%���($)�#" �(�� $�! !�($
* + * , �����
�
�$!"�# !"'#"�(�#&"�- $����#"./0
������������� �����&����1-�� ������
�
�
�
�
�����������
��������������
���������������
�����
�����������������
��������������
!"#��$ -��- $'!#" !�"$!
- $!
&��
&(�
$&(�
"%��
�2��
%(#�"%#�
-&���#�
%(#�
"&��
$(#�
�- ��
-&��%#
�
$(�
%(#�$(�
$(�
$"��
$(�
$(�
"#��
$2��
$(�
$(�
%"#�($!���
�����������
�)��
$"��2��
%�-��
!�������������2����������3��� ���
�
% --"4�#�$�-$5�(#"� $ %"'�%"#��($�!#�&!�#"
$���62���� ���7$2��8
���� ���#����1�� ��7�#�8����-�� ������������������� ��7�- ��8����6���/2���� ���������������� ��7�2��8%�����(��1���#����1�� ��7%(#�8$����6(��1����� ��7$(�8$���6(��1���#����1�� ��7$(#�8$���6&������(��1���������7$&(�8
-�&������������������� ��7-&��8
"���%�����#����1�� ��7"%#�8"���%������������������ ��7"%��8&������(��1����� ��7&(�8&������������������� ��7&��8 ���������%�����(��1���#����1�� ��7 %(#�8
������������������� ��7���8
"����#��9������������� ��7"#��8
"���&������������������� ��7"&�������&�����������8
$���6����������������� ��6�����7$"��2��/�������8&���������&����1��������'���6��������
%�����������-��������������7%�-��/�������8��������5)�����9������������� ��7�)��/�������8
%������
$���6����������������� ��7$"�������&�����������8
2����������3��� �����:���� ���
&����1-�� ������)�������!�����������������3��� ���

Hyperion-Coastal Sewershed
Los Angeles-Glendale Sewershed
VSL/FA Sewershed Tillman Sewershed
Tillman Sewershed
Terminal Island Sewershed
Tunnel Sewershed
Percent of Sewer Full in 2020
> 100% Full
75% to 100% Full
50% to 75% Full
< 50% Full
Force Main
(Segments not modeled are shown in white)
* Assuming derating due to planned nitrification/denitrification projects
Estimated Year 2020 AverageDry Weather Flows
Sewer Currently Under Construction
City of Los Angeles Boundary
Sewer Drainage Areas
Hyperion-Metro Sewershed
5
1
2
4
3
Wastewater System Flows and Capacity Gaps in Year 2020
405
210
110
710
105
605
10
27
19
91
72
107
213
42
2
170
1
2
Terminal Island Treatment Plant(current capacity 30 mgd)
Hyperion Treatment(current capacity 450 mgd)
Plant
LA/GlendaleWater Reclamation Plant(current capacity 15 mgd)
TillmanWater Reclamation Plant
(current capacity 64 mgd*)
Valley Spring Ln/Forman AveDiversion Structures
100%0%
104m
gd
48 mgd
56m
gd 35m
gd
243 mgd
25m
gd
20m
gd
Figure 4-6

Section 2 Wastewater Management
2-13
Section 2 - Wastewater.doc Summary Report
These bookend options provide a starting point for identifying variations of these options to match treatment plant option permutations and are described below:
Bookend Option 1 - Wet Weather Storage with Upstream Expansion For the treatment system scenario with upstream expansion of TWRP and LAG to Micro-Filtration/Reverse Osmosis, and wet weather storage at both plants, the collection system modifications were determined through a series of dry and wet weather MOUSE model runs. The resulting plant configurations for this scenario were as follows:
TWRP: 120 mgd with 6.5 percent sludge return to the downstream collection system and 25 percent MF/RO brine return; 30 million gallons of wet weather storage.
LAG: 30 mgd with 5.8 percent sludge return and 25 percent MF/RO brine return; 20 million gallons of storage.
HTP: 450 mgd.
Based on this scenario, the following collection system components were deemed to be needed for the treatment scenario with upstream plant expansions and wet weather storage:
Glendale-Burbank Interceptor Sewer (GBIS)
Northeast Interceptor Sewer Phase II (NEIS II)
Vermont Avenue Relief Sewer (VARS)
Bookend Option 2 - Maximum Conveyance to HTP For the treatment system scenario that maximizes conveyance to HTP, TWRP was assumed to be maintained at its existing derated capacity with MF/RO added and LAG was assumed to be operated as a skimming plant. A skimming plant operates during dry weather to produce recycled water for end users. However, during wet weather when end users are likely to be minimal since they are primarily for irrigation, the entire flow must be able to be conveyed back to the downstream collection system. The skimming plant was assumed to effectively have no flow diversion capacity during wet weather.
Collection system modifications were determined through a series of dry and wet weather MOUSE model runs. The resulting plant configurations for this scenario are as follows:
TWRP: 64 mgd with 6.5 percent return sludge and 25 percent brine return
LAG: 0 mgd

Section 2 Wastewater Management
2-14 Summary Report Section 2 - Wastewater.doc
HTP: 550 mgd
For this scenario, collection system capacity from TWRP to LAG needed expansion. The VARS was found to be needed to provide relief to the south branch of the North Outfall Sewer (NOS) at the Maze area. The following collection system components were determined to be needed for the treatment scenario with conveyance of maximum flows downstream and HTP expansion:
Valley Spring Lane Interceptor Sewer (VSLIS)
GBIS
NEIS II
Vermont Avenue Relief Sewer (VARS)
2.7 Existing Treatment Facilities An essential tool for the IRP is the wastewater treatment and effluent discharge facility capacities. There are six wastewater treatment facilities within the wastewater service area. Five treatment plants are within the HSA as follows:
Hyperion Treatment Plant (HTP) in Playa del Rey.
Donald C. Tillman Water Reclamation Plant (TWRP) in the Sepulveda Basin in Van Nuys.
Los Angeles-Glendale Water Reclamation Plant (LAGWRP) across the Golden State freeway from Griffith Park.
Burbank Water Reclamation Plant (BWRP) in the City of Burbank.
Los Angeles Zoo Treatment Facility (LAZTF) in Griffith Park.
The sixth treatment plant, TITP, serves the TISA and is in the vicinity of the Los Angeles Harbor. The locations of the HTP, TWRP, LAGWRP, and TITP are shown in Figure 2-1.
The HSA includes three plants operated by the City of Los Angeles: TWRP, LAGWRP and HTP. The TWRP treats flows from the San Fernando Valley. The LAGWRP serves the Glendale/Burbank area and can treat excess flows that by-pass the TWRP. The HTP serves the central Los Angeles area, treats excess flows from the San Fernando Valley and Glendale/Burbank area, and processes solids from the TWRP, LAGWRP, BWRP, and LAZTF.

Section 2 Wastewater Management
2-15
Section 2 - Wastewater.doc Summary Report
The BWRP is owned and operated by the City of Burbank and the Los Angeles Zoo operates its own treatment plant. The TITP serves the TISA, which includes the Los Angeles Harbor, and nearby communities, including San Pedro and Wilmington.
2.7.1 Hyperion Treatment Plant The HTP is located adjacent to Los Angeles World Airport in the beach community of Playa Del Rey, and is the City’s oldest and largest wastewater treatment facility. HTP, shown in Figure 2-6, is located on a 144-acre site adjacent to the Pacific Ocean. The plant is bounded on the north by Imperial Highway, on the west by Vista Del Mar, on the south by the Scattergood Power Plant, and on the east by the City of El Segundo.
The HTP is a full-secondary, high-purity-oxygen, activated sludge treatment plant with unchlorinated ocean discharge. HTP was designed to provide full secondary treatment for a maximum-month flow of 450 mgd (which corresponds to and ADWF of 413 mgd) and PWWF of 850 mgd. Biosolids removed during treatment of the wastewater are treated by anaerobic digestion, and are then dewatered and trucked offsite for use through a diversified management plan utilizing 100 percent beneficial use. The biosolids produced at HTP are Class “A.”
The HTP provides preliminary, primary, secondary, and solids handling facilities. The basic unit processes include:
Preliminary Treatment: Flow metering, screening, grit removal.
Primary Treatment: Flow metering, primary sedimentation, and raw sludge and scum removal and conveyance.
Secondary Treatment: Intermediate pump station, oxygen reactors, oxygen generation and storage, final sedimentation, return activated sludge (RAS) and waste activated sludge (WAS) piping, and WAS thickening.
Effluent Discharge System: Effluent pumping plant, one-mile emergency outfall, five-mile outfall, emergency storage facility and by-pass channels from primary clarifiers to effluent discharge system.
Solids Handling and Treatment: WAS thickening, anaerobic digesters, sludge screening, sludge dewatering, dewatered sludge storage and truck loading facility, and digester gas handling.
The IRP utilized simulation modeling in the planning effort for HTP’s treatment system; specifically, to evaluate existing wastewater treatment capacities; identify process bottlenecks and modifications; assess potential innovative treatment technologies; and evaluate options that provide upstream satellite treatment capabilities.

Figure 7-1H
yperion Treatment Plant Site Plan

Section 2 Wastewater Management
2-17
Section 2 - Wastewater.doc Summary Report
The results of the liquid process train model runs indicate that, with a capacity of 350 to 450 mgd, the secondary clarifiers are the main bottleneck for increased flow capacity through the plant. The addition of the anaerobic selector zones to the biological reactors is assisting in resolving the issue. These improvements along with operational adjustments to balance the amount of filaments in the sludge will potentially allow the liquid process train to handle greater than 450 mgd. It may also be possible to improve the existing secondary clarifiers to achieve additional performance by implementing modifications to the mixing baffles.
With the addition of more secondary clarifiers, the treatment capacity could be increased to approximately 600 mgd based on the limitations of the primary clarifiers.
The results also indicated that the secondary reactors, even with the change to anaerobic selectors, will not limit the capacity of the plant until the capacity is well over 900 mgd (or new treatment requirements are instituted).
The solids process train modeling results indicated that primary sludge thickening can significantly expand the capacity of the existing digesters (up to 500 mgd firm). However, treatment redundancy will need to be addressed.
2.7.2 Donald C. Tillman Water Reclamation Plant (TWRP) The TWRP is located in the San Fernando Valley on a 91-acre site within the Sepulveda Flood Control Basin in Van Nuys (see Figure 2-7). The plant site is south of Victory Boulevard, between Woodley Avenue and the San Diego Freeway (Interstate 405). TWRP is bounded on a 52-acre portion of the site by a retaining wall on the south and west, which protects the plant against floods in the Sepulveda Basin.
The TWRP is an upstream full tertiary treatment facility with capacity to provide Title 22 tertiary treatment for a rated average dry weather flow of 80 mgd. The TWRP provides preliminary, primary, secondary and tertiary treatment. The basic unit processes include the following:
Preliminary Treatment: Screening, grit removal, influent pumping.
Primary Treatment: Primary sedimentation, scum removal, equalization.
Secondary Treatment: Air activated sludge, final sedimentation.
Tertiary Treatment: Coagulation, filtration, disinfection, dechlorination.
TWRP does not process solids; rather, solids are discharged to the sewer system for conveyance and processing at HTP. Improved treatment process upgrades (nitrification/denitrification) are being implemented at TWRP.

Figur 7-9Tillman Water Reclamation Plant Site Plan

Section 2 Wastewater Management
2-19
Section 2 - Wastewater.doc Summary Report
An evaluation of the existing facilities at the TWRP was performed to determine available process and hydraulic capacity or limitations based on increased influent flows. The results indicated that the secondary clarifiers and the tertiary filters are the major unit process with capacity limitations for the liquid process train. With respect to the secondary clarifiers, pilot-testing results showed that the increased load on the secondary clarifiers from the nitrification/denitrification (NdN) converted aeration tanks (due to the higher mixed liquor concentration) will decrease the available capacity by approximately 20 percent (from 80 mgd to 64 mgd).
The tertiary filters reduced capacity stems from discussions with and experience of City personnel. It is the operational experience that the filters cannot consistently meet effluent turbidity requirements at flows greater than 64 mgd. The filters also have hydraulic constraints of 100 to 120 mgd during PWWF events.
The modeling efforts determined that the aeration tanks themselves should be able to treat up to the original capacity of 80 mgd with the addition of more secondary clarifiers. The IRP assumes that the existing capacity at TWRP is 64 mgd, based on limitations of the secondary clarifiers and tertiary filters. Pilot testing for NdN in 2006 indicated that TWRP may not require capacity derating to 64 mgd from 80 mgd.
2.7.3 Los Angeles-Glendale Water Reclamation Plant The LAGWRP is located at the southeast junction of the LA River and Colorado Boulevard between Griffith Park and the City of Glendale. The LAGWRP is bounded to the west by the City of Burbank/City of Los Angeles border, to the north by the La Canada/Flintridge area, to the east by the Glendale/Pasadena border, and to the south by the Griffith Park area. Figure 2-8 shows an aerial view of the plant.
In 1968, the cities of Los Angeles and Glendale joined resources to build the first water recycling plant in Los Angeles. The LAGWRP has been operating since 1976 and began operation at full capacity in 1986. The LAGWRP is a full tertiary treatment facility with capacity to provide tertiary effluent for an ADWF of 20 mgd. The LAGWRP provides preliminary, primary, secondary and tertiary treatment. The basic unit processes include:
Primary Treatment: Primary sedimentation, scum removal.
Secondary Treatment: Air activated sludge, final sedimentation.
Tertiary Treatment: Coagulation, filtration, disinfection, dechlorination.
The LAGWRP receives its influent wastewater from the NOS, thus providing hydraulic relief for the downstream interceptor conveyance facilities and the HTP, while producing recycled water. The disinfected plant effluent is pumped to the recycled water distribution system or flows by gravity to the LA River. All solids removed from the treatment process are returned untreated to the NOS for downstream treatment at the HTP.


Section 2 Wastewater Management
2-21
Section 2 - Wastewater.doc Summary Report
An evaluation of the existing facilities at the LAGWRP was performed to determine available process and hydraulic capacity or limitations based on increased influent flows. The results of these efforts indicated that the secondary clarifiers are the major unit process with capacity limitations for the liquid process train. Pilot testing results showed that the increased load on the secondary clarifiers from the NdN converted aeration tanks (due to the higher mixed liquor concentration) will decrease the available capacity by approximately 25 percent (from 20 mgd to 15 mgd).
The modeling efforts determined that the aeration tanks themselves should be able to treat up to the original capacity of 20 mgd with the addition of more secondary clarifiers. The IRP assumed that the existing LAGWRP capacity is 15 mgd, based on the secondary clarifiers. Pilot testing for NdN in 2006 indicated that LAG may not require capacity derating to 15 mgd from 20 mgd.
2.7.4 Terminal Island Treatment Plant The TITP is located on Terminal Island, which is approximately 20 miles south of downtown Los Angeles. It is situated on a 19.8-acre site at the northwest corner of Terminal Way and Ferry Street (see Figure 2-9).
The TITP serves the harbor area and has been operating since the 1935. Built originally as a primary facility, the plant was upgraded and expanded to secondary treatment (1973), to tertiary treatment (filtration) (1996), and to 6 mgd of advanced treatment (microfiltration and reverse osmosis) (2001). The TITP provides preliminary, primary, secondary, tertiary, advanced and solids handling and treatment facilities. The basic unit processes include:
Preliminary Treatment: Flow metering, screening, grit removal.
Primary Treatment: Flow metering, primary sedimentation, and raw sludge and scum removal and conveyance.
Secondary Treatment: Air activated sludge, final sedimentation, and RAS, and WAS piping and WAS thickening.
Tertiary Treatment: Deep-bed, multi-media filters.
Advanced Treatment: Microfiltration and Reverse Osmosis (MF/RO).
Effluent Discharge System: Effluent outfall to Los Angeles Harbor.
Solids handling and Treatment: WAS thickening, anaerobic digesters, sludge screening, sludge dewatering, dewatered sludge storage and truck loading facility, and digester gas handling.

Figure 7-15
Terminal Island Treatm
ent Plant Existing Site Plan

Section 2 Wastewater Management
2-23
Section 2 - Wastewater.doc Summary Report
Currently, TITP has the capacity to provide tertiary treatment (secondary treatment and filtration) for an ADWF of 30 mgd. A portion of TITP effluent currently undergoes advanced treatment (microfiltration/reverse osmosis) and is recycled, with the tertiary treated effluent discharged to the Los Angeles Harbor. Future advance treatment process modifications at TITP will allow the plant to recycle more wastewater and eventually eliminate effluent discharge to the Los Angeles Harbor. Solids are thickened, anaerobically digested, dewatered, and beneficially used by land application and reuse as a soil amendment.
2.8 Treatment Options The future wastewater flows to be treated by the City in the year 2020 were estimated to be 531 mgd for ADWF. The HSA would produce the majority of this flow at 511 mgd for ADWF. Figure 2-5 above also shows future wastewater flows by service area sub basins. To manage these future wastewater flows in the HSA, the Phase I (Integrated Plan for the Wastewater Program) guiding principles recommended building new wastewater facilities upstream in the system as well as focusing on lower-cost solutions.
The City evaluated the treatment options at each treatment plant, given the future anticipated wastewater flows, treatment plant limitations, and the Guiding Principles. For the HSA, four treatment options that were investigated for the Phase II IRP include:
1. New upstream water reclamation plant(s).
2. Expansion of the existing upstream treatment facilities TWRP and the LAGWRP.
3. Expansion of HTP.
4. Some combination of any or all of the above options.
The first step in developing the treatment options was to identify the needs or “gaps” in the treatment system. As indicated above, the total wastewater flow was estimated to be 531 mgd to the City treatment facilities, with the HSA estimated to be 511 mgd. The treatment facilities (TWRP, LAGWRP, HTP, and TITP) have a total capacity of about 550 mgd (520 mgd in HSA). This assumes the capacity reductions at TWRP and LAGWRP, as well as the discharge of the waste sludge to HTP for treatment.
These totals seemed to indicate that there is no need for expansion or upgrade of any facilities. However, National Pollutant Discharge Elimination System (NPDES) permit limits for TWRP and LAGWRP may require that those plants be upgraded to advanced treatment to discharge to the LA River. In this case, the options may include converting a portion or all of the plants to recycled water only with no LA River discharge. However, some recycled water must continue to be discharged to the Los Angeles River to support river habitat, so complete elimination of river discharge is not feasible. If the plants are upgraded to advanced treatment, an option may include

Section 2 Wastewater Management
2-24 Summary Report Section 2 - Wastewater.doc
discharge of the waste brine to the sewer for treatment at HTP. Either of these cases will reduce the effective capacities of TWRP and LAGWRP. A worst-case application of these changes could lower the total system capacity to about 507 mgd (496 mgd in HSA). To handle this reduction in effective capacity, some expansion and upgrade within the treatment system was assumed to be required.
Another factor that was considered was the possible future diversion of dry weather urban runoff (DWUR) to the wastewater system. This is already being planned and constructed for areas in the Santa Monica Bay Watershed (see Runoff Management Volume). At a minimum, the amount of DWUR diversion would be about 8 mgd from these coastal diversions (in the HSA only). If DWUR within the rest of the City were diverted to the wastewater system, an additional 44 mgd would be added. If DWUR from the entire watersheds, which flow through the City, were also diverted, that would be an additional 29 mgd. Therefore, the range of possible DWUR flows is 8 to 81 mgd. The increased estimated year 2020 HSA flows would be 519 to 592 mgd. Again, it was assumed that these increases may require expansions and upgrades to the facilities.
One last factor that was considered in determining the system “gaps” was the effect of the treatment facilities on the collection system. The primary needs in the collection system are upstream of TWRP, downstream of TWRP to the Valley Spring Lane/Forman Avenue (VSL/FA_ gate, the Tunnel downstream of the VSL/FA gate to HTP. Options at the upstream treatment plants or a new plant may provide relief of the last two collection system needs.
2.8.1 HTP Treatment Options The two basic options for HTP were determined to be either expansion or no expansion. As the influent flows to HTP are affected by the operation of the upstream water reclamation plants TWRP and LAGWRP, the need to expand HTP is determined by the treatment capacity of these facilities and the resulting flow to HTP. Figure 2-10 illustrates the interrelationship between the upstream plants and HTP.
The no expansion option would primarily be associated with the options of expansion at the upstream plants or construction of a new facility (or facilities), which would result in a flow at HTP of less than its current dry weather capacity of 450 mgd.
For the expansion of HTP, the buildout capacity of HTP was assumed to be about 550 mgd for ADWF, based on information presented in the last published Wastewater Facilities Plan (DMJM/BV, 1990) and discussions with HTP plant, Wastewater Engineer Services Division (WESD), and Environmental Engineering Division (EED) staff.
The first step in developing the option to expand HTP to 550 mgd was to identify the unit processes that would require upgrades. The higher influent flow rate of 550 mgd was inputted into the planning model. The individual processes were then evaluated to determine the "bottlenecks" or shortfalls.

Section 2 Wastewater Management
2-25
Section 2 - Wastewater.doc Summary Report
The results of the evaluation are indicated in the following:
Between 2 and 8 additional secondary clarifiers would be needed in the future. While the existing configuration of the secondary clarifiers is circular. Any new secondary clarifiers may be rectangular, due to possible space savings and enhanced treatment capacity with this configuration.
New secondary clarifiers would first be located in the parking lot just north of Reactor Module 9. After this space is filled, they will either be placed in the location of the existing emergency storage basins just west of the parking lot or in the location of the former administration building. Another possibility is to demolish two reactor modules (since there is excess capacity) and place the new clarifiers in the resulting space. Either way, installation of new clarifiers will present a challenge with respect to the flow conveyance from the reactors. Further study will be needed in the future on this topic.
Between 6 to 12 additional modified egg shaped digesters would be needed depending on redundancy requirements. The location of the new modified egg shaped digesters will start in the area of the existing Conventional Digester Battery C and be in line with the existing modified egg shaped digesters.
2.8.2 WRP Treatment Options In the initial development of the options for the upstream treatment facilities three factors were considered: the projected year 2020 flow generated by the tributary area
Figure 2-10Interrelationship of Upstream Plants with Hyperion Treatment Plant

Section 2 Wastewater Management
2-26 Summary Report Section 2 - Wastewater.doc
(including potential dry weather urban runoff diversion), the recycled water demand, and environmental goals.
The general assumptions used for evaluating the TWRP treatment options were as follows:
Any discharge to the LA River requires advanced treatment.
Assume brine disposal will be discharged to the sewer. Note that further study will be needed to determine the effects on HTP. A local or regional brine line will be considered as an alternate.
Other recycled water applications must only meet current Title 22 requirements, except for groundwater replenishment which would require advanced treatment if implemented.
Discharge limits will be the same for dry and wet weather at the upstream facilities. Note that currently they have a different limit for turbidity during storm events, which gives them the option to bypass the tertiary filters. However, all the other constituents in the 1998 NPDES Permit do not have different limits.
Nitrification/ denitrification (NdN) conversion is considered to be an existing situation.
NdN conversion at TWRP will require derating by 20 percent.
Replacement of tertiary filters at TWRP is considered to be the existing situation.
Waste sludge discharged back to sewer is assumed to be 6.5 percent of influent flow for TWRP. The sludge waste is based on historical information provided by the City.
The assumed brine return rates are 10 percent for MF and 15 percent for RO.
The evaluation determined that there are three general options for TWRP are as follows:
A. No expansion or advanced treatment upgrade.
B. Full advanced treatment upgrade
C. Adding storage to provide collection system and treatment relief during PWWF.
These three general options were further defined (see Table 2-6) for IRP Alternatives planning purposes.

Section 2 Wastewater Management
2-27
Section 2 - Wastewater.doc Summary Report
Table 2-6 Tillman WRP Options for the Year 2020
Description Rated ADWF
Capacity
Rated PWWF
Capacity Potential Recycled Water Produced***
1A No expansion or advanced treatment upgrade without operational storage
64 mgd* 0 mgd 64 mgd**
1B No expansion or advanced treatment upgrade with operational storage
64 mgd* 0 mgd 64 mgd
2A Partial advanced treatment upgrade without wet weather or operational storage
64 to 120 mgd* 27 to 90 mgd 51 to 92 mgd**
2B Partial advanced treatment upgrade with 60 mgd wet weather/ operational storage
64 to 120 mgd* 67 to 130
mgd 51 to 92 mgd
3A Full advanced treatment upgrade without wet weather or operational storage
64 to 120 mgd 64 to 120
mgd 51 to 92 mgd**
3B Full advanced treatment upgrade with 60 mgd wet weather/ operational storage
64 to 120 mgd 104 to 160
mgd 51 to 92± mgd****
Notes: * Depending on the recycled water demand ** Subject to diurnal constraints *** After brine and waste sludge discharge **** Could be more depending on operation of added storage
2.8.3 LAG Treatment Options As with other upstream plants, the evaluation of LAGWRP options also considered the same three factors: the projected year 2020 flow generated by the tributary area (including potential dry weather urban runoff diversion), the recycled water demand, and environmental goals.
The general assumptions used for the LAGWRP options were as follows:
Any discharge to the LA River requires advanced treatment.
Assume brine disposal will be discharged to the sewer. Note that further study will be needed to determine the effects on HTP. A local or regional brine line will be considered as an alternate.
Other recycled water applications must only meet current Title 22 requirements.
Discharge limits will be the same for dry and wet weather at the upstream facilities. Note that currently they have a different limit for turbidity during storm events, which gives them the option to bypass the tertiary filters. However, all the other constituents in the 1998 NPDES Permit do not have different limits.
Nitrification/ denitrification (NdN) conversion is considered existing situation.
NdN conversion at LAGWRP will require derating by 25 percent.

Section 2 Wastewater Management
2-28 Summary Report Section 2 - Wastewater.doc
Waste sludge discharged back to sewer is assumed to be 5.8 percent of influent flow for LAGWRP. The sludge waste is based on historical information provided by the City.
The assumed brine return rates are 10 percent for MF and 15 percent for RO.
The evaluation determined that there are three general options for LAGWRP are as follows:
A. No expansion or advanced treatment upgrade.
B. Expansion and no advanced treatment upgrade.
C. Full advanced treatment upgrade.
Table 2-7 lists the general LAGWRP options, which were used to develop the integrated IRP alternatives.
Table 2-7 Los Angeles-Glendale Water Reclamation Plant Options for the Year 2020
Description Rated ADWF
Capacity
Rated PWWF
Capacity Potential Recycled Water Produced***
1A No expansion or advanced treatment upgrade without operational storage
15 mgd* 0 mgd 15 mgd**
1B No expansion or advanced treatment upgrade with operational storage
15 mgd* 0 mgd 15 mgd
2A Expansion with no advanced treatment upgrade without wet weather or operational storage
15 to 50 mgd* 0 mgd 15 to 50 mgd**
2B Expansion with no advanced treatment upgrade with 20 mgd wet weather/ operational storage
15 to 50 mgd* 0 mgd 15 to 50 mgd
3A Full advanced treatment upgrade without wet weather or operational storage
15 to 50 mgd 15 to 50
mgd 11 to 36 mgd**
3B Full advanced treatment upgrade with 20 mgd wet weather/ operational storage
15 to 50 mgd 28 to 63
mgd 11 to 36± mgd****
Notes: * Depending on the recycled water demand ** Subject to diurnal constraints *** After brine and waste sludge discharge **** Could be more depending on operation of added storage

Section 2 Wastewater Management
2-29
Section 2 - Wastewater.doc Summary Report
2.8.4 TITP Options Because the TITP is currently operating at well below its capacity (the ADWF is 19 mgd whereas capacity is 30 mgd), TITP options were not required at this time.
2.8.5 New Water Reclamation Plant Options As with other upstream plants, planning for a new treatment facility considered the same three factors: the projected year 2020 flow generated by the tributary area (including potential dry weather urban runoff diversion), the recycled water demand, and environmental goals.
In order to help with the process of evaluating a site and new water reclamation plant (WRP), the IRP team posed the question, “What criteria should be used in evaluating a new WRP?” to the Steering Group, the Technical Advisory Committee (TAC) and the Management Advisory Committee (MAC). Table 2-8 summarizes the resulting criteria.
Table 2-8 Criteria for New and Upgraded Facilities
Category Description Location
Upstream VS. Downstream Generally, if the facility is located in or near the San Fernando Valley
Zoning/ Environmental Justice Appropriate zoning on actual site and within surrounding area. Consider also environmental justice issues
Not Using Existing Open Space Preferred to not use existing open space for new facility location. Look for opportunities for better use of site or creating open space
Low Cost Land Purchase Cost of land acquisition
Mitigation Cost of mitigation for public acceptance (i.e. buried tanks, architectural treatments, etc.)
Operational Excessive pumping, accessibility issues, etc.
High Beneficial Use of Water Resources Recycled Water Opportunities Proximity to recycled water demands
Runoff Treatment Opportunities Ability to intercept dry weather urban runoff Multiple Benefits Recreational Opportunity to include park, lake, wetlands, etc.
Commercial Opportunity to integrate with commercial possibilities for the site
Educational Opportunity for public education
Inter-Agency/Inter-Project Opportunities Opportunity for the integration with other agencies plans and projects (i.e. share costs, planning, etc.)
Environmental Opportunities to enhance the environment within Los Angeles
Revitalization/ Redevelopment Opportunities Opportunities to help revitalize and/or redevelop areas of Los Angeles
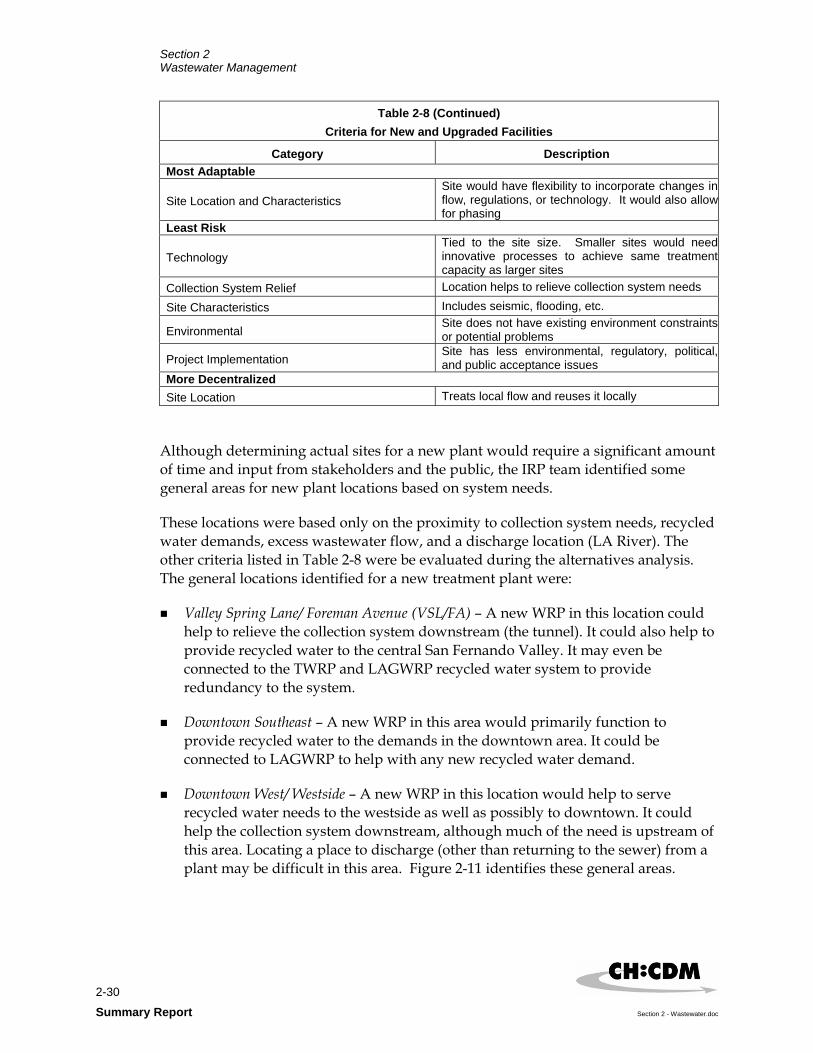
Section 2 Wastewater Management
2-30 Summary Report Section 2 - Wastewater.doc
Table 2-8 (Continued) Criteria for New and Upgraded Facilities
Category Description Most Adaptable
Site Location and Characteristics Site would have flexibility to incorporate changes in flow, regulations, or technology. It would also allow for phasing
Least Risk
Technology Tied to the site size. Smaller sites would need innovative processes to achieve same treatment capacity as larger sites
Collection System Relief Location helps to relieve collection system needs
Site Characteristics Includes seismic, flooding, etc.
Environmental Site does not have existing environment constraints or potential problems
Project Implementation Site has less environmental, regulatory, political, and public acceptance issues
More Decentralized Site Location Treats local flow and reuses it locally
Although determining actual sites for a new plant would require a significant amount of time and input from stakeholders and the public, the IRP team identified some general areas for new plant locations based on system needs.
These locations were based only on the proximity to collection system needs, recycled water demands, excess wastewater flow, and a discharge location (LA River). The other criteria listed in Table 2-8 were be evaluated during the alternatives analysis. The general locations identified for a new treatment plant were:
Valley Spring Lane/ Foreman Avenue (VSL/FA) – A new WRP in this location could help to relieve the collection system downstream (the tunnel). It could also help to provide recycled water to the central San Fernando Valley. It may even be connected to the TWRP and LAGWRP recycled water system to provide redundancy to the system.
Downtown Southeast – A new WRP in this area would primarily function to provide recycled water to the demands in the downtown area. It could be connected to LAGWRP to help with any new recycled water demand.
Downtown West/ Westside – A new WRP in this location would help to serve recycled water needs to the westside as well as possibly to downtown. It could help the collection system downstream, although much of the need is upstream of this area. Locating a place to discharge (other than returning to the sewer) from a plant may be difficult in this area. Figure 2-11 identifies these general areas.

Section 2 Wastewater Management
2-31
Section 2 - Wastewater.doc Summary Report
The general assumptions used for the new WRP options were as follows:
Any discharge to the LA River requires advanced treatment.
Assume brine disposal will be discharged to the sewer. Note that further study will be needed to determine the effects on HTP. A local or regional brine line will be considered as an alternate.
Other recycled water applications must only meet current Title 22 requirements.
Discharge limits will be the same for dry and wet weather at the upstream facilities.
Waste sludge discharged back to sewer is assumed to be 6.0 percent of influent flow for a new WRP.
The assumed brine return rates are 10 percent for MF and 15 percent for RO.
The three general options for a new WRP are similar to the options for LAGWRP and were as follows:
A. No new WRP
B. New WRP with no advanced treatment
C. New WRP with full advanced treatment
Table 2-9 lists the general options that were used to develop the integrated IRP alternatives.
2-11Initial General Areas for a New Water
Reclamation Plant

Section 2 Wastewater Management
2-32 Summary Report Section 2 - Wastewater.doc
Table 2-9 New Water Reclamation Plant Options for the Year 2020
Description Rated ADWF
Capacity Rated PWWF
Capacity
Potential Recycled Water
Produced*** 1A No new WRP 0 mgd 0 mgd 0 mgd
2A New WRP with no advanced treatment and without wet weather or operational storage
10 to 60 mgd* 0 mgd 9.4 to 56 mgd**
2B New WRP with no advanced treatment upgradewith wet weather/ operational storage
10 to 60 mgd* 0 mgd 9.4 to 56 mgd
3A New WRP with full advanced treatment andwithout wet weather or operational storage
10 to 60 mgd 10 to 60 mgd 7 to 42 mgd**
3B New WRP with full advanced treatment and wetweather/ operational storage
10 to 60 mgd 17 to 73 mgd 7 to 42± mgd****
Notes: * Depending primarily on the recycled water demand ** Subject to diurnal constraints ** After brine and waste sludge discharge *** Could be more depending on operation of added storage
2.9 Biosolids Management The approach used for evaluating biosolids management options is depicted in Figure 2-12. First, the existing biosolids management situation was reviewed, including an analysis of drivers, current biosolids production and quality and current management contracts. Following this, the available technologies for creating biosolids products were reviewed in parallel with the markets for these products. This then led to development of the recommended planning direction and associated cost projections and identification of potential triggers for change. The recommended strategy aimed to assist in providing direction for future biosolids management by the City in a manner that meets the goals and objectives of the City’s Biosolids Environmental Management System (EMS) and outlined in this task.
Several environmental goals were identified to guide the development of a sustainable biosolids management program. These goals were based on the City’s Biosolids EMS as follows:
Management should be in line with the Biosolids EMS
Comply with all regulations, federal, state and local
Provide good stewardship of resources - both biosolids and finances
Maximize the reliability of the long-term biosolids management program
Improve public perception and confidence
Realize innovative, cost-effective & environmentally sound ideas

Section 2 Wastewater Management
2-33
Section 2 - Wastewater.doc Summary Report
Figure 2-12
Biosolids Management Task Approach
Provide multiple processing options
Maintain in-basin management options
Continued use of private sector hauling and land application
Diversify markets
Identify and maintain back-up options
Various factors and drivers affecting biosolids management were considered in the development of biosolids management options, including existing biosolids quality, biosolids production quantities, regulations, public perception, product market options, and practices of other agencies. Technologies considered in the evaluation included the following:
Composting Heat Drying Chemical Treatment Pyrolysis Super Critical Water Oxidation
Gasification Combustion Renewable Energy Recovery Thermophilic Digestion
Market options considered included the following:

Section 2 Wastewater Management
2-34 Summary Report Section 2 - Wastewater.doc
Land Application for Non-food crops Land Application at City Farm, EQ
biosolids Horticulture - City Uses Horticulture – ornamental & nursery Horticulture – blending & bagging for
retail Silviculture – Shade Tree Program Biomass/Ethanol crops Citrus, avocado, vineyard & orchard
Ag-Lime Applications Direct Energy Erosion Control Direct Landfilling Landfill Partnering – Daily Cover Construction Market Non-construction Market Dedicated Land Disposal Fuel usage
The approach to evaluation of the biosolids management options for the City focused on coordinating two key aspects, the biosolids markets and the product technologies that can process the biosolids to form a product that is compatible with the available markets. Sustainable biosolids management needs to consider a business-type approach, where suitable markets are first identified and then the steps necessary to provide suitable products are implemented. The evaluation of biosolids management, therefore, first pre-screened the available biosolids product technologies to identify any that are inappropriate for further consideration in the IRP, and then identified the types of products provided by the range of technologies. This was followed by a more detailed ranking of the main product technology categories, to assistance in developing planning recommendations. A summary list of the product technologies and the preliminary screening conducted is provided in Table 2-10.
Table 2-10 Summary of Initial Screening of Biosolids Product Technologies
No. Process Appropriate for IRP 1 Thermophilic Digestion Y
2 Composting Y
3 Heat Drying Y
4 Solar Drying N – footprint, pathogen reduction control
5 Bactericides N – not EQ process, handling & dosing of toxin
6 Chemical Treatment Y
7 Combustion Y
8 Super Critical Water Oxidation Y
9 Gasification Y
10 Pyrolysis Y
11 Renewable Energy Recovery Y Note:
* For processes identified to be inappropriate, details were provided in the text below

Section 2 Wastewater Management
2-35
Section 2 - Wastewater.doc Summary Report
The results of the initial screening step showed that of the 11 broad categories of product technologies, two were considered to have fatal flaws, while nine categories were carried forward for more detailed evaluation of the viable technologies.
To evaluate the wide range of available biosolids product technologies, four broad objectives were identified that should be met by any product technology. These objectives listed below reflect key issues of concern for the City, the IRP, and biosolids management in Southern California:
Protect Public Health and the Environment
Provide System Reliability
Enhance Cost Efficiency
Implementation/Quality of Life
The product technology options that were not considered to have fatal flaws were ranked based on the objectives described above, and measurable criteria developed from those objectives. Evaluating the technologies was based on information from City staff and the IRP team with regard to specific technologies, experience with specific technologies and knowledge of the status of development of technologies.
Table 2-11 summarizes the total scores for the established and emerging technology categories. In the established technologies, thermophilic digestion, as currently conducted by the City, ranked the highest, with composting and heat drying being next ranked technologies. The TIRE project was the clear winner among the emerging technologies. These processing options may be conducted after thermophilic digestion, unless in the future the City selects an option to handle a sufficient volume of digested or undigested solids to allow some or all of the City’s biosolids to be processed without prior thermophilic digestion and/or dewatering. This may be the case if the TIRE demonstration project is successful.
Table 2-11 Summary of Initial Screening of Biosolids Product Technologies
No. Established Technologies Score Emerging Technologies Score 1 Thermophilic Digestion 62 Renewable Energy Recovery (TIRE) 60
2 Composting 57 Super Critical Water Oxidation 49
3 Heat Drying 56 Pyrolysis 47
4 Combustion 52 Gasification 46
5 Chemical Treatment 48
The following recommendations were made for long term direction of biosolids management, based on the evaluation and ranking of the biosolids product technologies, the evaluation of biosolids product markets, and consideration of the City’s Biosolids EMS:

Section 2 Wastewater Management
2-36 Summary Report Section 2 - Wastewater.doc
1. Continue thermophilic digestion and bulk land application at the Green Acres Farm:
Application at the farm should be restricted to 550 wet tons per day (wtpd) (as per initial estimate for 50-year farm life), unless a different suitable nutrient and metal loading rate is determined for long term sustainability;
Conduct a detailed evaluation of agronomic uptake rates and groundwater interactions at the farm;
Identify and implement farm improvements to maximize nutrient uptake, plant yields and revenues, such as addition of gypsum to sodic soils;
Provide biosolids storage facility at the farm for conditions when spreading is limited by adverse weather or other conditions; and
Conduct demonstration projects to showcase benefits of biosolids land application and encourage the use of biosolids for non-food farming.
2. Implement the TIRE demonstration project to determine true feasibility and costs for renewable energy recovery. If successful it is anticipated that the TIRE facility will be able to treat the equivalent of 200 wtpd of digested cake on average, with a maximum capacity of 400 wtpd for a short duration. This will provide diversification with an energy-based biosolids management option, rather than reliance on options that use the nutrient value of biosolids
3. Diversify biosolids management through consideration of other biosolids management options, such as private or City-owned composting or heat drying facilities. Although the current volume of 750 wtpd can be managed with the above two options, management of projected future increases to over 900 wtpd will require additional capacity. For an agency such as the City, which produces large volumes of biosolids, heavy reliance on one management option can contribute to public perception issues and leaves the City more vulnerable to changes in regulations or other factors that may impact costs of a biosolids management option.
As a closing note, biosolids management is a very dynamic area, with changes in regulations, public perception, technologies and costs. Biosolids management plans therefore would need to provide flexibility to respond to changing situations. Triggers for change that would lead to a re-consideration of the biosolids management strategy were identified and included:
Changes in local county ordinances, particularly Kern County;
Changes in the Part 503 regulations
Increasing need for diversification

Section 2 Wastewater Management
2-37
Section 2 - Wastewater.doc Summary Report
Successful demonstration of the TIRE project
Support for regional biosolids processing facilities
2.10 Alternatives Analysis The collection system options described in Section 2.5 above; the treatment options described in Section 2.7 above for the HTP, TWRP, LAG, TITP, a new water reclamation plant; and the biosolids management options described in Section 2.8 above; along with the recycled water options (see Section 3 of this volume) and runoff options (Section 4 of this volume), were then carried forward and assembled into integrated system-wide alternatives. The integrated alternatives were then evaluated, refined, and subjected to a cost-benefit analysis to identify the four highest ranked alternatives that were then analyzed in an environmental impacts report (see Section 8 of this volume). Section 5 of this volume and Volume 4 of the IRP Facilities Plan provides more details on the alternatives development, evaluation, and ranking process.

3-1
Section 3 - Water.doc Summary Report
Section 3 Water Management
3.1 Introduction The Los Angeles Department of Water and Power (DWP) provides potable water for single-family residences, multi-family residences, industries, commercial businesses, and government agencies throughout the City. DWP’s mission is “to provide our customers with reliable, high quality and competitively priced water services in a safe and publicly and environmentally responsible manner.”
In an arid region like Southern California, managing water demands and available supplies is an important issue. The California Urban Water Management Planning Act requires water suppliers to develop water management plans that:
Outline their efforts to use water efficiently;
Describe their current and future efforts for the development of alternative supplemental water supplies to meet growing water needs; and update their water resources management plan to coincide with changing needs and the diversity of water supply options available.
Consistent with this legislation, the City’s Year 2005 Urban Water Management Plan (UWMP) described the DWP’s efforts to promote efficient use and management of its water resources.
The IRP complements the UWMP by providing input to DWP’s UWMP process. The water management component of the IRP focused on the following elements:
Water conservation and its impact on potable water demands, wastewater flows, and dry weather urban runoff quantity
Recycled water and its impact on water supply
Beneficial use of runoff and its impact on water supply
Detailed discussion of the Recycled Water elements of the IRP is included in a separate document, titled Los Angeles Recycled Water Master Plan.
The data presented in this section is a summary of that data presented in the Facilities Plan, Volume 2: Water Management (July 2004), which was taken from the City’s Year 2000 Urban Water Management Plan (UWMP) and fiscal year 2002 annual update. Subsequent to the development of Facilities Plan, Volume 2: Water Management, DWP has prepared the year 2005 UWMP.

Section 3 Water Management
3-2 Summary Report Section 3 - Water.doc
3.2 Planning Parameters The City’s water service area is aligned with the City boundary. The City encompasses approximately 465 square miles and serves a population of nearly 3.8 million (per SCAG 2001 population data). DWP manages the City’s water system. Refer to the Facilities Plan, Volumes 1-3 for the planning parameters and guiding principles that apply to the IRP. Several of the guiding principles are specific to water management. These guiding principles include as follows:
Producing and using as much recycled water as possible from the existing and planned facilities
Increasing the level of water conservation beyond what is currently planned
Focusing on lower-cost solutions within the framework of the policy elements noted above
3.3 Potable Water Understanding the current and future issues related to potable water was an important element to the IRP. Although the IRP primarily focused on facilities planning for the wastewater, recycled water and runoff systems, options and alternatives in those areas could provide additional source water for non-potable or potable demands.
3.3.1 Demands There are several factors influencing water usage including demographics, climate, the economy, water pricing, and water conservation programs. The DWP projects water demands using population, housing forecast, historical demand data, and future conservation efforts. Population and conservation are key factors influencing water use. Based on these factors, the water projections for each customer class were developed as is summarized in Table 3-1. It is expected that the actual water usage between 2000 and 2020 should fall within plus or minus six percent of these projections (DWP, 2000).

Section 3 Water Management
3-3
Section 3 - Water.doc Summary Report
Table 3-1 Projected Water Demands for Each Customer Class in Thousands of Acre-/ft1
Customer Category 2005 2010 2015 2020 Average Annual
Growth RateSingle Family Residential 234 240 249 260 0.8% Multi Family Residential 216 240 260 283 2.2% Commercial 121 124 128 131 0.7% Industrial 26 27 28 30 1.3% Government 42 44 45 47 0.7% Subtotal 639 675 710 751 1.2% Unaccounted Water2 40 43 46 49 1.6% Total 679 718 756 800 1.3%
Notes: 1Source: Urban Water Management Plan (DWP, 2000) 26 percent of the subtotal (DWP, 2000)
The total projected water demands are shown in Figure 3-1.
Source: Ott, DWP, 2000 and DWP, 2002
679 718 756 800
0
200
400
600
800
1000
1200
1970
1975
1980
1985
1990
1995
2000
2005
2010
2015
2020
Fiscal Year
Wat
er D
eman
d (1
,000
s of
AF)
00.511.522.533.544.55
Popu
latio
n (1
,000
,000
s)
2000 UWMP Projected Demands Actual DemandActual Population Projected Population
Figure 3-2DWP Historical and Projected Water Demand and Population
Figure 3-1DWP Historical and Projected Water Demand and Population

Section 3 Water Management
3-4 Summary Report Section 3 - Water.doc
3.3.2 Supply The City has four principal water supply sources as shown in Figure 3-2:
Figure 3-3 shows the average year percentage of total annual usage for the last 10 years supplied by each source (DWP).
Purchased Water Imported by the MWD 34%
Local groundwater 14%
Los Angeles Aqueduct System 51%
Recycled water 1%
Total Water Usage = 679,099 acre-ft Source: DWP UWMP
Figure 3-3 Summary of Water Supply for the Average of 10 Years
Figure 3-2Principal Water Supply Sources
Los Angeles Aqueduct System (Los Angeles Owens River, 1st and 2nd Aqueducts)
Local groundwater
Purchased water imported by the Municipal Water District of Southern California (MWD) through the State Water Project and Colorado River Aqueduct
Recycled water

Section 3 Water Management
3-5
Section 3 - Water.doc Summary Report
Summary of Water Supply Projections A summary of the City’s projected water supply sources is presented in Table 3-2, which summarizes the anticipated supply sources and demands for normal and dry climate conditions.
Table 3-2 Potable Water Forecasts for the City of Los Angeles
Projected Supply1 (1000 acre-ft) Projected Demand
(1000 acre-ft) Local
Groundwater Los Angeles Aqueducts
Metropolitan Water District4 Recycled Water3
Seawater Desalination
Year Normal Dry2 Normal Dry Normal Dry Normal Dry Normal Dry Normal Dry 2005 679 720 108 135 296 135 267.35 442.35 44.15 44.15 0 0 2010 718 761 108 135 296 135 284.4 461.4 60.055 60.055 11.2 11.2 2015 757 802 108 135 296 135 318.15 497.15 72.75 72.75 11.2 11.2 2020 799 847 108 135 296 135 354.45 536.45 78.45 78.45 11.2 11.2 Notes: 1Source: Urban Water Management Plan (DWP 2000) and as updated in June 2003. 2The DWP defines a dry year as a year in which the total rainfall is at the 10th percentile (exceeded nine out of ten years). An estimated
additional 6 percent of the projected demand will be required under these conditions (DWP, 1995). 3The recycled water values listed reflect what is included in draft 2003 UWMP update (Van Wagoner 2003) and include recycled water
discharges to the Los Angeles River as an environmental enhancement. As part of the IRP, these values will be evaluated and modified as additional recycled water users are identified. See Section 5 for additional information.
4The MWD values reflect what is included in 2000 UWMP (DWP 2000) and as updated in June 2003. The IRP will evaluate potential reductions in these values as recycled water usage is increased.
In March 2003, MWD released a Report on Metropolitan’s Water Supplies, which outlines MWD’s water resources development plans and reliability outlook for at least the next twenty years. Additionally, MWD and its member agencies prepared the MWD Integrated Water Resources Plan, 2003 Update (May 2004), which is an updated version of MWD’s 1993 Integrated Resources Plan. Both reports contain in detail the various elements of MWD’s long-term plans to deliver Colorado River and State Water Project supplies.
3.4 Water Conservation Water conservation has become a way of life in California and is a critical part of the state’s overall strategy for managing water resources efficiently. The City operates one of the most successful conservation programs in the United States and has reduced its annual potable water demand by more than 15 percent since 2001. [DWP – UWMP FY 2001/02 Update].
Despite the fact that total water demand has slowly increased since the end of water rationing in 1992, water conservation levels remain above 15 percent. The conservation efforts correspond to actual water savings that have occurred as a result of changes in hardware and water usage patterns of residents and businesses within the City. The City’s nationally recognized water conservation programs are largely responsible for the significant reduction in the City’s water use over the last decade. According to DWP’s UWMP, by 2020 hardware-based conservation alone is projected to contribute to a ten percent savings in water use.

Section 3 Water Management
3-6 Summary Report Section 3 - Water.doc
In December of 1991 DWP, along with 120 urban water agencies, environmental groups and other interested groups, signed the Memorandum of Understanding (MOU) on Urban Water Conservation. The MOU identified “Best Management Practices” (BMPs), as proven conservation measures, as determined by the California Urban Water Conservation Council (CUWCC). All signatories to the MOU are committed to implement BMPs, subject to the condition that the BMPs are cost effective for the individual water agencies.
The implementation of conservation programs not only saves water, but also delays the need for costly expansions of sewer and stormwater facilities by reducing wastewater discharge into the sewer collection and treatment system and reducing runoff. However, even with aggressive conservation measures, City water demands are expected to increase with population growth.
3.4.1 Existing and Planned Conservation Measures DWP has implemented a plethora of water conservation measures, including tiered water pricing, financial incentives for the installation of ultra-low-flush (ULF) toilets and water efficient clothes washing machines, technical assistance programs for business and industry, and large scale irrigation efficiency programs. These programs and their associated water savings are described in the 2000 Urban Water Management Plan (UWMP) and the FY 2001/02 Annual Update (DWP). Conservation programs can be grouped into five categories:
Support and Education
Residential
Commercial /industrial/governmental
Landscape
System maintenance measures
The programs include traditional demand-side management measures, as well as infrastructure improvement programs that contribute to reductions in water consumption. Combined with a conservation pricing structure, these programs increase system reliability, efficiency, and in some cases provide water quality benefits. A conservation water pricing structure encourages consumers to reduce water consumption as the cost of water increases per unit with increased consumption.

Section 3 Water Management
3-7
Section 3 - Water.doc Summary Report
3.4.2 Potential Additional Conservation Measures As discussed in Section 3.2, one of the IRP guiding principles was increasing the level of water conservation beyond what is currently planned. This guiding principle is aligned with DWP’s water conservation program, which continues to investigate new conservation measures. Following is a summary of these additional measures that DWP is investigating for consideration into the conservation program.
“Smart Irrigation” implemented Citywide – “Smart Irrigation regulates the amount of irrigation on a property which reduces over-watering. If installed at 70 percent of all single-family homes, multi-family homes, and commercial/institutional properties by 2020, it was estimated that Citywide there could be a maximum reduction in water consumption of up to 15,800 acre-feet/yr. Additionally, if smart irrigation were implemented City wide, it would reduce dry weather runoff by up to 11 mgd (see Section 4 of this document for details on runoff reduction from smart irrigation).
X-Ray Film Processor Water Saving Rebate Program - Existing x-ray processing systems in hospital applications consume large volumes of water during the film washing process. New technology has been developed that, when installed on the x-ray film processing systems, enables this equipment to save extraordinary amounts of water. Recent studies have demonstrated that the addition of a specially designed package system to the existing x-ray film processor systems can save an average of about 3.2 acre-ft annually, per system, in hospital settings.
Retrofit of Existing Car Washes - There are 499 permitted car washes within the City of Los Angeles. Approximately 10 percent of these facilities were contacted as a part of this study. Based upon the information the car washes provided, only 60 percent of the car washes recycle their water. Further investigations would need to be done to determine the amount of water savings that could be achieved through retrofits.
Waterless urinals (no water is required for their use) if approved for use in the City. This technology is currently being studied by the Los Angeles Department of Building and Safety.
A pre-rinse kitchen sprayer rebate program for restaurants. The savings associated with the reduction of water may cover the full cost of the kitchen device. Estimated annual savings per kitchen is 75,000 gallons.

Section 3 Water Management
3-8 Summary Report Section 3 - Water.doc
3.5 Recycled System The use of “recycled” water (i.e., highly treated wastewater) for non-potable needs was an important area of focus for the IRP. One of the guiding principles from Phase I was to produce and use as much recycled water as possible from existing and planned facilities. Recognizing the importance of recycled water, the City continues to develop recycled water projects to help meet increasing demands by augmenting the City’s water supply. In fact, the City’s commitment to investigating and developing a plan for recycled water use is demonstrated by the development of a stand-alone Los Angeles Recycled Water Master Plan as part of the IRP. This section provides a short summary of the existing recycled water systems and potential demands.
3.5.1 Existing Recycled Water System and Demands Wastewater in the City of Los Angeles is collected and transported through some 6,500 miles of major interceptors and mainline sewers, more that 11,000 miles of house-sewer connections, 46 pumping plants, and four treatment plants. The Department of Public Works, Bureau of Sanitation (BOS) is responsible for the planning and operation of the wastewater program. Figure 3-4 shows the City’s four wastewater treatment plants and seven sewersheds that feed into the plants.
A portion of the treated effluent from the wastewater plants is provided to DWP to meet recycled water demands. DWP is responsible for planning, construction and operations of recycled pipelines and connections that will take the treated effluent water to its customers.
At the core of the existing recycled water system there are four wastewater treatment plants.
Donald C. Tillman Water Reclamation Plant The Donald C. Tillman Water Reclamation Plant (Tillman) has a rated capacity of 80 million gallons per day (mgd). The current level of treatment is Title 22 (tertiary) plus nitrogen removal (NdN). Currently, this plant is providing recycled water to the Japanese Garden, Wildlife Lake, and Lake Balboa. The remaining tertiary-treated water is discharged into the Los Angeles River.
Hyperion-CoastalSewershed
Los Angeles-GlendaleSewershed
VSL/FA Sewershed
Tillman Sewershed
Terminal IslandSewershed
Tunnel Sewershed
City of Los AngelesBoundary
Hyperion-MetroSewershed
5
1
2
4
3
5
6
7
4
3
2
1
6
5
1
2
4 3
7
TerminalIsland
TreatmentPlant
HyperionTreatment
Plant
LA/GlendaleWater
ReclamationPlant
TillmanWater
ReclamationPlant
Figure 3-4City Wastewater Plants and Sewersheds

Section 3 Water Management
3-9
Section 3 - Water.doc Summary Report
Los Angeles-Glendale Water Reclamation Plant The Los Angeles-Glendale Water Reclamation Plant (LAG) has a design capacity of 20 mgd. LAG provides landscape irrigation for Griffith Park and the Los Angeles Greenbelt Project, the remainder is discharged to the Los Angeles River.
Terminal Island Treatment Plant The Terminal Island Treatment Plant (TITP) provides tertiary treatment with a capacity of 30 mgd, with average flows being about 16 mgd, which discharges to the Los Angeles Harbor. There is an Advanced Wastewater Treatment Facility, with MF/RO treatment for 6 mgd of the wastewater effluent, after which this recycled water can be used for seawater barrier and industrial and landscaping uses in the harbor area.
Hyperion Treatment Plant The Hyperion Treatment Plant treats to full secondary treatment. A majority of the treated water is discharged into the Santa Monica Bay, and the rest is delivered to the West Basin Water Reclamation Plant to meet recycled demands in the West Basin Municipal Water District service area and parts of the City of Los Angeles. Currently about 34,000 acre-ft/ yr of water from HTP is sold to the West Basin Municipal Water District for additional treatment and then used to meet recycled water demands in its service area. The current capacity of HTP is 450 mgd, with an average wastewater flow of 350 mgd.
There are eight recycled water projects that the City has developed. Four of these projects are currently providing recycled water for landscape irrigation and commercial uses.
Japanese Garden
Wildlife Lake
Lake Balboa
Griffith Park
Los Angeles Greenbelt Project
Westside Water Recycling Project
East Valley Water Recycling Project
Harbor Water Recycling Project
Table 3-3 summarizes the existing recycled water use that is occurring in the City of Los Angeles. The existing recycled water use is broken down into three main categories: (1) irrigation; (2) environmental/recreation; and (3) wholesale sales to West Basin Municipal Water District.

Section 3 Water Management
3-10 Summary Report Section 3 - Water.doc
Table 3-3 Existing Recycled Water Use in City of Los Angeles
Type of Use/Project Source of Supply Amount of Supply Irrigation -Griffith Park and LA Greenbelt -Westside
Sub-Total
LAGWRP HTP/West Basin Plant
1,600 acre-ft/ yr 350 acre-ft/ yr 1,950 acre-ft/ yr
Environmental/ Recreation -Japanese Garden -Wildlife Lake -Lake Balboa
Sub-Total1
TWRP TWRP TWRP
4,400 acre-ft/ yr 7,800 acre-ft/ yr 16,300 acre-ft/ yr 28,500 acre-ft/ yr
Wholesale Sales to West Basin Municipal Water District2 HTP 34,000 acre-ft/ yr
Total Beneficial Use 64,450 acre-ft/ yr 1 The water provided to Japanese Garden, Wildlife Lake and Lake Balboa is ultimately discharged into the Los Angeles River and is providing additional environmental benefits. 2 Secondary treated water provided to West Basin MWD, which is further treated to meet recycled water demands in its service area.
3.5.2 Potential Demands for Recycled Water DWP’s implementation of recycled water factors in economics, water quality regulations, and public acceptance. DWP’s approach for identifying recycled water customers takes into account the following criteria:
Size of potential customer – initial focus on larger customers
Type of water use – treatment requirements area based on the end use
Proximity to existing recycled water system – costs to deliver water is lower for those potential customers nearest to existing wastewater treatment (due to costs of pipelines and pump stations)
Willingness to use recycled water – not all potential water customers have a desire to use recycled water; in most cases the City may need to provide proper incentives.
3.5.2.1 Identifying DWP Top Water Customers The following summarizes the number of customers that were identified as representing the potential for recycled water:
Irrigation customers with separate metered connections for irrigation: Number of customers 768

Section 3 Water Management
3-11
Section 3 - Water.doc Summary Report
Range of water demand 1 acre-ft/ yr to 2,296 acre-ft/ yr Total water demand potential 20,200 acre-ft/ yr
Industrial customers that may use the water for process use, and would likely incur user retrofit costs for installing separate plumbing for non-potable process demands: Number of customers 30 Range of water demand 15 acre-ft/ yr to 2,249 acre-ft/ yr Total water demand potential 8,453 acre-ft/ yr
Other customers that may use the water for irrigation, but would likely incur user retrofit costs for installing separate plumbing for non-potable irrigation demands: Number of customers 1,574 Range of water demand 1 acre-ft/ yr to 2,021 acre-ft/ yr Total water demand potential 73,205 acre-ft/ yr
Figure 3-5 plots the potential recycled water customers with respect to their potential water demand.
Figure 3-5 shows that 2,372 potential water customers can use approximately 103,000 acre-ft/ yr of recycled water. The graph also shows that the first 145 customers (which only represent 6 percent of the total number of customers) account for 50 percent of the total water demand. Furthermore, 500 customers (which represent 21 percent of the total) account for 70 percent of the total water demand.
0
10,00020,000
30,000
40,000
50,00060,000
70,000
80,000
90,000100,000
110,000
0 500 1000 1500 2000 2500
Number of Potential Water Customers
Wat
er D
eman
d (A
cre-
Feet
Per
Yea
r)
145 customersaccount for 50% of the total demand
500 customersaccount for 70% of the total demand
1,372 customersaccount for 90% of the total demand
Figure 3-5Potential Recycled Water Demand

Section 3 Water Management
3-12 Summary Report Section 3 - Water.doc
3.5.2.2 Mapping Potential Recycled Water Customers After identifying the potential recycled water customers, the next step was to map them in order to determine their proximity to the existing (or planned) recycled water system. This was accomplished using GIS. Figure 3-6 shows this plot of the potential customers.
The pink shaded areas represent the Tier 1 potential for recycled water—the customers in these areas are the closest to the existing (or immediately planned) recycled water system. The green shaded areas represent the Tier 2 potential for recycled water—the customers in these areas are further away from the existing (or immediately planned) recycled water system. In general, the Tier 1 customers should be less expensive to serve than the Tier 2 customers.
Figure 3-6 shows four areas of the City where delivery of recycled water is the most economical to achieve:
1. The Valley – which has a Tier 1 recycled water demand potential of 14,200 acre-ft/ yr, and a Tier 2 potential of 42,400 acre-ft/ yr
2. Central City – which has a Tier 1 recycled water demand potential of 2,000 acre-ft/ yr, and a Tier 2 potential of 29,500 acre-ft/ yr
3. Westside – which has a Tier 1 recycled water demand potential of 4,000 acre-ft/ yr, and a Tier 2 potential of 14,300 acre-ft/ yr
4. Harbor – which has a Tier 1 recycled water demand potential of 9,300 acre-ft/ yr, and a Tier 2 potential of 10,900 acre-ft/ yr
5. Total – Tier 1 recycled water demand potential is 29,500 acre-ft/ yr, while the Tier 2 recycled water demand potential is 97,100 acre-ft/ yr
There are approximately 158 water customers that are a considerable distance from existing City facilities and therefore do not meet Tier 2 criteria. This accounts for about 5,800 acre-ft/ yr of the 103,000 acre-ft potential (shown in Figure 3-6).
It should be noted that this potential for recycled water demand does not factor in the capacity limitations of the wastewater treatment plants. Wastewater flows, current and projected, could limit the amount of water that is available to be reused.

Figure 3-6
Potential Recycled Water Customers

Section 3 Water Management
3-14 Summary Report Section 3 - Water.doc
Furthermore, the recycled water demands are based on DWP’s customer data base and need to be verified to determine actual potential demand. Groundwater replenishment with advanced treated DCT effluent was identified as an option requiring future analysis and public acceptance, which could use up to 36,000 acre-feet per year in the east San Fernando Valley for this purpose.
3.6 Summary The two main water management options for the IRP include increasing levels of conservation and increasing recycled water use. Unlike the wastewater system, described in Section 2 of this document, in which the options are on an either/or basis, for water management the options build upon one another, indicating varying levels of water management. This is further detailed in Section 5 Alternatives Development and Analysis.

4-1
Section 4 - Runoff.doc Summary Report
Section 4 Runoff Management
4.1 Introduction The City is responsible for meeting the requirements of the various regulations pertaining to water quality and runoff management, which are discussed in Section 4.2.2. The following sections of this document serve to summarize the Facilities Plan, Volume 3: Runoff Management. As such, the Facilities Plan, Volume 3: Runoff Management should be referred to for a more detailed analysis.
4.1.1 Runoff Service Area The City’s runoff service area is comprised of portions of the following four major watershed management areas (WMAs):
LA River (including Reaches 1, 2, 3, 4, 5, and 6)
Ballona Creek
Dominguez Channel
Santa Monica Bay (the portion within the City of LA)
The Citywide land use breakdown is presented in the pie chart in Figure 4-1. As shown in Figure 4-2, portions, but not all, of the WMAs are within the City of Los Angeles’ boundary. For the purposes of the IRP, facility planning was focused on runoff derived from the watershed service areas within the City of Los Angeles. However, many stormwater runoff management solutions are appropriate to implement on a watershed-wide basis.Los Angeles River WMA
Commercial
Industrial
Multi Family
Open Space/Agriculture
Single Family High Density
Single Family Low Density
Single Family Mid Density
Transportation/Utilities/Mixed
Water
Figure 4-1 Citywide Land Use

Section 4 Runoff Management
4-2
Section 4 - Runoff.doc Summary Report
The Los Angeles River WMA is one of the largest in the region. The Los Angeles River is 51 miles long and drains 834 square miles (533,760 acres) of watershed. Approximately 30 miles of river and 289 square miles (185,000 acres) of watershed lie within the City. Approximately 324 square miles (207,000 acres) of the watershed are covered by forest or open space land, including the area near the headwaters, which originate in the Santa Monica, Santa Susana, and San Gabriel Mountains. The remaining 510 square miles (326,500 acres) of the watershed, and approximately 231 square miles (148,000 acres) of the City portion, is highly developed
Ballona Creek/Urban Santa Monica Bay WMA The entire Santa Monica Bay watershed, which encompasses an area of 414 square miles, is quite diverse. The WMA includes a number of watersheds; the two largest are Malibu Creek (to the north) and Ballona Creek (to the south). The remaining are smaller watersheds, some of which discharge to the bay entirely through local storm
Figure 4-2 Runoff Watersheds for Los Angeles

Section 4 Runoff Management
4-3
Section 4 - Runoff.doc Summary Report
drain systems. Only 149 square miles combined of the Ballona Creek WMA and Santa Monica Bay WMA fall within the City.
Dominguez Channel/Los Angeles Harbor WMA The Dominguez Channel/Los Angeles Harbor WMA drains 110 square miles of watershed (LACDPW and URS Greiner Woodward Clyde, 2000), of which approximately 23 square miles of the watershed lie within the City.
4.2 Planning Parameters The main focus of managing runoff, wherever possible, was on maximizing reuse and recycling of runoff, as recommended by the IRP guiding principles. Because the majority of the Total Maximum Daily Loads (TMDLs) were not published at the time of development, the intent of the IRP was not to ensure TMDL compliance but instead it focused on maximizing runoff management opportunities to supplement water supply needs, and in the process improve the water quality of the receiving water bodies.
4.2.1 IRP Guiding Principles In Phase I of the IRP (the Integrated Plan for the Wastewater Program), several guiding principles were identified and were used in the preparation of the Facilities Plan. Several of the guiding principles were specific to runoff management. These guiding principles included:
Increasing the amount of dry weather urban runoff that is diverted and treated or captured and beneficially used
The primary benefit of increased dry weather diversion will result from reduced pollution throughout the City’s waterways; this, in turn, will have a major impact on the region’s quality of life.
In addition, dry weather urban runoff could potentially provide additional beneficial water use opportunities. To protect all beneficial uses, the City recommends an extensive dry weather urban runoff capture and beneficial use program. The IPWP assumed that one of the requirements of any project would be that dry weather diversions would not impair the beneficial uses of other receiving waters in the Los Angeles basin.
Increasing the amount of wet weather urban runoff that can be captured and beneficially used
By capturing and beneficially using wet weather urban runoff, the City has the opportunity to make some significant restrictions in its dependence on imported water. For this reason, both the Steering Group and the City supported capturing and beneficially using wet weather urban runoff.

Section 4 Runoff Management
4-4 Summary Report Section 4 - Runoff.doc
Focusing on lower-cost solutions within the framework of the policy elements noted above
Providing for improvements in, and maintenance of, wastewater, recycled water, stormwater and water services that are adequate for meeting future treatment and quality needs may require increased investments in these programs, and paying for these improvements will result in some level of increased user costs. A wide range of possible costs for future actions was indicated by the alternatives studied in the Phase I process. In fact, individual economic preferences were considered in selecting alternatives. While alternatives will require significant investments, they will also offer the added value of achieving both the level-of-service and the environmental goals that are important for the City and its residents, and they may result in economic savings over time. Nonetheless, it was possible, within the scope of the desired options and policies outlined above, to strive for the lowest cost solutions that meet performance requirements. For these reasons, the Steering Group supported the use of lower cost solutions where they were available within the framework of the other policy elements.
4.2.2 Regulatory Drivers The primary regulatory drivers affecting the stormwater program are the issuance of National Pollutant Discharge Elimination System (NPDES) stormwater permits and the development of TMDLs. The Los Angeles County Stormwater permit requires implementation of a comprehensive stormwater program, Best Management Practices (BMPs), and TMDLs. TMDLs will limit pollutant loading to a number of impaired waters in the City, including the Los Angeles River, which is a major receiving water for both urban runoff and wastewater effluent, as well as Ballona Creek and Santa Monica Bay.
One of the specific requirements of the NPDES program is the Standard Urban Stormwater Management Plan (SUSMP), which is intended to address storm water pollution from new development and redevelopment by the private sector as well as equivalent public works projects. As adopted by the Los Angeles Regional Water Quality Control Board (RWQCB), the countywide SUSMP requires that BMPs be implemented to meet specific design standards to achieve the following goals (RWQCB, 2000b):
Mitigation (i.e., infiltration or treatment) of storm water runoff
Control of peak-flow discharge to provide stream channel and over-bank flood protection, based on flow design criteria selected by the local agency.
At the time of development, there were four TMDLs that had numerical limits or other quantifiable targets such as days of exceedance:
Los Angeles River Trash TMDL

Section 4 Runoff Management
4-5
Section 4 - Runoff.doc Summary Report
Los Angeles River Nitrogen TMDL
Santa Monica Bay Dry Weather Bacteria TMDL
Santa Monica Bay Wet Weather Bacteria TMDL
4.2.3 Runoff Planning Sheds For the IRP, the major watersheds (Los Angeles River, Ballona, Santa Monica Bay, and Dominguez Channel) were divided into smaller runoff planning sheds, resulting in 21 areas that drain to major channels or that are tributary to major receiving water bodies. These locations were considered logical points of collection as they already drain larger tributary areas and the flows can be captured at a point prior to discharge to the Los Angeles River or other water body. A map of these runoff planning sheds is included in Figure 4-4. Table 4-1 presents a summary of the acreage of these sheds. These runoff planning sheds will be used throughout this document.
4.3 Approach The first step in developing runoff management options for the stormwater program was to evaluate the regulatory drivers and other planning parameters that pertain to runoff. The second step was to estimate the amount and the quality of both dry and wet weather runoff that will need to be managed to meet regulatory requirements and to meet any other environmental goals developed by the City. The third step was to identify existing City programs and runoff facilities and assess how they might impact future planning and needs. The information resulting from the analysis outlined above was then used to develop runoff management options that can be integrated into a Citywide stormwater program.
Figure 4-3 Runoff Management Options
Local / Neighborhood Solutions

Section 4 Runoff Management
4-6 Summary Report Section 4 - Runoff.doc
Figure 4-4Runoff Planning Sheds

Section 4 Runoff Management
4-7
Section 4 - Runoff.doc Summary Report
Managing the quality of runoff includes meeting the following goals:
Address all existing TMDLs (listed above) and regulations in all alternatives (considered minimum requirements);
Provide leadership by including additional runoff management projects with multiple benefits (e.g., on-site storage/use, or infiltration trenches), which will provide beneficial use as well as some water quality benefits;
Develop a range of management options to meet future regulations;
Develop an IRP Implementation Plan that will include a schedule with potential regulatory triggers to allow the City to check whether the IRP projects will satisfy compliance with new TMDLs as they area issued. Whether and how to
Table 4-1 Summary of Runoff Planning Shed Areas
Portion within City of Los Angeles Watershed Management
Area Runoff Planning Shed Total Area (acres) (acres) (Percent)
Bell Creek 17,000 11,500 68% Browns Creek 23,000 12,000 52% Aliso Wash 9,500 9,500 100% Wilbur Wash 5,000 4,000 80% Limekiln Canyon 8,000 6,000 75% Caballero Canyon 5,500 5,500 100% Bull Creek 13,500 13,500 100% Tujunga Wash 32,500 32,500 100% Pacoima Wash 143,200 28,000 20% Arroyo Seco 78,500 13,500 17% Los Angeles River Reach 3 45,000 13,900 31% Los Angeles River Reach 2 73,000 15,000 21% Burbank Western Channel 9,300 9,000 97% Verdugo Wash 1,000 1,000 100% Compton Creek 14,000 10,100 72%
Los Angeles River
Subtotal 478,000 185,000 39% Ballona Creek 17,000 17,000 100% Ballona Creek Sepulveda Channel 67,000 50,000 75% Santa Monica Bay 1 21,100 21,100 100% Santa Monica Bay 2 5,900 5,900 100% Santa Monica Bay Santa Monica Bay 3 1,000 1,000 100%
Dominguez Channel Dominguez Channel 70,000 15,000 21% Area not Tributary to City (not in planning shed) 209,000 NA NA Total 869,000 295,000 Source: City’s GIS database.

Section 4 Runoff Management
4-8 Summary Report Section 4 - Runoff.doc
modify/expand the IRP plan will be detailed as part of each TMDL’s Implementation Plan.
The following are the key objectives relating to managing runoff quality and quantity;
Bacteria TMDL goals for the Santa Monica Bay for dry and wet weather which serves to eliminate or treat all dry weather flow entering the Santa Monica Bay, and that has set a numeric limit of 17 exceedance days for bacterial concentration at Santa Monica Bay beaches
Trash TMDL goal for Ballona Creek and Los Angeles River that establishes a zero target for trash in receiving waters from all runoff
NPDES permit goal to reduce or eliminate non-stormwater runoff flows and to reduce pollutants entering the receiving waters, which includes reducing all dry weather flows
SUSMP goals, which is a model guidance document for use by builders, land developers, and public agencies
4.4 Dry Weather Runoff Dry weather runoff is runoff that occurs when in the absence of rainfall. Dry weather runoff is generally associated with activities such as landscape irrigation and street washing.
To estimate the volume of dry weather runoff, the average monthly flow data from several locations throughout the WMAs during the dry months from October 1996 to September 2001 was used. At the time, this was the most recent data released by the County of Los Angeles Department of Public Works (Los Angeles County, 2002).
For the IRP, a “dry month” was defined as a month in which less than 0.25 inches of rain fell. The rainfall measured at the Los Angeles International Airport (LAX) rain gauge was used to determine which months during the study period were dry.
4.4.1 Dry Weather Runoff Volume The following Table 4-2 summarizes the runoff rates and total estimated dry weather runoff flow for each of the watersheds. Refer to the Facilities Plan Volume 3: Runoff Management for the calculations and methodology associated with this data. Table 4-3 summarizes the estimated dry weather flows from each subwatershed.

Section 4 Runoff Management
4-9
Section 4 - Runoff.doc Summary Report
Table 4-2
Runoff throughout City Based on Estimated Runoff Rates
Area (acres) Flow (mgd) Watershed Management Area Watershed City
Runoff Rate
(gpd/ac) Watershed City
Los Angeles River 533,000
(311,000 Measured
Developed)
185,000 (148,000 Measured
Developed)
190 59 28
Ballona Creek 84,000 67,000 230 20 16 Urban Santa Monica Bay 182,000 28,000 320 15 10 Dominguez Channel/Los Angeles Harbor
70,000 15,000 230 16 4
Total 869,000 295,000 NA 110 58
Table 4-3 Dry Weather Flows by Runoff Planning Shed
No. Runoff Planning Shed Flow (mgd) 1 Bell Creek 3 2 Browns Creek 3 3 Aliso Wash 2 4 Wilbur Wash 1 5 Limekiln Canyon 2 6 Caballero Canyon 1 7 Bull Creek 2 8 Tujunga Wash 6 9 Pacoima Wash 7 10 Arroyo Seco 5 11 LA River Reach 3 4 12 LA River Reach 2 12 13 Burbank Western Channel 2 14 Verdugo Wash 0 15
Los Angeles River WMA
Compton Creek 3 16 Ballona Creek 3 17
Ballona Creek WMA Sepulveda Channel 16
18 Dominguez Channel WMA Dominguez Channel 16 19 Santa Monica Bay 1 20 Santa Monica Bay 2 21
Santa Monica Bay WMA Santa Monica Bay 3
10
Total 97 Source: Calculated data based on City’s GIS database and runoff rates, wet weather based on based on areas and 0.45-inch target storm, 0.47 runoff coefficient, as detailed in Facilities Plan Volume 3: Runoff Management. Note that the total 97 mgd differs from the 110 mgd presented in Table 4-2 as there are 13 mgd of flow in the LA River watershed that does not reach the City and is therefore not included here.

Section 4 Runoff Management
4-10 Summary Report Section 4 - Runoff.doc
4.4.2 Dry Weather Runoff Quality The following Table 4-4 represents the runoff water quality data that was available for the IRP.
Table 4-4 Summary of Reported Dry Weather Runoff Water Quality Data
Constituent Unit
Ashland Storm Drain1
Ballona Creek1
Pico-Kenter Storm Drain1
Sepul-veda
Channel1
Saw-telle Blvd2
Overland Overpass3
Storm Drains4
General Constituents pH N/A 7.6 8.8 7.6 8.7 - - - Chemical Oxygen Demand (COD)
mg/L 252 51 88 73 - - -
Biochemical Oxygen Demand (BOD)
mg/L - - - - 5.6 <10 -
Dissolved Oxygen (DO)
mg/L 1.6 >15 6.6 >15 - - -
Total Dissolved Solids (TDS)
mg/L 6,058 1,625 1,493 4,071 - - -
Total Suspended Solids (TSS)
mg/L 299 8 103 13 - - -
Volatile Suspended Solids (VSS)
mg/L 86 5 42 7 - 26 -
Dissolved Organic Compounds (DOC)
mg/L 34 9 15 16 - - -
Salinity ppm 2.2 1.2 0.9 2.1 - - - Alkalinity mg/L 357 212 260 145 - - - Hardness mg/L 1,080 722 353 1,434 - - - Conductivity mu/cm - - - - 1,141 1110 - Detergent ppm 2.5 0.75 0.75 0.5 - - - Oil and Grease mg/L - - - - 2.2 3.5 - Bacteria e.coli mg/L - - - - - - 21,199 Enterococcus (mpn/100 ml) - - - - - - 4,124 Fecal Coliform (mpn/100 ml) - - - - 8,000 1,000 - Total Coliform (mpn/100 ml) - - - - 190,000 >1,600 79,593 Metals Chromium mg/L - - - - - - <0.01 Copper mg/L - - - - 0.019 0.012 <0.01 Iron mg/L - - - - - - 0.54 Lead mg/L - - - - 0.019 <.1 <0.01 Nickel mg/L - - - - - - <0.02
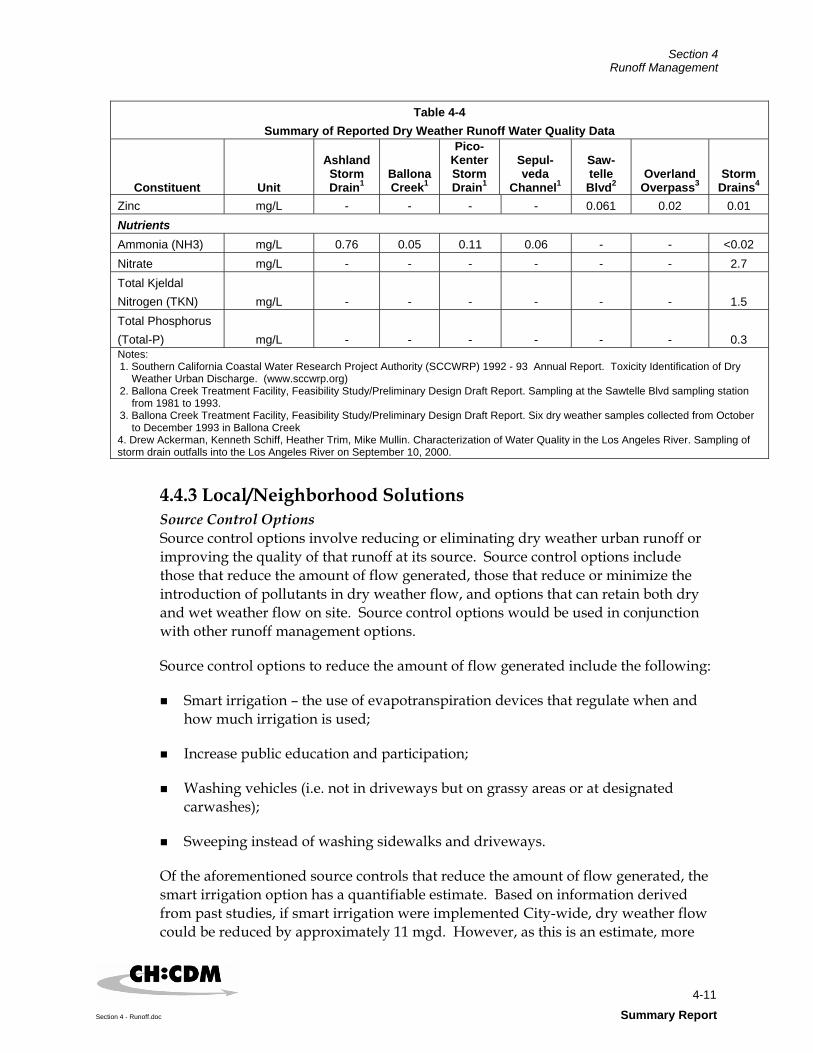
Section 4 Runoff Management
4-11
Section 4 - Runoff.doc Summary Report
Table 4-4 Summary of Reported Dry Weather Runoff Water Quality Data
Constituent Unit
Ashland Storm Drain1
Ballona Creek1
Pico-Kenter Storm Drain1
Sepul-veda
Channel1
Saw-telle Blvd2
Overland Overpass3
Storm Drains4
Zinc mg/L - - - - 0.061 0.02 0.01 Nutrients Ammonia (NH3) mg/L 0.76 0.05 0.11 0.06 - - <0.02 Nitrate mg/L - - - - - - 2.7 Total Kjeldal Nitrogen (TKN) mg/L - - - - - - 1.5 Total Phosphorus (Total-P) mg/L - - - - - - 0.3 Notes: 1. Southern California Coastal Water Research Project Authority (SCCWRP) 1992 - 93 Annual Report. Toxicity Identification of Dry
Weather Urban Discharge. (www.sccwrp.org) 2. Ballona Creek Treatment Facility, Feasibility Study/Preliminary Design Draft Report. Sampling at the Sawtelle Blvd sampling station
from 1981 to 1993. 3. Ballona Creek Treatment Facility, Feasibility Study/Preliminary Design Draft Report. Six dry weather samples collected from October
to December 1993 in Ballona Creek 4. Drew Ackerman, Kenneth Schiff, Heather Trim, Mike Mullin. Characterization of Water Quality in the Los Angeles River. Sampling of storm drain outfalls into the Los Angeles River on September 10, 2000.
4.4.3 Local/Neighborhood Solutions Source Control Options Source control options involve reducing or eliminating dry weather urban runoff or improving the quality of that runoff at its source. Source control options include those that reduce the amount of flow generated, those that reduce or minimize the introduction of pollutants in dry weather flow, and options that can retain both dry and wet weather flow on site. Source control options would be used in conjunction with other runoff management options.
Source control options to reduce the amount of flow generated include the following:
Smart irrigation – the use of evapotranspiration devices that regulate when and how much irrigation is used;
Increase public education and participation;
Washing vehicles (i.e. not in driveways but on grassy areas or at designated carwashes);
Sweeping instead of washing sidewalks and driveways.
Of the aforementioned source controls that reduce the amount of flow generated, the smart irrigation option has a quantifiable estimate. Based on information derived from past studies, if smart irrigation were implemented City-wide, dry weather flow could be reduced by approximately 11 mgd. However, as this is an estimate, more

Section 4 Runoff Management
4-12 Summary Report Section 4 - Runoff.doc
detailed studies would be needed to determine the full benefits of a smart irrigation program.
Improving water quality can be done through a variety of source controls. Following is a list of some ways to improve water quality on-site:
Eliminate littering
Pick up pet waste
Recycle motor oil
Provide employee training
Provide storm drain system stenciling & signage
Protect trash storage areas
Cover outdoor material handling and storage areas
Maintain fleet vehicles
Repair & clean maintenance bays
Sweep parking areas, driveways, and sidewalks
Install clarifiers/ oil-water separators
Maintain loading docks
Use proper waste handling and disposal methods
These methods of improving water quality were not quantified.
4.4.4 Regional Solutions Regional solutions to managing runoff are solutions that serve to manage runoff from a regional or subwatershed wide basis. As opposed to managing or reducing the runoff at its source, these solutions serve to manage a larger amount of flow after it has been generated. Regional solutions would be used in conjunction with local solutions.
4.4.4.1 Diversion to Wastewater system This option involves diverting dry weather runoff that has reached the storm drain system to the wastewater collection system for treatment at existing wastewater treatment plants. This option is not a viable option for wet weather runoff due to the high flow volume during storm events.

Section 4 Runoff Management
4-13
Section 4 - Runoff.doc Summary Report
To analyze the option for managing dry weather flows, as a first step the available capacity of the existing treatment plants was reviewed. A summary of the existing flow conditions at the four treatment plants is presented in Table 4-5. It should be noted that the Burbank Water Reclamation Plant was not included in this analysis since it is not in the City’s jurisdiction.
Table 4-5 Currently Available Treatment Plant Capacity
Plant Existing ADWF Capacity (mgd)
Current Flow (mgd)
Currently Available
Capacity (mgd)
Available Capacity in 2020 (mgd)
Tillman WRP (TWRP) 64 51 13 0 Los Angeles/Glendale WRP (LAGWRP)
15 18 0 0
Hyperion Treatment Plant (HTP)
450 340 110 0
Terminal Island Treatment Plant (TITP)
30 17 13 11
Notes: 1. City of Los Angeles Monthly Performance Report for HTP, TITP, TWRP, LAGWRP. 2. TWRP and LAG ADWF capacity based on derated capacity.
As shown previously in Table 4-3, the total watershed-wide flow to the sewersheds is 97 mgd and the total City flow to the sewersheds equals 58 mgd. Based on this information and the capacities of the wastewater treatment plants shown in Table 4-5, the City could not manage the entire flow by diverting it to the wastewater system. Therefore, for this option to be considered the treatment plants would need additional capacity.
At each of the diversion locations, the following would need to be built: temporary storage, pumping stations, diversion structures to the wastewater system or pipelines diverting the runoff directly to the treatment plant, collection piping to capture runoff prior to discharging into rivers or creeks that are 303d listed waterbodies.
4.4.4.2 Diversion to Urban Runoff Plants, Including Reuse Another option for managing dry weather urban runoff is to capture and treat the runoff and either discharge it back to the intended receiving water to improve water quality, or divert it to a beneficial use. Used in conjunction with source controls, this option will meet current and future dry weather TMDLs.
Treatment requirements will depend upon the specific water quality objectives to be met for regulatory compliance. Potential types of contaminants generated in each planning shed were determined based on land use. Dry weather urban runoff is a significant source of several, but certainly not all, constituents

Section 4 Runoff Management
4-14 Summary Report Section 4 - Runoff.doc
The same runoff planning sheds that were discussed in Section 4.3.2 (shown in Figure 4-4 and flows shown in Table 4-3) are utilized, with the collection points representing the locations of the treatment facilities. The target total flow that would need to be managed is 97 mgd, however since 10 mgd is already being managed by the existing coastal diversions, the City would have to treat and discharge up to 87 mgd of flow.
Treatment and Beneficial Use For this option, treated runoff would be beneficially used rather than discharged to receiving waters. The treatment plants described above for treatment and discharge would be built, but rather than discharging the effluent back into the receiving waters, the flow would be beneficially reused. For dry weather runoff most of the runoff could potentially be diverted directly to beneficial use, particularly during the summer months when demands for non-potable water are high (due to the higher irrigation demands in the summertime).
To evaluate additional potential demand for recycled water or other non-potable sources such as urban runoff, DWP’s top users were analyzed. A computer modeling analysis was performed based on the recycled water demands in the City and the available dry weather runoff.
Based on this data, the model determined which of the recycled water demands could be realistically met through treated runoff. Table 4-6 identifies the amount of this runoff that could, after treatment, be used to meet the recycled water demands. Figure 4-5 shows the locations of the potential recycle water users.
Table 4-6 Potential Non-Potable Water Demands Met with Treated Runoff
Total Demand Served Service Area
(acre-ft/year) (million gallon/year)
Aliso Wash 1,400 460
Canoga 3,250 1,050
Reseda 2,900 950
Tujunga / Burbank 9,050 2,950
LA River Reach 3 1,100 360
Dominguez Channel 8,500 2,770
Compton Creek 1,450 470
Ballona 10,850 3,530
Verdugo Wash 100 30
LA River/Arroyo 9,600 3,130
Total 48,200 15,700 Note: Source: Calculated data based on the recycled water model developed by the Southern California Comprehensive Water Reclamation and Reuse Study (Allocation and Distribution Model (ADM), a GIS based computer model). See Facilities Plan Volume #: Water Management for details on the model.

%[ %[
%[%[
%[%[
%[
%[
%[
%[
%[
%[
%[
%[
%[
%[
%[
%[
#### ###### ### ## #### # #### # ## #### ##### # ### #### #### ## #### ## ### # ### ### ##### # ### #### # ### # #### ### #### ### ## # ### ##### ## ### ### ## ## ##### # ### ### ## # ## #### ## ## ## # #### ## # ## # ## ## ###### # # ### ##### # # ## # ##### ### # # ### # ### ## ### ### #### ## # ## ### ## ## ## ## ## ###### ###### ## ### ### # #### # ##### ## ## ## # ## ## ## ##### #### ## ## # ## #### # ### #### ## # ## ## ### ###### ## ### # #### ## ## # ##### # # ###### ###### ## ## #### # ####### #
## #
####### # # ## ### ## ## # ## # ## ## ### #### ### ### # ## ## #### # ## ## # ##### ##### ### ######## # #### ### ### ### # ### #### ## ###### # ## ### ### ## ### ### # #### ## # ######## ### # ## # # ## ### # ## ## ### ### # # ### ###### ## #### ## ## # ## ## # # # # #### ### # # ## ### # ### ### # ## ## ## # ## # ### ### ## ## ## ## # ### ## ## ## ## # ### ## ##### ##### ### ### ### ### #### #### # #### # ## ## #### #### # ## ##### ##### # ##### ### ## #### ## # # ## ## #### ### ### ## #### ## # # #### # # # ## ### # ### ## ## ##### # ##### ## ## ## ###### ### ###
#
#### ## # #### # ## # # #### ### ## ## #### # ## ### # ## #### # ## ## # #
# #
##### # ## # ## ## # #### ### ### # # ### ## #### ######## ### #### # ## #### ### ####### ## ## # #### ## # ## ## ## ### ### # ## ## ###### # #### ## ##### ## ##### # ## # ### ## ## ## ### # ## #### ### ##### ### #### # ## #### # ## ### ## #### ##### #### ## # ## #### ## # #### # #### # #### # # # ## ## ### # # ### # ### ## ### ## # #### ## ## # ### ## #### ## # # # #### ## ## ## ### # ## ## # ## #### # ## ## # ## # ## # ## ### #### ### ## ## #### #### # # # ## ## # # ## # ## ## # ### ### ## #### ####### ### #####
## # ### # ##### # # # ######### ####### #### ### ####### ## ## ## ## #### ## ## ## # ## # # #####
##### ## ### ## ## ## ## # ###### # ## ## # ##### # ## #### #
#######
##### #### # ###
## ## #### ## #### # ## ### ### ### ## # ## ############# #####
## #### ######## #### ### # ### ### # # # #### ###### ### ## ##### ### ## ## #### ###### ### ########## ### # ## # # ### ## ##### ## ## #
%U%U
%U %U %U %U%U
%U
%U
%U %U
%U
%U
%U
%U
%U
%U
%U
Sepulveda Channel
Ballona Creek
Compton Creek
Dominguez Channel
LA River Reach 2
Arroyo Seco
Verdugo Wash
LA River Reach 3Tujunga Wash
Burbank Western Channel
Pacoima Wash
Bull CreekCaballero Creek
Aliso Wash
Limekiln Canyon
Wilbur Wash
Browns Creek
Bell Creek
Canoga
Aliso Wash
Reseda
Tujunga/Burbank
LA River Reach 3
Verdugo Wash
Compton Creek
Ballona
Dominguez Channel
LAR/Arroyo
N
Draft Runoff Alternatives
Supply in Analysis%U
Pipelines
Brine - Existing/Future
Reclaimed Water - Existing/Future
Outfall/Discharge Lines - Existing/Future
Supply Not in Analysis%[
Features
Existing Pipelines with Available Capacity
Major Highways
Major Body of Water
Major RiversReclaimed Water - Existing/Future
# Potential Demands
# Demands Connected
6 0 6 12 Miles

Section 4 Runoff Management
4-16 Summary Report Section 4 - Runoff.doc
In meeting these recycled water demands, facilities that would need to be constructed include: runoff diversion facilities, possibly with operating storage, treatment facilities (as in the Treatment and Discharge Option section above) treated to Title 22 standards, pipeline for collection and distribution and pumping stations.
4.4.4.3 Diversion to Wetlands Wetlands are another type of project that may be used to implement the beneficial use option. Wetlands are considered a beneficial use as they do many things to improve the community and environment (such as restore habitat), are aesthetically pleasing, are considered a public amenity, etc.
Current empty land is the optimum place for constructing new wetlands, and open space and vacant land within the City was considered as potentially suitable areas. The approximate maximum acreage available is 2,700 acres. For planning purposes, 10 percent of the open space acreage (or approximately 300 acres) was considered as potentially suitable for development of wetlands. Typical loading rates for wetlands range from 2 to 10 cm/day (0.066 to 0.328 ft/day). The optimum loading rate depends on a variety of factors including type of wetland and flow (i.e., surface or subsurface) and would be determined on a site specific basis. Based on these values, 7,200 to 35,900 acre-ft/yr (2,350 to 11,700 MG/yr) of runoff flow could be beneficially used as wetland areas.
4.5 Wet Weather Runoff Wet weather runoff is any runoff that occurs as a direct result of rainfall. Wet weather runoff represents a significantly larger volume of water than dry weather runoff. For this reason, it is not reasonable to expect that all wet weather flows can be managed. The wet weather runoff volume to be managed is primarily dependant on either meeting TMDLs or maximizing beneficial uses. Based on the anticipated TMDL requirements and on historical rainfall information, an average amount of runoff per storm to be captured and treated or diverted was determined.
4.5.1 Wet Weather Runoff Volume The City of Los Angeles covers approximately 295,000 acres (465 square miles) and receives a long-term annual average rainfall of about 14.95 inches of rain per year (based on National Weather Service Data). For purposes of runoff management planning, long-term annual average precipitation and existing land use distribution were used to calculate total runoff for each of the watersheds, and assuming a 2 percent new development in by the year 2020. The long-term average annual total wet weather runoff from land within the City jurisdiction was calculated to be 174,000 acre-feet/yr.
For the purposes of IRP planning, needs were assessed and facility planning conducted for runoff generated from the City only. The management of runoff from outside the City was not evaluated as part of this effort, though during implementation in some instances, the City may partner with other jurisdictions for

Section 4 Runoff Management
4-17
Section 4 - Runoff.doc Summary Report
finding the most appropriate solutions. Therefore managing runoff volumes depended on Citywide land use, but the watershed values were defined as well.
Estimated wet weather runoff volumes are presented in Table 4-7.
Table 4-7 Estimated Wet Weather Runoff Volume
City of Los Angeles Entire Watershed
Watershed Area1 (Acres) Average Annual
Rainfall2 (acre-feet/yr)
Average Annual Runoff3 (acre-
feet/yr)
Average Annual Volume (million gallons)
Area1 (Acres)
Average Annual Rainfall (acre-
feet/yr)
Los Angeles River 185,000 230,500 108,300 35,300 533,000 664,000 Ballona Creek 67,000 83,500 39,000 12,700 84,000 104,700 Santa Monica Bay (excl. Ballona Creek) 28,000 34,900 16,300 5,300 182,000 226,700
Dominguez Channel 15,000 18,700 8,700 2,900 70,000 87,200 Increase from Total New Development by 20204 NA NA 2,000 NA NA NA
Total 295,000 367,600 174,300 56,200 869,000 1,082,600 Notes: 1 Areas from City of LA GIS database. 2 Rain gauge. rainfall = Area x 14.95 inches of rain per year, rainfall from National Weather Service Data, measured at LAX rain gauge. 3 Calculation based on a runoff coefficient of 0.47, derived from the Watershed Protection Division’s Pollutant Load Model. 4 Total runoff reflects the assumed 2% new developments by 2020.
The targeted wet weather flows were determined based on an analysis of historic rainfall data and the 17 exceedence days allowed, assuming that similar requirements will be set for other watersheds, and it was determined that the 0.45 inch storm was assumed to be the “largest targeted storm” that needs to be managed in order to meet the Santa Monica Bay Bacterial TMDL. Assuming that similar requirements will be set for other emerging TMDLs, it was assumed that the 0.45 inch storm is the largest targeted storm.
Since the current requirements at the time of development only included managing the runoff from the Santa Monica Bay WMA, the requirement for managing wet weather runoff was 160 million gallons in one event. In anticipating potential regulations for wet weather runoff, the planning assumption used was to assume that similar implementation requirements to the current Santa Monica Bay TMDLs would affect the rest of the City. If these requirements were to be implemented, the City would potentially need to manage up to 5,200 acre-feet (1,700 million gallons) of runoff per event.
Estimate wet weather flows per runoff planning shed are presented in Table 4-8.

Section 4 Runoff Management
4-18 Summary Report Section 4 - Runoff.doc
Table 4-8 Wet Weather Flows by Runoff Planning Shed
No. Runoff Planning Shed Flow (mgd) 1 Bell Creek 65 2 Browns Creek 70 3 Aliso Wash 50 4 Wilbur Wash 25 5 Limekiln Canyon 35 6 Caballero Canyon 30 7 Bull Creek 75 8 Tujunga Wash 190 9 Pacoima Wash 160
10 Arroyo Seco 75 11 LA River Reach 3 80 12 LA River Reach 2 85 13 Burbank Western Channel 50 14 Verdugo Wash 5 15
Los Angeles River WMA
Compton Creek 60 16 Ballona Creek 90 17
Ballona Creek WMA Sepulveda Channel 285
18 Dominguez Channel WMA Dominguez Channel 110 19 Santa Monica Bay 1 125 20 Santa Monica Bay 2 30 21
Santa Monica Bay WMA Santa Monica Bay 3 5
Total 1,700 Notes: 1. Assumes all captured flow from a 0.45 inch storm event would be drained from operational storage and
treated for discharge over a 24-hour period. Source: Calculated data based on City’s GIS database and runoff rates, wet weather based on based on areas and 0.45-inch target storm, 0.47 runoff coefficient, as detailed in Facilities Plan Volume 3: Runoff Management.
4.5.2 Wet Weather Runoff Quality The following Table 4-9 represents the runoff water quality data that was available for the IRP.
Table 4-9 Water Quality Data In Ballona Creek and the Los Angeles River
General Chemicals and Minerals Parameter Water Quality Data
Units Ballona Creek (1994 – 2000 Mean)
Los Angeles River (1994 – 2000 Mean)
General Chemicals and Minerals pH N/A 7.3 7
Hardness mg/L 103 79
Turbidity NTU 74 127

Section 4 Runoff Management
4-19
Section 4 - Runoff.doc Summary Report
Table 4-9 Water Quality Data In Ballona Creek and the Los Angeles River
General Chemicals and Minerals Parameter Water Quality Data
Units Ballona Creek (1994 – 2000 Mean)
Los Angeles River (1994 – 2000 Mean)
Sulfate (SO4) mg/L 39 28
Chloride mg/L 24 16
Total suspended solids (TSS) mg/L 191 366
Detergents (as MBAS) mg/L 0.1 0.05
Fluoride mg/L 0.2 0.15
Cyanide mg/L S.I.D. S.I.D.
Total dissolved solids (TDS) mg/L 199 144
Calcium mg/L 27 23
Magnesium mg/L 8 5.9
Potassium mg/L 3.2 3.7
Sodium mg/L 20 17
Bicarbonate mg/L 67 45
Nitrate mg/L 4.1 4.5
Alkalinity mg/L 63 42
Chemical Oxygen Demand (COD) mg/L 103 79
Specific Conductance umhos/cm 317 227
Volatile Suspended Solids (VSS) mg/L/hr 57 66
Total Organic Carbon (TOC) mg/L 10 10
Total Petroleum Hydrocarbons (TPH) mg/L 2.5 2.5
Oil and Grease mg/L 3.8 2.5
Biochemical oxygen demand (BOD) mg/L 29 26
Bacteria Total Coliform MPN/100 mL 1,704,131 2,213,291
Fecal Coliform MPN/100 mL 917,648 1,477,645
Fecal Streptococcus MPN/100 mL 531,761 757,013
Fecal Enterococcus MPN/100 mL 433,639 358,468
Nutrients Ammonia (NH3) mg/L 0.53 0.56
Nitrite-N (NO3) mg/L 0.14 0.15
Dissolved Phosphorus mg/L 0.25 0.42
Total Phosphorus mg/L 0.36 0.62
NH3-N mg/L 0.43 0.47
Nitrate-N mg/L 0.9 0.8
Total Kjehldal Nitrogen (TKN) mg/L 3.3 3.5
Metals Arsenic (As) μg/L S.I.D. 4
Barium (Ba) μg/L 54 106

Section 4 Runoff Management
4-20 Summary Report Section 4 - Runoff.doc
Table 4-9 Water Quality Data In Ballona Creek and the Los Angeles River
General Chemicals and Minerals Parameter Water Quality Data
Units Ballona Creek (1994 – 2000 Mean)
Los Angeles River (1994 – 2000 Mean)
Cadmium (Cd) μg/L S.I.D. 1.9
Copper (Cu) μg/L 22 49
Lead (Pb) μg/L 12 109
Nickel (Ni) μg/L 6.4 14.5
Zinc (Zn) μg/L 136 253 Notes: Monitoring Locations: Ballona Creek-Stream Gage No. F38C-R between Sawtelle Blvd and Sepulveda Blvd in the City of Los Angeles; Los Angeles River: Stream Gage No. F319-R between Willow St. and Wardlow Rd. in the City of Long Beach. S.I.D. Statistically Invalid Data, not enough data.
Only the constituents who had data available are listed in this table. Source of data: LOS ANGELES COUNTY, 1994-2000 INTEGRATED, RECEIVING WATER IMPACTS REPORT, found at: http://ladpw.org/wmd/NPDES/Int_report/Tables/Table_4-5a.pdf
4.5.3 Local/Neighborhood Solutions Several options that are designed to provide source control of wet weather urban runoff will also impact dry weather urban runoff. While these options would be designed to manage the higher wet weather flows, once they are in place they would be able to manage dry weather flows as well.
4.5.3.1 New/Redevelopment Areas - Onsite treatment/discharge An option identified for onsite treatment and discharge is a bioretention area. In this option, runoff is directed into shallow landscaped depressions, and these depressions and the surrounding areas are designed to provide onsite treatment, incorporating many of the pollutant removal mechanisms that operate in forested ecosystems.
4.5.3.2 New/Redevelopment Areas - On-site percolation The following three BMPs require soils that allow for infiltration:
Retention Grading - a "sunken garden" that holds runoff and rainwater until it can be absorbed into the ground;
Driveway Dry Well - involve adding a grate at the end of the driveway designed to capture and store stormwater until the water percolates into the subsurface soils, essentially acting as a small dry pond;
Porous Pavement - Porous pavement is a special type of material used to allow water to pass through while being strong enough to support vehicular traffic.

Section 4 Runoff Management
4-21
Section 4 - Runoff.doc Summary Report
Based on the City’s GIS database, an analysis of historic rainfall data and average water use information, an estimate of the amount of runoff that could be managed by these onsite capture and treatment options was determined for various land uses in the east San Fernando Valley. These values are presented in Table 4-10. Figure 4-6 shows the areas in the City where soils are “good” for infiltration (i.e. optimal for implementing infiltration options), “fair” or “poor” for infiltration. As shown, only the east San Fernando Valley was targeted for this study, as only the soils in this area are optimal for infiltration.
4.5.3.3 Retrofit Areas – Cisterns Rain Barrels and Cisterns - Rain barrels and cisterns are low-cost water conservation devices that can be used to reduce runoff volume and, for smaller storm events, delay and reduce the peak runoff flow rates. They store and divert runoff from impervious roof areas. This stored runoff can provide a source of chemically untreated 'soft water' for gardens and compost, free of most sediment and dissolved salts.
Cisterns were analyzed to determine the amount of runoff that could be managed. Cisterns store and divert runoff from impervious roof areas. The cistern analysis consisted of estimating the potential runoff volume reduction and potable water savings by irrigating residential landscaping with captured storm water for cistern systems ranging in size from 60 to 10,000 gallons. In addition, the size of a system to capture and use all of the captured rainwater over a selected 11-year historical rainfall period was determined. The effect of installing cisterns on all residences in the City to manage runoff from the design storm (0.45 inches) was also analyzed. Of the estimated 1,700 million gallons of runoff from a 0.45-inch storm, approximately 440 million gallons could be captured in cisterns, assuming 1,000-gallon cisterns are installed to capture runoff from the roofs of all single and multi-family residences. While this provides a substantial amount of water conservation and can significantly reduce the amount of runoff to be managed in the storm drain system, it is not a reliable method by itself for meeting TMDL requirements since the cisterns may be full at the start of the storm.
City Boundary
Legend
Figure 4-6Soils Map
Soil Type

Section 4 Runoff Management
4-22 Summary Report Section 4 - Runoff.doc
4.5.3.4 Retrofit Areas – Onsite Percolation Onsite percolation at retrofit areas are the same as those discussed above in Section 4.5.3.2 for onsite percolation at the new and redevelopment areas.
4.5.3.5 Neighborhood Recharge Another method of managing runoff at the source is neighborhood recharge. Neighborhood recharge involves installing recharge facilities in portions of vacant urban lots, abandoned alleys, and City parklands, where the soil is highly permeable. This option involves installing underground storage, such as a honeycomb shaped device that allows the runoff to be stored underground, while still maintaining a safe area above ground for human activity. Again only the east San Fernando Valley was assumed to be suitable for neighborhood recharge. Based on known infiltration rates, land use and flow from the 0.45 inch storm, it was determined that the entire 500 million gallons of flow from the east San Fernando Valley could be managed by neighborhood recharge.
4.5.4 Regional Solutions Regional solutions to managing runoff are solutions that serve to manage runoff from a regional or subwatershed wide basis. As opposed to managing or reducing the runoff at its source, these solutions serve to manage a larger amount of flow after it has been generated. Regional solutions would be used in conjunction with local solutions.
4.5.4.1 Non-Urban Regional Recharge This option considered regional recharge of captured dry and wet weather runoff to groundwater storage in basins from which the City receives water. The regional recharge option focused on large scale projects to capture and infiltrate runoff from large areas within the City. As such, regional recharge is primarily a viable option for managing wet weather runoff. However, if the facilities were in place to manage wet weather runoff, the same facilities could be used for dry weather runoff as well.
As protection of groundwater quality is of paramount importance, runoff source quality, including considerations of pre-treatment, plays a key role in determining options.
Table 4-10 Wet Weather Runoff Managed by On-Site Percolation
Land Use Runoff Generated
Citywide Runoff Managed in
East Valley Residential 123 mgd 26 mgd Commercial 185 mgd 39 mgd Government Facilities 4 mgd 1 mgd Schools 15 mgd 3 mgd Recreational Areas and Cemeteries 5 mgd 1 mgd Total 332 mgd 71 mgd

Section 4 Runoff Management
4-23
Section 4 - Runoff.doc Summary Report
Basin Characteristics and Potential Locations In order to consider groundwater recharge as an option for beneficial use of runoff, appropriate locations with adequate capacity for infiltrating the runoff into local groundwater basins were identified.
Based on available storage information from the document Groundwater and Surface Water in Southern California, A Guide to Conjunctive Use (Published by the Association of Groundwater Agencies), as well as geology within the basins, it was determined that the basin in the eastern part of the San Fernando Valley is the only basin suitable for groundwater infiltration. Here, the soil is sandy with a deep groundwater level, which is optimal for infiltration, as discussed in Section 4.5.3.2, and shown in Figure 4-6, the areas in the City where soils are “good” for infiltration (i.e. optimal for implementing infiltration options), “fair” or “poor” for infiltration.
Based on these basin characteristics, the IRP primarily looked at regional recharge options within the east San Fernando Valley Basin only, with the possibility of also transporting flows from the west San Fernando Valley to the basins in the east.
For wet weather runoff, the total runoff generated in the Valley from a 0.45 inch storm event is 4,000 acre-feet (1,300 million gallons) watershed-wide, and 2,900 acre-feet (750 million gallons) for the City only. This amount could potentially all be diverted to the groundwater basins in the East Valley. Additionally, since dry weather flows are less than the flow from the 0.45 inch storm, the spreading grounds could manage all of the dry weather flow. However, the water quality of dry weather flow would need to be addressed prior to diverting any flow to the basins.
These amounts account for the runoff from the 0.45-inch storm only. As this represents approximately 25 percent of the total annual runoff generated in the City, there is a great deal more runoff available to recharge. Once the capture, storage, and diversion facilities are in place, flows from storms that exceed 0.45 inches can be diverted as well.
Considerations for Regional Recharge The regional recharge option includes using existing regional spreading grounds such as Hansen, Pacoima, or a new constructed facility. Discussions with DWP has determined several challenges to this use including the following: the necessity of seasonal storage because the spreading grounds are currently being used during storm events , the possibility of seasonal storage at several gravel pits, and the necessity of ensuring that only high quality water is infiltrated to the groundwater.
4.5.4.2 Treatment and Discharge or Beneficial Use 4.5.4.2.1 Treatment and Discharge Under this option, runoff from the target storm event (up to 160 mgd to meet the current requirement at the time of development) would be diverted, held in temporary operational storage, treated and discharged. For example, for the adopted bacteria TMDL, three conceptual treatment plants were identified along the coast,

Section 4 Runoff Management
4-24 Summary Report Section 4 - Runoff.doc
which are shown in Figure 4-4 and listed in Table 4-11, with operational storage up to the volume of runoff in one day. The flow to each of these treatment plants is shown in Table 4-11.
Table 4-11 Proposed Coastal Treatment Plants
Proposed Treatment Facility Volume of Runoff in One Day (million gallons)
Santa Monica Bay 1 125 Santa Monica Bay 2 30 Santa Monica Bay 3 5
Note: Source: Calculated based on City GIS data and runoff rate (see Section 4).
In order to divert the flows to a treatment and discharge facility, the runoff would have to be captured and a collection system installed, then possibly pumped to the facility, and treated. Treatment considerations will depend upon the target constituents. Additionally, storage equal to at least the daily volume would need to be provided. The plant would need to be designed to treat that volume in one day in order to be prepared for another storm event the following day.
Meeting Potential Future Requirements To meet potential future regulations using treatment and discharge as the option, up to 21 diversion and treatment plants would be needed. These treatment plants could be located at the same diversion points shown in Figure 4-4. Table 4-8 identifies the potential design flow rate for each of these treatment plants. Each plant would also need operational storage equal to the amount of runoff generated in one day. A collection system and pumping stations would also be required.
4.5.4.2.2 Treatment and Beneficial Use For this option, treated runoff would be beneficially used instead of discharged to receiving waters. Basically, the same treatment plants described in the previous section for treatment and discharge would be built, but rather than discharging the effluent back into the receiving waters, the flow would be beneficially reused.
For the Santa Monica Bay watershed, the design flows indicated in Table 4-11 could be met through treatment and beneficial use. The volume would require seasonal storage up to the amount of runoff flow in one day.
Seasonal Storage for Beneficial Use When addressing the potential future requirements throughout the City, identifying storage possibilities is the controlling factor. The total wet weather volume for the entire City that would need to be managed in order to meet potential TMDL implementation requirements is 43,000 acre-feet/yr (14,000 million gallons annually).
The ability to beneficially use wet weather runoff will greatly depend on the seasonal storage capacity, since the primary beneficial use of runoff is to meet irrigation

Section 4 Runoff Management
4-25
Section 4 - Runoff.doc Summary Report
demands. Since these demands are typically non-existent during rain events and low throughout the rainy season, the wet weather runoff would need to be stored until the demand exists.
There are two ways to store wet weather runoff throughout the City the first is a regional approach and the second is a more localized approach.
A regional approach would include the use of out-of-service reservoirs for seasonal storage. Conversion of the out-of-service Chatsworth Reservoir is one option for storing the wet weather runoff. The total volume available in the Chatsworth Reservoir is 10,600 acre-feet (3,500 million gallons). Assuming that the reservoir has an available operating capacity of 50 percent, there is the potential to store approximately 5,300 acre-feet (1,750 million gallons). This leaves up to 32,400 acre-feet (12,250 million gallons) that would need to be stored elsewhere. Using the Chatsworth Reservoir would require that runoff be diverted to it, which would require a collection system, pumping stations, and treatment either before storage or before the beneficial use. Additionally, the Chatsworth Reservoir was taken out of service due to seismic concerns and significant structural improvements and studies would be needed in order to make it useable.
A more localized approach to seasonal storage would be to construct distributed underground storage facilities, locally located in open spaces, parks, schools, etc. throughout the City, as summarized in Table 4-12. There are several types of underground storage facilities that can be considered, including modular storage media which is a honeycomb-like box that is installed underground.
Table 4-12 Underground Storage Potential throughout the City
Open space Acres (acres)
Potential Storage Volume1 (million gallons)
Schools (assume only ~ 25 percent suitable land)
6,000 15,000
Alleys 1,500 4,000 Total 900 count Unknown 7,500 19,000
Note: 1. Assuming 2.44 million gallons of storage per acre of land (based on modular storage media, 8-ft deep. Source: SCAG land use data; storage volume based on area and 8-feet of depth.
Based on these values, the City theoretically has the potential to store the entire volume of wet weather runoff in order to meet the potential future regulations if the Chatsworth Reservoir as well as the underground storage options were utilized. This stored water could then draw down and be beneficially used during the dry weather months. Ways of beneficially reusing wet weather runoff are similar to those discussed for dry weather runoff.

Section 4 Runoff Management
4-26 Summary Report Section 4 - Runoff.doc
4.6 Summary There are five main categories of runoff management options for the IRP including: source controls, diversion to the sewer system, treatment and discharge, direct beneficial use and regional recharge. Unlike the wastewater system, described in Section 2 of this document, in which the options are on an either/or basis, for runoff management the options build upon one another and can be combined in various ways, indicating varying levels of runoff management. This is further detailed in Section 5, Alternatives Development and Analysis.

5-1
Section 5 - Alternatives.doc Summary Report
Section 5 Alternatives Development and Analysis
5.1 Approach for Developing and Evaluating Alternatives
The approach to developing and evaluating alternatives took into account the integration of options from each of the service functions (i.e., wastewater, recycled water and runoff). This section summarizes the approach used to create alternatives, evaluate them using criteria developed by the IRP stakeholders, revise them based on the evaluation and ultimately recommend a short list to continue through the environmental analysis. A complete description of the steps taken is described in the Facilities Plan Volume 4: Alternatives Development and Analysis.
Figure 5-1 illustrates the steps that were taken to identify the final alternatives.
5.2 IRP Objectives, Sub-Objectives and Performance Measures
An essential role of the Steering Group during the first phase of the IRP was to determine the objectives for the planning process. These objectives provided the framework for developing and evaluating alternatives, and they were eventually reflected in the IRP Guiding Principles. This section will summarize IRP objectives and performance measures, which combined constitute the evaluation criteria used to analyze alternatives.
Figure 5-1IRP Alternatives Analysis Process Chart
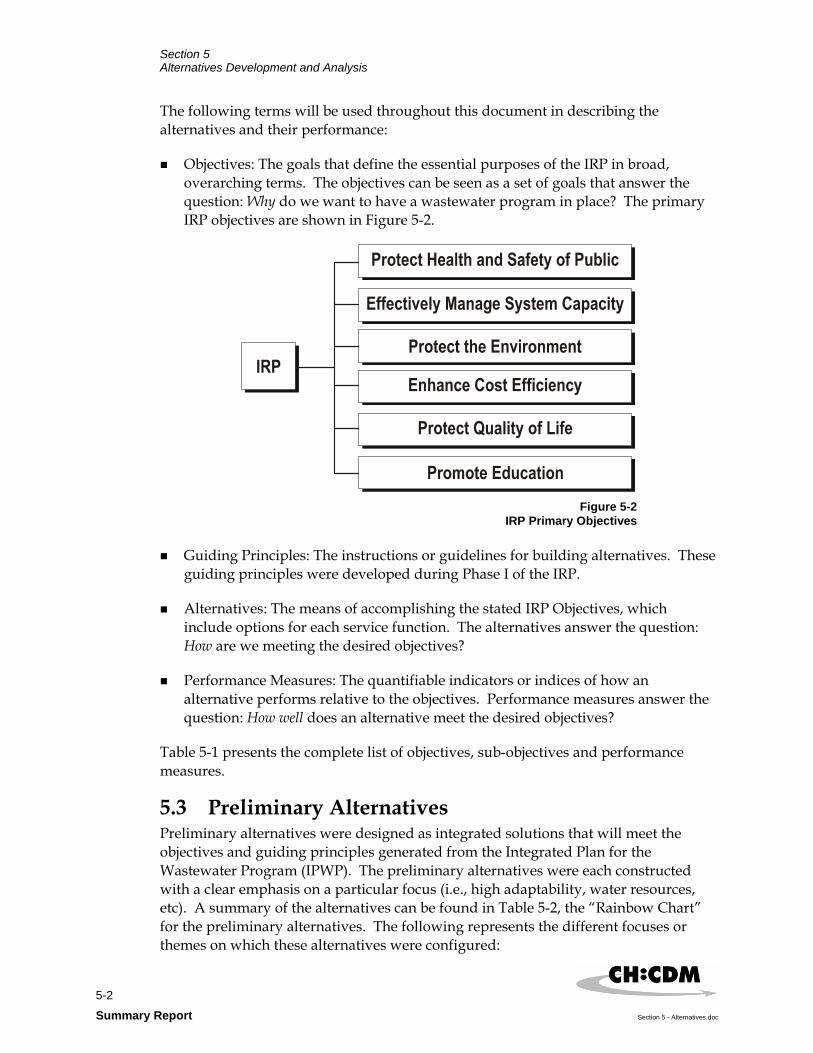
Section 5 Alternatives Development and Analysis
5-2 Summary Report Section 5 - Alternatives.doc
The following terms will be used throughout this document in describing the alternatives and their performance:
Objectives: The goals that define the essential purposes of the IRP in broad, overarching terms. The objectives can be seen as a set of goals that answer the question: Why do we want to have a wastewater program in place? The primary IRP objectives are shown in Figure 5-2.
Guiding Principles: The instructions or guidelines for building alternatives. These guiding principles were developed during Phase I of the IRP.
Alternatives: The means of accomplishing the stated IRP Objectives, which include options for each service function. The alternatives answer the question: How are we meeting the desired objectives?
Performance Measures: The quantifiable indicators or indices of how an alternative performs relative to the objectives. Performance measures answer the question: How well does an alternative meet the desired objectives?
Table 5-1 presents the complete list of objectives, sub-objectives and performance measures.
5.3 Preliminary Alternatives Preliminary alternatives were designed as integrated solutions that will meet the objectives and guiding principles generated from the Integrated Plan for the Wastewater Program (IPWP). The preliminary alternatives were each constructed with a clear emphasis on a particular focus (i.e., high adaptability, water resources, etc). A summary of the alternatives can be found in Table 5-2, the “Rainbow Chart” for the preliminary alternatives. The following represents the different focuses or themes on which these alternatives were configured:
Figure 5-2 IRP Primary Objectives
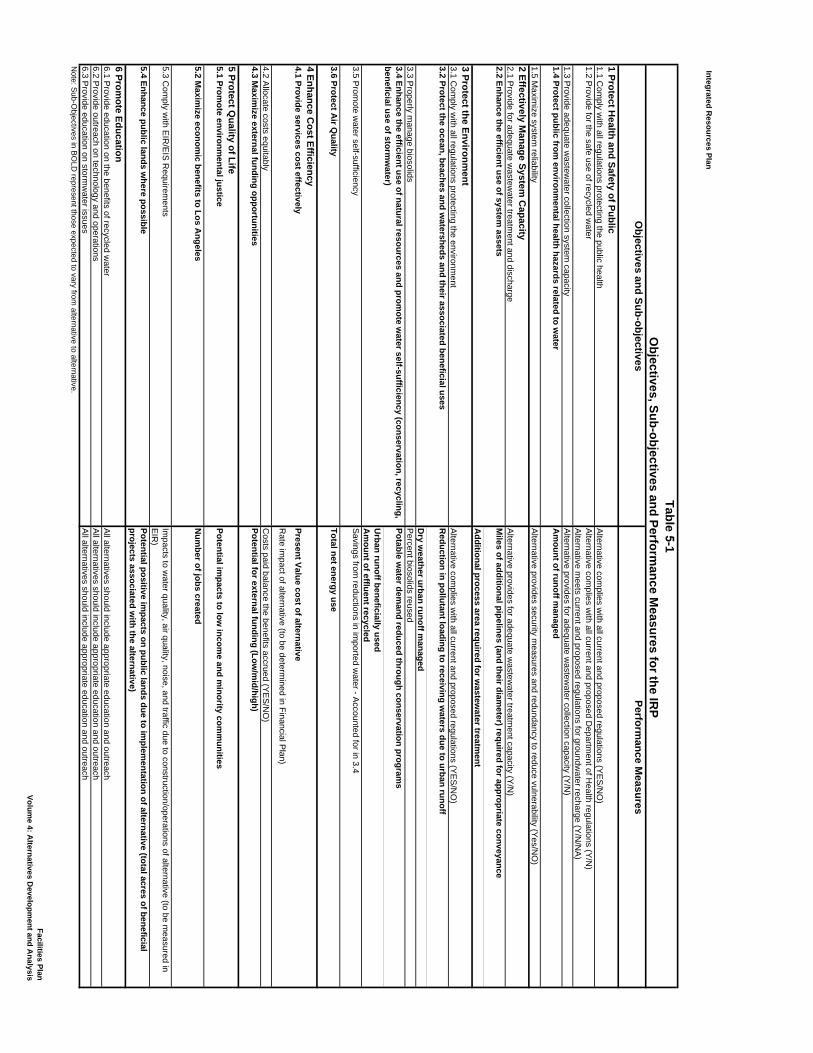
Integrated Resources Plan
Objectives and Sub-objectives
Performance M
easures
1 Protect Health and Safety of Public
1.1 Com
ply with all regulations protecting the public health
Alternative com
plies with all current and proposed regulations (Y
ES
/NO
)1.2 P
rovide for the safe use of recycled water
Alternative com
plies with all current and proposed D
epartment of H
ealth regulations (Y/N
)A
lternative meets current and proposed regulations for groundw
ater recharge (Y/N
/NA
)1.3 P
rovide adequate wastew
ater collection system capacity
Alternative provides for adequate w
astewater collection capacity (Y
/N)
1.4 Protect public from environm
ental health hazards related to water
Am
ount of runoff managed
1.5 Maxim
ize system reliability
Alternative provides security m
easures and redundancy to reduce vulnerability (Yes/N
O)
2 Effectively Manage System
Capacity
2.1 Provide for adequate w
astewater treatm
ent and dischargeA
lternative provides for adequate wastew
ater treatment capacity (Y
/N)
2.2 Enhance the efficient use of system assets
Miles of additional pipelines (and their diam
eter) required for appropriate conveyance
Additional process area required for w
astewater treatm
ent3 Protect the Environm
ent3.1 C
omply w
ith all regulations protecting the environment
Alternative com
plies with all current and proposed regulations (Y
ES
/NO
)3.2 Protect the ocean, beaches and w
atersheds and their associated beneficial usesR
eduction in pollutant loading to receiving waters due to urban runoff
Dry w
eather urban runoff managed
3.3 Properly m
anage biosolidsP
ercent biosolids reused3.4 Enhance the efficient use of natural resources and prom
ote water self-sufficiency (conservation, recycling,
beneficial use of stormw
ater)Potable w
ater demand reduced through conservation program
s
Urban runoff beneficially used
Am
ount of effluent recycled3.5 P
romote w
ater self-sufficiencyS
avings from reductions in im
ported water - A
ccounted for in 3.4
3.6 Protect Air Q
ualityTotal net energy use
4 Enhance Cost Efficiency
4.1 Provide services cost effectivelyPresent Value cost of alternative
Rate im
pact of alternative (to be determined in Financial P
lan)
4.2 Allocate costs equitably
Costs paid balance the benefits accrued (Y
ES
/NO
)4.3 M
aximize external funding opportunities
Potential for external funding (Low/m
id/high)
5 Protect Quality of Life
5.1 Promote environm
ental justicePotential im
pacts to low incom
e and minority com
munities
5.2 Maxim
ize economic benefits to Los A
ngelesN
umber of jobs created
5.3 Com
ply with E
IR/E
IS R
equirements
Impacts to w
ater quality, air quality, noise, and traffic due to construction/operations of alternative (to be measured in
EIR
)5.4 Enhance public lands w
here possiblePotential positive im
pacts on public lands due to implem
entation of alternative (total acres of beneficial projects associated w
ith the alternative)6 Prom
ote Education6.1 P
rovide education on the benefits of recycled water
All alternatives should include appropriate education and outreach
6.2 Provide outreach on technology and operations
All alternatives should include appropriate education and outreach
6.3 Provide education on storm
water issues
All alternatives should include appropriate education and outreach
Note: S
ub-Objectives in B
OLD
represent those expected to vary from alternative to alternative.
Objectives, Sub-objectives and Perform
ance Measures for the IR
PTable 5-1
Facilities PlanVolum
e 4: Alternatives D
evelopment and A
nalysis

Section 5 Alternatives Development and Analysis
5-4 Summary Report Section 5 - Alternatives.doc
Low cost/minimum requirements: Alternative includes lower cost solutions to meet minimum requirements
High beneficial use of water resources: Alternatives offer higher levels of water recycling, conservation and beneficial use of runoff to reduce imported water supplies
High adaptability : Alternatives provide adaptability to respond to changing conditions (e.g., changing flows, technology, or regulations)
More decentralized: Alternative includes more and smaller local projects rather than fewer and larger regional projects.
Lower risk: Alternatives offer relatively lower risk from either regulatory or from an ease-of-implementation perspective. Because these two definitions can be contradictory, several different low risk alternatives were created.
5.3.1 Evaluation of Preliminary Alternatives The alternatives analysis approach required a decision model to process the complex technical information and to synthesize it according to the objectives and preferences of each Steering Group member that participated in the surveys. Decision modeling is a tool used to aid in selecting one or more preferred alternatives - a process that rapidly increases in complexity as the numbers of alternatives, evaluation criteria, and stakeholders increase. Figure 5-3 represents the steps involved in the decision modeling process.
5.4 Hybrid Alternatives To create the hybrid alternatives, the team sought feedback from the Steering Group and identified key concepts to carry forward. The goal was to create alternatives that combined the best elements of the preliminary alternatives, thereby allowing them to perform better than the original preliminary alternatives.
ObjectiveWeighting
Overall Score For One Alternative
Alt
1 A
lt 2
Alt
3 A
lt 4
Set of Scores
Performance Measure “Report Card” Result for an Objective
Satis
fact
ion
Leve
l
Figure 5-3Decision Modeling

Table 5-2City of Los AngelesIntegrated Resources Plan (IRP) - Preliminary Alternatives Matrix
Option LCMR WR1a WR1b WR2a WR2b WR3a WR3b HA1 HA2 MD LR1 LR2Wastewater Treatment
Tillman - Upgrade treatment (64 mgd) (Advanced Treatment) 64 mgd 64 mgd 64 mgd 64 mgd 64 mgd 64 mgdTillman - Upgrade and increase capacity to 80 mgd (Advanced Treatment) 80 mgdTillman - Upgrade and increase capacity to 100 mgd (Advanced Treatment) 100 mgd100 mgdTillman - Upgrade and increase capacity to 120 mgd (Advanced Treatment) 120 mgd120 mgd 120 mgdLos Angeles-Glendale - Maintain existing capacity (15 mgd) (Title 22) 15 mgd 15 mgd 15 mgdLos Angeles-Glendale - Increase capacity to 20 mgd (Title 22) 20 mgd 20 mgd 20 mgd 20 mgdLos Angeles-Glendale - Increase capacity to 30 mgd (Title 22) 30 mgd 30 mgdLos Angeles-Glendale - Upgrade treatment (15 mgd) (Advanced Treatment) 15 mgdLos Angeles-Glendale - Upgrade and increase capacity to 30 mgd (Advanced Treatment) 30 mgd 30 mgdNew Reclamation Plant - Build 10 mgd capacity near downtown (Title 22) 10 mgd 10 mgdNew Reclamation Plant - Build 30 mgd capacity in valley (Title 22) 30 mgd 30 mgdNew Reclamation Plant - Build 10 mgd capacity near downtown (Advanced Treatment) 10 mgdNew Reclamation Plant - Build 30 mgd capacity in valley (Advanced Treatment) 30 mgdHyperion - Maintain existing capacity (450 mgd) 450 mgd450 mgd450 mgd450 mgd 450 mgd450 mgd 450 mgdHyperion - Increase capacity to 500 mgd 500 mgd 500 mgd500 mgd 500 mgdHyperion - Increase capacity to 550 mgd 550 mgdTerminal Island - Maintain existing capacity (30 mgd) 30 mgd 30 mgd 30 mgd 30 mgd 30 mgd 30 mgd 30 mgd 30 mgd 30 mgd 30 mgd 30 mgd 30 mgd
Wastewater Sewer SystemBuild new interceptor sewer - Valley Spring Lane Interceptor Sewer X X X X X X X X X XBuild new interceptor sewer - Glendale Burbank Interceptor Sewer (GBIS) X X X X X X X X X X X XBuild new interceptor sewer - North East Interceptor Sewer (NEIS) Phase 2 X X X X X X X X X X X XBuild new interceptor sewer - for New Plant (10 mgd - 2 miles) X X XBuild new interceptor sewer - for New Plant (30 mgd - 2 miles) X X XBuild new buried storage tank - 60 MG at Tillman X XBuild new buried storage tank - 20 MG at Los-Angeles Glendale X* X* X* X* X* X* X* X* X*Build new buried storage tank - 10 MG at new plant X* X* X*Build new buried storage tank - 20 MG at new plant X* X* X*
Recycled Water (Non-Potable Demands)Meet Los Angeles River minimum requirements using treated wastewater X X X X X X X X X X X XMeet Irrigation/Industry demands using treated wastewater (low/medium/high) Low High Medium High High High High Low Low Medium Low LowRecharge groundwater basin using treated wastewater HighMeet Irrigation/Industry demands using treated runoff (low/medium/high) Low LowRecharge groundwater basin using treated runoff High High High High High High
Conservation ProgramsIncrease conservation efforts to DWP's planned 2020 levels X X X X X X X X X X X XIncrease conservation efforts further X X X X X X X X X
Dry Weather Urban RunoffLocal/Neighborhood Solutions
Smart Irrigation X X X X X X X X XIncrease public education and participation X X X X X X X X X X X X
Regional SolutionsDiversion to Wastewater System (WW) or Divert to Urban Runoff Plant or wetlands and Beneficially Use (URP)1
Divert - coastal (10 mgd) WW WW WW WW WW WW WW WW WW WW WW WWDivert - inland (Bell Creek 2.8 mgd) WW WW URP URP WWDivert - inland (Browns Creek 3 mgd) WW WW URP URP WW WWDivert - inland (Aliso Wash 1.8 mgd) WW WW WWDivert - inland (Wilbur Wash 1 mgd) URP URP WW WWDivert - inland (Limekiln Canyon 1.5 mgd) URP URP WW WWDivert - inland (Caballero Canyon 1mgd) WW WW WW WWDivert - inland (Bull Creek 2.4 mgd) WW WW WW WWDivert - inland (Tujunga Wash 6 mgd) WWDivert - inland (Pacoima Wash 7 mgd) WW WWDivert - inland (Arroyo Seco 5 mgd) WWDivert - inland (Reach 3 LAR 4 mgd) WWDivert - inland (Reach 2 LAR-12 mgd) WWDivert - inland (Burbank Western Channel 1.8 mgd) WWDivert - inland (Compton Creek 2.6 mgd) URP URP WWDivert - inland (Ballona Creek 3.3 mgd) URP URP WWDivert - inland (Sepulveda Channel 16 mgd) WWDivert - inland (Dominguez Channel 16 mgd) WW
Percent of Dry Weather Runoff Managed (of watershed - 97 mgd) 10% 30% 30% 21% 28% 21% 28% 21% 21% 21% 100% 20%Wet Weather Urban Runoff
Local/Neighborhood SolutionsNew/Redevelopment Areas - On-site treatment/discharge X X X X X X X X X X X XNew/Redevelopment Areas - On-site percolation X X X X X X X X X X X XRetrofit Areas - Cisterns (On-site storage/use)
Residential (Low/Medium/High) Low Low High High High High HighSchools (Low/Medium/High) Low Low High High High High High HighGovernment (Low/Medium/High) Low Low High High High High High High
On-site percolation (infiltration trenches/basins, reduce paving/hardscape)Residential X X X X X X XSchools X X X X X X X XGovernment X X X X X X X XCommercial X X X X X X XRec/Cemetaries X X X X X X X X
Neighborhood rechargeVacant Lots (East Valley) (Low/Medium/High) MediumMedium Low Low Low Low High High Low HighParks/Open Space (East Valley) (Low/Medium/High) MediumMedium Low Low Low Low High High Low HighAbandoned Alleys (East Valley) (Low/Medium/High) MediumMedium Low Low Low Low High High Low High
Regional SolutionsNon-urban regional recharge X X X X X XRunoff treatment and beneficial use/discharge
Treat and benefical use/discharge (coastal area) X X X X X X X X X X X XTreat and benefical use/discharge (all areas) X
Percent of Representative storm (1/2-inch) managed (of citywide 1,700 mgd) 10% 48% 48% 58% 58% 58% 58% 39% 39% 55% 100% 42%Current/Anticipated Regulations Level of Compliance
California Toxics Rule Yes Yes Yes Yes Yes Yes Yes Yes Yes Yes Yes YesCurrent Total Maximum Daily Loads (TMDLs) - Bacteria (Santa Monica Bay), Trash Yes Yes Yes Yes Yes Yes Yes Yes Yes Yes Yes YesFuture Total Maximum Daily Loads (projection) No Partial Partial Partial Partial Partial Partial Partial Partial Partial Yes Partial
*Storage for daily (diurnal) peaks1Flows indicated assume no smart irrigation. Implementing smart irrigation citywide would reduce total dry weather runoff estimates by ~11 mgd
Notes:
Low Risk (LR)Low Cost/Min. Requirements
(LCMR)
More De-centralized
(MD)High Beneficial Use of Water Resources (WR) High Adaptability
(HA)
Definitions of areas of focus:Low Cost/Minimum Requirements: alternative includes lower cost solutions or low initial investment by meeting minimum requirements.High Beneficial Use of Water Resources: alternatives that include high levels of recycled water, conservation, and beneficial use of runoff that reduces use of imported water.High Adaptability: alternatives that are most able to adjust to changing conditions, such as population, wastewater flows and regulations.More Decentralized: alternatives with solutions based on many small-scale projects centered on small neighborhoods, households or even individuals, rather than fewer and larger regional projects.Lower Risk: alternatives that are lower in risk from a regulatory perspective (LR1) or in terms of ease of implementation from a technical, environmental and/or political and public acceptance perspective (LR2).
rainbow chart.xls - Original Draft Alts (12) 7/8/2004

Section 5 Alternatives Development and Analysis
5-6 Summary Report Section 5 - Alternatives.doc
Wastewater Story The following were identified as key concepts for the wastewater system:
Need more treatment capacity due to increased flows and runoff management
Do not need a brand new plant, it is more cost effective and less disruptive to add treatment capacity at the existing plants
Adding capacity of existing facilities (e.g., Tillman, LAG or Hyperion) has tradeoffs such as costs and flexibility
Based on these concepts, the hybrid alternatives built on three series of wastewater treatment combinations:
1) Expand Hyperion to 500 mgd and upgrade Tillman to advanced treatment
2) Expand Tillman to 80 mgd and LAG to 30 mgd (and upgrade both to advanced treatment)
3) Expand Tillman to 100 mgd (advanced)
Figure 5-4 shows the three wastewater combinations.
For each of the wastewater combinations, the same collection system components are included. These are described below:
Build new Glendale Burbank Interceptor Sewer (GBIS)
Build new North East Interceptor Sewer (NEIS) Phase 2
Build a new 60 million gallon (MG) buried wet weather storage tank with real-time control at Tillman and/or construction of the Valley Spring Lane Interceptor Sewer (VSLIS)
The NEIS Phase 2 project is included in the City’s baseline CIP, however, the odor control portion of this project will be identified as part of the IRP.
Water Management Story For the water components, the following were identified as key concepts that were important to the Steering Group member, staff, and the technical team:
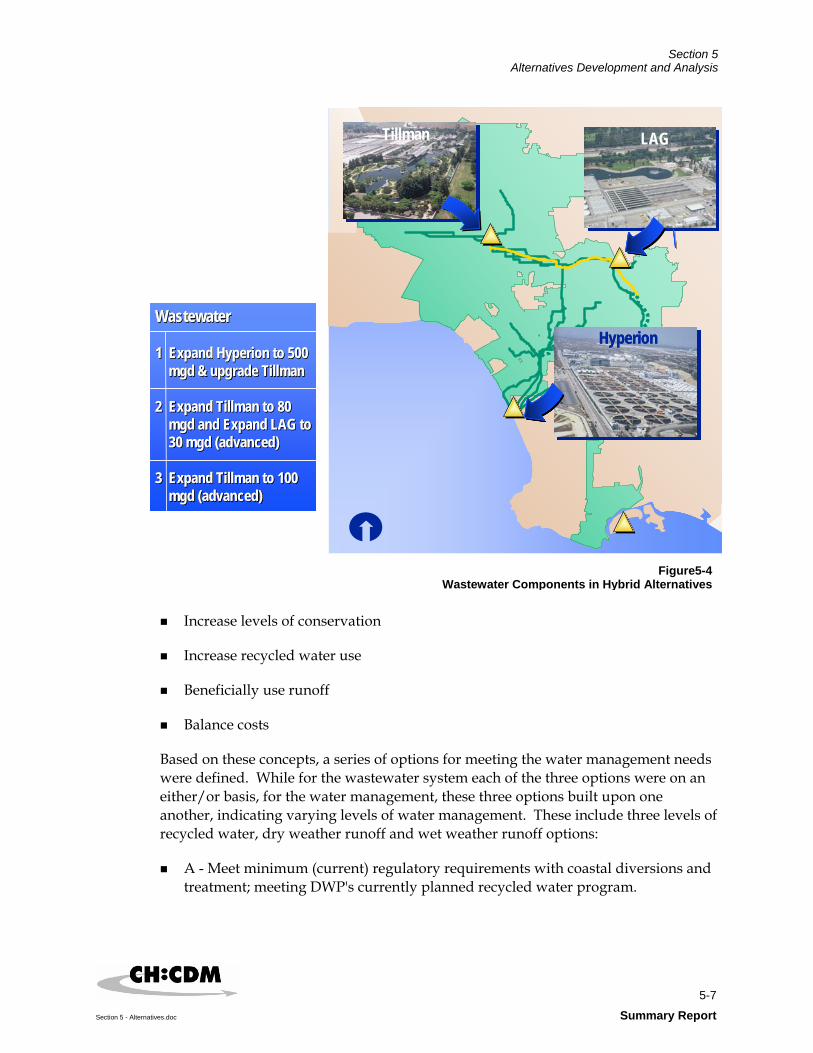
Section 5 Alternatives Development and Analysis
5-7
Section 5 - Alternatives.doc Summary Report
Increase levels of conservation
Increase recycled water use
Beneficially use runoff
Balance costs
Based on these concepts, a series of options for meeting the water management needs were defined. While for the wastewater system each of the three options were on an either/or basis, for the water management, these three options built upon one another, indicating varying levels of water management. These include three levels of recycled water, dry weather runoff and wet weather runoff options:
A - Meet minimum (current) regulatory requirements with coastal diversions and treatment; meeting DWP's currently planned recycled water program.
Figure5-4Wastewater Components in Hybrid Alternatives
City ofCity ofLos AngelesLos Angeles
WastewaterWastewater
1 Expand Hyperion to 5001 Expand Hyperion to 500mgdmgd & upgrade Tillman& upgrade Tillman
2 Expand Tillman to 802 Expand Tillman to 80mgdmgd and Expand LAG toand Expand LAG to30 30 mgdmgd (advanced)(advanced)
3 Expand Tillman to 1003 Expand Tillman to 100mgdmgd (advanced)(advanced)
LAGLAGTillman
HyperionHyperionHyperion

Section 5 Alternatives Development and Analysis
5-8 Summary Report Section 5 - Alternatives.doc
B –Provide additional benefits: in addition to the previous task, add smart irrigation and some urban runoff reuse plants for dry weather runoff, add some neighborhood recharge for wet weather runoff, and add additional recycled water.
C –Provide more benefits: in addition to the previous tasks, add additional urban runoff reuse plants and/or wetland treatment for dry weather runoff, add cisterns and regional recharge for wet weather and add higher levels of recycled water.
Based on these criteria, a set of nine hybrid alternative were developed, as detailed in Table 5-3 below, the “Rainbow Chart” for hybrid alternatives.
5.4.1 Evaluation of Hybrid Alternatives To evaluate the hybrid alternatives, the team used a simpler method to evaluate the hybrid alternatives. The team used a quadrant analysis method to evaluate the costs and benefits of the alternatives. The concept of the quadrant analysis is to use a grid to plot the benefits and costs of each alternative. The complete quadrant analysis can be found in the Facilities Plan Volume 4: Alternatives Development and Analysis.
In summary, the alternatives performed:
Alternative Hyb3C (clear winner for wastewater, recycled water and wet weather runoff)
Alternative Hyb1C (clear winner for both dry and wet weather runoff, and possible second choice for wastewater and recycled water)
Alternative Hyb2C (clear winner for wet weather runoff and recycled water)
Alternative Hyb3B (clear winner for wastewater, and possible second choice for recycled water)
5.5 Recommended Draft Alternatives for Environmental Analysis
Using preference information from the IRP Steering Group (see Section 7), the following draft alternatives were recommended to continue through the environmental impact analysis and financial analysis:
Alternative 1 (Hyb1C): Hyperion Expansion with moderate potential for water resources projects
Alternative 2 (Hyb2C): Tillman and Los Angeles Glendale Water Reclamation Plant expansions with high potential for water resources projects
Alternative 3 (Hyb3B): Tillman expansion with moderate potential for water resources projects

Table 5-3 City of Los AngelesIntegrated Resources Plan (IRP) - Hybrid Alternatives Matrix
1 Option LCMR WR3a HA1 LR1 Hyb1A Hyb1B Hyb1C Hyb2A Hyb2B Hyb2C Hyb3A Hyb3B Hyb3C2 Wastewater Treatment3 Tillman - Upgrade treatment (64 mgd) (Advanced Treatment) 64 mgd 64 mgd 64 mgd 64 mgd 64 mgd 64 mgd4 Tillman - Upgrade and increase capacity to 80 mgd (Advanced Treatment) 80 mgd 80 mgd 80 mgd 80 mgd5 Tillman - Upgrade and increase capacity to 100 mgd (Advanced Treatment) 100 mgd 100 mgd 100 mgd6 Tillman - Upgrade and increase capacity to 120 mgd (Advanced Treatment)7 Los Angeles-Glendale - Maintain existing capacity (15 mgd) (Title 22) 15 mgd 15 mgd 15 mgd 15 mgd 15 mgd 15 mgd 15 mgd8 Los Angeles-Glendale - Increase capacity to 20 mgd (Title 22)9 Los Angeles-Glendale - Increase capacity to 30 mgd (Title 22) 30 mgd
10 Los Angeles-Glendale - Upgrade treatment (15 mgd) (Advanced Treatment) 15 mgd12 Los Angeles-Glendale - Upgrade and increase capacity to 30 mgd (Advanced Treatment) 30 mgd 30 mgd 30 mgd 30 mgd13 New Reclamation Plant - Build 10 mgd capacity near downtown (Title 22)14 New Reclamation Plant - Build 30 mgd capacity in valley (Title 22) 30 mgd15 New Reclamation Plant - Build 10 mgd capacity near downtown (Advanced Treatment)16 New Reclamation Plant - Build 30 mgd capacity in valley (Advanced Treatment)17 Hyperion - Maintain existing capacity (450 mgd) 450 mgd 450 mgd 450 mgd 450 mgd 450 mgd 450 mgd 450 mgd18 Hyperion - Increase capacity to 500 mgd 500 mgd 500 mgd 500 mgd 500 mgd 500 mgd19 Hyperion - Increase capacity to 550 mgd 550 mgd20 Total Effective Hyperion Service Area Treatment Capacity2 (mgd) 546 546 529 607 546 546 546 529 529 529 521 521 52121 Terminal Island - Maintain existing capacity (30 mgd) 30 mgd 30 mgd 30 mgd 30 mgd 30 mgd 30 mgd 30 mgd 30 mgd 30 mgd 30 mgd 30 mgd 30 mgd 30 mgd22 Wastewater Sewer System23 Build new interceptor sewer - Valley Spring Lane Interceptor Sewer X X X24 Build new interceptor sewer - Glendale Burbank Interceptor Sewer (GBIS) X X X X X X X X X X X X X25 Build new interceptor sewer - North East Interceptor Sewer (NEIS) Phase 2 X X X X X X X X X X X X X26 Build new interceptor sewer - for New Plant (10 mgd - 2 miles)27 Build new interceptor sewer - for New Plant (30 mgd - 2 miles) X28 Build new buried storage tank - 60 MG at Tillman3 X X X X X X X X X X
Build new buried storage tank - 10 MG at Los-Angeles Glendale X* X* X* X* X* X* X* X* X*29 Build new buried storage tank - 20 MG at Los-Angeles Glendale X* X*30 Build new buried storage tank - 10 MG at new plant31 Build new buried storage tank - 20 MG at new plant X*32 Recycled Water (Non-Potable Demands)33 Meet Los Angeles River minimum requirements using treated wastewater X X X X X X X X X X X X X34 Meet Irrigation/Industry demands using treated wastewater X X X Low X X X X X X X X X37 Recharge groundwater basin using treated wastewater39 Meet Irrigation/Industry demands using treated runoff (low/medium/high) Low Low Low Low Low Low42 Recharge groundwater basin using treated runoff High43 Conservation Programs44 Increase conservation efforts to DWP's planned 2020 levels X X X X X X X X X X X X X45 Increase conservation efforts further X X X X X X X X46 Dry Weather Urban Runoff47 Local/Neighborhood Solutions48 Smart Irrigation X X X X X X X X49 Increase public education and participation X X X X X X X X X X X X X50 Regional Solutions
51
Diversion to Wastewater System (WW) or Divert to Urban Runoff Plant or wetlands and Beneficially Use (URP)1
52 Divert - coastal (10 mgd) WW WW WW WW WW WW WW WW WW WW WW WW WW53 Divert - inland (Bell Creek 2.8 mgd) WW54 Divert - inland (Browns Creek 3 mgd) WW WW URP4 URP4
55 Divert - inland (Aliso Wash 1.8 mgd) WW56 Divert - inland (Wilbur Wash 1 mgd) WW WW URP4 URP4
57 Divert - inland (Limekiln Canyon 1.5 mgd) WW WW URP4 URP4
58 Divert - inland (Caballero Canyon 1mgd) WW WW URP4 URP4
59 Divert - inland (Bull Creek 2.4 mgd) WW WW URP4 URP4
60 Divert - inland (Tujunga Wash 6 mgd) WW61 Divert - inland (Pacoima Wash 7 mgd) WW WW URP4 URP4
62 Divert - inland (Arroyo Seco 5 mgd) WW63 Divert - inland (Reach 3 LAR 4 mgd) WW64 Divert - inland (Reach 2 LAR-12 mgd) WW65 Divert - inland (Burbank Western Channel 1.8 mgd) WW66 Divert - inland (Compton Creek 2.6 mgd) WW URP URP URP URP URP URP67 Divert - inland (Ballona Creek 3.3 mgd) WW URP URP URP URP URP URP68 Divert - inland (Sepulveda Channel 16 mgd) WW69 Divert - inland (Dominguez Channel 16 mgd) WW73 Percent of Dry Weather Runoff Managed (of watershed - 97 mgd) 10% 21% 21% 100% 10% 26% 42% 10% 26% 42% 10% 26% 42%75 Wet Weather Urban Runoff76 Local/Neighborhood Solutions77 New/Redevelopment Areas - On-site treatment/discharge X X X X X X X X X X X X X78 New/Redevelopment Areas - On-site percolation X X X X X X X X X X X X X79 Retrofit Areas - Cisterns (On-site storage/use) 80 Residential X81 Schools X X X X82 Government X X X X83 On-site percolation (infiltration trenches/basins, reduce paving/hardscape)84 Residential X85 Schools X X X X86 Government X X X X87 Commercial X88 Rec/Cemetaries X89 Neighborhood recharge90 Vacant Lots (East Valley) (Low/Medium/High) Low High High Med High Med High Med91 Parks/Open Space (East Valley) (Low/Medium/High) Low High High Med High Med High Med92 Abandoned Alleys (East Valley) (Low/Medium/High) Low High High Med High Med High Med
102 Regional Solutions106 Non-urban regional recharge High Med Med Med107 Runoff treatment and beneficial use/discharge108 Treat and beneficial use/discharge (coastal area) X X X X X X X X X X X X X109 Treat and beneficial use/discharge (all areas) X110 Percent of Representative storm (1/2-inch) managed (of citywide 1,700 mgd) 10% 58% 39% 100% 10% 39% 47% 10% 39% 47% 10% 39% 47%111 Current/Anticipated Regulations Level of Compliance112 California Toxics Rule Yes Yes Yes Yes Yes Yes Yes Yes Yes Yes Yes Yes Yes113 Current Total Maximum Daily Loads (TMDLs) - Bacteria (Santa Monica Bay), Trash Yes Yes Yes Yes Yes Yes Yes Yes Yes Yes Yes Yes Yes114 Future Total Maximum Daily Loads (projection) No Partial Partial Yes No Partial Partial Partial Partial Partial Partial Partial Partial115 Notes:116 *Storage for daily (diurnal) peaks117 1Flows indicated assume no smart irrigation. Implementing smart irrigation citywide would reduce total dry weather runoff estimates by ~11 mgd118 2Effective Capacity is the total treatment capacity, minus solids and brine return flows to the sewer119 3Includes new GBIS extension from NOS to GBIS.120 4Runoff is treated and discharged. Runoff can potentially be treated and beneficially used if future demands are identified.121 Definitions:122 LCMR - Low Cost/Minimum Requirements: alternative includes lower cost solutions or low initial investment by meeting minimum requirements.123 WR - High Beneficial Use of Water Resources: alternatives that include high levels of recycled water, conservation, and beneficial use of runoff.124 HA - High Adaptability: alternatives that are most able to adjust to changing conditions, such as population, wastewater flows and regulations.125 LR - Lower Risk: alternatives that are lower in risk from a regulatory perspective (LR1) or in terms of ease of implementation from a technical, 126 environmental and/or political and public acceptance perspective (LR2).
rainbow chart.xls - New Hybrids + 4 Top Page 1 of 1 7/8/2004

Section 5 Alternatives Development and Analysis
5-10 Summary Report Section 5 - Alternatives.doc
Alternative 4 (Hyb3C): Tillman expansion with high potential water resources projects
These alternatives reflect a full spectrum of wastewater assumptions, provide leadership in water resources and balance today’s financial realities. Figure 5-5 provides a snapshot of the projects included in each of these alternatives. Figure 5-6 shows the summary of the costs and benefits for the four recommended alternatives.
5.6 Recommended Alternative The Draft EIR evaluated the Project Alternatives at a co-equal level and did not identify a preferred or recommended alternative for implementation. Rather, a Recommended Alternative was selected following public review of the Draft EIR. The identification of the Recommended Alternative and the factors that formed the basis of its recommendation were described in the Final EIR.
The Recommended Alternative is Alternative 4 and includes:
Expand the Hyperion biosolids handling capacity (new digesters and truck loading facility)
Add secondary clarifiers at Hyperion to meet existing treatment requirements
Expand and upgrade the Tillman capacity to 100 mgd with advanced treatment
Add wastewater storage at Tillman
Add operational storage at LAG for wastewater and recycled water and maintain the option to upgrade LAG to advance treatment
Construct NEIS II
Construct GBIS
Construct VSLIS
The Recommended Alternative would meet future recycled water demand by expanding the existing recycled water distribution system to serve new nonpotable water uses (up to 56,100 acre-feet per year. As an option, Alternative 4 could use some recycled water (advanced treatment) for groundwater recharge at the Hansen Spreading Grounds and Pacoima Spreading Grounds with reduced expansion of the recycled water distribution system for nonpotable reuse. If groundwater recharge is implemented, an additional 23,800 acre-feet per year could be used above the strictly nonpotable options. Alternative 4 could use up to 56,100 acre-feet per year for nonpotable or up to 79,900 acre-feet per year if groundwater recharge is added.
The Recommended Alternative would manage future urban runoff through the following measures:

Section 5 Alternatives Development and Analysis
5-11
Section 5 - Alternatives.doc Summary Report
Minimize dry weather urban runoff with Smart Irrigation devices throughout the City of Los Angeles
Treat dry weather urban runoff via Low-Flow Diversions to the sewer system in coastal areas
Treat dry weather runoff in URPs or treatment wetlands at Compton Creek and Ballona Creek
Manage wet weather urban runoff with capture and percolation facilities and cisterns
Treat wet weather urban runoff from the Santa Monica Bay watershed in URPs
Use regional non-urban runoff in the San Fernando Valley for groundwater recharge at the Hansen Spreading Grounds
On November 14, 2006, the Los Angeles City Council certified the EIR and approved the staff Recommended Alternative (Alternative 4) for implementation.
The Integrated Resources Plan Draft Environmental Impact Report (Draft EIR) and the Integrated Resources Plan Final Environmental Impact Report (Final EIR) detail the entire process, while a summary is included in Section 8 of this document.
This Recommended Alternative was the basis for the CIP and final financial analysis. The IRP is a road map that can change course as key triggers are encountered. These triggers include actual population increases, development of new technologies, demonstrated effectiveness of leadership projects, changes in regulatory requirements, availability of project funding, and public acceptance. Project components are categorized as “Go” projects, “Go if Triggered” projects and “Go” policies. The Facilities Plan, Volume 5: Adaptive Capital Improvement Program presents the CIP and documents the framework for tracking the triggers and adjusting the CIP.
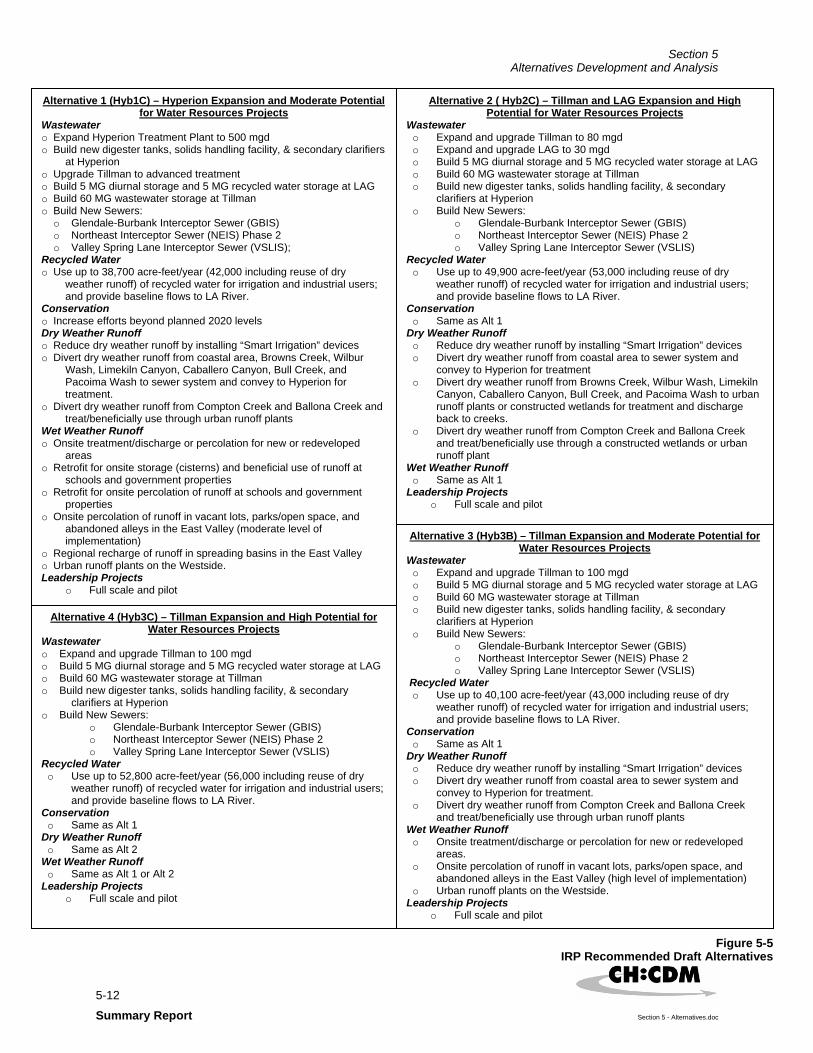
Section 5 Alternatives Development and Analysis
5-12 Summary Report Section 5 - Alternatives.doc
Alternative 1 (Hyb1C) – Hyperion Expansion and Moderate Potential for Water Resources Projects
Wastewater o Expand Hyperion Treatment Plant to 500 mgd o Build new digester tanks, solids handling facility, & secondary clarifiers
at Hyperion o Upgrade Tillman to advanced treatment o Build 5 MG diurnal storage and 5 MG recycled water storage at LAG o Build 60 MG wastewater storage at Tillman o Build New Sewers:
o Glendale-Burbank Interceptor Sewer (GBIS) o Northeast Interceptor Sewer (NEIS) Phase 2 o Valley Spring Lane Interceptor Sewer (VSLIS);
Recycled Water o Use up to 38,700 acre-feet/year (42,000 including reuse of dry
weather runoff) of recycled water for irrigation and industrial users; and provide baseline flows to LA River.
Conservation o Increase efforts beyond planned 2020 levels Dry Weather Runoff o Reduce dry weather runoff by installing “Smart Irrigation” devices o Divert dry weather runoff from coastal area, Browns Creek, Wilbur
Wash, Limekiln Canyon, Caballero Canyon, Bull Creek, and Pacoima Wash to sewer system and convey to Hyperion for treatment.
o Divert dry weather runoff from Compton Creek and Ballona Creek and treat/beneficially use through urban runoff plants
Wet Weather Runoff o Onsite treatment/discharge or percolation for new or redeveloped
areas o Retrofit for onsite storage (cisterns) and beneficial use of runoff at
schools and government properties o Retrofit for onsite percolation of runoff at schools and government
properties o Onsite percolation of runoff in vacant lots, parks/open space, and
abandoned alleys in the East Valley (moderate level of implementation)
o Regional recharge of runoff in spreading basins in the East Valley o Urban runoff plants on the Westside. Leadership Projects
o Full scale and pilot
Alternative 2 ( Hyb2C) – Tillman and LAG Expansion and High Potential for Water Resources Projects
Wastewater o Expand and upgrade Tillman to 80 mgd o Expand and upgrade LAG to 30 mgd o Build 5 MG diurnal storage and 5 MG recycled water storage at LAG o Build 60 MG wastewater storage at Tillman o Build new digester tanks, solids handling facility, & secondary
clarifiers at Hyperion o Build New Sewers:
o Glendale-Burbank Interceptor Sewer (GBIS) o Northeast Interceptor Sewer (NEIS) Phase 2 o Valley Spring Lane Interceptor Sewer (VSLIS)
Recycled Water o Use up to 49,900 acre-feet/year (53,000 including reuse of dry
weather runoff) of recycled water for irrigation and industrial users; and provide baseline flows to LA River.
Conservation o Same as Alt 1
Dry Weather Runoff o Reduce dry weather runoff by installing “Smart Irrigation” devices o Divert dry weather runoff from coastal area to sewer system and
convey to Hyperion for treatment o Divert dry weather runoff from Browns Creek, Wilbur Wash, Limekiln
Canyon, Caballero Canyon, Bull Creek, and Pacoima Wash to urban runoff plants or constructed wetlands for treatment and discharge back to creeks.
o Divert dry weather runoff from Compton Creek and Ballona Creek and treat/beneficially use through a constructed wetlands or urban runoff plant
Wet Weather Runoff o Same as Alt 1
Leadership Projects o Full scale and pilot
Alternative 4 (Hyb3C) – Tillman Expansion and High Potential for Water Resources Projects
Wastewater o Expand and upgrade Tillman to 100 mgd o Build 5 MG diurnal storage and 5 MG recycled water storage at LAG o Build 60 MG wastewater storage at Tillman o Build new digester tanks, solids handling facility, & secondary
clarifiers at Hyperion o Build New Sewers:
o Glendale-Burbank Interceptor Sewer (GBIS) o Northeast Interceptor Sewer (NEIS) Phase 2 o Valley Spring Lane Interceptor Sewer (VSLIS)
Recycled Water o Use up to 52,800 acre-feet/year (56,000 including reuse of dry
weather runoff) of recycled water for irrigation and industrial users; and provide baseline flows to LA River.
Conservation o Same as Alt 1
Dry Weather Runoff o Same as Alt 2
Wet Weather Runoff o Same as Alt 1 or Alt 2
Leadership Projects o Full scale and pilot
Alternative 3 (Hyb3B) – Tillman Expansion and Moderate Potential for Water Resources Projects
Wastewater o Expand and upgrade Tillman to 100 mgd o Build 5 MG diurnal storage and 5 MG recycled water storage at LAG o Build 60 MG wastewater storage at Tillman o Build new digester tanks, solids handling facility, & secondary
clarifiers at Hyperion o Build New Sewers:
o Glendale-Burbank Interceptor Sewer (GBIS) o Northeast Interceptor Sewer (NEIS) Phase 2 o Valley Spring Lane Interceptor Sewer (VSLIS)
Recycled Water o Use up to 40,100 acre-feet/year (43,000 including reuse of dry
weather runoff) of recycled water for irrigation and industrial users; and provide baseline flows to LA River.
Conservation o Same as Alt 1
Dry Weather Runoff o Reduce dry weather runoff by installing “Smart Irrigation” devices o Divert dry weather runoff from coastal area to sewer system and
convey to Hyperion for treatment. o Divert dry weather runoff from Compton Creek and Ballona Creek
and treat/beneficially use through urban runoff plants Wet Weather Runoff
o Onsite treatment/discharge or percolation for new or redeveloped areas.
o Onsite percolation of runoff in vacant lots, parks/open space, and abandoned alleys in the East Valley (high level of implementation)
o Urban runoff plants on the Westside. Leadership Projects
o Full scale and pilot
Figure 5-5IRP Recommended Draft Alternatives

Section 5 Alternatives Development and Analysis
5-13
Section 5 - Alternatives.doc Summary Report
Benefits Alt 1 (Hyb1C) Alt 2 (Hyb2C) Alt3 (Hyb3B) Alt4 (Hyb3C)Potential Potable Water Demand Reduction through conservation1
(AF/yr)103,200 103,200 103,200 103,200
Additional Recycled Water Usage (AF/yr) 38,700 49,900 40,100 52,800
DWUR Managed (% of watershed - 97 mgd) 42% 42% 26% 42%
WWUR Managed (% of citywide 1,700 mgd) 49% 49% 40% 49%
DWUR and WWUR Beneficially Used (AF/yr) 37,700 37,700 32,500 37,700
Positive Impacts on Public Lands (acres) 353 353 580 353
AcronymsDWUR- Dry Weather Urban RunoffWWUR-Wet Weather Urban RunoffAF/yr- Acre-feet per yearMGD- Million gallons per dayLAG-Los Angeles-Glendale
*Does not include baseline CIP costs, new costs for future TMDLs (except LR1), or budget for leadership projects.1Future implementation would depend on available funding, customer acceptance, reliability, and commercial availability of smart irrigation controllers. More detailed studies would be needed to determine the full benefits of a smart irrigation program.
Summary of Single-FamilyMonthly Cost for
Water, Wastewater, and Stormwater*
$84
$85
$86
$87
$88
$89
$90
$91
$92
$93
Alternative
Estim
ated
Ave
rage
C
ost p
er m
onth
Total* $87 $92 $91 $92
Alt 1 (Hyb1C) Alt 2 (Hyb2C) Alt 3 (Hyb3B) Alt 4 (Hyb3C)
Figure 5-6Hybrid Alternatives Costs and Benefits

6-1
Section 6 Adaptive CIP.doc Summary Report
Section 6 Adaptive Capital Improvement Plan (CIP)
6.1 Introduction The IRP Facilities Plan, Volume 5: Adaptive Capital Improvement Program (CIP) has been developed to reflect the staff-recommended alternative, as summarized in Section 5 of this document. The CIP includes the anticipated capital and Operation and Maintenance (O&M), project timing and the implementation strategy for tracking and monitoring triggers. The costs were originally developed as part of the Facilities Plan, Volumes 1-4 and updated as part of the Volume 5: Adaptive CIP. The staff-recommended alternative has component projects and policy directions that are ready for initiation, as well as projects that are contingent on specific conditions that could trigger the need for implementation. It is this flexibility that characterizes the adaptive nature of this CIP, and drives the establishment of a working group to monitor these trigger conditions. A framework for this group is provided as part of the Facilities Plan Volume 5: Adaptive CIP and is also summarized in this section.
6.2 Implementation Strategy Through the EIR process, Alternative 4 was determined to be the Recommended Alternative. Alternative 4 included various recycled water benefits. However, it was determined that if, in the future, the use of recycled water from Tillman for groundwater replenishment or other recycled water uses is considered infeasible based on a combination of factors, (including public acceptability, costs, future regulations, and the need for additional treatment capacity) then Alternative 1 would be considered the Recommended Alternative.
Additionally, project components of the Recommended Alternative were categorized as “go projects” and “go if triggered projects”. The go projects represent projects that have been evaluated at a project-level in the EIR, and are recommended for immediate implementation because the flow or regulatory triggers have already been met. The go if triggered projects include potential projects that will go if triggered by an action, flow, or regulation. If triggered, these projects will be included in the WCIP as part of the annual budget process.
The implementation of these projects is contingent on their need, as determined through pertinent “triggers”. These triggers may be related to regulatory actions such as new discharge or recycled water permit requirements, population increases and associated wastewater flow increases, operational requirements, and/or changes in public perception. The primary mechanism for monitoring these triggers will be an IRP Implementation Strategy Committee that will meet quarterly to review the trigger status and determine project readiness for initiation. The Facilities Plan volume 5: Adaptive CIP discusses this trigger tracking process.

Section 6 Adaptive Capital Improvement Plan (CIP)
6-2 Summary Report Section 6 Adaptive CIP.doc
6.3 Capital Cost Data Assumptions To estimate the probable capital cost of IRP recommended projects, cost factors (including overhead, profit, bond and insurance, overhead and contingency) and assumed cost indices were established.
Estimated capital cost data and associated assumptions used to develop the data were originally developed in the IRP Facilities Plan, Volumes 1 through 3 (Wastewater Management, Water Management, and Runoff Management) and presented in the IRP Facilities Plan, Volume 4: Alternatives Development and Analysis Appendix S, Unit Costs (Wastewater, Recycled Water, and Runoff) (July 2004). This cost data was utilized as a starting point and updated with revised assumptions to reflect current conditions. Cost factors and cost index adjustments were applied to the original capital costs to arrive at the Adaptive CIP. All capital costs presented in the Adaptive CIP are expected to be greater than listed as a result of inflation as projects will be constructed in the future. Not included in the costs presented here are the costs associated with the City’s baseline Wastewater Capital Improvement Program (WCIP), stormwater CIP, and Department of Water and Power CIP, which are significant and needed for rehabilitation of the current system, near-term regulatory and system requirements, and security purposes.
6.3.1 Cost Factors Capital costs presented include both estimated construction costs and construction mark-ups. Total construction mark-ups included in the estimated capital cost include: overhead at 7 percent, profit at 7 percent, mobilization at 7 percent, bond and insurance at 2 percent, and contingency at 15 percent unless otherwise noted. Total construction mark-ups are cumulative resulting in a total mark-up of 44 percent. For example, if a project’s construction cost estimate was $1,000,000, then the following would represent the total markup:
(1) $1,000,000 (raw construction cost estimate) x 1.07 (overhead) = $1,050,000
(2) $1,070,000 (new subtotal) x 1.07 (profit) = $1,144,900
(3) $1,144,900 (new subtotal) x 1.07 (mobilization) = $1,225,043
(4) $1,225,043 (new subtotal) x 1.02 (bond/insurance) = $1,249,544
(5) $1,249,544 (new subtotal) x 1.15 (contingency) = $1,436,975
Therefore, in this example, the total construction cost markup would be:
(6) $1,436,975 — $1,000,000 = $436,975 (or a 44% markup)

Section 6 Adaptive Capital Improvement Plan (CIP)
6-3
Section 6 Adaptive CIP.doc Summary Report
Non-construction mark-ups for program management, engineering studies/basic design services, construction management services, and start-up costs totaling 30 percent are also included within the estimated capital costs unless otherwise noted. Therefore, in order to get the non-construction cost markup a factor of 0.30 should be multiplied by the construction cost estimate (without construction cost markups). In the above referenced example, this would yield:
(7) $1,000,0000 (construction cost estimate) x 0.30 (non-construction cost markup) = $300,000
Therefore, the total capital cost for this example project would equal:
(8) raw construction cost estimate = $1,000,0000
(9) construction cost markup, see equation (6) = $436,975
(10) non-construction cost markup, see equation (7) = $300,000
(11) total capital cost = $1,000,000 + $436,975 + $300,000 = 1,736,975
Further explanation of these costs and assumptions used to develop the original capital costs are provided in Technical Memorandum: Cost Estimate Approach for the IRP Facilities Plan dated May 12, 2003 (Appendix A) and Appendix S, Unit Costs (Wastewater, Recycled Water, and Runoff) of the Facilities Plan, Volume 4: Alternatives Development and Analysis dated July 2004.
6.3.2 Construction Cost Index Updates The Engineering News Record (ENR) construction cost index (CCI) for Los Angeles was used to developed capital cost estimates for the IRP. Construction cost estimating involves using costs that were developed at multiple times. A CCI is necessary to adjust costs to a predetermined point in time. Cost indices vary geographically and are dependent upon multiple variables, including labor and material markets. Los Angeles was the most applicable CCI for the IRP. Capital cost estimates for projects developed as part of the IRP were originally developed in Volume 4 to September 2002 dollars with and ENR CCI of 7414 for Los Angeles. Volume 5 updated these costs to March 2006 dollars using and ENR CCI of 8552 for Los Angeles. To reflect the updated ENR CCI a factor of 1.153 was applied to all September 2002 capital costs.
6.4 Wastewater Projects The Recommended Alternative includes components that are well defined and components that are more conceptual. The well-defined components for the Recommended Alternative are site specific and therefore, more detailed capital cost data is available. Conceptual components will require additional detailed study and environmental analysis resulting in the formation of conceptual cost data.

Section 6 Adaptive Capital Improvement Plan (CIP)
6-4 Summary Report Section 6 Adaptive CIP.doc
The Department of Public Works (DPW) is responsible for developing the 10-year Wastewater Capital Improvement Program (WCIP). This program includes replacement, rehabilitation, and expansion of the City’s wastewater treatment and collection facilities.
Figure 6-1 shows the overview of treatment plants, service area, and proposed sewer lines.
6.4.1 Wastewater Go-Projects Go-Projects represent projects from the Recommended Alternative that have been evaluated at a project-level in the EIR, and are recommended for immediate implementation because the flow or regulatory triggers have already been met. The following section presents a description of Go-Projects, expected online years, and estimated capital costs. These projects will be included in the WCIP as part of the annual budget process. The total estimated capital cost for the Go-Projects is $662 million in March 2006 dollars. Table 6-1 provides a summary of estimated capital costs for the Go-Projects.
The components of the Go-Projects are described in greater detail The Facilities Plan, Volume 5: Adaptive CIP.
Table 6-1 IRP Recommended Alternative
Wastewater Estimated Capital Costs - Go-Projects
Estimated
Capital Cost (2006$)1 Millions
Forecast Operational
Date Go Projects
Treatment Construct Wastewater Storage Facilities at Tillman (60 Million Gallon with Real Time Control) $120 2011
Construct Wastewater Storage Facilities at LAG (5 Million Gallon with Real Time Control) $19 2012
Recycled Water Storage at LAG (5 Million Gallon with Real Time Control) $8 2012 HTP Solids Handling/Truck Loading Facility $89 2012 Collection System Glendale Burbank Interceptor Sewer (GBIS), including air treatment $196 2016 North East Interceptor Sewer (NEIS) Phase 2 $230 2016
Total Go Projects $662 Notes: 1 Costs are presented in 2006 dollars (March 2006 ENR CCI for Los Angeles). Capital costs include construction costs and non-construction costs including program management, engineering studies/design services, construction management, and start-up costs. Costs are expected to be greater than listed as a result of inflation as projects will be constructed in the future.

Section 6 Adaptive Capital Improvement Plan (CIP)
6-5
Section 6 Adaptive CIP.doc Summary Report
Figure 6-1Overview of Treatment Plants, Service Area, and Proposed Sewer Lines

Section 6 Adaptive Capital Improvement Plan (CIP)
6-6 Summary Report Section 6 Adaptive CIP.doc
6.4.2 Wastewater Go If Triggered Projects The Recommended Alternative also includes potential projects that will go if triggered by an action, flow, or regulation. If triggered, these projects will be included in the WCIP as part of the annual budget process. Triggers will be monitored by staff as summarized in Section 6.8.1. The following section presents a description of Go If Triggered Projects, current estimated capital costs, previous capital costs from the Facilities Plan, and a description of the changes in capital costs that have occurred since the Facilities Plan was completed. These projects will be included in the WCIP as part of the annual budget process if they are triggered. Total estimated capital costs for the Go If Triggered projects are estimated at $1,205 million in March 2006 dollars. Table 6-2 summarizes the estimated capital costs for the Goif Triggered Projects.
The components of the Go if Triggered Projects are described in greater detail The Facilities Plan, Volume 5: Adaptive CIP.
Table 6-2 IRP Alternative Four
Wastewater Estimated Capital Costs - Go If Triggered Projects
Estimated Capital Cost
(2006$)1 Millions Tillman Upgrade to Advanced Treatment and UV Disinfection Phase 1 (current capacity 80 mgd) $339
Tillman Expansion to 100 mgd (Secondary, MF/RO, and UV) (add 20 mgd) $210
LAG Upgrade to Advanced Treatment and UV disinfection (existing - 20 mgd capacity)2 $105
HTP Secondary Clarifiers (add 100 mgd to get capacity to 450 mgd) $92
HTP Digesters (up to 12 total) $303
Valley Spring Lane Interceptor Sewer (VSLIS) including air treatment $156
Total Go If Triggered Projects $1,205 Notes: 1 Costs are presented in 2006 dollars (March 2006 ENR CCI for Los Angeles). Capital costs include construction costs and non-construction costs including program management, engineering studies/design services, construction management, and start-up costs. Costs are expected to be greater than listed as a result of inflation as projects will be constructed in the future 2 In the unlikely event that the overall framework for recycled water changes to disallow its use, then Alternative 1 becomes the Recommended Alternative and "Expansion of Hyperion to 500 mgd (add 50 mgd)" would replace the "Tillman Expansion to 100 mgd (Secondary, MF/RO, and UV) (add 20mgd)" project at a total estimated capital cost of $46 million.


Section 6 Adaptive Capital Improvement Plan (CIP)
6-8 Summary Report Section 6 Adaptive CIP.doc
The implementation of these projects is contingent on their need, as determined through pertinent “triggers”. These triggers may be related to regulatory actions such as new discharge or recycled water permit requirements, population increases and associated wastewater flow increases, operational requirements, and/or changes in public perception. The primary mechanism for monitoring these triggers will be an IRP Implementation Strategy Committee that will meet quarterly to review the trigger status and determine project readiness for initiation. The Facilities Plan, Volume 5: Adaptive CIP discusses this trigger tracking process in detail.
6.4.3 Wastewater Leadership Projects Leadership projects are projects that require study before large-scale implementation. They allow the City to confirm the “implementabity” of a promising approach from technological, operability, results verification, scale-up effect, and public acceptance perspectives; and from City policy and agency coordination perspectives. Examples of types of leadership projects included in the wastewater estimated capital costs are pilot projects, feasibility studies, and demonstration projects. Further details regarding the leadership projects are available in the Facilities Plan Volume 4: Alternative Development and Analysis (Section 6). Capital costs for wastewater leadership projects are estimated at $14 million.
6.4.4 Baseline Project Timing Figure 6-2 provides a summary of the baseline project timing for-Go Project and Go-If-Triggered Projects. See The Facilities Plan, Volume 5: Adaptive CIP for additional discussion.
6.5 Runoff Management Projects The Runoff Management projects were developed at a programmatic or conceptual level with the goal of creating a starting point in quantifying the potential to improve water quality and increase reuse of runoff. As such, additional efforts are needed to further develop the program, including identification of actual sites and locations for implementing the various runoff management options (as defined in detail in the Facilities Plan, Volume 3: Runoff Management) which will be done as part of the TMDL implementation planning process.
To provide progress on the programmatic elements of runoff management, Go-Policy Directions have been adopted as City policy. Go-Policy Directions are specific directions to staff on the next studies and evaluations required to develop the programmatic elements of the Recommended Alternative.
Public Works is responsible for watershed protection, which includes compliance with stormwater and urban runoff regulations (TMDLs and NPDES permits) and beneficial use of runoff. Staff develops a CIP for the watershed protection program as part of the annual budget process.

Section 6 Adaptive Capital Improvement Plan (CIP)
6-9
Section 6 Adaptive CIP.doc Summary Report
6.5.1 Runoff Management Programmatic Projects Programmatic projects are currently broad in scope and require future refinement. The projects were evaluated at a programmatic level in the EIR requiring additional detailed studies to delineate specific projects and subsequent environmental analysis. Overall when refined the individual components of these projects could potentially manage up to 42 percent of the dry weather (41 mgd managed) and 47 percent of the wet weather urban runoff (791 mgd managed) generated in the City. The following section presents a description of the programmatic projects, expected online years, current estimated capital costs, and previous capital costs from the Facilities Plan.
Original capital costs estimates for the programmatic projects described in the Facilities Plan were based on unit costs developed for actual construction projects, such as the Santa Monica Urban Runoff Recycling Facility (SMURRF), Sun Valley recharge projects, and planned wastewater diversion structures. Mark-ups for construction and non-construction items were then applied to the unit costs where applicable and escalated to September 2002 dollars.
For wet weather runoff management projects the approach will be revisited upon approval of the Santa Monica Bay Beaches Bacteria Total Maximum Daily Load Implementation Plan by the Regional Board. The approved implementation change may change the described mix of wet weather projects that would be implemented.
Table 6-3 presents current estimated capital costs in March 2006 dollars for both dry and wet weather runoff management components and leadership projects of the IRP Recommended Alternative. The description of each option is detailed in Section 4 of this document, as well as the Facilities Plan Volume 3: Runoff Management.
6.5.2 Proposition O Conceptual Projects The DPW has taken the lead in developing a Proposition O program that will improve water quality at the beaches, rivers, and lakes within the City. This program includes solicitation of project ideas from the public and the development of conceptual plans for those projects that are approved by the Citizen’s Oversight Advisory Committee (COAC). In a multi-phase process, the City will allocate $500 million in bond funds for these projects.
At the time of developing this Summary Report, numerous Proposition O projects aligned with runoff management were under development and funding review in a process parallel to the IRP process. Conceptual plans were being developed for projects that have been approved for funding by the Citizen’s Oversight Advisory Committee. Other Proposition O projects were currently under review for potential approval. Capital costs have been developed for both the projects under development and those projects under funding review.

Section 6 Adaptive Capital Improvement Plan (CIP)
6-10 Summary Report Section 6 Adaptive CIP.doc
Table 6-3 IRP Alternative Four
Runoff Management Estimated Capital Costs
Estimated Capital Cost (2006$)1 Millions
Dry Weather Urban Runoff Smart irrigation (reduce runoff by ~10 mgd) $119 Divert runoff from Compton Creek to URP (~2 mgd) $19 Divert runoff from Ballona Creek to URP (~3 mgd) $27 Divert runoff from Inland Creeks to URPs and Wetlands (15.9 mgd) $393
Subtotal Dry Weather Urban Runoff $558 Wet Weather Urban Runoff
Treat and beneficially use/discharge (coastal area - 160 mgd) $1,039 Neighborhood recharge in vacant lots (east valley) $389 Neighborhood recharge in parks/open space $124 Neighborhood recharge in abandoned alleys $18 Onsite percolation - Schools $52 Onsite percolation - Government $17 Non-urban regional recharge (east valley) $87 Cisterns (onsite storage use) - Schools $71 Cisterns (onsite storage use) - Government $45 Onsite percolation - Schools $52 New/Redevelopment Areas - Onsite treat/discharge $0
Subtotal Wet Weather Urban Runoff $1,894 Leadership Projects $12
Total $2,463 Notes: 1 Costs are presented in 2006 dollars (March 2006 ENR CCI for Los Angeles). Capital costs include construction costs and non-construction costs including program management, engineering studies/design services, construction management, and start-up costs. Costs are expected to be greater than listed as a result of inflation as projects will be constructed in the future. 2 No costs are associated with new/redevelopment areas as onsite treatment and discharge would be included in the SUSMP requirements. SUSMP compliance is the responsibility of the property owner.
6.6 Recycled Water Potential recycled water projects included as part of the Recommended Alternative may result in the production and use of up to 56,000 acre-feet per year of recycled water for non-potable uses including the treatment and reuse of runoff. Recycled water uses would include industrial, irrigation, environmental and potential groundwater replenishment uses. If Tillman is upgraded to advanced treatment with MF/RO, then up to 35,000 acre-feet per year could potentially be used for groundwater replenishment. If public acceptance for groundwater replenishment is not secured or if Tillman is not expanded with advanced treatment, then DWP would implement recycled water projects consistent with IRP Alternative 1.

Section 6 Adaptive Capital Improvement Plan (CIP)
6-11
Section 6 Adaptive CIP.doc Summary Report
As part of the IRP, a detailed Recycled Water Master Plan was developed by DWP which examined these alternatives in more detail. Updated capital costs presented in this Volume of the IRP are for reference purposes only. Actual implementation of recycled water projects by DWP will be based on benefits, costs, regulations, and public acceptance. DWP will develop its CIP for recycled water based on its own budgeting process and using the Recycled Water Master Plan as its planning document.
Potential recycled water projects for the Recommended Alternative are presented in Section 6.5.1; while recycled water projects currently underway and conceptual projects included in DWP’s Recycled Water Master Plan are presented in Section 6.5.2.
To provide progress on the programmatic elements of recycled water, Go-Policy Directions have been adopted as City policy. Go-Policy Directions are specific directions to staff on the next studies and evaluations required to develop the programmatic elements of the Recommended Alternative. These actions are listed in Section 6.6.
6.6.1 Potential Recycled Water Projects To estimate the modified Recommended Alternative capital costs for recycled water, the IRP Alternative 1 was used for pipeline, pump stations, end user retrofits, and diurnal storage. This capital cost, updated to reflect March 2006 dollars, is $492 million. Approximately $4 million (not including costs of constructing advanced treatment at Tillman) in capital cost would be required to implement the groundwater replenishment component of the modified Recommended Alternative, bringing the total cost to $496 million.
Table 6-4 presents current estimated capital costs in March 2006 dollars for the recycled water component of the IRP Recommended Alternative.
The description of each option is detailed in the Facilities Plan Volume 5: Adaptive CIP.
Table 6-4 IRP Recommended Alternative Recycled Water Estimated Capital Costs
Estimated Capital Cost (2006$)1
Millions
Non-Potable Use Recycled Water Pipelines $286 Recycled Water Pumping $40
Diurnal Storage $83 End User Retrofit $83
Groundwater Replenishment $4 Total $496
Notes:1 Costs are presented in 2006 dollars (March 2006 ENR CCI for Los Angeles). Capital costs include construction costs and non-construction costs including program management, engineering studies/design services, construction management, and start-up costs. Costs are expected to be greater than listed as a result of inflation as projects will be constructed in the future.

Section 6 Adaptive Capital Improvement Plan (CIP)
6-12 Summary Report Section 6 Adaptive CIP.doc
6.6.2 Parallel Projects Underway and Conceptual Projects In a process parallel to the IRP the Master Plan has resulted in the development of multiple recycled water projects that are funded and underway and one conceptual project. These projects will continue to provide recycled water to irrigation customers and meet the overall IRP objectives and guiding principles.
6.7 Water Conservation Projects As part of its 5-year update to the Urban Water Management Plan (UWMP), DWP staff included water conservation and runoff management options that are aligned with the IRP, demonstrating their commitment to collaboration with DPW on integrated resources planning.
To provide progress on the increasing water conservation in the City, Go-Policy Directions have been adopted as City policy, and are detailed in the Facilities Plan, Volume 5: Adaptive CIP. DWP has invested $164 million in water conservation since 1991 with successful results. Water demand in 2004 was lower than 1984 levels even though the population has increased by over 750,000. Additionally, per capita water use in 2004 was 18 percent lower than in 1989 when DWP started its aggressive conservation campaign. The viability of water conservation programs is subject to funding, in the form of both outside and internal funding, and DWP’s ability to implement the programs. DWP has made a stronger commitment to obtain outside funding for conservation projects. Current water conservation funding sources include:
Water Rate Adjustments – An adjustment factor is applied to each bill to fund conservation and recycling projects
Metropolitan Water District of Southern California Conservation Credits Program – MWD offers rebates of half of the project cost (an approximate rebate of $154 per acre-foot saved) for the installation of specified conservation measures.
Grant Funding – LADWP applies for and has received grant funding from a variety of sources for water conservation projects, such as Proposition 13 and Proposition 50.
The information on water conservation presented in the Facilities Plan Volume 5: Adaptive CIP is for reference purposes only as the UWMP is developed outside of the IRP process. However, the IRP process has resulted in valuable input towards the development of water conservation measures and in viewing water use in an integrated manner in conjunction with wastewater, runoff management, and recycled water. The 2005 UWMP should be consulted for a more in depth discussion of water conservation programs.
Water conservation is the responsibility of DWP. DWP is a separate department from DPW and operates independently. Any financial impacts related to water conservation are evaluated by DWP.
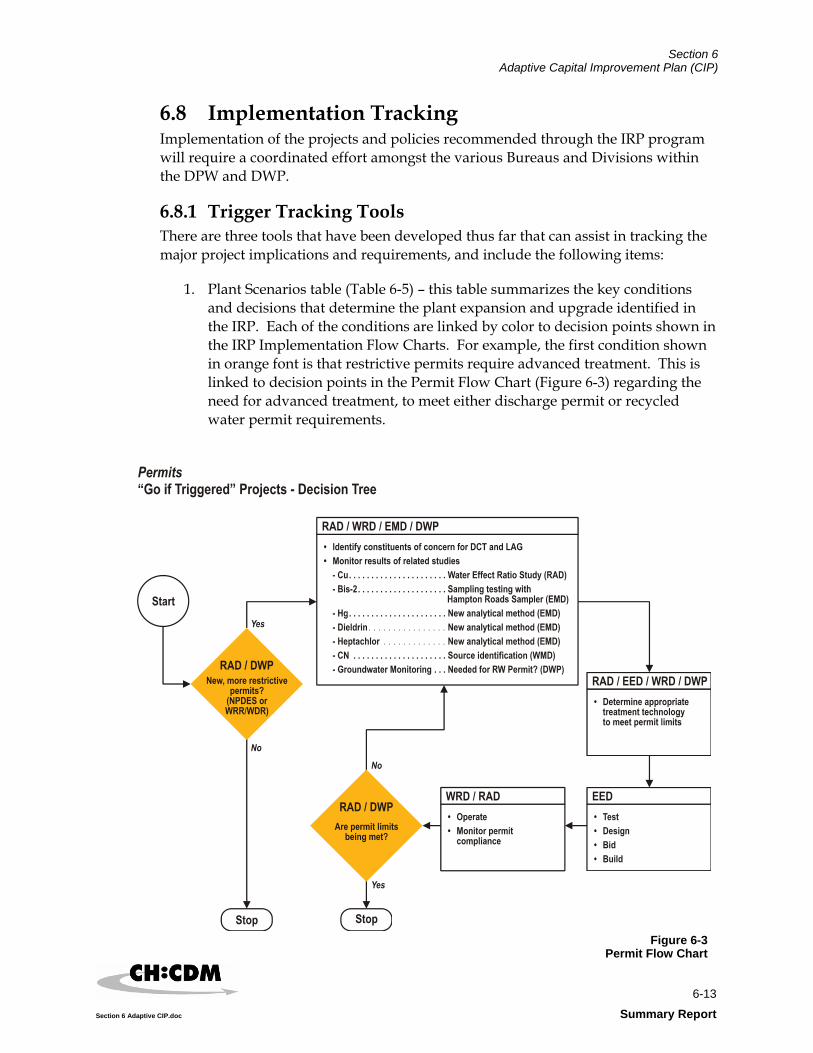
Section 6 Adaptive Capital Improvement Plan (CIP)
6-13
Section 6 Adaptive CIP.doc Summary Report
6.8 Implementation Tracking Implementation of the projects and policies recommended through the IRP program will require a coordinated effort amongst the various Bureaus and Divisions within the DPW and DWP.
6.8.1 Trigger Tracking Tools There are three tools that have been developed thus far that can assist in tracking the major project implications and requirements, and include the following items:
1. Plant Scenarios table (Table 6-5) – this table summarizes the key conditions and decisions that determine the plant expansion and upgrade identified in the IRP. Each of the conditions are linked by color to decision points shown in the IRP Implementation Flow Charts. For example, the first condition shown in orange font is that restrictive permits require advanced treatment. This is linked to decision points in the Permit Flow Chart (Figure 6-3) regarding the need for advanced treatment, to meet either discharge permit or recycled water permit requirements.
Figure 6-3Permit Flow Chart

IRP
Alternative
Scenario
Plant E
xpansion & O
ther System
Impacts
Am
ount A
dvanced Treatm
ent at D
CT
Am
ount A
dvanced Treatm
ent at LA
G
Implem
ent G
WR
?
Restrictive
Perm
its require A
T1?
Additional W
W
treatment capacity
needed in HS
A?
Sufficient flow
available in D
CTS
A for
expanded DC
T to treat?
DC
T discharge lim
ited to minim
um
LA R
iver flow
requirements?
41
DC
T:100 mgd expansion
FullFull
YY - Full
Y2
Y2
N4
2D
CT:100 m
gd expansionP
ortion 3P
ortion 2Y
Y - PartialY
2Y
2N
43
DC
T:100 mgd expansion
Portion 1
None
YN
Y2
Y2
N4
4N
oneFull
FullY
Y - FullN
NN
45
DC
T: bypass remaining flow
to HTP
Half
FullY
Y - FullN
NY
3
46
None
Portion 3
Portion 2
YY - Partial
NN
N7
DC
T: bypass remaining flow
to HTP
Portion 3
None
YY - Partial
NN
Y3
48
None
Portion 1
None
YN
NN
N4
9D
CT: bypass rem
aining flow to H
TPH
alfFull
NY - Full
Nn/a
4Y
3
410
None
Portion 2
Portion 2
NY - Partial
Nn/a
4N
411
DC
T: bypass remaining flow
to HTP
Portion 2
Portion 2
NY - Partial
Nn/a
4Y
3
112
HTP
expansion5
DC
T: bypass remaining flow
to HTP
Half
FullN
Y - FullY
n/a4
Y6
113
HTP
expansion5
FullFull
NY - Full
Yn/a
4N
114
HTP
expansion5
DC
T: bypass remaining flow
to HTP
Portion 2
Portion 2
NY - Partial
Yn/a
4Y
6
115
HTP
expansion5
None
None
NN
Yn/a
4N
Notes:
1Applies to plant N
PD
ES
or WD
R/W
RR
permits
234Assum
e DC
T will not be expanded unless there is a need for additional capacity in H
SA
(i.e., RW
demands alone w
ould not drive plant expansion). 5H
TP expansion requires additional environm
ental documentation
6HTP
expansion could occur even when half of D
CT is m
othballed if the HS
A flow
increases occur downstream
of the DC
T service area.FullH
alfP
ortion 1P
ortion 2P
ortion 3D
CT =
Portion of total plant flow
treated with A
.T. for GW
R and/or non-potable reuse
Am
ount of Advanced Treatm
ent (AT):
Plant ScenarioTable 6-5
Current Plant C
apacities:
CO
ND
ITION
S (KEY D
ECISIO
NS)
Half of plant flow
OU
TCO
MES FO
R TR
EATM
ENT PLA
NTS
Expansion at D
CT w
ould only occur if both additional wastew
ater treatment capacity in H
SA
and additional flows are available in D
CTS
A.
Full plant flow
Half of D
CT m
othballed due to excessive investment/O
&M
costs to comply w
ith new perm
it requirements
Portion of total plant flow
treated with A
.T. for LAR
discharge
80 mgd, LA
G = 20 m
gd, HTP
= 450 mgd
Portion of total plant flow
treated with A
.T. for GW
R and LA
R disch

Section 6 Adaptive Capital Improvement Plan (CIP)
6-15
Section 6 Adaptive CIP.doc Summary Report
2. IRP Implementation Flow Charts – these flow charts are intended to serve as decision trees to identify decisions necessary for implementation of the “Go If Triggered” projects.
The flow charts provide the linkages between the key conditions/decisions reflected in the Plant Scenarios table (item 1 above), the major activities necessary to make these decisions, and the organizations responsible for these activities.
3. Trigger Tracking Charts spreadsheet tools to monitor specific project triggers. The IRP Facilities Plan Volume 5: Adaptive Capital Improvement Plan provides detailed discussion of these tools.
Included in the preferred alternative is a listing of recommended policy directions for City staff to proceed with specific activities related to recycled water, water conservation, and runoff management. Staff is to provide periodic status updates to the City Council, along with identification of any impacts these actions might have on existing City. Each agency identified as lead will be invited to periodically report out to the IRP Implementation Strategy Committee on the activities and progress on these actions.
Table 6-6 summarizes these policy directions and the responsible party or parties leading the activities. These actions are grouped by service function. The General Go-Policy Directions listed are applicable to more than one resource area.
6.8.2 IRP Progress Reporting The status of IRP project and policies is of great interest to the affected agencies within the City, as well as the stakeholders, including community and partner agencies, that have been engaged in this program since its inception in 1999. As the keepers of this program, WESD will lead the communications of program progress. At a minimum, minutes of the IRP Implementation Strategy Committee meetings will be prepared and distributed among the committee member organizations. In addition, on an annual basis, WESD will prepare a summary brochure that communicates the following:
Highlights of key accomplishments in furthering IRP goals,
Status summary of IRP Go Projects,
Trigger status and implications to IRP Go If Triggered Projects,
Status of actions associated with Go Policy Directions
Short-term goals for the upcoming fiscal year

Section 6 Adaptive Capital Improvement Plan (CIP)
6-16 Summary Report Section 6 Adaptive CIP.doc
Table 6-6 IRP Go-Policy Directions
Policy Direction Responsible Party (lead organization listed first)
Recycled Water Non-Potable Uses: 1. Work together to maximize use of recycled water for non-potable uses in
Terminal Island Treatment Plant service area, west side, and LAG services areas. DWP to conduct additional Tier 1 and 2 customer analysis to verify the potential demands and feasibility. Develop a long-range marketing strategy for recycled water that includes a plan for recruiting (and keeping) new customers.
DWP and DPW
2. Evaluate and develop ordinances to require installation where feasible of dual plumbing for new multi-family, commercial and industrial developments, schools and government properties in the vicinity of existing or planned recycled water distribution systems in coordination with LA River Revitalization Master Plan. Consider proximity and demand when determining feasibility.
Dept. of Building and Safety
3. Coordinate where feasible the design/construction of recycled water distribution piping (purple pipe) with other major public works projects, including street widening, and LA River Revitalization Master Plan project areas. Also coordinate with other agencies, including MTA and Caltrans on major transportation projects.
DWP and DPW
Indirect Potable Uses: 4. Develop a public outreach program to explore the feasibility of
implementing groundwater replenishment with advanced treated recycled water.
DWP
Environmental Uses: 5.
Continue to provide water from DCT to Lake Balboa, Wildlife Lake, and the Japanese Garden at Sepulveda Basin, and the LA River to meet baseline needs for habitat, i.e., approximately 27 mgd through flow-through lakes).
DWP and DPW
Water Conservation 6. Continue conservation efforts, including programs to reduce outdoor
usage, including using smart irrigation devices on City properties, schools and large developments (those with 50 dwelling units or 50,000 gross square feet or larger), and to increase incentives to residential properties.
DWP
7. Continue conservation efforts, including evaluating and considering new water conservation technologies, including no-flush urinal technology.
DWP and DBS
8. Continue conservation efforts, including working with Building and Safety to evaluate and develop policy that requires developers to implement individual water meters for all new apartment buildings
DWP and DBS
9. Continue conservation awareness efforts, including increasing education programs on the benefits of using climate-appropriate plants with an emphasis on California friendly plants for landscaping or landscaped areas developed in coordination with LA River Revitalization Master Plan, and to develop a program of incentives for implementation.
DWP
10. Consider the development of City Directive to require the use of California friendly plants in all City projects where feasible and not in conflict with other facilities usage.
Planning Dept.

Section 6 Adaptive Capital Improvement Plan (CIP)
6-17
Section 6 Adaptive CIP.doc Summary Report
Table 6-6 IRP Go-Policy Directions
Policy Direction
Responsible Party (lead organization listed first)
Wet Weather Runoff Management 11. Review SUSMP requirements to require on-site infiltration instead of
treat/discharge BMPs, where feasible, along with in-lieu fess where infiltration is infeasible.
DPW
12. Evaluate and modify codes to encourage on-site capture and retention and/or infiltration, where feasible. Evaluate porous pavements in all new public facilities and large developments >1 acre.
DBS, DPW and Planning Dept.
13. Evaluate ordinances to reduce are on private properties that can be paved with impervious pavement.
Planning Dept.
14. Evaluate and implement integration of porous pavements into sidewalks and street programs where feasible.
DPW
15. Prepare concept report and determine feasibility of developing power line easement demonstration project.
DPW, DWP, DRP
16. Determine feasibility of developing projects for new and retrofitted schools, as well as government/city-owned facilities with stormwater BMPs.
DPW, DWP, LAUSD
17. Identify sites that can provide onsite percolation in surplus properties, vacant lots, parks/open space, abandoned alleys in the East Valley, and along the LA River in the East Valley, where feasible.
DPW, DGS, DRP
18. Maximize unpaved open space in City-owned properties and parking medians through use of all feasible BMPs and by removing all unnecessary pavement.
DPW, DGS, DOT
19. Include all feasible BMPs in the construction or reconstruction of highway medians under City’s jurisdiction.
DPW
20. Coordinate with Million Trees LA team to identify potential locations of tree planting to provide stormwater benefits.
DPW
Dry Weather Runoff Management 21. Consider diversion of dry weather runoff from Ballona Creek to constructed
wetlands, wastewater system or urban runoff plant for treatment and/or beneficial use in development of TMDL implementation plans.
DPW, DRP,
22. Consider diversion of dry weather runoff from inland creeks and storm drains tributary to LA River to wastewater system, constructed wetlands, or treatment/retention/infiltration basins in development of TMDL implementation plans.
DPW
General 23. Consider opportunities to incorporate IRP policy decisions in the General
Plan, Community Plan, and Specific Plan updates or revisions, and in the future LA River Revitalization Master Plan and Opportunity Areas.
Planning Dept.
24. Coordinate to include stormwater BMPs in all new parks. DRP, DPW 25. Evaluate feasibility of all City properties identified as surplus for potential
development of multiple-benefit projects to improve stormwater management, water quality and groundwater replenishment.
GS, Planning Dept., DPW
LEGEND: DPW – Dept. of Public Works DWP – Dept. of Water and Power DBS – Dept. of Building and Safety DRP – Dept. of Recreation and Parks DGS – Dept. of General Services LAUSD – Los Angeles Unified School District DOT – Dept. of Transportation

Section 6 Adaptive Capital Improvement Plan (CIP)
6-18 Summary Report Section 6 Adaptive CIP.doc
This brochure will be distributed at the end of each fiscal year to the IRP stakeholders as well as the City leadership, i.e., City Council members, Commissioners of the Board of Public Works and DWP Board. In this manner, the IRP will continue as an evolving, adaptive plan that will continue to reflect the IRP guiding principles that have culminated through the IRP process in the recommended projects and policies described in this Adaptive CIP, and from which the next facilities plan can be launched.

7-1
Section 7 Public Participation Final Summary Report
Section 7 Public Participation
7.1 Introduction One of the hallmarks of the IRP is that it was and continues to be a stakeholder driven process. From the beginning of the IRP in 2002, the City solicited the involvement of a large number of community, business, and environmental leaders in the development of the IRP, and their involvement has expanded considerably. The stakeholder involvement took the form of several stakeholder groups, each with a specific level of involvement in the IRP. These groups, the Steering Group, the Advisory Group, and the Information Group are described below. In addition, a forth group of stakeholders developed during the later stages of the IRP during the environmental process.
7.2 Roles of Stakeholders in the IRP Project The three stakeholder groups participated throughout the four-year IRP planning process. The group members provided input and guidance, much of which was incorporated into the IRP alternatives, and support for the IRP process. The stakeholder groups served as resources to the City and consultant team in addressing concerns or resolving issues as future needs were addressed and solutions developed. Figure 7-1 shows the relationship between the City and stakeholder groups in the IRP process.
Figure 7-1Role of Stakeholders Groups

Section 7 Public Participation
7-2 Summary Report Section 7 Public Participation
7.3 Steering, Advisory, and Information Groups The Steering Group, comprising approximately 125 community members and organizational representatives who could commit to active participation in a series of 13 half-day workshops held over four years, participated directly in the more detailed planning and alternatives development, which would ultimately result in a selected IRP Project and an associated Capital Improvements Program and implementation plan. These workshops were participatory decision-making workshops that were periodically held from November 2002 through 2006. Input and information developed in earlier workshops were addressed and built up in later workshops throughout the alternatives development process, which was completed in April 2004.
The Advisory Group, comprising community members who were interested in the IRP (the membership ranged from 74 to 218 stakeholders over time), provided feedback on IRP issues to be taken into consideration by the IRP team and the Steering Group throughout the facilities planning process. The Advisory Group members were considered closer to the various communities throughout the City and could provide community-relevant input. Meetings were held with the Advisory Group throughout 2003 and 2004.
The Information Group, comprising 232 people from organizations, agencies, neighborhoods, and other interests, were recipients of important IRP information and developments in the form of Newsletters so that they could, in turn, share that information with others in their organizations or offices. The Information Groups served as a means of conveying information to stakeholders and interested persons that may not have otherwise been informed. Four newsletters were circulated from 2003 and 2006.
7.4 Stakeholders and Focused Outreach Related to the Environmental Impact Report In summer 2004, the IRP team began the yearlong environmental analysis of the four alternatives identified in collaboration with the Steering and Advisory groups. In parallel, the IRP outreach team began a series of presentations to organizations throughout Los Angeles to increase awareness of the overall integrated resources planning program. The outreach team contacted 35 Neighborhood Councils that would potentially have IRP facilities within their jurisdictions and gave presentations upon request.
Specific to the environmental process, extensive public outreach was conducted, including initial internal stakeholder briefings (primarily with Los Angeles City Council offices with parts of alternatives within their districts); two Scoping Meetings held in the afternoon and evening of July 28, 2004; focused outreach to neighborhood groups from Spring 2005 to the release of the draft EIR in November 2005; and four public hearings to receive comments on the draft EIR in January and February 2006.

Section 7 Public Participation
7-3
Section 7 Public Participation Summary Report
Focused outreach brought in a new set of stakeholders, those that could be affected in the future by implementation of an IRP Alternative. This outreach effort focused on agencies, cities, community organizations, and other organizations that may have been located close to facilities proposed by one or more of the IRP Alternatives, or that were interested in areas that could be affected by the alternatives. The purpose of focused outreach was multi-fold:
Ensure that these unique stakeholders – those who could be impacted by construction or operations – were aware of the IRP and the alternatives
Answer questions about how the project alternatives could affect their neighborhoods and how impacts could be mitigated
Invite these stakeholders to comment on the draft EIR
The focused outreach engaged many people from these organizations, some who were supportive from the start and others who remained concerned about certain aspects of the alternatives at the time of Final EIR certification. Outreach continued, particularly with City officials and residents of Burbank and Toluca Lake, throughout much of 2006. The cities of Los Angeles and Burbank coordinated on a route for the Glendale-Burbank Interceptor Sewer that would meet the wastewater system needs while avoiding residential areas to the maximum extent possible.
7.5 Public Hearings to Certify the Final EIR In August 2006, the Final EIR was completed and released to the public. Notices were sent to all parties who sent comment letters, faxes and/or emails and/or attended the January 2006 public hearings or were included in the IRP stakeholder database. Other parties contacted by the City of Los Angeles about the Final EIR included all certified Neighborhood Councils. These councils were contacted via the Department of Neighborhood Empowerment and were apprised of the Final EIR contents, including the content of and rationale for the Recommended Alternative.
On October 4, 2006, the Board of Public Works recommended that the IRP EIR be approved and concurred with the staff recommendation that Alternative 4 be implemented. On November 1, 2006, the Energy and Environment Subcommittee agreed with the Board of Public Works recommendations and forwarded the EIR the City Council for certification and concurred with the staff recommendation that Alternative 4 be approved implemented. On November 7, 2006, the Board of Water and Power Commissioners concurred with the IRP EIR. Finally, on November 14, 2006 the Los Angeles City Council certified the EIR and approved the staff Recommended Alternative (IRP Alternative 4) for implementation.

8-1
Section 8 - Environmental Impact Report.doc Summary Report
Section 8 Environmental Impact Report
8.1 Introduction This section summarizes the environmental process and environmental impact report (EIR) prepared for the IRP (more detailed information is contained the EIR for the IRP).
The California Environmental Quality Act (CEQA) was passed by the state legislature in 1970, with the primary intent of requiring decision-makers to consider the environmental effects of their actions. CEQA applies to all levels of government in the state of California, including local agencies such as the City of Los Angeles. The principal way that environmental effects are disclosed is through the preparation of environmental documents, including EIRs. An EIR must be considered and certified by decision-makers before they approve a project. In the case of the IRP, the decision-maker is the City Council. The environmental impacts of the four Project Alternatives, as well as a No Project Alternative (required by CEQA), were evaluated in an EIR for the IRP. The EIR, comprised of the Integrated Resources Plan Draft Environmental Impact Report (Draft EIR) and the Integrated Resources Plan Final Environmental Impact Report (Final EIR), identified the environmental impacts of the Alternatives so that the decision-makers (City Council) could consider the environmental effects of the Project Alternatives prior to selecting a Project Alternative for implementation.
The Draft EIR evaluated the Project Alternatives at a co-equal level and did not identify a preferred or recommended alternative for implementation. Rather, a Recommended Alternative was selected following public review of the Draft EIR. The identification of the Recommended Alternative and the factors that formed the basis of its recommendation were described in the Final EIR.
8.2 Draft EIR The Draft EIR analyzed the four IRP Project Alternatives and the No Project Alternative required by CEQA, at a co-equal level. The No Project Alternative would result in not implementing integrated improvements to the wastewater treatment and collection, recycled water, and runoff systems.
Draft EIRs must be circulated for public review and comment for at least 30 days. The original comment period for the IRP Draft EIR was 90 days to afford adequate time for public review and response to the City of Los Angeles (City). The Draft EIR was initially circulated for public comment from November 30, 2005, through February 27, 2006.
A Notice of Completion (NOC) was submitted to the Office of Planning and Research and is included in the Administrative Record. A Notice of Availability (NOA) of the Draft EIR was mailed to over 8,000 agencies, organizations, and interested persons,

Section 8 Environmental Impact Report
8-2 Summary Report Section 8 - Environmental Impact Report.doc
including residents within 500 feet of the NEIS II and GBIS alignments within the City of Los Angeles.
In addition, a notice was published in the Los Angeles Times on December 1, 2005, and the Draft EIR was distributed to the local libraries listed in the NOA.
Furthermore, on February 6, 2006, at the request of the City of Glendale, the NOA of the Draft EIR was sent to all persons on the mailing list that the City of Glendale provided to the City of Los Angeles.
During the public review period, various comments were received from residents along the GBIS alignments expressing concerns about potential impacts. As a result, the City made a minor modification to the GBIS Alignments by connecting the eastern portion of the GBIS South Alignment with the western portion of the GBIS North Alignment with a short connector along West Olive Avenue/Pass Avenue. The City of Los Angeles extended the comment period for an additional 32 days to allow additional public comment on this modification and the Draft EIR, and the comment period ended on March 31, 2006. On February 27, 2006, a public announcement of this extension was distributed to all persons who had received the original NOA.
The Draft EIR also was sent to governmental agencies including the State Water Resources Control Board (State Board), the Governor’s Office of Planning and Research, applicable Responsible and Trustee agencies, and other jurisdictions. The Draft EIR also was posted on the IRP Web site for the City and was available for download and review.
The Draft EIR identified potentially significant impacts after mitigation to the following resource areas:
Air Quality (during construction, operation)
Cultural Resources (damage to paleontological and archaeological resources)
Geology (sewer fault crossings, settlement above tunnels)
Water Quality (degradation from possible earthquake induce tunnel rupture)
Recreation (from tunnel shaft sites and air treatment facilities)
During the public review period for the Draft EIR, the City of Los Angeles conducted four public hearings on the following dates and locations:
San Fernando Valley Area Van Nuys City Hall 6262 Van Nuys Boulevard Van Nuys, CA 91401 Wednesday, January 4, 2006 @7:00 p.m.
Central Los Angeles Area DWP – John Ferraro Building 111 N. Hope Street Los Angeles, CA 90012 Wednesday, January 11, 2006 @10:00 a.m.

Section 8 Environmental Impact Report
8-3
Section 8 - Environmental Impact Report.doc Summary Report
West Los Angeles Area Council District 11 7166 W. Manchester Boulevard Los Angeles, CA 90045 Saturday, January 7, 2006 @11:00 a.m.
Los Angeles Zoo Witherbee Auditorium 5333 Zoo Drive Los Angeles, CA 90027 Thursday, January 12, 2006 @6:00 p.m.
Public comments on the scope and content of the Draft EIR were accepted at the public hearings, including oral testimony recorded by court reporters and for which transcripts were prepared.
8.3 Final EIR The Final EIR describes the process and rationale for identifying the City staff Recommended Alternative, which is also summarized below. The Final EIR also provides responses to comments received on the Draft EIR and provides updates, where applicable, to the Draft EIR.
In response to the Draft EIR, a total of 2,767 comment documents (letters, public hearing and other comment sheets, public hearing transcripts, form letters and petitions) were received by the City. A total of 27 letters were received from agencies and jurisdictions, and 19 were from organizations. The remaining documents contain comments submitted by individuals to the City. The majority of the comments received were concerning the GBIS alignments. Section 3 of the Final EIR provides responses to each comment submitted on the Draft EIR.
Based on the Final EIR and the Draft EIR, a Statement of Finding and Overriding Consideration and a Mitigation Monitoring and Reporting Program were prepared and made a part of the decision-making process. On November 14, 2006, the Los Angeles City Council certified the EIR and approved the staff Recommended Alternative (Alternative 4) for implementation.
8.4 Recommended Alternative As described above, the City identified a Recommended Alternative after the public review of the Draft EIR. To select the Recommended Alternative from the alternatives analyzed in the Draft EIR, the City of Los Angeles relied on: (1) the information contained in the Draft and Final EIRs (including the Project objectives, environmental analysis, and public comments on the Draft EIR); and (2) the IRP Facilities Plan quadrant analysis that evaluated the preliminary Proposed Project Alternatives originally discussed in the IRP Facilities Plan (City of Los Angeles et al., 2004).
The Draft EIR identified Alternative 1 as the Environmentally Superior Alternative and determined that each of the four Proposed Project Alternatives would meet the long-term goals of protecting public health and safety, providing adequate wastewater treatment and conveyance capacity, and protecting the environment. Although Alternatives 1 through 4 would each result in short-term or temporary construction-related impacts, all of the alternatives were deemed to be superior to the

Section 8 Environmental Impact Report
8-4 Summary Report Section 8 - Environmental Impact Report.doc
No Project Alternative because they: (1) are designed to ensure that adequate wastewater treatment and conveyance capacity exists to prevent sewage overflows, (2) would comply with effluent quality requirements of the National Pollutant Discharge Elimination System (NPDES), and (3) would meet the requirements of applicable laws and regulations. On the basis of the analysis conducted in the Draft EIR, Alternative 1, Hyperion Expansion to 500 mgd, was determined to be the Environmentally Superior Alternative.
As discussed in the Draft EIR, the majority of the potentially significant impacts are associated with components that are common to all of the alternatives, such as the proposed new sewer alignments. Differences in impacts are most prevalent when considering alternate locations of proposed IRP treatment facilities. For example, all the Proposed Project Alternatives would result in potential odor impacts related to increased wastewater treatment capacity, but the potential for impacts to occur would differ depending on where a given alternative focuses the expansion of treatment capacity. Alternative 1 was identified as the Environmentally Superior Alternative because it would result in lower use of energy and fewer air pollutant emissions.
In addition to considering the relative differences in environmental impacts among alternatives, the City considered the comments received on the Draft EIR. To help identify the Recommended Alternative, staff reviewed the comments that focused on systemwide issues.
To assist further in the identification of a Recommended Alternative, City staff revisited the previous alternatives ranking process conducted for the Facilities Plan IRP (IRP Facilities Plan, Volume 4: Alternatives Development and Analysis; City of Los Angeles; 2004). In this process, staff applied the comprehensive principles of the IRP facilities planning process using a quadrant analysis (modified cost-benefits analysis) method to evaluate the costs and benefits of the alternatives. The overall objectives of the IRP are to:
Protect public health and safety
Effectively manage system capacity
Protect the environment
Enhance cost efficiency
Protect quality of life
Promote education
In applying the quadrant approach for the alternatives, staff evaluated the alternatives based on the project objectives. Based on the evaluation of the alternatives and consideration of the information in the Draft EIR and the comments on the Draft EIR, the City selected Alternative 4 as the Recommended Alternative.

Section 8 Environmental Impact Report
8-5
Section 8 - Environmental Impact Report.doc Summary Report
8.4.1 Final Selected Alternative The staff Recommended Alternative in the Final EIR was Alternative 4 and included expanding Tillman to 100 mgd; adding storage to Tillman and LAG; and adding a truck-loading facility, digesters, and secondary clarifiers to Hyperion. Figure 8-1 shows the overall system components that make up the staff Recommended Alternative. Wastewater treatment capacity at Tillman would be expanded by increasing the assumed derated capacity of 64 mgd to 100 mgd and upgrading treatment processes to advanced treatment. Adding advance treatment at LAG would also be an option. Wastewater and recycled water storage would be added at LAG. The staff Recommended Alternative would use up to 56,100 acre-feet per year of recycled water (79,900 acre-feet with groundwater replenishment) and would manage 42 percent and 47 percent of the dry weather and wet weather urban runoff, respectively, generated in the City.
On November 14, 2006, the Los Angeles City Council certified the EIR and approved Alternative 4 for implementation, and Alternative 4 is now the final selected alternative.

Figu
re 8-1
Fin
al Selected Altern
ative: Altern
ative 4 - Tillm
an Expan
sion
Source: CH
:CDM

R-1
references Summary Report
References
City of Los Angeles, Department of Public Works Bureau of Sanitation and Department of Water and Power. July 2006. Integrated Resources Plan, Facilities Plan, Volume 1: Wastewater Management.
__________. July 2004. Integrated Resources Plan, Facilities Plan, Volume 2: Water Management.
__________. July 2004. Integrated Resources Plan, Facilities Plan, Volume 3: Runoff Management.
________. July 2004. Integrated Resources Plan, Facilities Plan, Volume 4: Alternative Development and Analysis.
_________. July 2005. Technical Memorandum: Financial Impacts of Four Draft IRP Alternatives. ________. December 2006. Integrated Resources Plan, Facilities Plan, Volume 5: Adaptive Capital Improvement Program.
________. December 2006. Integrated Resources Plan, Facilities Plan, Executive Summary.
________. December 2006. Integrated Resources Plan, Facilities Plan, Draft Environmental Impact Report.
________. December 2006. Integrated Resources Plan, Facilities Plan, Financial Plan.
________. December 2006. Integrated Resources Plan, Facilities Plan, Public Outreach Program Report.