Embed Size (px)
Citation preview
1
Final report - PARE Youth Research Project
January, 2014
Ingrid Põldemaa Marika Tammaru Maarten de Wit
2
C o n t e n t 1. Introduction 1.1 Background 1.2 What has PARE done so far? 1.3 Objective of this project 2. Method 2.1 Approach of mixed methods and action research 2.2 Mapping exercise 2.3 Qualitative interviews and focus groups 2.4 Survey 3. Results 3.1 Overview youth activities in Europe 3.2 Interviews and focus group responses and characteristics 3.3 Survey responses and characteristics 3.4 Combined findings of the PARE youth research project 3.4.1 Me, myself and I 3.4.2 Health care 3.4.3 Education 3.4.4 Work 3.4.5 Social life 3.4.6 Family life and intimacy
4. Conclusions 5. Recommendations 6. Acknowledgements Appendixes
Glossary
EULAR European League Against Rheumatism
PARE The EULAR Standing Committee of PARE
PARE organisations Patient organisations member of the EULAR and co-opted members of the EULAR Standing Committee of PARE
3
1. I n t r o d u c t i o n 1.1 Background
PARE organisations often try to organise activities for younger people with Rheumatic and Musculoskeletal Diseases (RMDs). Empowering youth groups all over Europe is important to improve health care for young people, but also in the context of capacity building to guarantee sustainability of PARE and the national patient organisations, now and in the future. For several reasons, it seems difficult to reach this specific target group. There are however examples of youth groups that are very active and successful in bringing together young people with RMDs by using social media or by organising events that are different to the activities traditionally organised. From these examples we know that a group-specific approach to work for and by young people with RMDs is beneficial for campaigning in the interest of young people and for organising services that meet their needs and expectations.
1.2 What has PARE done so far?
In the last three years PARE has actively tried to become more inclusive in terms of young people with RMDs. By inviting young people, PARE has incorporated their perspectives in different events and activities. Young people with RMDs have been part of several working groups, extra bursaries have been provided to increase the number of young people at the autumn conference, dedicated sessions and workshops have been organised and also during the EULAR congress, opportunities for young people have been created to meet and to exchange knowledge and experiences.
1.3 Objectives of the project This proposal addresses the need and wish of youth organisations and PARE organisations to take the next step and to improve the services to young people with RMDs by enhancing international collaboration, and by the integration of the perspective of young people with RMDs in EULAR. In order to be able to do this, we first need more insight into the needs of young people with RMDs and their organisations, and we need more insight into what is currently available in terms of activities and organisations for young people with RMDs across Europe. For the first project year, we work with a tentative age definition between 18 and 35 years. Objectives – In the first year of this project, the task force will work on the following two objectives: a. Gather information about the way young people with RMDs are organised in different
European countries; b. Explore the needs, obstacles, preferences and priorities of young people with RMDs and
their organisations; With the research findings about the needs of young people with RMDs (objective b), PARE hopes to be able to develop tailored programs, activities and networks that supports the
4
improvement of quality of life of young people and addresses their needs. By mapping out the current situation of youth activities and organisations in Europe (objective a), PARE will be able to compare the existing situation with the needs of young people and assess whether the current activities and organisation forms are effective and appropriate to support the interests of the target group. On the basis of these findings, PARE will be able to develop a strategy for the future to improve the services for young people with RMDs: on an international as well as national level, and within its own organisation as well as beyond. A separate outcome of the first year might be topics and questions for a research agenda.
5
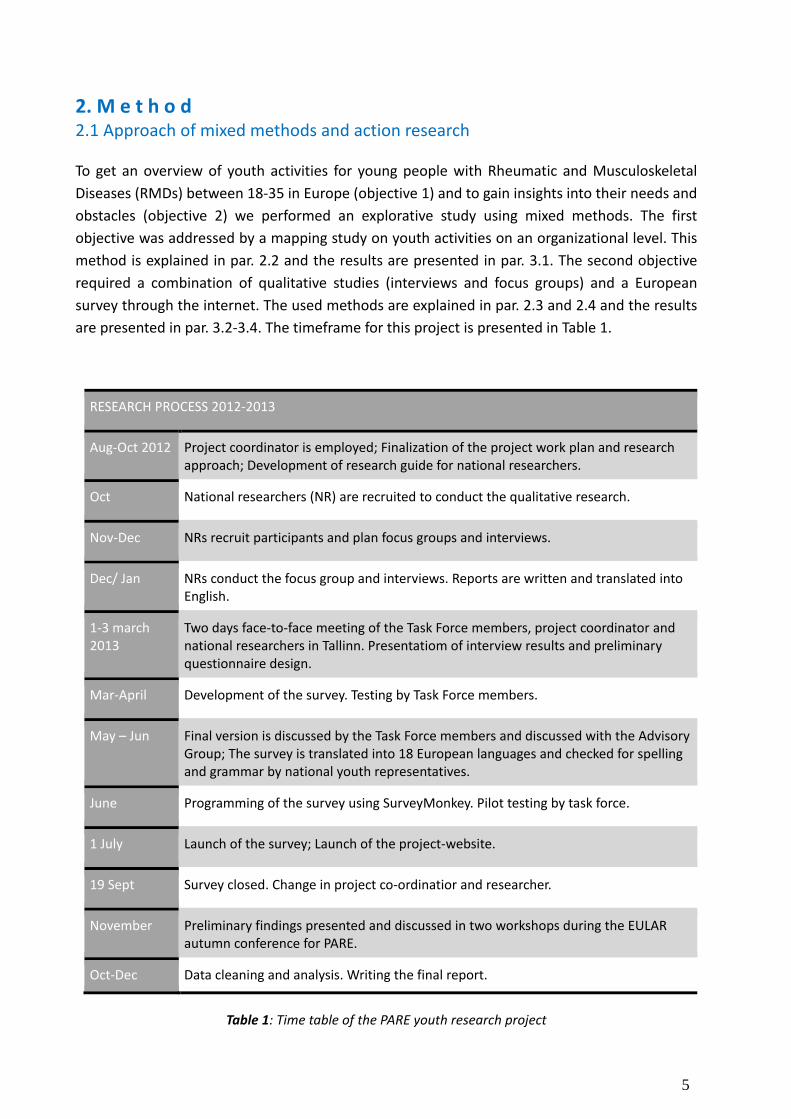
2. M e t h o d 2.1 Approach of mixed methods and action research To get an overview of youth activities for young people with Rheumatic and Musculoskeletal
Diseases (RMDs) between 18-35 in Europe (objective 1) and to gain insights into their needs and
obstacles (objective 2) we performed an explorative study using mixed methods. The first
objective was addressed by a mapping study on youth activities on an organizational level. This
method is explained in par. 2.2 and the results are presented in par. 3.1. The second objective
required a combination of qualitative studies (interviews and focus groups) and a European
survey through the internet. The used methods are explained in par. 2.3 and 2.4 and the results
are presented in par. 3.2-3.4. The timeframe for this project is presented in Table 1.
RESEARCH PROCESS 2012-2013
Aug-Oct 2012 Project coordinator is employed; Finalization of the project work plan and research approach; Development of research guide for national researchers.
Oct National researchers (NR) are recruited to conduct the qualitative research.
Nov-Dec NRs recruit participants and plan focus groups and interviews.
Dec/ Jan NRs conduct the focus group and interviews. Reports are written and translated into English.
1-3 march 2013
Two days face-to-face meeting of the Task Force members, project coordinator and national researchers in Tallinn. Presentatiom of interview results and preliminary questionnaire design.
Mar-April Development of the survey. Testing by Task Force members.
May – Jun Final version is discussed by the Task Force members and discussed with the Advisory Group; The survey is translated into 18 European languages and checked for spelling and grammar by national youth representatives.
June Programming of the survey using SurveyMonkey. Pilot testing by task force.
1 July Launch of the survey; Launch of the project-website.
19 Sept Survey closed. Change in project co-ordinatior and researcher.
November Preliminary findings presented and discussed in two workshops during the EULAR autumn conference for PARE.
Oct-Dec Data cleaning and analysis. Writing the final report.
Table 1: Time table of the PARE youth research project
6
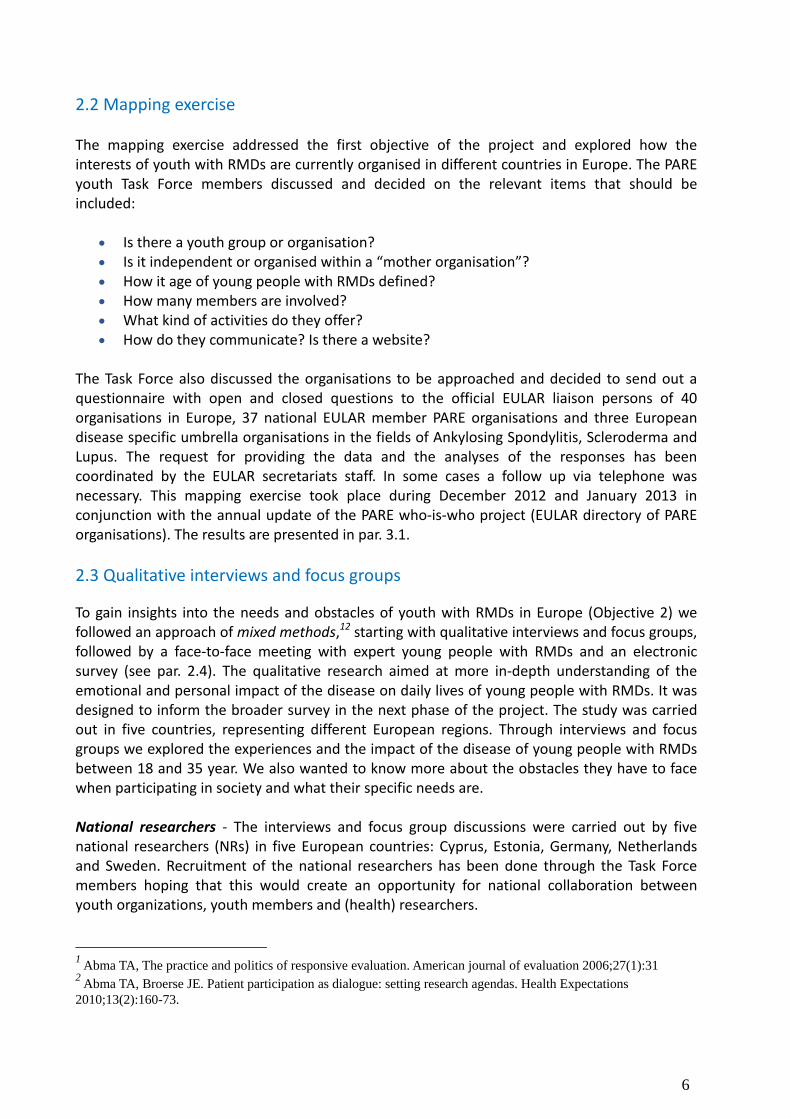
2.2 Mapping exercise The mapping exercise addressed the first objective of the project and explored how the interests of youth with RMDs are currently organised in different countries in Europe. The PARE youth Task Force members discussed and decided on the relevant items that should be included:
Is there a youth group or organisation? Is it independent or organised within a “mother organisation”? How it age of young people with RMDs defined?
How many members are involved? What kind of activities do they offer? How do they communicate? Is there a website?
The Task Force also discussed the organisations to be approached and decided to send out a questionnaire with open and closed questions to the official EULAR liaison persons of 40 organisations in Europe, 37 national EULAR member PARE organisations and three European disease specific umbrella organisations in the fields of Ankylosing Spondylitis, Scleroderma and Lupus. The request for providing the data and the analyses of the responses has been coordinated by the EULAR secretariats staff. In some cases a follow up via telephone was necessary. This mapping exercise took place during December 2012 and January 2013 in conjunction with the annual update of the PARE who-is-who project (EULAR directory of PARE organisations). The results are presented in par. 3.1.
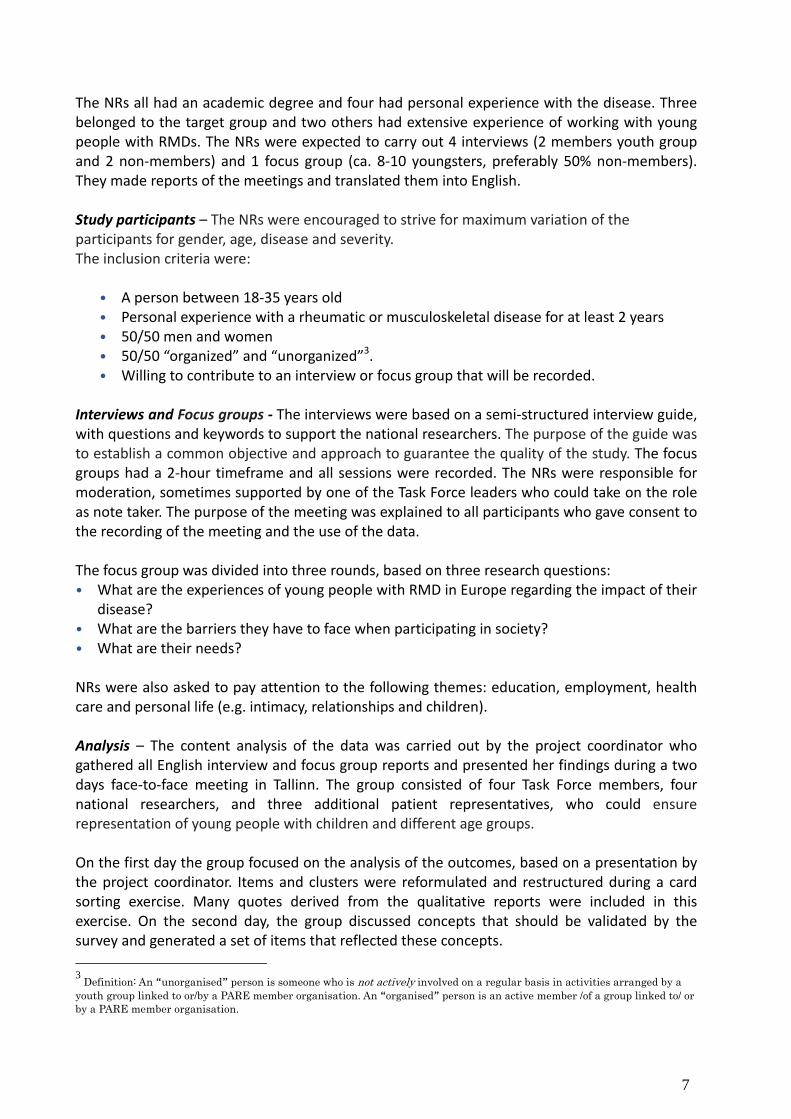
2.3 Qualitative interviews and focus groups
To gain insights into the needs and obstacles of youth with RMDs in Europe (Objective 2) we followed an approach of mixed methods,12 starting with qualitative interviews and focus groups, followed by a face-to-face meeting with expert young people with RMDs and an electronic survey (see par. 2.4). The qualitative research aimed at more in-depth understanding of the emotional and personal impact of the disease on daily lives of young people with RMDs. It was designed to inform the broader survey in the next phase of the project. The study was carried out in five countries, representing different European regions. Through interviews and focus groups we explored the experiences and the impact of the disease of young people with RMDs between 18 and 35 year. We also wanted to know more about the obstacles they have to face when participating in society and what their specific needs are. National researchers - The interviews and focus group discussions were carried out by five national researchers (NRs) in five European countries: Cyprus, Estonia, Germany, Netherlands and Sweden. Recruitment of the national researchers has been done through the Task Force members hoping that this would create an opportunity for national collaboration between youth organizations, youth members and (health) researchers.
1 Abma TA, The practice and politics of responsive evaluation. American journal of evaluation 2006;27(1):31
2 Abma TA, Broerse JE. Patient participation as dialogue: setting research agendas. Health Expectations
2010;13(2):160-73.
7
The NRs all had an academic degree and four had personal experience with the disease. Three belonged to the target group and two others had extensive experience of working with young people with RMDs. The NRs were expected to carry out 4 interviews (2 members youth group and 2 non-members) and 1 focus group (ca. 8-10 youngsters, preferably 50% non-members). They made reports of the meetings and translated them into English. Study participants – The NRs were encouraged to strive for maximum variation of the participants for gender, age, disease and severity. The inclusion criteria were:
• A person between 18-35 years old
• Personal experience with a rheumatic or musculoskeletal disease for at least 2 years
• 50/50 men and women
• 50/50 “organized” and “unorganized”3. • Willing to contribute to an interview or focus group that will be recorded.
Interviews and Focus groups - The interviews were based on a semi-structured interview guide, with questions and keywords to support the national researchers. The purpose of the guide was to establish a common objective and approach to guarantee the quality of the study. The focus groups had a 2-hour timeframe and all sessions were recorded. The NRs were responsible for moderation, sometimes supported by one of the Task Force leaders who could take on the role as note taker. The purpose of the meeting was explained to all participants who gave consent to the recording of the meeting and the use of the data. The focus group was divided into three rounds, based on three research questions: • What are the experiences of young people with RMD in Europe regarding the impact of their
disease?
• What are the barriers they have to face when participating in society?
• What are their needs? NRs were also asked to pay attention to the following themes: education, employment, health care and personal life (e.g. intimacy, relationships and children). Analysis – The content analysis of the data was carried out by the project coordinator who gathered all English interview and focus group reports and presented her findings during a two days face-to-face meeting in Tallinn. The group consisted of four Task Force members, four national researchers, and three additional patient representatives, who could ensure representation of young people with children and different age groups.
On the first day the group focused on the analysis of the outcomes, based on a presentation by the project coordinator. Items and clusters were reformulated and restructured during a card sorting exercise. Many quotes derived from the qualitative reports were included in this exercise. On the second day, the group discussed concepts that should be validated by the survey and generated a set of items that reflected these concepts.
3 Definition: An “unorganised” person is someone who is not actively involved on a regular basis in activities arranged by a
youth group linked to or/by a PARE member organisation. An “organised” person is an active member /of a group linked to/ or
by a PARE member organisation.
8
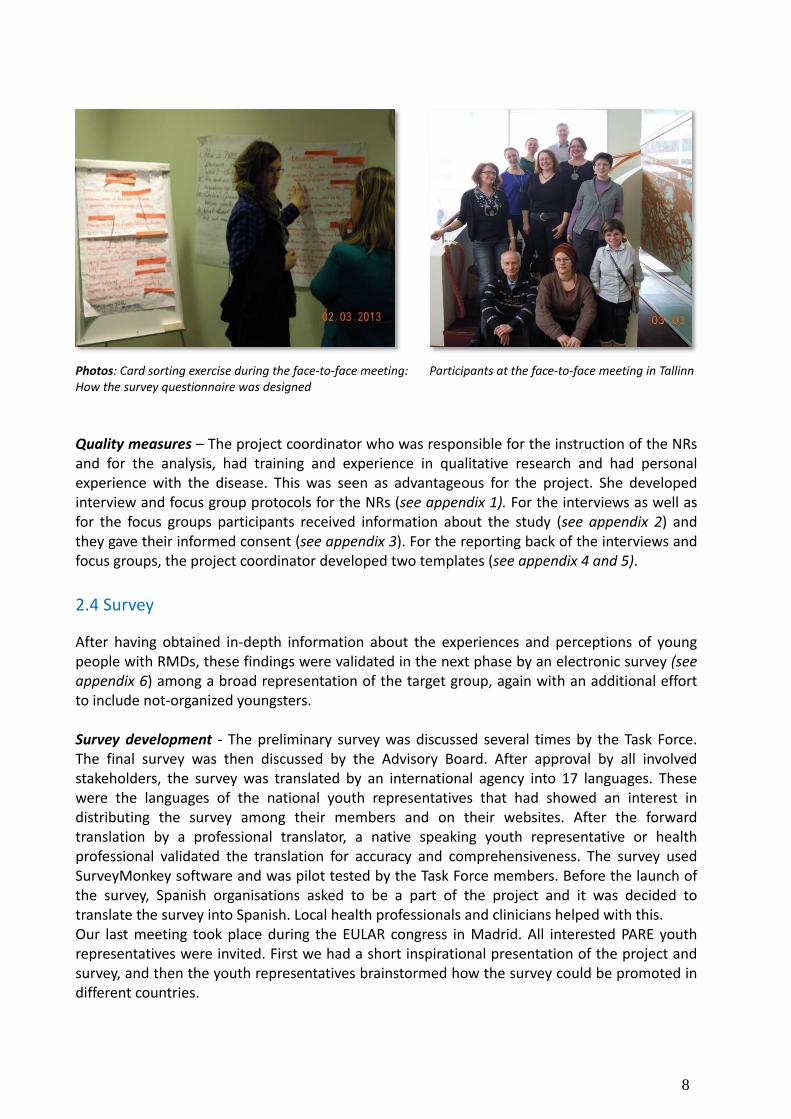
Photos: Card sorting exercise during the face-to-face meeting: Participants at the face-to-face meeting in Tallinn How the survey questionnaire was designed
Quality measures – The project coordinator who was responsible for the instruction of the NRs and for the analysis, had training and experience in qualitative research and had personal experience with the disease. This was seen as advantageous for the project. She developed interview and focus group protocols for the NRs (see appendix 1). For the interviews as well as for the focus groups participants received information about the study (see appendix 2) and they gave their informed consent (see appendix 3). For the reporting back of the interviews and focus groups, the project coordinator developed two templates (see appendix 4 and 5).
2.4 Survey
After having obtained in-depth information about the experiences and perceptions of young people with RMDs, these findings were validated in the next phase by an electronic survey (see appendix 6) among a broad representation of the target group, again with an additional effort to include not-organized youngsters. Survey development - The preliminary survey was discussed several times by the Task Force. The final survey was then discussed by the Advisory Board. After approval by all involved stakeholders, the survey was translated by an international agency into 17 languages. These were the languages of the national youth representatives that had showed an interest in distributing the survey among their members and on their websites. After the forward translation by a professional translator, a native speaking youth representative or health professional validated the translation for accuracy and comprehensiveness. The survey used SurveyMonkey software and was pilot tested by the Task Force members. Before the launch of the survey, Spanish organisations asked to be a part of the project and it was decided to translate the survey into Spanish. Local health professionals and clinicians helped with this. Our last meeting took place during the EULAR congress in Madrid. All interested PARE youth representatives were invited. First we had a short inspirational presentation of the project and survey, and then the youth representatives brainstormed how the survey could be promoted in different countries.
9
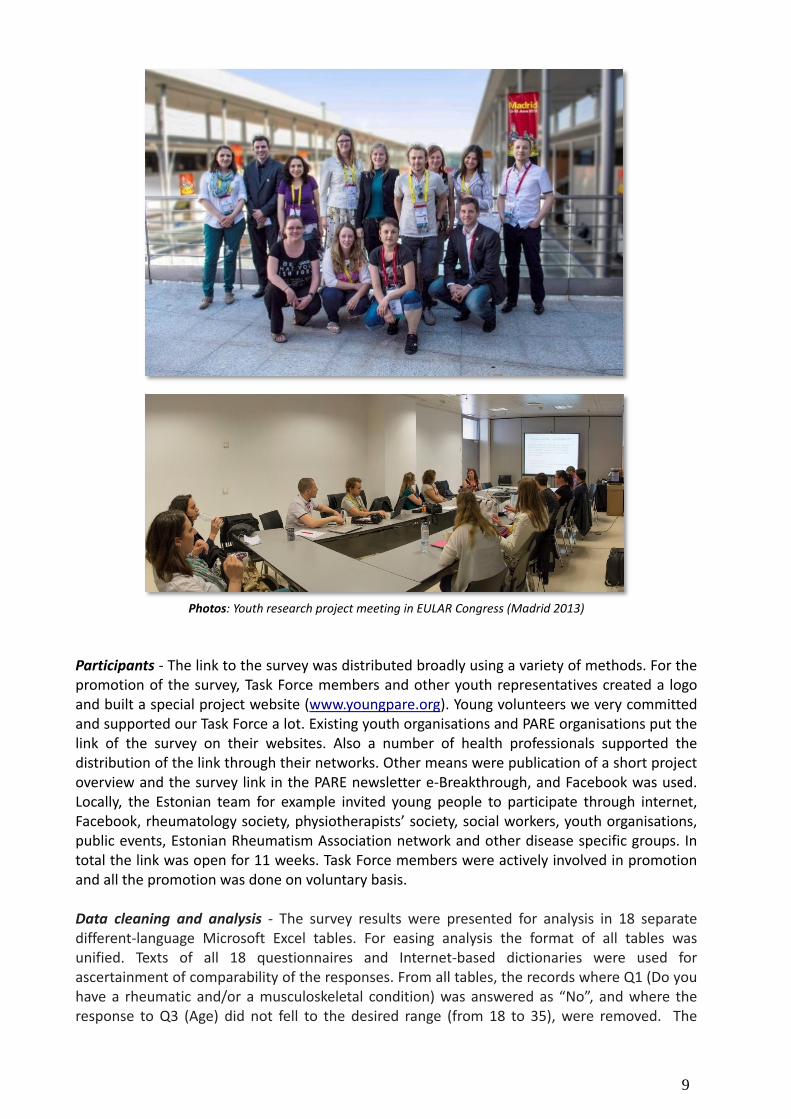
Photos: Youth research project meeting in EULAR Congress (Madrid 2013)
Participants - The link to the survey was distributed broadly using a variety of methods. For the promotion of the survey, Task Force members and other youth representatives created a logo and built a special project website (www.youngpare.org). Young volunteers we very committed and supported our Task Force a lot. Existing youth organisations and PARE organisations put the link of the survey on their websites. Also a number of health professionals supported the distribution of the link through their networks. Other means were publication of a short project overview and the survey link in the PARE newsletter e-Breakthrough, and Facebook was used. Locally, the Estonian team for example invited young people to participate through internet, Facebook, rheumatology society, physiotherapists’ society, social workers, youth organisations, public events, Estonian Rheumatism Association network and other disease specific groups. In total the link was open for 11 weeks. Task Force members were actively involved in promotion and all the promotion was done on voluntary basis. Data cleaning and analysis - The survey results were presented for analysis in 18 separate different-language Microsoft Excel tables. For easing analysis the format of all tables was unified. Texts of all 18 questionnaires and Internet-based dictionaries were used for ascertainment of comparability of the responses. From all tables, the records where Q1 (Do you have a rheumatic and/or a musculoskeletal condition) was answered as “No”, and where the response to Q3 (Age) did not fell to the desired range (from 18 to 35), were removed. The
10
remaining responses were combined in to one table; column headings in English were used. With the aid of the questionnaires the responses were translated and coded. The records with no information but demographic data were dropped. The final database was transferred to statistical program Stata 11.2 for further analysis. All variables were named and labelled according to Stata working principles. Some new variables were generated by grouping the existing ones. For description of qualitative data frequency tables with percentage calculations were used. Bar plot was utilised for illustrative purposes. For qualitative data summary statistics describing central tendency and distribution (mainly mean and standard deviation) were applied; variable distribution was illustrated by histogram. The associations between variables were tested by either Chi-squared or Fisher exact test (in the case of qualitative data); distribution of quantitative variables in groups was compared using Wilcoxon rank-sum or Kruskal-Wallis tests. The difference was considered as statistically significant at probability level p<0.05. First preliminary data was used as an input and starting point for the youth workshops in EULAR Autumn Conference for PARE (November 2013, Reykjavik) together with European Patient’s Forum (EPF) youth strategy example. Outcomes from the workshops are taken into account in conclusion and recommendation parts.
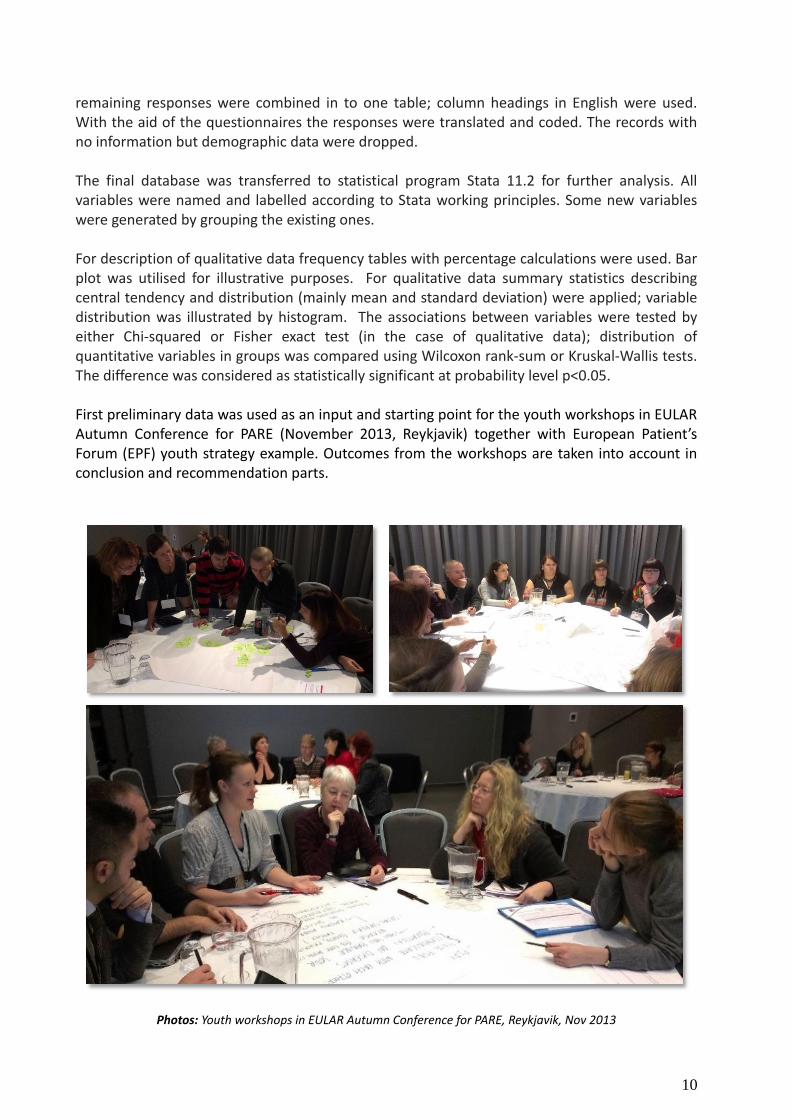
Photos: Youth workshops in EULAR Autumn Conference for PARE, Reykjavik, Nov 2013
11
3. R e s u l t s This chapter is structured as follows. First we present the final outcomes of the mapping exercise (3.1). Then we introduce the response numbers and characteristics of the interviews and focus groups participants (3.2) and the European survey participants (3.3). The combined findings of from the different research phases are presented in section 3.4. These findings are organized around six categories that were reviewed and agreed at the face-to-face youth meeting. These categories were used for survey design and validated by the survey.
3.1 Youth activities in Europe: current status
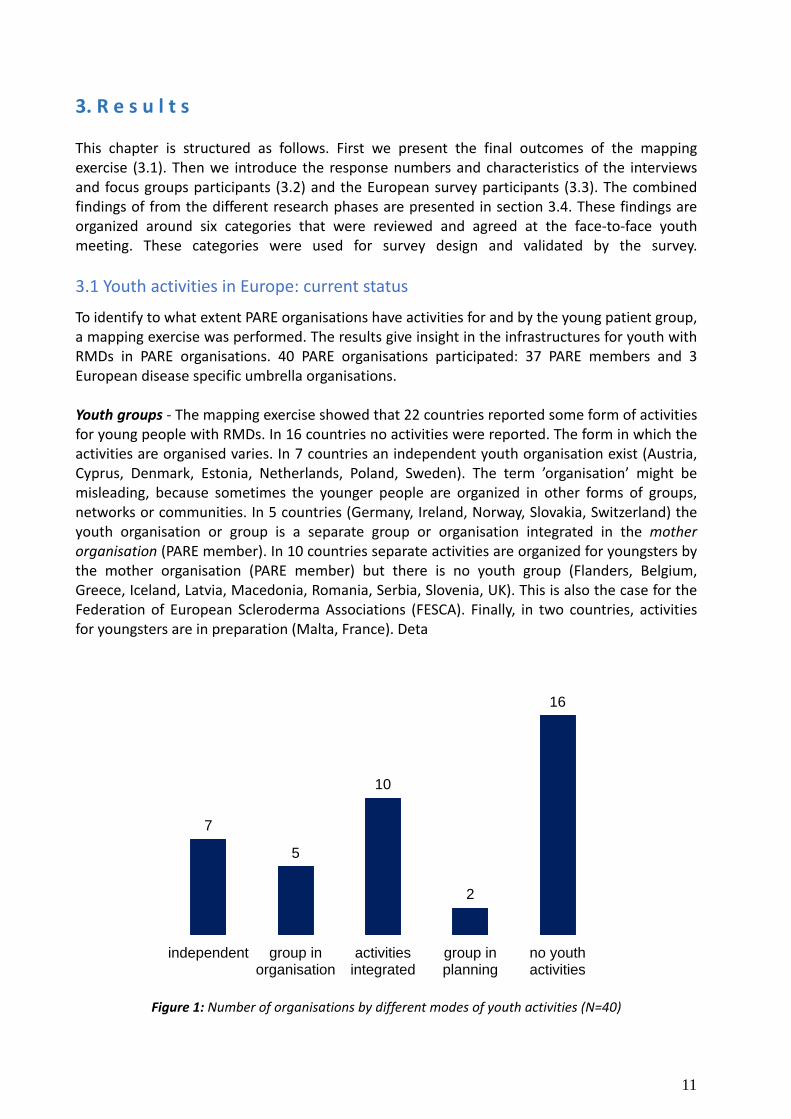
To identify to what extent PARE organisations have activities for and by the young patient group, a mapping exercise was performed. The results give insight in the infrastructures for youth with RMDs in PARE organisations. 40 PARE organisations participated: 37 PARE members and 3 European disease specific umbrella organisations. Youth groups - The mapping exercise showed that 22 countries reported some form of activities for young people with RMDs. In 16 countries no activities were reported. The form in which the activities are organised varies. In 7 countries an independent youth organisation exist (Austria, Cyprus, Denmark, Estonia, Netherlands, Poland, Sweden). The term ’organisation’ might be misleading, because sometimes the younger people are organized in other forms of groups, networks or communities. In 5 countries (Germany, Ireland, Norway, Slovakia, Switzerland) the youth organisation or group is a separate group or organisation integrated in the mother organisation (PARE member). In 10 countries separate activities are organized for youngsters by the mother organisation (PARE member) but there is no youth group (Flanders, Belgium, Greece, Iceland, Latvia, Macedonia, Romania, Serbia, Slovenia, UK). This is also the case for the Federation of European Scleroderma Associations (FESCA). Finally, in two countries, activities for youngsters are in preparation (Malta, France). Deta
Figure 1: Number of organisations by different modes of youth activities (N=40)
7
5
10
2
16
independent group inorganisation
activitiesintegrated
group inplanning
no youthactivities
12
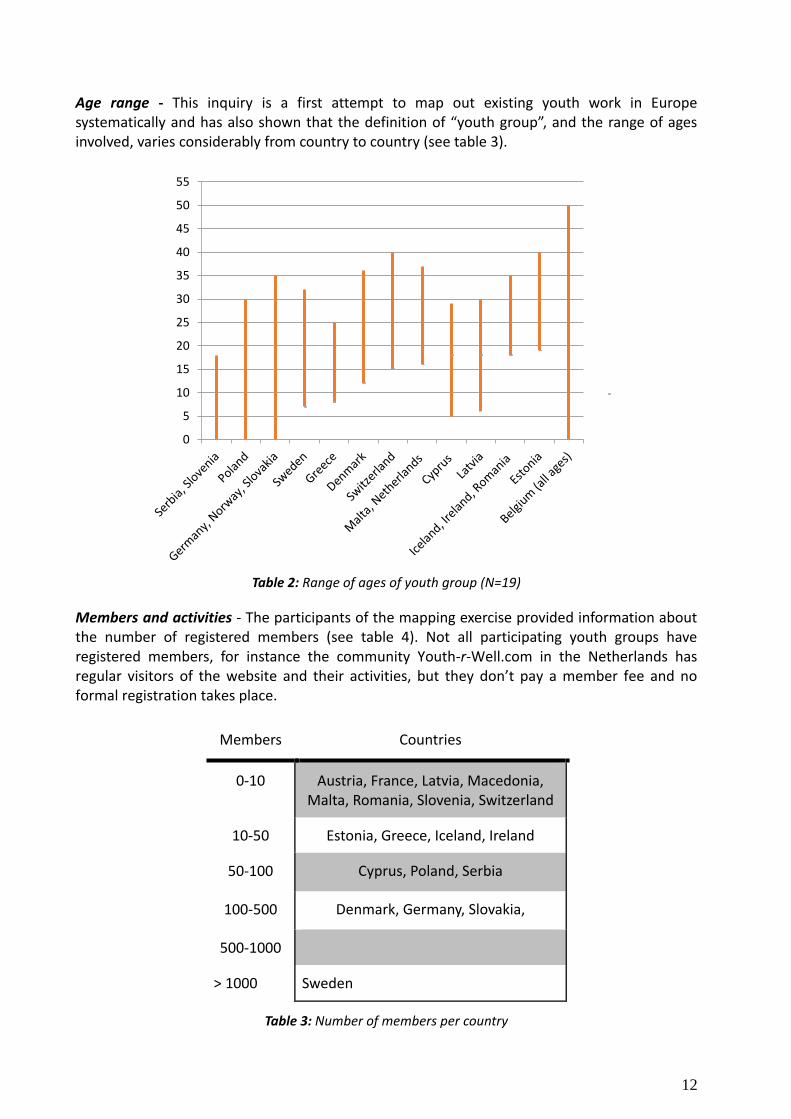
Age range - This inquiry is a first attempt to map out existing youth work in Europe systematically and has also shown that the definition of “youth group”, and the range of ages involved, varies considerably from country to country (see table 3).
Table 2: Range of ages of youth group (N=19)
Members and activities - The participants of the mapping exercise provided information about the number of registered members (see table 4). Not all participating youth groups have registered members, for instance the community Youth-r-Well.com in the Netherlands has regular visitors of the website and their activities, but they don’t pay a member fee and no formal registration takes place.
Table 3: Number of members per country
0
5
10
15
20
25
30
35
40
45
50
55
Members Countries
0-10 Austria, France, Latvia, Macedonia, Malta, Romania, Slovenia, Switzerland
10-50 Estonia, Greece, Iceland, Ireland
50-100 Cyprus, Poland, Serbia
100-500 Denmark, Germany, Slovakia,
500-1000
> 1000 Sweden
13
One group has an office with one employee. Many groups communicate through social media (Facebook, online contact, internet forums, and twitter) and have their own website or a webpage on the site of their mother organization. The activities that were reported showed a great diversity: Workshops, educational activities, social events, weekend seminars, lectures, awareness-raising events, political lobbying, group therapy, independence breaks, positive futures workshops, family gatherings, youth weekends, annual conference, and psychological support after diagnosis, re-socialization, rehabilitation (self-management) courses and creative play. The gathered data about youth groups is included in the annual EULAR directory of PARE organisations. For the future additional research is needed to complete the overview and to fill in the blank spots.
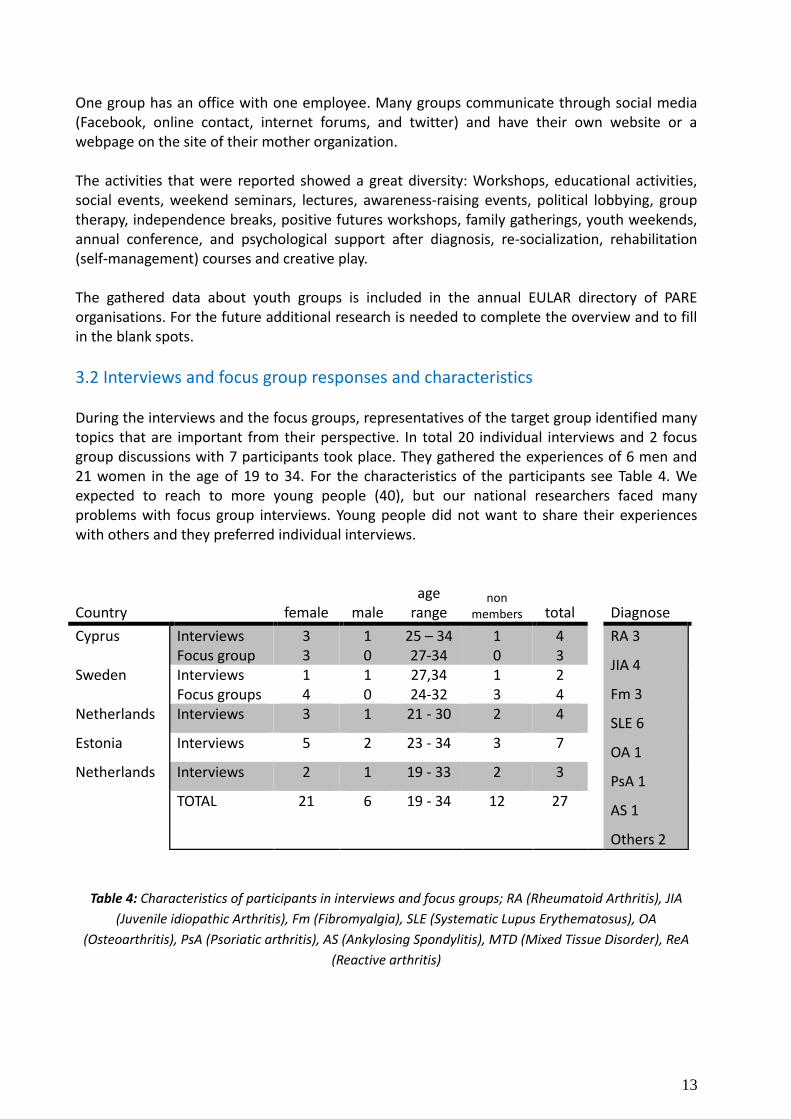
3.2 Interviews and focus group responses and characteristics During the interviews and the focus groups, representatives of the target group identified many topics that are important from their perspective. In total 20 individual interviews and 2 focus group discussions with 7 participants took place. They gathered the experiences of 6 men and 21 women in the age of 19 to 34. For the characteristics of the participants see Table 4. We expected to reach to more young people (40), but our national researchers faced many problems with focus group interviews. Young people did not want to share their experiences with others and they preferred individual interviews.
Country female male age
range non
members total
Diagnose
Cyprus Interviews Focus group
3 3
1 0
25 – 34 27-34
1 0
4 3
RA 3
JIA 4
Fm 3
SLE 6
OA 1
PsA 1
AS 1
Others 2
Sweden Interviews Focus groups
1 4
1 0
27,34 24-32
1 3
2 4
Netherlands Interviews 3 1 21 - 30 2 4
Estonia Interviews 5 2 23 - 34 3 7
Netherlands Interviews 2 1 19 - 33 2 3
TOTAL 21 6 19 - 34 12 27
Table 4: Characteristics of participants in interviews and focus groups; RA (Rheumatoid Arthritis), JIA
(Juvenile idiopathic Arthritis), Fm (Fibromyalgia), SLE (Systematic Lupus Erythematosus), OA
(Osteoarthritis), PsA (Psoriatic arthritis), AS (Ankylosing Spondylitis), MTD (Mixed Tissue Disorder), ReA
(Reactive arthritis)
14
The interview questions covered the impact of the disease, the needs and barriers that young people experience in daily life. Through content analysis of the interviews, focus group reports, the discussions and outcomes of our face-to-face meeting, the Task Force came up with 6 main categories:
• Me, Myself & I • Health care
• Education
• Work
• Social life
• Family and intimacy
3.3 Survey responses and characteristics
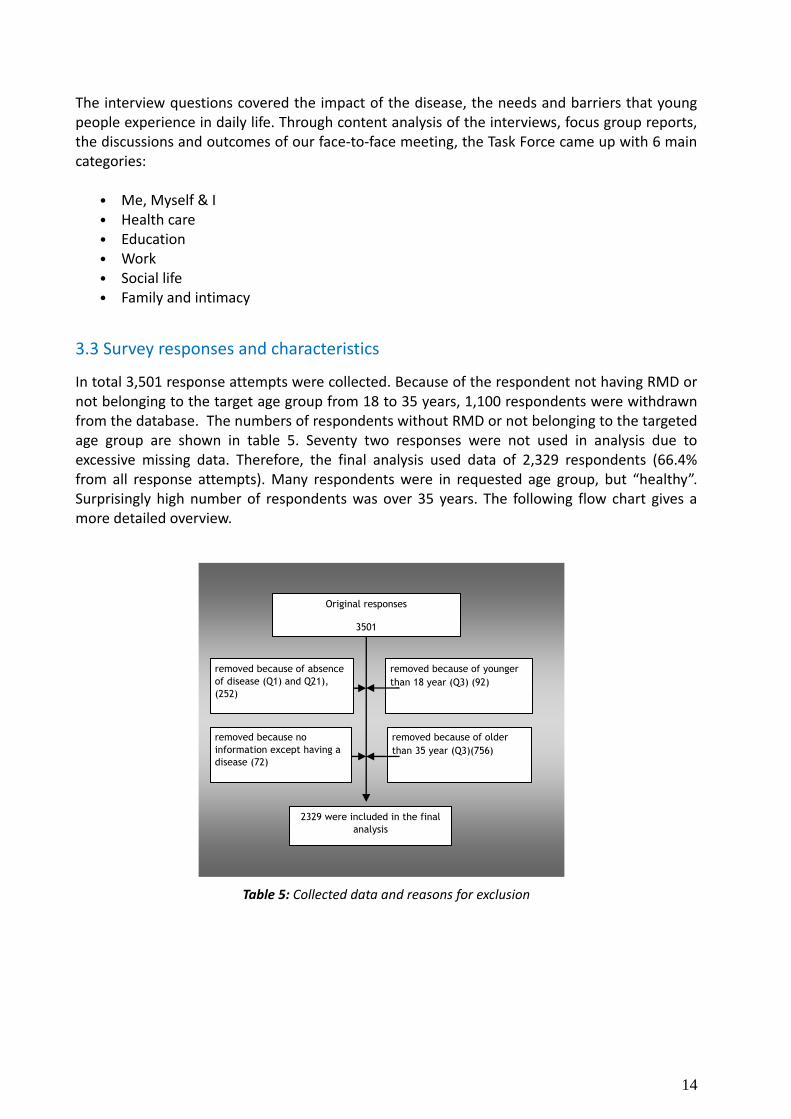
In total 3,501 response attempts were collected. Because of the respondent not having RMD or not belonging to the target age group from 18 to 35 years, 1,100 respondents were withdrawn from the database. The numbers of respondents without RMD or not belonging to the targeted age group are shown in table 5. Seventy two responses were not used in analysis due to excessive missing data. Therefore, the final analysis used data of 2,329 respondents (66.4% from all response attempts). Many respondents were in requested age group, but “healthy”. Surprisingly high number of respondents was over 35 years. The following flow chart gives a more detailed overview.
Table 5: Collected data and reasons for exclusion
Original responses
3501
2329 were included in the final
analysis
removed because of younger
than 18 year (Q3) (92)
removed because of older
than 35 year (Q3)(756)
removed because of absence
of disease (Q1) and Q21),
(252)
removed because no
information except having a
disease (72)
15
Language Collected No RMD Not in target age
Bulgarian 102 2 41
Dutch 376 10 29
English 684 55 89
Estonian 79 29 11
Finnish 65 5 6
French 893 70 353
German 253 12 60
Greek 97 12 17
Icelandic 110 4 23
Italian 130 7 38
Macedonian
35 5 4
Polish 41 3 11
Portuguese 96 8 31
Romanian 46 1 19
Serbian 102 4 21
Slovak 82 5 20
Spanish 133 7 51
Swedish 177 13 24
Total 3501 252 848
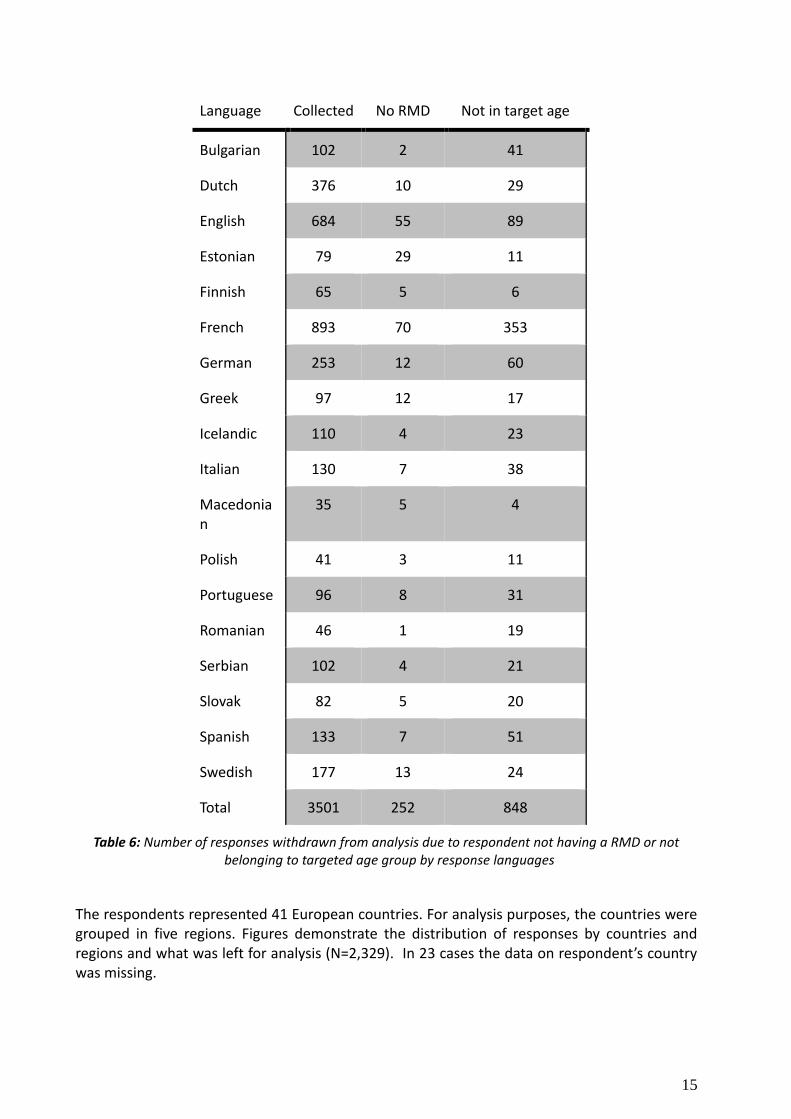
Table 6: Number of responses withdrawn from analysis due to respondent not having a RMD or not belonging to targeted age group by response languages
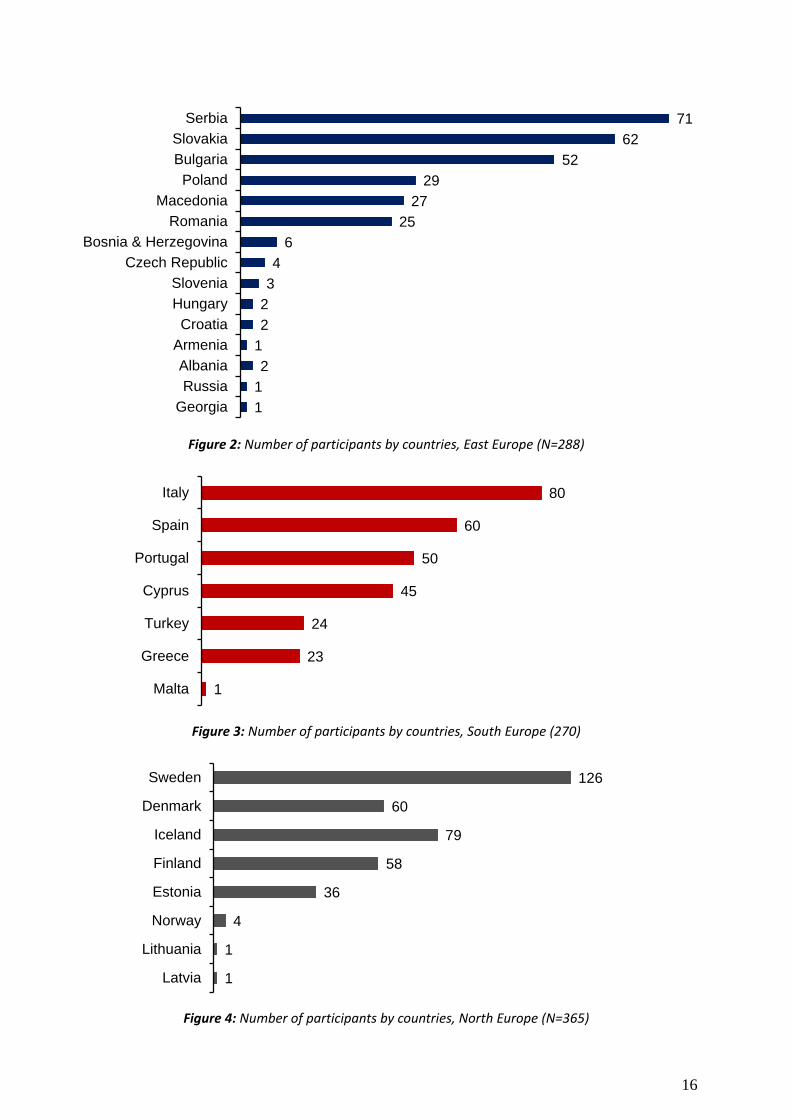
The respondents represented 41 European countries. For analysis purposes, the countries were grouped in five regions. Figures demonstrate the distribution of responses by countries and regions and what was left for analysis (N=2,329). In 23 cases the data on respondent’s country was missing.
16
Figure 2: Number of participants by countries, East Europe (N=288)
Figure 3: Number of participants by countries, South Europe (270)
Figure 4: Number of participants by countries, North Europe (N=365)
71
62
52
29
27
25
6
4
3
2
2
1
2
1
1
Serbia
Slovakia
Bulgaria
Poland
Macedonia
Romania
Bosnia & Herzegovina
Czech Republic
Slovenia
Hungary
Croatia
Armenia
Albania
Russia
Georgia
80
60
50
45
24
23
1
Italy
Spain
Portugal
Cyprus
Turkey
Greece
Malta
126
60
79
58
36
4
1
1
Sweden
Denmark
Iceland
Finland
Estonia
Norway
Lithuania
Latvia
17
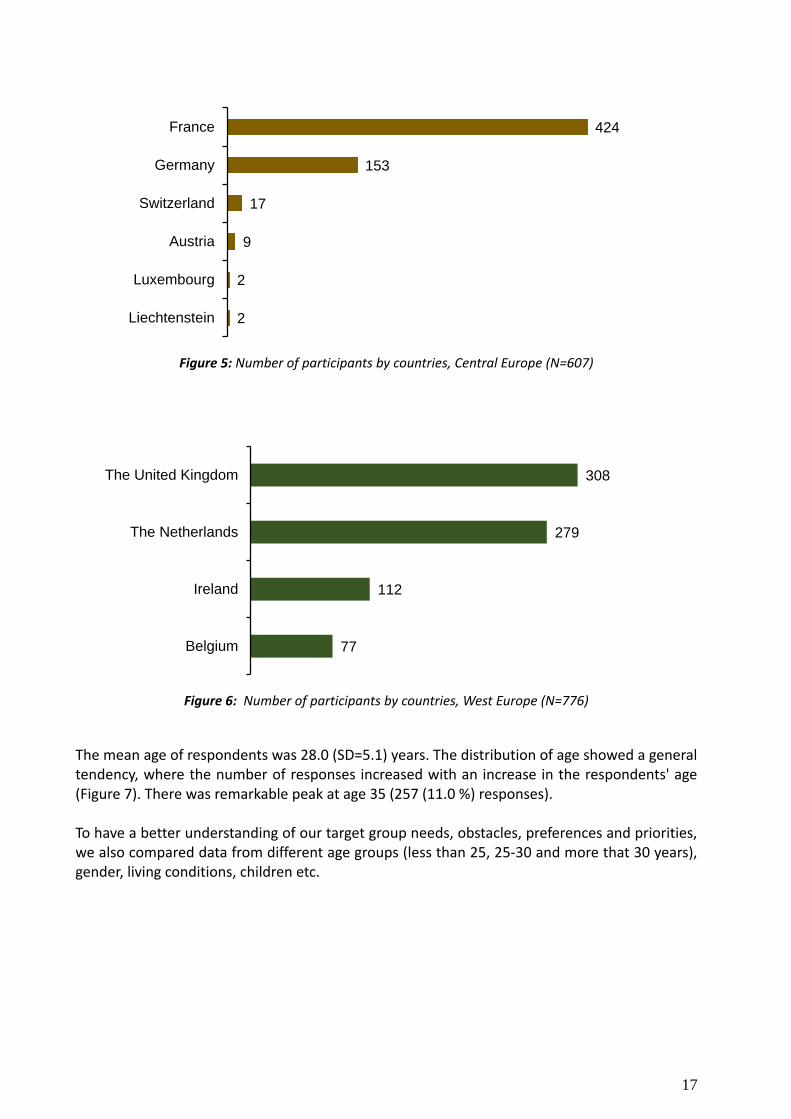
Figure 5: Number of participants by countries, Central Europe (N=607)
Figure 6: Number of participants by countries, West Europe (N=776)
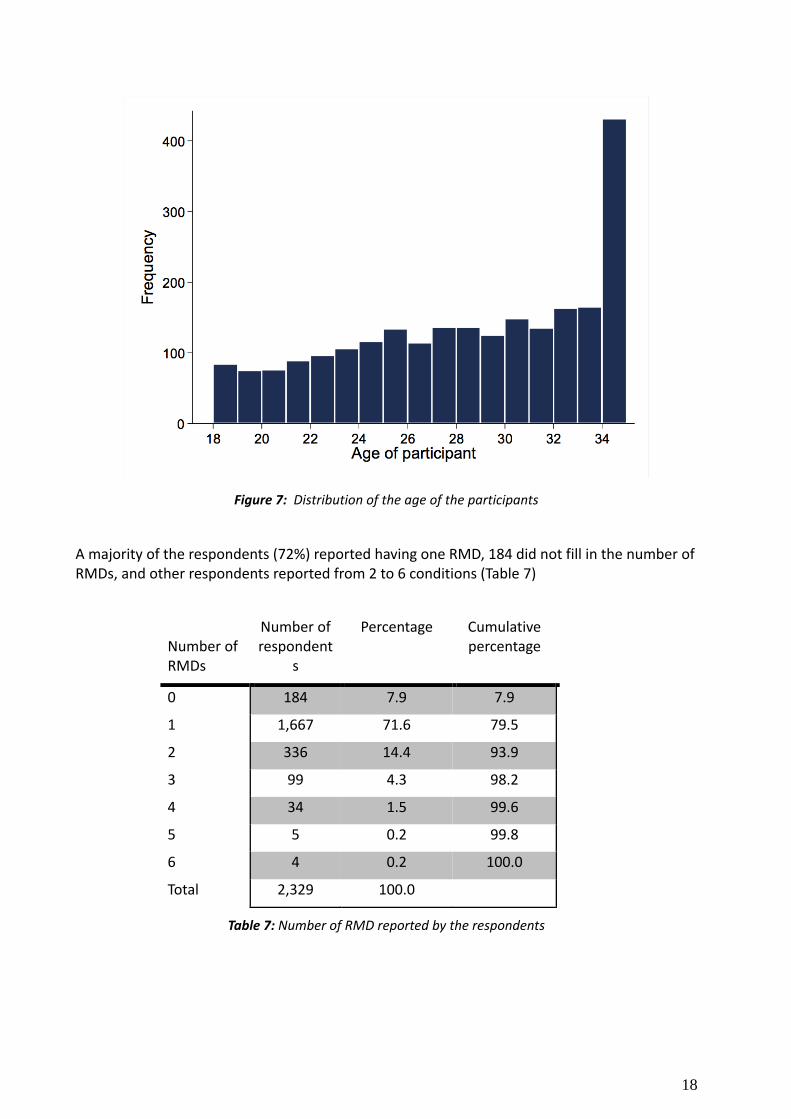
The mean age of respondents was 28.0 (SD=5.1) years. The distribution of age showed a general tendency, where the number of responses increased with an increase in the respondents' age (Figure 7). There was remarkable peak at age 35 (257 (11.0 %) responses). To have a better understanding of our target group needs, obstacles, preferences and priorities, we also compared data from different age groups (less than 25, 25-30 and more that 30 years), gender, living conditions, children etc.
424
153
17
9
2
2
France
Germany
Switzerland
Austria
Luxembourg
Liechtenstein
308
279
112
77
The United Kingdom
The Netherlands
Ireland
Belgium
18
Figure 7: Distribution of the age of the participants
A majority of the respondents (72%) reported having one RMD, 184 did not fill in the number of RMDs, and other respondents reported from 2 to 6 conditions (Table 7)
Number of RMDs
Number of respondent
s
Percentage Cumulative percentage
0 184 7.9 7.9
1 1,667 71.6 79.5
2 336 14.4 93.9
3 99 4.3 98.2
4 34 1.5 99.6
5 5 0.2 99.8
6 4 0.2 100.0
Total 2,329 100.0
Table 7: Number of RMD reported by the respondents
19
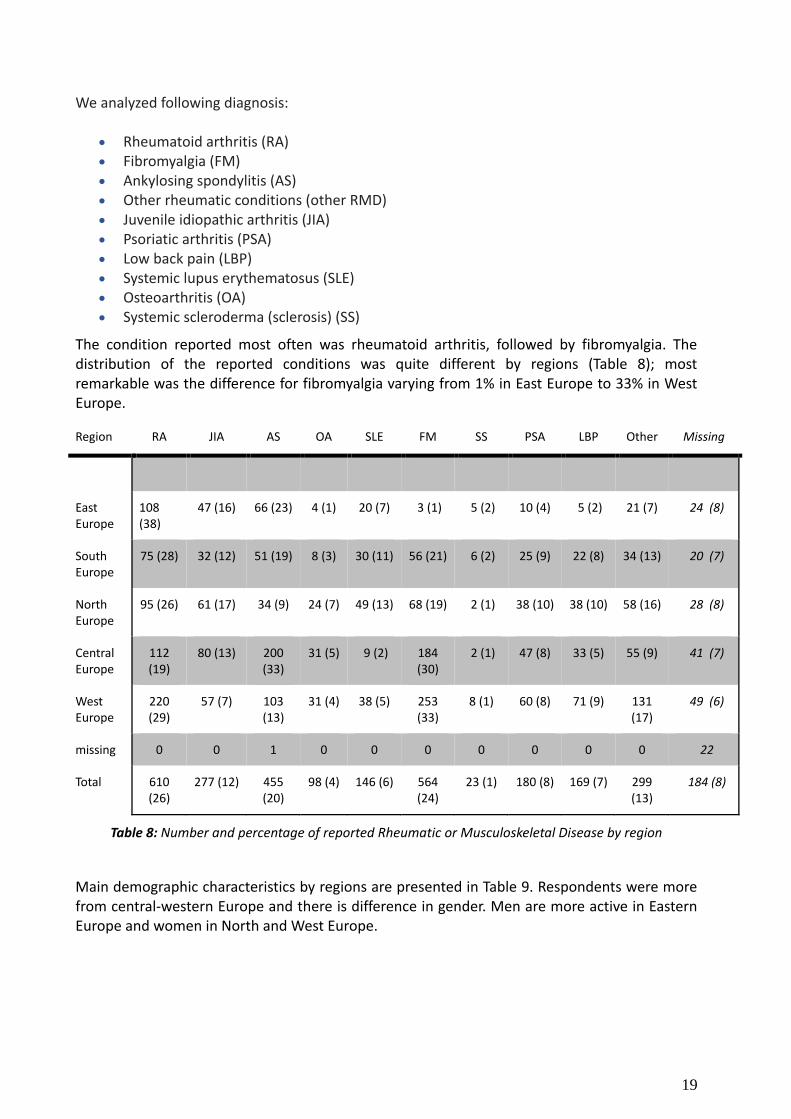
We analyzed following diagnosis:
Rheumatoid arthritis (RA)
Fibromyalgia (FM)
Ankylosing spondylitis (AS)
Other rheumatic conditions (other RMD)
Juvenile idiopathic arthritis (JIA)
Psoriatic arthritis (PSA)
Low back pain (LBP)
Systemic lupus erythematosus (SLE)
Osteoarthritis (OA)
Systemic scleroderma (sclerosis) (SS)
The condition reported most often was rheumatoid arthritis, followed by fibromyalgia. The distribution of the reported conditions was quite different by regions (Table 8); most remarkable was the difference for fibromyalgia varying from 1% in East Europe to 33% in West Europe.
Region RA JIA AS OA SLE FM SS PSA LBP Other Missing
East Europe
108 (38)
47 (16) 66 (23) 4 (1) 20 (7) 3 (1) 5 (2) 10 (4) 5 (2) 21 (7) 24 (8)
South Europe
75 (28) 32 (12) 51 (19) 8 (3) 30 (11) 56 (21) 6 (2) 25 (9) 22 (8) 34 (13) 20 (7)
North Europe
95 (26) 61 (17) 34 (9) 24 (7) 49 (13) 68 (19) 2 (1) 38 (10) 38 (10) 58 (16) 28 (8)
Central Europe
112 (19)
80 (13) 200 (33)
31 (5) 9 (2) 184 (30)
2 (1) 47 (8) 33 (5) 55 (9) 41 (7)
West Europe
220 (29)
57 (7) 103 (13)
31 (4) 38 (5) 253 (33)
8 (1) 60 (8) 71 (9) 131 (17)
49 (6)
missing 0 0 1 0 0 0 0 0 0 0 22
Total 610 (26)
277 (12) 455 (20)
98 (4) 146 (6) 564 (24)
23 (1) 180 (8) 169 (7) 299 (13)
184 (8)
Table 8: Number and percentage of reported Rheumatic or Musculoskeletal Disease by region
Main demographic characteristics by regions are presented in Table 9. Respondents were more from central-western Europe and there is difference in gender. Men are more active in Eastern Europe and women in North and West Europe.
20
Region Frequency (%) Female (%) Member of organisation (%)
Mean age, years (SD)
East Europe 288 (12) 210 (73) 96 (33) 28.9 (5)
South Europe 270 (12) 231 (86) 89 (33) 29.4 (5)
North Europe 365 (16) 329 (90) 145 (40) 27.3 (5)
Central Europe 607 (26) 520 (86) 240 (40) 28.3 (5)
West Europe 776 (33) 702 (91) 220 (28) 27.3 (5)
Missing 23 (1) 14 (61) 1 (4) 28.3 (5)
Total 2,329 (100) 2,006 (86) 741 (34) 28.0 (5)
Table 9: Distribution and main characteristics of respondents by regions
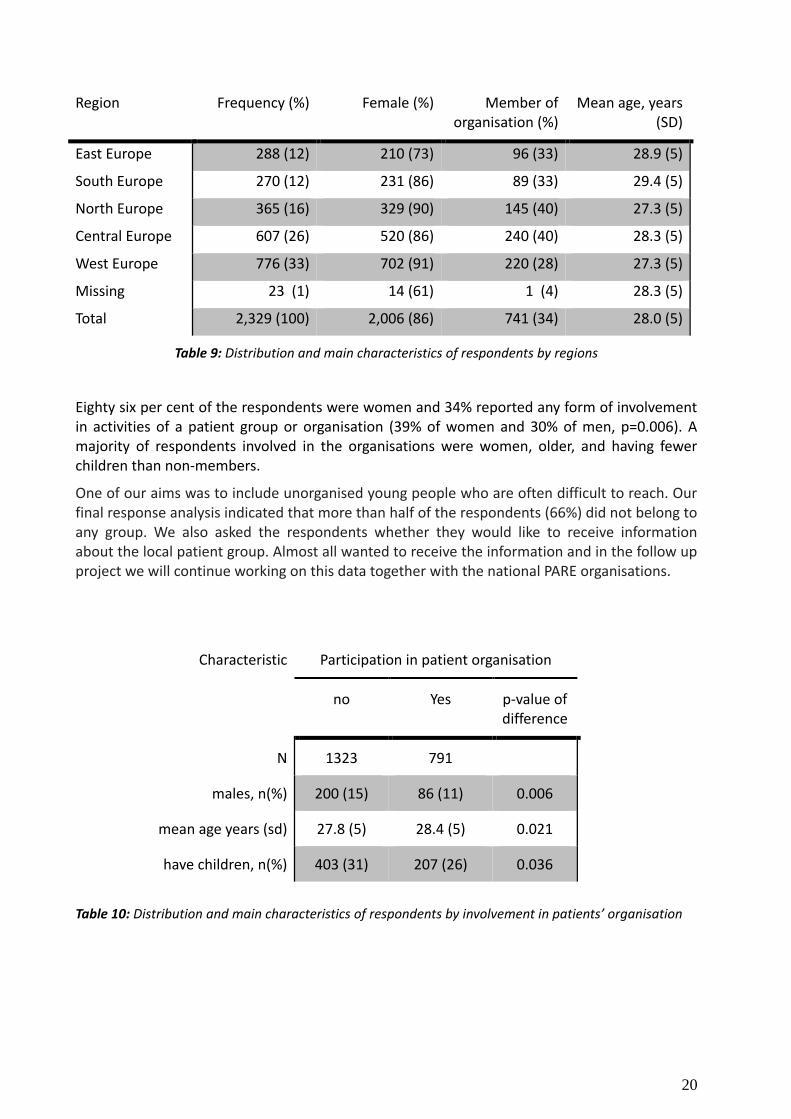
Eighty six per cent of the respondents were women and 34% reported any form of involvement in activities of a patient group or organisation (39% of women and 30% of men, p=0.006). A majority of respondents involved in the organisations were women, older, and having fewer children than non-members.
One of our aims was to include unorganised young people who are often difficult to reach. Our final response analysis indicated that more than half of the respondents (66%) did not belong to any group. We also asked the respondents whether they would like to receive information about the local patient group. Almost all wanted to receive the information and in the follow up project we will continue working on this data together with the national PARE organisations.
Characteristic Participation in patient organisation
no Yes p-value of difference
N 1323 791
males, n(%) 200 (15) 86 (11) 0.006
mean age years (sd) 27.8 (5) 28.4 (5) 0.021
have children, n(%) 403 (31) 207 (26) 0.036
Table 10: Distribution and main characteristics of respondents by involvement in patients’ organisation
21
3.4 Combined findings of the PARE youth research project In this paragraph we present the combined outcomes of the interviews and the survey, and illustrate the results by the quotes that were derived from the interviews and focus groups. After analysing and interpreting the results at their face-to-face meeting, the youth Task Force clustered the results into the following six main categories:
1 Me, myself and I 2 Health care 3 Education 4 Work 5 Social life 6 Family life and intimacy
To have a better understanding of our target group needs, obstacles, preferences and priorities, we compared the data from different age groups (younger than 25, 25-30 and older than 30 years), gender, living conditions, children etc. Our survey was translated into 18 languages, but we had responses from 41 countries. We made a country groups and compared the data between regions. In every theme we will focus first on the outcomes from the qualitative research that we wanted to validate. The statistical analysis shows the differences between regions or specific categories of the young people and gives an insightful overview of the everyday life of the young people with a RMD.
3.4.1 Me, myself and I Main outcomes from the interviews:
Fear not to be accepted as a full member of society, to be taken serious.
Preference not to talk about the disease and related consequences.
”The good girl complex” - Underreporting of pain and barriers, as a result of not wanting ”to cause trouble”
I am a leader of my life and feel good
Do not know how and to whom I can talk about my condition
Support groups are a great source of information
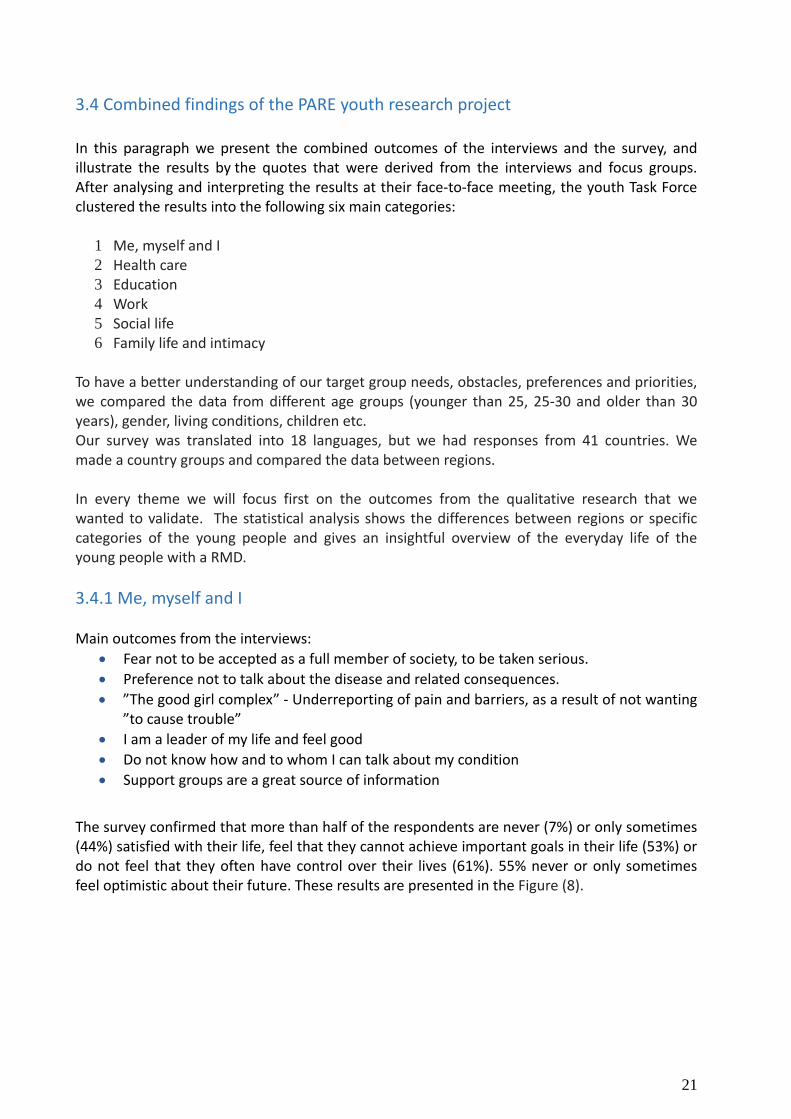
The survey confirmed that more than half of the respondents are never (7%) or only sometimes (44%) satisfied with their life, feel that they cannot achieve important goals in their life (53%) or do not feel that they often have control over their lives (61%). 55% never or only sometimes feel optimistic about their future. These results are presented in the Figure (8).
22
Figure 8: Percentages of respondents by the answers to the questions “I feel satisfied with my life”, “I feel that I can achieve important goals in my life”, “I feel that I have control over my own life”, and “I feel
optimistic about my future”.
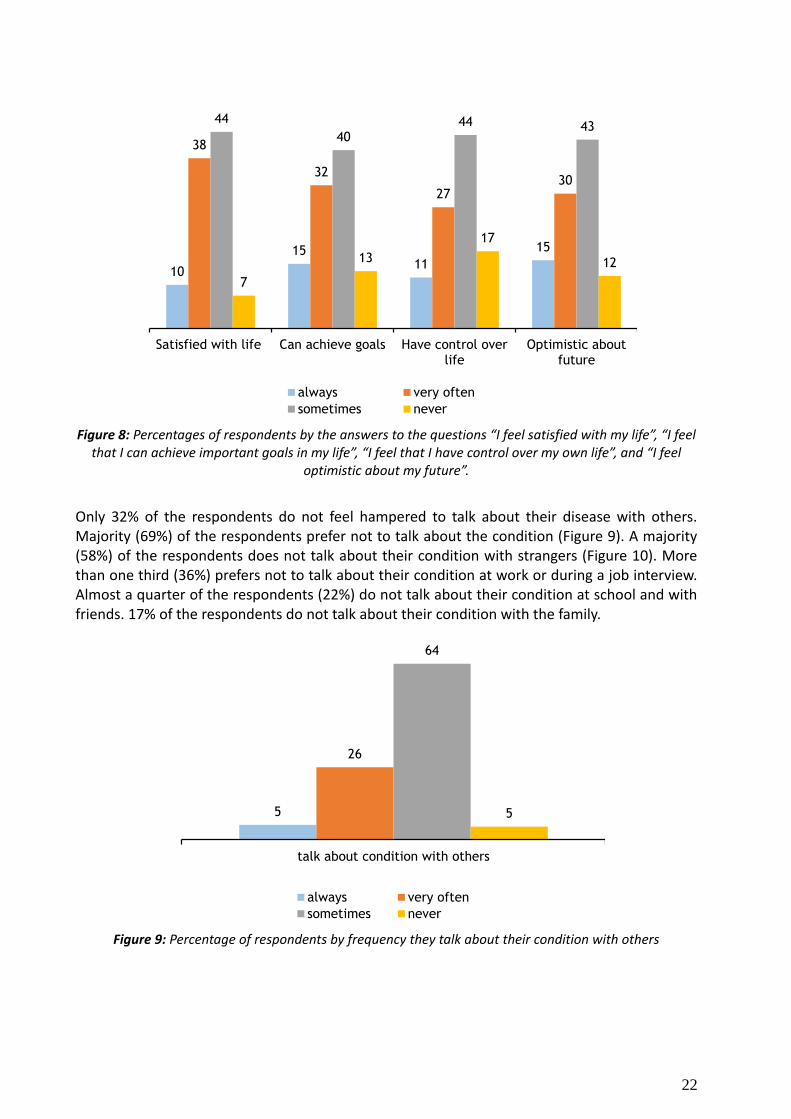
Only 32% of the respondents do not feel hampered to talk about their disease with others. Majority (69%) of the respondents prefer not to talk about the condition (Figure 9). A majority (58%) of the respondents does not talk about their condition with strangers (Figure 10). More than one third (36%) prefers not to talk about their condition at work or during a job interview. Almost a quarter of the respondents (22%) do not talk about their condition at school and with friends. 17% of the respondents do not talk about their condition with the family.
Figure 9: Percentage of respondents by frequency they talk about their condition with others
10
15 11
15
38
32
27 30
44
40 44 43
7
13
17
12
Satisfied with life Can achieve goals Have control overlife
Optimistic aboutfuture
always very often
sometimes never
5
26
64
5
talk about condition with others
always very often
sometimes never
23
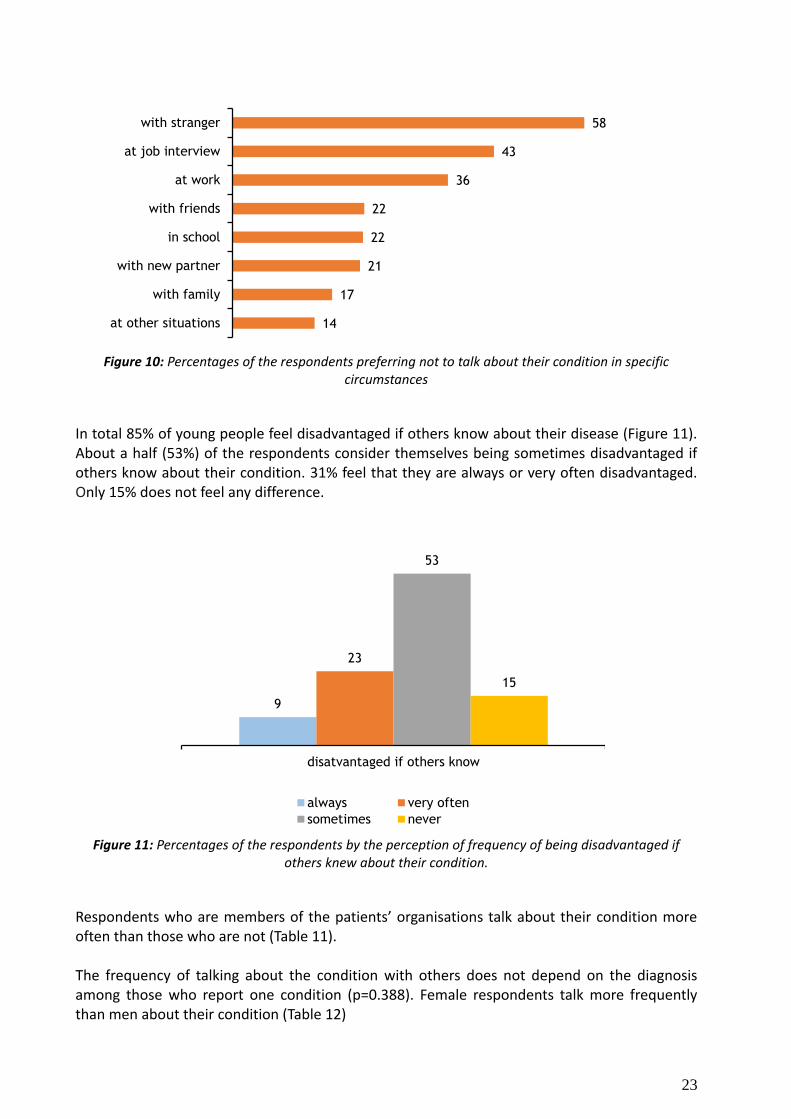
Figure 10: Percentages of the respondents preferring not to talk about their condition in specific circumstances
In total 85% of young people feel disadvantaged if others know about their disease (Figure 11). About a half (53%) of the respondents consider themselves being sometimes disadvantaged if others know about their condition. 31% feel that they are always or very often disadvantaged. Only 15% does not feel any difference.
Figure 11: Percentages of the respondents by the perception of frequency of being disadvantaged if others knew about their condition.
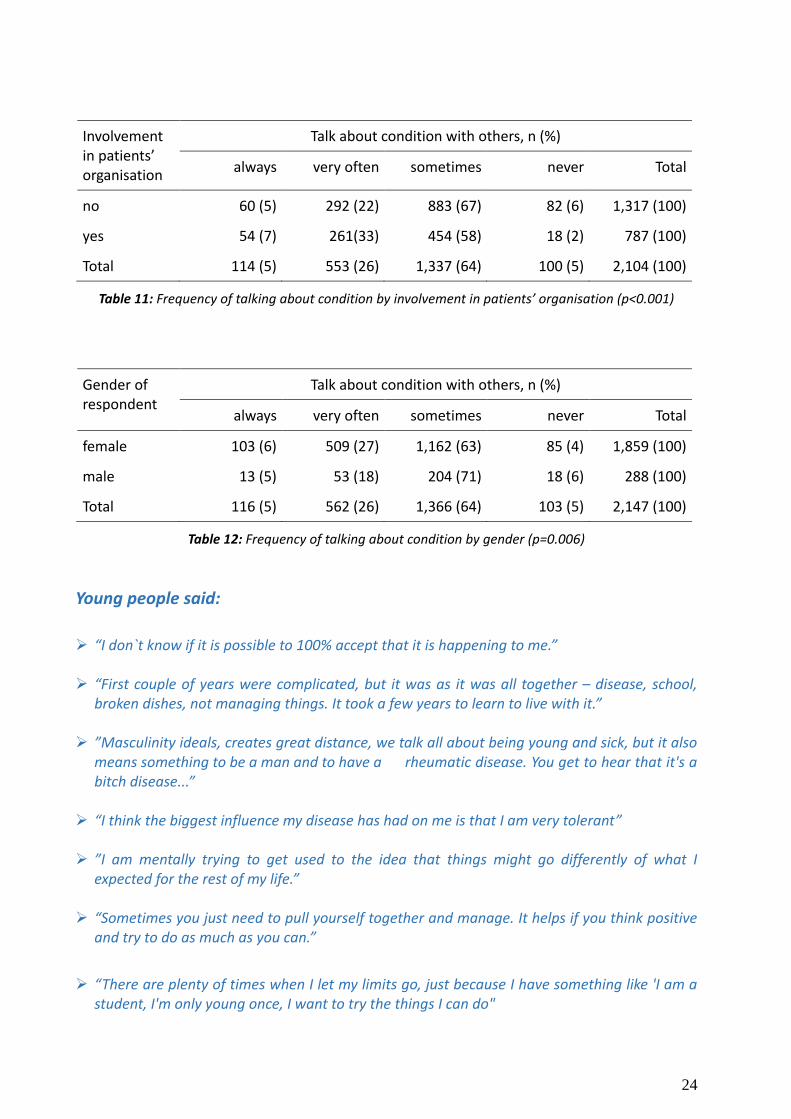
Respondents who are members of the patients’ organisations talk about their condition more often than those who are not (Table 11). The frequency of talking about the condition with others does not depend on the diagnosis among those who report one condition (p=0.388). Female respondents talk more frequently than men about their condition (Table 12)
58
43
36
22
22
21
17
14
with stranger
at job interview
at work
with friends
in school
with new partner
with family
at other situations
9
23
53
15
disatvantaged if others know
always very often
sometimes never
24
Involvement in patients’ organisation
Talk about condition with others, n (%)
always very often sometimes never Total
no 60 (5) 292 (22) 883 (67) 82 (6) 1,317 (100)
yes 54 (7) 261(33) 454 (58) 18 (2) 787 (100)
Total 114 (5) 553 (26) 1,337 (64) 100 (5) 2,104 (100)
Table 11: Frequency of talking about condition by involvement in patients’ organisation (p<0.001)
Gender of respondent
Talk about condition with others, n (%)
always very often sometimes never Total
female 103 (6) 509 (27) 1,162 (63) 85 (4) 1,859 (100)
male 13 (5) 53 (18) 204 (71) 18 (6) 288 (100)
Total 116 (5) 562 (26) 1,366 (64) 103 (5) 2,147 (100)
Table 12: Frequency of talking about condition by gender (p=0.006)
Young people said:
“I don`t know if it is possible to 100% accept that it is happening to me.” “First couple of years were complicated, but it was as it was all together – disease, school,
broken dishes, not managing things. It took a few years to learn to live with it.” ”Masculinity ideals, creates great distance, we talk all about being young and sick, but it also
means something to be a man and to have a rheumatic disease. You get to hear that it's a bitch disease...”
“I think the biggest influence my disease has had on me is that I am very tolerant” ”I am mentally trying to get used to the idea that things might go differently of what I
expected for the rest of my life.” “Sometimes you just need to pull yourself together and manage. It helps if you think positive
and try to do as much as you can.”
“There are plenty of times when I let my limits go, just because I have something like 'I am a student, I'm only young once, I want to try the things I can do"
25
“There have been times where I had to give up a lot, but when its better I do everything. I
don’t feel that there are many things undone.”
“Rather the problem is that there is feeling that I cannot leave anything undone now. Cause
there is the feeling that maybe soon the disease is bad again and then I cannot do anything.”
“This has given courage to me to face my disease. At the beginning I was afraid to talk about
it and it is easier to people in the same situation. They understand. When I talk to other
people, they only react how horrible it is. It is very different who you talk about it. In the
association I understand them and they understand me.”
“There could also be events for children, where they are explained in a simple way. Maybe
there could be materials about how to tell children. It’s a complicated thing.”
“I need to learn to talk about rheumatism when it does something to me. It is difficult, but I may find a way”"
”The feeling of doubt that you get from other people – teachers, friends, doctors, is a big
barrier that can make you cautious and closed.”
”Rheumatism is a hidden disability, that you don’t look sick, and what are you talking about or how will I know that you are feeling good or bad. There is a lot of this kind of attitude.”
”I tell to people now what I have. But I choose. I think not knowing creates rumours,
attitudes, thoughts etc.”
3.4.2 Health care Outcomes from the interviews:
• Finding the right diagnosis, treatment and medication are outstanding factors for one´s health and quality of life.
• Lack of access to rheumatologists causing difficulties in getting specialist care. • Inequalities of health care, for instance differences in access to specialist and
physiotherapeutic options and activities between (larger) cities and countryside. • More information about the disease, medication and communication between health
professionals. • Patient groups are a great source of medical information and support. • Belonging to the patient group gives me better access to rheumatologists and
information.
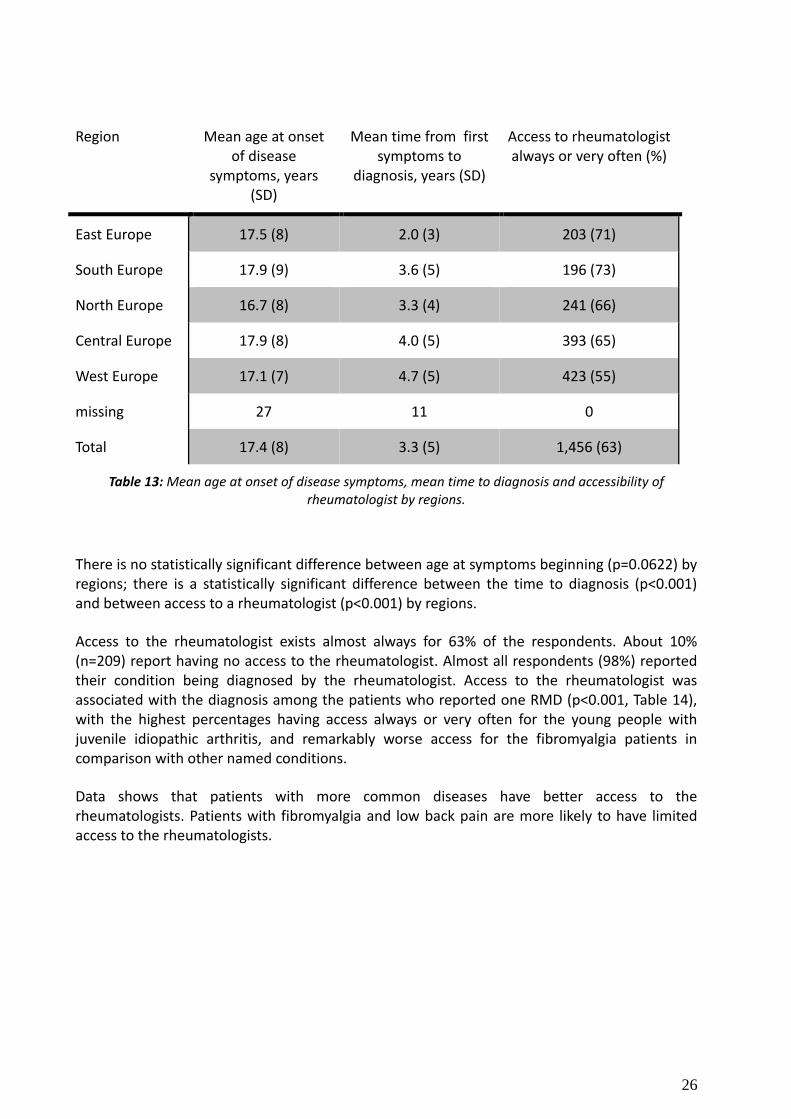
Table 13 compares the mean age at symptoms beginning, mean time from symptoms to diagnosis and accessibility of rheumatologist by regions. The difference between mean age at symptom onset is not significant between regions, whereas the mean time between first symptoms and diagnosis and access to rheumatologist differs significantly; the longest time from symptoms to diagnosis and lowest percentage of respondents with good (always or very often) access to rheumatologist characterise West Europe.
26
Region Mean age at onset of disease
symptoms, years (SD)
Mean time from first symptoms to
diagnosis, years (SD)
Access to rheumatologist always or very often (%)
East Europe 17.5 (8) 2.0 (3) 203 (71)
South Europe 17.9 (9) 3.6 (5) 196 (73)
North Europe 16.7 (8) 3.3 (4) 241 (66)
Central Europe 17.9 (8) 4.0 (5) 393 (65)
West Europe 17.1 (7) 4.7 (5) 423 (55)
missing 27 11 0
Total 17.4 (8) 3.3 (5) 1,456 (63)
Table 13: Mean age at onset of disease symptoms, mean time to diagnosis and accessibility of rheumatologist by regions.
There is no statistically significant difference between age at symptoms beginning (p=0.0622) by regions; there is a statistically significant difference between the time to diagnosis (p<0.001) and between access to a rheumatologist (p<0.001) by regions.
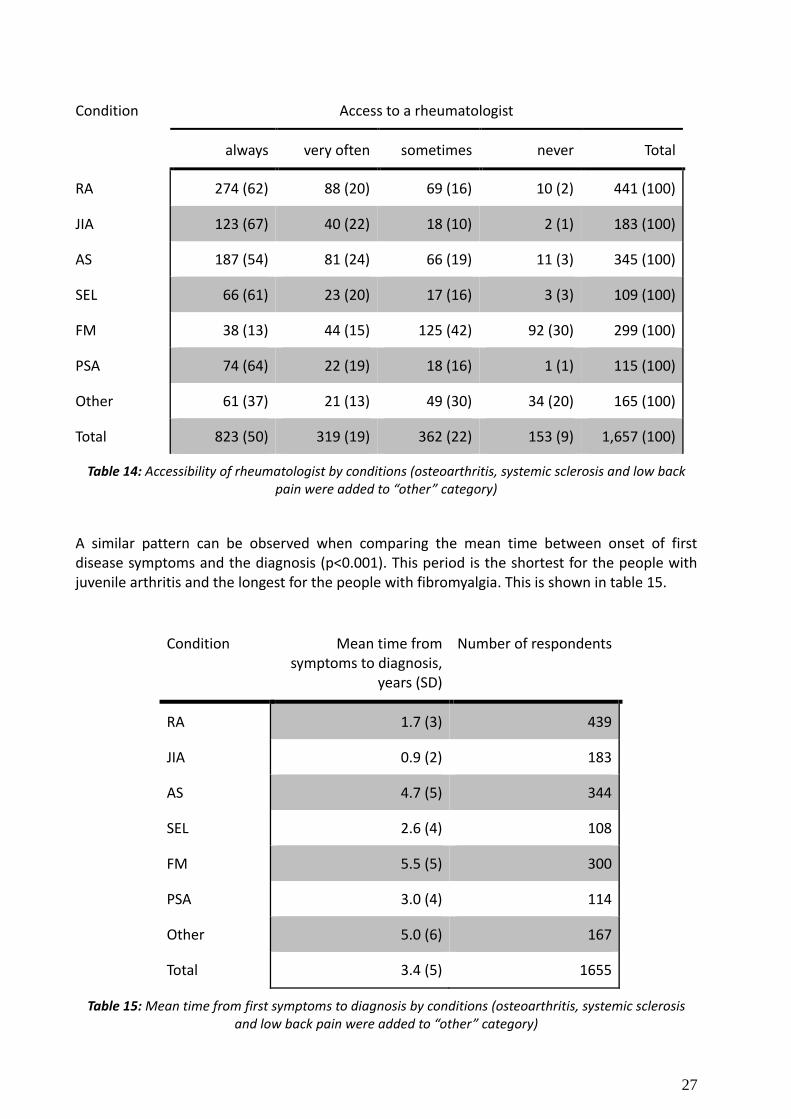
Access to the rheumatologist exists almost always for 63% of the respondents. About 10% (n=209) report having no access to the rheumatologist. Almost all respondents (98%) reported their condition being diagnosed by the rheumatologist. Access to the rheumatologist was associated with the diagnosis among the patients who reported one RMD (p<0.001, Table 14), with the highest percentages having access always or very often for the young people with juvenile idiopathic arthritis, and remarkably worse access for the fibromyalgia patients in comparison with other named conditions.
Data shows that patients with more common diseases have better access to the rheumatologists. Patients with fibromyalgia and low back pain are more likely to have limited access to the rheumatologists.
27
Condition Access to a rheumatologist
always very often sometimes never Total
RA 274 (62) 88 (20) 69 (16) 10 (2) 441 (100)
JIA 123 (67) 40 (22) 18 (10) 2 (1) 183 (100)
AS 187 (54) 81 (24) 66 (19) 11 (3) 345 (100)
SEL 66 (61) 23 (20) 17 (16) 3 (3) 109 (100)
FM 38 (13) 44 (15) 125 (42) 92 (30) 299 (100)
PSA 74 (64) 22 (19) 18 (16) 1 (1) 115 (100)
Other 61 (37) 21 (13) 49 (30) 34 (20) 165 (100)
Total 823 (50) 319 (19) 362 (22) 153 (9) 1,657 (100)
Table 14: Accessibility of rheumatologist by conditions (osteoarthritis, systemic sclerosis and low back pain were added to “other” category)
A similar pattern can be observed when comparing the mean time between onset of first disease symptoms and the diagnosis (p<0.001). This period is the shortest for the people with juvenile arthritis and the longest for the people with fibromyalgia. This is shown in table 15.
Condition Mean time from symptoms to diagnosis,
years (SD)
Number of respondents
RA 1.7 (3) 439
JIA 0.9 (2) 183
AS 4.7 (5) 344
SEL 2.6 (4) 108
FM 5.5 (5) 300
PSA 3.0 (4) 114
Other 5.0 (6) 167
Total 3.4 (5) 1655
Table 15: Mean time from first symptoms to diagnosis by conditions (osteoarthritis, systemic sclerosis and low back pain were added to “other” category)
28
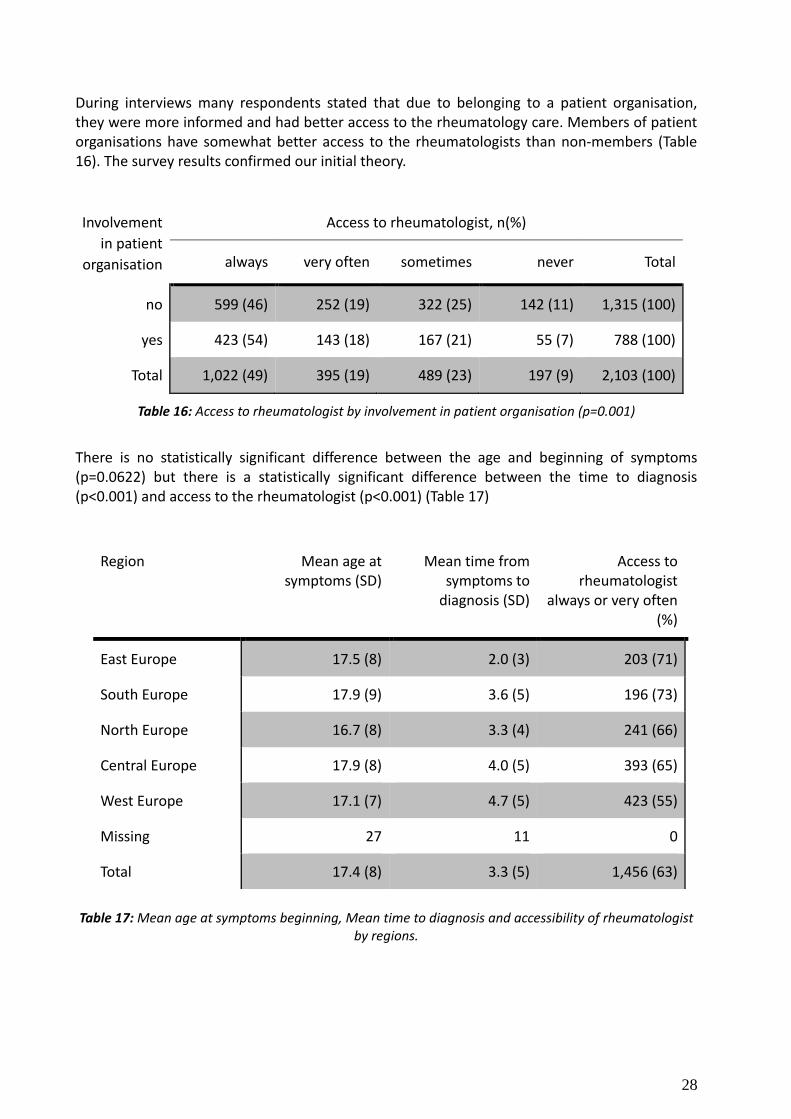
During interviews many respondents stated that due to belonging to a patient organisation, they were more informed and had better access to the rheumatology care. Members of patient organisations have somewhat better access to the rheumatologists than non-members (Table 16). The survey results confirmed our initial theory.
Involvement
in patient
organisation
Access to rheumatologist, n(%)
always very often sometimes never Total
no 599 (46) 252 (19) 322 (25) 142 (11) 1,315 (100)
yes 423 (54) 143 (18) 167 (21) 55 (7) 788 (100)
Total 1,022 (49) 395 (19) 489 (23) 197 (9) 2,103 (100)
Table 16: Access to rheumatologist by involvement in patient organisation (p=0.001)
There is no statistically significant difference between the age and beginning of symptoms (p=0.0622) but there is a statistically significant difference between the time to diagnosis (p<0.001) and access to the rheumatologist (p<0.001) (Table 17)
Region Mean age at symptoms (SD)
Mean time from symptoms to
diagnosis (SD)
Access to rheumatologist
always or very often (%)
East Europe 17.5 (8) 2.0 (3) 203 (71)
South Europe 17.9 (9) 3.6 (5) 196 (73)
North Europe 16.7 (8) 3.3 (4) 241 (66)
Central Europe 17.9 (8) 4.0 (5) 393 (65)
West Europe 17.1 (7) 4.7 (5) 423 (55)
Missing 27 11 0
Total 17.4 (8) 3.3 (5) 1,456 (63)
Table 17: Mean age at symptoms beginning, Mean time to diagnosis and accessibility of rheumatologist
by regions.
29
Young people said:
„I have had three mothers – my mother, my rheumatologist, my psychologist.“
“When I got lupus diagnosis, it was a relief, as it was a solution. I was even happy. It gave
finally some explanation to things.”
Money is a problem. One thing is to exercise alone at home, but other thing is in a group with a trainer. It would be good if there was support for doing sports.”
„I have gone through depression, anti-depressants, psychologist etc. This goes with the diagnosis, but maybe it does not. I don’t know.”
”I remember the first time I was diagnosed with RA, I was given a book “ABC of Rheumatic disease” to read. I thought that my life is over, but then it started slowly getting better again. I read what I cannot do or might become, what can happen to my body.... how much you have to bear. It was very depressing, very very depressing.”
“In itself, the care from the hospital is good, but mainly focused on drugs. They take study or social life not really into account."
“I could not get out of bed or could only crawl. Then I went to my family doctor, who sent me to a county hospital rheumatologist. She asked me what I take, I said baby pills, the doctor said to stop and come back in 2 months. But I said that I am in pain and I can`t handle it anymore. I waited another month and it got worse and my mouth took me again to the family doctor and said that I wanted to go into town to see a doctor. When I got there, I was put immediately to hospital and they did tests and already suspected lupus. In hospital when I got medication, then immediately the next days my fingers were moving and it was getting better. “
“I got pregnant, but the doctor did not tell me that with my medication it is not allowed and I did not know to ask. I lost this chance.”
3.4.3 Education
Main outcomes of the interviews:
• RMDs influence studies and causes delay • There is not enough understanding and awareness among teachers and professors • Support is very important
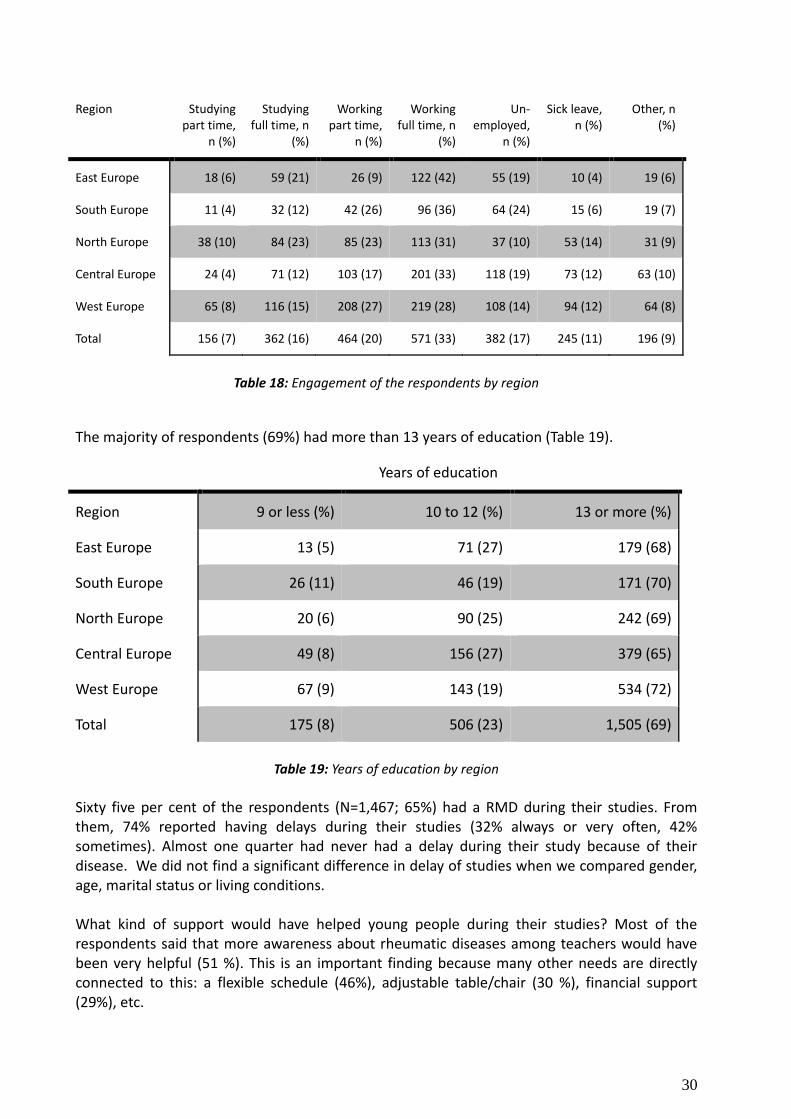
Engagement of the respondents at the time of the survey is presented in Table 18. A majority of the respondents (32,6 %) are working full time, followed by working part time (20,1%). Type of engagement varies in different parts of Europe.
30
Region Studying part time,
n (%)
Studying full time, n
(%)
Working part time,
n (%)
Working full time, n
(%)
Un-employed,
n (%)
Sick leave, n (%)
Other, n (%)
East Europe 18 (6) 59 (21) 26 (9) 122 (42) 55 (19) 10 (4) 19 (6)
South Europe 11 (4) 32 (12) 42 (26) 96 (36) 64 (24) 15 (6) 19 (7)
North Europe 38 (10) 84 (23) 85 (23) 113 (31) 37 (10) 53 (14) 31 (9)
Central Europe 24 (4) 71 (12) 103 (17) 201 (33) 118 (19) 73 (12) 63 (10)
West Europe 65 (8) 116 (15) 208 (27) 219 (28) 108 (14) 94 (12) 64 (8)
Total 156 (7) 362 (16) 464 (20) 571 (33) 382 (17) 245 (11) 196 (9)
Table 18: Engagement of the respondents by region
The majority of respondents (69%) had more than 13 years of education (Table 19).
Years of education
Region 9 or less (%) 10 to 12 (%) 13 or more (%)
East Europe 13 (5) 71 (27) 179 (68)
South Europe 26 (11) 46 (19) 171 (70)
North Europe 20 (6) 90 (25) 242 (69)
Central Europe 49 (8) 156 (27) 379 (65)
West Europe 67 (9) 143 (19) 534 (72)
Total 175 (8) 506 (23) 1,505 (69)
Table 19: Years of education by region
Sixty five per cent of the respondents (N=1,467; 65%) had a RMD during their studies. From them, 74% reported having delays during their studies (32% always or very often, 42% sometimes). Almost one quarter had never had a delay during their study because of their disease. We did not find a significant difference in delay of studies when we compared gender, age, marital status or living conditions. What kind of support would have helped young people during their studies? Most of the respondents said that more awareness about rheumatic diseases among teachers would have been very helpful (51 %). This is an important finding because many other needs are directly connected to this: a flexible schedule (46%), adjustable table/chair (30 %), financial support (29%), etc.
31
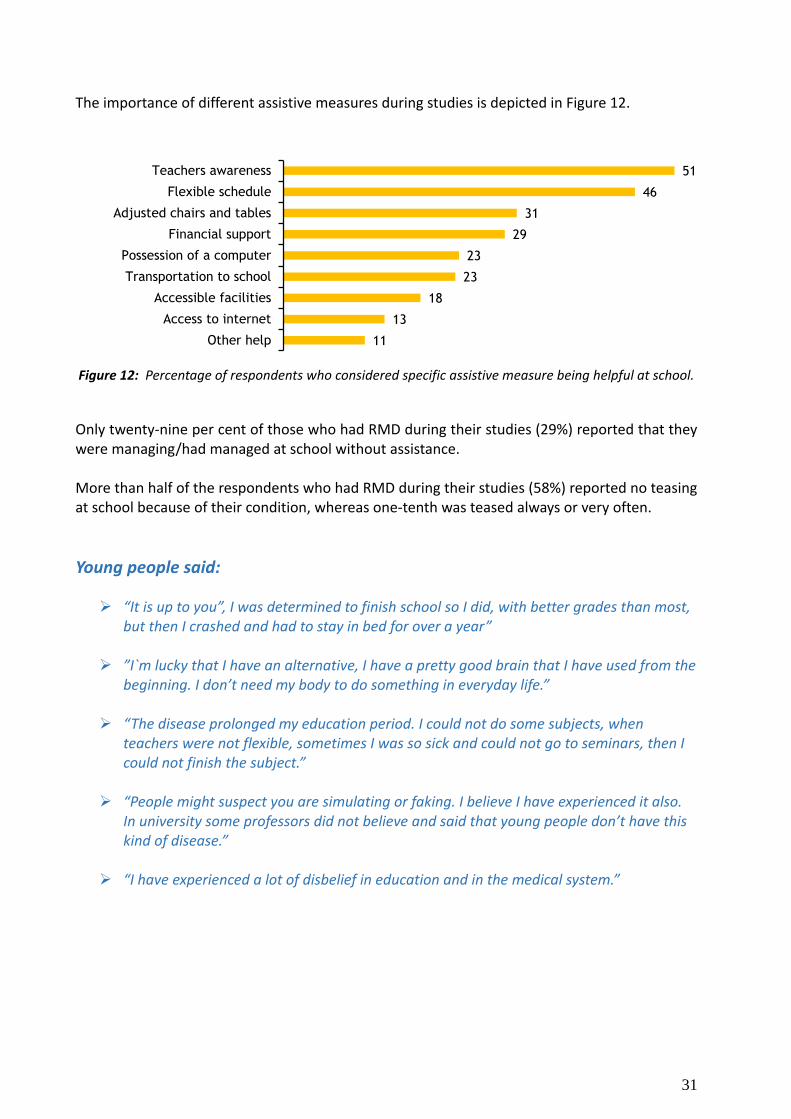
The importance of different assistive measures during studies is depicted in Figure 12.
Figure 12: Percentage of respondents who considered specific assistive measure being helpful at school.
Only twenty-nine per cent of those who had RMD during their studies (29%) reported that they were managing/had managed at school without assistance. More than half of the respondents who had RMD during their studies (58%) reported no teasing at school because of their condition, whereas one-tenth was teased always or very often.
Young people said:
“It is up to you”, I was determined to finish school so I did, with better grades than most, but then I crashed and had to stay in bed for over a year”
”I`m lucky that I have an alternative, I have a pretty good brain that I have used from the beginning. I don’t need my body to do something in everyday life.”
“The disease prolonged my education period. I could not do some subjects, when teachers were not flexible, sometimes I was so sick and could not go to seminars, then I could not finish the subject.”
“People might suspect you are simulating or faking. I believe I have experienced it also. In university some professors did not believe and said that young people don’t have this kind of disease.”
“I have experienced a lot of disbelief in education and in the medical system.”
51
46
31
29
23
23
18
13
11
Teachers awareness
Flexible schedule
Adjusted chairs and tables
Financial support
Possession of a computer
Transportation to school
Accessible facilities
Access to internet
Other help
32
3.4.4 Work Outcome from the interviews:
It is important for young persons with RMDs to be able to work.
Fear that the employer “might immediately think that you are sick and can´t do anything”
Many respondents are afraid to reveal their condition and to lose their job because of that.
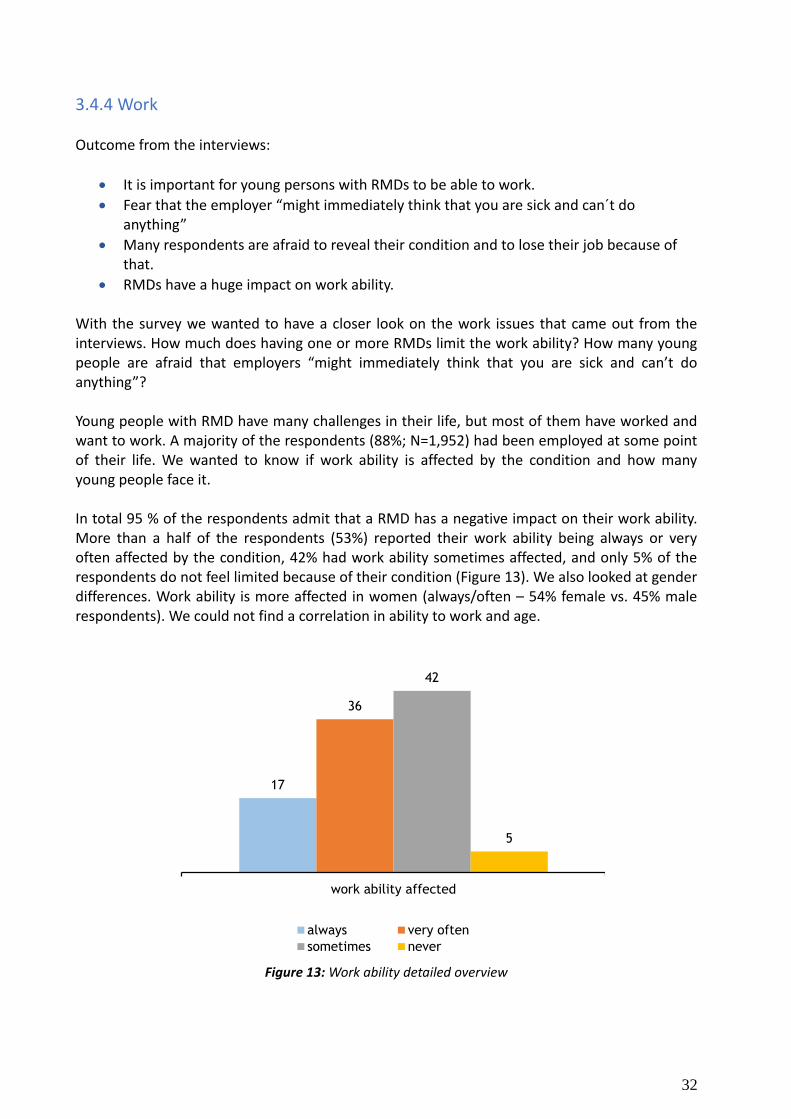
RMDs have a huge impact on work ability. With the survey we wanted to have a closer look on the work issues that came out from the interviews. How much does having one or more RMDs limit the work ability? How many young people are afraid that employers “might immediately think that you are sick and can’t do anything”? Young people with RMD have many challenges in their life, but most of them have worked and want to work. A majority of the respondents (88%; N=1,952) had been employed at some point of their life. We wanted to know if work ability is affected by the condition and how many young people face it. In total 95 % of the respondents admit that a RMD has a negative impact on their work ability. More than a half of the respondents (53%) reported their work ability being always or very often affected by the condition, 42% had work ability sometimes affected, and only 5% of the respondents do not feel limited because of their condition (Figure 13). We also looked at gender differences. Work ability is more affected in women (always/often – 54% female vs. 45% male respondents). We could not find a correlation in ability to work and age.
Figure 13: Work ability detailed overview
17
36
42
5
work ability affected
always very often
sometimes never
33
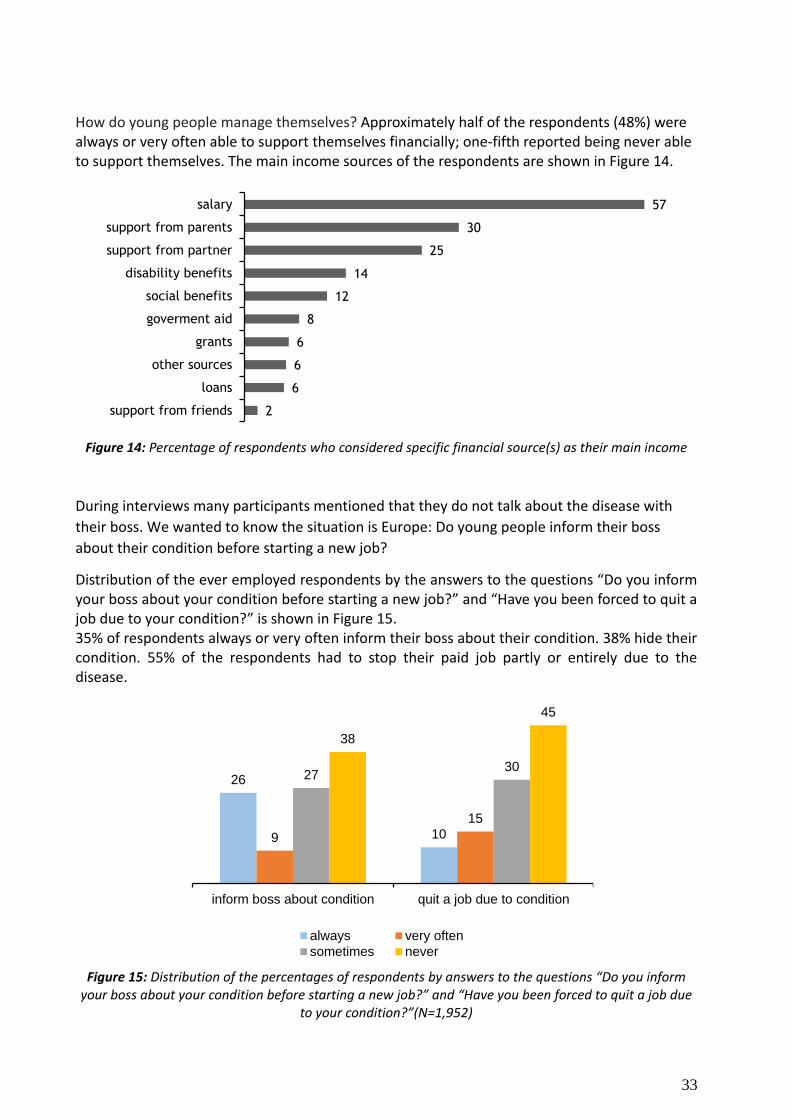
How do young people manage themselves? Approximately half of the respondents (48%) were always or very often able to support themselves financially; one-fifth reported being never able to support themselves. The main income sources of the respondents are shown in Figure 14.
Figure 14: Percentage of respondents who considered specific financial source(s) as their main income
During interviews many participants mentioned that they do not talk about the disease with
their boss. We wanted to know the situation is Europe: Do young people inform their boss
about their condition before starting a new job?
Distribution of the ever employed respondents by the answers to the questions “Do you inform your boss about your condition before starting a new job?” and “Have you been forced to quit a job due to your condition?” is shown in Figure 15. 35% of respondents always or very often inform their boss about their condition. 38% hide their condition. 55% of the respondents had to stop their paid job partly or entirely due to the disease.
Figure 15: Distribution of the percentages of respondents by answers to the questions “Do you inform your boss about your condition before starting a new job?” and “Have you been forced to quit a job due
to your condition?”(N=1,952)
57
30
25
14
12
8
6
6
6
2
salary
support from parents
support from partner
disability benefits
social benefits
goverment aid
grants
other sources
loans
support from friends
26
10 9
15
27 30
38
45
inform boss about condition quit a job due to condition
always very often
sometimes never
34
We also analyzed whether there is a difference if you have children. 32% of the respondents with children reported that they always or very often had to quit their job, compared to 21% of respondents without children. More optimistic people reported much less barriers in work life, only 37% feel that their work ability is always or very often affected. 65% of less optimistic people face the same situation.
Young people said:
”I have worked alongside my studies. I really love working, I think work is very important.”
”I suffer from fatigue, but working 32 hours is fine for me, I would also like to work 40
hours.
I've never had to take a day off from work due to illness or fatigue. I have to say that I would never do that”.
“Fatigue influences a lot. It is one of lupus symptoms. And it does not help that you
sleep. You are all the time like in a bubble and cannot work at all.”
“I noticed at first that colleagues said things behind my back, for example if I called in
sick. Once during a personal assessment, I was told that there are some functions that I could not fulfil. I thought we were to judge what I could and could not, and not Judge my sick leave.”
“Problematic was the combination of attending school, doing the internship, I had a
second job and my household: that didn’t work out.”
“I changed job a number of times, and because I got more responsibility and more freedom, I always managed to work full time. Until a few years ago. My disease progressed, I didn’t feel well and I also noticed that I was tired to prove to myself and others that I could do a full-time work week of 60 hours. Over the years you start to realize that you might want a lot, but it does not work out as you want.”
“It would be much harder to work in the office. It would not be possible to just lie down
for a couple of hours in the office. Of course it would depend of work place.”
“It is necessary that employer is flexible and you can take a day off if you can’t move or get dressed.”
“I have luckily worked always at home. During the whole duration of my sickness”
35
3.4.5 Social life Main outcomes from the interviews:
Suffering from crossing physical limits or not crossing these limits.
Not being able to go out with the friends
Finding alternatives and ”real” friends
Emotionally very hard to cope
Revise dreams and visions
Fatigue and pain are the main obstacles that limit daily life
Patient support (groups) groups are very important
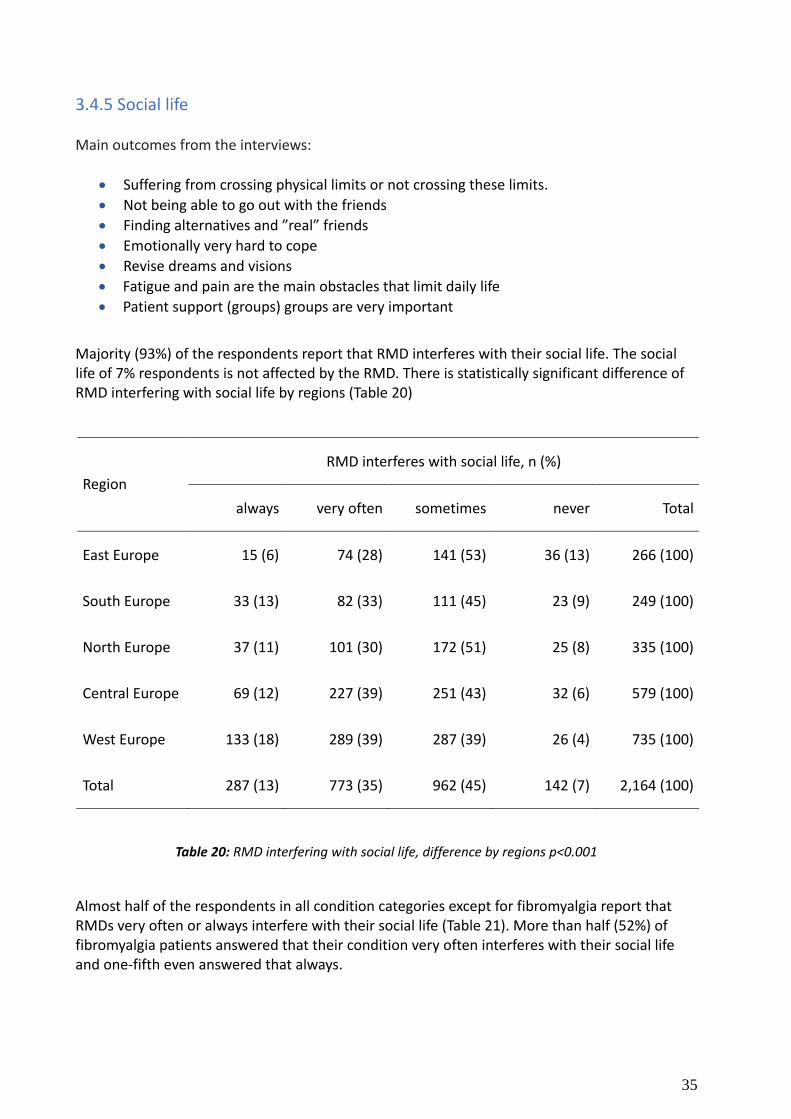
Majority (93%) of the respondents report that RMD interferes with their social life. The social life of 7% respondents is not affected by the RMD. There is statistically significant difference of RMD interfering with social life by regions (Table 20)
Region
RMD interferes with social life, n (%)
always very often sometimes never Total
East Europe 15 (6) 74 (28) 141 (53) 36 (13) 266 (100)
South Europe 33 (13) 82 (33) 111 (45) 23 (9) 249 (100)
North Europe 37 (11) 101 (30) 172 (51) 25 (8) 335 (100)
Central Europe 69 (12) 227 (39) 251 (43) 32 (6) 579 (100)
West Europe 133 (18) 289 (39) 287 (39) 26 (4) 735 (100)
Total 287 (13) 773 (35) 962 (45) 142 (7) 2,164 (100)
Table 20: RMD interfering with social life, difference by regions p<0.001
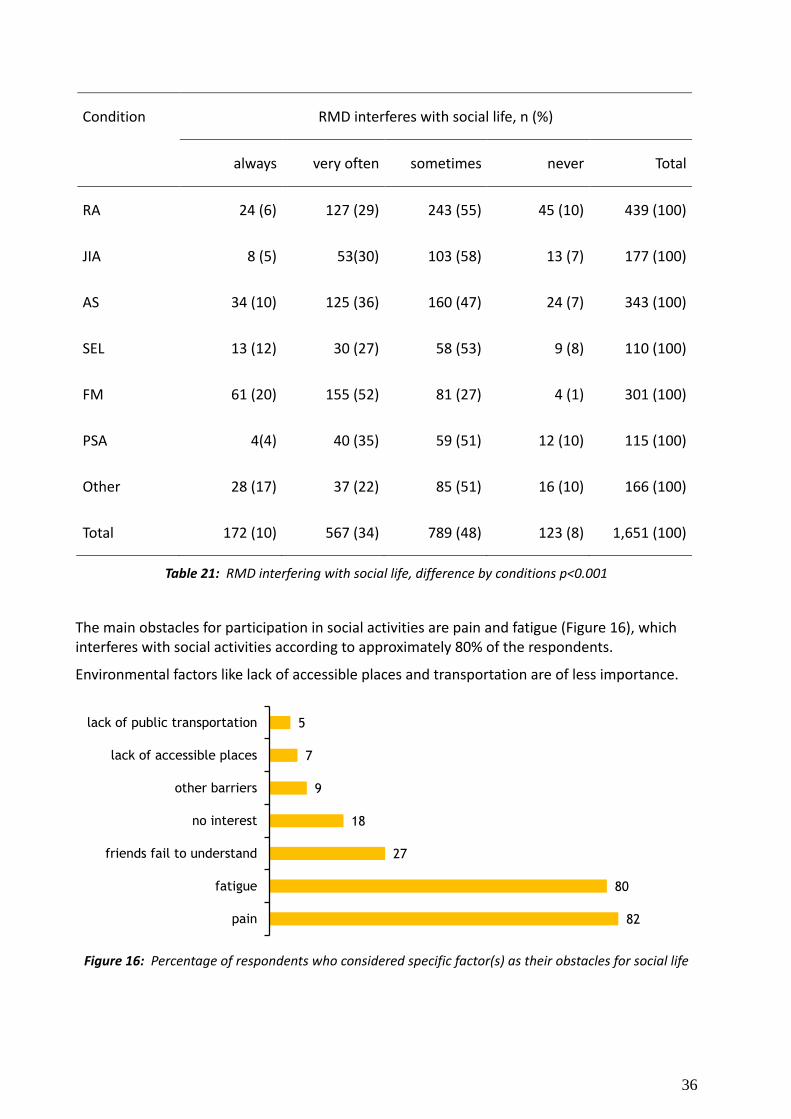
Almost half of the respondents in all condition categories except for fibromyalgia report that RMDs very often or always interfere with their social life (Table 21). More than half (52%) of fibromyalgia patients answered that their condition very often interferes with their social life and one-fifth even answered that always.
36
Condition RMD interferes with social life, n (%)
always very often sometimes never Total
RA 24 (6) 127 (29) 243 (55) 45 (10) 439 (100)
JIA 8 (5) 53(30) 103 (58) 13 (7) 177 (100)
AS 34 (10) 125 (36) 160 (47) 24 (7) 343 (100)
SEL 13 (12) 30 (27) 58 (53) 9 (8) 110 (100)
FM 61 (20) 155 (52) 81 (27) 4 (1) 301 (100)
PSA 4(4) 40 (35) 59 (51) 12 (10) 115 (100)
Other 28 (17) 37 (22) 85 (51) 16 (10) 166 (100)
Total 172 (10) 567 (34) 789 (48) 123 (8) 1,651 (100)
Table 21: RMD interfering with social life, difference by conditions p<0.001
The main obstacles for participation in social activities are pain and fatigue (Figure 16), which interferes with social activities according to approximately 80% of the respondents.
Environmental factors like lack of accessible places and transportation are of less importance.
Figure 16: Percentage of respondents who considered specific factor(s) as their obstacles for social life
5
7
9
18
27
80
82
lack of public transportation
lack of accessible places
other barriers
no interest
friends fail to understand
fatigue
pain
37
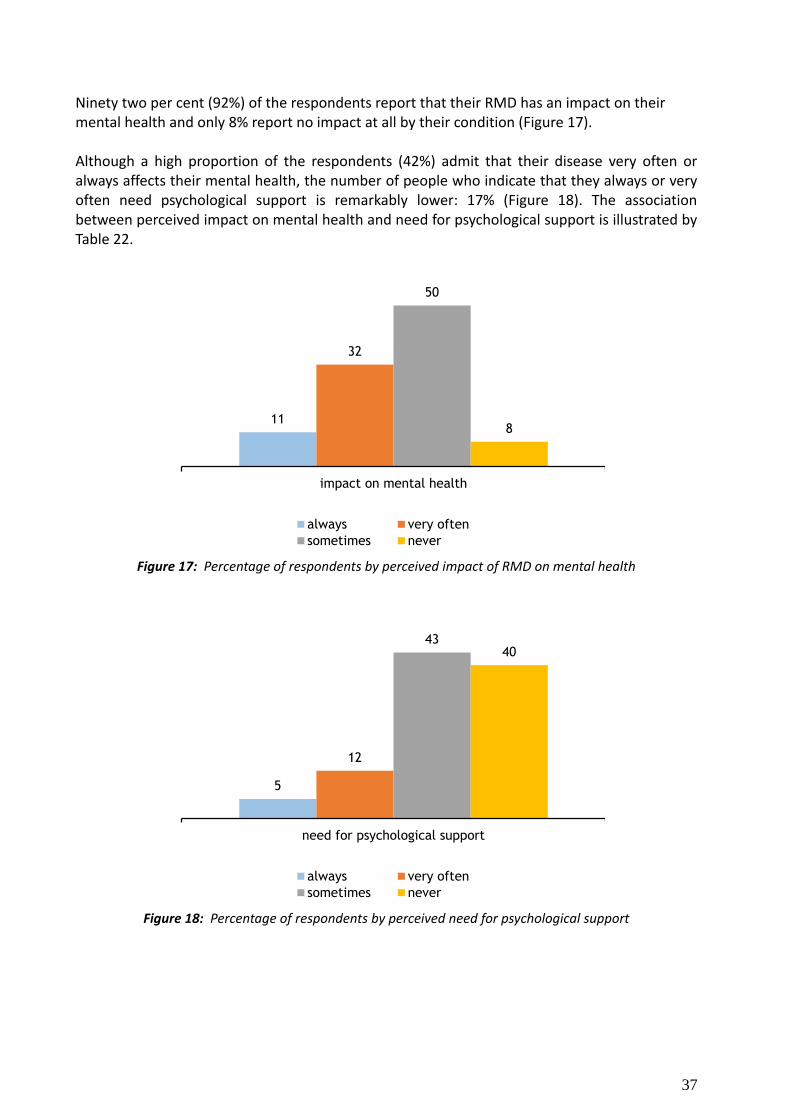
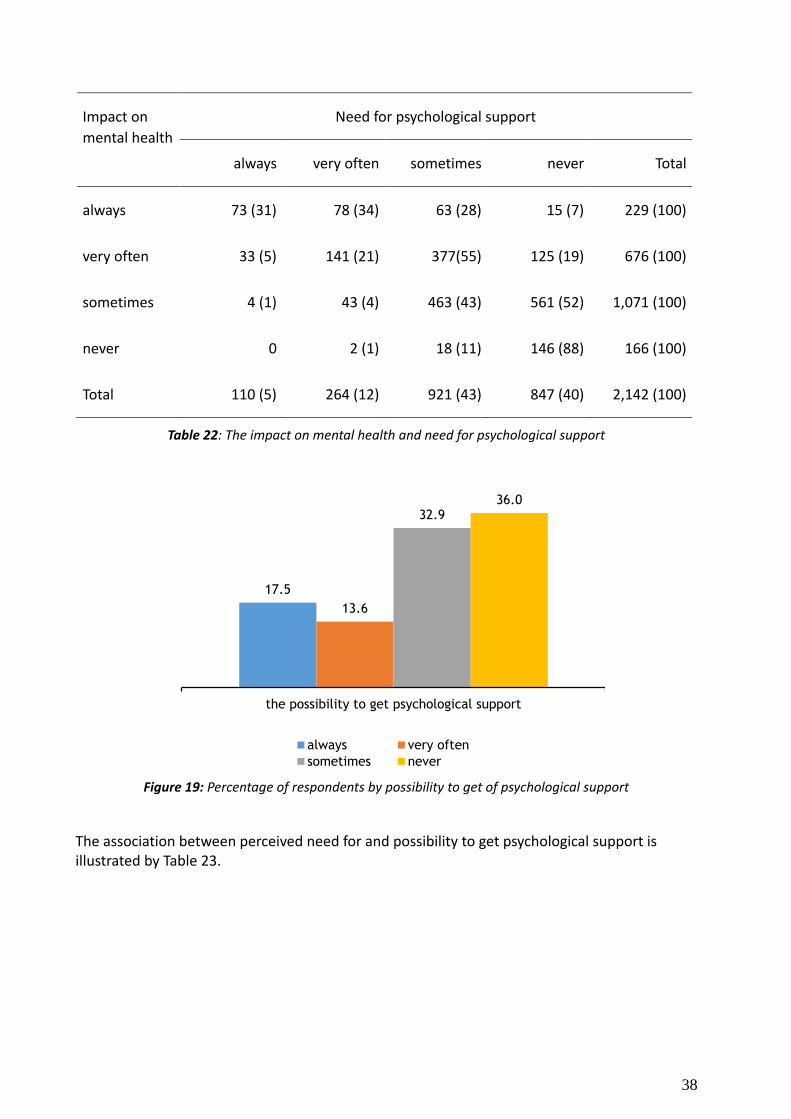
Ninety two per cent (92%) of the respondents report that their RMD has an impact on their mental health and only 8% report no impact at all by their condition (Figure 17). Although a high proportion of the respondents (42%) admit that their disease very often or always affects their mental health, the number of people who indicate that they always or very often need psychological support is remarkably lower: 17% (Figure 18). The association between perceived impact on mental health and need for psychological support is illustrated by Table 22.
Figure 17: Percentage of respondents by perceived impact of RMD on mental health
Figure 18: Percentage of respondents by perceived need for psychological support
11
32
50
8
impact on mental health
always very often
sometimes never
5
12
43 40
need for psychological support
always very often
sometimes never
38
Impact on
mental health
Need for psychological support
always very often sometimes never Total
always 73 (31) 78 (34) 63 (28) 15 (7) 229 (100)
very often 33 (5) 141 (21) 377(55) 125 (19) 676 (100)
sometimes 4 (1) 43 (4) 463 (43) 561 (52) 1,071 (100)
never 0 2 (1) 18 (11) 146 (88) 166 (100)
Total 110 (5) 264 (12) 921 (43) 847 (40) 2,142 (100)
Table 22: The impact on mental health and need for psychological support
Figure 19: Percentage of respondents by possibility to get of psychological support
The association between perceived need for and possibility to get psychological support is illustrated by Table 23.
17.5
13.6
32.9 36.0
the possibility to get psychological support
always very often
sometimes never
39
Need for
psychological
support
Possibility to get psychological support
always very often sometimes never Total
always 55 (50) 10 (9) 28 (26) 17 (15) 110 (100)
very often 42 (16) 87 (33) 82 (32) 54 (20) 265 (100)
sometimes 112 (12) 124 (15) 395 (43) 274 (30) 905 (100)
never 154 (19) 64 (8) 185 (23) 408 (50) 811 (100)
Total 363 (17) 285 (14) 690 (33) 753 (36) 2,091 (100)
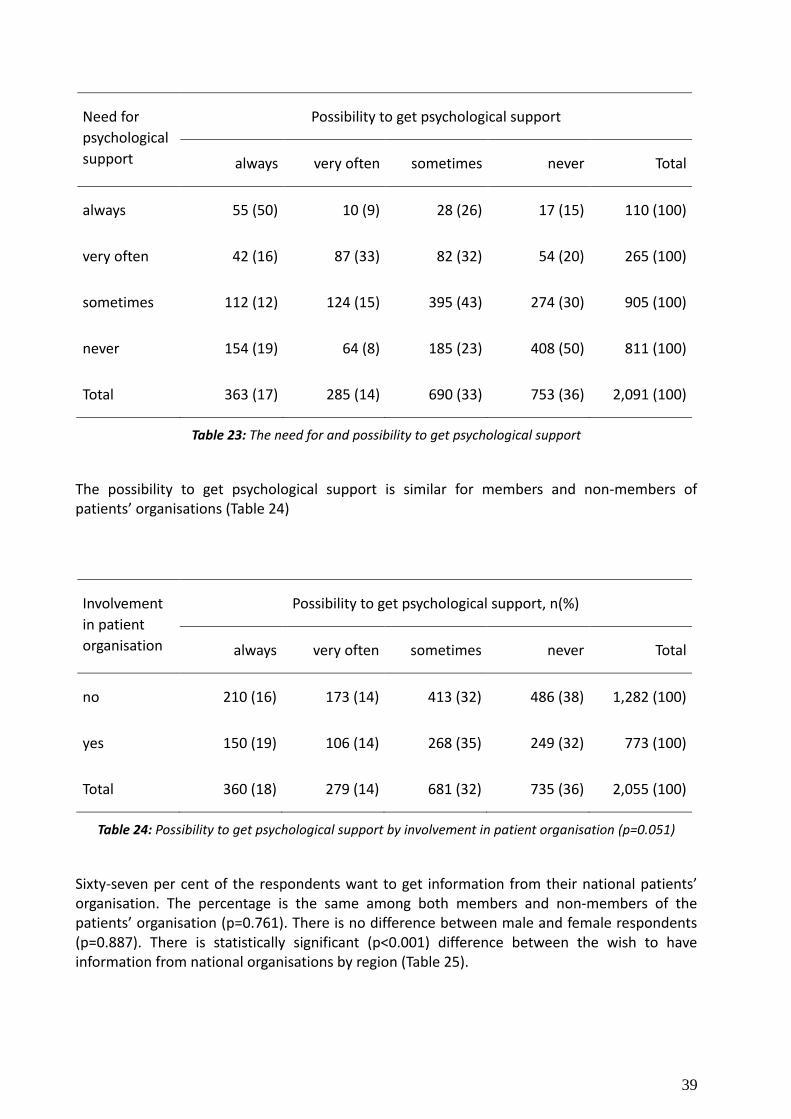
Table 23: The need for and possibility to get psychological support
The possibility to get psychological support is similar for members and non-members of patients’ organisations (Table 24)
Involvement
in patient
organisation
Possibility to get psychological support, n(%)
always very often sometimes never Total
no 210 (16) 173 (14) 413 (32) 486 (38) 1,282 (100)
yes 150 (19) 106 (14) 268 (35) 249 (32) 773 (100)
Total 360 (18) 279 (14) 681 (32) 735 (36) 2,055 (100)
Table 24: Possibility to get psychological support by involvement in patient organisation (p=0.051)
Sixty-seven per cent of the respondents want to get information from their national patients’ organisation. The percentage is the same among both members and non-members of the patients’ organisation (p=0.761). There is no difference between male and female respondents (p=0.887). There is statistically significant (p<0.001) difference between the wish to have information from national organisations by region (Table 25).
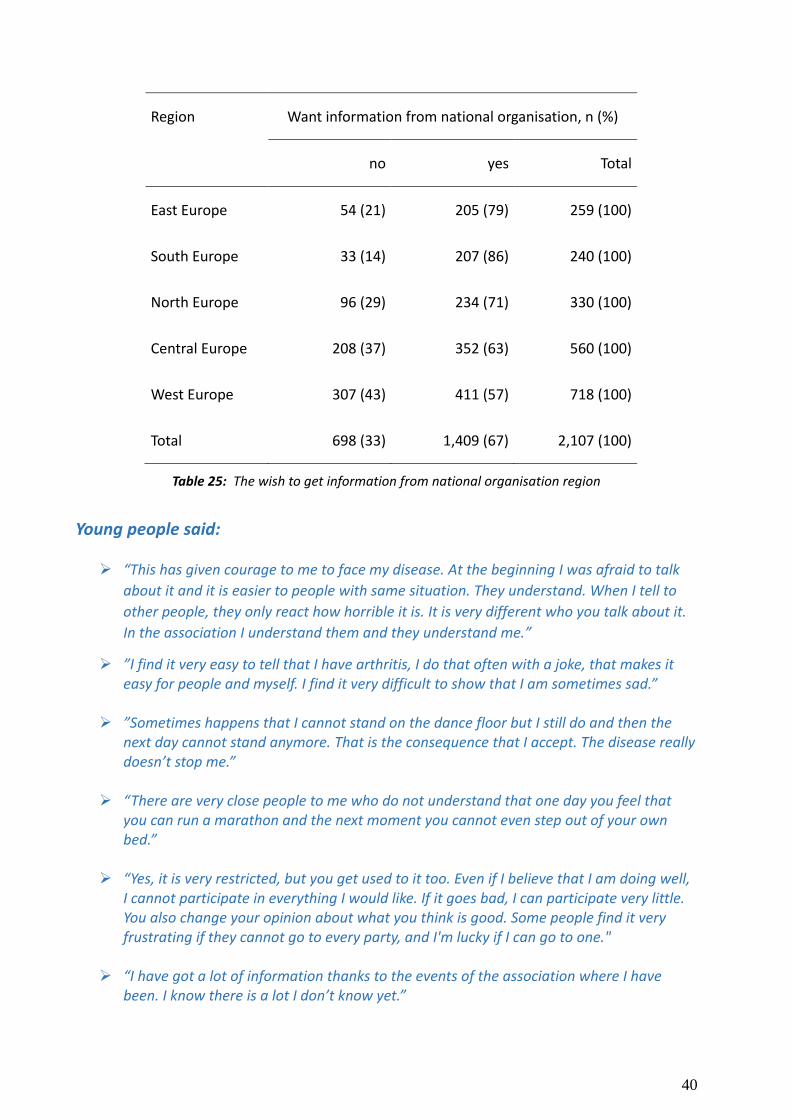
40
Region Want information from national organisation, n (%)
no yes Total
East Europe 54 (21) 205 (79) 259 (100)
South Europe 33 (14) 207 (86) 240 (100)
North Europe 96 (29) 234 (71) 330 (100)
Central Europe 208 (37) 352 (63) 560 (100)
West Europe 307 (43) 411 (57) 718 (100)
Total 698 (33) 1,409 (67) 2,107 (100)
Table 25: The wish to get information from national organisation region
Young people said:
“This has given courage to me to face my disease. At the beginning I was afraid to talk
about it and it is easier to people with same situation. They understand. When I tell to
other people, they only react how horrible it is. It is very different who you talk about it.
In the association I understand them and they understand me.”
”I find it very easy to tell that I have arthritis, I do that often with a joke, that makes it easy for people and myself. I find it very difficult to show that I am sometimes sad.”
”Sometimes happens that I cannot stand on the dance floor but I still do and then the
next day cannot stand anymore. That is the consequence that I accept. The disease really doesn’t stop me.”
“There are very close people to me who do not understand that one day you feel that you can run a marathon and the next moment you cannot even step out of your own bed.”
“Yes, it is very restricted, but you get used to it too. Even if I believe that I am doing well,
I cannot participate in everything I would like. If it goes bad, I can participate very little. You also change your opinion about what you think is good. Some people find it very frustrating if they cannot go to every party, and I'm lucky if I can go to one."
“I have got a lot of information thanks to the events of the association where I have been. I know there is a lot I don’t know yet.”
41
“The emotional support that I get in the association is very important.”
"My disease keeps me busy every day, absolutely."
“Emotional support has been very important – I have got it from mother, husband and friends”
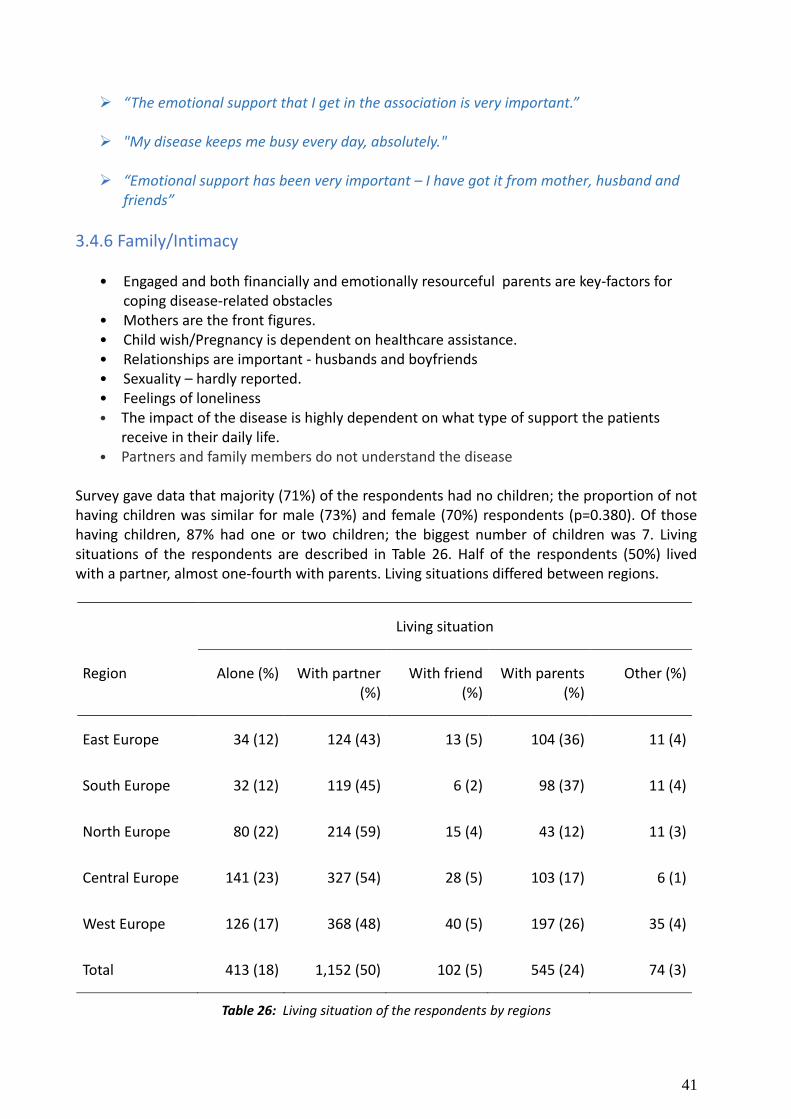
3.4.6 Family/Intimacy
• Engaged and both financially and emotionally resourceful parents are key-factors for
coping disease-related obstacles • Mothers are the front figures. • Child wish/Pregnancy is dependent on healthcare assistance. • Relationships are important - husbands and boyfriends • Sexuality – hardly reported. • Feelings of loneliness • The impact of the disease is highly dependent on what type of support the patients
receive in their daily life. • Partners and family members do not understand the disease
Survey gave data that majority (71%) of the respondents had no children; the proportion of not having children was similar for male (73%) and female (70%) respondents (p=0.380). Of those having children, 87% had one or two children; the biggest number of children was 7. Living situations of the respondents are described in Table 26. Half of the respondents (50%) lived with a partner, almost one-fourth with parents. Living situations differed between regions.
Living situation
Region Alone (%) With partner (%)
With friend (%)
With parents (%)
Other (%)
East Europe 34 (12) 124 (43) 13 (5) 104 (36) 11 (4)
South Europe 32 (12) 119 (45) 6 (2) 98 (37) 11 (4)
North Europe 80 (22) 214 (59) 15 (4) 43 (12) 11 (3)
Central Europe 141 (23) 327 (54) 28 (5) 103 (17) 6 (1)
West Europe 126 (17) 368 (48) 40 (5) 197 (26) 35 (4)
Total 413 (18) 1,152 (50) 102 (5) 545 (24) 74 (3)
Table 26: Living situation of the respondents by regions
42
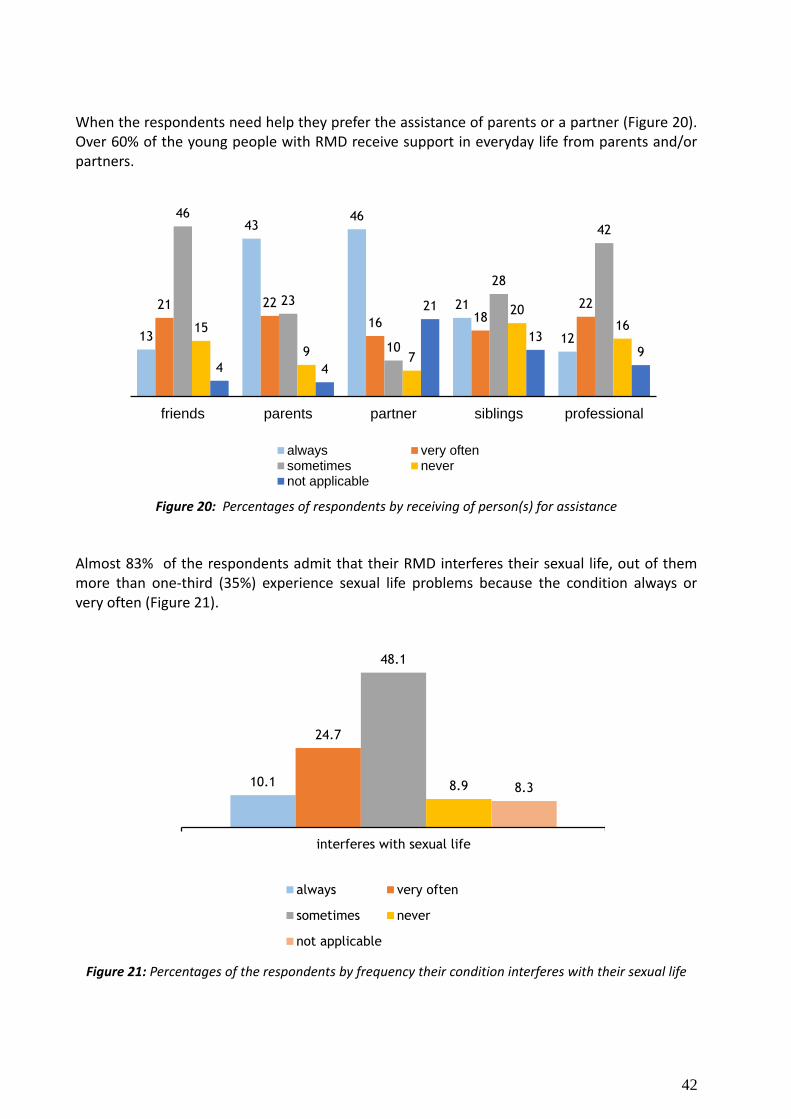
When the respondents need help they prefer the assistance of parents or a partner (Figure 20). Over 60% of the young people with RMD receive support in everyday life from parents and/or partners.
Figure 20: Percentages of respondents by receiving of person(s) for assistance
Almost 83% of the respondents admit that their RMD interferes their sexual life, out of them more than one-third (35%) experience sexual life problems because the condition always or very often (Figure 21).
Figure 21: Percentages of the respondents by frequency their condition interferes with their sexual life
13
43 46
21
12
21 22
16 18 22
46
23
10
28
42
15
9 7
20 16
4 4
21
13 9
friends parents partner siblings professional
always very oftensometimes nevernot applicable
10.1
24.7
48.1
8.9 8.3
interferes with sexual life
always very often
sometimes never
not applicable
43
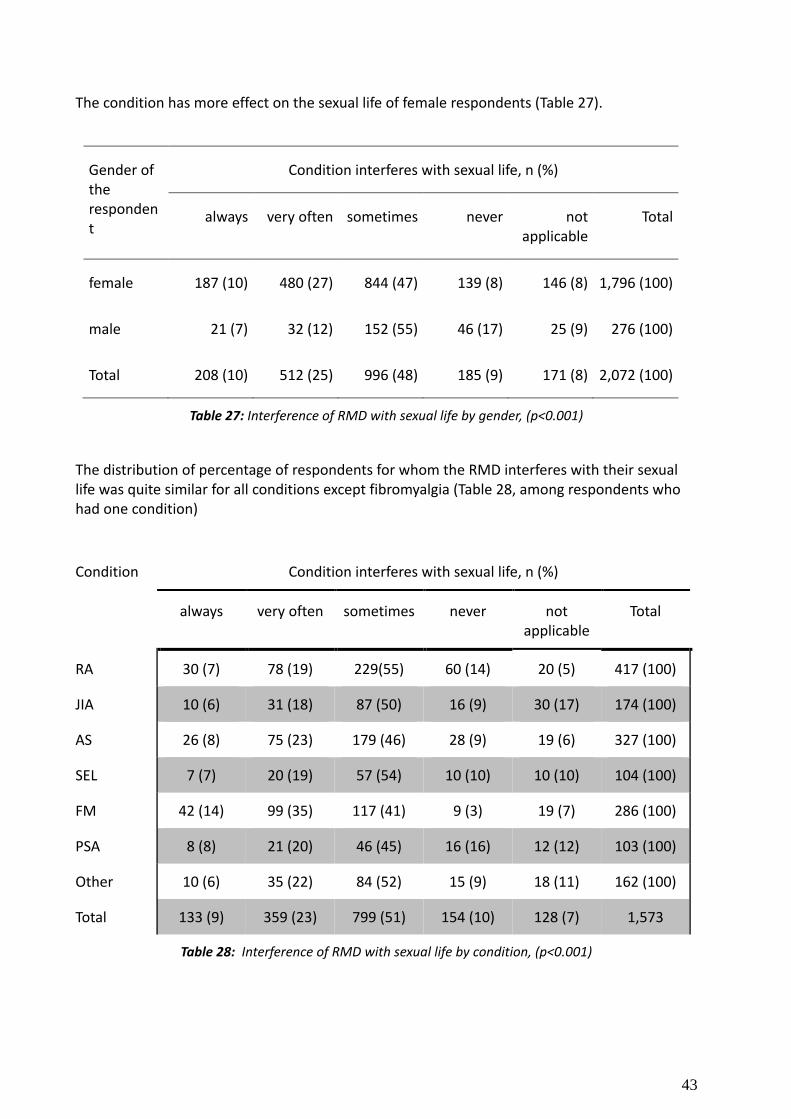
The condition has more effect on the sexual life of female respondents (Table 27).
Gender of the respondent
Condition interferes with sexual life, n (%)
always very often sometimes never not applicable
Total
female 187 (10) 480 (27) 844 (47) 139 (8) 146 (8) 1,796 (100)
male 21 (7) 32 (12) 152 (55) 46 (17) 25 (9) 276 (100)
Total 208 (10) 512 (25) 996 (48) 185 (9) 171 (8) 2,072 (100)
Table 27: Interference of RMD with sexual life by gender, (p<0.001)
The distribution of percentage of respondents for whom the RMD interferes with their sexual life was quite similar for all conditions except fibromyalgia (Table 28, among respondents who had one condition)
Condition Condition interferes with sexual life, n (%)
always very often sometimes never not applicable
Total
RA 30 (7) 78 (19) 229(55) 60 (14) 20 (5) 417 (100)
JIA 10 (6) 31 (18) 87 (50) 16 (9) 30 (17) 174 (100)
AS 26 (8) 75 (23) 179 (46) 28 (9) 19 (6) 327 (100)
SEL 7 (7) 20 (19) 57 (54) 10 (10) 10 (10) 104 (100)
FM 42 (14) 99 (35) 117 (41) 9 (3) 19 (7) 286 (100)
PSA 8 (8) 21 (20) 46 (45) 16 (16) 12 (12) 103 (100)
Other 10 (6) 35 (22) 84 (52) 15 (9) 18 (11) 162 (100)
Total 133 (9) 359 (23) 799 (51) 154 (10) 128 (7) 1,573
Table 28: Interference of RMD with sexual life by condition, (p<0.001)
44
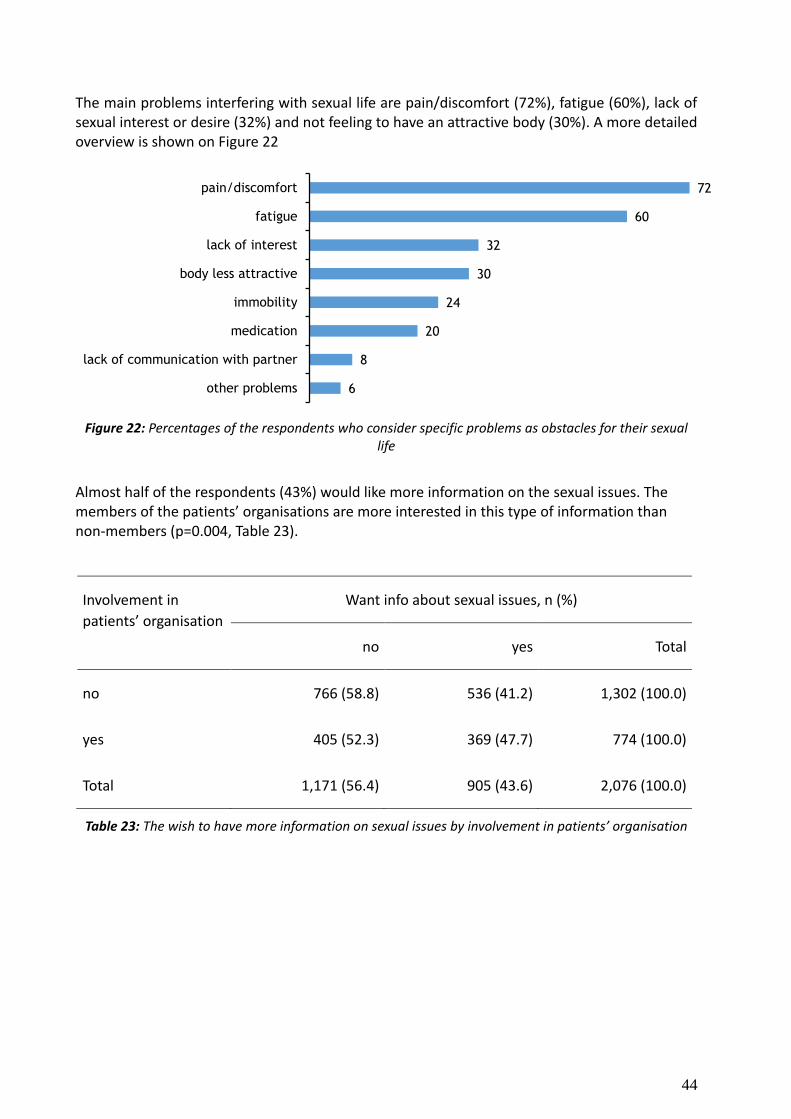
The main problems interfering with sexual life are pain/discomfort (72%), fatigue (60%), lack of sexual interest or desire (32%) and not feeling to have an attractive body (30%). A more detailed overview is shown on Figure 22
Figure 22: Percentages of the respondents who consider specific problems as obstacles for their sexual life
Almost half of the respondents (43%) would like more information on the sexual issues. The members of the patients’ organisations are more interested in this type of information than non-members (p=0.004, Table 23).
Involvement in
patients’ organisation
Want info about sexual issues, n (%)
no yes Total
no 766 (58.8) 536 (41.2) 1,302 (100.0)
yes 405 (52.3) 369 (47.7) 774 (100.0)
Total 1,171 (56.4) 905 (43.6) 2,076 (100.0)
Table 23: The wish to have more information on sexual issues by involvement in patients’ organisation
72
60
32
30
24
20
8
6
pain/discomfort
fatigue
lack of interest
body less attractive
immobility
medication
lack of communication with partner
other problems
45
Young people said:
“Partner and parents do not understand what I am going through.”
„I always learned from my parents: the disease doesn’t own you, but you have the disease.”
”My parents are very important, other people come and go in my life, and they are family and so those who know me from zero to now have experienced my arthritis as well.”
“At a given moment, when I had stopped the medication, my husband said that only then he really realized what an impact this had on my body and my life."
“Arthritis is never specifically discussed in my family.”
“It has become a lot easier since I have my husband. He does all heavier things”
“My main aiding equipment is my husband and if he is not there, then I don´t eat things that I cannot open. Otherwise you just have to be creative and find solutions”
“I couldn’t find a better man. My husband does everything in the household, he never complains, it is of course nice if I can do things by myself if I am physically able to, but in principle he says "if you occasionally have some extra energy, just go out with your girlfriends”.
“My husband knows what it is. And he has been with me to some events and there he has got a lot of information also. It is very important that he knows. Cause at the beginning when I did not have the diagnoses, then he thought I am faking it. And when he found out about the diagnoses he got down and was surprised what kinds of diseases exist.”
”My first son was born deaf and my in-laws blamed my pharmacological treatment for their grandson` s disability. I was deeply hurt by this and felt very guilty for a long time, even though I stopped all medication three months prior to his conception.”
”I will not let my rheumatism limited my relationships and don’t have any problem with sex.”
“I notice there are obstacles in bed because I have often pain or tiredness. In that case it requires some extra efforts to become more active than you sometimes want.”
46
4. C o n c l u s i o n s
This is the first and the largest European study into the experiences, obstacles and needs of the young people between 18 and 35 years with a rheumatic or musculoskeletal disease (RMD). The study has been carried out by, with and for people from the target group. The results reveal a variety of circumstances affecting the lives of young people with RMDs in Europe. With these results, we not only have a solid base-line picture of the current needs and obstacles of this rather invisible patient group, but we also have a good starting document to develop a youth strategy for the future and a practical plan of actions for EULAR, youth groups and PARE organisations.
Strengths of the study
The strength of the study is the emergent project design that combined mixed methods with an approach of action research by the youngsters themselves. This has resulted in a high response rate of the survey. Over 3500 people filled in the online-survey, which was available in 18 languages. After excluding non-eligible responses, 2329 responses were included, representing the perceptions of young people with a RMD coming from 41 European countries. A further strength of the study is the fact that there were a significant number of non-organized respondents (66%) and this was one of our objectives. This indicates that the outreach of the survey may have contributed to a valid representation of the target group. Inspite of not having a traditional paper questionnaire, we reached many young people. A separate website (www.youngpare.org) was created to promote the survey. National organisations were asked to upload the information on their websites and Facebook pages. Survey results indicate that we reached more people than we expected by using modern communication channels. If we want to reach out to the target group, we have to utilize social media actively. The mapping exercise taught us that only in 22 countries (55%) there are some youth activities. Despite the fact that RMDs have a high impact on young people, in many countries, patient organisations do not work specifically in their interests. The findings from the qualitative research showed that local groups support young people a lot and they are a good source for information, peer education and mental support. Many non-organised young people (65%) showed interest in receiving information about local patient groups. Based on the presentation of our findings at the Autumn Conference in Reykjavik (November 2013), we recommend to follow the example of the European Patient Forum. They have developed a youth strategy and have a steady youth working group. Their youth activities are carried out with the help of dedicated staff officers.
Limitations
One limitation of this study is the relatively low number of participants in the focus groups. It might be argued that it is difficult to gather young people with RMDs to come together for research purposes to talk about their condition. The survey also indicated that many young people do not want to disclose themselves. They clearly prefer to meet on the internet or face-to-face during more enjoyable activities. Other limitations were the restricted experiences of the young Task Force members in carrying out research. The lack of a control group has been
47
brought forward as an obstacle to compare our findings with healthy youngsters. However, we believe that the data as presented in this report is appropriate, gives sufficient information to stimulate follow-up research and could be used nationally. Due to limited resources we were not able to prepare separate country reports and we will focus on these in our follow up projects. Another limitation might have been that the mapping exercise through data collected via email through PARE liaison persons did not result in a complete overview of current youth activities and youth involvement. This offline exercise involved not only information about youth activities in a specific country but also other organisational updates. This poses the potential of gaps in information as well as changes which may have taken place in the meantime. There is a need to update and verify this information again to monitor youth activities and groups frequently, preferably every year. This information should be integrated into the EULAR Directory of PARE organisations and should be fed back into the PARE Youth task force.
The current research design could not allow us to analyze the correlation between different variables or to compare the data with the general population. Further research is needed in prioritized areas to obtain more information. Scientific research methods should be used again and implemented more stringent to gather an even better scientifically sound database. However the quality of the available data guaranteed a solid baseline to get an understanding of the needs, obstacles, preferences and priorities of young people and to plan follow up steps for further integration of young people`s perspectives into EULAR PARE. Finally, the project had to face a change of coordinator after the data collection. This required prompt improvisation in the last stages of data analysis and writing the report.
Mapping exercise
From the mapping exercise we learned how young people with RMDs are organized in different European countries. The most important conclusions are:
22 (55%) of the PARE member organisations have some kind of activities that are dedicated to young people.
18 (45%) of the PARE member organisations do not provide services to young people. Two of them are planning to establish a youth group.
There is a huge difference in the age limits that defines ”youth” in all European countries, varying between 0 till 55.
Activities for young people with RMDs vary a lot and are offered through 3 different ways: By independent youth organisations (7), by a youth group that is part of a mother organisation (5) or as specific focus in the ordinary activities of the mother organisation (10).
There are special contact people for young people in many countries, almost all of them work on a voluntary basis.
From the research, we learned more about the impact that young people with RMDs between18 and 35 years experience as a consequence of their disease. The most important conclusions are:
48
Talking about the disease is a huge issue in many European countries. 68% of respondents prefer not to talk about their condition. 36% of younger people do not tell their employers about their disease, 22% does not talk about their disease at school or with friends and 17% does not talk about it with their family.
85% of the young people with a RMD feel disadvantaged if others know about their disease
10% of the young people have no access to a rheumatologist in their country.
92% of the young people are facing negative impact on mental health.
65% of the young people had a RMD during their studies and 74% of them experienced a delay in their educational career.
Delay in educational career could be avoided by raising awareness about RMD among teaching staff (51%), flexible schedule (46%), adjustable table/chair (30%) and financial support (29%).
95% of the young people reported a significant impact of their condition on work ability.
55% of the young people had to stop their paid job partly or entirely due to their disease.
20% of the young people are not able to support themselves.
93% of the young people reported a significant impact of their condition on social life. Main barriers for them were: pain (82%), fatigue (80%), friends fail to understand their needs (27%) and no interest (21%).
RMDs impacted the sexual life of 83% of the young people. Most common causes are pain and discomfort (72%), fatigue (60%), lack of sexual interest or desire (32%) and not feeling to have an attractive body (30%).
Over 60% of the young people with RMDs receive support in everyday life from parents and/or partners.
Collected data confirm that having a RMD has a huge impact on many domains of life. Education, work, social life, family life, intimacy and health care are all affected by having a disease. The ability and willingness to disclose the disease is a great problem in many countries, partly because of the expected negative consequences of others knowing about the disease. A majority of the young people does not want to talk about their disease for different reasons, not only because they are afraid of not getting a job or to stay at work, but also because they experience or expect negative responses from others. Therefore many young people do not talk about their disease at school, with friends or family. Fatigue, functional disabilities and the unpredictable nature of the disease are symptoms that many respondents experience, although often not taken seriously by people in the direct environment. Lack of understanding often leads to feelings of depression and loneliness. Finally, for many respondents it is hard to find appropriate and tailor-made information that addresses their every day concerns, such as information about opportunities to enjoy sexuality, the decision to have children and consequences for pregnancy, medicine use and breast feeding. To reach out to young people, we have to use modern communication channels and support online networking.
49
5. R e c o m m e n d a t i o n s
The PARE youth research project has finished the first phase, the identification and research part. In the second phase we hope to continue on the basis of these research findings to improve the support of PARE and youth organisations and to further integrate their perspective in EULAR. For this the Task Force has developed a new project application.
The collected data confirm that having a RMD has a huge impact on the life of young people. How can EULAR, the Standing Committee of PARE and the national organisations help to reduce this burden and raise the quality of life of this target group?
Based on the findings from this PARE research project, we recommend the development of a youth strategy and to undertake the following actions:
The impact of RMDs on young people is often neglected. Therefore all stakeholders, including EULAR, the national patient organisations, health providers and policy makers should give more attention to this specific target group.
To establish a sustainable youth group in PARE with sufficient secretarial support to develop a youth strategy and to implement the recommendations, support youth groups and national member organisations, and to guarantee continuity in the future.
To organize a strategic meeting in 2014 with representatives of all European youth groups who actively contributed to the survey, to develop a youth strategy and a plan of actions based on the survey results.
To explore the reasons or obstacles of PARE organisations not to have a youth group.
To engage with national youth groups and organisations to develop, share and organize programs that can be implemented on a national level to encourage and empower young people to start talking about their disease.
To agree on a preferred age range for the definition of young people with RMDs.
To support the development and use of modern communication channels (social media, www.youngpare.org, etc.) for networking, education and support of youth groups.
Many actively participating PARE representatives have asked for detailed country reports to use on national and local level. We therefore recommend to further analyze the outcomes of the European youth survey and to produce country fact sheets.
To mediate contact with unorganized youth, who participated in the survey and showed interest to receive additional information about youth groups.
To support the establishment of new youth activities, new youth groups and online platforms.
50
6. A c k n o w l e d g e m e n t s
We would like to thank all the people that in many different ways have contributed to the success of the PARE youth research project.
Task Force
Anna Ageberg (Sweden) Dragan Chichikj (Macedonia) Laura Hickey (Ireland) Linda van Nieuwkoop (Netherlands) Ingrid Põldemaa (Estonia, chair, project
coordinator Sep`13 – Jan`14) Björn Teutriene (Germany) Maarten de Wit (Netherlands,
convenor) Fotini Xomeritaki (Greece)
Advisory Board
Epp Adler (Estonia), youth worker Judy Ammerlaan (Netherlands), health
professional representative Nele Caeyers (Belgium), patient
representative Nemanja Damjanov (Serbia),
rheumatologist
National researchers
Epp Adler, Estonia , NGO Headest, founder, trainer and consultant in youth work, BA in Social Work Management, , European Studies Master Program, Tartu University European College
Sophie Cleanthouse, Cyprus research assistant Centre for Rheumatology Research, Division of Medicine, University College London, Phd candidate University College London
Astrid Kuentzel, Germany Archivist of senior civil service at the Landesarchiv of Northrhine-Westfalia in Düsseldorf, PhD
Ingrid Kihlsten, Sweden. Project Coordinator/researcher of the (PARE Youth Research) project (until Aug 2013) and BA in Public Health Science, Master student in Sexology, Malmo University.
Maarten de Wit, Netherlands, PhD in collaboration with Linda van Nieuwkoop.
Researcher (survey)
Marika Tammaru, Estonia, East Tallinn Central Hospital, Head of Research Department, MD, Phd Tartu University
Secretarial support Florian Klett, EULAR PARE Programme
manager
Volunteers
Susanne Poot, the Netherlands (website www.youngpare.org) Jean-Nöel Dachicourt, France (creating logo) Kristi Mustkivi and Serle Roletsky, Estonia (TF meeting preparation) Angela Lore, Italy (TF meeting) Youth representatives in PARE and other European organisations
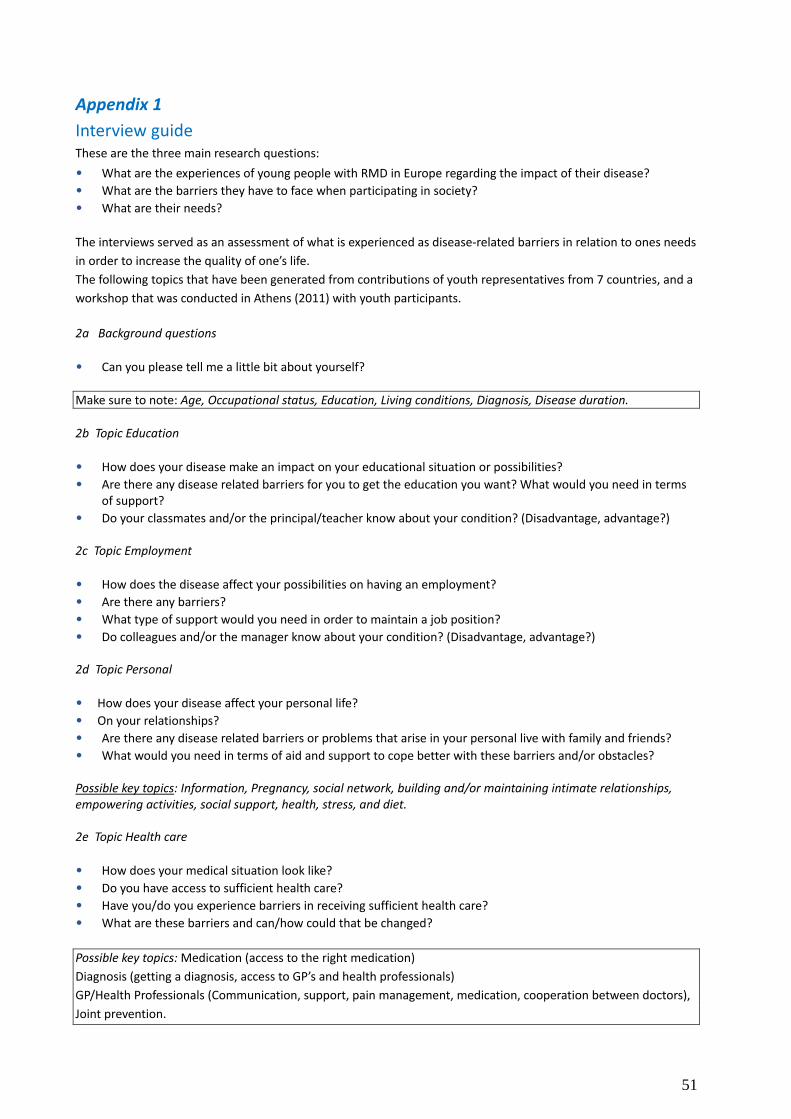
51
Appendix 1
Interview guide These are the three main research questions:
• What are the experiences of young people with RMD in Europe regarding the impact of their disease? • What are the barriers they have to face when participating in society? • What are their needs?
The interviews served as an assessment of what is experienced as disease-related barriers in relation to ones needs
in order to increase the quality of one’s life.
The following topics that have been generated from contributions of youth representatives from 7 countries, and a
workshop that was conducted in Athens (2011) with youth participants.
2a Background questions
• Can you please tell me a little bit about yourself?
Make sure to note: Age, Occupational status, Education, Living conditions, Diagnosis, Disease duration. 2b Topic Education
• How does your disease make an impact on your educational situation or possibilities? • Are there any disease related barriers for you to get the education you want? What would you need in terms
of support? • Do your classmates and/or the principal/teacher know about your condition? (Disadvantage, advantage?) 2c Topic Employment
• How does the disease affect your possibilities on having an employment? • Are there any barriers? • What type of support would you need in order to maintain a job position? • Do colleagues and/or the manager know about your condition? (Disadvantage, advantage?) 2d Topic Personal
• How does your disease affect your personal life? • On your relationships? • Are there any disease related barriers or problems that arise in your personal live with family and friends? • What would you need in terms of aid and support to cope better with these barriers and/or obstacles? Possible key topics: Information, Pregnancy, social network, building and/or maintaining intimate relationships, empowering activities, social support, health, stress, and diet. 2e Topic Health care
• How does your medical situation look like? • Do you have access to sufficient health care? • Have you/do you experience barriers in receiving sufficient health care? • What are these barriers and can/how could that be changed?
Possible key topics: Medication (access to the right medication)
Diagnosis (getting a diagnosis, access to GP’s and health professionals)
GP/Health Professionals (Communication, support, pain management, medication, cooperation between doctors),
Joint prevention.
52
Appendix 2
Information letter
Dear
In this letter we would like to provide information about the research for which you were asked to
participate and the organisation standing behind it. The EULAR PARE Standing Committee gathers
representatives of rheumatic and musculoskeletal user groups around Europe to work together towards
improving the quality of life for the more than 120 million people in Europe living with these conditions.
The committee's vision is of people with rheumatic and musculoskeletal diseases in Europe being
empowered to lead full and independent lives. To achieve this, the committee organises a range of high-
quality activities and programmes. This study is an international collaborative research that will be
conducted in five European countries (Germany, Sweden, Netherlands, Cyprus, and Estonia). We would
like to know more about the consequences of having a rheumatic disease for young people between 18
and 35 years. This concerns the question of how the disease make an impact on your daily life, what
obstacles you are experiencing and what you kind of support that would meet your needs to have
increased quality of life. We collect this information through interviews with young people and a group
meeting with about 8 people. You are invited to give voice to your life experience by participating in a
group meeting [day] [date] in [location]. The evening starts at [time] and lasts about 2 hours. All
participants receive a small present and reimbursement of travel expenses. If you do not have the
opportunity to participate in the group meeting, we will ask you if you are willing to participate in an
interview. The time and place we can determine in consultation. All the information from the interviews
and the group meeting will be handled very carefully. That means that your privacy is assured and that
all information used in the report and any publication will be displayed completely anonymous. If you
would like more information about this study, or if you are interested to participate, please send an
email to [name national researcher], [e-mal]. You can also call [phone number].
Thanks in advance for your interest in this investigation and we hope you want to take part,
Yours sincerely,
[Name task force member], [position and name of organisation]
[Name national researcher], researcher
53
Appendix 3
Consent form
Pare Youth Project
- A study to investigate the barriers and needs of young people living with RMD
Project Coordinator: Ingrid Kihlsten, [email protected]
Project Convenor: Maarten de Wit, [email protected]
National Researcher: (name), (number email)
If you have a concern about any aspect of this study you should speak to the researcher or contact the project
coordinator and we will do our best to answer any questions or concerns that you might have
Please read the following statements and initial box
1. I confirm that I have read and understood the information sheet for the above study and have had the
opportunity to ask questions.
2. I confirm that I have had sufficient time to consider whether or not I wish to participate in the study.
3. I understand that my participation is voluntary and that I am free to
withdraw from the study at any time, without giving any reason
4. I understand that all data will be kept strictly confidential to this research.
5. I consent to my quotations being used anonymously in reports and publications.
Signed: _____________________________________________Date:_____________
Full name in block capitals:_______________________________________________
Signed (National researcher):_____________________________________________
Full name in block capitals:_______________________________________________
54
Appendix 4
Template for reporting back about the focus group meeting Name of the national researcher
Name of the national PARE task force member
Date of focus group
Location of the focus group
Duration of the focus group
Number of participants
Number of male
Number of female
Lowest age
Highest age
Average age
Number of “organised”
Number of “un-organised”
List the specific rheumatic conditions if available
Description of recruitment procedure
Please report the main experiences of the participants regarding the impact of their disease
Please report the main barriers for participating fully and independently in society
Please report the main needs of the participants
55
Appendix 5 Template for reporting back on individual interviews (Please complete the report for each individual interview separately)
Name of the national researcher
Name of the national PARE task force member
Date of the interview
Location of the interview
Duration of the interview
Sex (Male/Female)
Age
Occupation
Member of disease-related organisation or youth group (Yes/No)
Rheumatic condition Diagnosis: Duration:
Description of recruitment procedure
Please report the main experiences of the interviewee regarding the impact of the disease
Please report the main barriers for participating fully and independently in society
Please report the main needs of the interviewee
56
Appendix 6
Survey questionnaire (18 languages)
PARE YOUTH RESEARCH PROJECT - INSTRUCTION TO TRANSLATORS
The translators for this project are required to be native speakers of the target language, proficient in the reading the source language, experienced in translating documents and have experience within the health services field. The survey is reaching out via SurveyMonkey, to young people between the ages of 18-35 years living in 23 European countries. (Text in parentheses and in red) are only clarifications and are not needed to be translated. You can have a look on the digital version here: https://www.surveymonkey.com/s/YDC78L8 We have through extensive collaboration with the target group, youth in Europe between the ages of 18-35 years, tried to give the survey a cultural sensitivity. Many surveys suffer measurement errors due to poor translation procedures, inappropriate content, insensitivity of items, and a lack of knowledge of the cultural norms by researchers. Unfortunately, due to limited time and resources in the project we are unable to double-check the validity of each questionnaire. However, in the extent that it is possible, we will try to test all questionnaires by one representative from each country before it is sent out. One issue that has been discussed within our research team is whether it is more appropriate to use the word "disease" than "condition". This is something that you will be the judge of when translating. However the aim of the research is to explore the conditions for youth living with a disease rather than exploring the disease itself (in a medical sense). It can be important for you to know that rheumatic and musculoskeletal diseases vary greatly, in terms of how these affect the physical and mental ability of each individual and depending on the societal norms and support systems for that individual; so you know that our research population is very heterogeneous. It is therefore a challenge to make one survey for many different types of living conditions and contexts. The aim should be to achieve linguistic equivalence in terms of taking the semantic, conceptual and normative equivalence closely into account. It is important that not only the words and sentences are translated but also accordingly to the language of the target group; according to the social script of the linguistic and social culture. For example, some cultures are less willing to share personal information or discuss certain topics than other cultures, and by paraphrasing a sensitive question one could make a sensitive item less intrusive. It is important that the reader does not feel threatened by a question, thus it might risk that they decide to leave the survey. Best wishes and good luck, [name Project co-ordinator PARE Youth Research Project]
57
(FIRST PAGE, Introduction text)
Hi there!
Thank you for lending us 10 minutes of your time! Your participation is very important. This survey is about the needs and experiences of young people between 18-35 years living with rheumatic and musculoskeletal diseases in Europe. We have made this survey together with youth representatives from all over Europe, and we hope that you will find the questions in this survey relevant to you!
Do not worry, all responses are anonymous. That means that no one can track who wrote what. The results will be used in a report that will help to guide future youth work across Europe, and might also be used for scientific purposes.
The final report will be published in November 2013 on our homepage (XXX) and EULAR's homepage www.eular.org.
If you have any questions about the survey, or if you want to contact us, you are welcome to send an email to the Project Co-ordinator, Ingrid Kihlsten, at [email protected]
Thank you for taking the time to complete this survey!
“Thank you for your interest!”
“You have to answer this question.”
“Forward/Next”
“Back”
"Finished"
"Click the ‘Next’ button to start the survey!"
DEMOGRAPHIC VARIABLES 1) Do you have a rheumatic and/or a musculoskeletal condition? <Yes, No> 2) Gender <Male, Female> 3) Age (A list of numbers from 0-35+). (If the respondent clicks 35+ they will be conducted to a frame saying): ”In this research project we have chosen only to include young people between 18-35 years old. Thank you for your interest!” 4) In which country do you live? Albania Andorra Armenia Austria Azerbaijan Belarus
Belgium Bosnia & Herzegovina Bulgaria Croatia Cyprus Czech Republic
58
EULAR Secretariat | Seestrasse 240 | 8802 Kilchberg | Switzerland T: +41 44 716 30 30 | F: +41 44 716 30 39 M: [email protected] | W: www.eular.org
Denmark Estonia Finland France Georgia Germany Greece Hungary Iceland Ireland Italy Kosovo Latvia Liechtenstein Lithuania Luxembourg Macedonia Malta Moldova
Monaco Montenegro The Netherlands Norway Poland Portugal Romania Russia San Marino Serbia Slovakia Slovenia Spain Sweden Switzerland Turkey Ukraine United Kingdom
5) Do you have children? Yes No 6) How many children do you have? (A list of numbers) 7) What is your current living situation? The question aims to investigate how the respondent live/what their housing conditions are like) Single Shared housing with a partner Shared housing with friends With parents Other EDUCATION 8) Years of education (We want to know how many years in total that the respondent has attended any form of formal education, from primary school to university) 9 years or less 10 -12 years 13 years or more 9) What are you engaged with now? Please tick the appropriate boxes Studying part time Studying full time Working part time
Working full time Unemployed Sick leave Other
59
EULAR Secretariat | Seestrasse 240 | 8802 Kilchberg | Switzerland T: +41 44 716 30 30 | F: +41 44 716 30 39 M: [email protected] | W: www.eular.org
10) Did you have a rheumatic/musculoskeletal condition during your studies? Yes No 11) Has your rheumatic/musculoskeletal condition caused a delay in your studies? <Always, Very often, Sometimes, Never, Not applicable> 12) What kind of support would help/would have helped you manage your studies? (This questions is constructed to include both respondents that are currently enrolled and the ones that have finished their education/studies) Please tick the appropriate boxes. I manage-/d without support Accessible facilities in school Financial support Adjusted chairs and tables Flexible schedule To have a computer Access to internet Information about my condition to teachers Transport to school 13) Have you experienced any teasing in school due to your condition? <Always, Very often, Sometimes, Never> WORK 14) Has your condition affected your ability to work? <Always, Very often, Sometimes, Never> 15) Have you ever been employed? ("No" will jump to question 18) Yes No 16) Do you inform your boss about your condition before starting a new job? <Always, Very often, Sometimes, Never> 17) Have you been forced to quit a job due to your condition? <Always, Very often, Sometimes, Never> FINANCES 18) Are you able to financially support yourself? <Always, Very often, Sometimes, Never> 19) What is your main source of income? Please tick the appropriate boxes. Salary from work Government aid Social benefits Disability benefit Loans
60
EULAR Secretariat | Seestrasse 240 | 8802 Kilchberg | Switzerland T: +41 44 716 30 30 | F: +41 44 716 30 39 M: [email protected] | W: www.eular.org
Grants Support from partner Support from parents Support from friends Other HEALTH 20) Have you been diagnosed by a medical doctor for a rheumatic/musculoskeletal condition? <Yes, No> 21) What type of condition do you have?
Rheumatoid Arthritis Juvenile Idiopathic Arthritis Ankylosing Spondylitis Osteoarthritis Systemic Lupus Erythematosus Fibromyalgia Scleroderma Psoriatic Arthritis Lower Back Pain Other
22) At what age were you diagnosed by a medical doctor with this condition? (A list of numbers from 0-35+) 23) At what age did you discover your first symptoms? (A list of numbers from 0-35+) 24) Do you have access to a rheumatologist to treat your condition? <Always, Very often, Sometimes, Never> SOCIAL LIFE & SUPPORT 25) Does your condition limit your social life? <Always, Very often, Sometimes, Never> 26) What are the main barriers for your social life? Please tick the appropriate boxes. Fatigue Pain No interest in social activities Friends fail to understand my needs Lack of accessible public places Lack of public transportation Other, please specify. 27) Who assists you when you need it? Friends <Always, Very often, Sometimes, Never, Not applicable> Parents <Always, Very often, Sometimes, Never, Not applicable> Siblings <Always, Very often, Sometimes, Never, Not applicable> Partner <Always, Very often, Sometimes, Never, Not applicable> Health professionals <Always, Very often, Sometimes, Never, Not applicable>
61
EULAR Secretariat | Seestrasse 240 | 8802 Kilchberg | Switzerland T: +41 44 716 30 30 | F: +41 44 716 30 39 M: [email protected] | W: www.eular.org
28) Does your condition have a negative impact on your mental health? <Always, Very often, Sometimes, Never> 29) Do you need psychological support? <Always, Very often, Sometimes, Never> 30) Do you have the possibility to get psychological support? <Always, Very often, Sometimes, Never> 31) Do you talk about your condition with others? <Always, Very often, Sometimes, Never> 32) When do you not talk about your condition? Please tick the appropriate boxes. In school At work With a new partner With friends With family With a stranger At a job interview Other 33) Do you feel that you would be disadvantaged if people knew about your condition? <Always, Very often, Sometimes, Never> 34) Please rate the following statements I feel satisfied with my life <Always, Very often, Sometimes, Never> I feel that I can achieve important goals in my life <Always, Very often, Sometimes, Never> I feel that I have control over my own life <Always, Very often, Sometimes, Never> I feel optimistic about my future <Always, Very often, Sometimes, Never> INTIMACY 35) Does your condition interfere with your sexual life? <Always, Very often, Sometimes, Never, Not applicable> 36) What interferes with your sexual activity or satisfaction? Please tick the appropriate boxes. Fatigue Pain or discomfort in my body Feeling that my body is less attractive Lack of sexual interest or desire Medication Lack of communication with partner Immobility Other Please specify... 37) Would you like to receive information regarding how to deal with sexual issues? <Yes, No> ORGANISATIONS 38) Have you been involved in any activity organised by a patient group or patient organisation?
62
EULAR Secretariat | Seestrasse 240 | 8802 Kilchberg | Switzerland T: +41 44 716 30 30 | F: +41 44 716 30 39 M: [email protected] | W: www.eular.org
<Yes, No> 39) Would you like to receive information from your national organisation? <Yes, No> ”If you would like some more information, please fill in your email address. Your responses to this survey will still remain completely anonymous, and cannot be linked to your email address. We will forward your email to your local organisation”. Thank you for filling out this survey! For more information visit XXXX or www.eular.org