Embed Size (px)
Citation preview
FINAL REPORT ON THE RESULTS OF PRECISION EXPERIMENT
PROFICIENCY TESTING PROGRAMStrenght and Elasticity of Hardened Concrete
ZZB 2018/2
Brno University of TechnologyProficiency testing provider at the SZK FASTVeveří 95, Brno 602 00Czech Republic
www.szk.fce.vutbr.cz
Date: November, 20th 2018
Assoc. Prof. Ing. Tomáš Vymazal, Ph.D. Ing. Petr Misák, Ph.D.Head of the PT Provider, PTP coordinator Coordinator of PTP results assessment


CONTENTS
Contents
1 Introduction and Important Contacts 3
2 Procedures used in the Statistical Analysis of Laboratory Results 62.1 The Numerical Procedure for Determining Outliers . . . . . . . . . . . . . . . . . . . . . . . . . . . 6
2.1.1 Cochran’s test . . . . . . . . . . . . . . . . . . . . . . . . . . . . . . . . . . . . . . . . . . . 62.1.2 Grubbs’ test – One Outlying Observation . . . . . . . . . . . . . . . . . . . . . . . . . . . . 7
2.2 Mandel’s Statistics . . . . . . . . . . . . . . . . . . . . . . . . . . . . . . . . . . . . . . . . . . . . 72.2.1 Interlaboratory Consistency Statistic h . . . . . . . . . . . . . . . . . . . . . . . . . . . . . . 72.2.2 Intralaboratory Consistency Statistic k . . . . . . . . . . . . . . . . . . . . . . . . . . . . . . 7
2.3 Calculation of Variances Estimates . . . . . . . . . . . . . . . . . . . . . . . . . . . . . . . . . . . . 72.3.1 Repeatability Variance . . . . . . . . . . . . . . . . . . . . . . . . . . . . . . . . . . . . . . . 82.3.2 Interlaboratory Variance . . . . . . . . . . . . . . . . . . . . . . . . . . . . . . . . . . . . . . 82.3.3 Reproducibility Variance . . . . . . . . . . . . . . . . . . . . . . . . . . . . . . . . . . . . . . 8
2.4 Repeatability and Reproducibility . . . . . . . . . . . . . . . . . . . . . . . . . . . . . . . . . . . . . 82.5 Assigned Values . . . . . . . . . . . . . . . . . . . . . . . . . . . . . . . . . . . . . . . . . . . . . . 82.6 Calculation of Performance Statistics . . . . . . . . . . . . . . . . . . . . . . . . . . . . . . . . . . . 10
3 Conclusions of the Statistical Analysis 113.1 EN 12390-3 – Compressive strength of test specimens . . . . . . . . . . . . . . . . . . . . . . . . . . 113.2 EN 12390-5 – Flexural strength of test specimens . . . . . . . . . . . . . . . . . . . . . . . . . . . . 113.3 EN 12390-6 – Tensile splitting strength of test specimens . . . . . . . . . . . . . . . . . . . . . . . . 113.4 EN 12390-7 – Density of hardened concrete . . . . . . . . . . . . . . . . . . . . . . . . . . . . . . . 123.5 ISO 1920-10 – Determination of static modulus of elasticity in compression . . . . . . . . . . . . . . 123.6 EN 12390-13 – method A – Determination of secant modulus of elasticity in compression . . . . . . . 123.7 EN 12390-13 – method B – Determination of secant modulus of elasticity in compression . . . . . . . 123.8 EN 12504-4, ČSN 731371 – Non-destructive testing of concrete . . . . . . . . . . . . . . . . . . . . 123.9 ČSN 731373, EN 12504-2 – Determination of rebound number . . . . . . . . . . . . . . . . . . . . . 123.10 EN 1542, ČSN 736242 – Appendix B – Measurement of bond strength by pull-off . . . . . . . . . . . 12
Standards and Documents Used 13
Appendix 14
1 Appendix – EN 12390-3 – Compressive strength of test specimens 141.1 Test results . . . . . . . . . . . . . . . . . . . . . . . . . . . . . . . . . . . . . . . . . . . . . . . . 141.2 The Numerical Procedure for Determining Outliers . . . . . . . . . . . . . . . . . . . . . . . . . . . 151.3 Mandel’s Statistics . . . . . . . . . . . . . . . . . . . . . . . . . . . . . . . . . . . . . . . . . . . . 161.4 Calculation of Performance Statistics . . . . . . . . . . . . . . . . . . . . . . . . . . . . . . . . . . . 17
2 Appendix – EN 12390-5 – Flexural strength of test specimens 192.1 Test results . . . . . . . . . . . . . . . . . . . . . . . . . . . . . . . . . . . . . . . . . . . . . . . . 192.2 The Numerical Procedure for Determining Outliers . . . . . . . . . . . . . . . . . . . . . . . . . . . 202.3 Mandel’s Statistics . . . . . . . . . . . . . . . . . . . . . . . . . . . . . . . . . . . . . . . . . . . . 212.4 Calculation of Performance Statistics . . . . . . . . . . . . . . . . . . . . . . . . . . . . . . . . . . . 22
3 Appendix – EN 12390-6 – Tensile splitting strength of test specimens 253.1 Test results . . . . . . . . . . . . . . . . . . . . . . . . . . . . . . . . . . . . . . . . . . . . . . . . 253.2 The Numerical Procedure for Determining Outliers . . . . . . . . . . . . . . . . . . . . . . . . . . . 253.3 Mandel’s Statistics . . . . . . . . . . . . . . . . . . . . . . . . . . . . . . . . . . . . . . . . . . . . 263.4 Calculation of Performance Statistics . . . . . . . . . . . . . . . . . . . . . . . . . . . . . . . . . . . 27
Proficiency Testing Provider at the SZK FAST | Z 7008Brno University of Technology | Faculty of Civil Engineering | Departement of Building TestingVeveří 331/95 | 602 00 Brno | Czech Republicszk.fce.vutbr.cz | ptprovider.cz
1/46

CONTENTS
4 Appendix – EN 12390-7 – Density of hardened concrete 304.1 Test results . . . . . . . . . . . . . . . . . . . . . . . . . . . . . . . . . . . . . . . . . . . . . . . . 304.2 The Numerical Procedure for Determining Outliers . . . . . . . . . . . . . . . . . . . . . . . . . . . 314.3 Mandel’s Statistics . . . . . . . . . . . . . . . . . . . . . . . . . . . . . . . . . . . . . . . . . . . . 324.4 Calculation of Performance Statistics . . . . . . . . . . . . . . . . . . . . . . . . . . . . . . . . . . . 33
5 Appendix – ISO 1920-10 – Determination of static modulus of elasticity in compression 35
6 Appendix – EN 12390-13, method A – Determination of secant modulus of elasticity in compression 35
7 Appendix – EN 12390-13, method B – Determination of secant modulus of elasticity in compression 35
8 Appendix – EN 12504-4, ČSN 731371 – Non-destructive testing of concrete 35
9 Appendix – ČSN 731373, EN 12504-2 – Determination of rebound number 369.1 Test results . . . . . . . . . . . . . . . . . . . . . . . . . . . . . . . . . . . . . . . . . . . . . . . . 369.2 The Numerical Procedure for Determining Outliers . . . . . . . . . . . . . . . . . . . . . . . . . . . 369.3 Mandel’s Statistics . . . . . . . . . . . . . . . . . . . . . . . . . . . . . . . . . . . . . . . . . . . . 389.4 Calculation of Performance Statistics . . . . . . . . . . . . . . . . . . . . . . . . . . . . . . . . . . . 39
10 Appendix – EN 1542, ČSN 736242, Appendix B – Measurement of bond strength by pull-off 4110.1 Test results . . . . . . . . . . . . . . . . . . . . . . . . . . . . . . . . . . . . . . . . . . . . . . . . 4110.2 The Numerical Procedure for Determining Outliers . . . . . . . . . . . . . . . . . . . . . . . . . . . 4210.3 Mandel’s Statistics . . . . . . . . . . . . . . . . . . . . . . . . . . . . . . . . . . . . . . . . . . . . 4310.4 Calculation of Performance Statistics . . . . . . . . . . . . . . . . . . . . . . . . . . . . . . . . . . . 44
Proficiency Testing Provider at the SZK FAST | Z 7008Brno University of Technology | Faculty of Civil Engineering | Departement of Building TestingVeveří 331/95 | 602 00 Brno | Czech Republicszk.fce.vutbr.cz | ptprovider.cz
2/46
1. INTRODUCTION AND IMPORTANT CONTACTS
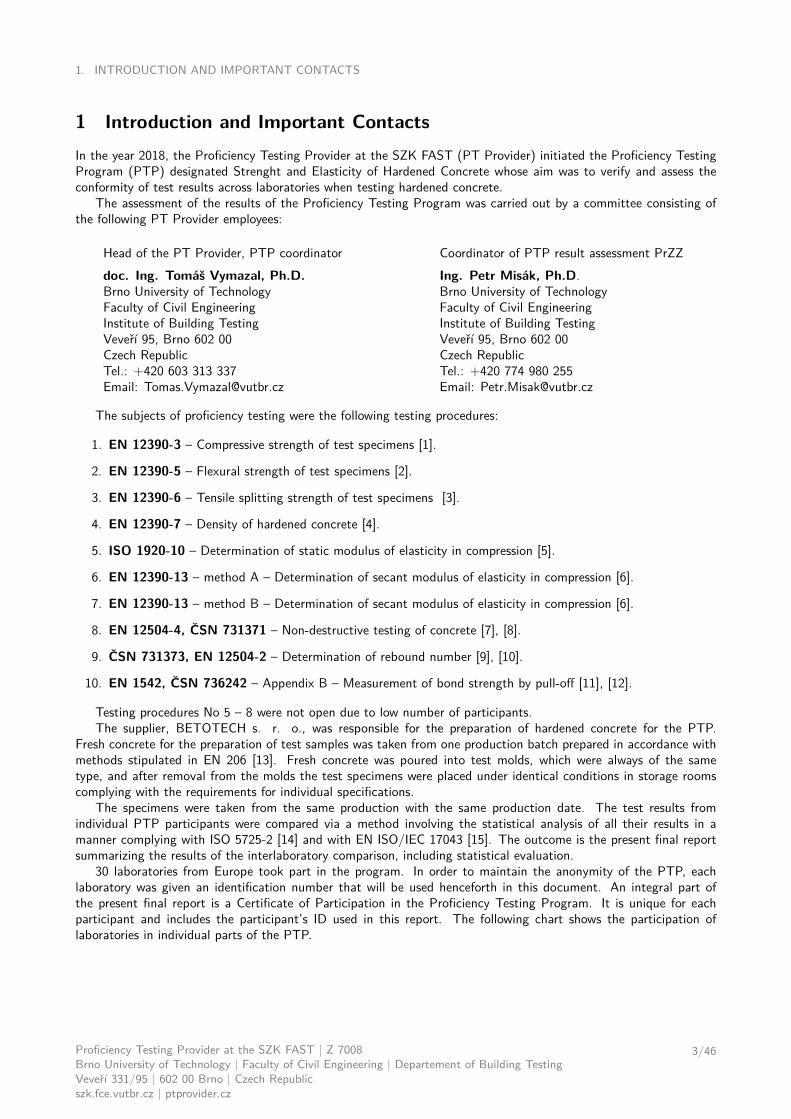
1 Introduction and Important ContactsIn the year 2018, the Proficiency Testing Provider at the SZK FAST (PT Provider) initiated the Proficiency TestingProgram (PTP) designated Strenght and Elasticity of Hardened Concrete whose aim was to verify and assess theconformity of test results across laboratories when testing hardened concrete.
The assessment of the results of the Proficiency Testing Program was carried out by a committee consisting ofthe following PT Provider employees:
Head of the PT Provider, PTP coordinator Coordinator of PTP result assessment PrZZdoc. Ing. Tomáš Vymazal, Ph.D. Ing. Petr Misák, Ph.D.Brno University of Technology Brno University of TechnologyFaculty of Civil Engineering Faculty of Civil EngineeringInstitute of Building Testing Institute of Building TestingVeveří 95, Brno 602 00 Veveří 95, Brno 602 00Czech Republic Czech RepublicTel.: +420 603 313 337 Tel.: +420 774 980 255Email: [email protected] Email: [email protected]
The subjects of proficiency testing were the following testing procedures:
1. EN 12390-3 – Compressive strength of test specimens [1].
2. EN 12390-5 – Flexural strength of test specimens [2].
3. EN 12390-6 – Tensile splitting strength of test specimens [3].
4. EN 12390-7 – Density of hardened concrete [4].
5. ISO 1920-10 – Determination of static modulus of elasticity in compression [5].
6. EN 12390-13 – method A – Determination of secant modulus of elasticity in compression [6].
7. EN 12390-13 – method B – Determination of secant modulus of elasticity in compression [6].
8. EN 12504-4, ČSN 731371 – Non-destructive testing of concrete [7], [8].
9. ČSN 731373, EN 12504-2 – Determination of rebound number [9], [10].
10. EN 1542, ČSN 736242 – Appendix B – Measurement of bond strength by pull-off [11], [12].
Testing procedures No 5 – 8 were not open due to low number of participants.The supplier, BETOTECH s. r. o., was responsible for the preparation of hardened concrete for the PTP.
Fresh concrete for the preparation of test samples was taken from one production batch prepared in accordance withmethods stipulated in EN 206 [13]. Fresh concrete was poured into test molds, which were always of the sametype, and after removal from the molds the test specimens were placed under identical conditions in storage roomscomplying with the requirements for individual specifications.
The specimens were taken from the same production with the same production date. The test results fromindividual PTP participants were compared via a method involving the statistical analysis of all their results in amanner complying with ISO 5725-2 [14] and with EN ISO/IEC 17043 [15]. The outcome is the present final reportsummarizing the results of the interlaboratory comparison, including statistical evaluation.
30 laboratories from Europe took part in the program. In order to maintain the anonymity of the PTP, eachlaboratory was given an identification number that will be used henceforth in this document. An integral part ofthe present final report is a Certificate of Participation in the Proficiency Testing Program. It is unique for eachparticipant and includes the participant’s ID used in this report. The following chart shows the participation oflaboratories in individual parts of the PTP.
Proficiency Testing Provider at the SZK FAST | Z 7008Brno University of Technology | Faculty of Civil Engineering | Departement of Building TestingVeveří 331/95 | 602 00 Brno | Czech Republicszk.fce.vutbr.cz | ptprovider.cz
3/46
1. INTRODUCTION AND IMPORTANT CONTACTS
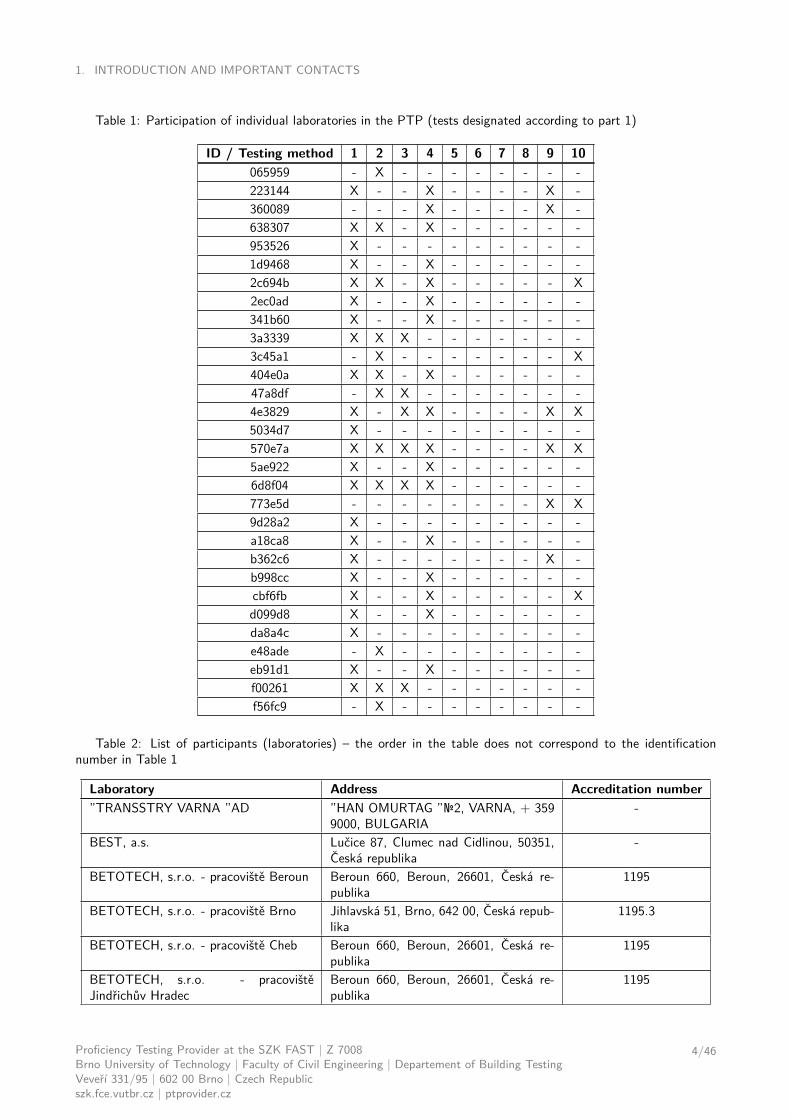
Table 1: Participation of individual laboratories in the PTP (tests designated according to part 1)
ID / Testing method 1 2 3 4 5 6 7 8 9 10065959 - X - - - - - - - -223144 X - - X - - - - X -360089 - - - X - - - - X -638307 X X - X - - - - - -953526 X - - - - - - - - -1d9468 X - - X - - - - - -2c694b X X - X - - - - - X2ec0ad X - - X - - - - - -341b60 X - - X - - - - - -3a3339 X X X - - - - - - -3c45a1 - X - - - - - - - X404e0a X X - X - - - - - -47a8df - X X - - - - - - -4e3829 X - X X - - - - X X5034d7 X - - - - - - - - -570e7a X X X X - - - - X X5ae922 X - - X - - - - - -6d8f04 X X X X - - - - - -773e5d - - - - - - - - X X9d28a2 X - - - - - - - - -a18ca8 X - - X - - - - - -b362c6 X - - - - - - - X -b998cc X - - X - - - - - -cbf6fb X - - X - - - - - Xd099d8 X - - X - - - - - -da8a4c X - - - - - - - - -e48ade - X - - - - - - - -eb91d1 X - - X - - - - - -f00261 X X X - - - - - - -f56fc9 - X - - - - - - - -
Table 2: List of participants (laboratories) – the order in the table does not correspond to the identificationnumber in Table 1
Laboratory Address Accreditation number”TRANSSTRY VARNA ”AD ”HAN OMURTAG ”№2, VARNA, + 359
9000, BULGARIA-
BEST, a.s. Lučice 87, Clumec nad Cidlinou, 50351,Česká republika
-
BETOTECH, s.r.o. - pracoviště Beroun Beroun 660, Beroun, 26601, Česká re-publika
1195
BETOTECH, s.r.o. - pracoviště Brno Jihlavská 51, Brno, 642 00, Česká repub-lika
1195.3
BETOTECH, s.r.o. - pracoviště Cheb Beroun 660, Beroun, 26601, Česká re-publika
1195
BETOTECH, s.r.o. - pracovištěJindřichův Hradec
Beroun 660, Beroun, 26601, Česká re-publika
1195
Proficiency Testing Provider at the SZK FAST | Z 7008Brno University of Technology | Faculty of Civil Engineering | Departement of Building TestingVeveří 331/95 | 602 00 Brno | Czech Republicszk.fce.vutbr.cz | ptprovider.cz
4/46

1. INTRODUCTION AND IMPORTANT CONTACTS
Laboratory Address Accreditation numberBETOTECH, s.r.o. - pracoviště Klatovy Beroun 660, Beroun, 26601, Česká re-
publika1195
BETOTECH, s.r.o. - pracoviště Most Beroun 660, Beroun, 26601, Česká re-publika
1195
BETOTECH, s.r.o. - pracoviště Trutnov Beroun 660, Beroun, 26601, Česká re-publika
1195
BETOTECH, s.r.o., zkušební laboratořOstrava
Beroun 660, BEROUN 2, 266 01, Českárepublika
1195.2
Cement Hranice, akciová společnost - be-tonářská laboratoř
Bělotínská 288, Hranice I - Město, 75301,Czech Republic
1284
CEMEX Czech Republic, s.r.o. Semtín 102, Pardubice, 53354, Česká re-publika
1302
CSS d.o.o. Savska cesta 144a, Zagreb, 10000,CROATIA
1106 HAA
EUROVIA Services, s.r.o. PO BOX 207, Praha 6, 160 41, Českárepublika
1170
Institute for Materials Testing JSC Bel-grade
Bulevar vojvode Mišića 43, Belgrade,11000, Serbia
-
Koncept CB spol. s r.o. nám. Švabinského 961/10, ČeskéBudějovice, 370 08, Česká republika
1534
QUALIFORM SLOVAKIA s.r.o. - org.složka - pracoviště Praha
Lesní 693, Bílovice nad Svitavou, 66401,Česká republika
S-301
QUALIFORM SLOVAKIA s.r.o. - orga-nizační složka - pracoviště Olomouc
Lesní 693, Bílovice nad Svitavou, 66401,Česká republika
S-301
QUALIFORM SLOVAKIA s.r.o. , Praco-visko 02 Svit
Pasienková 9 D, Bratislava, 82106,Slovenská republika
154/S-301
Ředitelství silnic a dálnic ČR Rebešovická 40, Brno-Chrlice, 643 00,Česká republika
1072
STACHEMA Bratislava a.s., Skúšobnélaboratórium STACHEMA
Rovinka 411, Rovinka, 900 41, Slovenskárepublika
S-275
STACHEMA CZ s.r.o., Zkušební labora-toř, Pracoviště 1
Hasičská 1, Zibohlavy, Kolín, 280 02,Česká republika
L 1433
Stavební fakulta, ČVUT v Praze Thákurova 7/2077, Praha, 266 29, Czechrepublic
L1048
STROYCONTROL 2003 LTD Kostenec Str 12, Sofia Bulgaria, 1612,Bulgaria
182/LI
TPA ČR, s.r.o. Vrbenská 1821/31, České Budějovice,370 06, Česká republika
1181
TPA EOOD CTC SOFIA Rezbarska 7 str., Sofia, 1510, Bulgaria -UAB ”Konstrukcijų bandymo centras” J. Basanavičiaus str. 160 D-2, Šiauliai,
LT-76128, LithuaniaLA013
Universität für Bodenkultur Wien Peter-Jordan-Str. 82, Wien - Vienna,1190, Austria
-
University of Technology - TVFA Inffeldgasse 24, Graz, 8010, Austria -ZAPA beton a.s. ZAPA beton a.s. , PO BOX č. 31, Kla-
tovská tř. 127, Plzeň 20, 320 81, Českárepublika
1439
Proficiency Testing Provider at the SZK FAST | Z 7008Brno University of Technology | Faculty of Civil Engineering | Departement of Building TestingVeveří 331/95 | 602 00 Brno | Czech Republicszk.fce.vutbr.cz | ptprovider.cz
5/46
2. PROCEDURES USED IN THE STATISTICAL ANALYSIS OF LABORATORY RESULTS
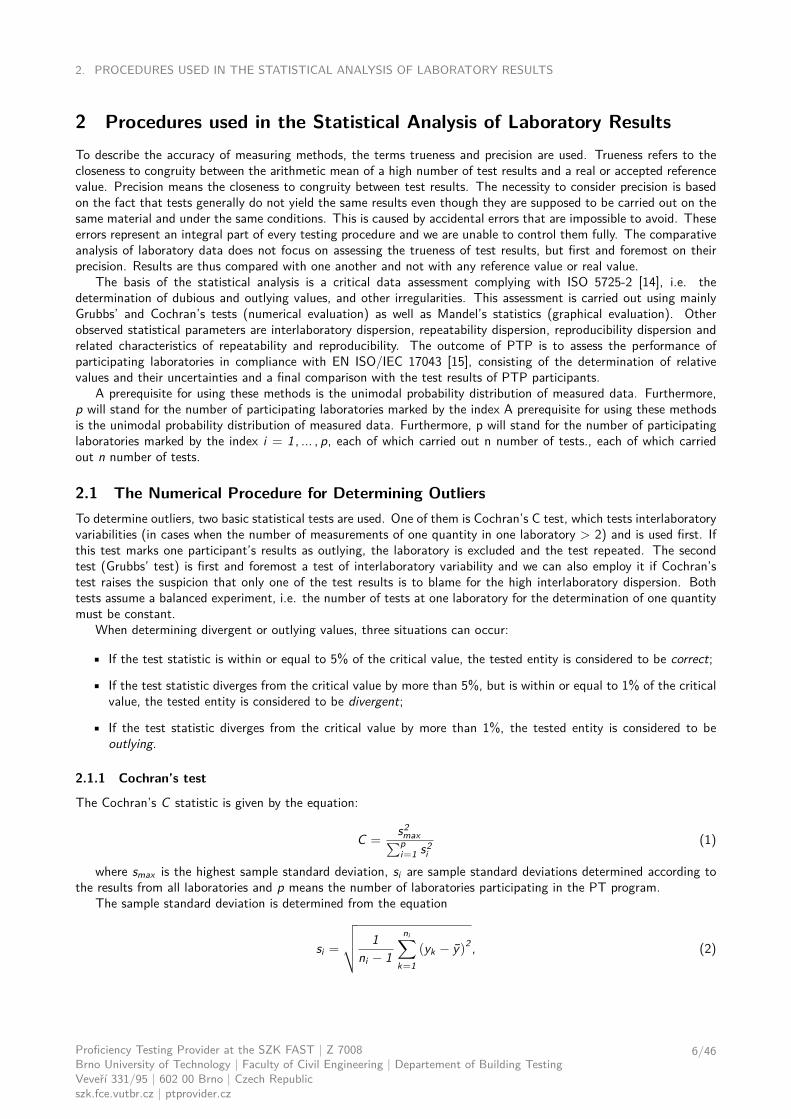
2 Procedures used in the Statistical Analysis of Laboratory ResultsTo describe the accuracy of measuring methods, the terms trueness and precision are used. Trueness refers to thecloseness to congruity between the arithmetic mean of a high number of test results and a real or accepted referencevalue. Precision means the closeness to congruity between test results. The necessity to consider precision is basedon the fact that tests generally do not yield the same results even though they are supposed to be carried out on thesame material and under the same conditions. This is caused by accidental errors that are impossible to avoid. Theseerrors represent an integral part of every testing procedure and we are unable to control them fully. The comparativeanalysis of laboratory data does not focus on assessing the trueness of test results, but first and foremost on theirprecision. Results are thus compared with one another and not with any reference value or real value.
The basis of the statistical analysis is a critical data assessment complying with ISO 5725-2 [14], i.e. thedetermination of dubious and outlying values, and other irregularities. This assessment is carried out using mainlyGrubbs’ and Cochran’s tests (numerical evaluation) as well as Mandel’s statistics (graphical evaluation). Otherobserved statistical parameters are interlaboratory dispersion, repeatability dispersion, reproducibility dispersion andrelated characteristics of repeatability and reproducibility. The outcome of PTP is to assess the performance ofparticipating laboratories in compliance with EN ISO/IEC 17043 [15], consisting of the determination of relativevalues and their uncertainties and a final comparison with the test results of PTP participants.
A prerequisite for using these methods is the unimodal probability distribution of measured data. Furthermore,p will stand for the number of participating laboratories marked by the index A prerequisite for using these methodsis the unimodal probability distribution of measured data. Furthermore, p will stand for the number of participatinglaboratories marked by the index i = 1 , ... , p, each of which carried out n number of tests., each of which carriedout n number of tests.
2.1 The Numerical Procedure for Determining OutliersTo determine outliers, two basic statistical tests are used. One of them is Cochran’s C test, which tests interlaboratoryvariabilities (in cases when the number of measurements of one quantity in one laboratory > 2) and is used first. Ifthis test marks one participant’s results as outlying, the laboratory is excluded and the test repeated. The secondtest (Grubbs’ test) is first and foremost a test of interlaboratory variability and we can also employ it if Cochran’stest raises the suspicion that only one of the test results is to blame for the high interlaboratory dispersion. Bothtests assume a balanced experiment, i.e. the number of tests at one laboratory for the determination of one quantitymust be constant.
When determining divergent or outlying values, three situations can occur:
• If the test statistic is within or equal to 5% of the critical value, the tested entity is considered to be correct;
• If the test statistic diverges from the critical value by more than 5%, but is within or equal to 1% of the criticalvalue, the tested entity is considered to be divergent;
• If the test statistic diverges from the critical value by more than 1%, the tested entity is considered to beoutlying.
2.1.1 Cochran’s test
The Cochran’s C statistic is given by the equation:
C =s2max∑pi=1 s2
i(1)
where smax is the highest sample standard deviation, si are sample standard deviations determined according tothe results from all laboratories and p means the number of laboratories participating in the PT program.
The sample standard deviation is determined from the equation
si =
√√√√ 1ni − 1
ni∑k=1
(yk − y)2 , (2)
Proficiency Testing Provider at the SZK FAST | Z 7008Brno University of Technology | Faculty of Civil Engineering | Departement of Building TestingVeveří 331/95 | 602 00 Brno | Czech Republicszk.fce.vutbr.cz | ptprovider.cz
6/46

2. PROCEDURES USED IN THE STATISTICAL ANALYSIS OF LABORATORY RESULTS
where ni is the number of test results from the determination of one quantity in i-th laboratory, yk is the k-thvalue and yi is the average value measured in the i-th laboratory. If only two results were measured for the relevantquantity, we can use the simplified equation:
si =|y1 − y2 |√
2. (3)
2.1.2 Grubbs’ test – One Outlying Observation
From the given set of xi data for i = 1 , 2 , …, p, ordered upward according to size, Grubbs’ statistic Gp is calculatedin order to use Grubbs’ test to determine whether the largest observation is an outlier:
Gp =xp − x
s , (4)
whereby x is the arithmetic mean of the observed feature. The observed feature can be the average value of thequantity determined within the laboratory. Furthermore, s is a sample standard deviation of the observed feature,which in this case is a standard deviation calculated for all the laboratories.
For significance testing of the smallest observation the test statistic is calculated:
Gp =x − xp
s . (5)
2.2 Mandel’s StatisticsIn order to determine data consistency, two values called Mandel’s h and k statistics were used. These indicators arecommonly used for the graphical evaluation of laboratories in a similar way to a description of variability.
2.2.1 Interlaboratory Consistency Statistic h
For each laboratory, the interlaboratory consistency statistic h was evaluated according to the formula
hi =yi − ¯y√
1p−1
∑pji=1
(yi − ¯y
) , (6)
where yi is the average value for the i-th laboratory, ¯y is the arithmetic mean of all values and p is the numberof laboratories. The values of the hi statistics were plotted on graphs.
2.2.2 Intralaboratory Consistency Statistic k
The intralaboratory consistency statistic k is calculated from the equation
ki =si√p√∑pi=1 s2
i
, (7)
where si is a sample standard deviation of values measured at the i-th laboratory. Just as with h statistics, thek values are plotted on graphs.
Study of the graphs displaying h and k values may indicate that certain laboratories show a significantly differentordering of results than other studied laboratories. This is caused by a permanently large and/or permanently smalldispersion of results or extreme averages of results across all levels.
2.3 Calculation of Variances EstimatesAfter the elimination of outliers (of laboratories), we can proceed to the calculation of basic variability characteristics,i.e. repeatability dispersion, interlaboratory dispersion and reproducibility dispersion. These characteristics are statedin the form of standard deviations, i.e. after extracting the root. It is advantageous when the variability characteristicsand the observed quantity are of the same physical dimensions.
Proficiency Testing Provider at the SZK FAST | Z 7008Brno University of Technology | Faculty of Civil Engineering | Departement of Building TestingVeveří 331/95 | 602 00 Brno | Czech Republicszk.fce.vutbr.cz | ptprovider.cz
7/46

2. PROCEDURES USED IN THE STATISTICAL ANALYSIS OF LABORATORY RESULTS
2.3.1 Repeatability Variance
s2r =
∑pi=1 (ni − 1)s2
i∑pi=1 (ni − 1)
(8)
2.3.2 Interlaboratory Variance
s2L =
s2d − s2
r¯n
, (9)
where
s2d =
1p − 1
p∑i=1
ni(yi − ¯y
)2 (10)
and
¯n =1
p − 1
[ p∑i=1
ni −∑p
i=1 n2i∑p
i=1 ni
]. (11)
2.3.3 Reproducibility Variance
s2R = s2
r + s2L , (12)
where s2r is repeatability variance and s2
l is interlaboratory variance.
2.4 Repeatability and ReproducibilityRepeatability expresses the fact that the difference between two test results from the same sample from testscarried out by the same person at the same facility and within the shortest time interval possible will not exceed therepeatability value r on average more than once in 20 cases if the method is employed in the common and correctmanner.
The repeatability value is expressed by the relation
r = 2 , 8sr , (13)where sr =
√s2r stands for the standard deviation of repeatability.
Reproducibility expresses the fact that the reproducibility value R for test results from one sample obtained inthe shortest time interval possible by two persons who used their own devices will not differ on average more thanonce in 20 cases if the method is employed in the common and correct manner.
The reproducibility value is expressed by the relation
R = 2 , 8sR , (14)where sR =
√s2R stands for the standard deviation of reproducibility.
2.5 Assigned ValuesThe PT Provider will ensure the determination of assigned value X and its uncertainty for every PTP. Assigned valuesare always only imparted to PTP participants after they have submitted their PTP results so that they cannot obtainany benefit from the premature revelation of the values.
The assigned values are determined by the PT Provider as consensual values derived from the results of participantsin compliance with Appendix B of EN ISO/IEC 17043 [15] using the statistical methods described in ISO 13528 [16]and ISO 5725-5 [17]. The assigned value X is therefore determined as a robust estimate of the average value x∗ (theA algorithm mentioned in [16] and [17]):
Initial values x∗ and s∗ (robust standard deviation) are calculated as
x∗ = median xi , (15)
Proficiency Testing Provider at the SZK FAST | Z 7008Brno University of Technology | Faculty of Civil Engineering | Departement of Building TestingVeveří 331/95 | 602 00 Brno | Czech Republicszk.fce.vutbr.cz | ptprovider.cz
8/46

2. PROCEDURES USED IN THE STATISTICAL ANALYSIS OF LABORATORY RESULTS
s∗ = 1 , 483 ·median |xi − x∗| , (16)where i = 1 , ... , p. The values of x∗ and s∗ are then processed as follows. First, φ = 1 , 5 · s∗ is computed. For
every xi (i = 1 , ... , p) value, the following is calculated
x∗i =
x∗ − φ if xi < x∗ − φ,x∗ + φ if xi > x∗ + φ,xi in other cases.
(17)
New values of x∗ and s∗ are calculated from the following equations
x∗ =
p∑i=1
x∗ip , (18)
s∗ = 1 , 134 ·
√√√√ p∑i=1
(x∗i − x∗)2
p − 1 . (19)
Robust estimates are derived by iteration until the estimate changes between calculations become small.The standard uncertainty uX of an assigned value determined in this manner is calculated from the relation
uX = 1 , 25 · s∗√p . (20)
In the case of a small number of PTP participants, the PT Provider sets the assigned values as consensual valuesobtained from expert participants who have proven their competence to determine the measured quantity that is thesubject of testing.
Furthermore, if the number of participants is small (4 �p�20), the PT Provider can consider determining therelative values by using what is called Horn’s method. This method consists in the determination of so-called pivotsused as a basis for estimating location and variability. First, the assessed data are ordered upwards. The low pivot isthen determined from the equation
xD = x(H), (21)
where H is an ordinal index given by the equation H =int( p+1
2 )2 or H =
int( p+12 +1)2 .
The upper pivot is then determined from the equation
xH = xp+1−H . (22)Using Horn’s method, the assigned value is determined as a location estimate, i.e. as the so-called pivot half
sum:
x∗ =xD + xH
2 . (23)
The variability estimate is determined as the so-called pivot range
RL = xH − xD (24)and the uncertainty of an assigned value calculated in this way is determined as a 95% interval estimate of the
mean value
uX = RL · tL;0 ,95 (p), (25)where tL;0 ,95 (p) is the (1 − α) quantile of the TL probability distribution with p degrees of freedom.
Proficiency Testing Provider at the SZK FAST | Z 7008Brno University of Technology | Faculty of Civil Engineering | Departement of Building TestingVeveří 331/95 | 602 00 Brno | Czech Republicszk.fce.vutbr.cz | ptprovider.cz
9/46

2. PROCEDURES USED IN THE STATISTICAL ANALYSIS OF LABORATORY RESULTS
2.6 Calculation of Performance StatisticsProficiency test results often need to be transformed into performance statistics in order to aid interpretation andto allow comparison with defined objectives. The aim is to express the divergence from the assigned value in a waythat enables its comparison with performance criteria. In compliance with the EN ISO/IEC 17043 standard [15], theperformance of participating laboratories is evaluated according to the so-called z-score and ζ-score (zeta-score).
For every non-outlying laboratory (participant), the z-score is calculated according to the equation
zi =|xi − x∗|
s∗ . (26)
ζ-score is calculated using the equation
ζi =|xi − x∗|√
u2i + u2
X, (27)
where ui is a combined standard uncertainty of the i-th laboratory. Combined standard measurement uncertaintiescan be arrived at by dividing the extended uncertainty U by the extension coefficient k, which for normal probabilitydivision has the value k = 2 . If the participant does not state the extended measurement uncertainty in their testresult protocol, it is impossible to determine the ζ-score. For more about measurement uncertainties see document[18].
The following scales are applied for the z-score and ζ-score (to simplify the matter, only the z-score is shown):
z-score =
|z | ≤ 2 shows that the laboratory performance is satisfactory and generates no signal;2 ≤ |z | ≤ 3 shows that the laboratory performance is questionable and generates an action signal;3 ≤ |z | shows that the laboratory performance is unsatisfactory and generates an action signal.
(28)
Proficiency Testing Provider at the SZK FAST | Z 7008Brno University of Technology | Faculty of Civil Engineering | Departement of Building TestingVeveří 331/95 | 602 00 Brno | Czech Republicszk.fce.vutbr.cz | ptprovider.cz
10/46
3. CONCLUSIONS OF THE STATISTICAL ANALYSIS
3 Conclusions of the Statistical AnalysisThe present report summarizes the results of the Proficiency Testing Program Strenght and Elasticity of HardenedConcrete (PT Program) organized by the PT Provider at the SZK FAST. 30 participants (laboratories) took part inthe PT Program. The program focused on ordinary standardized testing of hardened concrete with emphasis on itsstrength and elasticity. The test results are evaluated separately for each testing procedure examined. An evaluationof statistical characteristics is included in the Appendix, as well as test results and graphic presentations.
The most significant outcome of the PT Program is the so-called z-score and ζ-score (zeta-score).These charac-teristics assess the performance of individual participants by comparing it with the assigned value and measurementuncertainties. The assigned value and its uncertainty were determined according to the procedures stated in thesection 2.6. z-score and ζ-score are compared with limit values (see part 2.6). The resulting ζ-score values are nottaken into account during the final evaluation of the performance of participants as they are to a considerable degreedependent on the values of the measurement uncertainties of the assessed institutions.
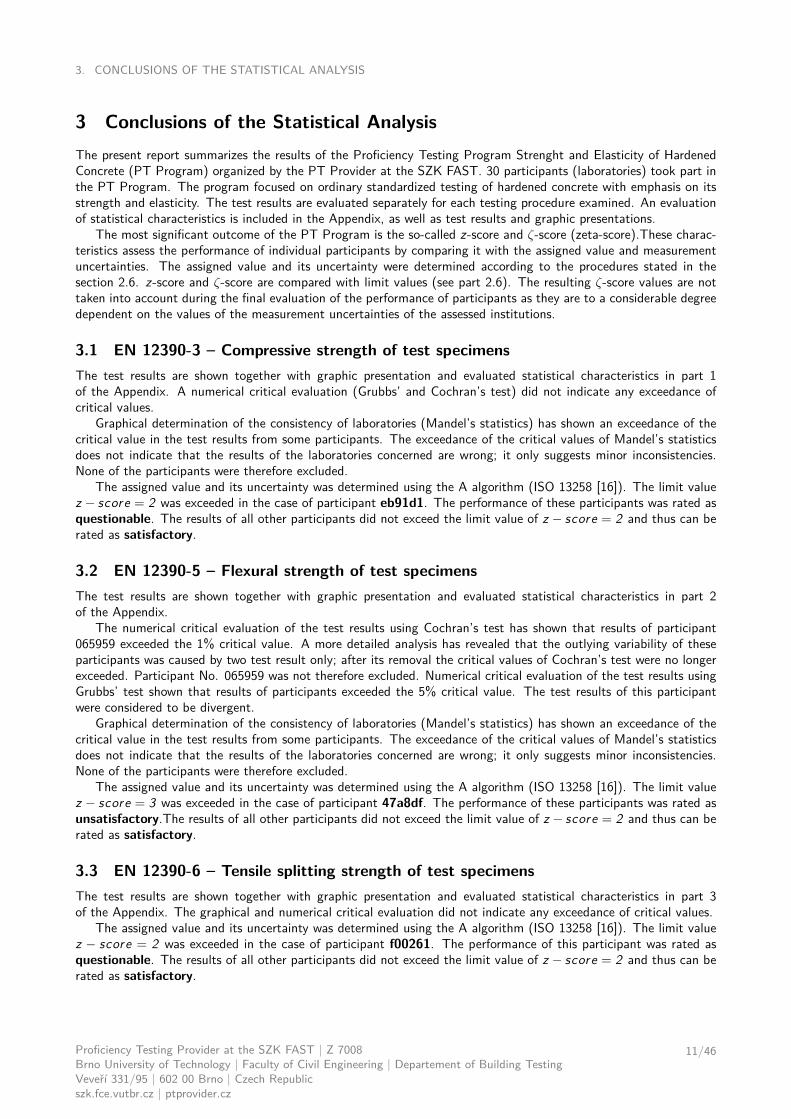
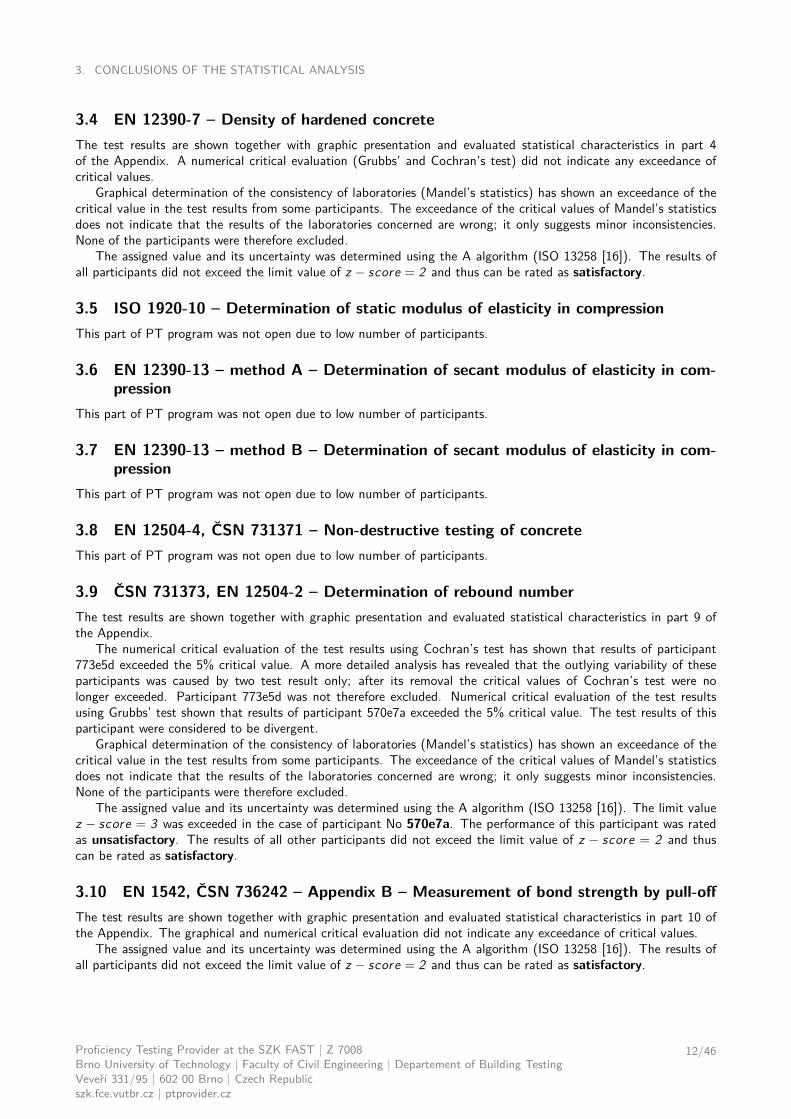
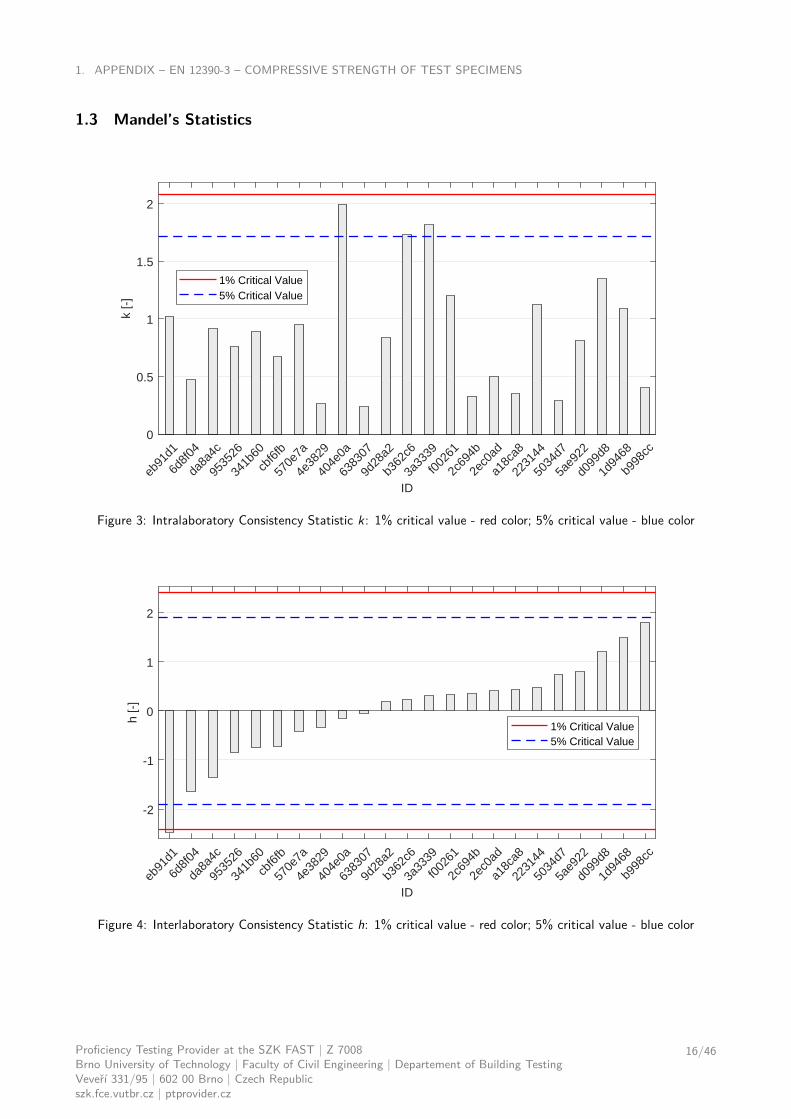
3.1 EN 12390-3 – Compressive strength of test specimensThe test results are shown together with graphic presentation and evaluated statistical characteristics in part 1of the Appendix. A numerical critical evaluation (Grubbs’ and Cochran’s test) did not indicate any exceedance ofcritical values.
Graphical determination of the consistency of laboratories (Mandel’s statistics) has shown an exceedance of thecritical value in the test results from some participants. The exceedance of the critical values of Mandel’s statisticsdoes not indicate that the results of the laboratories concerned are wrong; it only suggests minor inconsistencies.None of the participants were therefore excluded.
The assigned value and its uncertainty was determined using the A algorithm (ISO 13258 [16]). The limit valuez − score = 2 was exceeded in the case of participant eb91d1. The performance of these participants was rated asquestionable. The results of all other participants did not exceed the limit value of z − score = 2 and thus can berated as satisfactory.
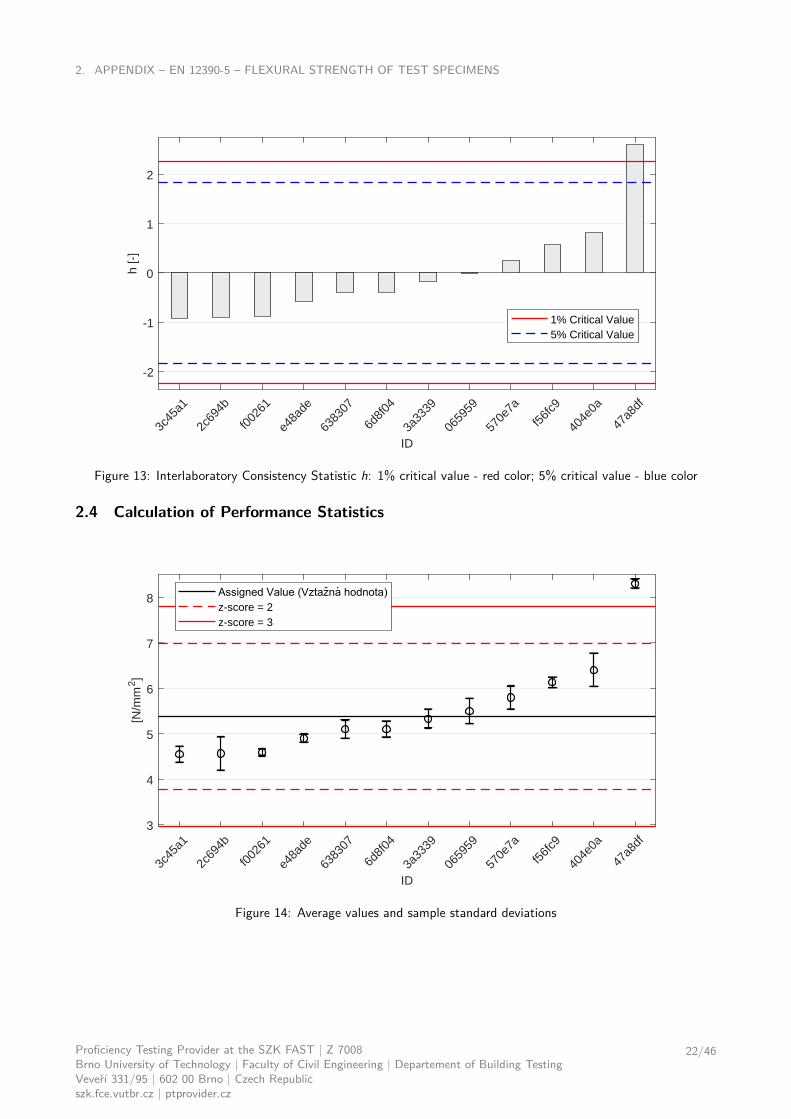
3.2 EN 12390-5 – Flexural strength of test specimensThe test results are shown together with graphic presentation and evaluated statistical characteristics in part 2of the Appendix.
The numerical critical evaluation of the test results using Cochran’s test has shown that results of participant065959 exceeded the 1% critical value. A more detailed analysis has revealed that the outlying variability of theseparticipants was caused by two test result only; after its removal the critical values of Cochran’s test were no longerexceeded. Participant No. 065959 was not therefore excluded. Numerical critical evaluation of the test results usingGrubbs’ test shown that results of participants exceeded the 5% critical value. The test results of this participantwere considered to be divergent.
Graphical determination of the consistency of laboratories (Mandel’s statistics) has shown an exceedance of thecritical value in the test results from some participants. The exceedance of the critical values of Mandel’s statisticsdoes not indicate that the results of the laboratories concerned are wrong; it only suggests minor inconsistencies.None of the participants were therefore excluded.
The assigned value and its uncertainty was determined using the A algorithm (ISO 13258 [16]). The limit valuez − score = 3 was exceeded in the case of participant 47a8df. The performance of these participants was rated asunsatisfactory.The results of all other participants did not exceed the limit value of z − score = 2 and thus can berated as satisfactory.
3.3 EN 12390-6 – Tensile splitting strength of test specimensThe test results are shown together with graphic presentation and evaluated statistical characteristics in part 3of the Appendix. The graphical and numerical critical evaluation did not indicate any exceedance of critical values.
The assigned value and its uncertainty was determined using the A algorithm (ISO 13258 [16]). The limit valuez − score = 2 was exceeded in the case of participant f00261. The performance of this participant was rated asquestionable. The results of all other participants did not exceed the limit value of z − score = 2 and thus can berated as satisfactory.
Proficiency Testing Provider at the SZK FAST | Z 7008Brno University of Technology | Faculty of Civil Engineering | Departement of Building TestingVeveří 331/95 | 602 00 Brno | Czech Republicszk.fce.vutbr.cz | ptprovider.cz
11/46
3. CONCLUSIONS OF THE STATISTICAL ANALYSIS
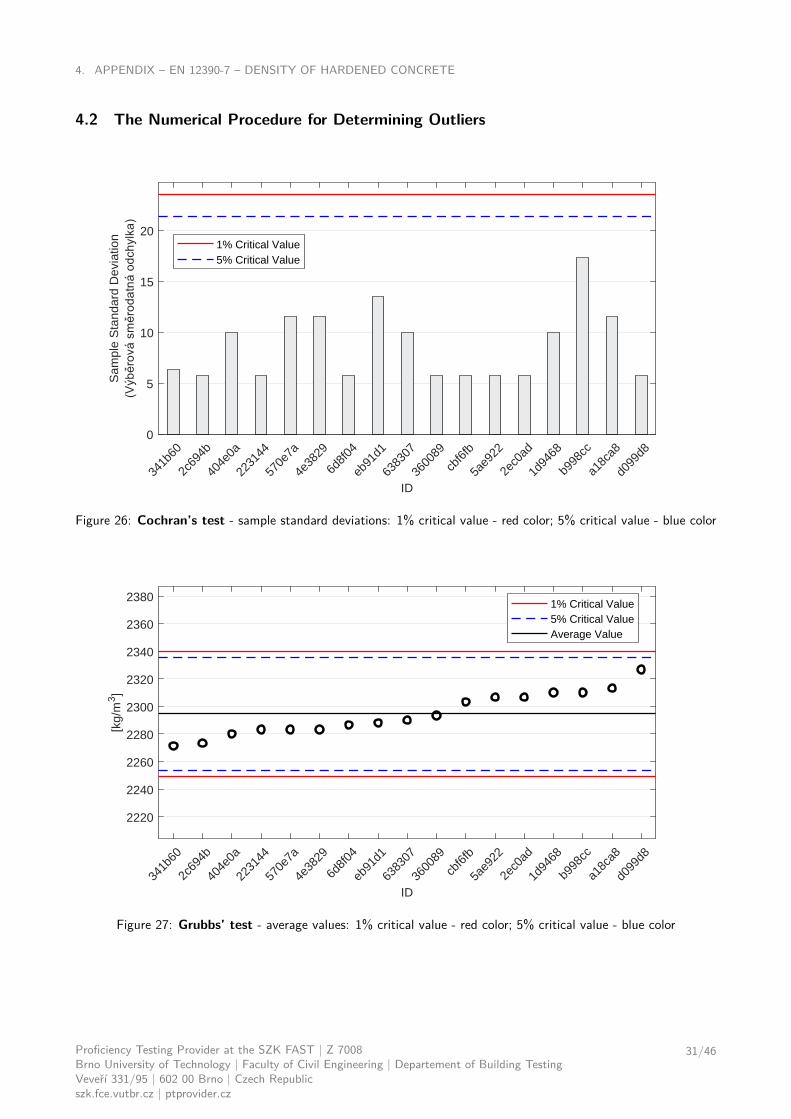
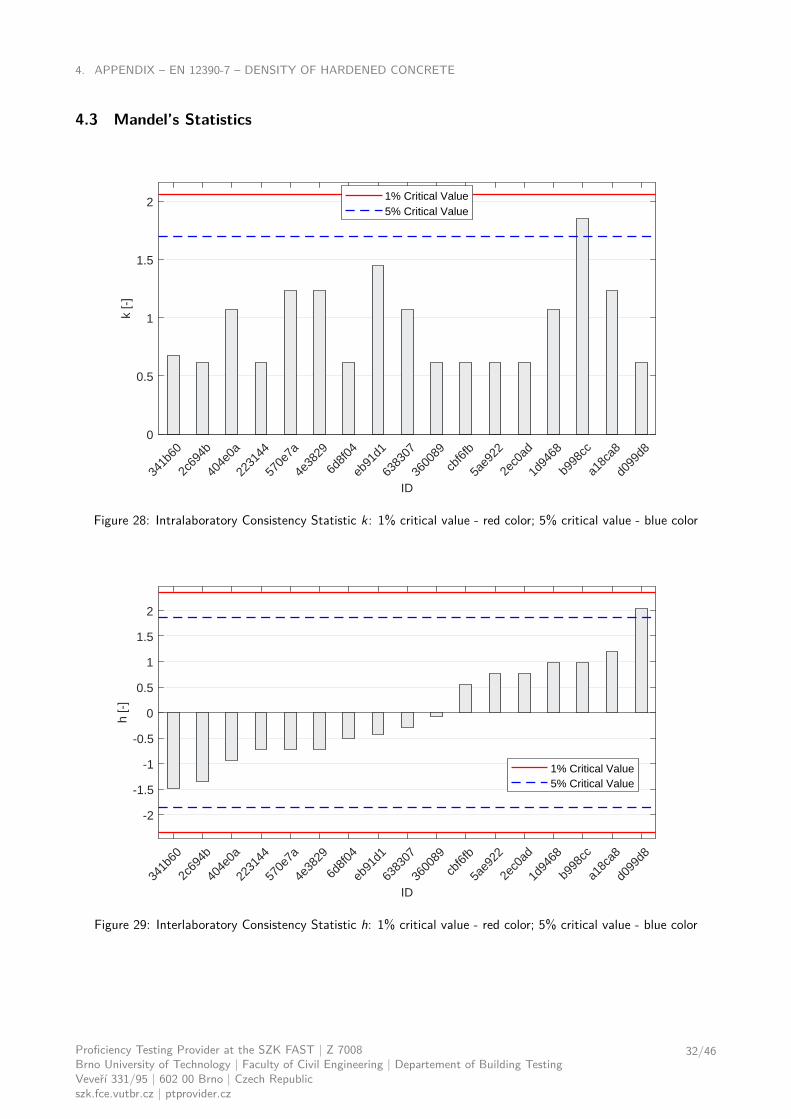
3.4 EN 12390-7 – Density of hardened concreteThe test results are shown together with graphic presentation and evaluated statistical characteristics in part 4of the Appendix. A numerical critical evaluation (Grubbs’ and Cochran’s test) did not indicate any exceedance ofcritical values.
Graphical determination of the consistency of laboratories (Mandel’s statistics) has shown an exceedance of thecritical value in the test results from some participants. The exceedance of the critical values of Mandel’s statisticsdoes not indicate that the results of the laboratories concerned are wrong; it only suggests minor inconsistencies.None of the participants were therefore excluded.
The assigned value and its uncertainty was determined using the A algorithm (ISO 13258 [16]). The results ofall participants did not exceed the limit value of z − score = 2 and thus can be rated as satisfactory.
3.5 ISO 1920-10 – Determination of static modulus of elasticity in compressionThis part of PT program was not open due to low number of participants.
3.6 EN 12390-13 – method A – Determination of secant modulus of elasticity in com-pression
This part of PT program was not open due to low number of participants.
3.7 EN 12390-13 – method B – Determination of secant modulus of elasticity in com-pression
This part of PT program was not open due to low number of participants.
3.8 EN 12504-4, ČSN 731371 – Non-destructive testing of concreteThis part of PT program was not open due to low number of participants.
3.9 ČSN 731373, EN 12504-2 – Determination of rebound numberThe test results are shown together with graphic presentation and evaluated statistical characteristics in part 9 ofthe Appendix.
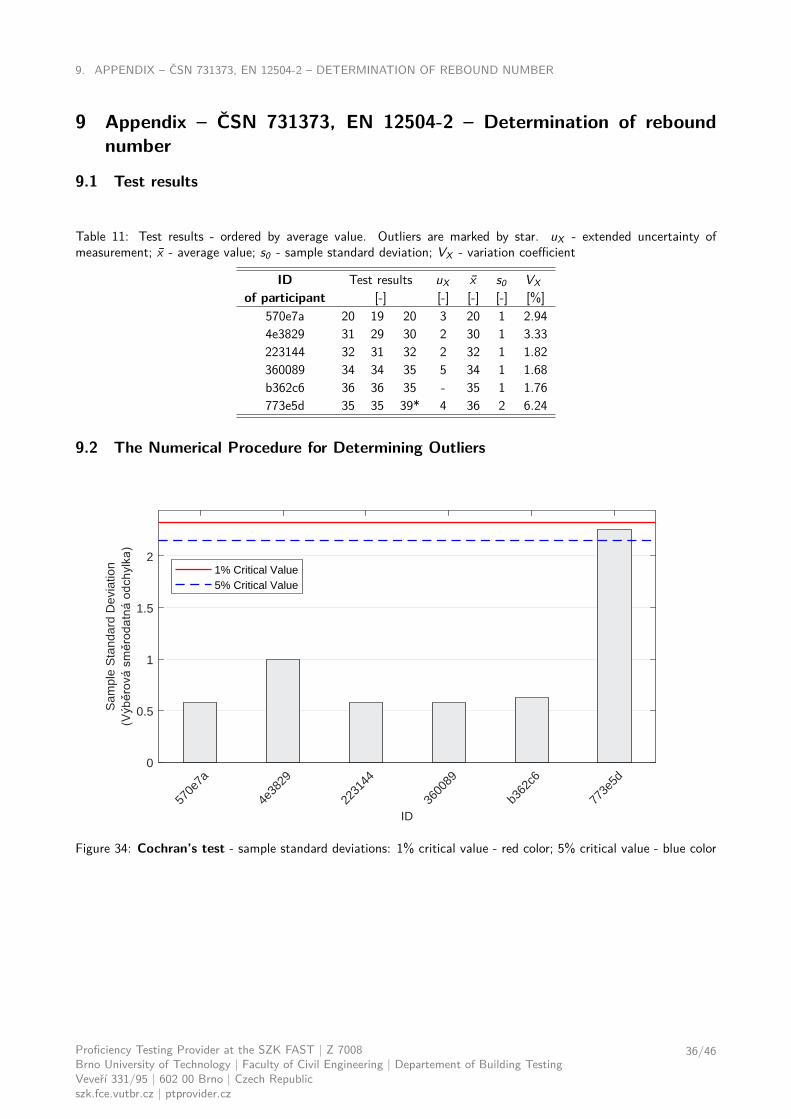
The numerical critical evaluation of the test results using Cochran’s test has shown that results of participant773e5d exceeded the 5% critical value. A more detailed analysis has revealed that the outlying variability of theseparticipants was caused by two test result only; after its removal the critical values of Cochran’s test were nolonger exceeded. Participant 773e5d was not therefore excluded. Numerical critical evaluation of the test resultsusing Grubbs’ test shown that results of participant 570e7a exceeded the 5% critical value. The test results of thisparticipant were considered to be divergent.
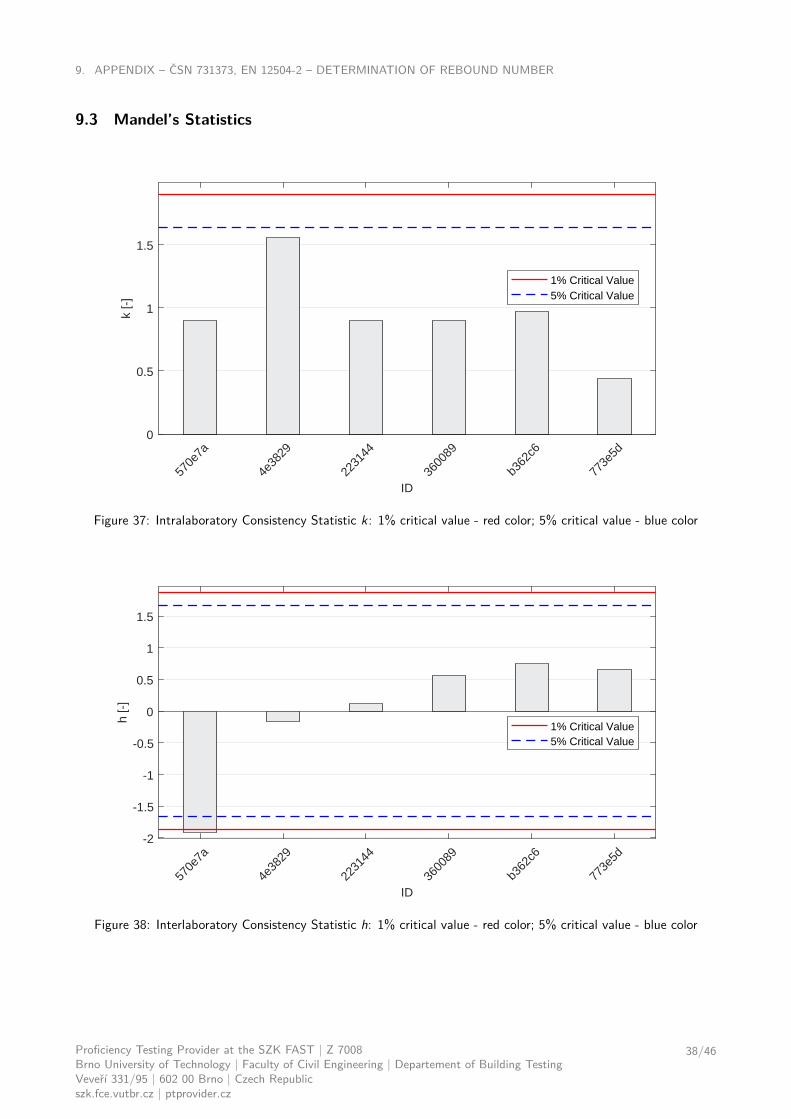
Graphical determination of the consistency of laboratories (Mandel’s statistics) has shown an exceedance of thecritical value in the test results from some participants. The exceedance of the critical values of Mandel’s statisticsdoes not indicate that the results of the laboratories concerned are wrong; it only suggests minor inconsistencies.None of the participants were therefore excluded.
The assigned value and its uncertainty was determined using the A algorithm (ISO 13258 [16]). The limit valuez − score = 3 was exceeded in the case of participant No 570e7a. The performance of this participant was ratedas unsatisfactory. The results of all other participants did not exceed the limit value of z − score = 2 and thuscan be rated as satisfactory.
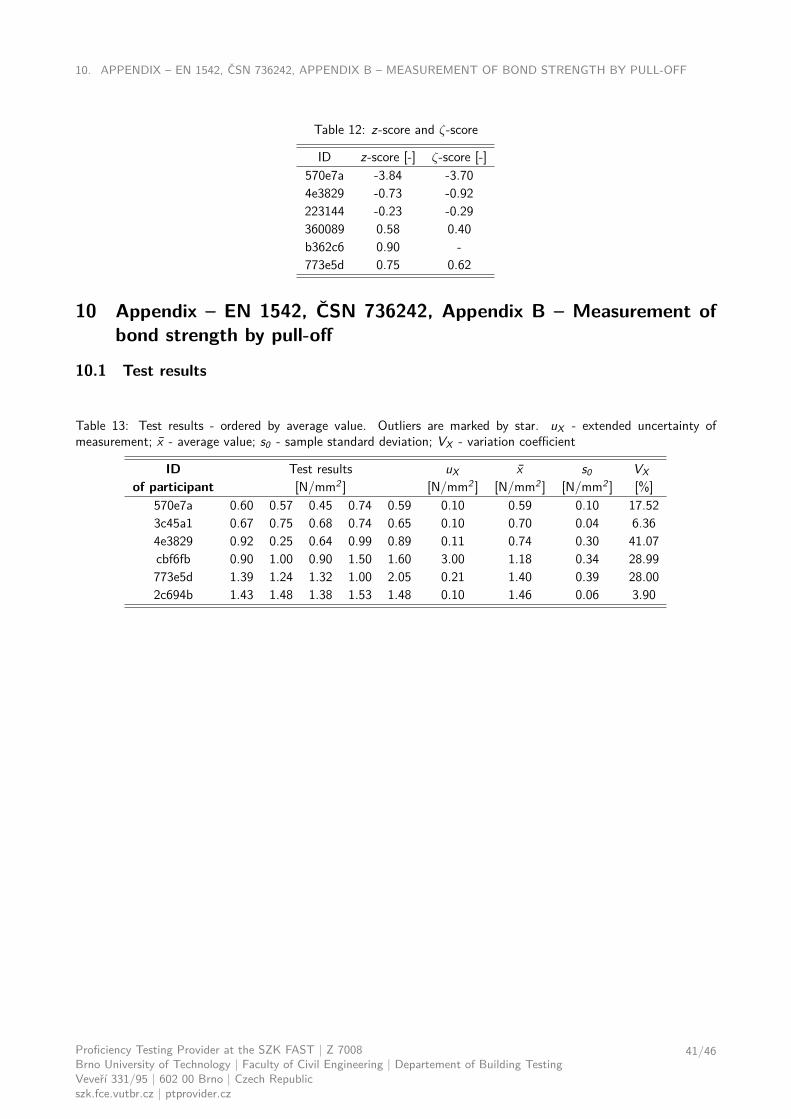
3.10 EN 1542, ČSN 736242 – Appendix B – Measurement of bond strength by pull-offThe test results are shown together with graphic presentation and evaluated statistical characteristics in part 10 ofthe Appendix. The graphical and numerical critical evaluation did not indicate any exceedance of critical values.
The assigned value and its uncertainty was determined using the A algorithm (ISO 13258 [16]). The results ofall participants did not exceed the limit value of z − score = 2 and thus can be rated as satisfactory.
Proficiency Testing Provider at the SZK FAST | Z 7008Brno University of Technology | Faculty of Civil Engineering | Departement of Building TestingVeveří 331/95 | 602 00 Brno | Czech Republicszk.fce.vutbr.cz | ptprovider.cz
12/46
REFERENCES
References[1] EN 12390-3. Testing hardened concrete - Part 3: Compressive strength of test specimens. 2009.[2] EN 12390-5. Testing hardened concrete - Part 5: Flexural strength of test specimens. 2009.[3] EN 12390-6. Testing hardened concrete - Part 6: Tensile splitting strength of test specimens. 2010.[4] EN 12390-7. Testing hardened concrete - Part 7: Density of hardened concrete. 2009.[5] ISO 1920-10. Testing of concrete - Part 10: Determination of static modulus of elasticity in compression. 2016.[6] EN 12390-13. Testing hardened concrete - Part 13: Determination of secant modulus of elasticity in compres-
sion. 2014.[7] EN 12504-4. Testing concrete - Part 4: Determination of ultrasonic pulse velocity. 2005.[8] ČSN 731371. Non-destructive testing of concrete - Method of ultrasonic pulse testing of concrete. 2011.[9] ČSN 731373. Non-destructive testing of concrete - Determination of compressive strength by hardness testing
methods. 2011.[10] EN 12504-2. Testing concrete in structures - Part 2: Non-destructive testing - Determination of rebound
number. 2013.[11] EN 1542. Products and systems for the protection and repair of concrete structures - Test methods - Measure-
ment of bond strength by pull-off. 2000.[12] ČSN 736242. Design and construction of pavements on road bridges. 2010.[13] EN 206. Concrete - Specification, performance, production and conformity. 2014.[14] ISO 5725-2. Accuracy (trueness and precision) of measurement methods and results - Part 2: Basic method
for the determination of repeatability and reproducibility of a standard measurement method. 1997.[15] EN ISO/IEC 17043. Conformity assessment - General requirements for proficiency testing. 2010.[16] ISO 13 528. Statistical methods for use in proficiency testing by interlaboratory comparisons. 2005.[17] ISO 5725-5. Accuracy (trueness and precision) of measurement methods and results - Part 5: Alternative
methods for the determination of the precision of a standard measurement method. 1999.[18] EA 4/02. Vyjadřování nejistot měření při kalibracích. 2000.
Proficiency Testing Provider at the SZK FAST | Z 7008Brno University of Technology | Faculty of Civil Engineering | Departement of Building TestingVeveří 331/95 | 602 00 Brno | Czech Republicszk.fce.vutbr.cz | ptprovider.cz
13/46

1. APPENDIX – EN 12390-3 – COMPRESSIVE STRENGTH OF TEST SPECIMENS
1 Appendix – EN 12390-3 – Compressive strength of test specimens
1.1 Test results
Table 3: Test results - ordered by average value. Outliers are marked by star. uX - extended uncertainty ofmeasurement; x - average value; s0 - sample standard deviation; VX - variation coefficient
ID Test results uX x s0 VXof participant [N/mm2 ] [N/mm2 ] [N/mm2 ] [N/mm2 ] [%]
eb91d1 28.1 26.5 28.0 0.5 27.5 0.9 3.266d8f04 28.2 28.8 29.0 - 28.7 0.4 1.45da8a4c 28.3 29.0 29.9 2.6 29.1 0.8 2.76953526 29.2 29.6 30.5 1.0 29.8 0.7 2.24341b60 29.4 30.8 29.5 0.9 29.9 0.8 2.61cbf6fb 29.5 30.6 29.7 0.4 29.9 0.6 1.96570e7a 30.1 31.3 29.7 1.6 30.4 0.8 2.744e3829 30.6 30.6 30.2 1.7 30.5 0.2 0.76404e0a 31.2 28.8 32.2 1.4 30.7 1.7 5.69638307 31.1 30.8 30.7 1.9 30.9 0.2 0.679d28a2 30.4 31.3 31.9 0.9 31.2 0.7 2.34b362c6 33.0 30.2 30.6 - 31.3 1.5 4.843a3339 30.4 33.2 30.5 1.6 31.4 1.6 5.06f00261 30.4 32.5 31.3 1.4 31.4 1.1 3.362c694b 31.6 31.1 31.6 1.7 31.4 0.3 0.922ec0ad 31.3 32.0 31.2 1.1 31.5 0.4 1.38a18ca8 31.6 31.2 31.8 1.0 31.5 0.3 0.97223144 31.3 30.8 32.7 1.3 31.6 1.0 3.125034d7 32.0 32.2 31.7 1.2 32.0 0.3 0.795ae922 31.4 31.9 32.8 0.8 32.0 0.7 2.21d099d8 32.9 31.3 33.6 2.1 32.6 1.2 3.621d9468 34.1 32.4 32.5 0.4 33.0 1.0 2.89b998cc 33.4 33.8 33.1 0.4 33.4 0.4 1.05
Proficiency Testing Provider at the SZK FAST | Z 7008Brno University of Technology | Faculty of Civil Engineering | Departement of Building TestingVeveří 331/95 | 602 00 Brno | Czech Republicszk.fce.vutbr.cz | ptprovider.cz
14/46

1. APPENDIX – EN 12390-3 – COMPRESSIVE STRENGTH OF TEST SPECIMENS
1.2 The Numerical Procedure for Determining Outliers
eb91
d1
6d8f
04
da8a
4c
9535
26
341b
60
cbf6
fb
570e
7a
4e38
29
404e
0a
6383
07
9d28
a2
b362
c6
3a33
39
f002
61
2c69
4b
2ec0
ad
a18c
a8
2231
44
5034
d7
5ae9
22
d099
d8
1d94
68
b998
cc
ID
0
0.5
1
1.5
2
Sam
ple
Sta
ndar
d D
evia
tion 1% Critical Value
5% Critical Value
Figure 1: Cochran’s test - sample standard deviations: 1% critical value - red color; 5% critical value - blue color
eb91
d1
6d8f
04
da8a
4c
9535
26
341b
60
cbf6
fb
570e
7a
4e38
29
404e
0a
6383
07
9d28
a2
b362
c6
3a33
39
f002
61
2c69
4b
2ec0
ad
a18c
a8
2231
44
5034
d7
5ae9
22
d099
d8
1d94
68
b998
cc
ID
27
28
29
30
31
32
33
34
35
[N/m
m2 ]
1% Critical Value5% Critical ValueAverage Value
Figure 2: Grubbs’ test - average values: 1% critical value - red color; 5% critical value - blue color
Proficiency Testing Provider at the SZK FAST | Z 7008Brno University of Technology | Faculty of Civil Engineering | Departement of Building TestingVeveří 331/95 | 602 00 Brno | Czech Republicszk.fce.vutbr.cz | ptprovider.cz
15/46
1. APPENDIX – EN 12390-3 – COMPRESSIVE STRENGTH OF TEST SPECIMENS
1.3 Mandel’s Statistics
eb91
d1
6d8f
04
da8a
4c
9535
26
341b
60
cbf6
fb
570e
7a
4e38
29
404e
0a
6383
07
9d28
a2
b362
c6
3a33
39
f002
61
2c69
4b
2ec0
ad
a18c
a8
2231
44
5034
d7
5ae9
22
d099
d8
1d94
68
b998
cc
ID
0
0.5
1
1.5
2
k [-
]
1% Critical Value5% Critical Value
Figure 3: Intralaboratory Consistency Statistic k: 1% critical value - red color; 5% critical value - blue color
eb91
d1
6d8f
04
da8a
4c
9535
26
341b
60
cbf6
fb
570e
7a
4e38
29
404e
0a
6383
07
9d28
a2
b362
c6
3a33
39
f002
61
2c69
4b
2ec0
ad
a18c
a8
2231
44
5034
d7
5ae9
22
d099
d8
1d94
68
b998
cc
ID
-2
-1
0
1
2
h [-
]
1% Critical Value5% Critical Value
Figure 4: Interlaboratory Consistency Statistic h: 1% critical value - red color; 5% critical value - blue color
Proficiency Testing Provider at the SZK FAST | Z 7008Brno University of Technology | Faculty of Civil Engineering | Departement of Building TestingVeveří 331/95 | 602 00 Brno | Czech Republicszk.fce.vutbr.cz | ptprovider.cz
16/46

1. APPENDIX – EN 12390-3 – COMPRESSIVE STRENGTH OF TEST SPECIMENS
1.4 Calculation of Performance Statistics
eb91
d1
6d8f
04
da8a
4c
9535
26
341b
60
cbf6
fb
570e
7a
4e38
29
404e
0a
6383
07
9d28
a2
b362
c6
3a33
39
f002
61
2c69
4b
2ec0
ad
a18c
a8
2231
44
5034
d7
5ae9
22
d099
d8
1d94
68
b998
cc
ID
26
27
28
29
30
31
32
33
34
[N/m
m2 ]
z-score = 2z-score = 3
Figure 5: Average values and sample standard deviations
eb91
d1
6d8f
04
da8a
4c
9535
26
341b
60
cbf6
fb
570e
7a
4e38
29
404e
0a
6383
07
9d28
a2
b362
c6
3a33
39
f002
61
2c69
4b
2ec0
ad
a18c
a8
2231
44
5034
d7
5ae9
22
d099
d8
1d94
68
b998
cc
ID
26
27
28
29
30
31
32
33
34
35
[N/m
m2 ]
z-score = 2z-score = 3
Figure 6: Average values and extended uncertainties of measurement
Proficiency Testing Provider at the SZK FAST | Z 7008Brno University of Technology | Faculty of Civil Engineering | Departement of Building TestingVeveří 331/95 | 602 00 Brno | Czech Republicszk.fce.vutbr.cz | ptprovider.cz
17/46

1. APPENDIX – EN 12390-3 – COMPRESSIVE STRENGTH OF TEST SPECIMENS
25 26 27 28 29 30 31 32 33 34 35
[N/mm2]
0
5
10
15
20
25
30
35
Figure 7: Histogram of all test results
eb91
d1
6d8f
04
da8a
4c
9535
26
341b
60
cbf6
fb
570e
7a
4e38
29
404e
0a
6383
07
9d28
a2
b362
c6
3a33
39
f002
61
2c69
4b
2ec0
ad
a18c
a8
2231
44
5034
d7
5ae9
22
d099
d8
1d94
68
b998
cc
ID
-8
-6
-4
-2
0
2
4
6
z-sc
ore
/ -s
core
z-score-score
Figure 8: z-score and ζ-score
Proficiency Testing Provider at the SZK FAST | Z 7008Brno University of Technology | Faculty of Civil Engineering | Departement of Building TestingVeveří 331/95 | 602 00 Brno | Czech Republicszk.fce.vutbr.cz | ptprovider.cz
18/46

2. APPENDIX – EN 12390-5 – FLEXURAL STRENGTH OF TEST SPECIMENS
Table 4: z-score and ζ-score
ID z-score [-] ζ-score [-]eb91d1 -2.93 -6.296d8f04 -1.99 -da8a4c -1.66 -0.76953526 -1.07 -1.21341b60 -0.96 -1.21cbf6fb -0.93 -2.13570e7a -0.57 -0.414e3829 -0.49 -0.34404e0a -0.27 -0.22638307 -0.16 -0.109d28a2 0.13 0.17b362c6 0.18 -3a3339 0.26 0.19f00261 0.29 0.252c694b 0.32 0.222ec0ad 0.37 0.39a18ca8 0.40 0.46223144 0.46 0.415034d7 0.76 0.745ae922 0.82 1.14d099d8 1.29 0.731d9468 1.62 4.13b998cc 1.98 4.96
2 Appendix – EN 12390-5 – Flexural strength of test specimens
2.1 Test results
Table 5: Test results - ordered by average value. Outliers are marked by star. uX - extended uncertainty ofmeasurement; x - average value; s0 - sample standard deviation; VX - variation coefficient
ID Test results uX x s0 VXof participant [N/mm2 ] [N/mm2 ] [N/mm2 ] [N/mm2 ] [%]
3c45a1 4.3 4.6 4.7 0.1 4.5 0.2 3.862c694b 4.4 4.3 5.0 1.2 4.6 0.4 8.29f00261 4.5 4.7 4.6 0.1 4.6 0.1 1.85e48ade 4.9 5.0 4.8 0.3 4.9 0.1 2.04638307 4.9 5.1 5.3 0.3 5.1 0.2 3.926d8f04 5.0 5.0 5.3 - 5.1 0.2 3.403a3339 5.1 5.4 5.5 0.2 5.3 0.2 3.90570e7a 5.9 6.0 5.5 0.7 5.8 0.3 4.40065959 6.7* 5.3 5.7 1.9 5.9 0.7 12.22f56fc9 6.0 6.2 6.2 0.3 6.1 0.1 1.88404e0a 6.8 6.1 6.3 0.1 6.4 0.4 5.6347a8df 8.3 8.2 8.4 0.3 8.3 0.1 1.20
Proficiency Testing Provider at the SZK FAST | Z 7008Brno University of Technology | Faculty of Civil Engineering | Departement of Building TestingVeveří 331/95 | 602 00 Brno | Czech Republicszk.fce.vutbr.cz | ptprovider.cz
19/46

2. APPENDIX – EN 12390-5 – FLEXURAL STRENGTH OF TEST SPECIMENS
2.2 The Numerical Procedure for Determining Outliers
3c45
a1
2c69
4b
f002
61
e48a
de
6383
07
6d8f
04
3a33
39
570e
7a
0659
59
f56f
c9
404e
0a
47a8
df
ID
0
0.1
0.2
0.3
0.4
0.5
0.6
0.7
Sam
ple
Sta
ndar
d D
evia
tion 1% Critical Value
5% Critical Value
Figure 9: Cochran’s test - sample standard deviations: 1% critical value - red color; 5% critical value - blue color
3c45
a1
2c69
4b
f002
61
e48a
de
6383
07
6d8f
04
3a33
39
570e
7a
0659
59
f56f
c9
404e
0a
47a8
df
ID
0
0.1
0.2
0.3
0.4
0.5
Sam
ple
Sta
ndar
d D
evia
tion 1% Critical Value
5% Critical Value
Figure 10: Cochran’s test - sample standard deviations without outliers: 1% critical value - red color; 5% criticalvalue - blue color
Proficiency Testing Provider at the SZK FAST | Z 7008Brno University of Technology | Faculty of Civil Engineering | Departement of Building TestingVeveří 331/95 | 602 00 Brno | Czech Republicszk.fce.vutbr.cz | ptprovider.cz
20/46

2. APPENDIX – EN 12390-5 – FLEXURAL STRENGTH OF TEST SPECIMENS
3c45
a1
2c69
4b
f002
61
e48a
de
6383
07
6d8f
04
3a33
39
0659
59
570e
7a
f56f
c9
404e
0a
47a8
df
ID
3
4
5
6
7
8
[N/m
m2 ]
1% Critical Value5% Critical ValueAverage Value
Figure 11: Grubbs’ test - average values: 1% critical value - red color; 5% critical value - blue color
2.3 Mandel’s Statistics
3c45
a1
2c69
4b
f002
61
e48a
de
6383
07
6d8f
04
3a33
39
0659
59
570e
7a
f56f
c9
404e
0a
47a8
df
ID
0
0.5
1
1.5
2
k [-
]
1% Critical Value5% Critical Value
Figure 12: Intralaboratory Consistency Statistic k: 1% critical value - red color; 5% critical value - blue color
Proficiency Testing Provider at the SZK FAST | Z 7008Brno University of Technology | Faculty of Civil Engineering | Departement of Building TestingVeveří 331/95 | 602 00 Brno | Czech Republicszk.fce.vutbr.cz | ptprovider.cz
21/46
2. APPENDIX – EN 12390-5 – FLEXURAL STRENGTH OF TEST SPECIMENS
3c45
a1
2c69
4b
f002
61
e48a
de
6383
07
6d8f
04
3a33
39
0659
59
570e
7a
f56f
c9
404e
0a
47a8
df
ID
-2
-1
0
1
2
h [-
]
1% Critical Value5% Critical Value
Figure 13: Interlaboratory Consistency Statistic h: 1% critical value - red color; 5% critical value - blue color
2.4 Calculation of Performance Statistics
3c45
a1
2c69
4b
f002
61
e48a
de
6383
07
6d8f
04
3a33
39
0659
59
570e
7a
f56f
c9
404e
0a
47a8
df
ID
3
4
5
6
7
8
[N/m
m2 ]
z-score = 2z-score = 3
Figure 14: Average values and sample standard deviations
Proficiency Testing Provider at the SZK FAST | Z 7008Brno University of Technology | Faculty of Civil Engineering | Departement of Building TestingVeveří 331/95 | 602 00 Brno | Czech Republicszk.fce.vutbr.cz | ptprovider.cz
22/46

2. APPENDIX – EN 12390-5 – FLEXURAL STRENGTH OF TEST SPECIMENS
3c45
a1
2c69
4b
f002
61
e48a
de
6383
07
6d8f
04
3a33
39
0659
59
570e
7a
f56f
c9
404e
0a
47a8
df
ID
3
4
5
6
7
8
9[N
/mm
2 ]
z-score = 2z-score = 3
Figure 15: Average values and extended uncertainties of measurement
2 3 4 5 6 7 8 9
[N/mm2]
0
5
10
15
Figure 16: Histogram of all test results
Proficiency Testing Provider at the SZK FAST | Z 7008Brno University of Technology | Faculty of Civil Engineering | Departement of Building TestingVeveří 331/95 | 602 00 Brno | Czech Republicszk.fce.vutbr.cz | ptprovider.cz
23/46

2. APPENDIX – EN 12390-5 – FLEXURAL STRENGTH OF TEST SPECIMENS
3c45
a1
2c69
4b
f002
61
e48a
de
6383
07
6d8f
04
3a33
39
0659
59
570e
7a
f56f
c9
404e
0a
47a8
df
ID
-3
-2
-1
0
1
2
3
4
5
6
7z-
scor
e /
-sco
re
z-score-score
Figure 17: z-score and ζ-score
Table 6: z-score and ζ-score
ID z-score [-] ζ-score [-]3c45a1 -1.03 -2.792c694b -1.01 -0.66f00261 -0.97 -2.46e48ade -0.59 -1.14638307 -0.35 -0.676d8f04 -0.35 -3a3339 -0.06 -0.12065959 0.15 0.06570e7a 0.52 0.58f56fc9 0.94 1.81404e0a 1.27 3.1747a8df 3.63 7.00
Proficiency Testing Provider at the SZK FAST | Z 7008Brno University of Technology | Faculty of Civil Engineering | Departement of Building TestingVeveří 331/95 | 602 00 Brno | Czech Republicszk.fce.vutbr.cz | ptprovider.cz
24/46

3. APPENDIX – EN 12390-6 – TENSILE SPLITTING STRENGTH OF TEST SPECIMENS
3 Appendix – EN 12390-6 – Tensile splitting strength of test specimens
3.1 Test results
Table 7: Test results - ordered by average value. Outliers are marked by star. uX - extended uncertainty ofmeasurement; x - average value; s0 - sample standard deviation; VX - variation coefficient
ID Test results uX x s0 VXof participant [N/mm2 ] [N/mm2 ] [N/mm2 ] [N/mm2 ] [%]
f00261 3.12 2.68 2.84 0.15 2.88 0.22 7.73570e7a 3.15 3.05 2.95 0.19 3.05 0.10 3.286d8f04 3.20 3.25 3.30 - 3.25 0.05 1.5447a8df 3.25 3.35 3.15 0.20 3.25 0.10 3.084e3829 3.24 3.46 3.21 0.15 3.30 0.14 4.133a3339 3.55 3.10 3.45 0.24 3.37 0.24 7.02
3.2 The Numerical Procedure for Determining Outliers
f002
61
570e
7a
6d8f
04
47a8
df
4e38
29
3a33
39
ID
0
0.05
0.1
0.15
0.2
0.25
0.3
Sam
ple
Sta
ndar
d D
evia
tion
1% Critical Value5% Critical Value
Figure 18: Cochran’s test - sample standard deviations: 1% critical value - red color; 5% critical value - blue color
Proficiency Testing Provider at the SZK FAST | Z 7008Brno University of Technology | Faculty of Civil Engineering | Departement of Building TestingVeveří 331/95 | 602 00 Brno | Czech Republicszk.fce.vutbr.cz | ptprovider.cz
25/46

3. APPENDIX – EN 12390-6 – TENSILE SPLITTING STRENGTH OF TEST SPECIMENS
f002
61
570e
7a
6d8f
04
47a8
df
4e38
29
3a33
39
ID
2.8
2.9
3
3.1
3.2
3.3
3.4
3.5
3.6
[N/m
m2 ]
1% Critical Value5% Critical ValueAverage Value
Figure 19: Grubbs’ test - average values: 1% critical value - red color; 5% critical value - blue color
3.3 Mandel’s Statistics
f002
61
570e
7a
6d8f
04
47a8
df
4e38
29
3a33
39
ID
0
0.5
1
1.5
k [-
]
1% Critical Value5% Critical Value
Figure 20: Intralaboratory Consistency Statistic k: 1% critical value - red color; 5% critical value - blue color
Proficiency Testing Provider at the SZK FAST | Z 7008Brno University of Technology | Faculty of Civil Engineering | Departement of Building TestingVeveří 331/95 | 602 00 Brno | Czech Republicszk.fce.vutbr.cz | ptprovider.cz
26/46

3. APPENDIX – EN 12390-6 – TENSILE SPLITTING STRENGTH OF TEST SPECIMENS
f002
61
570e
7a
6d8f
04
47a8
df
4e38
29
3a33
39
ID
-1.5
-1
-0.5
0
0.5
1
1.5
h [-
]
1% Critical Value5% Critical Value
Figure 21: Interlaboratory Consistency Statistic h: 1% critical value - red color; 5% critical value - blue color
3.4 Calculation of Performance Statistics
f002
61
570e
7a
6d8f
04
47a8
df
4e38
29
3a33
39
ID
2.6
2.8
3
3.2
3.4
3.6
3.8
[N/m
m2 ]
z-score = 2z-score = 3
Figure 22: Average values and sample standard deviations
Proficiency Testing Provider at the SZK FAST | Z 7008Brno University of Technology | Faculty of Civil Engineering | Departement of Building TestingVeveří 331/95 | 602 00 Brno | Czech Republicszk.fce.vutbr.cz | ptprovider.cz
27/46

3. APPENDIX – EN 12390-6 – TENSILE SPLITTING STRENGTH OF TEST SPECIMENS
f002
61
570e
7a
6d8f
04
47a8
df
4e38
29
3a33
39
ID
2.6
2.8
3
3.2
3.4
3.6
3.8[N
/mm
2 ]
z-score = 2z-score = 3
Figure 23: Average values and extended uncertainties of measurement
2.5 3 3.5 4
[N/mm2]
0
1
2
3
4
5
6
7
Figure 24: Histogram of all test results
Proficiency Testing Provider at the SZK FAST | Z 7008Brno University of Technology | Faculty of Civil Engineering | Departement of Building TestingVeveří 331/95 | 602 00 Brno | Czech Republicszk.fce.vutbr.cz | ptprovider.cz
28/46

3. APPENDIX – EN 12390-6 – TENSILE SPLITTING STRENGTH OF TEST SPECIMENS
f002
61
570e
7a
6d8f
04
47a8
df
4e38
29
3a33
39
ID
-3
-2
-1
0
1
2
3z-
scor
e /
-sco
re
z-score-score
Figure 25: z-score and ζ-score
Table 8: z-score and ζ-score
ID z-score [-] ζ-score [-]f00261 -2.33 -2.01570e7a -1.15 -0.816d8f04 0.24 -47a8df 0.24 0.164e3829 0.61 0.533a3339 1.05 0.60
Proficiency Testing Provider at the SZK FAST | Z 7008Brno University of Technology | Faculty of Civil Engineering | Departement of Building TestingVeveří 331/95 | 602 00 Brno | Czech Republicszk.fce.vutbr.cz | ptprovider.cz
29/46
4. APPENDIX – EN 12390-7 – DENSITY OF HARDENED CONCRETE
4 Appendix – EN 12390-7 – Density of hardened concrete
4.1 Test results
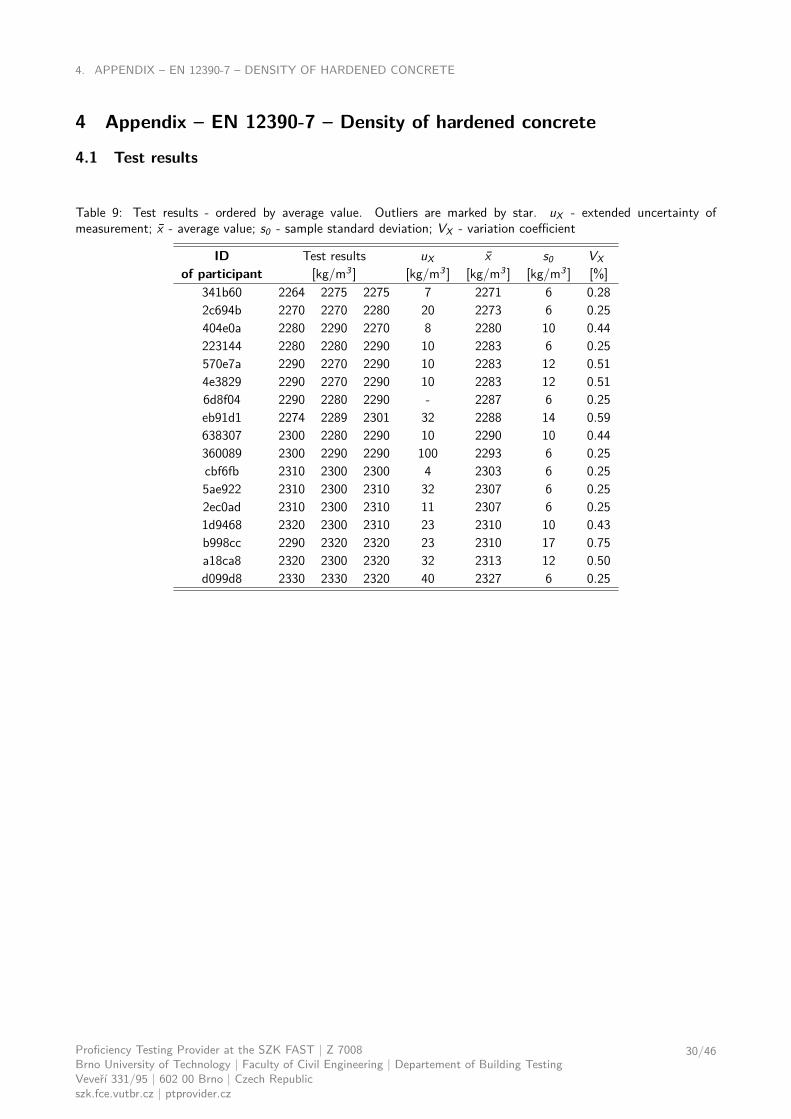
Table 9: Test results - ordered by average value. Outliers are marked by star. uX - extended uncertainty ofmeasurement; x - average value; s0 - sample standard deviation; VX - variation coefficient
ID Test results uX x s0 VXof participant [kg/m3 ] [kg/m3 ] [kg/m3 ] [kg/m3 ] [%]
341b60 2264 2275 2275 7 2271 6 0.282c694b 2270 2270 2280 20 2273 6 0.25404e0a 2280 2290 2270 8 2280 10 0.44223144 2280 2280 2290 10 2283 6 0.25570e7a 2290 2270 2290 10 2283 12 0.514e3829 2290 2270 2290 10 2283 12 0.516d8f04 2290 2280 2290 - 2287 6 0.25eb91d1 2274 2289 2301 32 2288 14 0.59638307 2300 2280 2290 10 2290 10 0.44360089 2300 2290 2290 100 2293 6 0.25cbf6fb 2310 2300 2300 4 2303 6 0.255ae922 2310 2300 2310 32 2307 6 0.252ec0ad 2310 2300 2310 11 2307 6 0.251d9468 2320 2300 2310 23 2310 10 0.43b998cc 2290 2320 2320 23 2310 17 0.75a18ca8 2320 2300 2320 32 2313 12 0.50d099d8 2330 2330 2320 40 2327 6 0.25
Proficiency Testing Provider at the SZK FAST | Z 7008Brno University of Technology | Faculty of Civil Engineering | Departement of Building TestingVeveří 331/95 | 602 00 Brno | Czech Republicszk.fce.vutbr.cz | ptprovider.cz
30/46
4. APPENDIX – EN 12390-7 – DENSITY OF HARDENED CONCRETE
4.2 The Numerical Procedure for Determining Outliers
341b
60
2c69
4b
404e
0a
2231
44
570e
7a
4e38
29
6d8f
04
eb91
d1
6383
07
3600
89
cbf6
fb
5ae9
22
2ec0
ad
1d94
68
b998
cc
a18c
a8
d099
d8
ID
0
5
10
15
20
Sam
ple
Sta
ndar
d D
evia
tion
1% Critical Value5% Critical Value
Figure 26: Cochran’s test - sample standard deviations: 1% critical value - red color; 5% critical value - blue color
341b
60
2c69
4b
404e
0a
2231
44
570e
7a
4e38
29
6d8f
04
eb91
d1
6383
07
3600
89
cbf6
fb
5ae9
22
2ec0
ad
1d94
68
b998
cc
a18c
a8
d099
d8
ID
2220
2240
2260
2280
2300
2320
2340
2360
2380
[kg/
m3 ]
1% Critical Value5% Critical ValueAverage Value
Figure 27: Grubbs’ test - average values: 1% critical value - red color; 5% critical value - blue color
Proficiency Testing Provider at the SZK FAST | Z 7008Brno University of Technology | Faculty of Civil Engineering | Departement of Building TestingVeveří 331/95 | 602 00 Brno | Czech Republicszk.fce.vutbr.cz | ptprovider.cz
31/46
4. APPENDIX – EN 12390-7 – DENSITY OF HARDENED CONCRETE
4.3 Mandel’s Statistics
341b
60
2c69
4b
404e
0a
2231
44
570e
7a
4e38
29
6d8f
04
eb91
d1
6383
07
3600
89
cbf6
fb
5ae9
22
2ec0
ad
1d94
68
b998
cc
a18c
a8
d099
d8
ID
0
0.5
1
1.5
2
k [-
]
1% Critical Value5% Critical Value
Figure 28: Intralaboratory Consistency Statistic k: 1% critical value - red color; 5% critical value - blue color
341b
60
2c69
4b
404e
0a
2231
44
570e
7a
4e38
29
6d8f
04
eb91
d1
6383
07
3600
89
cbf6
fb
5ae9
22
2ec0
ad
1d94
68
b998
cc
a18c
a8
d099
d8
ID
-2
-1.5
-1
-0.5
0
0.5
1
1.5
2
h [-
]
1% Critical Value5% Critical Value
Figure 29: Interlaboratory Consistency Statistic h: 1% critical value - red color; 5% critical value - blue color
Proficiency Testing Provider at the SZK FAST | Z 7008Brno University of Technology | Faculty of Civil Engineering | Departement of Building TestingVeveří 331/95 | 602 00 Brno | Czech Republicszk.fce.vutbr.cz | ptprovider.cz
32/46

4. APPENDIX – EN 12390-7 – DENSITY OF HARDENED CONCRETE
4.4 Calculation of Performance Statistics
341b
60
2c69
4b
404e
0a
2231
44
570e
7a
4e38
29
6d8f
04
eb91
d1
6383
07
3600
89
cbf6
fb
5ae9
22
2ec0
ad
1d94
68
b998
cc
a18c
a8
d099
d8
ID
2260
2280
2300
2320
2340
[kg/
m3 ]
z-score = 2z-score = 3
Figure 30: Average values and sample standard deviations
341b
60
2c69
4b
404e
0a
2231
44
570e
7a
4e38
29
6d8f
04
eb91
d1
6383
07
3600
89
cbf6
fb
5ae9
22
2ec0
ad
1d94
68
b998
cc
a18c
a8
d099
d8
ID
2150
2200
2250
2300
2350
2400
[kg/
m3 ]
z-score = 2z-score = 3
Figure 31: Average values and extended uncertainties of measurement
Proficiency Testing Provider at the SZK FAST | Z 7008Brno University of Technology | Faculty of Civil Engineering | Departement of Building TestingVeveří 331/95 | 602 00 Brno | Czech Republicszk.fce.vutbr.cz | ptprovider.cz
33/46

4. APPENDIX – EN 12390-7 – DENSITY OF HARDENED CONCRETE
2240 2260 2280 2300 2320 2340 2360
[kg/m3]
0
5
10
15
20
25
Figure 32: Histogram of all test results
341b
60
2c69
4b
404e
0a
2231
44
570e
7a
4e38
29
6d8f
04
eb91
d1
6383
07
3600
89
cbf6
fb
5ae9
22
2ec0
ad
1d94
68
b998
cc
a18c
a8
d099
d8
ID
-3
-2
-1
0
1
2
3
z-sc
ore
/ -s
core
z-score-score
Figure 33: z-score and ζ-score
Proficiency Testing Provider at the SZK FAST | Z 7008Brno University of Technology | Faculty of Civil Engineering | Departement of Building TestingVeveří 331/95 | 602 00 Brno | Czech Republicszk.fce.vutbr.cz | ptprovider.cz
34/46

5. APPENDIX – ISO 1920-10 – DETERMINATION OF STATIC MODULUS OF ELASTICITY IN COMPRESSION
Table 10: z-score and ζ-score
ID z-score [-] ζ-score [-]341b60 -1.36 -2.642c694b -1.24 -1.01404e0a -0.85 -1.50223144 -0.65 -0.97570e7a -0.65 -0.944e3829 -0.65 -0.976d8f04 -0.45 -eb91d1 -0.37 -0.19638307 -0.25 -0.38360089 -0.05 -0.01cbf6fb 0.54 1.445ae922 0.74 0.382ec0ad 0.74 1.021d9468 0.94 0.67b998cc 0.94 0.67a18ca8 1.13 0.59d099d8 1.93 0.80
5 Appendix – ISO 1920-10 – Determination of static modulus of elasticityin compression
This part of PT program was not open due to low number of participants.
6 Appendix – EN 12390-13, method A – Determination of secant mod-ulus of elasticity in compression
This part of PT program was not open due to low number of participants.
7 Appendix – EN 12390-13, method B – Determination of secant mod-ulus of elasticity in compression
This part of PT program was not open due to low number of participants.
8 Appendix – EN 12504-4, ČSN 731371 – Non-destructive testing ofconcrete
This part of PT program was not open due to low number of participants.
Proficiency Testing Provider at the SZK FAST | Z 7008Brno University of Technology | Faculty of Civil Engineering | Departement of Building TestingVeveří 331/95 | 602 00 Brno | Czech Republicszk.fce.vutbr.cz | ptprovider.cz
35/46
9. APPENDIX – ČSN 731373, EN 12504-2 – DETERMINATION OF REBOUND NUMBER
9 Appendix – ČSN 731373, EN 12504-2 – Determination of reboundnumber
9.1 Test results
Table 11: Test results - ordered by average value. Outliers are marked by star. uX - extended uncertainty ofmeasurement; x - average value; s0 - sample standard deviation; VX - variation coefficient
ID Test results uX x s0 VXof participant [-] [-] [-] [-] [%]
570e7a 20 19 20 3 20 1 2.944e3829 31 29 30 2 30 1 3.33223144 32 31 32 2 32 1 1.82360089 34 34 35 5 34 1 1.68b362c6 36 36 35 - 35 1 1.76773e5d 35 35 39* 4 36 2 6.24
9.2 The Numerical Procedure for Determining Outliers
570e
7a
4e38
29
2231
44
3600
89
b362
c6
773e
5d
ID
0
0.5
1
1.5
2
Sam
ple
Sta
ndar
d D
evia
tion 1% Critical Value
5% Critical Value
Figure 34: Cochran’s test - sample standard deviations: 1% critical value - red color; 5% critical value - blue color
Proficiency Testing Provider at the SZK FAST | Z 7008Brno University of Technology | Faculty of Civil Engineering | Departement of Building TestingVeveří 331/95 | 602 00 Brno | Czech Republicszk.fce.vutbr.cz | ptprovider.cz
36/46

9. APPENDIX – ČSN 731373, EN 12504-2 – DETERMINATION OF REBOUND NUMBER
570e
7a
4e38
29
2231
44
3600
89
b362
c6
773e
5d
ID
0
0.2
0.4
0.6
0.8
1
1.2
1.4
Sam
ple
Sta
ndar
d D
evia
tion 1% Critical Value
5% Critical Value
Figure 35: Cochran’s test - sample standard deviations without outliers: 1% critical value - red color; 5% criticalvalue - blue color
570e
7a
4e38
29
2231
44
3600
89
b362
c6
773e
5d
ID
20
25
30
35
40
[-]
1% Critical Value5% Critical ValueAverage Value
Figure 36: Grubbs’ test - average values: 1% critical value - red color; 5% critical value - blue color
Proficiency Testing Provider at the SZK FAST | Z 7008Brno University of Technology | Faculty of Civil Engineering | Departement of Building TestingVeveří 331/95 | 602 00 Brno | Czech Republicszk.fce.vutbr.cz | ptprovider.cz
37/46
9. APPENDIX – ČSN 731373, EN 12504-2 – DETERMINATION OF REBOUND NUMBER
9.3 Mandel’s Statistics
570e
7a
4e38
29
2231
44
3600
89
b362
c6
773e
5d
ID
0
0.5
1
1.5
k [-
]
1% Critical Value5% Critical Value
Figure 37: Intralaboratory Consistency Statistic k: 1% critical value - red color; 5% critical value - blue color
570e
7a
4e38
29
2231
44
3600
89
b362
c6
773e
5d
ID
-2
-1.5
-1
-0.5
0
0.5
1
1.5
h [-
]
1% Critical Value5% Critical Value
Figure 38: Interlaboratory Consistency Statistic h: 1% critical value - red color; 5% critical value - blue color
Proficiency Testing Provider at the SZK FAST | Z 7008Brno University of Technology | Faculty of Civil Engineering | Departement of Building TestingVeveří 331/95 | 602 00 Brno | Czech Republicszk.fce.vutbr.cz | ptprovider.cz
38/46

9. APPENDIX – ČSN 731373, EN 12504-2 – DETERMINATION OF REBOUND NUMBER
9.4 Calculation of Performance Statistics
570e
7a
4e38
29
2231
44
3600
89
b362
c6
773e
5d
ID
15
20
25
30
35
40
[-]
z-score = 2z-score = 3
Figure 39: Average values and sample standard deviations
570e
7a
4e38
29
2231
44
3600
89
b362
c6
773e
5d
ID
15
20
25
30
35
40
[-]
z-score = 2z-score = 3
Figure 40: Average values and extended uncertainties of measurement
Proficiency Testing Provider at the SZK FAST | Z 7008Brno University of Technology | Faculty of Civil Engineering | Departement of Building TestingVeveří 331/95 | 602 00 Brno | Czech Republicszk.fce.vutbr.cz | ptprovider.cz
39/46

9. APPENDIX – ČSN 731373, EN 12504-2 – DETERMINATION OF REBOUND NUMBER
15 20 25 30 35 40 45 50[-]
0
2
4
6
8
10
12
Figure 41: Histogram of all test results
570e
7a
4e38
29
2231
44
3600
89
b362
c6
773e
5d
ID
-4
-3
-2
-1
0
1
2
3
z-sc
ore
/ -s
core
z-score-score
Figure 42: z-score and ζ-score
Proficiency Testing Provider at the SZK FAST | Z 7008Brno University of Technology | Faculty of Civil Engineering | Departement of Building TestingVeveří 331/95 | 602 00 Brno | Czech Republicszk.fce.vutbr.cz | ptprovider.cz
40/46
10. APPENDIX – EN 1542, ČSN 736242, APPENDIX B – MEASUREMENT OF BOND STRENGTH BY PULL-OFF
Table 12: z-score and ζ-score
ID z-score [-] ζ-score [-]570e7a -3.84 -3.704e3829 -0.73 -0.92223144 -0.23 -0.29360089 0.58 0.40b362c6 0.90 -773e5d 0.75 0.62
10 Appendix – EN 1542, ČSN 736242, Appendix B – Measurement ofbond strength by pull-off
10.1 Test results
Table 13: Test results - ordered by average value. Outliers are marked by star. uX - extended uncertainty ofmeasurement; x - average value; s0 - sample standard deviation; VX - variation coefficient
ID Test results uX x s0 VXof participant [N/mm2 ] [N/mm2 ] [N/mm2 ] [N/mm2 ] [%]
570e7a 0.60 0.57 0.45 0.74 0.59 0.10 0.59 0.10 17.523c45a1 0.67 0.75 0.68 0.74 0.65 0.10 0.70 0.04 6.364e3829 0.92 0.25 0.64 0.99 0.89 0.11 0.74 0.30 41.07cbf6fb 0.90 1.00 0.90 1.50 1.60 3.00 1.18 0.34 28.99773e5d 1.39 1.24 1.32 1.00 2.05 0.21 1.40 0.39 28.002c694b 1.43 1.48 1.38 1.53 1.48 0.10 1.46 0.06 3.90
Proficiency Testing Provider at the SZK FAST | Z 7008Brno University of Technology | Faculty of Civil Engineering | Departement of Building TestingVeveří 331/95 | 602 00 Brno | Czech Republicszk.fce.vutbr.cz | ptprovider.cz
41/46

10. APPENDIX – EN 1542, ČSN 736242, APPENDIX B – MEASUREMENT OF BOND STRENGTH BY PULL-OFF
10.2 The Numerical Procedure for Determining Outliers
570e
7a
3c45
a1
4e38
29
cbf6
fb
773e
5d
2c69
4b
ID
0
0.1
0.2
0.3
0.4
0.5
Sam
ple
Sta
ndar
d D
evia
tion
1% Critical Value5% Critical Value
Figure 43: Cochran’s test - sample standard deviations: 1% critical value - red color; 5% critical value - blue color
570e
7a
3c45
a1
4e38
29
cbf6
fb
773e
5d
2c69
4b
ID
0.4
0.6
0.8
1
1.2
1.4
1.6
1.8
[N/m
m2 ]
1% Critical Value5% Critical ValueAverage Value
Figure 44: Grubbs’ test - average values: 1% critical value - red color; 5% critical value - blue color
Proficiency Testing Provider at the SZK FAST | Z 7008Brno University of Technology | Faculty of Civil Engineering | Departement of Building TestingVeveří 331/95 | 602 00 Brno | Czech Republicszk.fce.vutbr.cz | ptprovider.cz
42/46

10. APPENDIX – EN 1542, ČSN 736242, APPENDIX B – MEASUREMENT OF BOND STRENGTH BY PULL-OFF
10.3 Mandel’s Statistics
570e
7a
3c45
a1
4e38
29
cbf6
fb
773e
5d
2c69
4b
ID
0
0.5
1
1.5
k [-
]
1% Critical Value5% Critical Value
Figure 45: Intralaboratory Consistency Statistic k: 1% critical value - red color; 5% critical value - blue color
570e
7a
3c45
a1
4e38
29
cbf6
fb
773e
5d
2c69
4b
ID
-1.5
-1
-0.5
0
0.5
1
1.5
h [-
]
1% Critical Value5% Critical Value
Figure 46: Interlaboratory Consistency Statistic h: 1% critical value - red color; 5% critical value - blue color
Proficiency Testing Provider at the SZK FAST | Z 7008Brno University of Technology | Faculty of Civil Engineering | Departement of Building TestingVeveří 331/95 | 602 00 Brno | Czech Republicszk.fce.vutbr.cz | ptprovider.cz
43/46

10. APPENDIX – EN 1542, ČSN 736242, APPENDIX B – MEASUREMENT OF BOND STRENGTH BY PULL-OFF
10.4 Calculation of Performance Statistics
570e
7a
3c45
a1
4e38
29
cbf6
fb
773e
5d
2c69
4b
ID
0
0.5
1
1.5
2
[N/m
m2 ]
z-score = 2z-score = 3
Figure 47: Average values and sample standard deviations
570e
7a
3c45
a1
4e38
29
cbf6
fb
773e
5d
2c69
4b
ID
-2
-1
0
1
2
3
4
5
[N/m
m2 ]
z-score = 2z-score = 3
Figure 48: Average values and extended uncertainties of measurement
Proficiency Testing Provider at the SZK FAST | Z 7008Brno University of Technology | Faculty of Civil Engineering | Departement of Building TestingVeveří 331/95 | 602 00 Brno | Czech Republicszk.fce.vutbr.cz | ptprovider.cz
44/46

10. APPENDIX – EN 1542, ČSN 736242, APPENDIX B – MEASUREMENT OF BOND STRENGTH BY PULL-OFF
0 0.5 1 1.5 2 2.5
[N/mm2]
0
2
4
6
8
10
12
14
16
18
Figure 49: Histogram of all test results
570e
7a
3c45
a1
4e38
29
cbf6
fb
773e
5d
2c69
4b
ID
-3
-2
-1
0
1
2
3
z-sc
ore
/ -s
core
z-score-score
Figure 50: z-score and ζ-score
Proficiency Testing Provider at the SZK FAST | Z 7008Brno University of Technology | Faculty of Civil Engineering | Departement of Building TestingVeveří 331/95 | 602 00 Brno | Czech Republicszk.fce.vutbr.cz | ptprovider.cz
45/46
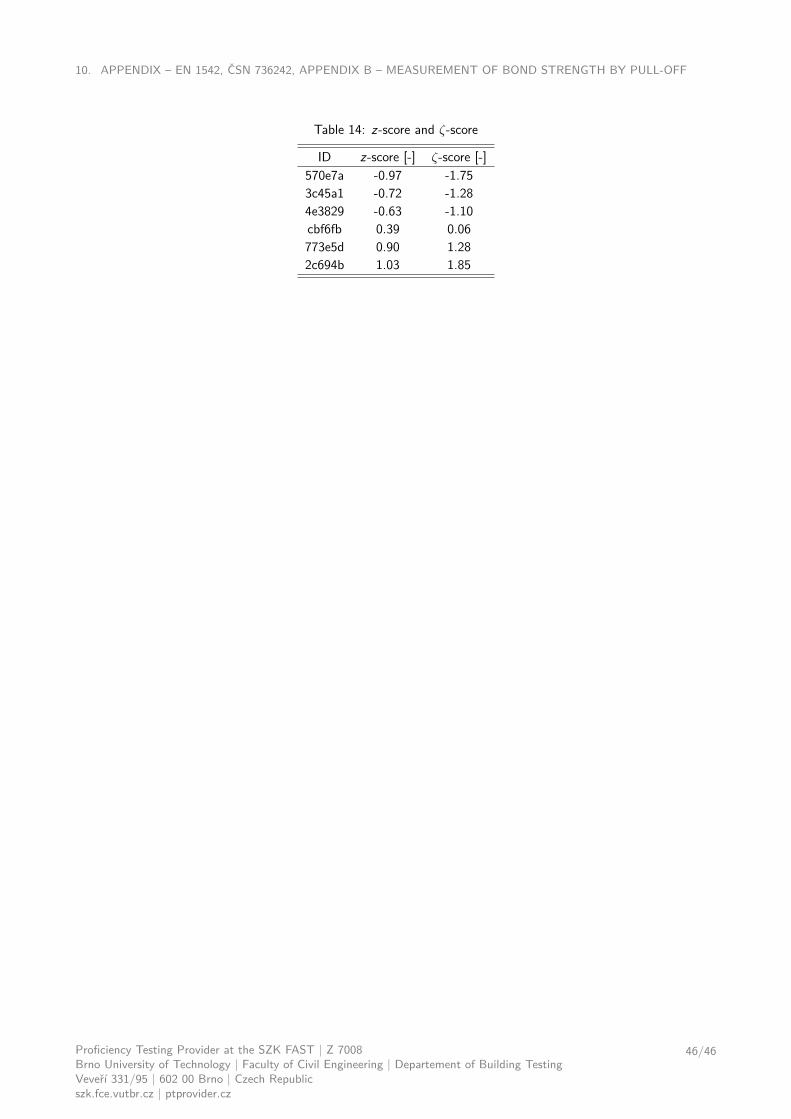
10. APPENDIX – EN 1542, ČSN 736242, APPENDIX B – MEASUREMENT OF BOND STRENGTH BY PULL-OFF
Table 14: z-score and ζ-score
ID z-score [-] ζ-score [-]570e7a -0.97 -1.753c45a1 -0.72 -1.284e3829 -0.63 -1.10cbf6fb 0.39 0.06773e5d 0.90 1.282c694b 1.03 1.85
Proficiency Testing Provider at the SZK FAST | Z 7008Brno University of Technology | Faculty of Civil Engineering | Departement of Building TestingVeveří 331/95 | 602 00 Brno | Czech Republicszk.fce.vutbr.cz | ptprovider.cz
46/46