Embed Size (px)
Citation preview

Domicile: Bundesallee 100 38116 Braunschweig GERMANY
Telephone: +49 531 592-0 Telefax: +49 531 592-9292 E-mail: [email protected] Internet: http://www.ptb.de
Deutsche Bundesbank, Filiale Leipzig IBAN: DE38 8600 0000 0086 0010 40 BIC: MARKDEF1860 VAT-Nr.: DE 811 240 952
PTB Berlin-Charlottenburg Abbestr. 2-12 10587 Berlin GERMANY
600
01
en
r
CCQM WG on Electrochemical Analysis
Final report on CCQM – K91 Key comparison on pH of an unknown phthalate buffer
22 April 2013
P. Spitzer, F. Bastkowski, B. Adel, L. Dimitrova, F. B. Gonzaga, P. T. Jakobsen, P. Fisicaro, D. Stoica, T. Asakai, I. Maksimov, Z. N.Szilágyi, A.Reyes, M. Monroy, G.T. Canaza, W. Kozlowski, M. Pawlina, V. Kutovoy, L. Vyskocil, A. Mathiasova, T. Nongluck, F. Ficicioglu, V. Gavrilkin, K.W. Pratt, J. Waters
Abstract Results of the CCQM-K91 key comparison on pH of an unknown phthalate buffer with a nominal pH value of pH ~ 4.01 at 25 °C are reported. Measurements are performed at 15 °C, 25 °C, and 37 °C and optional also at 5 °C and 50 °C.
Subject field Amount of substance
Subject Determination of the acidity functions at zero chloride molality, pa0, of an unknown phthalate buffer, nominal pH value pH ~4.01 (25 °C) by Harned cell and differential potentiometric cell measurements, respectively at 15 °C, 25 °C and 37 °C and optional at 5 °C and 50 °C.

- 2 -
Table of Contents Abstract ........................................................................................................................ 1
Subject field ................................................................................................................. 1
Subject ......................................................................................................................... 1
Table of Contents ..................................................................................................... 2 Purpose of the comparison ....................................................................................... 3 Time schedule .......................................................................................................... 3 Coordinating laboratory ............................................................................................ 3
Participants .................................................................................................................. 4
Sample preparation and distribution ............................................................................ 4
Sample homogeneity and stability ............................................................................... 5
Timetable of measurements and Comments ............................................................... 8
Problems reported to the coordinator ........................................................................... 8
Measurement Technique ............................................................................................. 9
Results and discussion .............................................................................................. 10
Calculation of the KCRV and its uncertainty .............................................................. 13
Conclusions ............................................................................................................... 16
How far the light shines .............................................................................................. 17
Acknowledgment ........................................................................................................ 17
Figures ....................................................................................................................... 17

- 3 -
Purpose of the comparison The key comparison (KC) CCQM-K91 was performed to demonstrate the capability of the participating National Metrology Institutes (NMI) to measure the pH value of unknown phthalate buffer solutions.
The buffer of nominal pH 4.01 (25 °C) was measured at 15 °C, 25 °C 37 °C and optional also at 5 °C and 50 °C. The comparison is a complete repetition of the KC CCQM-K17 from 2001.
The comparison was restricted to the use of either the primary Harned cell1 or the secondary differential potentiometric cell2 method for pH. It was only allowed to participate by using a secondary instead of a primary method if this is the highest metrological standard in the NMI and if the CMCs are based on this method. Only the results obtained by the primary method have been used to calculate the KCRV.
Phthalate buffer is widely used to calibrate pH electrodes in the acid range. A buffer solution of 0.05 mol kg-1 potassium hydrogen phthalate, KHC8H4O4, is one of the primary pH reference buffer solutions recommended by IUPAC. Certified reference materials are issued by several NMIs based on primary measurements.
Time schedule Dispatch of the samples: 29 July 2011 Deadline for receipt of the report: 30 September 2011 Draft A report distributed 25 October 2011 Discussion of results EAWG meeting, November 2011 Discussion of Draft A report EAWG meeting, April 2012 Draft B report distributed February 2013 EAWG approval of Draft B report April 2013 Final report April 2013
Coordinating laboratory PTB (Physikalisch-Technische Bundesanstalt) Bundesallee 100 38116 Braunschweig Germany Petra Spitzer Tel: +49 531 592 3130 Fax: +49 531 592 3015 Email: [email protected] Frank Bastkowski Tel: +49 531 592 3323 Fax: +49 531 592 3015 Email: [email protected] Beatrice Adel Tel: +49 531 592 3132 Fax: +49 531 592 3015 Email: [email protected]
1 Buck RP et al. 2002 Pure Appl. Chem. 74(11) 2169–2200
2 Baucke FGK (1994) J Electroanal Chem 368:67–75

- 4 -
Participants
No Country Institute Acronym Contact
1 BG Bulgarian Institute of Metrology- National Centre of Metrology
BIM-NMC L. Dimitrova
2 BR National Institute of Metrology, Quality and Technology
INMETRO F. B.Gonzaga
3 DK Danish Fundamental Metrology DFM P. T. Jakobsen
4 DE Physikalisch-Technische Bundesanstalt PTB P. Spitzer. F. Bastkowski, B. Adel
5 FR Laboratoire National de métrologie et d'Essais
LNE P. Fisicaro, D. Stoica
6 JP National Metrology Institute of Japan NMIJ T. Asakai
7 HU Hungarian Trade Licensing Office MKEH Z. N.Szilágyi
8 MX Centro Nacional de Metrología CENAM A.Reyes, M. Monroy
9 PE Instituto Nacional de Defensa Competencia y de la Protección de la Propiedad intellectual
INDECOPI G.T. Canaza
10 PL Central Office of Measures GUM W. Kozlowski, M. Pawlina
11 RU National Research Institute Physicotechnical and Radio Engineering Measurements
VNIIFTRI V. Kutovoy
12 SK Slovenský metrologický ústav SMU L. Vyskocil, A. Mathiasova
13 TH National Institute of Metrology NIMT T. Nongluck
14 TR TUBITAK UME Tubitak UME F. Ficicioglu
15 UA Ukrmetrteststandart UMTS V. Gavrilkin
16 US National Institute of Standards and Technology
NIST K.W. Pratt
Tab. 1: List of participants in KC CCQM-K91.
Sample preparation and distribution The phthalate buffer solution was prepared from deionized water and potassium hydrogen phthalate (Merck A112365). The mass fraction of water of the final solution was w (H2O) = 0,989893 g g-1.
The sample batch was produced at 15 July 2011 in one 100 kg batch at the ZMK (Zentrum fuer Messen und Kalibrieren) facilities in Germany by colleagues from PTB and ZMK.
ZMK is a calibration laboratory accreted by the German accreditation body DAkkS for the quantity pH. The bottles and the buffer starting material were provided by PTB. The samples were bottled during one day. Sealing and weighing was done at PTB.
Each participant received three 1 L high-density polyethylene (HDPE) bottles filled with the sample solution, sealed in aluminized plastic bags and numbered. Shipment to all participants was performed at the same time by courier. Except VNIIFTRI the participants received the samples between 29 July and 16 August. VNIIFTRI received the sample solution only at 9 September.
Hydrochloric acid and sodium or potassium chloride was not provided. It has been recommended to dry the alkali chloride at least at 400 °C for two hours.
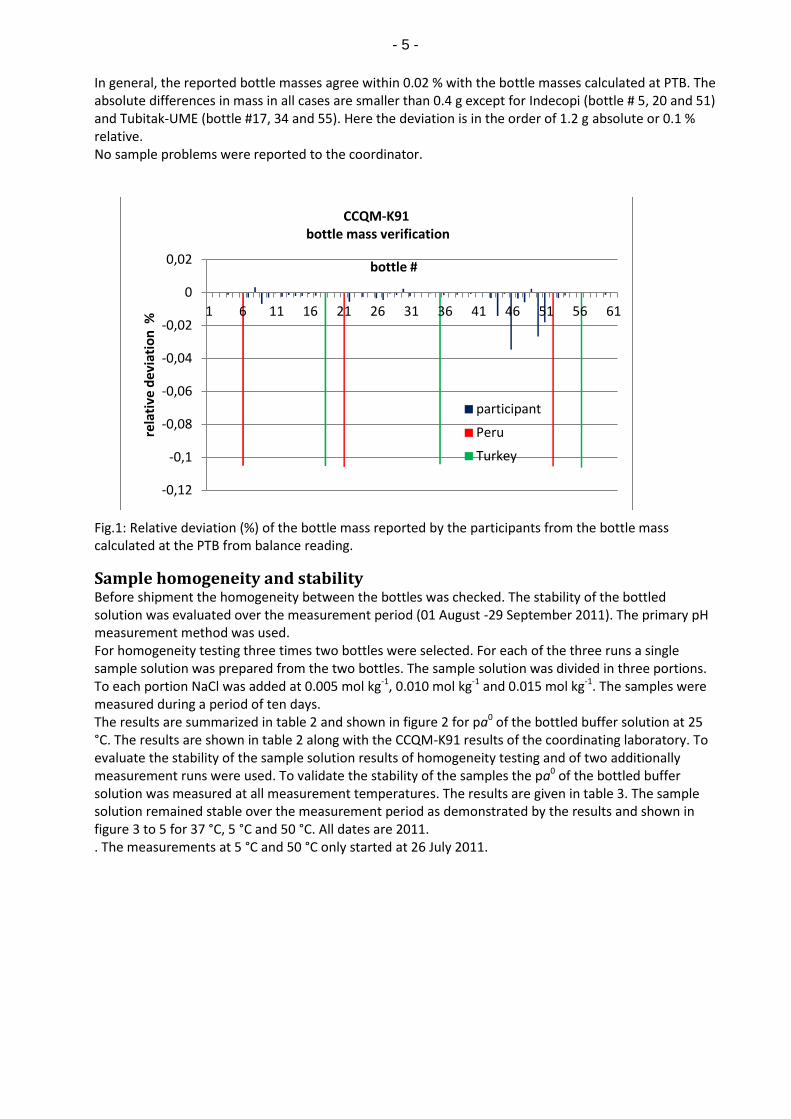
To verify that the sample mass are unchanged during transport participants were requested to weight the bottles and to calculate the bottle mass from the balance reading. Figure 1 shows the relative deviation reported by the participants from the bottle mass. The bottle masses were calculated at PTB from the balance reading.
- 5 -
In general, the reported bottle masses agree within 0.02 % with the bottle masses calculated at PTB. The absolute differences in mass in all cases are smaller than 0.4 g except for Indecopi (bottle # 5, 20 and 51) and Tubitak-UME (bottle #17, 34 and 55). Here the deviation is in the order of 1.2 g absolute or 0.1 % relative. No sample problems were reported to the coordinator.
Fig.1: Relative deviation (%) of the bottle mass reported by the participants from the bottle mass calculated at the PTB from balance reading.
Sample homogeneity and stability Before shipment the homogeneity between the bottles was checked. The stability of the bottled solution was evaluated over the measurement period (01 August -29 September 2011). The primary pH measurement method was used. For homogeneity testing three times two bottles were selected. For each of the three runs a single sample solution was prepared from the two bottles. The sample solution was divided in three portions. To each portion NaCl was added at 0.005 mol kg-1, 0.010 mol kg-1 and 0.015 mol kg-1. The samples were measured during a period of ten days. The results are summarized in table 2 and shown in figure 2 for pa0 of the bottled buffer solution at 25 °C. The results are shown in table 2 along with the CCQM-K91 results of the coordinating laboratory. To evaluate the stability of the sample solution results of homogeneity testing and of two additionally measurement runs were used. To validate the stability of the samples the pa0 of the bottled buffer solution was measured at all measurement temperatures. The results are given in table 3. The sample solution remained stable over the measurement period as demonstrated by the results and shown in figure 3 to 5 for 37 °C, 5 °C and 50 °C. All dates are 2011. . The measurements at 5 °C and 50 °C only started at 26 July 2011.
-0,12
-0,1
-0,08
-0,06
-0,04
-0,02
0
0,02
1 6 11 16 21 26 31 36 41 46 51 56 61
rela
tive
dev
iati
on
%
bottle #
CCQM-K91 bottle mass verification
participant
Peru
Turkey

- 6 -
Date Bottle # pa0 U (k =2)
19 July 2011 1/2 4.09423 0.0023
25 July 2011 31/32 4.09417 0.0023
28 July 2011 61/62 4.09424 0.0023
07 Sept 2011 K91 (85/86) 4.09415 0.0023
Tab 2: Homogeneity check at 25 °C at coordinating laboratory before shipment. The measurement result of KC CCQM-K91 of the coordinating laboratory is shown in the last row.
Fig.2: Sample homogeneity at 25 °C. Given is the expanded uncertainty (k= 2).
Date Bottle # pa0
25 °C pa0
15 °C pa0
37 °C pa0 5 °C
U (k =2) pa0
50 °C U (k =2)
19. Jul 1/2 4.09423 0.0023
25. Jul 31/32 4.09417 4.08668 4.11416 0.0023
28. Jul 61/62 4.09424 4.08681 4.11603 4.08692 0.0023 4.15073 0.0028
03. Aug 71/72 4.09445 4.08592 4.11430 4.08650 0.0023 4.14759 0.0028
16. Aug 81/82 4.09424 4.08560 4.11523 4.08524 0.0023 4.14970 0.0028
07. Sep KC 91 85/86
4.09415 4.08631 4.11435 4.08838 0.0023 4.14684 0.0028
Tab 3: Sample stability over a 90 days period. The measurement result of KC CCQM-K91 of the coordinating laboratory is shown in the last row.

- 7 -
Fig.3: Validation of the sample stability at 37 °C. Given is the expanded uncertainty (k = 2).
Fig.4: Validation of the sample stability at 5 °C. Given is the expanded uncertainty (k = 2).

- 8 -
Fig.5: Validation of the sample stability at 50 °C. Given is the expanded uncertainty (k = 2).
Timetable of measurements and Comments
NMI Sample received
Measurement Period Report Date
Revised Report
Comments
BIM-NCM 03 Aug 18 - 26 Sep 30 Sep 31 Oct E0 revised values
INMETRO 03 Aug 3 - 25 Aug 14 Sep
DFM 29 July 31 Aug – 2 Sep 21 Sep
PTB - 7 -9 Sep 11 Sep
LNE 01 Aug 29 Aug – 2 Sep 22 Sep
NMIJ 01 Aug 4 -23 Aug 30 Sep
MKEH 01 Aug 29 Aug 30 Sep
CENAM 12 Aug 13 – 22 Sep 30 Sep
Indecopi 16 Aug 19 Aug 30 Sep 1 Nov pa0 values added
GUM 01 Aug 29 Aug – 2 Sep 30 Sep
VNIIFTRI 09 Sep 14 Sep 30 Sep 7 Oct uncertainty budgets added
SMU 03 Aug 20 – 22 Sep 30 Sep
NIMT 01 Aug 14 – 26 Sep 30 Sep
Tubitak UME
01 Aug 25 – 29 Sep 30 Sep 25 Oct malfunction of thermostat unit: no results at 5 °C and 15 °C
UMTS 16 Aug 16 – 25 Sep 30 Sep 11 Oct 14 Nov
revised value for partial pressure of hydrogen malfunction of potential measurement circuit reported
NIST 08 Aug 12 – 15 Sep 26 Sep
Tab 4: Dates of sample received, measurement period, and comments.
Problems reported to the coordinator -Indecopi(PE): In the original report only pH as result was stated. In the revised version the pa0 are added. -UMTS (UA):“Unexpectedly, our results appeared to be biased compared to the results of other participants. It could be possibly caused by the malfunction of our potential measurement circuit. Now
- 9 -
we are trying to find the exact reason. In course of preparation for comparison the instruments calibration was OK (for example, electrode potential was close to mean value of all participants). The most probable reason is a failure of microcircuit in the potential meter. At any case, our results should not be taken into account in KCRV calculation.” -Tubitak UME (TR) reported problems with their thermostat unit and did not report results at 5 °C and 15 °C. -SMU (SK) gave only an informal result for 5 °C due to instability in this temperature. -BIM-NCM (BG) observed a calculation error in E0 and sent revised pa0values at 31 October one month after the comparison deadline. -VNIIFTRI (RU) added uncertainty calculations in a revised version of the report.
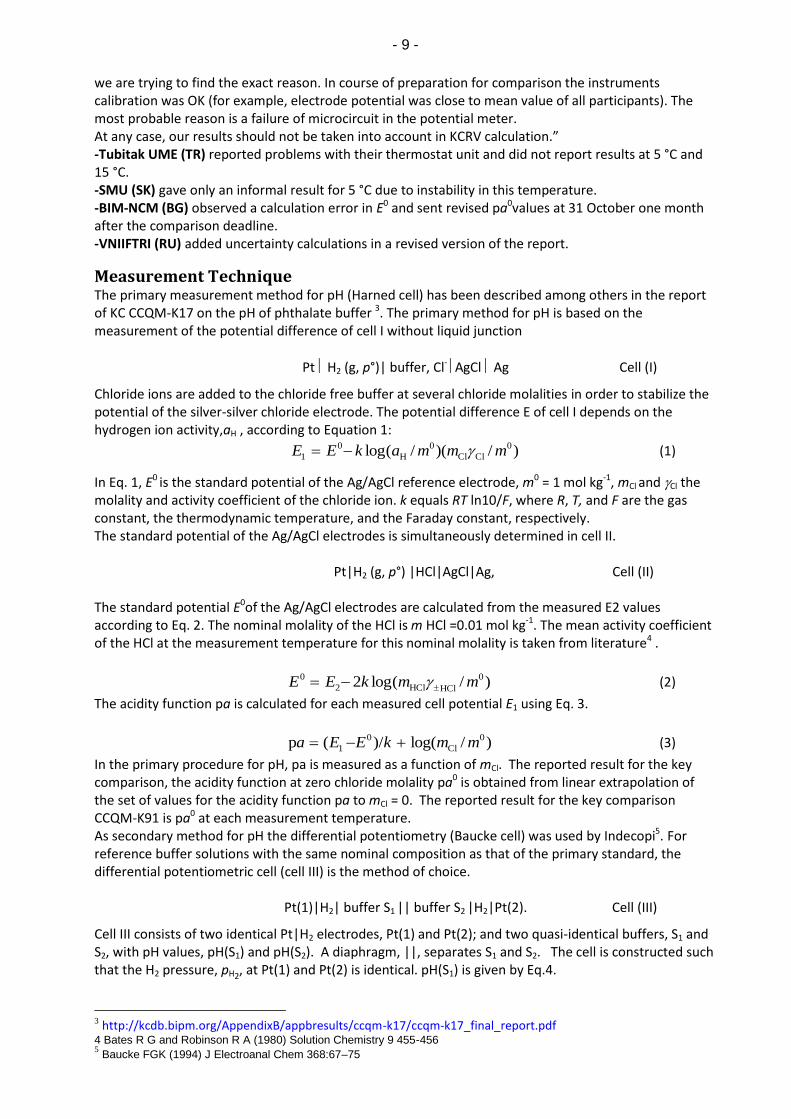
Measurement Technique The primary measurement method for pH (Harned cell) has been described among others in the report of KC CCQM-K17 on the pH of phthalate buffer 3. The primary method for pH is based on the measurement of the potential difference of cell I without liquid junction
Pt H2 (g, p°)| buffer, Cl- AgCl Ag Cell (I)
Chloride ions are added to the chloride free buffer at several chloride molalities in order to stabilize the potential of the silver-silver chloride electrode. The potential difference E of cell I depends on the hydrogen ion activity,aH , according to Equation 1:
)/)(/(log 0
ClCl
0
H
0
1 mmmakEE (1)
In Eq. 1, E0 is the standard potential of the Ag/AgCl reference electrode, m0 = 1 mol kg-1, mCl and Cl the molality and activity coefficient of the chloride ion. k equals RT ln10/F, where R, T, and F are the gas constant, the thermodynamic temperature, and the Faraday constant, respectively. The standard potential of the Ag/AgCl electrodes is simultaneously determined in cell II.
Pt|H2 (g, p°) |HCl|AgCl|Ag, Cell (II)
The standard potential E0of the Ag/AgCl electrodes are calculated from the measured E2 values according to Eq. 2. The nominal molality of the HCl is m HCl =0.01 mol kg-1. The mean activity coefficient of the HCl at the measurement temperature for this nominal molality is taken from literature4 .
)/(log2 0
HClHCl2
0 mmkEE (2)
The acidity function pa is calculated for each measured cell potential E1 using Eq. 3.
)/(log/)(p 0
Cl
0
1 mmkEEa (3)
In the primary procedure for pH, pa is measured as a function of mCl. The reported result for the key comparison, the acidity function at zero chloride molality pa0 is obtained from linear extrapolation of the set of values for the acidity function pa to mCl = 0. The reported result for the key comparison CCQM-K91 is pa0 at each measurement temperature. As secondary method for pH the differential potentiometry (Baucke cell) was used by Indecopi5. For reference buffer solutions with the same nominal composition as that of the primary standard, the differential potentiometric cell (cell III) is the method of choice. Pt(1)|H2| buffer S1 || buffer S2 |H2|Pt(2). Cell (III)
Cell III consists of two identical Pt|H2 electrodes, Pt(1) and Pt(2); and two quasi-identical buffers, S1 and S2, with pH values, pH(S1) and pH(S2). A diaphragm, ||, separates S1 and S2. The cell is constructed such that the H2 pressure, pH2
, at Pt(1) and Pt(2) is identical. pH(S1) is given by Eq.4.
3 http://kcdb.bipm.org/AppendixB/appbresults/ccqm-k17/ccqm-k17_final_report.pdf
4 Bates R G and Robinson R A (1980) Solution Chemistry 9 455-456 5 Baucke FGK (1994) J Electroanal Chem 368:67–75

- 10 -
k
EE j3
12 )S(pH)S(pH
, (4)
Ej is the liquid junction potential that forms between S1 and S2 at the diaphragm. Provided that S1 and S2 are quasi-identical in composition, |pH(S2) – pH(S1)| ≤ 0.02, and 3 < pH < 11 |Ej|<0.1|E3.
Results and discussion All participants delivered results. It was agreed previously that only results from primary measurements are used to calculate the key comparison reference value (KCRV). Only Indecopi (PE) applied a secondary method. Indecopi measured the pH of the sample by differential potentiometry as this is the highest metrological standard in the NMI and as the CMCs are based on this method. The pH value reported by Indecopi is recalculated as pa0 by assuming an ionic strength of the buffer of 0.0535 mol kg-1. All participants were requested to measure the pa0 at 15 °C, 25 °C and 37 °C. Eight institutes provided additional results at 5 °C and 50 °C. The results for the key comparison, pa0, are given at each measurement temperature in table 5 to 6 below and shown in figures 6 to 10. The uncertainty is the standard uncertainty with k = 1. Only for information BIM-NCM revised as well as original results are shown in tables and figures below but only in case they are different. Tables 7 and 8 summarize the E0 values at 25 °C. The E0 values at 25 °C are shown in figure 11. In table 9 and 10 and the uncertainty of the intercept and the slope of the regression line obtained from linear extrapolation of the acidity function pa to mCl = 0 are given. These data are shown in figures 12 to 15. The HCl molality and the method used to standardize the HCl are given in table 11.
15 °C 25 °C 37 °C
NMI Country pa0 u(pa0) (k =1)
pa0 u(pa0) (k =1)
pa0 u(pa0) (k =1)
BIM-NCM rev BG 4.0817 0.0040 4.0907 0.0040 4.1133 0.0040
BIM-NCM org BG 4.0751 0.0040 4.0831 0.0040 4.1058 0.0040
INMETRO BR 4.0831 0.0015 4.0918 0.0013 4.1131 0.0012
DFM DK 4.0857 0.0006 4.0940 0.0005 4.1157 0.0005
PTB DE 4.0863 0.0012 4.0941 0.0012 4.1143 0.0012
LNE FR 4.0835 0.0022 4.0921 0.0018 4.1112 0.0019
NMIJ JP 4.0854 0.0012 4.0932 0.0012 4.1151 0.0015
MKEH HU 4.0847 0.0014 4.0947 0.0014 4.1102 0.0030
CENAM MX 4.0808 0.0010 4.0904 0.0011 4.1133 0.0012
Indecopi PE 4.0877 0.0020 4.0923 0.0020 4.1136 0.0020
GUM PL 4.0852 0.0014 4.0926 0.0016 4.1116 0.0014
VNIIFTRI RU 4.0856 0.0030 4.0942 0.0038 4.1137 0.0039
SMU SK 4.0862 0.0010 4.0946 0.0010 4.1162 0.0010
NIMT TH 4.0815 0.0025 4.0883 0.0025 4.1114 0.0040
Tubitak UME TR - - 4.8085 0.0028 4.0626 0.0190
UMTS UA 3.9573 0.0021 3.9832 0.0019 3.9970 0.0019
NIST US 4.0867 0.0006 4.0946 0.0008 4.1153 0.0019
Tab 5: Results at 15 °C, 25 °C and 37 °C. The uncertainty is the standard uncertainty (k = 1).
5 °C 50 °C
NMI Country pa0 u(pa0) (k =1)
pa0 u(pa0) (k =1)
BIM-NCM rev BG 4.0827 0.0040 4.1447 0.0030
BIM-NCM org BG 4.0750 0.0020 4.1382 0.0020
PTB DE 4.0884 0.0012 4.1477 0.0014
NMIJ JP 4.0868 0.0012 4.1446 0.0021
MKEH HU 4.0818 0.0027 4.1458 0.0031
GUM PL 4.0831 0.0017 4.1419 0.0014

- 11 -
VNIIFTRI RU 4.0851 0.0037 4.1559 0.0039
SMU SK - - 4.1513 0.0010
NIMT TH 4.0792 0.0015 4.1358 0.0055
Tubitak UME TR - - 3.9537 0.0488
UMTS UA 3.9624 0.0019 4.0311 0.0019
NIST US 4.0896 0.0006 4.1496 0.0017
Tab 6: Results at 5 °C and 50 °C. The uncertainty is the standard uncertainty (k = 1).
15 °C 25 °C 37 °C
NMI Country E0/V u(E0) (k =1)
E0/V u(E0)
(k =1)) E0/V
u(E0) (k =1)
BIM-NCM rev BG 0.228322 0.00020 0.222011 0.00020 0.213719 0.00020
BIM-NCM org BG 0.22875 0.00020 0.222454 0.00020 0.21418 0.00020
INMETRO BR 0.228936 0.000085 0.222753 0.000086 0.214599 0.000088
DFM DK 0.228671 0.000062 0.222506 0.000059 0.214316 0.000062
PTB DE 0.228688 0.000052 0.222508 0.000052 0.214286 0.000052
LNE FR 0.228746 0.000175 0.222526 0.000155 0.214293 0.000162
NMIJ JP 0.228641 0.000035 0.222508 0.000040 0.214364 0.000040
MKEH HU 0.227959 0.000067 0.220157 0.000069 0.21102 0.000071
CENAM MX 0.228639 0.000067 0.222383 0.000060 0.214066 0.000088
GUM PL 0.228351 0.000068 0.222166 0.000071 0.214031 0.000072
VNIIFTRI RU 0.228536 0.000088 0.222352 0.000107 0.214218 0.000101
SMU SK 0.228880 0.000046 0.222667 0.000047 0.214381 0.000048
NIMT TH 0.228991 0.000027 0.222865 0.000027 0.214326 0.000027
Tubitak UME TR - - 0.524718 0.000041 0.5734436 0.000041
UMTS UA 0.228641 0.000074 0.222384 0.000075 0.214955 0.000079
NIST US 0.228543 0.000023 0.222396 0.000034 0.214256 0.000038
Tab 7: Standard potential of the Ag/AgCl electrodes at 15 °C, 25 °C and 37 °C as reported by the participants.

- 12 -
5 °C 50 °C
NMI Country E0/V u(E0) (k =1)
E0/V u(E0) (k =1)
BIM-NCM rev BG 0.23380 0.00020 0.20397 0.000140
BIM-NCM org BG 0.23422 0.00020 0.204454 0.000140
PTB DE 0.234177 0.000052 0.204471 0.000052
NMIJ JP 0.234142 0.000046 0.204639 0.000052
MKEH HU 0.233434 0.000077 0.202258 0.000084
GUM PL 0.233853 0.000066 0.204327 0.000075
VNIIFTRI RU 0.234142 0.000067 0.204515 0.000093
SMU SK - - 0.204484 0.000049
NIMT TH 0.234458 0.000027 0.203507 0.000027
Tubitak UME TR - - 0.580283 0.001564
UMTS UA 0.234676 0.000074 0.204913 0.000850
NIST US 0.234045 0.000023 0.204489 0.000025
Tab 8: Standard potential of the Ag/AgCl electrodes at 5 °C and 50 °C as reported by the participants.
NMI Country u(intercept) Slope (extrapolation)
15 °C 25 °C 37 °C 15 °C 25 °C 37 °C
BIM-NMC rev BG 0.003 0.004 0.003 -0.629 -0.421 -0.512
BIM-NMC org BG 0.003 0.004 0.003 -0.65357 -0.41610 -0.51140
CENAM MX 0.00077 0.00076 0.00081 -0.65670 -0.57740 -0.72264
DFM DK 0.00056 0.00048 0.00051 -0.69300 -0.67900 -0.69800
GUM PL 0.00057 0.00098 0.00058 -0.75066 -0.61501 -0.59550
INMETRO BR 0.00110 0.00090 0.00070 -0.47570 -0.52030 -0.57130
LNE FR 0.00100 0.00100 0.00110 -0.66060 -0.63700 -0.53480
MKEH HU 0.00063 0.00286 0.00279 -6.56970 -4.96640 -7.81350
NMIJ JP 0.00080 0.00070 0.00130 -0.63869 -0.64661 -0.67039
NMIT TH 0.00527 0.00506 0.00813 -0.89350 -0.85950 -1.15140
NIST US 0.00046 0.00054 0.00077 -0.59044 -0.61278 -0.56763
PTB DE 0.00040 0.00032 0.00054 -0.61499 -0.61012 -0.61838
SMU SK 0.00040 0.00030 0.00040 -0.60855 -0.62893 -0.73113
Tubitak UME TR - - - - -29.119 -0.01600
UMTS UA 0.00160 0.00130 0.00130 0.00210 0.00190 0.00190
VNIIFTRI RU 0.00208 0.00279 0.00316 -0.03351 -0.08744 -0.07679
Tab 9: Uncertainty of the intercept and slope of the regression line obtained from linear extrapolation of the acidity function pa to mCl = 0 at 15 °C, 25 °C and 37 °C.

- 13 -
NMI Country u(intercept) Slope (extrapolation)
5 °C 50 °C 5 °C 50 °C
BIM-NCM rev BG 0.00300 0.00210 -0.0847 -0.639
BIM-NMC org BG 0.00300 0.00200 -0.0857 -0.6429
GUM PL 0.00114 0.00065 -0.4047 -0.3883
MKEH HU 0.00224 0.00253 -5.6401 -7.0092
NMIJ JP 0.00060 0.00130 -0.6608 -0.7291
NIMT TH 0.00272 0.01100 -0.6166 -0.5574
NIST US 0.00041 0.00060 -0.6300 -0.5932
PTB DE 0.00035 0.00085 -0.5975 -0.6749
SMU SK - 0.00043 - -0.8614
Tubitak UME TR - -0.0161
UMTS UA 0.00297 0.00421 -8.9200 -17.4000
VNIIFTRI RU 0.00300 0.00210 -0.0027 -0.1013
Tab 10: Uncertainty of the intercept and slope of the regression line obtained from linear extrapolation of the acidity function pa to mCl = 0 at 5 °C and 50 °C.
NMI HCl molality mCl (mol kg-1)
Standardization Technique for HCl
BIM-NCM 0.00947 titrimetry (methyl red)
INMETRO 0.010013 coulometry
DFM 0.010000 coulometry+gravimetric
dilution
PTB 0.010008 coulometry
LNE 0.0099998 potentiometric titration
NMIJ 0.0099989 coulometry+gravimetric
dilution
MKEH 0.010005 potentiometric titration
CENAM 0.01000 coulometry
Indecopi - -
GUM 0.010009 potentiometric titration
(Tris)
VNIIFTRI 0.01015 coulometry
SMU 0.010000 coulometry
NIMT 0.010002 coulometry+gravimetric
dilution
Tubitak UME 0.0108 coulometry
UMTS 0.010012 coulometry
NIST 0.0100042 coulometry
Tab.11: HCl molality and method of standardization.
Calculation of the KCRV and its uncertainty The key comparison CCQM-K91 (pH of phthalate buffer, pH~4) was a complete repeat of CCQM-K17. CCQM-K17 was performed in 20016. Three possibilities for determination of the KCRV are listed in Table 12 and 13. For each estimator, the UMTS, Tubitak UME, BIM-NCM and Indecopi results are omitted from the calculation. The differences between the estimators at all temperatures are insignificant. Based on the decision of the EAWG at its
6 http://kcdb.bipm.org/appendixB/KCDB_ApB_info.asp?cmp_idy=168&cmp_cod=CCQM-K17&prov=exalead

- 14 -
meeting on 31 April 2012, the weighted mean and its uncertainty were selected as the estimators for the KCRV in CCQM-K91. This approach is the same as that used to calculate the KCRV in the CCQM-K17.
15 °C 25 °C 37 °C
Estimator Value u (k = 1) Value u (k = 1) Value u (k = 1)
Arithmetic mean 4.0846 0.00054 4.0929 0.00057 4.1134 0.0011
Weighed mean 4.0853 0.00052 4.0935 0.00042 4.1147 0.00046
Median 4.0853 0.00055 4.0936 0.00057 4.1135 0.00057
Birge ratio 1.73 1.38 1.37
Tab.12: Values of candidate estimator for the KCRV at 15 °C, 25 °C and 37 °C for CQQM-K91.
5 °C 50 °C
Estimator Value u (k = 1) Value u (k = 1)
Arithmetic mean 4.0849 0.0026 4.1466 0.0027
Weighed mean 4.0875 0.0013 4.1480 0.0015
Median 4.0851 0.0014 4.1468 0.0022
Birge ratio 3.04 2.51
Tab.13: Values of candidate estimator for the KCRV for CQQM-K91 at 5 °C and 50 °C.
The weighted mean pa0R for CCQM-K91 was calculated using Eq4. Where n is the number of
participants, wi is the normalized weight for participant i, and pa0i is the result for participant i.
N
i
iiR awa1
00 pp (4)
The weight wi is given by Eq 5 and 6, where u(xi) is the standard uncertainty for participant i:
2)( i
ixu
Cw
(5)
N
i ixu
C
12)(
1
1
(6) The values of u(xi) are the individual uncertainties and C is the variance. The uncertainty of the weighted mean was determined by the external consistency method (uncertainty –weighted mean). uR(pa0
R) is given by Eq 7.
)1(
pp
)p( 1
200
0
R
N
aaw
au
N
i
Rii
R (7)

- 15 -
As for CCQM-K17 the Birge approach is used again to test if there is the possibility that some or all of the individual uncertainties have been underestimated. When applying this test, the uncertainty of the KCRV as determined from the individual uncertainties stated by the participants (the internal consistency of the data, equation (8)) are compared to the external consistency taking into account how much each result deviates from the KCRV in relation to its uncertainty.
CauRm 0p
(8) The Birge ratio R = uR/um calculated for the CCQM-K91 is always larger than one as given in tables 13 and 14, indicating that the external consistency method yields a better estimate of the uncertainty of the results than does the internal consistency method. Therefore the calculated values of uR(pa0
R) were taken as the standard uncertainty of the KCRV, u(KCRV). For CCQM-K17 the Birge ratios were: 2.85 (15 °C), 3.08 (25 °C) and 3.02 (37 °C). The final value of the KCRV and its expanded uncertainty (k =2) is listed for each temperature in table 14.
15 °C 25 °C 37 °C 5 °C 50 °C
KCRV U(k = 2) KCRV U(k = 2) KCRV U(k = 2) KCRV U(k = 2) KCRV U(k = 2)
4.0853 0.0011 4.0935 0.00083 4.1147 0.00092 4.0875 0.0027 4.1480 0.0030
Tab. 14: KCRV and its expanded uncertainty, U, for CCQM-K91.
Calculation of the degrees of equivalence
The degree of equivalence for each participant, Di, and its standard uncertainty, u (Di), are given by Eq 9 and Eq 10.
KCRVp 0 ii aD
(9)
)KCRV()p()( 202 uauDu ii
(10) Values for Di and u(Di) are given in Table 15 and 16 Figures 16-20 and shown in for each participant except Tubitak UME and UMTS. For BIM-NCM values are given for the original submitted and for the revised values.
- 16 -
NMI 15 °C 25 °C 37 °C
Di u(k = 1) Di u(k = 1) Di u(k = 1)
BIM-NCM rev -0.0036 0.0040 -0.0028 0.0040 -0.0014 0.0040
BIM-NCM org -0.0102 0.0040 -0.0104 0.0040 -0.0089 0.0040
Inmetro -0.0022 0.0016 -0.0017 0.0012 -0.0016 0.0013
DFM 0.0005 0.0008 0.0005 0.0007 0.0010 0.0007
PTB 0.0010 0.0013 0.0006 0.0013 -0.0004 0.0013
LNE -0.0018 0.0023 -0.0014 0.0018 -0.0035 0.0020
NMIJ 0.0001 0.0013 -0.0004 0.0013 0.0004 0.0016
MKEH -0.0006 0.0015 0.0012 0.0015 -0.0045 0.0030
CENAM -0.0045 0.0011 -0.0031 0.0012 -0.0014 0.0013
GUM -0.0001 0.0015 -0.0009 0.0017 -0.0031 0.0015
VNIIFTRI 0.0003 0.0030 0.0007 0.0037 -0.0010 0.0040
SMU 0.0009 0.0011 0.0011 0.0011 0.0015 0.0011
NIMT -0.0038 0.0026 -0.0052 0.0025 -0.0033 0.0040
NIST 0.0014 0.0008 0.0011 0.0009 0.0006 0.0020
Indecopi 0.0024 0.0021 -0.0012 0.0020 -0.0012 0.0021
Tubitak UME - - 0.7150 0.0028- -0.0521- 0.038
UMTS -0.1280 0.0021- -0.1103- -0.0019 -0.1177- 0.0039-
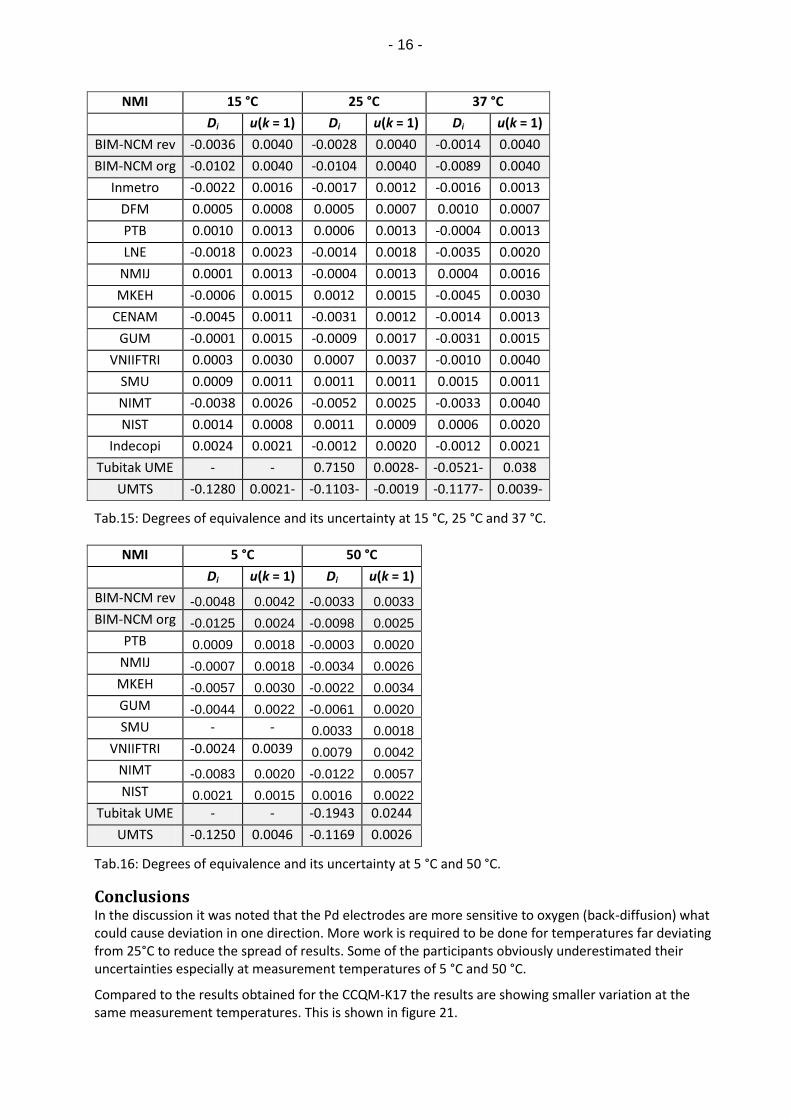
Tab.15: Degrees of equivalence and its uncertainty at 15 °C, 25 °C and 37 °C.
NMI 5 °C 50 °C
Di u(k = 1) Di u(k = 1)
BIM-NCM rev -0.0048 0.0042 -0.0033 0.0033
BIM-NCM org -0.0125 0.0024 -0.0098 0.0025
PTB 0.0009 0.0018 -0.0003 0.0020
NMIJ -0.0007 0.0018 -0.0034 0.0026
MKEH -0.0057 0.0030 -0.0022 0.0034
GUM -0.0044 0.0022 -0.0061 0.0020
SMU - - 0.0033 0.0018
VNIIFTRI -0.0024 0.0039 0.0079 0.0042
NIMT -0.0083 0.0020 -0.0122 0.0057
NIST 0.0021 0.0015 0.0016 0.0022
Tubitak UME - - -0.1943 0.0244
UMTS -0.1250 0.0046 -0.1169 0.0026
Tab.16: Degrees of equivalence and its uncertainty at 5 °C and 50 °C.
Conclusions In the discussion it was noted that the Pd electrodes are more sensitive to oxygen (back-diffusion) what could cause deviation in one direction. More work is required to be done for temperatures far deviating from 25°C to reduce the spread of results. Some of the participants obviously underestimated their uncertainties especially at measurement temperatures of 5 °C and 50 °C.
Compared to the results obtained for the CCQM-K17 the results are showing smaller variation at the same measurement temperatures. This is shown in figure 21.

- 17 -
How far the light shines Phthalate reference buffer solutions are widely used as pH standards in acid range. Participants successfully took part in the KC CCQM-K91 demonstrate their capability to measure the pH of primary buffer in the acid range of pH (25°C) = 3.8 to pH = 4.2. Problems occurred at 5 °C and 50 °C measurement temperatures. The spread of results is much higher as at 25 °C. This has to be taken into for CMC claims for pH different from 25 °C.
Acknowledgment The coordinating laboratory gratefully acknowledges the contributions of all participants and of the members of the CCQM EAWG for their valuable suggestions concerning and the evaluation process.
Figures
Fig 6: CCQM-K91 pa0 at 15 °C. The uncertainty of the results is the standard uncertainty (k = 1). The results of TR and UA are not shown. Red line: KCRV and dotted lines uncertainty of the KCRV (k = 2).
- 18 -
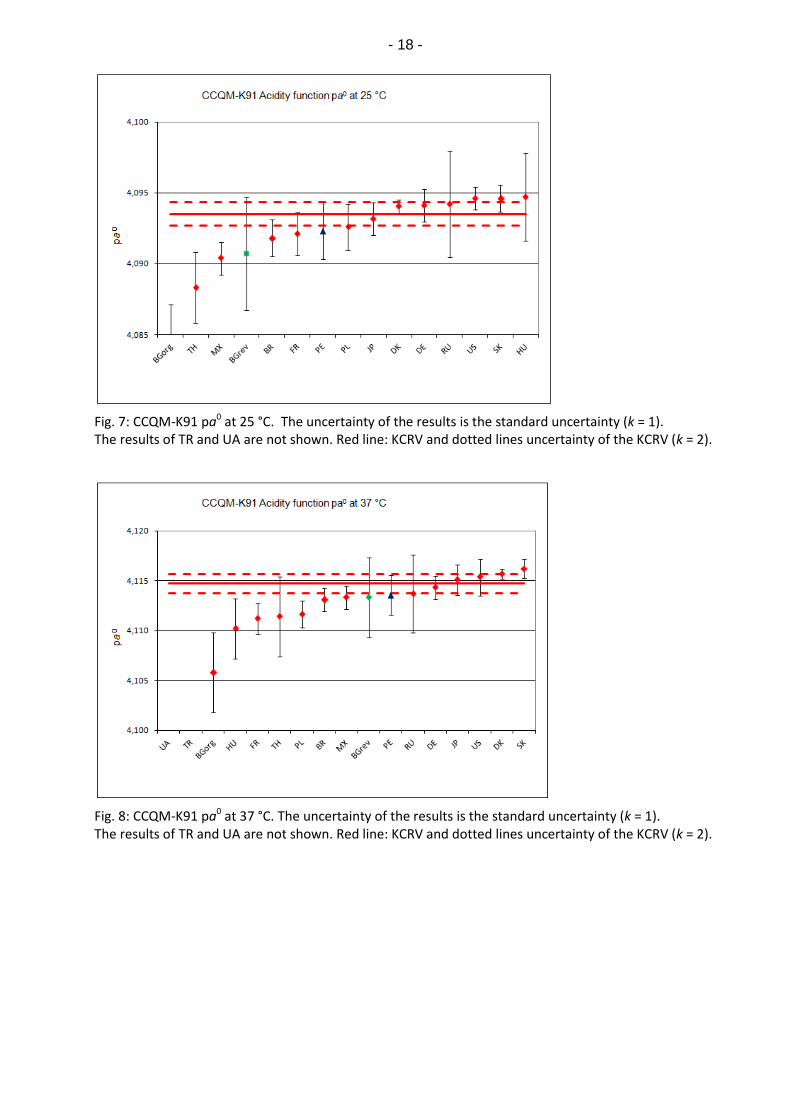
Fig. 7: CCQM-K91 pa0 at 25 °C. The uncertainty of the results is the standard uncertainty (k = 1). The results of TR and UA are not shown. Red line: KCRV and dotted lines uncertainty of the KCRV (k = 2).
Fig. 8: CCQM-K91 pa0 at 37 °C. The uncertainty of the results is the standard uncertainty (k = 1). The results of TR and UA are not shown. Red line: KCRV and dotted lines uncertainty of the KCRV (k = 2).

- 19 -
Fig. 9: CCQM-K91 pa0 at 5 °C. The uncertainty of the results is the standard uncertainty (k = 1). The results of UA are not shown. Red line: KCRV and dotted lines uncertainty of the KCRV (k = 2).
Fig. 10: CCQM-K91 pa0 at 50 °C. The uncertainty of the results is the standard uncertainty (k = 1). The results of TR and UA are not shown. Red line: KCRV and dotted lines uncertainty of the KCRV (k = 2).

- 20 -
Fig. 11: Standard potential of the Ag/AgCl electrodes at 25 °C. The result of HU is out of range.
Fig. 12: Standard uncertainty (k = 1) of the regression line at 15 °C, 25 °C and 37 °C.
Fig. 13: Standard uncertainty (k = 1) of the regression line at 5 °C and 50 °C.

- 21 -
Fig. 14: Slope of the regression line at 15°C, 25 °C and 37 °C.
Fig. 15: Slope of the regression line at 5°C and 50 °C.

- 22 -
Fig, 16: Degree of Equivalence and its uncertainty (k = 2) at 15 °C. The result of UA is out of range.
Fig, 17: Degree of Equivalence and its uncertainty (k = 2) at 25 °C. The results of TR and UA are out of range.
-0,015
-0,010
-0,005
0,000
0,005
0,010 D
i
Degree of Equivalence at 15 °C
-0,015
-0,010
-0,005
0,000
0,005
0,010
Di
Degree of Equivalence at 25 °C
- 23 -
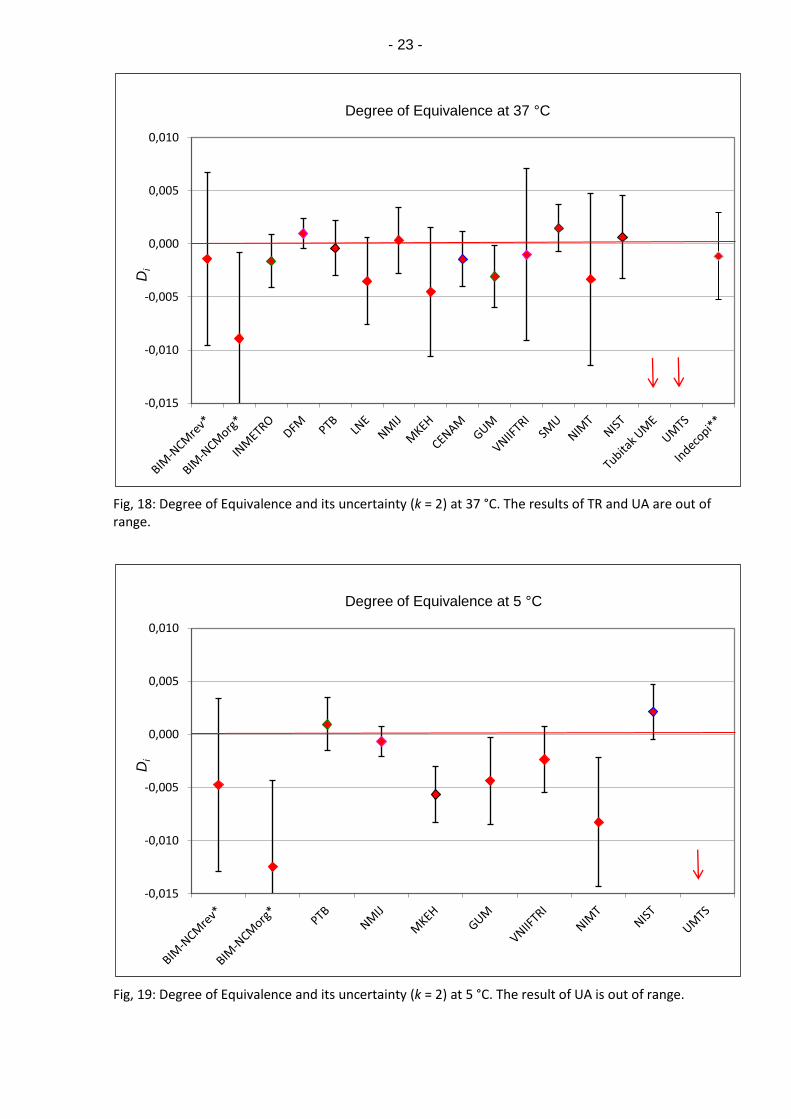
Fig, 18: Degree of Equivalence and its uncertainty (k = 2) at 37 °C. The results of TR and UA are out of range.
Fig, 19: Degree of Equivalence and its uncertainty (k = 2) at 5 °C. The result of UA is out of range.
-0,015
-0,010
-0,005
0,000
0,005
0,010 D
i
Degree of Equivalence at 37 °C
-0,015
-0,010
-0,005
0,000
0,005
0,010
Di
Degree of Equivalence at 5 °C

- 24 -
Fig, 20: Degree of Equivalence and its uncertainty (k = 2) at 50 °C. The results of TR and UA are out of range.
Fig, 21: Degree of Equivalence and its uncertainty (k = 2) at 25 °C. Compared are the results for CCQM-K17 and for CCQM-K91.
-0,015
-0,010
-0,005
0,000
0,005
0,010 D
i
Degree of Equivalence at 50 °C