Embed Size (px)
Citation preview

FINAL REPORT ON A COLD CLIMATE PERMEABLE INTERLOCKING CONCRETE PAVEMENT TEST FACILITY AT THE
UNIVERSITY OF NEW HAMPSHIRE STORMWATER CENTER
May 2013
Submitted to
INTERLOCKING CONCRETE PAVEMENT INSTITUTE FOR EDUCATION AND RESEARCH
NEW ENGLAND CONCRETE MASONRY ASSOCIATION NORTHEAST CEMENT SHIPPERS ASSOCIATION
Prepared and Conducted by
Robert M. Roseen, D.WRE, PE., PhD. Associate, Geosyntec Consultants Principal Investigator, Adjunct Professor, UNHSC Phone: 617-992-9067 [email protected] Timothy A. Puls, EIT Site Facility Manager Phone: 603-343-6672 [email protected]
James J. Houle, CPSWQ Program Manager, Outreach Coordinator Phone: 603-767-7091 [email protected] Thomas P. Ballestero, PE, PhD Director Phone: 603-862-1405 [email protected]
University of New Hampshire Stormwater Center (UNHSC) Gregg Hall ● 35 Colovos Road ● Durham, New Hampshire 03824-3534 ● http://www.unh.edu/unhsc/

PICP Final Performance Report The University of New Hampshire Stormwater Center-May 2013
Acknowledgements Many thanks to the generous donors whom made this research possible:
Genest Concrete Works, Inc.
Hanson Hardscape Products
New England Concrete Masonry Association
Nicolock Pavers
Northeast Cement Shippers Association
Oldcastle Architectural Products
Pavers by Ideal
Pavestone Company
SF Concrete Products
Techo Bloc, Inc.
Unilock

PICP Final Performance Report The University of New Hampshire Stormwater Center-May 2013
FINAL REPORT ON A COLD CLIMATE PERMEABLE INTERLOCKING CONCRETE PAVEMENT TEST FACILITY - MAY 2013 BY THE UNIVERSITY OF NEW HAMPSHIRE STORMWATER CENTER
TABLE OF CONTENTS Acknowledgements .............................................................................................................................................. 2
1.0 EXECUTIVE SUMMARY ................................................................................................ 1
2.0 INTRODUCTION .......................................................................................................... 2
3.0 FIELD FACILITY ............................................................................................................ 2
3.1 System Description, Configuration and Sizing _________________________________________ 2
3.2 Subgrade Soils __________________________________________________________________ 7
3.3 Reference TSS Information ________________________________________________________ 7
4.0 INSTRUMENTATION AND MEASURING TECHNIQUES ................................................... 8
4.1 Flow _________________________________________________________________________ 8
4.2 Rainfall Collection and Measurement _______________________________________________ 8
4.3 Other Measurements ____________________________________________________________ 8
4.4 Water Quality Analysis ___________________________________________________________ 8
5.0 TEST PROCEDURES...................................................................................................... 9
5.1 Field Sampling Procedures ________________________________________________________ 9
6.0 MAINTENANCE ......................................................................................................... 11
7.0 DATA EVALUATION .................................................................................................. 12
8.0 RESULTS ................................................................................................................... 13
8.1 Water Quality and Quantity Performance ___________________________________________ 13
8.2 Particle Size Distribution _________________________________________________________ 21
8.3 Real-Time Water Quality Parameters _______________________________________________ 21
8.4 Thermal Performance and Comparison _____________________________________________ 22
9.0 OUTREACH AND EDUCATION .................................................................................... 22
10.0 SUMMARY AND CONCLUSIONS ................................................................................. 23
11.0 REFERENCES ............................................................................................................. 24
APPENDIX A: University of New Hampshire Hood House Drive and J Lot Upgrades: Site Plans. ........................................................................................................................................... 25
PICP Final Performance Report The University of New Hampshire Stormwater Center-May 2013
APPENDIX B: Analysis of soils from test pits at Hood House, University of New Hampshire Durham, NH dug on April 15, 2010. ...................................................................................... 32
APPENDIX C: General specifications for Tymco 210 Regenerative Air Sweeper. ..................... 41
APPENDIX D: General specifications for Tymco 500X High Side Dump Regenerative Air Sweeper. ............................................................................................................................. 42
APPENDIX E: Photos of various conditions of the UNH PICP installation during the testing period. ................................................................................................................................ 43
APPENDIX F: Results of particle size distribution analysis by laser diffraction. ....................... 44
APPENDIX G: Final factsheet in the UNHSC 2012 biennial report. .......................................... 46
APPENDIX H: Concrete paver test results. ............................................................................. 49
APPENDIX I: Memo from UNH Facilities. .............................................................................. 51
LIST OF FIGURES Figure 1: August 2010 installation of PICP system (clockwise from top left) demolition and excavation, placement of subbase aggregate, finished product, underdrain installation. ..................................................................................... 3 Figure 2: Location map of the PICP Test Site. ................................................................................................................ 4 Figure 3: Typical PICP Hood House Drive Cross Section. The concrete haunches on both sides of the granite curbs are not typical to most PICP applications. The use of the concrete in this detail is specific to the University of New Hampshire...................................................................................................................................................................... 5 Figure 4: Check dam and perforated underdrain configurations. On the left is J Lot and the right is Hood House Drive. J Lot is the section being monitored for this study. ............................................................................................. 5 Figure 5: T Lot – PICP influent monitoring location ....................................................................................................... 6 Figure 6: Picture of T Lot effluent location. T Lot is to the upper right in this picture.................................................... 6 Figure 7: Total suspended solids (TSS) concentrations for varied land uses and at UNH Stormwater Center (Source: National Stormwater Quality Database, 2005, UNHSC, 2007) ...................................................................................... 7 Figure 8: Surface Inundation Test Equipment; A variation on ASTM C 1701 and D 3385-03 ........................................ 9 Figure 9: Infiltration rate monitoring over time of 3 separate locations representing different loading and usage characteristics. ............................................................................................................................................................. 11 Figure 10: Total Volume of Influent and Effluent and Rainfall Depth for the Research Period of the Permeable Interlocking Concrete Pavement Treatment System. .................................................................................................. 16 Figure 11: Thermal performance comparison of PICP, porous asphalt, pervious concrete and conventional asphalt. Measurements taken on June 21, 2012. ...................................................................................................................... 22 Figure 12: Run on from an intersecting pedestrian walkway. ..................................................................................... 43 Figure 13: Loss of No. 8 stone along curb line due to erosion and cleaning. ............................................................... 43 Figure 14: Another area of run on from an intersecting pedestrian walkway. ............................................................ 43 Figure 15: No. 8 joint stone has settled approximately 1 inch. .................................................................................... 43 Figure 16: Snow cover after plowing but before sun begins to warm up pavement. .................................................. 43 Figure 17: Run on from intersecting MUB drive. ......................................................................................................... 43

PICP Final Performance Report The University of New Hampshire Stormwater Center-May 2013
LIST OF TABLES Table 1: Laboratory analytical methods and detection limits for each analyte. ........................................................... 8 Table 2: Rainfall-Runoff event characteristics for 26 storm events; 18 events sampled for water quality analyses. .. 14 Table 3: Rainfall-Runoff event statistics for 26 storm events including volume reduction calculations. ..................... 15 Table 4: Water quality performance for sediments with pollutant mass balance. ..................................................... 17 Table 5: Water quality performance for hydrocarbons and zinc, with pollutant mass balance. ................................. 18 Table 6: Water quality performance for total nitrogen and dissolved inorganic nitrogen (NO2, N03, NH4), with pollutant mass balance. ............................................................................................................................................... 19 Table 7: Water quality performance for total phosphorus and ortho-phosphate with pollutant mass balance ......... 20 Table 8: Real-time water quality parameters per event. ............................................................................................. 21

Page 1 PICP Performance Evaluation Report The University of New Hampshire Stormwater Center-May 2013
FINAL REPORT ON UNHSC COLD CLIMATE PERMEABLE INTERLOCKING CONCRETE PAVEMENT TEST FACILITY-THE UNIVERSITY OF NEW HAMPSHIRE STORMWATER CENTER-MAY 2013 1.0 EXECUTIVE SUMMARY University of New Hampshire Stormwater Center (UNHSC) completed a two year field verification study of a permeable interlocking concrete pavement (PICP) stormwater management system. The purpose of this study was to evaluate the cold climate functionality of a PICP in an institutional setting. Monitoring took place from October 2010 through April 2012 on the University of New Hampshire (UNH) main campus in Durham, NH. The installation converted Hood House Drive and adjoining J Lot from a standard asphalt surface to a PICP system in the summer of 2010. The pre-existing condition included no stormwater control measures and conveyed surface runoff into the municipal storm sewer. The PICP system was designed by Appledore Engineering, Inc. in association with UNHSC and the Interlocking Concrete Pavement Institute (ICPI). An ICPI recommended PICP profile was used for the study site for the drive and a modified section with reservoir was used in the parking area. The treatment area includes direct rainfall over the system area and run-on from three pedestrian walkways and Memorial Union Building Drive. Concrete pavers and the surrounding grassed landscaping are separated by granite curbing. Rainfall is designed to filter down through the PICP system and into an infiltration reservoir. Excess stormwater is drained through internal drainage which discharges subsurface to the municipal storm sewer system. Pollutant loading is estimated by monitoring runoff from an adjacent parking lot at Thompson Hall (T Lot) which is similar in size, usage, and location. Project objectives included: 1) Water Quantity and Water Quality Monitoring, 2) Surface Infiltration Testing, 3) Thermal Performance and Comparisons, and 4) Educational Outreach. In particular the Test Facility has been examined with respect to cold climate functionality. Assessment of eleven water quality parameters comparing the PICP lot and a reference lot was used to evaluate performance metrics for the system. All analyses and procedures comply with the Technology Acceptance and Reciprocity Partnership (TARP), and the Technology Acceptance Protocol – Ecology (TAPE) guidelines to the maximum extent possible. The UNHSC operates under a detailed Quality Assurance Project Plan (QAPP) which is available on request. Following 2 years of monitoring that included 26 storms and 18 water sampling events, the performance for volume reduction and pollutant load reduction was exceptional for an instillation on a sandy clay soil (HSG-C). The USDA Soil Survey for the site is a Hollis-Charlton (very rocky, fine sandy loam). Local infiltration measurements are consistent with rates of a HSG-B soil at 3 in/hr. Volume reduction and subsequently pollutant mass removal exceeds 95% for all contaminants measured including sediment (TSS and SSC), metals (total Zinc - TZn), petroleum hydrocarbons (TPH), and nutrients (TP, ortho-P, TN, TKN, DIN = NO3, N02, NH4). Reductions in effluent concentrations were not observed for these same contaminants. This was presumably due to a concentration of pollutants caused by an exceptional volume

Page 2 PICP Performance Evaluation Report The University of New Hampshire Stormwater Center-May 2013
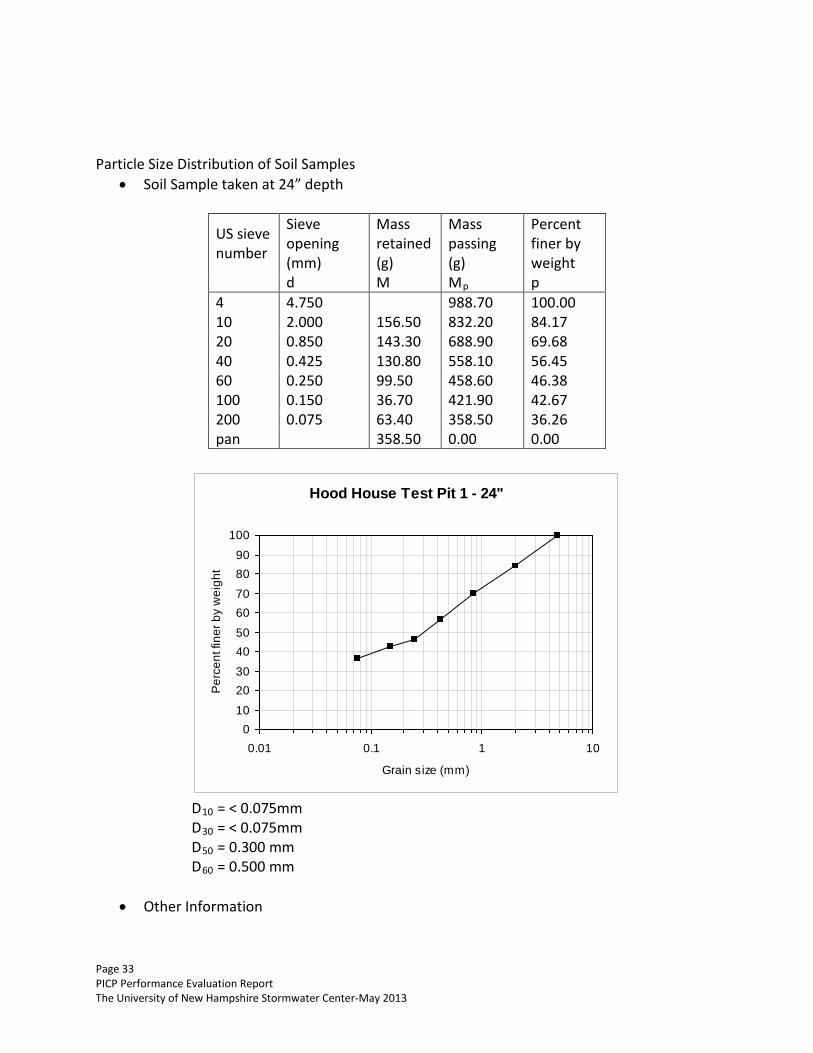
reduction. Effluent volumes in any single event never exceeded 5 gallons and peak flows were all less than 1 gallon per minute (with one exception). Surface infiltration testing shows modest average performance for the PICP installation. A substantial decline in infiltration was observed for areas subjected to run-on. Infiltration rates declined 69% over 21 months yet still retained greater than 1000 inches per hour capacity. Minimal maintenance was performed during the period of monitoring. Impacts from run-on underscore the importance of designs minimizing run-on. Thermal analyses were conducted comparing four pavement surface types at three different times. PICP surface temperatures were observed to be lower than that for porous asphalt, pervious concrete, and standard asphalt. Outreach activities were conducted during 2011 and 2012. Three porous pavement design workshops were performed. A full-day ICPI training was performed in collaboration with David Smith, the ICPI Technical Director. The training included a field visit to the Test Facility alongside other porous pavement installations throughout the UNH campus and the region. Participants learned key design principles necessary to successfully design, evaluate, specify, and install porous pavements for stormwater management. 2.0 INTRODUCTION Under an agreement with the Interlocking Concrete Pavement Institute (ICPI), field verification testing of a permeable interlocking concrete pavement (PICP) treatment system was conducted by the University of New Hampshire Stormwater Center (UNHSC) on the University campus in Durham, NH. Testing consisted of determining the water quality and quantity performance for a range of parameters including sediments, metals, nutrients, petroleum hydrocarbons, net effluent flow, and surface infiltration rates. PICP performance evaluations were conducted across two seasons and a range of rainfall conditions: important variables reflective of natural field performance conditions. This report presents the analyses and monitoring from October 2010 through April 2012. This included monitoring of 26 rainfall events and sampling of 18 events in total. 3.0 FIELD FACILITY
3.1 System Description, Configuration and Sizing The climatology of the area is characterized as a coastal, cool temperate forest. Average annual precipitation is 45 inches that is nearly uniformly distributed throughout the year, with average monthly precipitation of 4.02 in +/- 0.5. The mean annual temperature is 48°F, with the average low in January at 14°F, and the average high in July at 83°F. The UNH test site is a 13,500 square foot PICP system installed in the summer of 2010 on the UNH main campus in Durham, NH (Figure 1, Figure 2). The pre-existing Hood House Drive (7,000 square foot) and J Lot (6,500 square foot) were standard asphalt surfaces. The areas

Page 3 PICP Performance Evaluation Report The University of New Hampshire Stormwater Center-May 2013
previously had no stormwater controls and conveyed surface runoff to the downslope road and existing municipal stormwater system. Hood House Drive and J Lot are heavily used parking and driving surfaces during the school year. The PICP system was designed to: provide treatment by filtration through the subbase; promote infiltration and groundwater recharge; and underdrain to a central monitoring location, eventually flowing to the municipal storm sewer. The PICP installation treats direct rainfall and run-on from three intersecting pedestrian pathways and one moderately used road. While the entire installation was monitored for long-term infiltration capacity and surface temperature, only the J Lot portion was monitored for water quality.
Figure 1: August 2010 installation of PICP system (clockwise from top left) demolition and excavation, placement of subbase aggregate, finished product, underdrain installation.
Page 4 PICP Performance Evaluation Report The University of New Hampshire Stormwater Center-May 2013
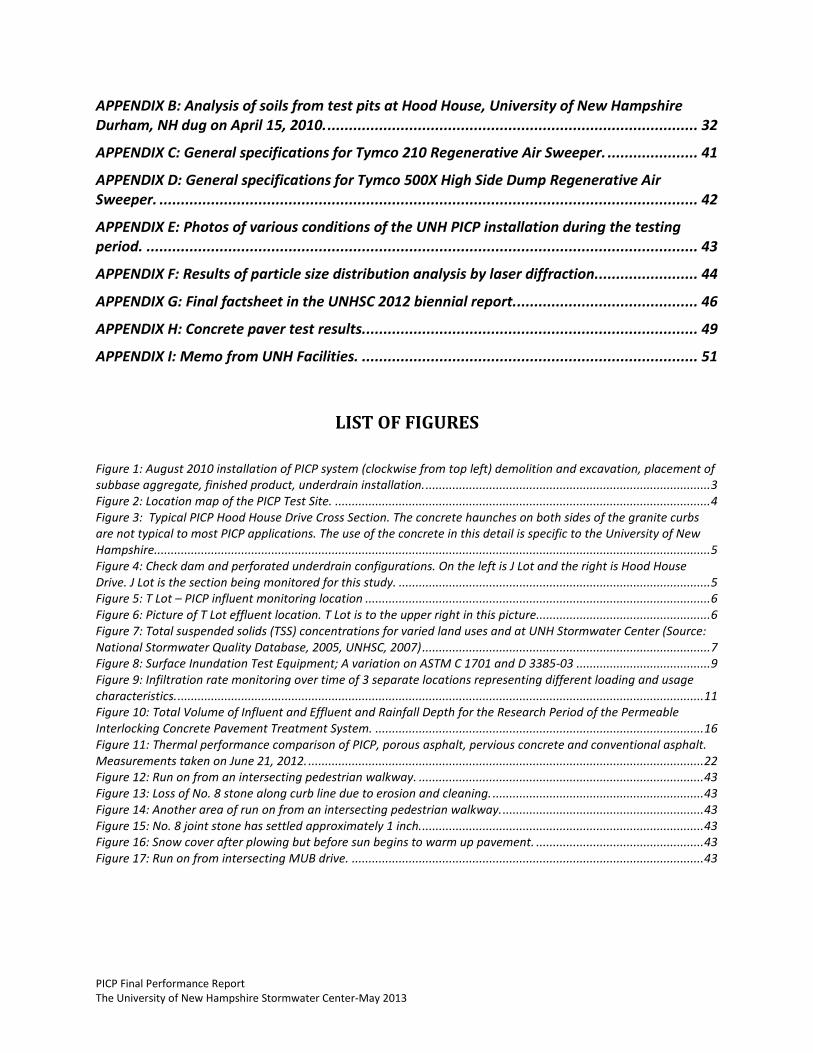
Figure 2: Location map of the PICP Test Site.
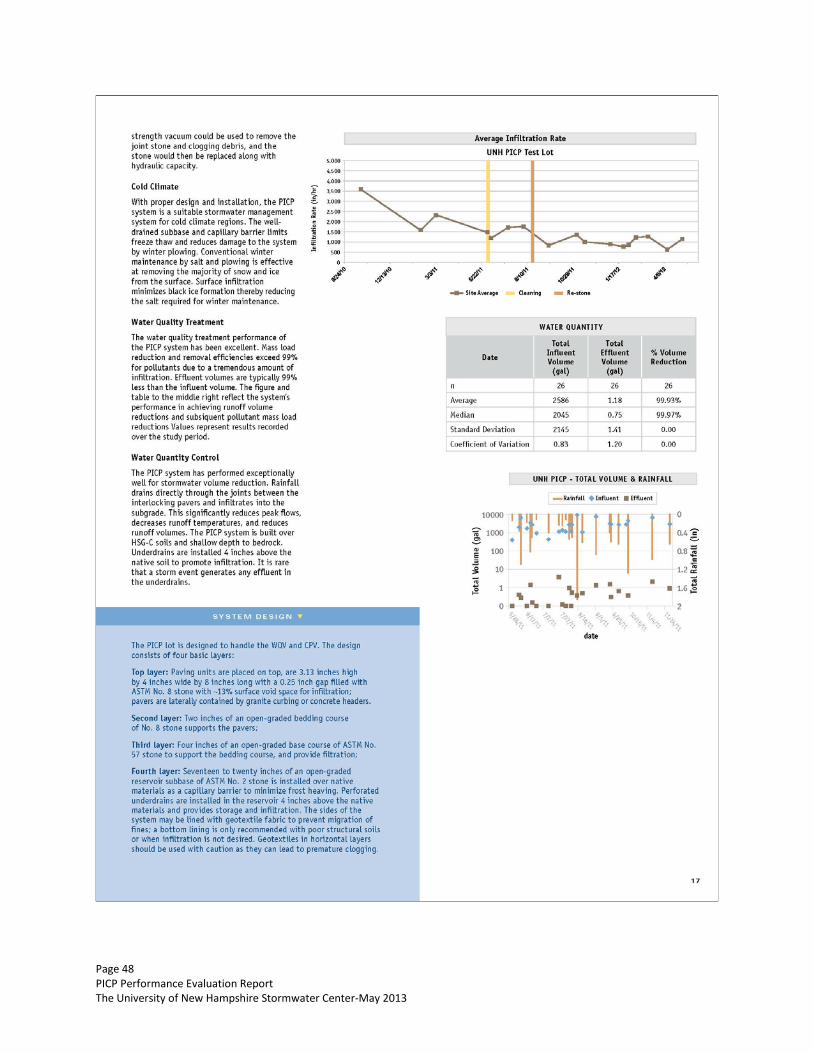
Appendix A includes project construction drawings and details. System configuration is an ICPI recommended profile (Figure 3). Concrete pavers were placed on a 2-inch bedding course of ASTM No. 8 aggregate. Appendix H provides test results on the concrete pavers which conform to ASTM C 936. The No. 8 aggregate was also used to fill the joints between the pavers. The bedding course is supported by a 4-inch open graded base layer of No. 57 aggregate. This layer was placed on a stone subbase reservoir of variable thickness of ASTM No. 2 aggregate. The thickness of the No. 2 subbase was 20 inches in the J Lot (the upper portion) areas, and 17 inches thick along the drive portion leading to Main Street. Below the subbase are native soils of sandy loam which have a high infiltration capacity of approximately 3 in/hr., measured in a test pit location prior to installation. The subbase and surface slopes of the PICP system are 6% and designed with internal grade controls. Two check dam and perforated underdrain configurations (Figure 4) were installed in the reservoir layer; one draining J Lot and the other Hood House Drive into an underground monitoring chamber. The J Lot underdrains are installed downstream of the check dams while the Hood House Drive underdrains are installed upstream. The check dams are constructed of 30 mil (0.762 mm) impermeable PVC liner installed in a stepped pattern (Figure 4). The perforated underdrains are placed 4 inches above the native soils. The J Lot configuration is intended to retain stormwater between events to promote denitrification within the subbase. The Hood House Drive configuration is intended to allow high flow events to bypass through the system more quickly. Both configurations allow the design storm event to infiltrate into the native soils. Each configuration has a unique outlet into the monitoring chamber. To date monitoring efforts have focused on the main parking area (J Lot) of the PICP system.
Page 5 PICP Performance Evaluation Report The University of New Hampshire Stormwater Center-May 2013
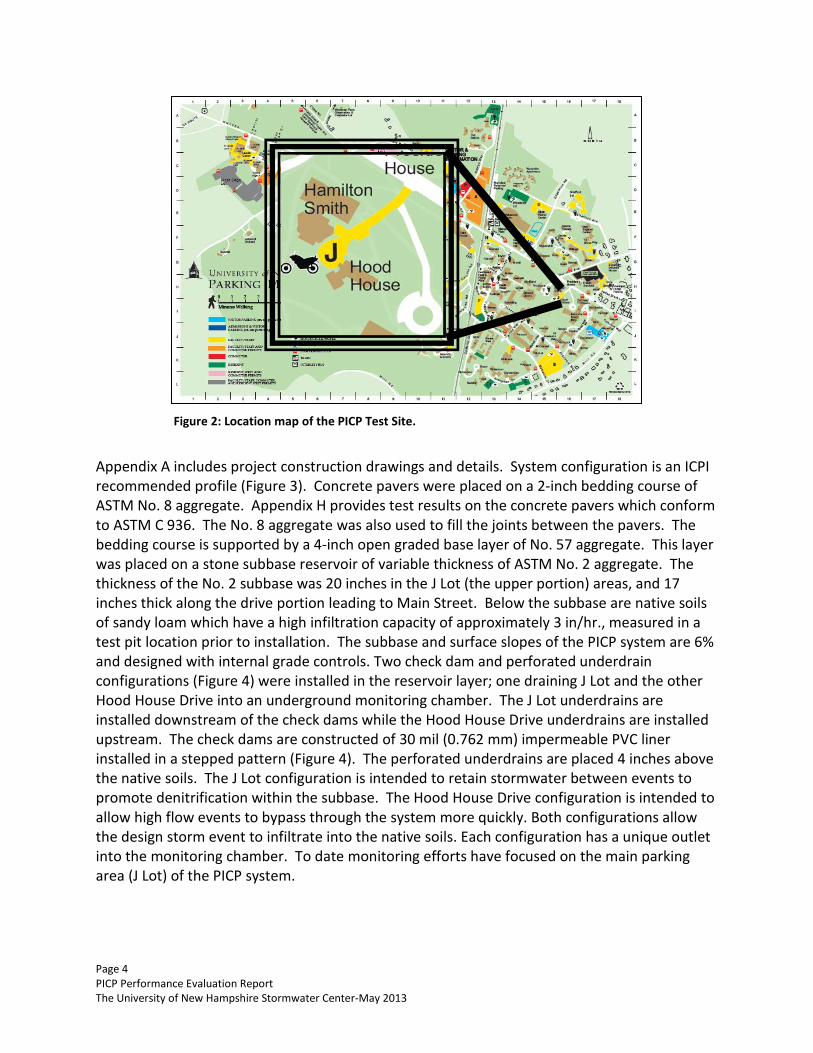
Figure 3: Typical PICP Hood House Drive Cross Section. The concrete haunches on both sides of the granite curbs are not typical to most PICP applications. The use of the concrete in this detail is specific to the University of New Hampshire.
Figure 4: Check dam and perforated underdrain configurations. On the left is J Lot and the right is Hood House Drive. J Lot is the section being monitored for this study.
The reference influent monitoring and rain gauge were located off T Lot (Figure 5), which is approximately 400 feet from the PICP effluent monitoring location. T Lot is adjacent to Thompson Hall and Dimond Library on the main University campus and is similar in size, usage, and rainfall characteristics. T Lot is a 12,000 square foot standard asphalt lot with approximately 50 parking spaces, granite curbing, and traffic consisting of both passenger vehicles and routine bus traffic. The area, like Hood House Drive and J Lot, is subject to frequent plowing, and deicing (salting) throughout winter months. Literature reviews indicate that pollutant concentrations from T Lot are above or equal to national norms for parking lot runoff. T Lot is drained by a typical catch basin and piping network. A 12 inch HDPE pipe conveys a portion of T Lot runoff to a surface location (Figure 6) where monitoring equipment is installed to collect data, gather samples, and monitor flow and rainfall depths.

Page 6 PICP Performance Evaluation Report The University of New Hampshire Stormwater Center-May 2013
Figure 5: T Lot – PICP influent monitoring location
Figure 6: Picture of T Lot effluent location. T Lot is to the upper right in this picture.
Page 7 PICP Performance Evaluation Report The University of New Hampshire Stormwater Center-May 2013
3.2 Subgrade Soils Prior to system design and construction, subgrade soils were examined. Soils categorized as Hydrologic Soil Group (HSG) B (NEH630.07, 2007) with an average infiltration rate of 3 inches per hour. Three test pits were dug however due to ledge outcrops were discovered at two of the test locations average infiltration rate from measured at one location on Hood House Drive was used. Appendix B (page 32) details test pit investigations. Two test pits (test pit #1 and #3) were dug down to 48 inches or until ledge outcrops impeded further excavation. Appendix B contains infiltration capacity (IC) and particle size distribution (PSD) of subbase soils located under Hood House Drive. Infiltration data is only available for Test Pit #2 and was measured at an average 3 inches per hour.
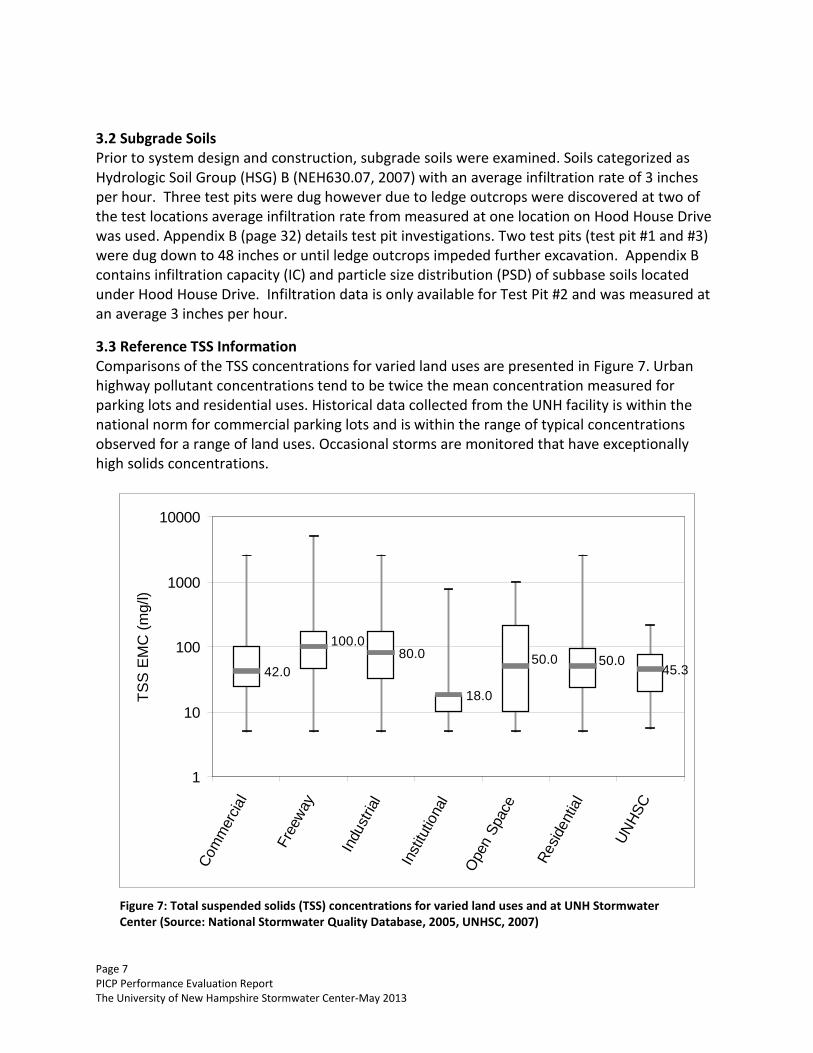
3.3 Reference TSS Information Comparisons of the TSS concentrations for varied land uses are presented in Figure 7. Urban highway pollutant concentrations tend to be twice the mean concentration measured for parking lots and residential uses. Historical data collected from the UNH facility is within the national norm for commercial parking lots and is within the range of typical concentrations observed for a range of land uses. Occasional storms are monitored that have exceptionally high solids concentrations.
Figure 7: Total suspended solids (TSS) concentrations for varied land uses and at UNH Stormwater Center (Source: National Stormwater Quality Database, 2005, UNHSC, 2007)
42.080.0
18.0
45.350.050.0
100.0
1
10
100
1000
10000
Com
mer
cial
Free
way
Indu
stria
l
Inst
itutio
nal
Ope
n Sp
ace
Resid
entia
l
UNHS
C
TSS
EM
C (m
g/l)

Page 8 PICP Performance Evaluation Report The University of New Hampshire Stormwater Center-May 2013
4.0 INSTRUMENTATION AND MEASURING TECHNIQUES
4.1 Flow Influent and effluent flow monitoring is accomplished with the use of Teledyne ISCO 6712 automated samplers. The samplers are equipped with Teledyne ISCO 730 Bubbler Flow Modules which work in conjunction with Thelmar compound weirs. Pre-established flow rating curves (Lehigh University, 1992) are used to convert depth readings to flow rates.
4.2 Rainfall Collection and Measurement Rainfall is monitored using a Teledyne ISCO 674 Rain Gauge. The gauge collects direct rainfall through a 6-inch diameter opening in a 2-foot high anodized aluminum housing; water flows through an HDPE funnel and into a tipping bucket. The tipping bucket is calibrated to take a reading every 0.01-inch of rainfall depth. The rain gauge connects to and stores data in the ISCO 6712 sampler located off T Lot.
4.3 Other Measurements Temperature, pH, specific conductivity, and dissolved oxygen are monitored using YSI 600XL multi-parameter sondes. These parameters are monitored at the effluent location during wet weather events only. Moisture, temperature, and electrical conductivity are measured within the system base materials using Decagon Devices 5TE probes in conjunction with Decagon Devices Em50 Data Loggers. The 5TE probes were installed during placement of the PICP system. Probes were installed in pairs at each interface of the base materials (i.e. two between the native soils and No. 2 stone reservoir; two between the No. 2 and No. 57 stone layers, etc.) Probes are paired for redundancy and because access to their location is impossible once installed.
4.4 Water Quality Analysis Samples were processed and analyzed by an EPA and National Environmental Laboratory Accreditation Conference (NELAC) certified laboratory using the standard methodologies outlined in Table 1. Table 1: Laboratory analytical methods and detection limits for each analyte.
Analyte Analytical Method Sample Detection Limit (mg/L)
Method Detection Limit (mg/L)a
Nitrate/Nitrite in water EPA 300.0A 0.1 0.008 Total Suspended Solids SM 2540 D Variable, 1-10 0.4 Suspended Sediment Concentration
ASTM D-3977 Variable, 1-2 1
Total Phosphorus EPA 365.3 0.01 0.008 Zinc in water EPA 200.7 0.01 0.001-0.05 Total Petroleum Hydrocarbons –Diesel Range
SW 3510C 8015B Variable ≤ 3.5 0.1-3.0

Page 9 PICP Performance Evaluation Report The University of New Hampshire Stormwater Center-May 2013
aMethod detection limit is different than sample detection limit which will often be higher due to available sample volume. SM = Standard Method, SW = Solid Waste 5.0 TEST PROCEDURES
5.1 Field Sampling Procedures PICP effluent is captured by an automated sampler (large runoff events) or a 5-gallon bucket (small runoff events). For the majority of events a 5-gallon bucket was sufficient to hold the entire effluent volume. In these cases full sample (total capture) methods were used as opposed to automated composite samples. Total capture methods were utilized due to the increased accuracy associated with system performance and the tremendous volume reduction occurring by infiltration into the native soils. The total capture volume is homogenized, measured, and split into 1 liter ISCO Pro-Pak bags using a United States Geological Survey (USGS) Dekaport Cone Sample Splitter. PICP influent sampling was achieved using a portable ISCO 6712 automated sampler. Influent samples were collected using a flow weighted sampling program. Programs are set to achieve a minimum of 70% coverage over the duration of the storm event. Individual samples are automatically discharged into 1 liter Pro Pak bags. Post-processing consists of compositing all relevant samples into identical 1 liter samples using the USGS Dekaport Cone Splitter. The 1 liter disposable LDPE sample bags are used to assure clean, non-contaminated sample containers. Samples are sealed and labeled with a unique, water proof, adhesive bar code that corresponds with a field identification label containing information relating to the stormwater treatment unit and date of sampling. Records are kept that correlate sample bar code with sample time, date, flow, and other real time water quality parameters. This begins the chain-of-custody record that accompanies each sample to track handling and transportation throughout the sampling process.
Figure 8: Surface Inundation Test Equipment; A variation on ASTM C 1701 and D 3385-03

Page 10 PICP Performance Evaluation Report The University of New Hampshire Stormwater Center-May 2013
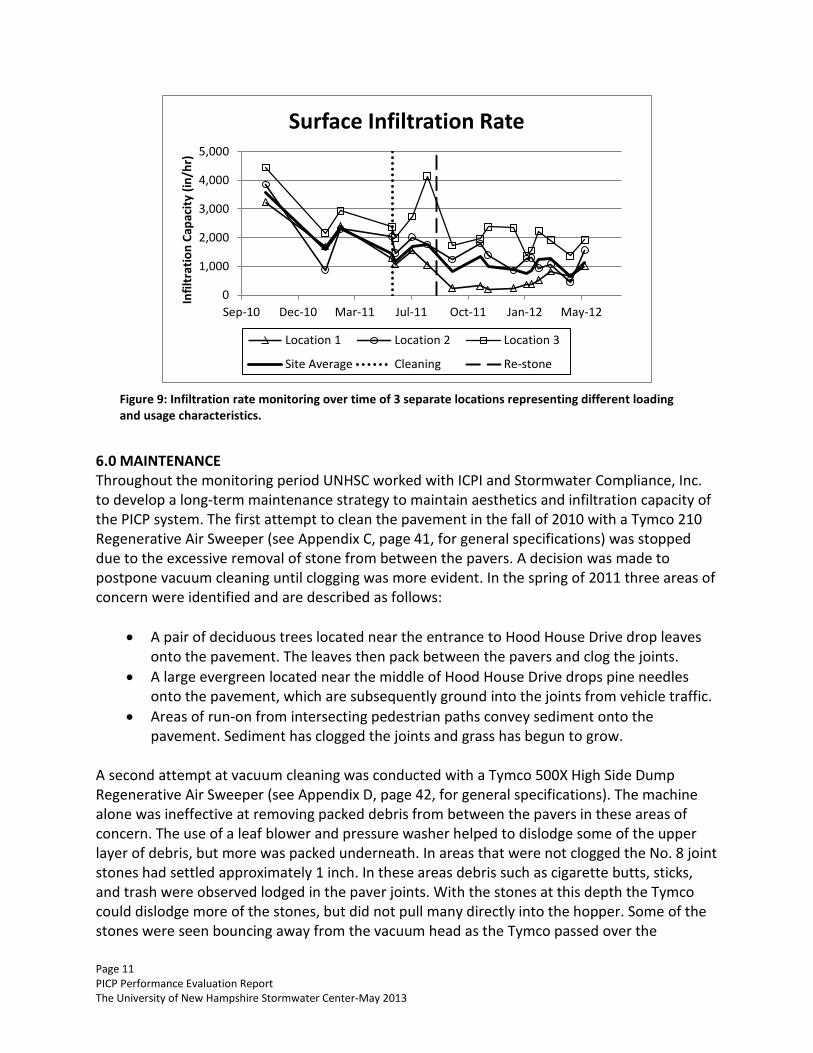
Infiltration rate (IR) measurements are developed using a modified surface inundation (SI) device. The modified SI is a falling head test that measures the time to infiltrate a known volume of water (0.56 gallons) through the permeable surface (Figure 8). SI measurements were taken at three separate locations on the PICP lot over 11 times throughout the study. The SI test is a modification of an ASTM Standard D 3385-03 (ASTM, 1988) in which the falling head SI test involves placing a cylinder of known diameter onto the pavement surface which is then sealed to the pavement surface (Briggs, 2006). The UNHSC SI test is similar to ASTM C 1701 for pervious concrete in which both methods measure the infiltration rate of a known volume of water through a pervious pavement. The difference is that the SI is a falling head test that starts time zero when the full volume of water is delivered to the infiltration device. C 1701 specifies that the known volume be delivered to the device at a rate that maintains a surface depth between 10mm to 15mm and starts time zero as soon as water contacts the pavement surface. Another difference is that the SI uses a closed-cell foam foot to seal the cylinder to the pavement surface and C 1701 specifies the use of plumbers putty as a sealant. Also, C 1701 generally requires at least 5 gallons of water to conduct, whereas the modified SI requires 0.56 gallons. SI tests were used to monitor the infiltration capacity of the PICP system through the duration of the study. Locations for infiltration capacity measurement were chosen to represent different use scenarios. Location 1 is located near the entrance to Hood House Drive and represents a high use area. This location receives run on from Memorial Union Building Drive, sediment tracking from vehicles entering the lot, and leaf litter from a pair of deciduous trees. Location 2 is subject to less vehicle traffic, less impervious surface run on, is located on a more gradual slope, and has an evergreen tree that drops needles onto the surface of the test lot. Location 3 is located in a level parking stall that receives little traffic, has no organic litter build up, and is representative of a low loading area. IR measurements over the research period are shown in Figure 9. A site average for the study area is plotted and based on relative area contributions and infiltration capacity.
Page 11 PICP Performance Evaluation Report The University of New Hampshire Stormwater Center-May 2013
Figure 9: Infiltration rate monitoring over time of 3 separate locations representing different loading and usage characteristics.
6.0 MAINTENANCE Throughout the monitoring period UNHSC worked with ICPI and Stormwater Compliance, Inc. to develop a long-term maintenance strategy to maintain aesthetics and infiltration capacity of the PICP system. The first attempt to clean the pavement in the fall of 2010 with a Tymco 210 Regenerative Air Sweeper (see Appendix C, page 41, for general specifications) was stopped due to the excessive removal of stone from between the pavers. A decision was made to postpone vacuum cleaning until clogging was more evident. In the spring of 2011 three areas of concern were identified and are described as follows:
• A pair of deciduous trees located near the entrance to Hood House Drive drop leaves onto the pavement. The leaves then pack between the pavers and clog the joints.
• A large evergreen located near the middle of Hood House Drive drops pine needles onto the pavement, which are subsequently ground into the joints from vehicle traffic.
• Areas of run-on from intersecting pedestrian paths convey sediment onto the pavement. Sediment has clogged the joints and grass has begun to grow.
A second attempt at vacuum cleaning was conducted with a Tymco 500X High Side Dump Regenerative Air Sweeper (see Appendix D, page 42, for general specifications). The machine alone was ineffective at removing packed debris from between the pavers in these areas of concern. The use of a leaf blower and pressure washer helped to dislodge some of the upper layer of debris, but more was packed underneath. In areas that were not clogged the No. 8 joint stones had settled approximately 1 inch. In these areas debris such as cigarette butts, sticks, and trash were observed lodged in the paver joints. With the stones at this depth the Tymco could dislodge more of the stones, but did not pull many directly into the hopper. Some of the stones were seen bouncing away from the vacuum head as the Tymco passed over the
0
1,000
2,000
3,000
4,000
5,000
Sep-10 Dec-10 Mar-11 Jul-11 Oct-11 Jan-12 May-12
Infil
trat
ion
Capa
city
(in/
hr)
Surface Infiltration Rate
Location 1 Location 2 Location 3
Site Average Cleaning Re-stone

Page 12 PICP Performance Evaluation Report The University of New Hampshire Stormwater Center-May 2013
pavement. It was also evident that many of the pavers were loose and could be wobbled by foot. Winter plowing and freeze-thaw did not dislodge any of the pavers. In August 2011, additional No. 8 joint stone was used to fill in the seams. This proved to stabilize the loose pavers and no further settling was observed through the monitoring period. Photo documentation of various conditions is provided in Appendix E. An operation and maintenance procedure for PICP placements is an area of acute interest for additional research. Results from work by Smith and Hunt (2010) indicated if a regenerative air machine is not used regularly, withdrawal of accumulated sediment requires use of a full vacuum machine. These machines have greater suction power than regenerative air machines which requires stone replenishment after cleaning. Winter maintenance including plowing and anti-icing/de-icing was handled independently by UNH facilities. A memo regarding equipment and procedures used is included in Appendix I. 7.0 DATA EVALUATION Data analyses are presented to examine PICP performance for water quality, quantity, infiltration, and surface reflectivity. Data and results are presented along with simple statistical analyses to examine performance trends. Data analyses included a range of approaches:
• evaluation of storm characteristics • table of influent and effluent event mean concentrations (EMC), volume and pollutant
mass summaries • simple statistics summary • particle size distribution (PSD) analysis • thermal survey information from various pavements
Storm characteristics for each sampled storm event are presented in Table 2. Included in this table are characteristics of 8 events that could not be sampled for water quality analyses. Out of these 8 events 6 had 100% total volume reduction and thus no effluent volume with which to produce water quality results. This helps to illustrate the infiltration capacity of the native materials providing excellent groundwater recharge and runoff reduction. EMC’s are presented in Table 4 through Table 7 along with volume and mass reduction for a range of seasons. EMC’s are used to represent the flow-proportional average concentration of a given parameter during a storm event. An EMC is the total constituent mass divided by the total runoff volume. When combined with flow measurement data, the EMC can be used to estimate the pollutant loading from a given storm, or on an annual basis. With respect to determination of EMC samples for the effluent flows both flow-weighted composite samples and total capture samples were taken. Total capture (entire storm volume) was used when available due to the higher data quality expectation. Total pollutant mass in the effluent samples were flow weighted to produce a relative EMC from total capture samples as a function of rainfall depth and the square footage of the test lot. Calculations are made according to the following equations:
Page 13 PICP Performance Evaluation Report The University of New Hampshire Stormwater Center-May 2013
Equation 1: Vi = Ap * Pe * 0.98 * 7.48 (gallons) Equation 2: Vr = 1 – (Vo/Vi) Equation 3: Massin = Vi * EMCin * 3785 Equation 4: Massout = Vo * TCout * 3785 Equation 5: %Mass Reduction = 1 – (Massout/Massin )
Where:
Vi = Direct volume into the system, or the runoff volume from impervious surface. Ap = Area of the pavement (6,500 ft2). Pe = The precipitation associated with the event. Vo = The volume out of the system collected and directly measured out of the system underdrain. Vr = The amount of water volume reduction expressed as a percentage. Massin = the total mass, in grams, of pollutant entering the system Massout = the total mass, in grams, of pollutant leaving the system EMCin = the measured laboratory results from the flow weighted composite sample taken at the reference influent location (T Lot). TCout = the measured laboratory results from the total capture sample taken at the effluent location.
And with: 0.98 = a runoff conversion typical of paved or impervious surfaces. 7.48 = volume conversion factor to yield gallons from cubic feet. 3785 = a conversion factor to get from gallons to liters and milligrams to grams.
8.0 RESULTS
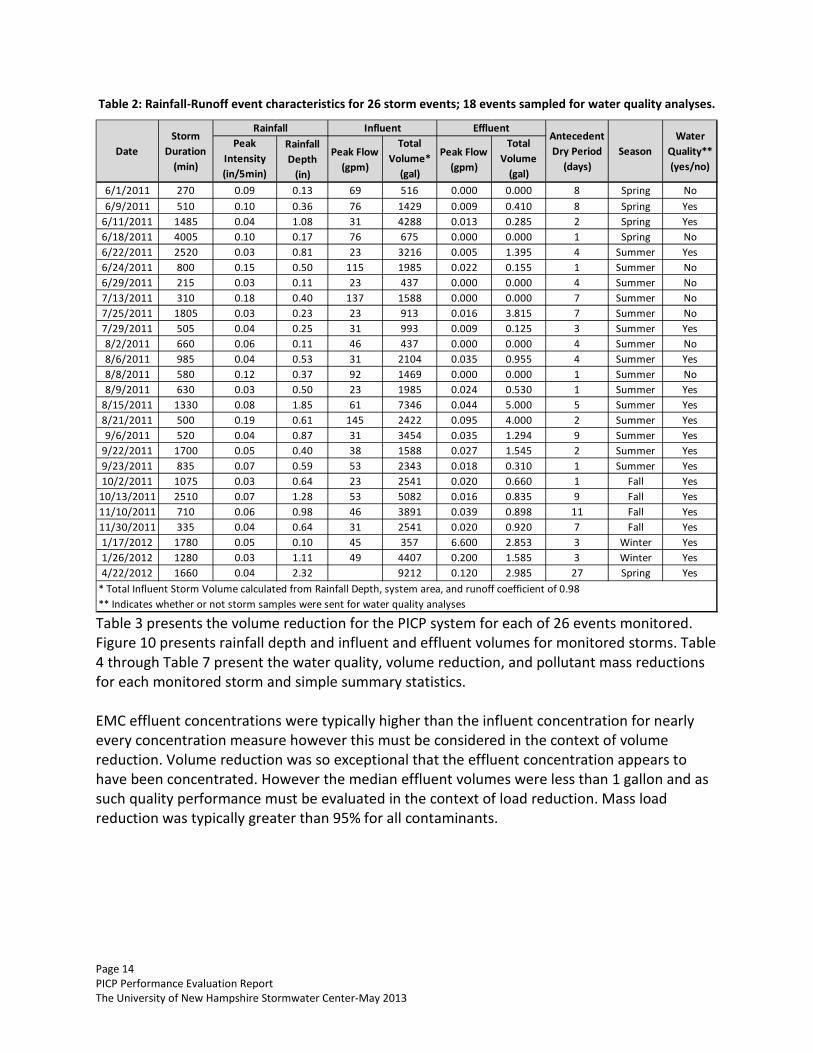
8.1 Water Quality and Quantity Performance Results presented below for the PICP Test Facility represent data collected from the period of monitoring from October 2010 through April 2012 conducted at the UNHSC field facility. The data set reflects rainfall across four seasons and covers a wide range of rainfall characteristics. Table 2 displays rainfall event characteristics and influent and effluent volume for 26 storms of which 18 events had sufficient volume to monitor for water quality. Storms ranged in size from low intensity to high intensity, small volume to large volume.
Page 14 PICP Performance Evaluation Report The University of New Hampshire Stormwater Center-May 2013
Table 2: Rainfall-Runoff event characteristics for 26 storm events; 18 events sampled for water quality analyses.
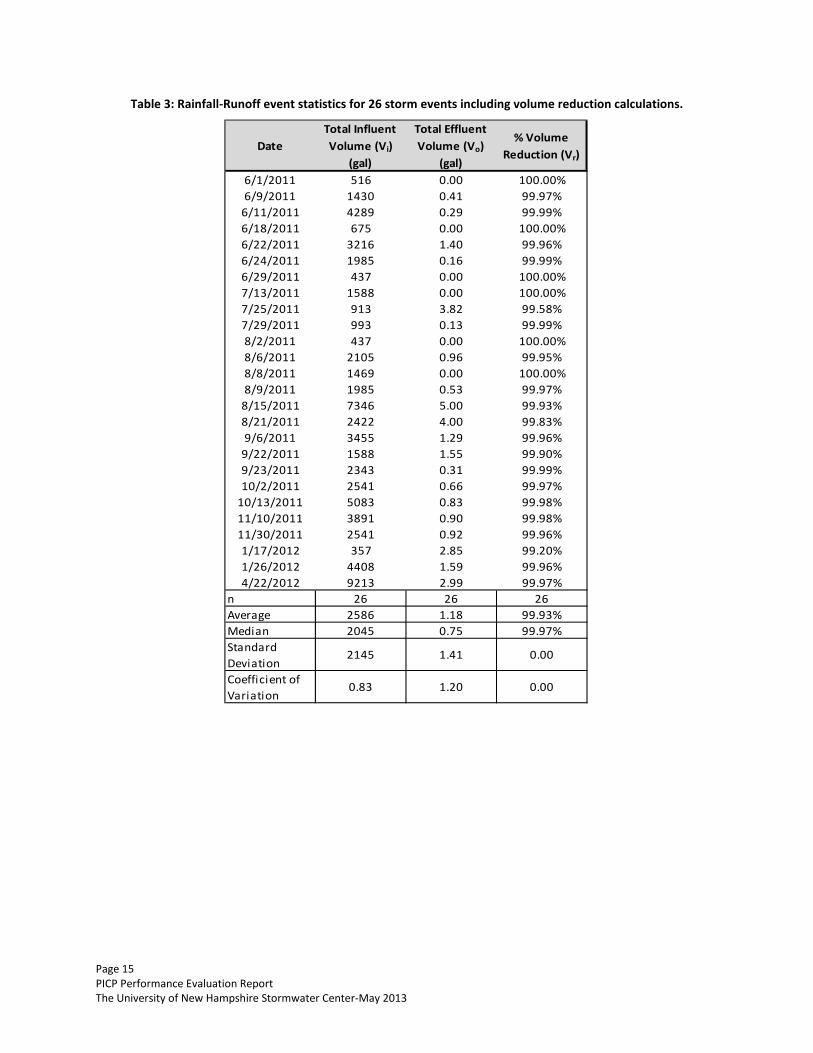
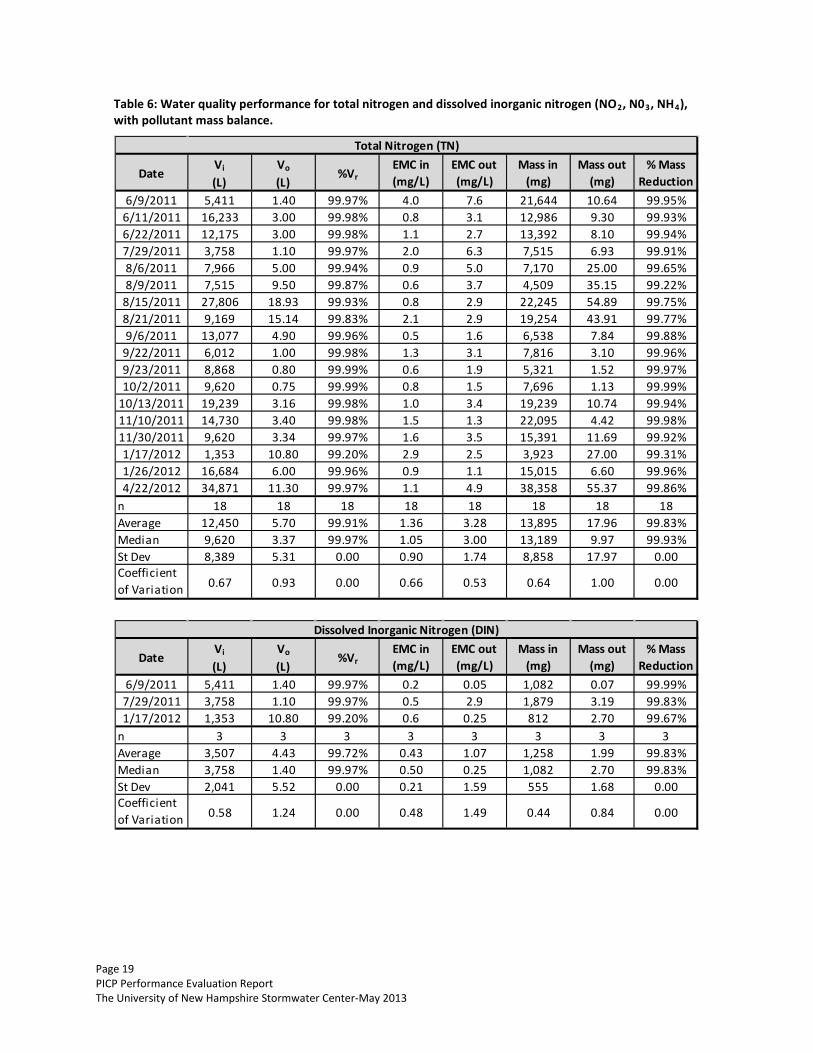
Table 3 presents the volume reduction for the PICP system for each of 26 events monitored. Figure 10 presents rainfall depth and influent and effluent volumes for monitored storms. Table 4 through Table 7 present the water quality, volume reduction, and pollutant mass reductions for each monitored storm and simple summary statistics. EMC effluent concentrations were typically higher than the influent concentration for nearly every concentration measure however this must be considered in the context of volume reduction. Volume reduction was so exceptional that the effluent concentration appears to have been concentrated. However the median effluent volumes were less than 1 gallon and as such quality performance must be evaluated in the context of load reduction. Mass load reduction was typically greater than 95% for all contaminants.
Peak Intensity (in/5min)
Rainfall Depth
(in)
Peak Flow (gpm)
Total Volume*
(gal)
Peak Flow (gpm)
Total Volume
(gal) 6/1/2011 270 0.09 0.13 69 516 0.000 0.000 8 Spring No6/9/2011 510 0.10 0.36 76 1429 0.009 0.410 8 Spring Yes
6/11/2011 1485 0.04 1.08 31 4288 0.013 0.285 2 Spring Yes6/18/2011 4005 0.10 0.17 76 675 0.000 0.000 1 Spring No6/22/2011 2520 0.03 0.81 23 3216 0.005 1.395 4 Summer Yes6/24/2011 800 0.15 0.50 115 1985 0.022 0.155 1 Summer No6/29/2011 215 0.03 0.11 23 437 0.000 0.000 4 Summer No7/13/2011 310 0.18 0.40 137 1588 0.000 0.000 7 Summer No7/25/2011 1805 0.03 0.23 23 913 0.016 3.815 7 Summer No7/29/2011 505 0.04 0.25 31 993 0.009 0.125 3 Summer Yes8/2/2011 660 0.06 0.11 46 437 0.000 0.000 4 Summer No8/6/2011 985 0.04 0.53 31 2104 0.035 0.955 4 Summer Yes8/8/2011 580 0.12 0.37 92 1469 0.000 0.000 1 Summer No8/9/2011 630 0.03 0.50 23 1985 0.024 0.530 1 Summer Yes
8/15/2011 1330 0.08 1.85 61 7346 0.044 5.000 5 Summer Yes8/21/2011 500 0.19 0.61 145 2422 0.095 4.000 2 Summer Yes9/6/2011 520 0.04 0.87 31 3454 0.035 1.294 9 Summer Yes
9/22/2011 1700 0.05 0.40 38 1588 0.027 1.545 2 Summer Yes9/23/2011 835 0.07 0.59 53 2343 0.018 0.310 1 Summer Yes10/2/2011 1075 0.03 0.64 23 2541 0.020 0.660 1 Fall Yes
10/13/2011 2510 0.07 1.28 53 5082 0.016 0.835 9 Fall Yes11/10/2011 710 0.06 0.98 46 3891 0.039 0.898 11 Fall Yes11/30/2011 335 0.04 0.64 31 2541 0.020 0.920 7 Fall Yes1/17/2012 1780 0.05 0.10 45 357 6.600 2.853 3 Winter Yes1/26/2012 1280 0.03 1.11 49 4407 0.200 1.585 3 Winter Yes4/22/2012 1660 0.04 2.32 9212 0.120 2.985 27 Spring Yes
* Total Influent Storm Volume calculated from Rainfall Depth, system area, and runoff coefficient of 0.98** Indicates whether or not storm samples were sent for water quality analyses
Influent EffluentRainfall
DateStorm
Duration (min)
Antecedent Dry Period
(days)Season
Water Quality** (yes/no)
Page 15 PICP Performance Evaluation Report The University of New Hampshire Stormwater Center-May 2013
Table 3: Rainfall-Runoff event statistics for 26 storm events including volume reduction calculations.
DateTotal Influent Volume (Vi)
(gal)
Total Effluent Volume (Vo)
(gal)
% Volume Reduction (Vr)
6/1/2011 516 0.00 100.00%6/9/2011 1430 0.41 99.97%
6/11/2011 4289 0.29 99.99%6/18/2011 675 0.00 100.00%6/22/2011 3216 1.40 99.96%6/24/2011 1985 0.16 99.99%6/29/2011 437 0.00 100.00%7/13/2011 1588 0.00 100.00%7/25/2011 913 3.82 99.58%7/29/2011 993 0.13 99.99%8/2/2011 437 0.00 100.00%8/6/2011 2105 0.96 99.95%8/8/2011 1469 0.00 100.00%8/9/2011 1985 0.53 99.97%
8/15/2011 7346 5.00 99.93%8/21/2011 2422 4.00 99.83%9/6/2011 3455 1.29 99.96%
9/22/2011 1588 1.55 99.90%9/23/2011 2343 0.31 99.99%10/2/2011 2541 0.66 99.97%
10/13/2011 5083 0.83 99.98%11/10/2011 3891 0.90 99.98%11/30/2011 2541 0.92 99.96%1/17/2012 357 2.85 99.20%1/26/2012 4408 1.59 99.96%4/22/2012 9213 2.99 99.97%
n 26 26 26Average 2586 1.18 99.93%Median 2045 0.75 99.97%Standard Deviation
2145 1.41 0.00
Coefficient of Variation
0.83 1.20 0.00

Page 16 PICP Performance Evaluation Report The University of New Hampshire Stormwater Center-May 2013
Figure 10: Total Volume of Influent and Effluent and Rainfall Depth for the Research Period of the Permeable Interlocking Concrete Pavement Treatment System.

Page 17 PICP Performance Evaluation Report The University of New Hampshire Stormwater Center-May 2013
Table 4: Water quality performance for sediments with pollutant mass balance.
DateVi
(L)Vo
(L)%Vr
EMC in (mg/L)
EMC out (mg/L)
Mass in (g)
Mass out (g)
% Mass Reduction
6/9/2011 5,411 1.40 99.97% 400 540 2164 0.76 99.97%6/11/2011 16,233 3.00 99.98% 29 140 471 0.42 99.91%6/22/2011 12,175 3.00 99.98% 10 12 122 0.04 99.97%7/29/2011 3,758 1.10 99.97% 51 45 192 0.05 99.97%8/6/2011 7,966 5.00 99.94% 38 29 303 0.15 99.95%8/9/2011 7,515 9.50 99.87% 75 100 564 0.95 99.83%
8/15/2011 27,806 18.93 99.93% 24 110 667 2.08 99.69%8/21/2011 9,169 15.14 99.83% 360 940 3301 14.23 99.57%9/6/2011 13,077 4.90 99.96% 22 74 288 0.36 99.87%
9/22/2011 6,012 1.00 99.98% 42 280 253 0.28 99.89%9/23/2011 8,868 0.80 99.99% 56 100 497 0.08 99.98%10/2/2011 9,620 0.75 99.99% 31 48 298 0.04 99.99%
10/13/2011 19,239 3.16 99.98% 80 130 1539 0.41 99.97%11/10/2011 14,730 3.40 99.98% 150 70 2209 0.24 99.99%11/30/2011 9,620 3.34 99.97% 140 51 1347 0.17 99.99%1/17/2012 1,353 10.80 99.20% 110 8 149 0.09 99.94%1/26/2012 16,684 6.00 99.96% 77 15 1285 0.09 99.99%4/22/2012 34,871 11.30 99.97% 320 17 11159 0.19 100.00%
n 18 18 18 18 18 18 18 18Average 12,450 5.70 99.91% 112 151 1,489 1.15 99.92%Median 9,620 3.37 99.97% 66 72 530 0.22 99.97%St Dev 8,389 5.31 0.00 121 234 2,573 3.30 0.00Coefficient of Variation 0.67 0.93 0.00 1.08 1.56 1.73 2.88 0.00
Total Suspended Sediments (TSS)
DateVi
(L)Vo
(L)%Vr
EMC in (mg/L)
EMC out (mg/L)
Mass in (g)
Mass out (g)
% Mass Reduction
6/11/2011 16,233 3.00 99.98% 29 140 471 0.42 99.91%6/22/2011 12,175 3.00 99.98% 18 19 219 0.06 99.97%8/6/2011 7,966 5.00 99.94% 29 20 231 0.10 99.96%8/9/2011 7,515 9.50 99.87% 53 69 398 0.66 99.84%
8/15/2011 27,806 18.93 99.93% 21 100 584 1.89 99.68%8/21/2011 9,169 15.14 99.83% 320 390 2,934 5.91 99.80%9/6/2011 13,077 4.90 99.96% 32 160 418 0.78 99.81%
10/2/2011 9,620 0.75 99.99% 42 530 404 0.40 99.90%11/10/2011 14,730 3.40 99.98% 140 49 2,062 0.17 99.99%11/30/2011 9,620 3.34 99.97% 61 48 587 0.16 99.97%1/17/2012 1,353 10.80 99.20% 110 1 149 0.01 99.99%1/26/2012 16,684 6.00 99.96% 79 16 1,318 0.10 99.99%
n 12 12 12 12 12 12 12 12Average 12,162 6.98 99.88% 78 129 815 0.89 99.90%Median 10,897 4.95 99.96% 48 59 445 0.28 99.93%St Dev 6,517 5.53 0.00 85 165 861 1.66 0.00Coefficient of Variation 0.54 0.79 0.00 1.09 1.29 1.06 1.88 0.00
Suspended Sediment Concentration (SSC)

Page 18 PICP Performance Evaluation Report The University of New Hampshire Stormwater Center-May 2013
Table 5: Water quality performance for hydrocarbons and zinc, with pollutant mass balance.
DateVi
(L)Vo
(L)%Vr
EMC in (ug/L)
EMC out (ug/L)
Mass in (mg)
Mass out (mg)
% Mass Reduction
6/22/2011 12,175 3.00 99.98% 430 157.5 5,235 0.47 99.99%7/29/2011 3,758 1.10 99.97% 800 158 3,006 0.17 99.99%8/6/2011 7,966 5.00 99.94% 610 410 4,859 2.05 99.96%8/9/2011 7,515 9.50 99.87% 410 350 3,081 3.33 99.89%
8/15/2011 27,806 18.93 99.93% 320 158 8,898 2.98 99.97%8/21/2011 9,169 15.14 99.83% 1,400 158 12,836 2.38 99.98%
10/13/2011 19,239 3.16 99.98% 710 5,100 13,660 16.12 99.88%11/10/2011 14,730 3.40 99.98% 660 1,100 9,722 3.74 99.96%11/30/2011 9,620 3.34 99.97% 570 370 5,483 1.24 99.98%n 9 9 9 9 9 9 9 9Average 12,442 6.95 99.94% 657 884 7,420 3.61 99.96%Median 9,620 3.40 99.97% 610 350 5,483 2.38 99.97%St Dev 7,297 6.23 0.00 318 1,609 4,018 4.85 0.00Coefficient of Variation 0.59 0.90 0.00 0.48 1.82 0.54 1.34 0.00
Total Petroleum Hydrocarbons - Diesel Range (TPH-D)
DateVi
(L)Vo
(L)%Vr
EMC in (mg/L)
EMC out (mg/L)
Mass in (mg)
Mass out (mg)
% Mass Reduction
6/9/2011 5,411 1.40 99.97% 0.14 0.26 758 0.36 99.95%6/11/2011 16,233 3.00 99.98% 0.03 0.12 487 0.36 99.93%6/22/2011 12,175 3.00 99.98% 0.03 0.01 365 0.03 99.99%7/29/2011 3,758 1.10 99.97% 0.10 0.07 376 0.08 99.98%8/6/2011 7,966 5.00 99.94% 0.05 0.07 398 0.35 99.91%8/9/2011 7,515 9.50 99.87% 0.03 0.05 225 0.48 99.79%
8/15/2011 27,806 18.93 99.93% 0.03 0.05 834 0.95 99.89%8/21/2011 9,169 15.14 99.83% 0.11 0.3 1,009 4.54 99.55%9/6/2011 13,077 4.90 99.96% 0.03 0.29 392 1.42 99.64%
9/22/2011 6,012 1.00 99.98% 0.07 0.08 421 0.08 99.98%9/23/2011 8,868 0.80 99.99% 0.03 0.07 266 0.06 99.98%10/2/2011 9,620 0.75 99.99% 0.02 0.03 192 0.02 99.99%
10/13/2011 19,239 3.16 99.98% 0.05 0.12 962 0.38 99.96%11/10/2011 14,730 3.40 99.98% 0.11 0.09 1,620 0.31 99.98%11/30/2011 9,620 3.34 99.97% 0.05 0.06 481 0.20 99.96%1/17/2012 1,353 10.80 99.20% 0.24 0.03 325 0.32 99.90%1/26/2012 16,684 6.00 99.96% 0.06 0.03 1,001 0.18 99.98%4/22/2012 34,871 11.30 99.97% 0.01 0.005 349 0.06 99.98%
n 18 18 18 18 18 18 18 18Average 12,450 5.70 99.91% 0.07 0.10 581 0.57 99.91%Median 9,620 3.37 99.97% 0.05 0.07 410 0.32 99.96%St Dev 8,389 5.31 0.00 0.06 0.09 374 1.05 0.00Coefficient of Variation 0.67 0.93 0.00 0.86 0.95 0.64 1.86 0.00
Total Zinc - (TZn)
Page 19 PICP Performance Evaluation Report The University of New Hampshire Stormwater Center-May 2013
Table 6: Water quality performance for total nitrogen and dissolved inorganic nitrogen (NO2, N03, NH4), with pollutant mass balance.
DateVi
(L)Vo
(L)%Vr
EMC in (mg/L)
EMC out (mg/L)
Mass in (mg)
Mass out (mg)
% Mass Reduction
6/9/2011 5,411 1.40 99.97% 4.0 7.6 21,644 10.64 99.95%6/11/2011 16,233 3.00 99.98% 0.8 3.1 12,986 9.30 99.93%6/22/2011 12,175 3.00 99.98% 1.1 2.7 13,392 8.10 99.94%7/29/2011 3,758 1.10 99.97% 2.0 6.3 7,515 6.93 99.91%8/6/2011 7,966 5.00 99.94% 0.9 5.0 7,170 25.00 99.65%8/9/2011 7,515 9.50 99.87% 0.6 3.7 4,509 35.15 99.22%
8/15/2011 27,806 18.93 99.93% 0.8 2.9 22,245 54.89 99.75%8/21/2011 9,169 15.14 99.83% 2.1 2.9 19,254 43.91 99.77%9/6/2011 13,077 4.90 99.96% 0.5 1.6 6,538 7.84 99.88%
9/22/2011 6,012 1.00 99.98% 1.3 3.1 7,816 3.10 99.96%9/23/2011 8,868 0.80 99.99% 0.6 1.9 5,321 1.52 99.97%10/2/2011 9,620 0.75 99.99% 0.8 1.5 7,696 1.13 99.99%
10/13/2011 19,239 3.16 99.98% 1.0 3.4 19,239 10.74 99.94%11/10/2011 14,730 3.40 99.98% 1.5 1.3 22,095 4.42 99.98%11/30/2011 9,620 3.34 99.97% 1.6 3.5 15,391 11.69 99.92%1/17/2012 1,353 10.80 99.20% 2.9 2.5 3,923 27.00 99.31%1/26/2012 16,684 6.00 99.96% 0.9 1.1 15,015 6.60 99.96%4/22/2012 34,871 11.30 99.97% 1.1 4.9 38,358 55.37 99.86%
n 18 18 18 18 18 18 18 18Average 12,450 5.70 99.91% 1.36 3.28 13,895 17.96 99.83%Median 9,620 3.37 99.97% 1.05 3.00 13,189 9.97 99.93%St Dev 8,389 5.31 0.00 0.90 1.74 8,858 17.97 0.00Coefficient of Variation 0.67 0.93 0.00 0.66 0.53 0.64 1.00 0.00
Total Nitrogen (TN)
DateVi
(L)Vo
(L)%Vr
EMC in (mg/L)
EMC out (mg/L)
Mass in (mg)
Mass out (mg)
% Mass Reduction
6/9/2011 5,411 1.40 99.97% 0.2 0.05 1,082 0.07 99.99%7/29/2011 3,758 1.10 99.97% 0.5 2.9 1,879 3.19 99.83%1/17/2012 1,353 10.80 99.20% 0.6 0.25 812 2.70 99.67%
n 3 3 3 3 3 3 3 3Average 3,507 4.43 99.72% 0.43 1.07 1,258 1.99 99.83%Median 3,758 1.40 99.97% 0.50 0.25 1,082 2.70 99.83%St Dev 2,041 5.52 0.00 0.21 1.59 555 1.68 0.00Coefficient of Variation 0.58 1.24 0.00 0.48 1.49 0.44 0.84 0.00
Dissolved Inorganic Nitrogen (DIN)

Page 20 PICP Performance Evaluation Report The University of New Hampshire Stormwater Center-May 2013
Table 7: Water quality performance for total phosphorus and ortho-phosphate with pollutant mass balance
DateVi
(L)Vo
(L)%Vr
EMC in (mg/L)
EMC out (mg/L)
Mass in (mg)
Mass out (mg)
% Mass Reduction
6/9/2011 5,411 1.40 99.97% 0.81 1.10 4,383 1.54 99.96%6/11/2011 16,233 3.00 99.98% 0.17 0.50 2,760 1.50 99.95%6/22/2011 12,175 3.00 99.98% 0.11 0.14 1,339 0.42 99.97%7/29/2011 3,758 1.10 99.97% 0.17 0.27 639 0.30 99.95%8/6/2011 7,966 5.00 99.94% 0.13 0.48 1,036 2.40 99.77%8/9/2011 7,515 9.50 99.87% 0.09 0.49 676 4.66 99.31%
8/15/2011 27,806 18.93 99.93% 0.06 0.37 1,668 7.00 99.58%8/21/2011 9,169 15.14 99.83% 0.27 0.92 2,476 13.93 99.44%9/6/2011 13,077 4.90 99.96% 0.10 0.21 1,308 1.03 99.92%
9/22/2011 6,012 1.00 99.98% 0.21 0.36 1,263 0.36 99.97%9/23/2011 8,868 0.80 99.99% 0.06 0.17 532 0.14 99.97%10/2/2011 9,620 0.75 99.99% 0.12 0.21 1,154 0.16 99.99%
10/13/2011 19,239 3.16 99.98% 0.16 0.13 3,078 0.41 99.99%11/10/2011 14,730 3.40 99.98% 0.39 0.19 5,745 0.65 99.99%11/30/2011 9,620 3.34 99.97% 0.12 0.26 1,154 0.87 99.92%1/17/2012 1,353 10.80 99.20% 0.26 0.05 352 0.54 99.85%1/26/2012 16,684 6.00 99.96% 0.14 0.12 2,336 0.72 99.97%4/22/2012 34,871 11.30 99.97% 0.06 0.05 2,092 0.57 99.97%
n 18 18 18 18 18 18 18 18Average 12,450 5.70 99.91% 0.19 0.33 1,888 2.07 99.86%Median 9,620 3.37 99.97% 0.14 0.24 1,323 0.68 99.96%St Dev 8,389 5.31 0.00 0.18 0.28 1,414 3.45 0.00Coefficient of Variation 0.67 0.93 0.00 0.93 0.85 0.75 1.67 0.00
Total Phosphorus (TP)
DateVi
(L)Vo
(L)%Vr
EMC in (mg/L)
EMC out (mg/L)
Mass in (mg)
Mass out (mg)
% Mass Reduction
6/9/2011 5,411 1.40 99.97% 0.250 0.010 1,353 0.014 100.00%6/11/2011 16,233 3.00 99.98% 0.080 0.005 1,299 0.015 100.00%6/22/2011 12,175 3.00 99.98% 0.040 0.005 487 0.015 100.00%7/29/2011 3,758 1.10 99.97% 0.060 0.050 225 0.055 99.98%8/6/2011 7,966 5.00 99.94% 0.060 0.250 478 1.250 99.74%8/9/2011 7,515 9.50 99.87% 0.040 0.120 301 1.140 99.62%
8/15/2011 27,806 18.93 99.93% 0.020 0.030 556 0.568 99.90%9/6/2011 13,077 4.90 99.96% 0.060 0.005 785 0.025 100.00%
9/22/2011 6,012 1.00 99.98% 0.078 0.008 469 0.008 100.00%9/23/2011 8,868 0.80 99.99% 0.030 0.025 266 0.020 99.99%10/2/2011 9,620 0.75 99.99% 0.059 0.015 568 0.011 100.00%
10/13/2011 19,239 3.16 99.98% 0.082 0.017 1,578 0.054 100.00%11/10/2011 14,730 3.40 99.98% 0.123 0.002 1,812 0.007 100.00%11/30/2011 9,620 3.34 99.97% 0.026 0.007 250 0.023 99.99%1/17/2012 1,353 10.80 99.20% 0.003 0.001 4 0.011 99.73%1/26/2012 16,684 6.00 99.96% 0.010 0.009 167 0.054 99.97%4/22/2012 34,871 11.30 99.97% 0.001 0.003 35 0.034 99.90%
n 17 17 17 17 17 17 17 17Average 12,643 5.14 99.92% 0.06 0.03 625 0.1943 99.93%Median 9,620 3.34 99.97% 0.06 0.01 478 0.0234 99.99%St Dev 8,606 4.90 0.00 0.06 0.06 552 0.3996 0.00Coefficient of Variation 0.68 0.95 0.00 0.97 1.90 0.88 2.06 0.00
Ortho - Phosphate (OrP)
Page 21 PICP Performance Evaluation Report The University of New Hampshire Stormwater Center-May 2013
8.2 Particle Size Distribution One set of influent and effluent samples were sent to Microtrac Inc. in Largo, FL for analysis of particle size distribution by laser diffraction. The requested range was 0.02 – 1500 microns. The influent sample was a composite from the influent reference parking lot (T-Hall) and the effluent was a sub-sample of the effluent total capture. Samples were taken from the 8/9/2011 event. The median particle diameter for both samples were very fine, approximately 42-47 microns. Results are included as Appendix F on page 44.
8.3 Real-Time Water Quality Parameters Water quality parameters were monitored for 14 of the 18 sampled events using an YSI 600XL Multi-parameter probe. Parameters include dissolved oxygen, conductivity, pH, and temperature. Table 8 lists the average values over the duration of each event with summary statistics covering the entire monitoring period. During August and September of 2011 the conductivity / temperature probe began to malfunction and were recording either static or inaccurate values, therefore they have been removed from the data set.
Table 8: Real-time water quality parameters per event.
DateDissolved Oxygen (mg/l)
Conductivity (uS/cm)
pH Temperature (°F)
6/9/2011 No Data6/11/2011 No Data6/22/2011 No Data7/29/2011 9.5 327.2 8.0 68.98/6/2011 7.6 460.4 7.9 69.28/9/2011 9.5 430.5 8.4 68.6
8/15/2011 8.9 217.9 8.0 67.18/21/2011 9.9 7.89/6/2011 3.2 9.1
9/22/2011 17.1 7.69/23/2011 17.4 7.610/2/2011 No Data
10/13/2011 5.3 44.6 6.3 61.711/10/2011 11.2 84.6 7.3 55.011/30/2011 8.0 54.5 6.2 54.31/17/2012 16.8 429.3 6.7 42.21/26/2012 13.1 97.4 7.1 41.04/22/2012 11.5 108.1 8.9 54.7
n 14 10 14 10Average 10.7 225.5 7.6 58.3Median 9.7 163.0 7.7 58.4St Dev 4.1 161.6 0.8 10.1Coefficient of Variation 0.4 0.7 0.1 0.2
Average Real-Time Water Quality Parameters
Page 22 PICP Performance Evaluation Report The University of New Hampshire Stormwater Center-May 2013
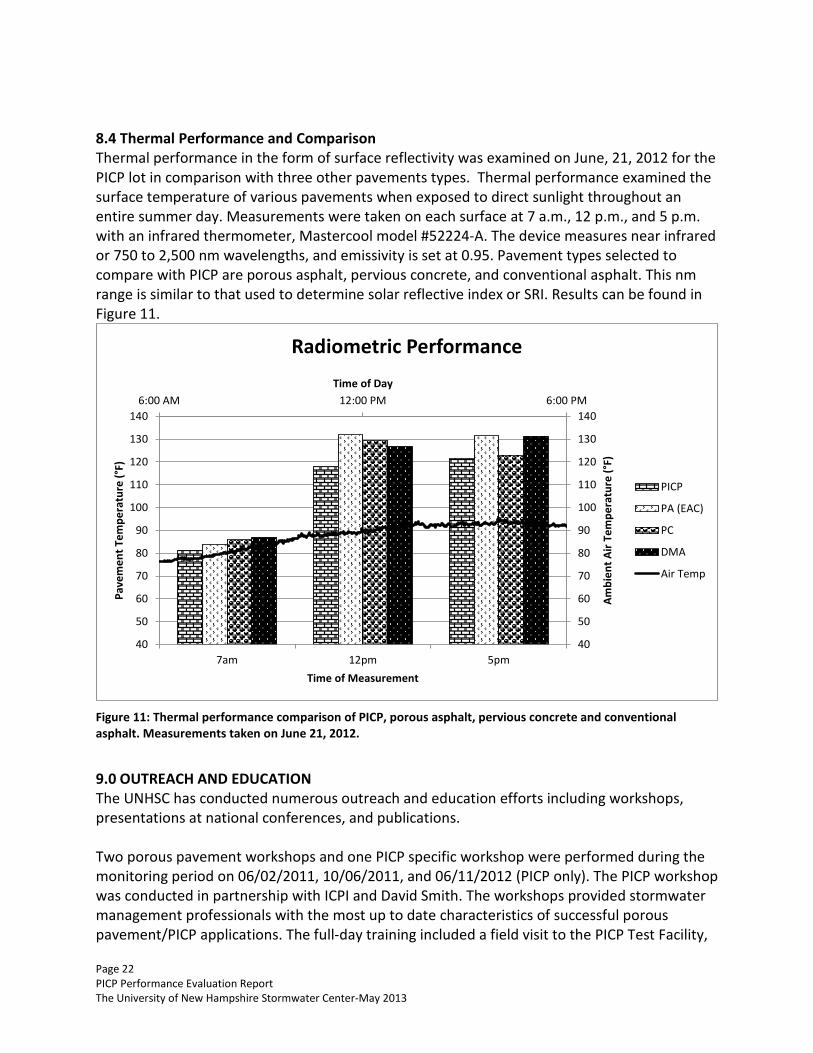
8.4 Thermal Performance and Comparison Thermal performance in the form of surface reflectivity was examined on June, 21, 2012 for the PICP lot in comparison with three other pavements types. Thermal performance examined the surface temperature of various pavements when exposed to direct sunlight throughout an entire summer day. Measurements were taken on each surface at 7 a.m., 12 p.m., and 5 p.m. with an infrared thermometer, Mastercool model #52224-A. The device measures near infrared or 750 to 2,500 nm wavelengths, and emissivity is set at 0.95. Pavement types selected to compare with PICP are porous asphalt, pervious concrete, and conventional asphalt. This nm range is similar to that used to determine solar reflective index or SRI. Results can be found in Figure 11.
Figure 11: Thermal performance comparison of PICP, porous asphalt, pervious concrete and conventional asphalt. Measurements taken on June 21, 2012.
9.0 OUTREACH AND EDUCATION The UNHSC has conducted numerous outreach and education efforts including workshops, presentations at national conferences, and publications. Two porous pavement workshops and one PICP specific workshop were performed during the monitoring period on 06/02/2011, 10/06/2011, and 06/11/2012 (PICP only). The PICP workshop was conducted in partnership with ICPI and David Smith. The workshops provided stormwater management professionals with the most up to date characteristics of successful porous pavement/PICP applications. The full-day training included a field visit to the PICP Test Facility,
6:00 AM 12:00 PM 6:00 PM
40
50
60
70
80
90
100
110
120
130
140
40
50
60
70
80
90
100
110
120
130
140
7am 12pm 5pm
Time of Day
Ambi
ent A
ir Te
mpe
ratu
re (°
F)
Pave
men
t Tem
pera
ture
(°F)
Time of Measurement
Radiometric Performance
PICP
PA (EAC)
PC
DMA
Air Temp
Page 23 PICP Performance Evaluation Report The University of New Hampshire Stormwater Center-May 2013
and in some cases, alongside with other porous pavement installations throughout the UNH campus and the region. Participants learned key design principles necessary to successfully design, evaluate, specify, and install porous pavements for stormwater management. Additional workshop events may be organized and conducted following project completion. UNHSC will use additional educational outreach as follows. UNHSC produces a biennial report on the testing results of the various stormwater systems and management practices. PICP research results are in the next report and a copy has been included in Appendix G. An electronic version of the full biennial report is available for download at the UNHSC website at http://unh.edu/unhsc/sites/unh.edu.unhsc/files/docs/UNHSC.2012Report.10.10.12.pdf. 10.0 SUMMARY AND CONCLUSIONS The range of statistical analyses presented reveals constant and repeatable performance trends. Mass pollutant removals were calculated to best represent overall system performance. While conceivable that the PICP systems have diverse unit operations and processes to address and effectively remove sediments, and sediment associated pollutants (SSC, TSS, TZn, TPH-D), all pollutant reduction recognized in this analysis is associated with mass reduction through volume control (infiltration). Thus, the final performance report for the PICP system indicates very strong volume reduction and overall pollutant mass reduction. Of course, a large volume spill would be an issue for any infiltration system. In general appropriate design and siting would be critical criteria to ensure groundwater protection. The surface vacuuming of the PICP did not prove to be an effective method of regenerating the infiltration capacity of the system. Manipulation of the vacuum sweeper to maintain appropriate suction proved difficult. A more thorough investigation is needed to determine the full impact of vacuuming however vacuuming less frequently with greater suction and replacement of the No. 8 joint stone may be a worthwhile direction to investigate. While infiltration rates were seen to decline following the installation of new No. 8 joint stone, average IR still remained upwards of 1,000 in/hr. The replacement of missing No. 8 within the top 1 inch of the joints should not be viewed as a means to increase surface infiltration. In the same respect overall infiltration rate declined by 69% over 21 months however with average IR upwards of 1,000 inches/hour the system is working as expected. The thermal performance of the PICP surface was compared to porous asphalt, pervious concrete, and standard dense mix asphalt on June 21, 2012. The weather was sunny all day and the measurement locations were exposed to direct sunlight throughout the study period. The average ambient air temp was 88°F. The PICP consistently remained cooler than each of the other pavement types indicating the potential for thermal buffering. Previous studies have demonstrated that that stormwater control measures like PICP that provide treatment by infiltration and filtration can moderate runoff temperatures by thermal exchange with cool subsurface materials (Roseen et al 2011). Numerous agencies and locales are beginning to consider the thermal impacts of stormwater management upon cold water streams.

Page 24 PICP Performance Evaluation Report The University of New Hampshire Stormwater Center-May 2013
Of future interest is to explore the winter maintenance and performance for PICP. Research on porous asphalt (PA) at the UNHSC has shown that PA exhibits greater frictional resistance and can become clear of snow and ice faster than conventional pavements. Substantial reductions of up to 77% in annual salt loads for anti-icing/deicing practices were demonstrated. Winter maintenance of the PICP, including plowing and anti-icing/de-icing was handled independently by UNH facilities. A memo regarding equipment and procedures used is included in Appendix I. UNH Facilities Department staff was not instructed to reduce application rates on Hood House Drive and managed the PICP like all other dense pavements on campus. 11.0 REFERENCES 1. Roseen, R., A. Watts, et al. (2011). Examination of Thermal Impacts From Stormwater Best
Management Practices. Durham, NH, University of New Hampshire Stormwater Center Prepared for US EPA Region 1.
2. Smith, D. and B. Hunt (2010). Structural/Hydrologic Design and Maintenance of Permeable Interlocking Concrete Pavements. Green Streets and Highways, Denver, Colorado, ASCE.
3. National Engineering Handbook, Part 630 Hydrology, Chapter 7 Hydrologic Soil Groups, 2007, NEH630.07, United States Department of Agriculture.

Page 25 PICP Performance Evaluation Report The University of New Hampshire Stormwater Center-May 2013
APPENDIX A: University of New Hampshire Hood House Drive and J Lot Upgrades: Site Plans.

Page 26 PICP Performance Evaluation Report The University of New Hampshire Stormwater Center-May 2013

Page 27 PICP Performance Evaluation Report The University of New Hampshire Stormwater Center-May 2013

Page 28 PICP Performance Evaluation Report The University of New Hampshire Stormwater Center-May 2013

Page 29 PICP Performance Evaluation Report The University of New Hampshire Stormwater Center-May 2013

Page 30 PICP Performance Evaluation Report The University of New Hampshire Stormwater Center-May 2013

Page 31 PICP Performance Evaluation Report The University of New Hampshire Stormwater Center-May 2013

Page 32 PICP Performance Evaluation Report The University of New Hampshire Stormwater Center-May 2013
APPENDIX B: Analysis of soils from test pits at Hood House, University of New Hampshire Durham, NH dug on April 15, 2010. April 30, 2010 Performed By: Timothy Puls, Field Facility Manager Reviewed By: Robert Roseen, Director UNH Stormater Center 35 Colovos Road Durham, NH 03824 RE: Analysis of soils from test pits at Hood House, University of New Hampshire Durham, NH dug on April 15, 2010. Introduction This report contains infiltration capacity (IC) and particle size distribution (PSD) of sub-base soils located under Hood House driveway on the University of New Hampshire (UNH) main campus. Refer to attached map for location of test pits. Test pits 1 and 2 were dug down 48 inches or until ledge impeded further excavation. Test pits 3-5 are not included in this report. Test Pit 1 Excavation
• At 24” down an unmarked utility was found. This was an old rusted pipe 1.5” in diameter that was of unknown use. UNH facilities personnel came out to inspect pipe, but there was no determination of what the pipe was used for or if it was in use. It was assumed to be an abandoned pipe, but we moved the pit location over to avoid and work around the pipe.
• At 24” down soil changed from coarse sand to sandy clay. Soil sample was taken. • At 36” down soil is sandy clay. Soil sample was taken. • At 48” down the excavator hit ledge that seemed to be continuous throughout the pit.
Infiltration Capacity
• No IC test was done due to ledge.
Page 33 PICP Performance Evaluation Report The University of New Hampshire Stormwater Center-May 2013
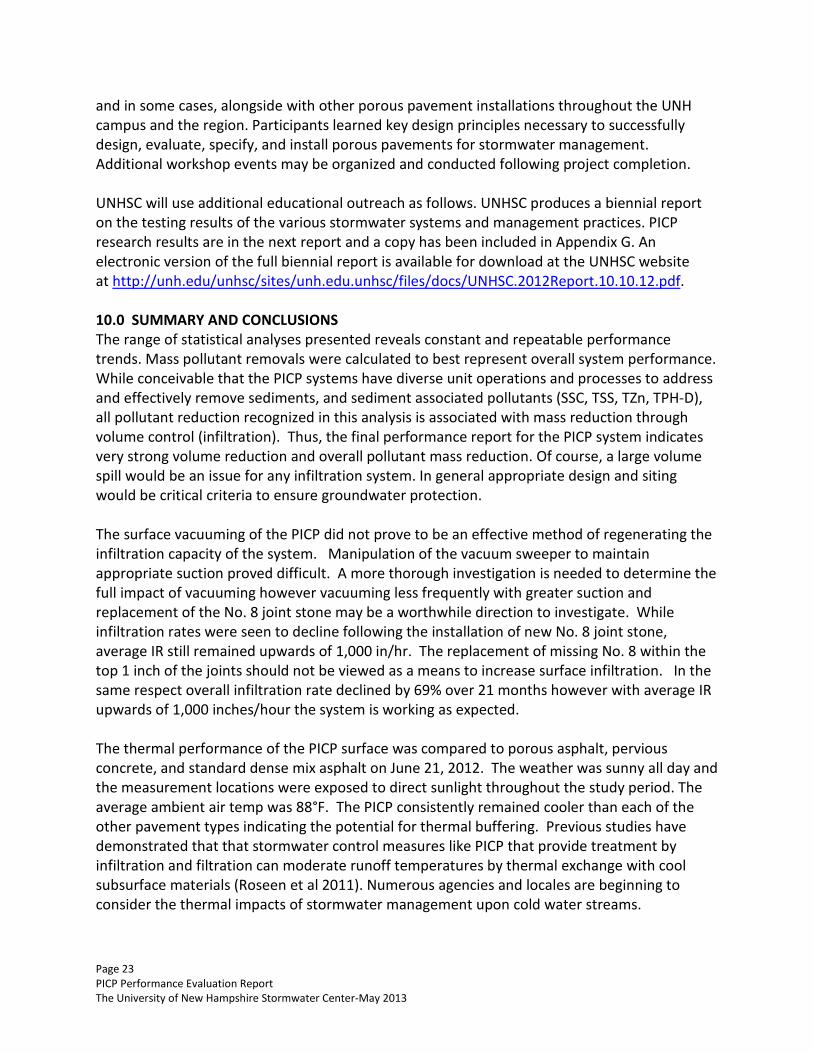
Particle Size Distribution of Soil Samples
• Soil Sample taken at 24” depth
US sieve number
Sieve opening (mm)
Mass retained (g)
Mass passing (g)
Percent finer by weight
d M Mp p 4 4.750 988.70 100.00 10 2.000 156.50 832.20 84.17 20 0.850 143.30 688.90 69.68 40 0.425 130.80 558.10 56.45 60 0.250 99.50 458.60 46.38 100 0.150 36.70 421.90 42.67 200 0.075 63.40 358.50 36.26 pan 358.50 0.00 0.00
D10 = < 0.075mm D30 = < 0.075mm D50 = 0.300 mm D60 = 0.500 mm
• Other Information
Hood House Test Pit 1 - 24"
010
2030
4050
6070
8090
100
0.01 0.1 1 10
Grain size (mm)
Per
cent
fine
r by
wei
ght

Page 34 PICP Performance Evaluation Report The University of New Hampshire Stormwater Center-May 2013
o 17.77% moisture content as a percentage of oven-dried mass. Determined using ASTM Designation: D 2974-00.
• Soil Sample taken at 36” depth
US sieve number
Sieve opening (mm)
Mass retained (g)
Mass passing (g)
Percent finer by weight
d M Mp p 4 4.750 978.30 100.00 10 2.000 204.40 773.90 79.11 20 0.850 199.40 574.50 58.72 40 0.425 137.00 437.50 44.72 60 0.250 101.70 335.80 34.32 100 0.150 51.60 284.20 29.05 200 0.075 31.70 252.50 25.81 pan 252.50 0.00 0.00
D10 = < 0.075mm D30 = 0.160 mm D50 = 0.540 mm D60 = 0.890 mm
Hood House Test Pit 1 - 36"
010
2030
4050
6070
8090
100
0.01 0.1 1 10
Grain size (mm)
Per
cent
fine
r by
wei
ght

Page 35 PICP Performance Evaluation Report The University of New Hampshire Stormwater Center-May 2013
• Other Information o 12.85% moisture content as a percentage of oven-dried mass. Determined using
ASTM Designation: D 2974-00. Test Pit 2 Excavation
• At 24” down ledge along curbed side of the pit was found. The ledge extended approximately 1 foot into the pit. There was enough room to continue digging in the same location.
• At 24” down soil is sand that was placed as sub-base for existing driveway. Soil sample was taken.
• At 36” down soil is coarse sand. Soil sample was taken. • At 48” down soil is sandy clay. Soil sample was taken.
Infiltration Capacity
• IC test was conducted using a Turf Tech infiltration device. Results are as follows. •
Level (in)∆ Level
(in)IC
(in/min)IC
(in/hr)0 - 0.250 - - -1 1 0.375 0.125 0.125 82 1 0.469 0.094 0.094 63 1 0.500 0.031 0.031 24 1 0.531 0.031 0.031 25 1 0.563 0.031 0.031 26 1 0.594 0.031 0.031 27 1 0.625 0.031 0.031 28 1 0.688 0.063 0.063 49 1 0.719 0.031 0.031 2
10 1 0.750 0.031 0.031 211 1 0.813 0.063 0.063 412 1 0.875 0.063 0.063 413 1 0.906 0.031 0.031 214 1 0.938 0.031 0.031 215 1 0.969 0.031 0.031 216 1 1.000 0.031 0.031 2
Average 3
Time (min)
∆ Time (min)
Inner Ring

Page 36 PICP Performance Evaluation Report The University of New Hampshire Stormwater Center-May 2013
Particle Size Distribution of Soil Samples
• Soil Sample taken at 24” depth
US sieve number
Sieve opening (mm)
Mass retained (g)
Mass passing (g)
Percent finer by weight
d M Mp p 4 4.750 977.30 100.00 10 2.000 92.00 885.30 90.59 20 0.850 82.50 802.80 82.14 40 0.425 196.00 606.80 62.09 60 0.250 194.30 412.50 42.21 100 0.150 126.60 285.90 29.25 200 0.075 37.70 248.20 25.40 pan 248.20 0.00 0.00
Hood House - Test Pit 2
012345678
0 3 6 9 12 15 18Time (min)
Inf.
Rat
e (in
/hr)

Page 37 PICP Performance Evaluation Report The University of New Hampshire Stormwater Center-May 2013
D10 =< 0.075mm D30 = 0.160 mm D50 = 0.300 mm D60 = 0.400 mm
• Other Information o 6.99% moisture content as a percentage of oven-dried mass. Determined using
ASTM Designation: D 2974-00.
• Soil Sample taken at 36” depth.
US sieve number
Sieve opening (mm)
Mass retained (g)
Mass passing (g)
Percent finer by weight
d M Mp p 4 4.750 1174.80 100.00 10 2.000 266.50 908.30 77.32 20 0.850 197.00 711.30 60.55 40 0.425 212.60 498.70 42.45 60 0.250 176.20 322.50 27.45 100 0.150 105.30 217.20 18.49 200 0.075 48.10 169.10 14.39 pan 169.10 0.00 0.00
Hood House Test Pit 2 - 24"
010
2030
4050
6070
8090
100
0.01 0.1 1 10
Grain size (mm)
Per
cent
fine
r by
wei
ght

Page 38 PICP Performance Evaluation Report The University of New Hampshire Stormwater Center-May 2013
D10 = < 0.075mm D30 = 0.270 mm D50 = 0.560 mm D60 = 0.830 mm
• Other Information o 8.57% moisture content as a percentage of oven-dried mass. Determined using
ASTM Designation: D 2974-00.
Hood House Test Pit 2 - 36"
010
2030
4050
6070
8090
100
0.01 0.1 1 10
Grain size (mm)
Per
cent
fine
r by
wei
ght

Page 39 PICP Performance Evaluation Report The University of New Hampshire Stormwater Center-May 2013
• Soil Sample taken at 48” depth.
US sieve number
Sieve opening (mm)
Mass retained (g)
Mass passing (g)
Percent finer by weight
d M Mp p 4 4.750 1052.00 100.00 10 2.000 266.00 786.00 74.71 20 0.850 185.60 600.40 57.07 40 0.425 176.20 424.20 40.32 60 0.250 147.90 276.30 26.26 100 0.150 98.20 178.10 16.93 200 0.075 43.90 134.20 12.76 pan 134.20 0.00 0.00
D10 = < 0.075mm D30 = 0.290 mm D50 = 0.605 mm D60 = 0.990 mm
• Other Information o 11.18% moisture content as a percentage of oven-dried mass. Determined using
ASTM Designation: D 2974-00.
Hood House Test Pit 2 - 48"
010
2030
405060
7080
90100
0.01 0.1 1 10
Grain size (mm)
Per
cent
fine
r by
wei
ght

Page 40 PICP Performance Evaluation Report The University of New Hampshire Stormwater Center-May 2013
Location Map for Test Pits at Hood House

Page 41 PICP Performance Evaluation Report The University of New Hampshire Stormwater Center-May 2013
APPENDIX C: General specifications for Tymco 210 Regenerative Air Sweeper.

Page 42 PICP Performance Evaluation Report The University of New Hampshire Stormwater Center-May 2013
APPENDIX D: General specifications for Tymco 500X High Side Dump Regenerative Air Sweeper.

Page 43 PICP Performance Evaluation Report The University of New Hampshire Stormwater Center-May 2013
APPENDIX E: Photos of various conditions of the UNH PICP installation during the testing period.
Figure 12: Run on from an intersecting pedestrian walkway.
Figure 13: Loss of No. 8 stone along curb line due to erosion and cleaning.
Figure 14: Another area of run on from an intersecting pedestrian walkway.
Figure 15: No. 8 joint stone has settled approximately 1 inch.
Figure 16: Snow cover after plowing but before sun begins to warm up pavement.
Figure 17: Run on from intersecting MUB drive.

Page 44 PICP Performance Evaluation Report The University of New Hampshire Stormwater Center-May 2013
APPENDIX F: Results of particle size distribution analysis by laser diffraction. Influent Sample

Page 45 PICP Performance Evaluation Report The University of New Hampshire Stormwater Center-May 2013
Effluent Sample

Page 46 PICP Performance Evaluation Report The University of New Hampshire Stormwater Center-May 2013
APPENDIX G: Final factsheet in the UNHSC 2012 biennial report.

Page 47 PICP Performance Evaluation Report The University of New Hampshire Stormwater Center-May 2013
Page 48 PICP Performance Evaluation Report The University of New Hampshire Stormwater Center-May 2013

Page 49 PICP Performance Evaluation Report The University of New Hampshire Stormwater Center-May 2013
APPENDIX H: Concrete paver test results.
Page 50 PICP Performance Evaluation Report The University of New Hampshire Stormwater Center-May 2013

Page 51 PICP Performance Evaluation Report The University of New Hampshire Stormwater Center-May 2013
APPENDIX I: Memo from UNH Facilities. Below is the feedback from Tom Byron, UNH Manager of Grounds and Events in response to question regarding standard practices and effectiveness of winter plowing and anti-icing/de-icing management of the PICP. From: Byron, Thomas Sent: Monday, March 25, 2013 7:09 AM To: Geuther, Mark Cc: Fortin, Robert; VanDessel, Larry; Howard, Dave Subject: RE: Hood House Drive Questions 1. What type of equipment was use to remove snow? It’s a 1 ton truck that plows that area with a steel cutting edge. The small areas it can be shovels or snow blowers we have had no problems. 2. Did Hood House Drive receive deicing materials? What type? Rock salt was used just like the rest of the campus I don’t think there was any less or more used. 3. Did snow on Hood House Drive melt faster, the same, or slower than snow and ice on asphalt pavements? As far as melting I would say it’s slower just because of the drainage. When applying salt as it melts it makes a brine that helps with melting and because of the drainage it doesn’t spread out as well.


![PERMEABLE INTERLOCKING CONCRETE PAVEMENT (PICP) … · 2019. 6. 10. · ILID INTEGRATED WITH PICP ] Permeable Interlocking Concrete Pavement: A Low Impact Development Tool PICP Meets](https://img.dokumen.tips/doc/110x75/6046a3a7630ba6411f40aec3/permeable-interlocking-concrete-pavement-picp-2019-6-10-ilid-integrated-with.jpg)


![PERMEABLE INTERLOCKING CONCRETE PAVEMENT (PICP) … · ILID INTEGRATED WITH PICP ] Permeable Interlocking Concrete Pavement: A Low Impact Development Tool PICP Meets LID Goals •](https://img.dokumen.tips/doc/110x75/604f6c43a317d40fb379e0ba/permeable-interlocking-concrete-pavement-picp-ilid-integrated-with-picp-permeable.jpg)