Embed Size (px)
Citation preview

I
Final Report
t
L.
I.
': 1 <.
Implementation and Testing of the Travel Time Prediction System (TIPS)
Prahlad D. Pant Professor
University of Cincinnati Department of Civil & Environmental Engineering
Cincinnati, Ohio 45221-0071
Prepared in cooperation with The Ohio Department Of Transportation
and The U.S Department of Transportation, Federal Highway
Administration
May, 2001


Final Report
Implementation and Testing of the Travel Time Prediction System (TIPS)
Prahlad D. Pant Professor
University of Cincinnati Department of Civil & Environmental Engineering
Cincinnati, Ohio 45221-0071
Prepared in cooperation with The Ohio Department Of Transportation
and The U.S Department of Transportation, Federal Highway
Administration
May, 2001


2 Government Accession No. . Report No. 3. Reclplent’s Catalog No.
a Performing Ctrganization Report No. Author(s)
Prahlad D. Pant
10. Work Unl NO. (TRAIS)
. Title and SubtltleL
mplementation and Testing of the Travel Time Prediction System TIPS)
Performlng Organization Name and Address
Jniversity of Cincinnati )epartrnent of Civil and Enviromental Engineering ’0 Box 210071 Zincinnati, OH 45221-0071
k Report Date
May, 2001 6. Performlng Organlzatlon Code
State Job No. 14756(0)
2. Sponsoring Awncy Name and Address
lhio Department of Transportation 980 W Broad Street
Final Report
14. Sponsoring Agency Code
>olurnbus, OH 43223 i Supplementary Notes
*. Key words Intelli ent Transportation Systems 9 ITS, Crave1 Time Prefiction System, TIPS, Freeway Work !one, Advanced Traffic Management Systems, Advanced Craffic Information System
I. Security Classit. (of thk report) 20. Securiry Classit. (of this page)
lnclassified Unclassified
ia Distribution Statement
No Restrictions. This document is available to the public through the National Technical Information Service, Springfield, Virginia 221 61 21. No. of Pages 2 2 Prlce

ii
Disclaimer Statement
The contents of this report reflect the views of the authors who are responsible for the facts and accuracy of the data presented herein. The contents do not necessarily reflect the official views or policies of the Ohio Department of Transportation or the Federal Highway Administration. This report does not constitute a standard, specification, or regulation.


iii
Acknowledgement
The researchers express their sincere appreciation to the following oficials of the
Ohio Department of Transportation for their valuable support (in alphabetical order):
Mr. Rodger DUM, Ofice of Traffic Engineering
Mr. Roger Green, Office of R & D
Mr. William L. Harrison, District 7
Ms. Rhonda Higgins, District 7
Mr. David Holstein, Office of Traffic Engineering
Mr. David Ley, District 7
Mr. Kenneth E. Linger, Ofice of Traffic Engineering
Mi-. William C. Lozier, Central Ofice
The researchers express their sincere appreciation to Mr. Herman Rodrigo of the Federal Highway Administration for his continued support of this project. The assistance
received fiom many other individuals from ODOT central and district offices is sincerely
appreciated. Mr. Raymond Lindemann, a Research Assistant at the University of Cincinnati,
worked with the author in the implementation and testing of the Travel Time Prediction
System (TIPS). Dr. Yizong Cheng of the University of Cincinnati provided software
assistance. The author expresses his sincere appreciation to these individuals.


N
TABLE OF CONTENTS
Disclaimer Statement
Acknowledgement
Table of Contents
List of Figures
1. Introduction 2.
3. Implementation and Testing
Background & Significance of Work
3.1 Solar Trailer Purchase
3.2 Site Survey
3.3 Mobilization
3.4
3.5 Operation of TIPS Installation of Equipment At The Site
3.5 1
3.52 Incident Management
Performance of Hardware and Software
4. Independent Evaluation of TIPS
5. Conclusions & Recommendations
6. References
.. 11
111 ...
iv
V
1
4
7
7
8
11
11
17
18
19
20
22
24

Figure 1
Figure 2
Figure 3
Figure 4
Figure 5
Figure 6
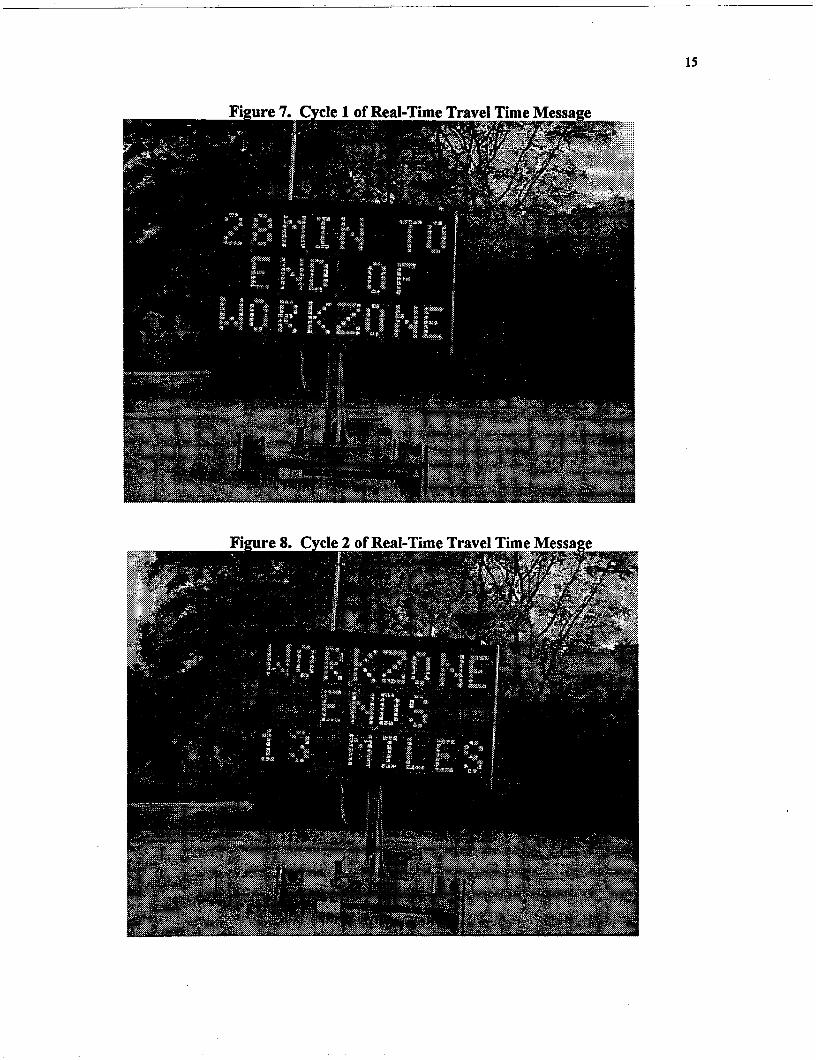
Figure 7
Figure 8
Figure 9
LIST OF FIGURES
Basic TIPS Hardware Setup
Schematic of Northbound 1-75 Dayton, Ohio 1-75 Work Zone in City of Dayton, Ohio
Antenna Pole at ODOT Lyons Road Outpost
Personal Computer with TIPS Sohare
Trailer with Solar Panels, Sensor, and Radio
Cycle 1 of Real-Time Travel Time Message Cycle 2 of Real-Time Travel Time Message
Real-Time “Accident Ahead” Message
6
9
13
13
14
14
15
15
16


1
Implementation and Testing of the Travel Time Prediction System (TIPS)
1 INTRODUCTION
A fieeway construction work zone creates conflicts between vehicular
traffic and work activity. The closure of one or more lanes of a fieeway section
causes a bottleneck on the freeway and reduces the capacity in the work zone, which can lead to conditions that violate the expectations of the motorists. Such a
work zone situation is a challenge to one of the main objectives of a traffic
management system, that is, to maintain “the s 4 e and eficient movement of
traffic”. The advance warning area of a traffic control zone represents the area in
which the motorists are informed as to what they can expect ahead. The
information which is normally provided to the motorists include the type of construction activity, type of lane closure, extent of the work zone, and whether
there are available alternate routes to avoid the construction all together. This
information is given on static signs, or electronic portable changeable message
signs (CMS) by way of static preprogrammed messages. This information is
crucial in preparing the motorist to take appropriate action when they reach the
work zone; however, these techniques do little to assist the motorist in areas
where increased congestion leads to queuing up of vehicles for miles on the
fieeway. These drivers are generally not aware of what is going on ahead of them
and how long it will take them to clear the work zone. This lack of real-time
“travel time ” information to motorists can lead to motorist frustration, accidents,
or other avoidable incidents. This illustrates the need to accurately inform the
motorists of the “travel time” through the work zone. The benefit of real-time “travel time ” information is two fold. First, the motorist can make an informed
decision on whether to stay on the freeway, or take an alternate route. Second, by
knowing the time it will take to traverse the work zone before entering, the

2
anxiety and fiustration felt while waiting indeterminately in traffic will be alleviated.
The Travel Time Prediction System (TIPS) was developed by Dr. Prahlad
D. Pant of the University of Cincinnati. The Ohio Department of Transportation and the Federal Highway Administration provided fUnding for the research and
development of TIPS. More details about TIPS can be found in References (1)
and (2) and hence will not be repeated in this report. TIPS was designed to
address the need for providing real-time travel time information to the motorists . TIPS can predict the travel time for the motorists from any one point on a fieeway to any other. This system was designed with fieeway work zones in mind, but has
a much broader application for any freeway that suffers congestion, leading to
travel times that fluctuate, and therefore pose an inconvenience, and potentially unsafe conditions, to motorists. TIPS is intended to provide real-time travel time
information to the motorists both in advance of, and throughout the work zone,
thereby reducing the motorist fiustration and increasing safety on the highway.
The ultimate benefit of the TIPS system is the reduction of congestion and travel times, by allowing motorists to take alternate routes. Thus the two main concerns
of a traffic management system - safety and efficiency - are expected to improve.
TIPS combines the disciplines of traffic engineering and modeling,
wireless communications, and computer science, in a portable, automated, and
user-fiiendly system, which can be easily installed on-site. It is a comprehensive
system that collects real-time traffic flow data using non-contact sensors,
processes the data in an on-site personal computer, calculates the estimated travel
time, and transmits the information to changeable message signs positioned at
pre-determined locations along the freeway section, which in turn display the
travel time information to the motorists.
The objective of this project was to implement and test the Travel Time
Prediction System (TIPS) on northbound 1-75 work zone in Montgomery County,
Dayton, Ohio during the Summer and Fall of 2000. TIPS was operated a
minimum of 15 hours per day- from 5:OO AM until 8:OO PM- seven days a week
for about four months. The system was also run twenty-four hours a day upon


3
request from ODOT, to facilitate night time construction or other extraordinary
events such as an accident in the work zone, or hrther overnight lane closures.
The TIPS hardware and software were configured as necessary to meet site-
specific objectives at the beginning of implementation. The key components to the implementation of TIPS were the purchase of additional trailers with solar
panels and batteries, site survey, mobilization, equipment installation, and the
operation, maintenance and monitoring of TIPS. Additionally, ODOT hired Dr.
Helmut Zwahlen, Russ Professor Emeritus of Ohio University, to conduct an independent evaluation of TIPS at this site. The successfbl implementation and
testing of TIPS at the Montgomery County site will allow ODOT to deploy one or
more systems at construction projects in the future.


4
2. BACKGRO AND SIG CANCE OF WORK
TIPS was developed as an intelligent transportation systems (ITS) research project. It is a portable, automated, flexible, and user-friendly system.
TIPS uses microwave radar detectors that provide contact closure signals, which
in turn are used to compute volume and occupancy at 30-sec intervals. The traffic
flow information is transmitted by 220 MHz radios to an on-site computer, which
computes the travel time using a travel time prediction algorithm and model, and
this information is transmitted to the changeable message signs (CMS’s) by 220
MHz radios.
A more detailed list of the components of TIPS are as follows: Microwave radar sensors for vehicle detection on the freeway;
Programmable microcontrollers for computing volume and occupancy for
each lane; 220 MHz narrowband radio modems for transmitting volume and occupancy
data from each sensor to the on-site PC;
0 Intelligent traffic algorithm and travel time estimation model residing in the
TIPS software (TIPS Version 2.1) in Windows NT environment;
220 MHz narrow-band radio modems for transmitting travel time information
fiom the PC to portable changeable message signs; 0 Changeable message signs for displaying travel time information to motorists;
0 Mobile trailers equipped with solar panels and batteries that can be used for
mounting sensors and radio modems.
A full-scale implementation of TIPS will provide hrther validation of the
travel time prediction models and all other hardware and software components.
Once the system is operational on a hll-scale basis, the system can be reassessed
for its effectiveness. The more the system is used, the better the scope for
assessment, innovation and improvement. TIPS can also be used on any freeway


5
that experiences congestion on a regular basis, thereby making it a universal
system rather than one for work zones only.


J


7
3.0 LEMENTATION AND TESTING
The scope of this project was to implement and test the Travel Time
Prediction System (TIPS) on northbound 1-75 work zone in Montgomery County,
Dayton, Ohio during the freeway construction period of July 14, 2000 until
November 4, 2000. During this implementation of TIPS, the hub of operations
was located at the Lyons Road ODOT Outpost. The base station radio and
personal computer were located at this location. Solar trailers and changeable
message signs were located along the freeway at strategic locations in advance of,
and in the construction work zone. This implementation provided ODOT with an
additional example how research results can be implemented for the benefit of
motorists in the State.
3.1 SOLAR ER PURCHASE
This project used the equipment that was purchased for the previous research project "A Portable Real-Time Traffic Control System for Freeway Work Zones"
(Reference 1). A preliminary survey of the site showed that at least five sensors
and four changeable message signs were required for this project. Four mobile
trailers with solar panels and batteries that can also be used for mounting sensors
and radio modems were purchased. These trailers consisted of a bank of three 80
watt solar panels which connected to a solar power controller, which in turn fed a
bank of six 6 volt deep-cycle batteries that were connected in series and in parallel to give the output of three 12 volt batteries. The trailers also contained an
eighteen-foot retractable mast for mounting the sensor and radio antenna.
An aluminum traffic control box and radio antenna mount were installed onto
the four new trailers, two existing trailers, and five changeable message signs.
Each aluminum box was used to house a radio and/or microcontroller. Necessary
wiring was provided.


8
3.2 SITESURVEY
A thorough survey of the fieeway work zone was performed. The site survey
was carried out by monitoring traffic flow patterns in the field, with special
attention paid to the traffic queues during peak hours. The taper, which was
located just south of the Nicholas Road exit, brought the fieeway down from three
lanes to two lanes. The work zone extended to just north of the First St. exit
where the taper ended and the fieeway again became three lanes (see Fig. 2). It was observed that peak queuing times were between 7:OO-8:30 AM and 4:OO-5:30
PM weekdays. The increase in travel time was typically 12 to 16 minutes during
these times, which is reflected in a queuing of motorists preceding the work zone
of between one and one and a half miles. Occasionally, the traffic backed up about 3-3.5 miles during peak hours causing additional travel time of 22 to 26
minutes. Attention was paid to the best alternate routes for traffic. During the site
survey and installation of the sensor trailers, the US 35 ramps were closed. The
US 35 ramps subsequently opened during the operation and evaluation of the TIPS deployment, which impacted the traffic flow pattern. It was determined that
if motorists were to take an alternate route to avoid an unwanted delay from
increased congestion, they would most probably take 1-675, SR 725, or Dixie
Drive. Accordingly, three CMS’s displaying real-time travel time information
were placed before these exits. Additionally, a CMS that displayed a static
message was also placed before 1-675. These alternate routes were in advance of
any significant congestion under normal circumstances, and also afforded the
driver access to points north that would usually be accessed by staying on 1-75.
The locations of the changeable message signs were (Fig 2) as follows:


10
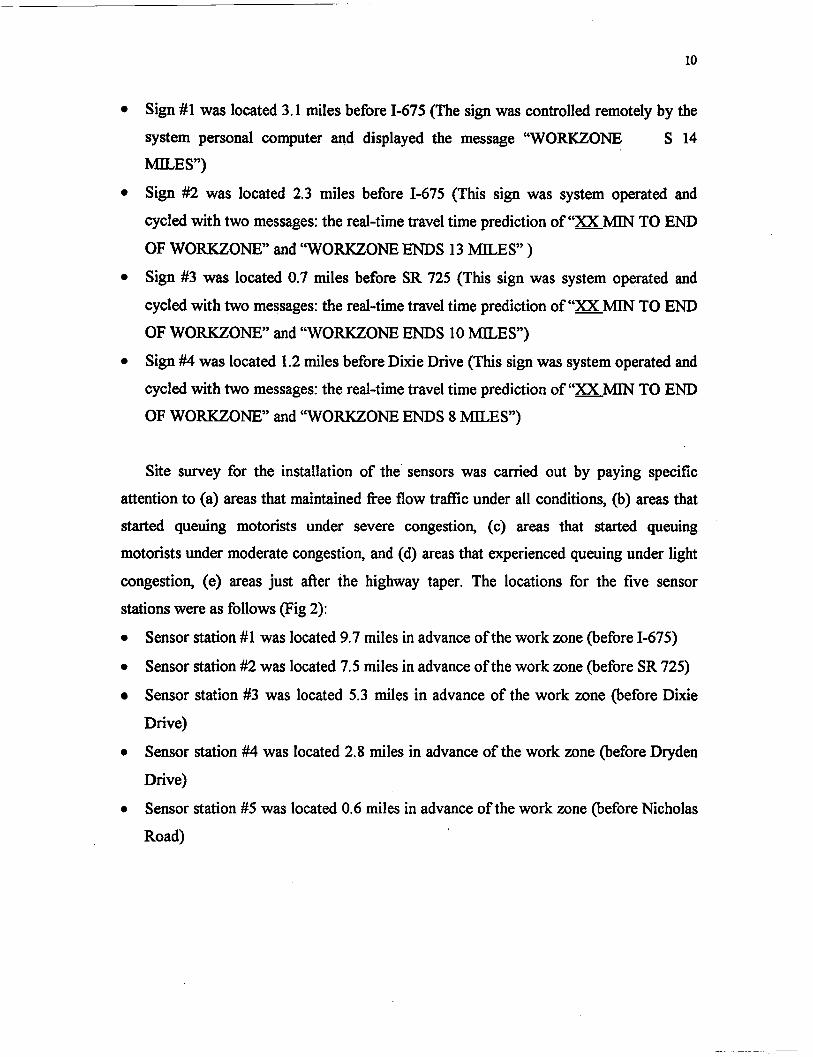
Sign #1 was located 3.1 miles before 1-675 (The sign was controlled remotely by the
system personal computer and displayed the message “WORKZONE S 14
MILES”)
Sign #2 was located 2.3 miles before 1-675 (This sign was system operated and
cycled with two messages: the real-time travel time prediction of ‘ ‘ZMIN TO END
OF WORKZONE” and “WORKZONE ENDS 13 MILES” )
Sign #3 was located 0.7 miles before SR 725 (This sign was system operated and
cycled with two messages: the real-time travel time prediction of “ Z M I N TO END
OF WORKZONE” and “WORKZONE ENDS 10 MILES”) Sign #4 was located 1.2 miles before Dixie Drive (This sign was system operated and
cycled with two messages: the real-time travel time prediction of “ Z M I N TO END
OF WORKZONE’ and “WORKZONE ENDS 8 MILES”)
Site survey for the installation of the sensors was carried out by paying specific
attention to (a) areas that maintained fiee flow traffic under all conditions, (b) areas that started queuing motorists under severe congestion, (c) areas that started queuing
motorists under moderate congestion, and (d) areas that experienced queuing under light
congestion, (e) areas just after the highway taper. The locations for the five sensor
stations were as follows (Fig 2):
0 Sensor station #1 was located 9.7 miles in advance of the work zone (before 1-675)
0 Sensor station #2 was located 7.5 miles in advance of the work zone (before SR 725)
Sensor station #3 was located 5.3 miles in advance of the work zone (before Dixie
Drive)
0 Sensor station #4 was located 2.8 miles in advance of the work zone (before Dryden
Drive)
Sensor station #5 was located 0.6 miles in advance of the work zone (before Nicholas
Road)
0


11
3.3 MOBILIZATION
Before all equipment were transported to the site, it was important to test
them one by one to make sure that they all fbnctioned properly. Since most of the
sensors purchased in the previous research project were operating with 12OV
electric power, they were converted to 12V DC operation. The mobilization
process included a complete testing and configuration of all equipment to work
with 220 MHZ radio modems.
All mobile radios were tested and necessary configurations were made to
assure compatibility with the base station radio.
Before the installation of sensor stations and CMSs at the site, an on-site
testing of the two-way radio communications was performed at the Lyons
Road ODOT Outpost in Dayton, Ohio to be certain that previously determined
survey sites would support the required communication need of the system. A
bucket truck with a fifty-foot mast carried a radio antenna and the base station radio, to simulate the fifty-foot antenna pole and base station radio
configuration. A solar trailer was towed to the various locations that were
intended to be used for sensor stations and changeable message signs. A
computer with a communication software was used at each end to send and receive text messages fiom one end to the other.
3.4 INSTALLATION OF EQUIPMENT AT SITE
On July 10 and 11, 2000 five solar trailers were towed fiom their storage
locations and placed at the previously defined locations along 1-75 as detailed
above. An additional sixth sensor trailer was stored at the Lyons Road ODOT
Outpost in Dayton, Ohio. That same week four changeable message signs were
towed and placed at their previously defined locations along 1-75. An additional
CMS was stored at the Lyons Road ODOT Outpost location. On July 12, 2000,
the base station radio and personal computer were transported and installed at the


12
Lyons Road ODOT Outpost. A fifty-foot wooden pole, with radio antenna, was
installed at the Outpost for use by the base station radio.
On July 12 and 13, 2000, the work crew installed the antennae, radios, microprocessors, and sensors on the solar trailers. The sensors were configured to
detect full and accurate vehicular counts at each location.
TIPS began operating and displaying travel time messages at 125 I PM on
Friday, July 14, 2000. At this time three sensors stations were in operation and
the travel time message was displayed on a changeable message sign that was located on northbound 1-75 just south of SR 725. The full system began operation at 6:11 PM. All five sensor stations and three changeable signs were operating
smoothly. The base station radio was receiving data fiom all five sensors and
travel time information messages were being displayed on all changeable message
signs.


13
Figure 3. 1-75 Work Zone in City of Dayton, Ohio

.

14
Figure 5. Personal Computer with TIPS Software
F 'i igr u r a d li

15

16
Figure 9. Real-Time “Accident Ahead” Message

17
3.5 OPERATION OF TIPS
As suggested by the Ohio Department of Transportation, the Travel Time
Prediction System (TIPS) was run for 15 hourdday, 7 daydweek. TIPS was operated fiom July 14, 2000 until November 4, 2000 (end of the construction
season). The TIPS program was run a minimum of 15 hours a day, fiom SAM
until 8PM seven days a week during this time. TIPS was run continuously
twenty-four hours a day upon request fiom ODOT on the weekend of Friday
September 22, 2000 at 5AM until Monday September 25, 2000 at 8PM, to
facilitate night time construction and an additional lane closure. TIPS was also
kept running until 12AM on two occasions for other extraordinary events such as an accident in the work zone, which caused travel time delay to exist later than
usual in the area preceding the construction zone. TIPS was monitored at all times when the system was operating during
this test deployment of the system for the northbound 1-75 construction work zone in Dayton, Ohio. The actual travel time through the work zone was frequently measured and compared to the travel time displayed by the system at the various
CMS’s. The maintenance crew was “on-call” at all times of the system operation.
The monitoring and operation of TIPS indicated that the system was
highly reliable as initially put in place, with only minor adjustments being
necessary to the initial hardware configuration. The modifications were:
0 The newly purchased solar trailers were originally outfitted with six 6-volt
batteries wired in such a way to produce the output of three 12-volt batteries.
It was determined that the power storage required by the system was best
accomplished by eight 6-volt batteries wired to produce the output of four 12-
volt batteries. The company executed the additional battery installation.
0 The newly purchased solar trailers were originally outfitted with a bank of
three 80 watt solar panels connected to a solar power controller, which
supplied 20 amps of recharging current to the battery bank. It was determined
that a solar controller which supplied 30 amps of recharging current was better


18
suited to the TIPS system power requirements. The company executed the controller change.
The sensor station #5, located just south of Nicholas Rd, which was originally
run utilizing the on-trailer radio antenna, was later outfitted with a 40 foot
pole-mounted antenna for better radio communications.
The antenna pole at sensor station #5 was originally set up with a ground wire
from the top. After several lightning storms it was determined that this
configuration actually put the RTMS sensor in great jeopardy. The sensor at station #5 was repaired three times because lightning strikes near the area
caused a surge in the power sensor, damaging the unit. After the grounding
wire was removed, the problem ceased.
Each radio/micro-controller box was equipped with a fan controlled by a
thermostat but the box was not insulated. On a few occasions after several
consecutive days of temperatures in the go’s, it was observed that the
microprocessor at sensor station #3, located just south of Dixie Drive, began to report unsuitable data, or report no data at all in the late afternoon that
lasted about one to two hours. Suspecting that it could be a heat related
problem, the aluminum box at this location was later insulated. However, this
problem was not observed at other sensor stations. If it is a heat related
problem, subsequent radio/micro-processor boxes should be insulated to
provide the best protection against radiant heat.
3.51 PERF0 NCE OF WARE AND SOFTWARE
The hardware and software performed well during the course of deployment in Dayton, Ohio when TIPS was operated fiom July 14, 2000 until
November 4, 2000. The hardware of the system including radios, micro-
controllers, antennae, sensors and trailers performed reliably in all weather
conditions (including severe thunderstorms). The only weather related incidents
were the previously-mentioned effects of lightning and related power surge on the

19
sensor at station #5, and the possible heat related problem experienced by the micro-controller at sensor station #3.
I
The TIPS software performed well during the period of deployment. The
s o h a r e was originally configured to calculate the travel times at five-minute
increments. After repeatedly monitoring the actual travel times and comparing
them to the predicted travel times, it was decided to update the travel times on all
CMSs at four-minute increments. The new travel time increment was
implemented on August 16,2000.
3.52 INCIDENT MANAGEMENT
In addition to providing real-time travel time information to motorists,
TIPS also provided valuable assistance in the management of incidents on
fieeways. The State Highway Patrol officers and the traffic enforcement officers of local municipalities were given the phone number of the TIPS monitoring center at ODOT Outpost. They reported any incidents in the construction work
zone or the area preceding the work zone to the TIPS monitoring personnel who
in turn immediately displayed ‘‘ACCIDENT AHEAD” message on the
changeable message signs. The ability to remotely change the message displayed
to the motorist was expected to relieve congestion and increase highway safety
through the problem area by diverting trafiic to alternate routes.


20
4 EPENDENT EVALUATION OF TIPS
The Ohio Department of Transportation (ODOT) hired Dr. Helmut Zwahlen, Russ Professor Emeritus at Ohio University, to conduct an independent
evaluation of the Travel Time Prediction System (TIPS). This evaluation was
performed primarily to (a) veri@ the accuracy of the travel times displayed on the
CMSs and (b) to assess motorists' response to the messages displayed by TIPS.
The data collection for the independent evaluation were performed on October
12-14,2000. During this time, three cars with two persons in each car recorded
the displayed and actual travel times for each changeable message sign from 5:OO
AM until 8:OO PM each day. The surveyors also recorded the license plates of the
cars on the freeway during this period. Later a questionnaire was mailed to more than 3 100 owners of these cars, whose names and addresses were obtained by Dr.
Zwahlen fiom the Bureau 'of Motor Vehicles. Readers are encouraged to read the
report (Reference 3) on evaluation of TIPS deployment at this site. The result of the evaluation showed that 88% of the actual times recorded for each sign, and for
all the signs combined, were within a range of f 4 minutes of the predicted time.
(Remember: TIPS was configured to display travel time at 4-minute increments).
The result also showed that 97% of the surveyed motorists felt that a system to
provide real-time travel time in advance of a work zone is either outright helpful
or may be helpful. It was concluded that "the real-time TIPS system represents a
definite improvement over any static non-real-time display system. It provides in
general and most of the time useful and relatively accurate travel time predictions
to the motoring public and appears to be perceived by the motoring public as
helpful and usefil". An abstract of the evaluation report is reproduced below:
ABSTRACT
"A real-time travel time prediction system (TIPS) was evaluated in a construction
work zone. TIPS includes changeable message signs (CMSs) displaying the travel
time and distance to the end of the work zone to motorists. The travel times
displayed by these CMSs are computed by an intelligent traffic algorithm and


21
travel-time estimation model of the TIPS soflware, which takes input fiom
microwave radar sensors that detect the vehicle traflic on each lane of the
fieeway. Besides the CMSs and the radar sensors, the TIPS system includes the computer and microcontroller computing the travel times, 220 MHz radios for
transmitting data fiom the sensors to the computer and fiom the computer to the
CMSs, and trailers with solar panels and batteries to power the radar sensors,
CMSs, and radios. The evaluation included an accuracy analysis between the
predicted and actual recorded travel times and a survey of the motoring public.
Three crews driving independently of each other in the trait stream recorded predicted and actual travel times at three CMSs to the end of the work zone for 12
hours each day for three consecutive days, resulting in 119 trial runs. The data recorder in each crew also recorded the license plate numbers of private non-
commercial vehicles with Ohio license plates. A total of 3177 different license
plate numbers were recorded and a questionnaire was sent to each one. A total of
660 completed surveys were returned and analyzed. Based on the regression
analysis of actual times vs. predicted times, the system does on the average a reasonable job in predicting the travel times to the end of the work zone. About 88% of the actual times recorded for each sign, and for all the signs combined,
were within a range of f 4 minutes of the predicted time. However, a few
differences (actual - predicted) as great as 18 minutes were observed. Survey
responses indicated that the motoring public does perceive a certain inaccuracy in
the travel times. However, almost 97 % of surveyed motorists felt that a system to
provide real-time travel information in advance of work zones is either outright
helpfil or maybe helpful. In summary we may conclude that the real-time TIPS system represents a definite improvement over any static non-real-time display
system. It provides in general and most of the time usefbl and relatively accurate
travel time predictions to the motoring public and appears to be perceived by the
motoring public as helpful and useful".


22
5 CONCLUSIONS & RECO NDATIONS
Traffic congestion in fieeway work zones is generally a fiustrating
experience for motorists. An efficient traffic management system in fieeway work zones becomes a top priority for public officials involved in the construction
and rehabilitation of fieeways. The Travel Time Prediction System (TIPS) would
aid ODOT in this process and would be a useful tool due to the capability to
provide real-time information to motorists about traffic conditions.
The implementation of the Travel Time Prediction System (TIPS) fulfilled
the objective of informing the motorists of the estimated travel time to the end of
the work zone. This information was potentially useful to the motorists in making
driving and route decisions based on the travel time information displayed on the changeable message signs.
This successful implementation of TIPS serves to illustrate the capabilities
and reliability of the system. TIPS has been usefbl in accurately predicting travel
time through the work zone on northbound 1-75 in Dayton, Ohio. TIPS was
successfblly used as an information system for motorists during additional lane
closures resulting extended travel times when twenty-four hour construction was
employed throughout the work zone. TIPS has been proven to be an accurate and
flexible system to deliver real-time travel information to motorists. The full implementation of TIPS has provided motorists with the real-time travel time
through the work zone, for the duration of the project. This project, which is the implementation and testing of the TIPS system,
was a success by any measure. The full-scale implementation of TIPS provided
fbrther validation of the travel time prediction model and all other hardware and
s o b a r e components. Based on the experience of the field tests, it was found that
all components performed satisfactorily and the stated objectives of the project
were achieved. An independent evaluation of TIPS concluded that "the real-time TIPS
system represents a definite improvement over any static non-real-time display


23
system. It provides in general and most of the time useful and relatively accurate
travel time predictions to the motoring public and appears to be perceived by the
motoring public as helphl and useful".
The researchers are confident that in the future, TIPS would be a valuable
tool for providing real-time travel time information to motorists in freeway work
zones. It is recommended that the Ohio Department of Transportation (ODOT) use the Travel Time Prediction System in future freeway work zones.


6 REFERENCES
(1) Pant, Prahlad D. (2000). A Portable Real-Time Trafic Control System for Freeway Work Zones, Report No. FHwA/oH-2000/0 1 1 , July 2000
(2) Pant, Prahlad D. (2000). A Portable Real-Time TraDc Control System for Freeway Work Zones, Travel Time Prediction System mPS) User's Guide Version 2. I , Report No. FHWA/OH-2000/0 12, July 2000
(3) Zwahlen, Helmut T. (2001). Evaluation of A Real-Time Travel Time Prediction System in a Freeway Construction Work Zone, Final Report, Prepared for the Ohio Department of Transportation, March 2001