Embed Size (px)
DESCRIPTION
Power Industry
Citation preview

FIN 254
Project
Submitted to: Shanila Taneem (SnT)
SEC: 12
Submitted by:
Name ID
Sharif Md. Saddam 1120799030
Hasan Mahmood Sagar 1120180030
Hossain Al Imran 1130395030
M. Wasif Rahman 1120909530
Salman Mostafiz Mahi 1110607030
Kamrul Hasan 1120231030

Introduction If management is to maximize a firms value it must take advantage of the firms strengths and correct its weakness,(1) financial statement analysis involves comparing the firm’s performance with that of other firms in the same industry and (2) evaluating trends in the firm’s financial position over time. However the real value of financial statement lies in the fact they can be used to help future earnings and dividends. From an investors standpoint, predicting the future is useful both to help anticipate future conditions and more important as a starting point for planning actions that will improve the firms future performance. Financial ratios are designed to help one evaluate a financial statement. As a part of our course (fin 254) we have decided to find out the ratio analysis of 4 companies named, Summit power ltd, Desco power ltd, Khulna power ltd, Bangladesh power development board.
DESCO Power LTD:
Desco is the electricity supply industry in South Asia which started with the commissioning of the first power station in the 1890s. For the next 20 years, a number on small stations were constructed although isolated, catering to small distribution networks serving the major urban centers. In 1910, the first effort to structure a legal framework for the industry came to take place with the enactment of the Indian Electricity Act, 1910.
Desco achieves to be a role-model electric supply company in the region using most dependable technologies and be a development partner in the continuous welfare of the society, providing service to the utmost satisfaction of consumers through reliable and uninterrupted power supply and provide value for money.

SUMMIT POWER LTD
Summit Power Limited (SPL) is the first Bangladeshi Independent Power Producer (IPP) in Bangladesh in private sector providing power to national grid. It is sponsored by Summit Group. SPL was incorporated in Bangladesh on March 30, 1997 as a Private Limited Company. On June 7, 2004 the Company was converted to Public Limited Company under the Companies Act 1994.
The company seeks to generate and provide uninterrupted reasonably priced electricity to its customers. To provide quality & uninterrupted electricity to the vast majority of rural Bangladesh for their personal, social & economic development. The company is striving to establish more power plants around the country. The fast-growing company hopes to empower Bangladesh and has set a mission to expand the company with a power generation capacity to the tune of 1000 MW, which is a modest 20% of the electricity requirement in Bangladesh.
Khulna Power Ltd:
Khulna Power Company Ltd. (KPCL) is the first Independent Power Producer (IPP) of the country stablished in 1997 under the Private Sector Power Generation Policy and are in operation for last 12 years. It owns and operates a 110 MW barge mounted power plant that commenced its operation in October 1998. Its paid up capital is BDT 2085.93 million (US$ 44.10 million). When established, KPCL shareholders were Coastal Power Company (later Coastal was merged with El Paso Corporation, USA) through its direct wholly-owned subsidiary El Paso Khulna Power ApS, Summit Industrial & Mercantile Corporation (Pvt.) Ltd. (Bangladesh), United

Enterprises & Co Ltd. (Bangladesh) and Wärtsilä Development and Financial Services (Asia) Ltd.
Now only local shareholders hold 100% ownership of the company. The total initial project cost was USD 96.07 million. KPCL owns and operates a barge mounted power plants in Khulna and supply electricity to the national grid of Bangladesh. The plant came into operation in October 1998. Nine generator sets are mounted on one barge and ten on the other. Each barge is approximately 91 meters long and 24 meters wide. The plant consumes about 600 MT of Heavy Fuel Oil daily to generate 110 MW power by the 19 generators on the two barges located in Khalishpur, Khulna.
Power Grid (PGCB):
Power Grid Company of Bangladesh Ltd. (PGCB) was created under the restructuring process of Power Sector in Bangladesh with the objective of bringing about commercial environment including increase in efficiency, establishment of accountability and dynamism in accomplishing its objectives. PGCB was incorporated in November 1996 with an authorized capital of Tk.10 billion. It was entrusted with the responsibility to own the national power grid to operate and expand the same with efficiency. Pursuant to Government decision to transfer transmission assets to PGCB from Bangladesh Power Development Board (BPDB) and Dhaka Electric Supply Authority (DESA), PGCB completed taking over of all the transmission assets on 31.12.2002. Since then, PGCB is operating those efficiently and effectively.Bangladesh Power Development Board (BPDB) was assigned to manage power transmission system,power generation and power distribution through out Bangladesh before formation of Power Grid Company of Bangladesh Ltd.(PGCB). PGCB was established on the 21st November, 1996 as a fully BPDB owned company with an authorized capital of Tk.10 billion under the Power Sector Reform Program of the Government. PGCB has been running under the Company Act 1994.

1.Current Ratio=Current asset/current liabilities :
2007-2008
2008-2009 2009-2010 2010-2011
DESCO power ltd
2.59 3.23 3.64 3.49
Summit power ltd
0.87 0.60 0.89 0.51
Khulna power ltd
1.06 1.36 0.40 0.45
PGCB 0.89 0.82 4.43 3.69
2007-2008 2008-2009 2009-2010 2010-20110
0.5
1
1.5
2
2.5
3
3.5
4
DESCOSUMMITKPCLPGCB
1. Current ratio:
Interpretation [DESCO Power ltd]: DESCO Power ltd had a ratio of 3.49 times in the year of 2011 which means in 2011, the company’s current assets were 3.49 times of its current liability. The company’s trend of current ratio was quite stable throughout 2008-2009 and it sloped downward in 2010 which is near of 2011. It is good for the company that in 2011 it has increased to 3.49 from 2010.

Interpretation [Summit power ltd]: Summit power ltd had a ratio of 0.51 times in the year of 2011 which means in 2011, the company’s current assets were 0.51 times of its current liability. The company’s trend of current ratio flactuated throughout 2008-2009 and it spiked upward in 2011. It is good for the company that in 2011 it had increased to 0.51 from previous years.
Interpretation [Khulna power ltd]: Khulna power had a ratio of 0.45 times in the year of 2011 which means in 2011, the company’s current assets were 0.45 times of its current liability. The company’s trend of current ratio was quite stable in 2008-2009 and it went up in 2010 and then it went down a little bit in 2011. It is not good for the company that in 2011 it has decreased to 0.45 from 2010.
Interpretation [PGCB]: PGCB had a ratio of 3.69times in the year of 2011, the company’s current assets were 3.69 times of its current liability.
2. Quick Ratio = Current Asset-inventories/Current Liabilities:
2007-2008 2008-2009 2009-2010 2010-2011DESCO power ltd
2.4 2.25 2.65 2.78
Summit power ltd
0.63 0.54 0.68 0.37
Khulna power ltd
.60 .75 .25 .31
PGCB .64 .76 4.21 3.12

2007-2008 2008-2009 2009-2010 2010-20110
0.5
1
1.5
2
2.5
3
3.5
4
4.5
DESCOSUMMITKPCLPGCB
2.Quick ratio:
Interpretation [DESCO Power ltd]: DESCO power ltd had a quick ratio of 2.78 in the year of 2011, the company’s current assets excluding inventory were 2.78 times of its current liabilities. The company had a similar ratio in year 2009-2010 but it was high in 2008. In 2011 the ratio abruptly went down a bit. This ratio 2.78 in 2011 was higher than 2.65 which was the quick ratio of 2010 and it’s much better for the company as in relative to current ratio, the amount of current assets and inventories increased in 2011 in comparison of 2010.
Interpretation [Summit power ltd]: Summit power ltd had a Quick ratio of 0.37 in the year of 2011, which means the company’s current assets excluding inventory were 0.37 times of its current liabilities. The company had a little bit fluctuating rate from 2008-2010. But it decreased abruptly in 2011 which was not satisfactory for the company.
Interpretation [Khulna power ltd]: Khulna power ltd had quick ratio of 0.31 in the year of 2011 which means the company’s current assets excluding inventory were 0.31 times of its current liabilities. The rate of quick ratio was improving gradually but it sloped downward in the year of 2011 with 0.31 which is not good for the company.
Interpretation [PGCB]: BPDB had a quick ratio of 3.12 in the year of 2011 which means the company’s current assets excluding inventory were 3.12 times of its current liabilities. The rate of quick ratio fluctuated in 2008-2009 but it came to a stable position in the year of 2011 which was average for the company.

3. DSO = Receivables/Average Sale per day (Annual Sales/365):
2007-2008 2008-2009 2009-2010 2010-2011DESCO power ltd
74.03 79.34 80.13 80.29
Summit power ltd
42.48 50.39 45.95 53.71
Khulna power ltd
39.62 22.15 54.45 57.79
PGCB 73.59 81.12 80.81 80.35
2007-2008
2008-2009
2009-2010
2010-2011
0% 10% 20% 30% 40% 50% 60% 70% 80% 90% 100%
DESCOSUMMITKPCLPGCB
3. Days Sales Outstanding (DSO):
Interpretation [DESCO power ltd]: DESCO power ltd had a had Days Sales Outstanding (DSO) or Average collection Period of 80 days in the year of 2011 which means in 2011 on an average the company took only 80 days to collect its account receivables from the customers. The company had a high rate of DSO in 2008-2009 but it abruptly started to go down from 2010 to 2011. DSO was smaller in 2011 than 2010 and it may be not good in customer’s point of view as they got less time to clear their payments bit it’s appreciable to the company as it means the company took less time in collecting A/R in 2011 than that of in 2010.

Interpretation [Summit power ltd]: Summit power ltd had DSO of 53 days in the year of 2011 which means in 2011 on an average the company took only 53 days to collect receivables from the customers. The rate in the year of 2008-2010 fluctuated and it decreased in the year of 2011 to 53 days which is good from the customers’ point of view but it is not good for the company as they took less time in collecting A/R in 2011.
Interpretation [Khulna power ltd]: Khulna power ltd had DSO of 57 days in the year of 2011 which means in 2011 on an average the company took 112 days to collect receivables from the customers. The rate was improving in the year of 2008-2011 and it was very high in 2011 which is good from the customer’s point of view but is not good for the company at all.
Interpretation [PGCB]: PGCB had DSO of 80 days in the year of 2011 which means in 2011 on an average the company took 80 days to collect their receivables from the customers. The rate of DSO fluctuated over the years and 80 days in the year of 2011 would be good for the customers but not good for the company.
4. Inventory Turnovers = Sales/Inventory:
2007-2008 2008-2009 2009-2010 2010-2011DESCO power ltd 11.66 2.02 2.33 2.28Summit power ltd 4.55 6.51 5.79 5.33Khulna power ltd
10.05 5.83 8.87 9.12
PGCB 10.69 5.53 3.24 2.26
2007-2008 2008-2009 2009-2010 2010-20110%
10%20%30%40%50%60%70%80%90%
100%
BPCGKPCLSUMMITDESCO

4. Inventory Turnovers:
Interpretation [DESCO power ltd]: DESCO power ltd had an Inventory Turnover Ratio of 2.28 times in the year of 2011 which means in 2011 the company had sold out and restocked its Inventory 2.28 times. The company had a bit fluctuating quick ratio in 2008-2010 and then it increased radically in 2011. It was satisfactory for the company that it had an Inventory Turnover ratio 2.28 times in 2011.
Interpretation [Summit power ltd]: Summit power ltd had an Inventory turnover ratio of 5.33 times in the year of 2011 which means in 2011 the company had sold out and restocked its inventory 5.33 times. The company had an improving rate of inventory turnover ratio in 2008-2010. It increased dramatically in the year 2011 which was very satisfactory for the company.
Interpretation [Khulna power ltd]: Khulna power ltd had an Inventory Turnover Ratio of 9.12 times in the year of 2011 which means in 2011 the company had sold out and restocked its inventory 9.12. The company had an improving rate in the year of 2008-2010 but it decreased a little bit in the year of 2011 which was not good for the company.
Interpretation [PGCB]: PGCB had an Inventory Turnover Ratio of 2.26 times in the year of 2011 which means in 2011 the company had sold out and restocked its inventory 2.26 times. It sloped downward in the year of 2008-2010 but it spiked upward in the year of 2011 which is very satisfactory for the company.
5. Fixed Asset Turnover = Sales/Net Fixed Asset:
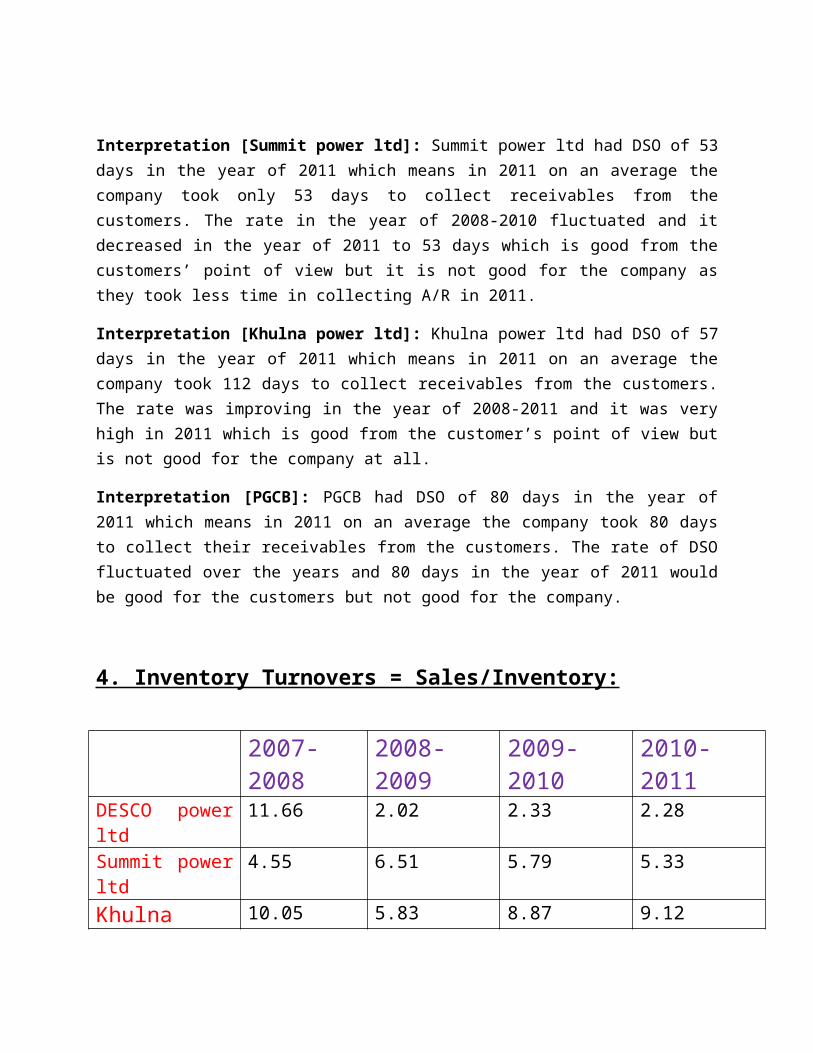
2007-2008 2008-2009 2009-2010 2010-2011DESCO power ltd
0.89 0.82 0.77 0.81
Summit power ltd
0.34 .32 .29 .39
Khulna power ltd
2.36 1.93 1.14 1.19
PGCB .39 .26 .33 .27

2007-2008 2008-2009 2009-2010 2010-20110
0.5
1
1.5
2
2.5
DESCOSUMMITKPCLPGCB
5. Fixed Asset Turnover:
Interpretation [DESCO power ltd]: DESCO power ltd had Fixed Turnover Ratio of 0.81 times in the year of 2011 which means in 2011 the company’s every 1 taka worth of fixed assets generated 0.81 taka worth of sales. The company had good improvements from 2008-2011 because it was spiked upward. The ratio 0.81 in 2011 is higher than 2010 so it is quite satisfactory for the company.
Interpretation [Summit power ltd]: Summit power ltd had Fixed Assets Turnover Ratio of 0.39 times in the year of 2011 which means the company’s every 1 taka worth of fixed assets generated 0.39 taka worth of sales. The company had good improvements throughout the year of 2008-2011 and it was very satisfactory for the company.
Interpretation [Khulna power ltd]: Khulna power ltd had Fixed Assets Turnover Ratio of 1.19 times in the year of 2011 which means the company’s every 1 taka worth of fixed assets generated 1.19 taka worth of sales. The company had good improvements in the year of 2008-2010 but in 2011 it sloped downward which is not very good for the company.
Interpretation [PGCB]: PGCB had Fixed Assets Turnover ratio of 0.27 times in the year of 2011 which means the company’s every 1 taka worth of fixed assets generated 0.27 taka worth of sales. The rate of Ratio fluctuated in the year of 2008-2010 but it increased in the year of 2011 which was very good for the company.
6 Total Asset Turnover = Sales/ Total Asset :
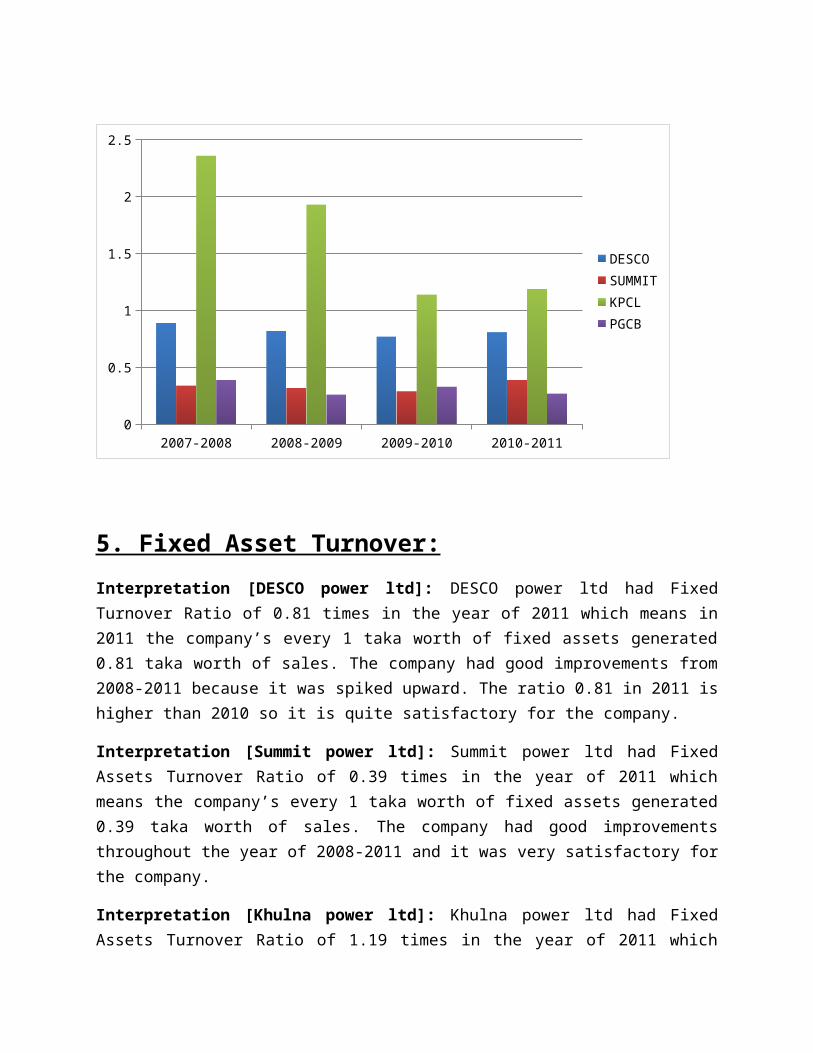
2007-2008 2008-2009 2009-2010 2010-2011DESCO power ltd
0.51 0.42 0.41 0.42
Summit power ltd
.31 .28 .24 .34
Khulna power ltd
1.56 1.19 .86 .87
PGCB .29 .19 .22 .16
2007-2008 2008-2009 2009-2010 2010-20110
0.2
0.4
0.6
0.8
1
1.2
1.4
1.6
DESCOSUMMITKPCLPGCB
6. Total Asset Turnover
Interpretation [DESCO power ltd]: DESCO power ltd had Total Assets Turnover Ratio of 0.42 times in the year of 2011 which means in 2011 the company’s every 1 taka worth of total assets generated 0.42 taka worth of sales. The company had quite proximity of Total Assets Turnover Ratio from 2008 to 2010 and in 2009 it sloped downward a little bit. In 2011 it was really improving and satisfactory for the company.
Interpretation [Summit power ltd]: Summit power ltd had Total Assets Turnover Ratio of 0.34 times in the year of 2011 which means in 2011 the company’s every 1 taka worth of total assets

generated 0.34 taka worth of sales. The rate of the ratio fluctuated in the year of 2008-2010 but it was very poor in the year of 2009. In 2011 it improved a lot and it was satisfactory for the company.
Interpretation [Khulna power ltd]: Khulna power ltd had Total Assets Turnover Ratio of 0.87 times in the year of 2011 which means in 2011 the company’s every 1 taka worth of total assets generated 0.87 taka worth of sales. The rate of the ratio was improving in the year of 2008-2010 but in decreased in the year of 2011 which was not good for the company.
Interpretation [PGCB]: PGCB had Total assets Turnover Ratio of 0.16 times in the year of 2011 which means in 2011 the company’s every 1 taka worth of 0.16 taka worth of sales. The rate was improving in the year of 2008-2010 but in the year 2011 it decreased which was not good for the company.
7. Debt Ratio = Total Liabilities/Total Asset:
2007-2008 2008-2009 2009-2010 2010-2011DESCO power ltd
0.659 0.646 0.664 0.661
Summit power ltd
0.391 0.573 .426 .538
Khulna power ltd
.3335 .2851 .6721 .7006
PGCB 0.587 .614 .730 .734

2007-2008 2008-2009 2009-2010 2010-20110
0.1
0.2
0.3
0.4
0.5
0.6
0.7
0.8
DESCOSUMMITKPCLPGCB
7. Debt Ratio
Interpretation [DESCO power ltd]: DESCO power ltd had Debt Ratio of 66.1% in the year of 2011 which means in 2011 the company’s 66.1% total assets were financed by debt. The company had an decreasing rate of debt ratio from 2009-2011 but it was extremely low in year 2008 at 65.9%. This 66.1% is lower than 66.4% which was the debt ratio in 2010. Due to decrease of total debt, it is good for the company as that means less part of total assets were financed by debt in 2011 than that of 2010.
Interpretation [Summit power ltd]: Summit power ltd had Debt Ratio of 53.8% in the year of 2011 which means in 2011 the company’s 10% total assets were financed by debt. The company had an flactuating rate of debt ratio from 2009-2011 but it was average in year 2008 at 39.1%. This 53.8% is lower than 42.6% which was the debt ratio in 2010. Due to rapid decrease of total debt, it is very much good for the company as that means less part of total assets were financed by debt in 2011 than that of 2010.
Interpretation [Khulna power ltd]: Khulna power ltd had Debt Ratio of 70.06% in the year of 2011 which means in 2011 the company’s 70.06% total assets were financed by debt. The company had an averagerate of debt ratio from 2009-2011 but it was extremely high in year 2008 at 33.35%. This 70.06% is lower than 67.21% which was the debt ratio in 2010. Due to decrease of total debt, it is good for the company as that means less part of total assets were financed by debt in 2011 than that of 2010.
Interpretation [PGCB]: PGCB had Debt Ratio of 73.8% in the year of 2011 which means in 2011 the company’s 73.8% total assets were financed by debt. The company had an flactuating rate of debt ratio from 2009-2011 but it was extremely low in year 2009 at 58.7%. This 73.8% is higher than 73.0% which was the debt ratio in 2010. Due to increase of total debt, it is not good for the company as that means more part of total assets were financed by debt in 2011 than that of 2010.
8 Time-Interest-Earned = EBIT/interest Charge
2007-2008 2008-2009 2009-2010 2010-2011DESCO power ltd
0.12 2.25 11.29 7.48
Summit power ltd
55.46 3.31 2.00 7.97
Khulna power ltd
-4.03 -19.45 -8.50 -3.41
PGCB -80.44 -102.43 -3.85 24.88
2007-2008 2008-2009 2009-2010 2010-20110%
10%
20%
30%
40%
50%
60%
70%
80%
90%
100%
PGCBKPCLSUMMITDESCO

8 Time-Interest-Earned
Interpretation: A high ratio can indicate that a company has an undesirable lack of debt or is paying down too much debt with earnings that could be used for other projects. Almost all the companies are in the same position and POWER GRID is reviving from a very critical condition.
9. ROA= Net Income/Total Asset
2007-2008 2008-2009 2009-2010 2010-2011DESCO power ltd
14.00 16.01 20.31 21.89
Summit power ltd
8.12 6.92 7.96 11.90
Khulna power ltd
5.21 12.91 5.86 6.01
PGCB 10.70 14.9 10.21 12.43
2007-2008
2008-2009
2009-2010
2010-2011
0 5 10 15 20 25
PGCBKPCLSUMMITDESCO
9. Return on Assets (ROA)
Interpretation [DESCO power ltd]: DESCO power ltd had Return On Assets of 21.89% in the year of 2011 which means in 2011 the company received 21.89 taka worth of net income for every 100 taka worth of total assets. The company had an improving ROA in 2009-2011 but it was very poor in 2008. This increased ROA was really satisfactory for the company as it would more investors to invest in the company.
Interpretation [Summit power ltd]: Summit power ltd had Return On Assets of 11.9% in the year of 2011 which means in 2011 the company received 11.9 taka worth of net income for every 100 taka worth of total assets. The company was improving over the years. This increased ROA was really satisfactory for the company as it would more investors to invest in the company.
Interpretation [Khulna power ltd]: Khulna power ltd had Return On Assets of 6.01% in the year of 2011 which means in 2011 the company received 6.01 taka worth of net income for every 100 taka worth of total assets. The company had fluctuated rate of ROA in the year 2008-2010 and in 2011 it had decreased little bit which was not satisfactory for the company.
Interpretation [PGCB]: PGCB had Return On Assets of 12.43% in the year of 2011 which means in 2011 the company received 12.43 taka worth of net income for every 100 taka worth of total assets. The company had ups and down over the years but in year 2011 it had increased high which was good for the company.
10.ROE= Net Income/Total Common Equity:
2007-2008 2008-2009 2009-2010 2010-2011DESCO power ltd
22.38 22.96 19.44 14.90
Summit power ltd
13.25 16.1 13.85 25.42
Khulna power ltd
7.83 18.06 17.89 21.65
PGCB 13.27 17.9 15.21 21.04

2007-2008 2008-2009 2009-2010 2010-20110
5
10
15
20
25
30
DESCOSUMMITKPCLPGCL
10. Return On Equity (ROE)
Interpretation [DESCO power ltd]: DESCO power ltd had a Return on Equity of 14.90% in the year of 2011 which means in 2011 the shareholders received 14.90 taka worth of net income for every 100 taka worth of investment. The company had increased rate of ROE throughout the years. This increased rate was really satisfactory for the company as it would attract more investors to invest in the company. The rate of 2011 was higher than the rate of 2010 which was satisfactory as the relative increase of net income and total equity in 2011 was higher than that of 2010.
Interpretation [Summit power ltd]: Summit power ltd had a Return On Equity of 25.42% in the year of 2011 which means in 2011 the shareholders received 25.42 taka worth of net income for every 100 taka worth of investments. The company had increased rate of ROE over the years. This increased rate was really satisfactory for the company as it would attract more investors to invest in the company.
Interpretation [Khulna power ltd]: Khulna power ltd had Return On Equity of 21.65% in the year of 2011 which means in 2011 the shareholders received 21.65 taka worth of net income for every 100 taka worth of investments. The rate of the company was fluctuated throughout the years. But it was very high in the year of 2011 which was very satisfactory for the company.

Interpretation [PGCB]: PGCB had Return On Equity of 21.04% in the year of 2011 which means in 2011 the shareholders received 21.04 taka worth of net income for every 100 taka worth of investments. The rate of ROE was fluctuated over the years. But it increased in 2011 than 2010 which was good for the company.
11 Net Profit Margin = Net Income / Sales
2007-2008 2008-2009 2009-2010 2010-2011DESCO power ltd
2.58 2.73 3.19 3.50
Summit power ltd
26.48 24.59 32.61 34.52
Khulna power ltd
3.34 10.89 6.79 7.40
PGCB 25.38 36.16 35.29 36.50
2007-2008
2008-2009
2009-2010
2010-2011
0% 10% 20% 30% 40% 50% 60% 70% 80% 90% 100%
DESCOSUMMITKPCLPGCB

11. Net Profit Margin
Interpretation [DESCO power ltd]: DESCO power ltd had a profit margin of 3.50 in 2011.
Interpretation [Summit power ltd]: Summit power ltd had a profit margin 34.52 in 2011.
Interpretation [Khulna power ltd]: Khulna power ltd had a profit margin 7.40 in 2011.
Interpretation [PGCB]: PGCB had a profit margin 36.50 in 2011.
12. Book Value per Share = Share Holder Equity /Number of Share
2007-2008 2008-2009 2009-2010 2010-2011DESCO power ltd
200 390 386.4 378.9
Summit power ltd
134.7 133.4 149 171
Khulna power ltd
1196.5 1321 1467 1561
PGCB 353.81 390.01 386.4 378.9
2007-2008
2008-2009
2099-2010
2010-2011
0 500 1000 1500 2000 2500
DESCOSUMMITKPCLPGCB

12. Book Value per Share
Interpretation [DESCO power ltd]: DESCO power ltd had Book value per share of 378.9 taka in the year of 2011. It means in 2011 the company had 378.1 taka worth of per share. It was decreasing gradually from 2008 to 2011. It was decreasing because total common equity was falling down. It was not good for the owners of the company as retained earnings started falling.
Interpretation [Summit power ltd]: Summit power ltd had Book value per share of 171 taka in the year of 2011. It means in 2011 the company had 171 taka worth of per share. It was increasing gradually from 2008 to 2011. It was increasing because total common equity was going up. It was good for the owners of the company as retained earnings started rising.
Interpretation [Khulna power ltd]: Khulna power ltd had Book value per share of 1561 taka in the year of 2011. It means in 2011 the company had 1561 taka worth of per share. It was fluctuating from 2008 to 2011. It was not good for the owners of the company as retained earning is not that rising that much
Interpretation [PGCB]: PGCB had Book value per share of 378.9 taka in the year of 2011. It means in 2011 the company had 378.9 taka worth of per share. It was decreasing gradually from 2008 to 2010. But in 2011 it started rising. It is good for the owners of the company as retained earnings is rising.
13. P/E = Share Price / Earnings per Share
2007-2008 2008-2009 2009-2010 2010-2011DESCO power ltd
1.27 0.83 0.89 1.41
Summit power ltd
5.24 42.48 37.25 33.01
Khulna power ltd
12.33 4.73 6.52 5.51
PGCB 11.71 18.48 24.62 27.1

2007-2008 2008-2009 20009-2010 2010-20110
5
10
15
20
25
30
35
40
45
DESCOSUMMITKPCLPGCL
13. Price Earnings Ratio (P/E)
Interpretation [DESCO power ltd]: DESCO power ltd had a P/E of 1.41 in 2011.
Interpretation [Summit power ltd]: Summit power ltd had a P/E of 33.01 in 2011.
Interpretation [Khulna power ltd]: Khulna power ltd had a P/E of 5.51 in 2011.
Interpretation [PGCB]: PGCB had a P/E of 27.1 in 2011
14. Earnings per Share =Net Income/Number of Share:
2007-2008 2008-2009 2009-2010 2010-2011DESCO power ltd
74.98 77.19 85.91 71
Summit power ltd
25.71 3.14 4 5.18
Khulna power ltd
.97 2.79 2.25 2.83
PGCB 46.66 42.39 4.41 6.37

2007-2008 2008-2009 2009-2010 2010-20110
10
20
30
40
50
60
70
80
90
100
DESCOSUMMITKPCLPGCB
14. Earnings Per Share
Interpretation [DESCO power ltd]: DESCO power ltd had earnings per of 71 taka in the year
of 2011 which means in 2011 the company’s shareholders earned 71 taka worth of net income for every share they hold. The company had increasing earnings per share from 2010 to 2011. The increased per share of 2011 was really satisfactory for the company as it would attract more investors to invest in the company.
Interpretation [Summit power ltd]: Summit power ltd had earnings per of 5.18 taka in the
year of 2011 which means in 2011 the company’s shareholders earned 5.18 taka worth of net income for every share they hold. The company had increasing earnings per share from 2010 to 2011. The increased per share of 2011 was good for the company as it would attract more investors to invest in the company.
Interpretation [Khulna power ltd]: Khulna power ltd had earnings per of 2.83 taka in the year
of 2011 which means in 2011 the company’s shareholders earned 2.83 taka worth of net income for every share they hold. The company had decreasing earnings per share from 2010 to 2011. The decrease per share of 2011 was not that much satisfactory for the company as it would not attract more investors to invest in the company.

Interpretation [PGCB]: PGCB had earnings per of 6.37 taka in the year of 2011 which means in 2011 the company’s shareholders earned 6.37 taka worth of net income for every share they hold. The company had increasing earnings per share from 2010 to 2011. The increased per share of 2011 was really satisfactory for the company as it would attract more investors to invest in the company.
15. Dividend per Share = Dividend paid to common stock Holder /Number of Share:
2007-2008 2008-2009 2009-2010 2010-2011DESCO power ltd
20 23.8 20.43 11.5O
Summit power ltd
.12 .17 .19 .18
Khulna power ltd
32 27 .89 .0018
PGCB 10.39 10.12 11.24 12.73
2007-2008 2008-2009 2009-2010 2010-20110
5
10
15
20
25
30
35
DESCOSUMMITKPCLPGCL

15. Dividend Per Share:
Interpretation [DESCO power ltd]: DESCO power ltd The amount of dividend per share was 11.50.
Interpretation [Summit power ltd]: Summit power ltd had dividend per share of 0.18 taka in the year of 2011 which was decreased from previous years as 2008-2010 had 50 taka per share. It’s a profit distribution to the shareholder and low DPS can be a sign that the company’s management believes that the rate cannot be sustained.
Interpretation [Khulna power ltd]: Khulna power ltd had DPS of 0.0018 taka per share in the year of 2011 but in the previous year it was fluctuated. It means in 2011 the profit distribution was poor from 2010.
Interpretation [PGCB]: PGCB had a 12.73tk dividend per share.
16. Cash Flow per Share (CPS): Net Income+Dep. +Amoti. /Number of Share
2007-2008 2008-2009 2009-2010 2010-2011DESCO power ltd
112.4 102.1 113.13 102.68
Summit power ltd
53.2 5.92 8.32 9.48
Khulna power ltd
61.12 10.22 10.67 10.60
PGCB -12.38 -38.78 -5.77 -1.59

2007-2008 2008-2009 2009-2010 2010-2011
-60
-40
-20
0
20
40
60
80
100
120
140
DESCOSUMMITKPCLPGCB
Interpretation: In this graph we can see that DESCO cash flow per share is good compared than the other companies.
Conclusion:
The whole point of the thorough analysis conducted on the four companies was to asses this entity in terms of liquidity, profitability, solvency, cash health, comparison with rival and so on. Accordingly, it would safe to say that these companies have great potential for the future. It is invested huge in property, plant, machineries and equipment purpose. All through the year it gain goodwill and create investors trust thus increases in the price of market share.