Embed Size (px)
Citation preview

HHuunnggaarriiaann AAccaaddeemmyy ooff SScciieenncceess KKFFKKII AAttoommiicc EEnneerrggyy RReesseeaarrcchh IInnssttiittuuttee
The material is the intellectual property of the Hungarian Academy of Sciences KFKI Atomic Energy Research Institute. Unauthorized use is not permitted.
File: final-report_Kulacsy.doc AEKI FL
FINAL REPORT
FUMEX-III Improvement of Models Used for Fuel Behaviour Simulation
Katalin Kulacsy
AEKI-FL-2011-704-04/01
Budapest, December 2011

MTA KFKI AEKI FUMEX-III final report
File: final-report_Kulacsy.doc 2/53 AEKI FL
Project: FUMEX-III IMPROVEMENT OF MODELS USED FOR FUEL BEHAVIOUR SIMULATION
Title: FINAL REPORT
Authors: Katalin Kulacsy
Type of the document: RESEARCH REPORT
Registry number: AEKI-FL-2011-704-04/01
Signatures Revision Date
Authors Reviewed by Approved by
0.
20-12-2011
Katalin Kulacsy Zoltán Hózer János Gadó 1.
2.
3.
Revision Date Short description of the revision
1.
2.
3.

MTA KFKI AEKI FUMEX-III final report
File: final-report_Kulacsy.doc 3/53 AEKI FL
TABLE OF CONTENTS
1. Introduction ...................................................................................................................5
2. The code FUROM..........................................................................................................6 3. The US PWR 16x16 case ...............................................................................................7
3.1. Irradiation histories .........................................................................................................7 3.2. FUROM input ..................................................................................................................8 3.3. Observations concerning the data ...................................................................................8 3.4. Results of the calculations ................................................................................................9
4. The SPC RE GINNA case............................................................................................13 4.1. Irradiation histories .......................................................................................................13 4.2. FUROM input ................................................................................................................15 4.3. Observations concerning the data .................................................................................15 4.4. Results of the calculations ..............................................................................................16
5. The AREVA idealised case n° 2 ...................................................................................21 5.1. Irradiation history..........................................................................................................21 5.2. FUROM input ................................................................................................................22 5.3. Observations concerning the data .................................................................................22 5.4. Results of the calculations ..............................................................................................22
6. The Kola3-MIR case ....................................................................................................24 6.1. Irradiation histories .......................................................................................................24
6.1.1. Base irradiation........................................................................................................................ 24 6.1.2. Ramp tests ............................................................................................................................... 24
6.2. FUROM input ................................................................................................................26 6.2.1. Base irradiation........................................................................................................................ 26 6.2.2. Ramp tests ............................................................................................................................... 26
6.3. Observations concerning the data .................................................................................26 6.4. Results of the calculations ..............................................................................................26
6.4.1. Base irradiation........................................................................................................................ 26 6.4.2. Ramp tests ............................................................................................................................... 27
7. The IFA-519.9 case......................................................................................................32 7.1. Irradiation histories .......................................................................................................32 7.2. FUROM input ................................................................................................................34 7.3. Observations concerning the data .................................................................................34 7.4. Results of the calculations ..............................................................................................35
8. Conclusions regarding the code FUROM....................................................................37
9. Conclusions of the FUMEX-III programme ...............................................................38

MTA KFKI AEKI FUMEX-III final report
File: final-report_Kulacsy.doc 4/53 AEKI FL
References ...........................................................................................................................39
Appendix..............................................................................................................................40 A. Input for the US PWR 16x16 case .........................................................................................41 B. Input for the SPC RE GINNA case .......................................................................................42 C. Input for the AREVA idealised case n° 2 ..............................................................................43 D1. Input for the Kola3-MIR case..............................................................................................44 D2. Correction of the in-pile data for the Kola3-MIR test ........................................................46 E. Input for the IFA-519.9 case ..................................................................................................53
MTA KFKI AEKI FUMEX-III final report
File: final-report_Kulacsy.doc 5/53 AEKI FL
1. Introduction The FUMEX-III coordinated research programme organised by the IAEA was the first
FUMEX exercise in which AEKI (Hungarian Academy of Sciences KFKI Atomic Energy Research Institute) took part with the partial support of Paks NPP. The aim of the participation was to test the code FUROM developed at AEKI against not only measurements but also other fuel behaviour simulation codes, to share and discuss modelling experience and issues, and to establish acquaintance with fuel modellers in other countries.
Among the numerous cases proposed for the programme, AEKI chose to simulate normal operation up to high burn-up and ramp tests, with special interest in VVER rods and PWR rods with annular pellets. The US PWR 16x16, the SPC RE GINNA, the Kola3-MIR, the IFA-519.9 cases and the AREVA idealised rod were thus selected.
The present Final Report gives a short description of the FUROM models relevant to the selected cases, presents the results for the 5 cases and summarises the conclusions of the FUMEX-III programme. The input parameters used for the simulations can be found in the Appendix at the end of the Report. Observations concerning the IFPE datasets are collected for each dataset in their respective Sections for possible use in the IFPE database.

MTA KFKI AEKI FUMEX-III final report
File: final-report_Kulacsy.doc 6/53 AEKI FL
2. The code FUROM The present report was written on the basis of simulations performed by version 2.0 of
the fuel behaviour modelling code FUROM (FUel ROd Model), developed at AEKI.
The code works in an axi-symmetric, quasi-static, finite difference approach, it is therefore suitable for simulating normal operation and anticipated operational occurrences. It was initially developed for VVER fuel elements, but has been extended to PWR rods as well: it can handle UO2 fuel (not MOX) and E110 or Zr-4 cladding.
The models of most interest for the cases simulated by AEKI are fuel swelling, fuel creep thermal (diffusional) FGR and athermal (rim) FGR.
Fuel swelling is calculated using an empirical linear dependence on burn-up and is supposed to start at a burn-up of 6 MWd/kgU.
Fuel creep is not modelled in version 2.0 of the code FUROM, only thermal expansion, pellet cracking, relocation, densification and swelling are simulated using empirical formulae.
Two alternative models are available for thermal FGR: a simple, one-step model where a certain fraction of the produced fission gases is released directly into the free volume, and a more sophisticated, two-step model where the grain boundary retention is taken into account. In the latter case a burn-up dependent athermal release is simulated to account for the release during incubation, and after saturation the gas in excess of the saturation value is released into the free volume. During ramps, the complete grain boundary gas inventory is released when the fuel reaches the Vitanza threshold [1]. The two-step model is mainly used to simulate ramp tests.
Athermal rim FGR can also be simulated using two different models, one fitted to PWR and the other to VVER data.
All FGR models can calculate the release of not only stable but also radioactive gaseous and volatile fission product isotopes, 36 isotopes in all. They work on the basis of the fission product inventory, which takes into account the production of plutonium in the periphery of the pellet, but averages it out along the pellet radius. The Xe/Kr ratio in the released fission gas can therefore not be simulated correctly, as only the average production ratio is correct, the different local ratios serving as the basis for the release are not considered.
The code can handle as many as 45 axial and 20 radial sections (all equidistant) in a maximum of 5000 time steps. The axial numbering in the code starts from the bottom of the fuel rod, whereas the radial starts from outside.
MTA KFKI AEKI FUMEX-III final report
File: final-report_Kulacsy.doc 7/53 AEKI FL
3. The US PWR 16x16 case The aim of the experiment was to study the effect of burn-up on fuel behaviour. Two
LTA’s were irradiated in a commercial PWR, one of them for 5 cycles. The rods and rodlets included in the IFPE database were in this assembly [2].
The fuel elements were composed of solid or annular pellets, and standard Zr-4 cladding or Zr-4 lined with graphite. Two rods were selected as priority cases for the FUMEX-III exercise: rod TSQ002 (solid pellets, standard cladding, burn-up of approx. 53 MWd/kgU) and rod TSQ022 (annular pellets, standard cladding, burn-up of approx. 58 MWd/kgU). Burn-up, density, FGR, rod free volume and cladding outer diameter were measured after the irradiation.
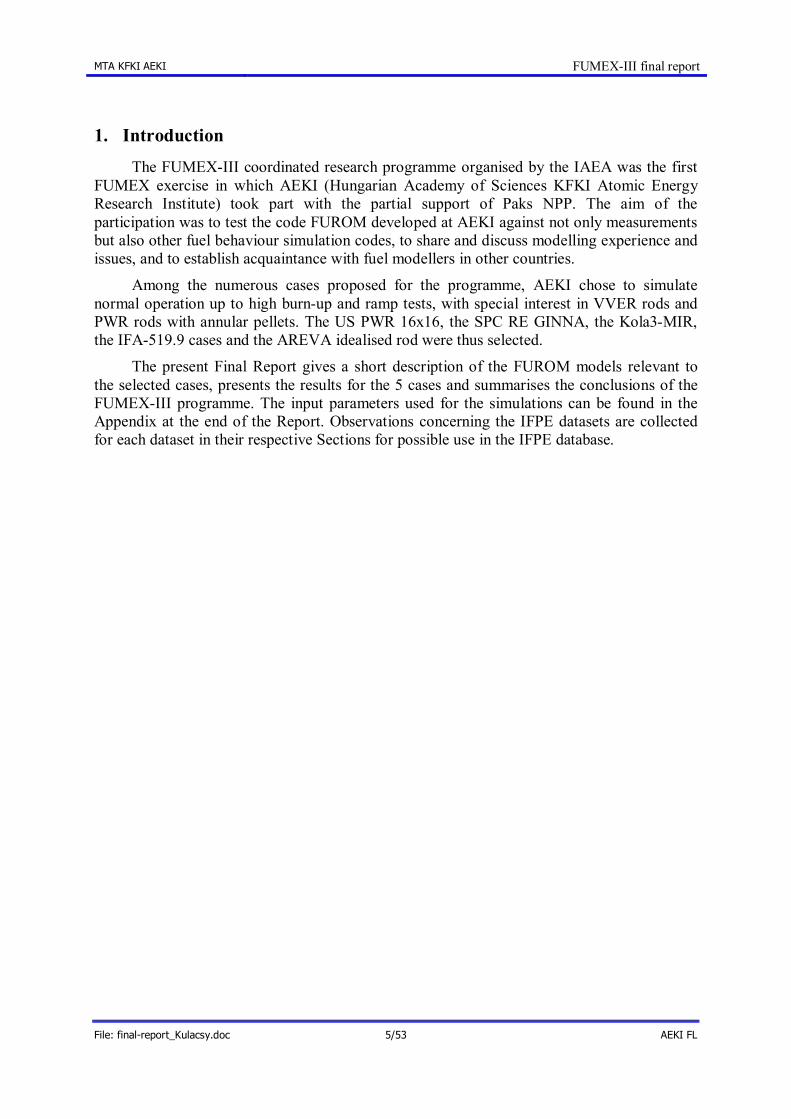
3.1. Irradiation histories The two selected rods were irradiated in normal operation conditions at moderate power
levels as shown in Fig. 3-1.
0
5
10
15
20
25
0 200 400 600 800 1000 1200 1400 1600 1800time (d)
LHR
(kW
/m)
TSQ002TSQ022
Figure 3-1: Power histories of the selected rods
Accordingly, the fuel centreline temperatures were far below the Vitanza [1]threshold during the entire irradiation as seen in Fig. 3-2. The thermal FGR is therefore not expected to exceed 1%.

MTA KFKI AEKI FUMEX-III final report
File: final-report_Kulacsy.doc 8/53 AEKI FL
0100200300400500600700800900
100011001200130014001500
0 200 400 600 800 1000 1200 1400 1600 1800time (d)
fuel
cen
trel
ine
tem
pera
ture
(°C
)TSQ002TSQ022Vitanza threshold
Figure 3-2: Maximum fuel centreline temperature of the selected rods
3.2. FUROM input The technological input data applied for the simulations are given in Appendix A. The
irradiation histories were provided in 25 axial sections. Missing data and suggestions on how to obtain them are summarised in Section 3.3.
3.3. Observations concerning the data The dataset does not include pellet roughness, cladding roughness and re-sinter density. Fast neutron flux is not given but can be calculated from the LHR using the flux
conversion factor given in the dataset. This implies that fast neutron fluxes at the ends of the rods will not be quite realistic.
If the segmented rod in the dataset is also considered (not only the priority cases) then the helium contents of rodlet n° 1 given and calculated from volume and pressure data show a significant difference. Also, if a linear fit is made for the LHR of the rodlets, the burn-up calculated on the basis of the linear fit differs significantly from the given value for rodlets n° 1, 2, 7, 8 and 9. Accordingly, only rodlets n° 3 through 6 are suitable for code validation purposes.
The measured Xe+Kr volume for rodlets 3 through 6 is not consistent with the given final and initial total gas volumes. The Xe+Kr volume seems to be the right value.
Fission gas release fraction is given for rodlets 3 through 6. However, the calculation of the inventory used as the basis of the release fraction is approximate.

MTA KFKI AEKI FUMEX-III final report
File: final-report_Kulacsy.doc 9/53 AEKI FL
3.4. Results of the calculations The burn-up of the rods was measured at several axial positions. The calculations and
the measurements are presented in Fig. 3-3: burn-up calculated on the basis of the given power history is a little lower than the measured value.
The densities were also measured at certain elevations, the results are plotted together with the calculated values in Fig. 3-4. The densities of the two rods are approximately equal even though there is a difference of 5 MWd/kgU in their burn-up. The calculations show the increase of porosity with burn-up, as described in Section 2, the calculated porosity is therefore high for rod TSQ022 (with the higher burn-up).
30
35
40
45
50
55
60
65
0 0.5 1 1.5 2 2.5 3 3.5 4elevation (m)
burn
-up
(MW
d/kg
U)
TSQ002 measuredTSQ002 calculatedTSQ022 measuredTSQ022 calculated
Figure 3-3: Measured and calculated axial burn-up of rods TSQ002 and TSQ022

MTA KFKI AEKI FUMEX-III final report
File: final-report_Kulacsy.doc 10/53 AEKI FL
9.95
10
10.05
10.1
10.15
10.2
10.25
10.3
0 0.5 1 1.5 2 2.5 3 3.5 4elevation (m)
dens
ity (g
/cm
3 )
TSQ002 measuredTSQ002 calculatedTSQ022 measuredTSQ022 calculated
Figure 3-4: Measured and calculated axial densities of rods TSQ002 and TSQ022
The free volume of the rods changed according to Table 3-1. The calculated free volumes are somewhat smaller than the measured ones, which may be due to the overestimated swelling. However, the rod diameter measurements do not support this explanation (see below).
Table 3-1: Free volume of the rods
initial free volume (cm3)
measured final free volume (cm3)
calculated final free volume (cm3)
TSQ002 25.42 17.80 16.47 TSQ022 37.22 31.00 28.24
The fission gas release of the rods can be given in terms of the volume of fission gas in the free volume (at standard temperature and pressure) or as fractional release. Since this latter is strongly influenced by the calculation of the total gas inventory, it is more accurate to compare the measured and calculated quantity of fission gas in the free volume. Table 3-2 shows the results for the priority case rods. The solid-pellet rod is well modelled, whereas the calculated FGR for the annular-pellet rod is too high by a factor of 2.
Table 3-2: Fission gas in the free volume at STP
measured fission gas (cm3 STP)
calculated fission gas (cm3 STP)
TSQ002 (solid) 34.5 33.4 TSQ022 (annular) 23.0 46.9
In order to highlight the dependence of FGR on burn-up, the ‘specific FGR’, i.e. the FGR per unit of energy release was calculated. This is a quantity analogous to the usual FGR,

MTA KFKI AEKI FUMEX-III final report
File: final-report_Kulacsy.doc 11/53 AEKI FL
but without the effect of the different inventory calculation methods. The results are presented in Table 3-3.
Table 3-3: ‘Specific FGR’ at STP
measured ‘specific FGR’ (cm3 STP/MWd)
calculated ‘specific FGR’ (cm3 STP/MWd)
TSQ002 (solid) 0.346 0.334 TSQ022 (annular) 0.230 0.468
The FGR of the annular-pellet rod is unexpectedly low considering its higher burn-up. This implies that most of the release is thermal and originates from the hot inner part of the rod, which is in agreement with the LHR’s of Fig. 3-2. The same effect is seen in the other, non-priority annular rod (TSQ064) of the dataset.
As the calculated release comes mainly from the rim, the calculated FGR of rod TSQ022 is the higher. Considering that all releases are very low, the difference does not affect the thermo-mechanical behaviour of the rod.
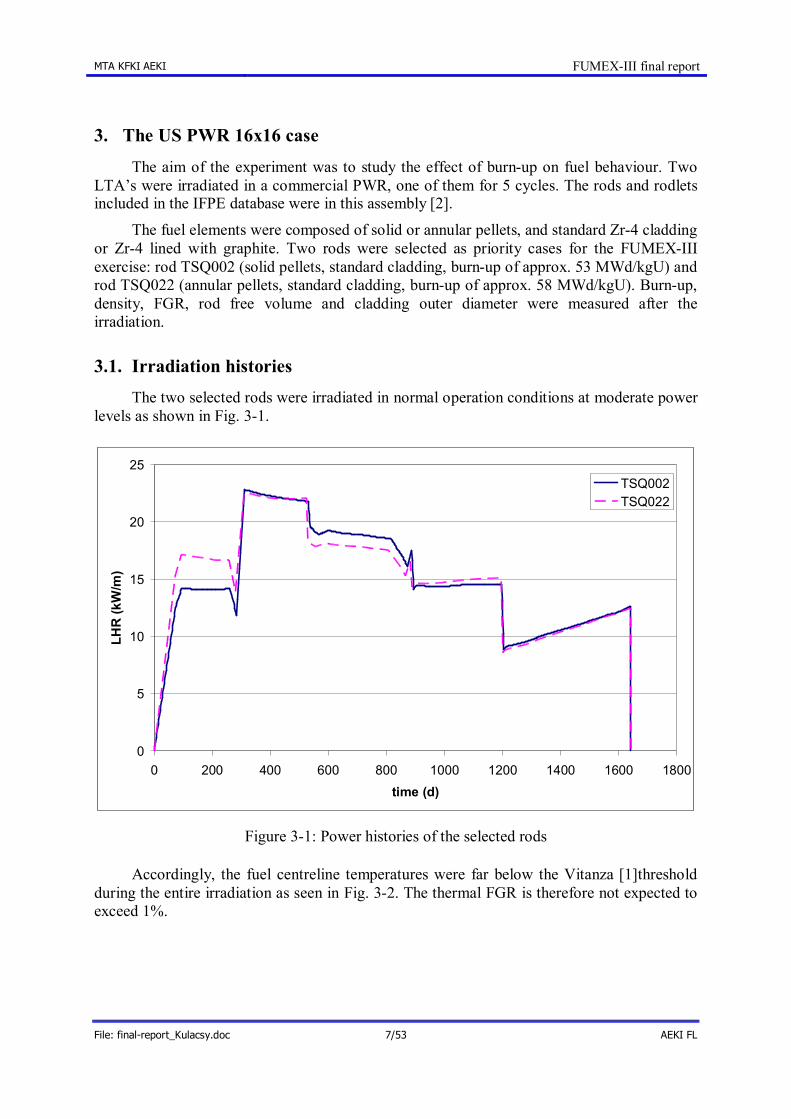
Cladding creep in the central sections of the fuel element (where the gap is closed) gives information on the pellet diameter, whereas in the end sections it refers to the creep properties of the zirconium alloy. However, this latter strongly depends on the local temperature and fast neutron fluent. Figs. 3-5 and 3-6 present the measured and calculated cladding creep-down values. Calculations were performed with a re-sinter density set in such a way that the results be optimal for the entire US PWR 16x16 dataset.
The results for the central sections are in good agreement with the measurements. At the top of the rods, the calculated creepdown is greater than the measured value, which may be due to the inaccurate fast neutron fluence (see Section 3.3).
-50
-45
-40
-35
-30
-25
-20
-15
-10
-5
00 50 100 150 200 250 300 350
distance from bottom of fuel stack (cm)
clad
ding
cre
epdo
wn
(mcm
)
measuredcalculated
Figure 3-5: Cladding creepdown for rod TSQ002
MTA KFKI AEKI FUMEX-III final report
File: final-report_Kulacsy.doc 12/53 AEKI FL
-45
-40
-35
-30
-25
-20
-15
-10
-5
00 50 100 150 200 250 300 350
distance from bottom of fuel stack (cm)
clad
ding
cre
epdo
wn
(mcm
)
measuredcalculated
Figure 3-6: Cladding creepdown for rod TSQ022

MTA KFKI AEKI FUMEX-III final report
File: final-report_Kulacsy.doc 13/53 AEKI FL
4. The SPC RE GINNA case The experiment aimed at finding ways to reduce the effect of PCI during normal
operation: it included standard solid and annular pellets, and standard Zr-4 cladding and Zr-4 with a pure zirconium liner. Full-length and segmented rods were included in the experiment. The IFPE database contains the data of 11 full-length rods and 8 segmented rods. The rods were irradiated in normal operation conditions up to 4 or 5 cycles, to a burn-up between 41.4 and 56 MWd/kgU [3]. The FUMEX-III priority cases were the rodlets with standard cladding, solid or annular pellets and standard gap, i.e. rodlets 1 through 4. Since the entire dataset has been simulated at AEKI, some information is used from the other rods and rodlets as well.
The main characteristics of the rodlets and measurements performed on them are summarised in Table 4-1 ([4], [5]).
Table 4-1: Main characteristics of the rodlets and measurements performed on them
ID type (pellet/ cladding)
rod avg. BU (MWd/kgU) / number of cycles
fuel
stac
k le
ngth
clad
ding
dia
met
er
wat
ersid
e ox
ide
thic
knes
s
free
vol
ume
FGR
Xe/
Kr
ratio
gas c
ompo
sitio
n
Kr,
Xe
isoto
pes
rlt1 solid/standard standard gap 41.4 / 4 x x x x x x x
rlt2 solid/standard standard gap 48.8 / 5 x x x x x x x x
rlt3 annular/standard standard gap 45.1 / 4 x x
rlt4 annular/standard standard gap 53.7 / 5 x x x x x x x x
4.1. Irradiation histories The irradiation histories of the 4 priority case rodlets are presented in Fig. 4-1.

MTA KFKI AEKI FUMEX-III final report
File: final-report_Kulacsy.doc 14/53 AEKI FL
0
5
10
15
20
25
30
35
0 200 400 600 800 1000 1200 1400time (d)
LHR
(kW
/m)
1234
Figure 4-1: Irradiation histories of rodlets 1 through 4
The corresponding calculated fuel centreline temperatures are presented in Fig. 4-2. The solid-pellet rodlets were rather close to if not above the Vitanza threshold in their second cycle, a FGR value of more than 1% is therefore to be expected.
0
200
400
600
800
1000
1200
1400
0 10000 20000 30000 40000 50000 60000burn-up (MWd/tU)
fuel
cen
trel
ine
tem
pera
ture
(°C
)
1 (solid)2 (solid)3 (annular)4 (annular)Vitanza
Figure 4-2: Fuel centreline temperatures of rodlets 1-4 and the Vitanza threshold

MTA KFKI AEKI FUMEX-III final report
File: final-report_Kulacsy.doc 15/53 AEKI FL
4.2. FUROM input The technological input data applied for the simulations are given in Appendix B. The
irradiation histories were provided in 5 axial sections. As certain measurements were performed during outages, a cool time step has been inserted after each cycle. Missing data and suggestions on how to obtain them are summarised in Section 4.3.
4.3. Observations concerning the data Pellet roughness is not given. There are discrepancies in the initial densities in document XN-NF-85-79: the design
density is 94% for the full-length rods, Table 3.2 gives 95.04-95.58% for the different pellet types, Table 5.3 gives 94.31-94.58 for the individual segmented rods. Table 3.2 is probably wrong, the correct densities should be between 94.04 and 94.58 for the different pellet types.
There are also discrepancies in the enrichment in document XN-NF-85-79: the design value is 3.7% for the full-length (annular) rods. Table 3.1A gives 3.708-3.711 for the annular pellets. As far as the solid pellets are concerned, the aim is to obtain the same burn-up. As the volume of the solid pellets is approx. 10% higher than that of the annular ones and the aim is to reach the same burn-up, the enrichment should be about 3.35% (Section 3.0), as opposed to the 3.52% given in Table 3.1A for solid pellets.
The fast neutron flux, and especially its axial profile is missing. The rod average fast neutron fluent is given for each time step, but it is the same for all rods in an assembly, which makes the data rather questionable. The flux can be calculated e.q. by fitting a function of the form
IAXIIAXIIAXI PBUK ,,, )(
on the fluent data, where
BBUABUK )( , I denotes the time step IAX is the axial section is the fast neutron flux P is the LHR BU is the burn-up A, B are the fitting parameters.
It has to be noted that for the full-length rod A01 the fast neutron fluent grows very rapidly at the beginning of the irradiation, compared to the LHR. This gives a rather large deviation between the fluent obtained from the flux calculated using the above method and the fluent given in the dataset at BOL.
The cladding temperatures given in the IFPE are rather approximate: the coolant temperature rise along the core (core ΔT) is assumed valid for all the full-length rods, and the coolant temperature rise along the rods is assumed linear, regardless of the local LHR. However, a better estimate can be made for the full-length rods. The power output of the assembly with respect to the core average is given. The calculated burn-up of the individual rods with respect to the given assembly average can be determined. Thus, the power output of each full-length rod with respect to the core average (referred to henceforward as inequality) can be calculated. As an estimate the core ΔT can be multiplied by the inequality to obtain the rod ΔT, which can be distributed along the rod proportionally to the local LHR. Unfortunately

MTA KFKI AEKI FUMEX-III final report
File: final-report_Kulacsy.doc 16/53 AEKI FL
this cannot be done for the segmented rods, since the data of the segments below and above the documented rods are not known.
The PIE oxide thickness data are controversial. Firstly, the spacers disturbed the coolant flow in such a way that much less oxide was formed in the vicinity of the spacers. Unless the code can model this disturbance, these data have to be ignored. The undisturbed data are best read from the hotcell graphs or taken from the poolside results. Secondly, for rods A01, D04, G03, G09, K09, R14 and rodlets 6 and 9 the oxide thickness measured at pool side after cycles 4 and 5 decreases significantly. Thirdly, the positions of the data given in the tables for the PIE hotcell results are called ‘elevation’, whereas in reality they are ‘distances from end cap shoulder’ measured from the top, as seen in the graphs.
4.4. Results of the calculations The results are mostly presented for those rodlets that are among the priority cases and
measured data are available for them. In some cases, however, especially when few measurements are available, the data of all the rodlets are included in the present report.
Table 4-2 summarises the burn-up measured in PIE, given in the dataset and calculated by the code FUROM, together with the measured and calculated relative increase of the fuel stack length. The calculations are within the range of the measurements.
Table 4-2: Burn-up and relative fuel stack elongation
rodlet ID (pellet type)
measured rod avg. BU (MWd/kgU)
given rod avg. BU
(MWd/kgU)
calculated rod avg. BU (MWd/kgU)
measured fuel stack elongation
(%)
calculated fuel stack elongation
(%) 2 (solid) 48.8 51.7 50.2 1.35 1.04 4 (annular) 53.7 57.0 55.8 0.87 1.19 5 (annular) 45.0 46.4 45.9 1.04 0.93 6 (annular) 54.2 56.6 55.4 0.92 1.18 8 (annular) 55.4 57.5 56.3 0.16 1.20
The measured data exhibit no clear burn-up dependence, or rather a tendency to decrease with burn-up, which is unusual.
Cladding creep has mainly been investigated for the 5-cycle rodlets, where it gives information about the pellet swelling rather than about the cladding creep models. The initial cladding thickness was subtracted from the final cladding diameter corrected for oxide (this gave an approximation for the pellet diameter) and the result was compared to the initial pellet diameter. Figure 4-3 shows the results. Again, no clear burn-up dependence can be seen in the measured data. At higher burn-up the calculated swelling is a little greater than the measured value.

MTA KFKI AEKI FUMEX-III final report
File: final-report_Kulacsy.doc 17/53 AEKI FL
1.1
1.2
1.3
1.4
1.5
1.6
1.7
1.8
49 50 51 52 53 54 55 56 57
burn-up (MWd/kgU)
appr
oxim
ate
rela
tive
incr
ease
of f
uel d
iam
eter
(%
)measured (pool-side)measured (hot cell)calculated
Figure 4-3: Relative increase of fuel diameter for each section of rodlets 2 and 4 (crossed symbols refer to solid pellets)
The rod free volumes were also measured for 6 rodlets. The results are summarised in Table 4-3. Calculated relative decreases are 20-30% greater than measured, which may be due to the overestimation of the swelling.
Table 4-3: Relative change in the free volumes of the rodlets
rodlet meas. rel. change in free V (%)
calc. rel. change in free V (%)
1 (solid) -24.0 -33.0 2 (solid) -26.0 -33.2 4 (annular) -11.4 -20.8 6 (annular) -15.6 -19.5 8 (annular) -17.7 -22.3 9 (annular) -15.2 -15.9
Fission gas release was measured for the same six rodlets and in all but one case by two different methods (85Kr activity and rod perforation). The results are presented in Table 4-4 and Fig. 4-4, where the calculations were made assuming that rim release starts at a local burn-up of 75 MWd/kgU. The threshold value was chosen in such a way that the calculated rim width (62-74 m) be closest to the measured (50-70 m) value. For comparison the purely thermal release is also shown.
As expected the solid rodlets released more than 1% of their fission gas inventories by diffusion both in the measurements and in the calculations. The differences in the calculated and measured burn-up account for the shift in the positions of the points in Fig. 4-4. The calculations agree well with the measurements.

MTA KFKI AEKI FUMEX-III final report
File: final-report_Kulacsy.doc 18/53 AEKI FL
Table 4-4: Calculated and measured burn-up and FGR for six rodlets
rodlet
measured burn-up (MWd/kgU)
calculated burn-up (MWd/kgU)
meas. FGR (85Kr) (%)
meas. FGR (perf.) (%)
calc. FGR (%)
calc. FGR only thermal (%)
1 (solid) 41.4 40.3 1.32 1.54 1.54 2 (solid) 48.8 50.2 2.29 2.36 1.90 1.92 4 (annular) 53.7 55.8 0.94 0.92 1.34 1.03 6 (annular) 54.2 55.4 0.89 1.00 1.24 0.95 8 (annular) 55.4 56.3 0.83 0.98 1.41 1.06 9 (annular) 56.0 54.1 1.35 1.51 1.05 0.85
0
0.5
1
1.5
2
2.5
40 42 44 46 48 50 52 54 56 58
burn-up (MWd/kgU)
FGR
(%)
measuredcalculatedcalculated, no rim
Figure 4-4: FGR vs. burn-up for six rodlets (crossed symbols refer to solid pellets)
The composition of the released fission gases was also measured. The Xe/Kr ratio and the isotopic composition of the xenon and krypton are presented in Tables 4-5 and 4-6.

MTA KFKI AEKI FUMEX-III final report
File: final-report_Kulacsy.doc 19/53 AEKI FL
Table 4-5: Xe/Kr ratio for the rodlets
rlt1 rlt2 rlt4 rlt6 rlt8 rlt9
measured burn-up (MWd/kgU) 41.4 48.8 53.7 54.2 55.4 56.0
measured FGR (%) 1.32 2.33 0.93 0.94 0.91 1.43
measured (−) 8.1 9.6 12.1 11.5 11.5 11.6 Xe/Kr
calculated (−) 9.2 9.6 9.8 9.8 9.8 9.7
The Xe/Kr ratio reveals the origin of the fission gases: as the fission of plutonium yields relatively more xenon than that of uranium, the higher this ratio, the more gas comes from the pellet rim. As expected, the two solid rodlets have lower Xe/Kr ratios, but rlt2 has a developing rim structure that already releases some fission gas.
The calculations cannot render all these details of FGR: the radial distribution of plutonium is not calculated, only the pellet average quantity, hence even if the gas release comes mainly from the rim, the composition of the gas will reflect the pellet average composition.
Table 4-6 shows the isotopic composition of the released xenon and krypton.
Table 4-6: Isotopic composition of the released fission gases
rlt1 rlt2 rlt4 rlt8 rlt9
measured (%) 8.4 7.3 9.1 8.7 8.6 83Kr/∑Kr calculated (%) 15.1 15.2 15.3 15.3 15.2
measured (%) 34.5 35.7 33.5 37.2 35.1 84Kr/∑Kr calculated (%) 26.9 27.0 27.0 27.0 26.9
measured (%) 4.6 4.5 4.8 4.5 4.9 85Kr/∑Kr calculated (%) 7.0 7.0 7.4 7.3 7.4
measured (%) 52.5 52.5 52.6 49.6 51.4 86Kr/∑Kr calculated (%) 51.0 50.8 50.4 50.5 50.4
measured (%) 5.3 4.6 5.6 5.4 5.3 131Xe/∑Xe calculated (%) 7.8 7.1 6.2 6.3 6.3
measured (%) 23.3 23.9 23.4 23.3 23.5 132Xe/∑Xe calculated (%) 20.7 21.4 22.5 22.4 22.4
measured (%) 28.6 28.0 27.8 27.6 27.6 134Xe/∑Xe calculated (%) 28.5 28.3 28.0 28.0 28.1
measured (%) 42.5 43.1 42.9 43.4 43.2 136Xe/∑Xe calculated (%) 43.0 43.2 43.2 43.3 43.2

MTA KFKI AEKI FUMEX-III final report
File: final-report_Kulacsy.doc 20/53 AEKI FL
The results for 86Kr and all the xenon isotopes are very good. The result for 85Kr is irrelevant since it is not known how much time elapsed between the end of the irradiation and the analysis. The results for 83Kr and 84Kr, on the contrary, show rather large deviations, which may be due to discrepancies in the calculation of the respective inventories.
Finally, the rod internal pressure calculations are compared to measurements in Table 4-7. The differences between the measurements and the calculations are consistent with the previous results on free volume and fission gas release.
Table 4-7: Measured and calculated rod internal pressures
rlt1 rlt2 rlt4 rlt6 rlt8 rlt9
measured (bar) 25.6 28.8 23.2 24.6 24.7 24.0 rod pressure
calculated (bar) 32.7 33.2 27.0 26.6 27.5 25.2

MTA KFKI AEKI FUMEX-III final report
File: final-report_Kulacsy.doc 21/53 AEKI FL
5. The AREVA idealised case n° 2 The aim of the exercise was to compare the FGR models of the codes participating in
the FUMEX-III programme. The idealised fuel rod was irradiated for 7 cycles under normal operation conditions up to a rod average burn-up of 81.5 MWd/kgU.
5.1. Irradiation history The irradiation history of the rod is presented in Fig. 5-1.
0
5
10
15
20
25
0 500 1000 1500 2000 2500time (d)
LHR
(kW
/m)
Figure 5-1: Irradiation history of the rod
The corresponding calculated fuel centreline temperature is presented in Fig. 5-2. Even though the Vitanza threshold is not valid for such a high burn-up, it still gives a reference for the fuel centreline temperature: towards the end of the irradiation the temperature was rather close to if not above the Vitanza threshold, a thermal FGR value of more than 1% is therefore to be expected.

MTA KFKI AEKI FUMEX-III final report
File: final-report_Kulacsy.doc 22/53 AEKI FL
0
200
400
600
800
1000
1200
1400
1600
0 10 20 30 40 50 60 70 80 90burn-up (MWd(kgU)
fuel
cen
trel
ine
tem
pera
ture
(°C
)
TcTVit
Figure 5-2: Fuel centreline temperature of the rod and the Vitanza threshold
5.2. FUROM input The data were given in a concise form and are summarised in Table C-1 of Appendix C.
5.3. Observations concerning the data The dataset does not include pellet roughness, cladding roughness and re-sinter density.
5.4. Results of the calculations Fission gas release was given as an interval. The calculated and measured FGR values
are presented in Fig. 5-3, together with the calculated fuel centreline temperature and the Vitanza threshold. The calculated thermal FGR exceeds 1% when the centreline temperature crosses the Vitanza threshold. Nevertheless, the majority of the FGR is due to the athermal rim release, which is significant at such a high burn-up.
The calculated FGR is within the experimental range, even though the burn-up is higher than that usually reached in nuclear power plants.

MTA KFKI AEKI FUMEX-III final report
File: final-report_Kulacsy.doc 23/53 AEKI FL
0
2
4
6
8
10
12
14
0 500 1000 1500 2000 2500
time (d)
FGR
(%)
0
200
400
600
800
1000
1200
1400
1600
fuel
cen
trel
ine
tem
pera
ture
(°C
)
FGR meas.FGR calc.FGR thermalT centrTvit
Figure 5-3: Measured and calculated FGR, calculated fuel centreline temperature and the Vitanza threshold

MTA KFKI AEKI FUMEX-III final report
File: final-report_Kulacsy.doc 24/53 AEKI FL
6. The Kola3-MIR case Nine full-length rods were irradiated in Unit 3 of Kola NPP [6] up to a burn-up of
approx. 50 MWd/kgU (4 cycles, assembly n° 198) or 60 MWd/kgU (5 cycles, assembly n° 222). A central segment was cut from each rod and refabricated into short rodlets, four of which were instrumented, two with pressure transducers and two with fuel centreline thermocouples. The rodlets were subjected to ramp tests in the MIR reactor: in-pile measurements were provided and PIE measurements were made after the tests ([7], [8]).
The priority cases of the FUMEX-III exercise were re-instrumented rods n° 41 and 48 equipped with pressure transducers, and rods n° 50 and 51 equipped with fuel centreline thermocouples. However, the entire dataset has been simulated at AEKI and some results are used to help the evaluation of the results for the priority cases.
6.1. Irradiation histories
6.1.1. Base irradiation
The nine mother rods were irradiated at medium linear heat rates as shown in Figure 6-1. The fuel centreline temperatures did not reach the Vitanza threshold.
0
2
4
6
8
10
12
14
16
18
0 200 400 600 800 1000 1200 1400 1600time (d)
LHR
(kW
/m)
assembly 198assembly 222
Figure 6-1: Linear heat rates of typical rods in fuel assemblies 198 and 222
PIE was performed on the rods after base irradiation.
6.1.2. Ramp tests
The priority case rods were ramped in tests FGR1 (Fig. 6-2) and FGR2 (Fig. 6-3). Considering the burn-up and LHR values, rods 32 and 48 are true sibling rods, whereas rods 50 and 52 are similar.

MTA KFKI AEKI FUMEX-III final report
File: final-report_Kulacsy.doc 25/53 AEKI FL
0
5
10
15
20
25
30
35
0 100 200 300 400 500 600 700 800 900
time (h)
rod
aver
age
LHR
(kW
/m)
0
5
10
15
20
25
30
35
mea
sure
d ro
d in
tern
al
pres
sure
(MPa
)
rod 41 LHR (BU=48.9 MWd/kgU) rod 32 LHR (BU=60.2 MWd/kgU)rod 48 LHR (BU=60.5 MWd/kgU) rod 41 Prod 48 P
Figure 6-2: Linear heat rates and measured pressures for rods in test FGR1
0
5
10
15
20
25
30
35
40
45
0 50 100 150 200 250 300time (h)
rod
aver
age
LHR
(kW
/m)
0
400
800
1200
1600
2000
2400
2800
3200
3600
mea
sure
d fu
el c
entr
elin
e te
mpe
ratu
re
(°C
)
rod 51 LHR (BU=49.5 MWd/kgU) rod 50 LHR (BU=58.4 MWd/kgU)rod 52 LHR (BU=58.0 MWd/kgU) rod 51 Tcrod 50 Tc Vitanza threshold
Figure 6-3: Linear heat rates and measured fuel centreline temperatures for rods in test FGR2
The pressure sensor of rod 48 and the fuel centreline thermocouple of both rods 50 and 51 certainly failed during the tests. The reliability of the previous data is unknown.

MTA KFKI AEKI FUMEX-III final report
File: final-report_Kulacsy.doc 26/53 AEKI FL
6.2. FUROM input
6.2.1. Base irradiation
The base irradiation histories were given for the full-length mother rods in 21 axial sections and for their segments to be used for the ramp tests in 11 axial sections. The base irradiation was calculated for the mother rods, the FGR and cladding diameter of the segments were recorded and the plenum of the segments was adjusted in such a way that approximately the same FGR and cladding diameter were obtained when simulating only the segments.
As the rod burn-up values did not match those given in the IFPE database and burn-up is essential for obtaining correct FGR results, the rod technological data and the LHR values were altered within their fabrication ranges and uncertainties, respectively, in such a way that the correct burn-up values be calculated by the code. The base irradiation input obtained for only the segments can be found in Appendix D, Tables D-1 and D-2.
6.2.2. Ramp tests
Tables D-1 and D-2 also contain the new parameters of the segments after re-instrumentation. The original fission gas content of the free volume is released in the models, like in reality.
Since the results of the simulation show too little fission gas release, the uncertainties of the LHR measurements during the ramp tests (max. +8%) and of the cladding temperature (max. +6 °C) were added to the data. The results presented below have been obtained using these maximum values.
6.3. Observations concerning the data Rod average burn-up values given in the dataset are not consistent with the maximum
burn-up values derived from the given LHR profiles. In addition, the burn-up of the segments is consistently taken to be equal to the maxima of the burn-up of the mother rods, whereas the segments at best include the maximum burn-up section of the mother rods, but also other sections with lower burn-up.
The in-pile measurements contradict to the given histories in several respects. The steps taken to correct them are presented in Appendix D2, the corrected in-pile data have been submitted for use in the IFPE database.
6.4. Results of the calculations
6.4.1. Base irradiation
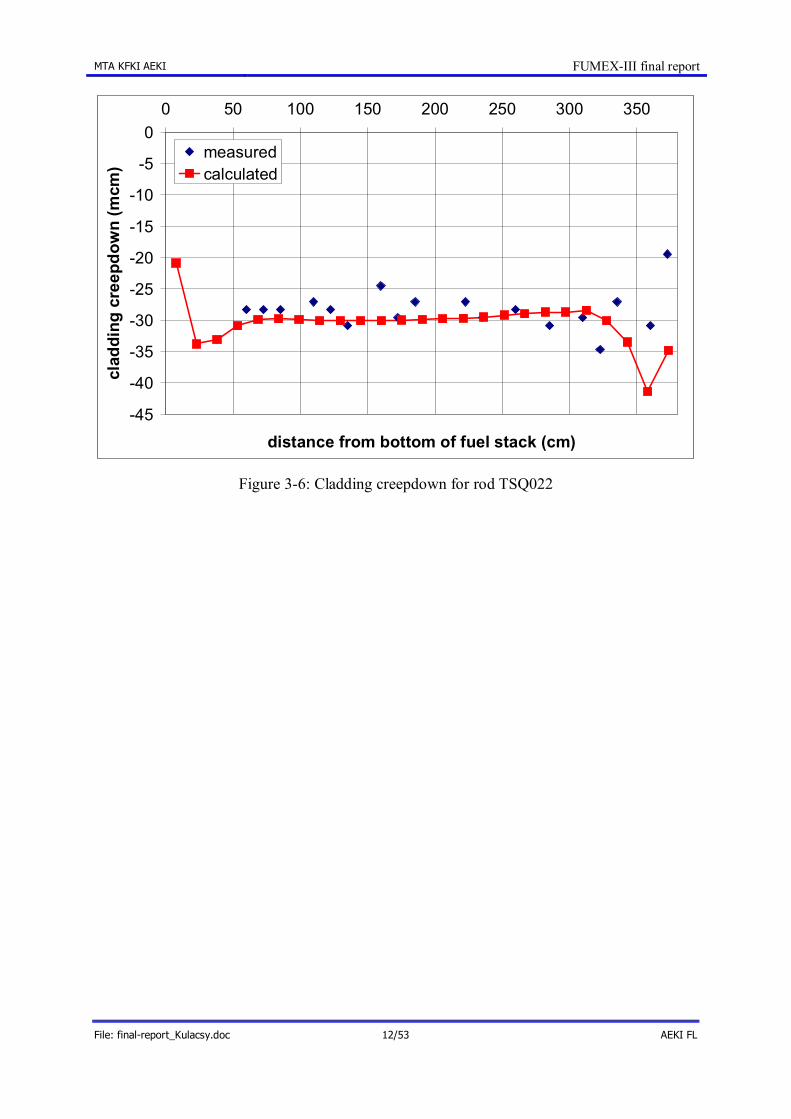
The data measured after base irradiation were only given for the assemblies, not for the individual rods. Comparison of the results using nominal input and values corrected to obtain the right burn-up is presented in Tables 6-1 and 6-2.
MTA KFKI AEKI FUMEX-III final report
File: final-report_Kulacsy.doc 27/53 AEKI FL
Table 6-1: Measured and calculated values (using nominal input and input corrected for burn-up) for the mother rods at the end of base irradiation, assembly 198 (numbers of the segments
in brackets)
assembly 198 rod 20 (→51) calc.
rod 76 (→33) calc.
rod 99 (→41) calc.
quantity meas.
nom. corr. nom. corr. nom. corr. rim width [μm] 100 45 54 42 62 38 52 swelling [%] 2.9 3.2 3.2 3.2 3.6 3.1 3.2 FGR [%] 0.5–1 0.8 1.1 0.7 1.3 0.7 1.00 rod pressure [MPa] 1.0 0.9 1.0 0.9 1.0 0.9 1.0 gap [μm] 4–17 0 0 0 0 0 0 cladding diameter decrease, mid rod [μm] 55–65 88 122 90 112 90 124
oxide [μm] ≤ 7 4.2 4.2 4.2 4.2 4.2 4.2
Table 6-2: Measured and calculated values (using nominal input and input corrected for burn-up) for the mother rods at the end of base irradiation, assembly 222 (numbers of the segments
in brackets)
assembly 222 rod 2 (→48) calc.
rod 3 (→38) calc.
rod 5 (→37) calc.
quantity meas.
nom. corr. nom. corr. nom. corr. rim width [μm] 120 93 107 90 107 89 106 swelling [%] 3.8 4.0 4.1 3.9 4.1 3.9 4.1 FGR [%] 3 2.2 3.0 2.1 3.0 2.1 2.9 rod pressure [MPa] 1.1 1.1 1.3 1.1 1.3 1.1 1.3 gap [μm] 0–7 0 0 0 0 0 0 cladding diameter decrease, mid rod [μm] 55–65 64 90 66 90 66 92
oxide [μm] ≤ 7 4.5 4.5 4.5 4.5 4.5 4.5
The FGR values in Table 6-2 show how important it is to make the correction for burn-up. However, even with the corrected input, the rim width is slightly underestimated, especially for assembly 198, which leads to better heat conductivity, therefore lower temperatures and FGR in the simulations. Nevertheless, it has to be noted that it is not straightforward to tell in the measurements what is part of the high-burnup structure and what is not.
Pellet swelling and cladding creepdown are a little too large, which lead to early closure of the gap, as seen in the results. This is probably what causes the slightly higher pressures in the burnup-corrected calculations.
Fission gas release and oxidation are very well reproduced by the simulation.
6.4.2. Ramp tests
The calculations are plotted together with the measurements with a corrected time scale and time step averaging (see Section 6.3). First the results of the test FGR2 are presented, as they give part of the explanation for the results of the FGR1 test.

MTA KFKI AEKI FUMEX-III final report
File: final-report_Kulacsy.doc 28/53 AEKI FL
Test FGR2 Fig. 6-4 shows that the fuel centreline temperature of rod 51 is correctly modelled if the
burn-up is correct (curve ‘opt. BU’). If the uncertainties of the LHR measurements during the ramp test (max. +8%) and of the cladding temperature (max. +6 °C) are added to the data, the calculated temperature becomes too high (curve ‘max T’).
Fig. 6-5 shows the fuel centreline temperature of rod 50. The calculated temperatures are far below the measured ones even taking advantage of the uncertainties mentioned for rod 51.
PIE FGR measurements are only available for rod 52, which is similar in all respects to rod 50. The results are included in Table 6-3.
Table 6-3: PIE results for rod 52 (similar to rod 50)
rod ID measured FGR (%)
calculated FGR (%)
52 48.8 6.9
The differences in porosity after base irradiation cannot account for the difference in FGR.
0
200
400
600
800
1000
1200
1400
1600
0 20 40 60 80 100 120 140 160 180 200time (h)
fuel
cen
trel
ine
tem
pera
ture
(°C
)
measuredcalculated (opt. BU)calculated (max T)
Figure 6-4: Measured and calculated fuel centreline temperatures for rod 51 (BU=49.5 MWd/kgU) in test FGR2

MTA KFKI AEKI FUMEX-III final report
File: final-report_Kulacsy.doc 29/53 AEKI FL
0
200
400
600
800
1000
1200
1400
1600
0 10 20 30 40 50 60 70 80 90time (h)
fuel
cen
trel
ine
tem
pera
ture
(°C
)measuredcalculated
Figure 6-5: Measured and calculated fuel centreline temperatures for rod 50 (BU=58.4 MWd/kgU) in test FGR2
Test FGR1 Fig. 6-6 shows the internal pressure of rod 41. The calculated pressures are far below
the measured ones even taking advantage of the uncertainties mentioned for rod 51. This is so although rod 41 is among the lower burn-up ones irradiated in assembly 198, for which the central temperature calculations should be correct.

MTA KFKI AEKI FUMEX-III final report
File: final-report_Kulacsy.doc 30/53 AEKI FL
0
5
10
15
20
0 100 200 300 400 500 600 700 800 900time (h)
rod
pres
sure
(MPa
)
0
10
20
30
40
rod
aver
age
LHR
(kW
/m)
measured pcalculated pLHR
Figure 6-6: Measured and calculated fuel rod pressures for rod 41 (BU=48.9 MWd/kgU) in test FGR1
The calculations for rod 48 are even further below the measurements (Fig. 6-7): the calculated pressure hardly increases during the test.
0
5
10
15
20
0 100 200 300 400 500 600time (h)
rod
pres
sure
(MPa
)
0
10
20
30
40
rod
aver
age
LHR
(kW
/m)
measured pcalculated pLHR
Figure 6-7: Measured and calculated fuel rod pressures for rod 48 (BU=60.5 MWd/kgU) in test FGR1

MTA KFKI AEKI FUMEX-III final report
File: final-report_Kulacsy.doc 31/53 AEKI FL
The PIE results are summarised in Table 6-4. The calculated FGR is low for rod 41 and very low for rod 48. Rim porosity is well calculated for the lower burn-up rod but is a factor of 2 low for the higher burn-up rod. However, the correction of the calculated porosity does not lead to significantly better FGR predictions.
Table 6-4: PIE results for rods 41 and 48
rod ID measured FGR (%)
calculated FGR (%)
measured rim porosity (%)
calculated rim porosity (%)
41 47.5 32.6 7.50.8 10.0 48 50.0 5.3 152.0 8.2

MTA KFKI AEKI FUMEX-III final report
File: final-report_Kulacsy.doc 32/53 AEKI FL
7. The IFA-519.9 case The aim of the experiment was to see the effect of grain size, temperature and power
cycling on fission gas release. For this purpose, three rods with different grain sizes and gap sizes were manufactured and irradiated in the Halden HBWR in similar conditions. First, the rods were base irradiated in the IFA-429 rig at linear heat generation rates below 22 kW/m, up to a burn-up of 29-33 MWd/kgU. They were then re-instrumented with pressure transducers and further irradiated in the IFA-519.9 rig up to a burn-up of 100 MWd/kgU. The IFA-519.9 experiment consisted of the following steps:
pre-conditioning at approx. 40 kW/m for 2 months, two power cycling tests at LHR’s between 25 and 40 kW/m, with periods of 12 or
24 hours, further power cycling tests at lower LHR’s and periods of 24 hours up to a burn-up
of approx. 64 MWd/kgU, irradiation at approx. 30 kW/m up to a burn-up of approx. 100 MWd/kgU. The instrument heads containing the pressure transducers were welded on top of the
original fuel rods and a built-in drill established the connection between the two volumes. Unfortunately the connection could not be established in one of the rods (rod DC), no in-pile measurement is therefore available for this rod. Furthermore, the other two rods (DH and DK) leaked during the test IFA-519.9. It was assumed that only the helium fill gas leaked, the fission gases did not [9].
7.1. Irradiation histories
0
5
10
15
20
25
0 200 400 600 800 1000 1200 1400 1600 1800 2000time (d)
LHR
(kW
/m)
DCDHDK
Figure 7-1: Base irradiation of the rods in the IFA-429 rig

MTA KFKI AEKI FUMEX-III final report
File: final-report_Kulacsy.doc 33/53 AEKI FL
The base irradiation is presented in Fig. 7-1 for all 3 rods. Rod DH was inserted into the core later than rods DC and DK.
0
5
10
15
20
25
30
35
40
45
50
0 200 400 600 800 1000 1200 1400 1600 1800 2000time (d)
LHR
(kW
/m)
DCDHDK
Figure 7-2: Irradiation of the rods in the IFA-519.9 test
The calculated fuel centreline temperatures are presented in Figs 7-3 and 7-4.
0
200
400
600
800
1000
1200
1400
0 200 400 600 800 1000 1200 1400 1600 1800 2000time (d)
fuel
cen
trel
ine
tem
pera
ture
(°C
)
DCDHDKT Vit
Figure 7-3: Calculated fuel centreline temperature of the rods in the IFA-429 rig

MTA KFKI AEKI FUMEX-III final report
File: final-report_Kulacsy.doc 34/53 AEKI FL
During base irradiation the rods were operated well below the Vitanza threshold, while during the IFA-519.9 they were operated mostly above it.
0
500
1000
1500
2000
2500
1500 2000 2500 3000 3500 4000time (d)
fuel
cen
trel
ine
tem
pera
ture
(°C
)
DCDHDKT Vit
Figure 7-4: Calculated fuel centreline temperature of the rods in the IFA-519.9 test (time measured from the beginning of irradiation)
7.2. FUROM input The technological input data used for the simulations are given in Appendix E. The
irradiation histories were applied in 1 axial section. Missing data and suggestions on how to obtain them are summarised in Section 7.3.
7.3. Observations concerning the data The dataset does not include pellet roughness, cladding roughness and re-sinter density.
Re-sinter density was set in such a way that the PIE cladding outer diameters be calculated correctly.
The provided burn-up increased even in periods when nuclear heating was zero, i.e. when the heat was only generated by decay. The original TFDB files had therefore to be used, ignoring all time steps with zero nuclear heating.
In the original TFDB files the outages were not always well recorded (LHR=0 time step at the beginning and at the end of the outage not always present).

MTA KFKI AEKI FUMEX-III final report
File: final-report_Kulacsy.doc 35/53 AEKI FL
As the code FUROM cannot handle histories longer than 5000 time steps, the TFDB’s had to be condensed allowing a difference of as much as 2 kW/m between the original and the condensed LHR.
7.4. Results of the calculations Figs. 7-5 and 7-6 show the calculated and measured rod pressures (and as a reference,
the fuel centreline temperatures). The PIE value is also included at the end of the graphs. The calculations agree well with the measurements, which is meaningless due to the helium loss. The PIE pressures are consistent with the in-pile measurements.
Figure 7-5: Calculated fuel centreline temperature, and calculated and measured pressure of rod DH during the test IFA-519.9

MTA KFKI AEKI FUMEX-III final report
File: final-report_Kulacsy.doc 36/53 AEKI FL
Figure 7-6: Calculated fuel centreline temperature, and calculated and measured pressure of rod DK during the test IFA-519.9
In order to get a more reliable comparison, the PIE fission gas release results had to be used (Table 7-1).
Table 7-1: Measured and calculated FGR
measured FGR (cm3 STP)
calculated FGR (cm3 STP)
calculated/measured
DC 190 164 0.86 DH 262 157 0.60 DK 237 173 0.73
The measured FGR is much higher than the calculated one. This may be due to a very high athermal (rim) release: the rim is 800-900 m thick, which cannot be reproduced by either model built into the code FUROM (both give values of about 200-300 m). The unusually thick rim layer may be caused by the difference in the neutron spectrum of the Halden HBWR from ordinary VVER or PWR spectra. The theory of a high athermal (rim) release is also supported by the measured high Xe/Kr ratio.

MTA KFKI AEKI FUMEX-III final report
File: final-report_Kulacsy.doc 37/53 AEKI FL
8. Conclusions regarding the code FUROM The models affecting the quantities measured in the tests selected by AEKI are fuel pellet swelling, thermal FGR, athermal (rim) FGR.
A general observation is that pellet swelling tends to be overestimated by the code in the above cases. As an empirical burn-up dependence is implemented, the difference between solid and gaseous fission product swelling cannot be taken into account. Relatively low-power histories are characterised by slow gas diffusion and fuel porosity lower than expected on the basis of the burn-up, this is probably the cause of the overestimation.
Fission gas release is usually well modelled for normal operation conditions. This applies both to thermal and athermal release. However, the FGR of the annular-pellet rod in the US PWR 16x16 dataset was overestimated (this was general among the participants). The FGR of other annular-pellet rods (SPC GINNA and Kola3 datasets) was well simulated.
Thermal FGR in normal operation conditions agrees well with the measurements and the Vitanza threshold.
Fuel creep is not modelled in version 2.0 of the code FUROM, the closure of the central hole in the Kola3-MIR experiments could therefore not be simulated, the results of that experiment cannot be evaluated.
Similarly, the results of the IFA-519.9 experiment cannot be evaluated not only because of the flaws of the measurements but also because the thickness of the rim layer (and consequently of the rim FGR) is probably specific of the Halden HBWR.
Overall the code reproduces well the thermo-mechanical behaviour of the fuel rods selected for the FUMEX-III programme. Suggested improvements were the implementation of fuel swelling related to fission gas diffusion and of fuel creep. The latter has recently been finished.

MTA KFKI AEKI FUMEX-III final report
File: final-report_Kulacsy.doc 38/53 AEKI FL
9. Conclusions of the FUMEX-III programme The FUMEX-III programme provided a platform for developers and users of licensing
and research codes to meet and share observations, issues, needs and solutions. It was a unique opportunity for AEKI to share information, know-how and experience with colleagues from many countries in an informal atmosphere.
FUMEX-III was the first FUMEX programme in which AEKI took part. The RCM’s were found to be the best platform for detailed, multi-lateral discussion on modelling issues, which is never possible at conferences. In fact, the RCM’s were the most useful platforms for such exchanges.
In addition to code validation against measurements, the inter-comparison of the simulations lead to the conclusion that a broad diversity of approaches could yield similar results, which is a kind of assurance that these results are reliable: this is crucial for nuclear safety. It is therefore important to continue developing and applying many independent codes and to have further opportunities to test these against experiments and each other. AEKI advocates that there be a following CRP like the FUMEX series.
In the FUMEX-III programme a large number of cases was offered, covering many fields of interest. This had the advantage of touching upon all relevant issues, together with the disadvantage that the presentations and discussions were somewhat cumbersome. In the hope to have a following CRP like FUMEX, AEKI’s suggestion is to have fewer, very well defined cases.
The FUMEX-III CRP was unusual in its large number of participants, which shows the importance of this activity. A programme arousing such interest can only be co-ordinated by an international body like e.g. the IAEA. Hopefully the IAEA will undertake the organisation of a forthcoming CRP on fuel behaviour modelling issues.

MTA KFKI AEKI FUMEX-III final report
File: final-report_Kulacsy.doc 39/53 AEKI FL
References [1] C. Vitanza, E. Kolstad and U. Graziani: „Fission gas release from UO2 pellet fuel at
high burnup”, Proceedings of American Nuclear Society, Topical Meeting on Light Water Reactor Fuel Performance, (May 1979), Portland, Oregon, USA
[2] US-PWR 16x16 LTA Extended Burnup Demonstration Program, Summary File, Revision 1, March 2005
[3] D.R. Packard: Preirradiation Characterisation of GINNA/ESEERCO Lead Fuel Assemblies Containing Barrier Cladding and Annular Pellets, 1986
[4] A.S. Giurgiuman, T.E. Wickersham: Annular-Pellet, Barrier-Clad Fuel R.E. GINNA Reactor Lead Fuel Assemblies Poolside Examination, 1994
[5] G.A Sofer, L.F.P. van Swam: Annular-Pellet Barrier-Clad Fuel Assemblies at the R.E. GINNA PWR: Hotcell Examinations, 1997
[6] IFPE\Kola3MIR\Evaluation_for_IFPE\readme: The tests of VVER-440 refabrication rods in reactor MIR (working materials), 2005.
[7] A. Smirnov, V. Smirnov, A. Petuhov, B. Kanashov, V. Kuzmin, A. Novoselov, Y. Bibilashvili, V. Tzibulya, E. Bek: The peculiarities of the VVER-440 fuel behaviour at higher burnups, Proceedings of the Second International Seminar on VVER Fuel Performance, Modelling and Experimental Support, Sandinski 1997, pp. 58-65
[8] M. Solonin et al.: VVER fuel performance and material development for extended burnup in Russia, Proceedings of the Second International Seminar on VVER Fuel Performance, Modelling and Experimental Support, Sandinski 1997, pp. 48-57
[9] J.A Turnbull: Concluding Report on Three PWR Rods Irradiated to 90 MWd/kgUO2 in IFA-519.9: Analysis of Measurements Obtained In-Pile and by PIE, HWR-668, 2001

MTA KFKI AEKI FUMEX-III final report
File: final-report_Kulacsy.doc 40/53 AEKI FL
Appendix

MTA KFKI AEKI FUMEX-III final report
File: final-report_Kulacsy.doc 41/53 AEKI FL
A. Input for the US PWR 16x16 case
Table A-1 shows the technological input data applied for the simulation of the two rods. Grey data were not given, data in italic had to be calculated, underlined data were individually measured during pre-characterisation.
Table A-1: Technological input data of rods TSQ002 and TSQ022
rod n° TSQ002 TSQ022 pellet inner radius (mm)
0 1.1684
pellet outer radius (mm)
4.1275 4.1275
pellet roughness (m)
2.0000 2.0000
cladding inner radius (mm)
4.2164 4.2164
cladding outer radius (mm)
4.8495 4.8480
cladding roughness (m)
1.0000 1.0000
fuel stack length (m)
3.81 3.81
enrichment ()
0.0348 0.0348
relative density ()
0.95 0.95
re-sinter rel. density ()
0.9633 0.9633
grain size (m)
10 10
pressure of He (MPa)
2.62 2.62
plenum volume (cm3)
16.54 12.00
hydraulic diameter (mm)
10 10
coolant velocity (m/s)
5 5
coolant pressure (MPa)
15.5 15.5

MTA KFKI AEKI FUMEX-III final report
File: final-report_Kulacsy.doc 42/53 AEKI FL
B. Input for the SPC RE GINNA case Table B-1 shows the technological input data applied for the simulation of the four
rodlets. Grey data were not given, data in italic had to be calculated, underlined data were individually measured during pre-characterisation.
Table B-1: Technological input data of rodlets 1 through 4
rod n° 1 2 3 4 5 6 8 9 pellet inner radius (mm) 0 0 1.398 1.398 1.398 1.398 1.398 1.398
pellet outer radius (mm) 4.448 4.448 4.450 4.450 4.450 4.450 4.439 4.463
pellet roughness (m) 2 2 2 2 2 2 2 2
cladding inner radius (mm) 4.549 4.552 4.550 4.553 4.545 4.547 4.547 4.547
cladding outer radius (mm) 5.293 5.293 5.296 5.295 5.300 5.297 5.293 5.295
cladding roughness (m) 0.8 0.8 0.8 0.8 0.8 0.8 0.8 0.8
fuel stack length (m) 0.5420 0.5427 0.5420 0.5433 0.5384 0.5460 0.5461 0.5420
enrichment () 0.0335 0.0335 0.0371 0.0371 0.0371 0.0371 0.0371 0.0371
relative density () 0.9431 0.9431 0.9450 0.9450 0.9450 0.9450 0.9457 0.9458
re-sinter rel. density () 0.9500 0.9500 0.9518 0.9518 0.9518 0.9518 0.9525 0.9526
grain size (m) 22 22 20 20 20 20 20 20
pressure of He (MPa) 2.1 2.1 2.1 2.1 2.1 2.1 2.1 2.1
plenum volume (cm3) 3.5 3.4 3.1 3.0 3.5 2.9 2.9 3.3
coolant pressure (MPa) 15.51 15.51 15.51 15.51 15.51 15.51 15.51 15.51

MTA KFKI AEKI FUMEX-III final report
File: final-report_Kulacsy.doc 43/53 AEKI FL
C. Input for the AREVA idealised case n° 2 Table A-1 shows the technological input data applied for the simulation of the rod. Grey
data were not given, a usual value was used.
Table C-1: Technological input data of the AREVA idealised rod
pellet inner radius (mm) 0
pellet outer radius (mm) 4.0425
pellet roughness (m) 3
cladding inner radius (mm) 4.125
cladding outer radius (mm) 4.75
cladding roughness (m) 1
fuel stack length (m) 3.65
enrichment () 0.045
relative density () 0.95
re-sinter rel. density () 0.96
grain size (m) 16
pressure of He (MPa) 1.6
plenum volume (cm3) 8.4
hydraulic diameter (mm) 11.77
coolant pressure (MPa) 15.5

MTA KFKI AEKI FUMEX-III final report
File: final-report_Kulacsy.doc 44/53 AEKI FL
D1. Input for the Kola3-MIR case
Table D-1: Input data for the test FGR1 name of test FGR1 mother rod segment 99/198 41 6/222 32 2/222 48 pellet inner radius [mm] corrected for burn-up 0.825
pellet outer radius [mm] corrected for burn-up
3.780 3.765
pellet roughness [μm] 2.5 cladding inner radius [mm] 3.8775 cladding outer radius [mm] 4.56 cladding roughness [μm] 1.5 pellet stack length [cm] 242 75 242 95 242 75 enrichment [%] 4.4 initial relative density [-] corrected for burn-up
0.966 0.948
0.966 0.958 0,966
re-sinter relative density [-] corrected for burn-up
0.971 0.955
0.971 0.963 0,971
grain size [μm] 6.6 pressure of He [MPa] 0.6 plenum volume [cm3] corrected for burn-up 6.1 2.25
2.45 6,1 3,00 3,46 6,1 2,77
2,95 start of rim effect [MWd/kgU] 55 55 55 factor for LHR [-] corrected for burn-up
1.000 1.032
1.000 1.040
1,000 1,040
parameters after re-instrumentation plenum volume [cm3] 3.98 3,68 4,21 pressure of He [MPa] 1.6 1,6 1,6
MTA KFKI AEKI FUMEX-III final report
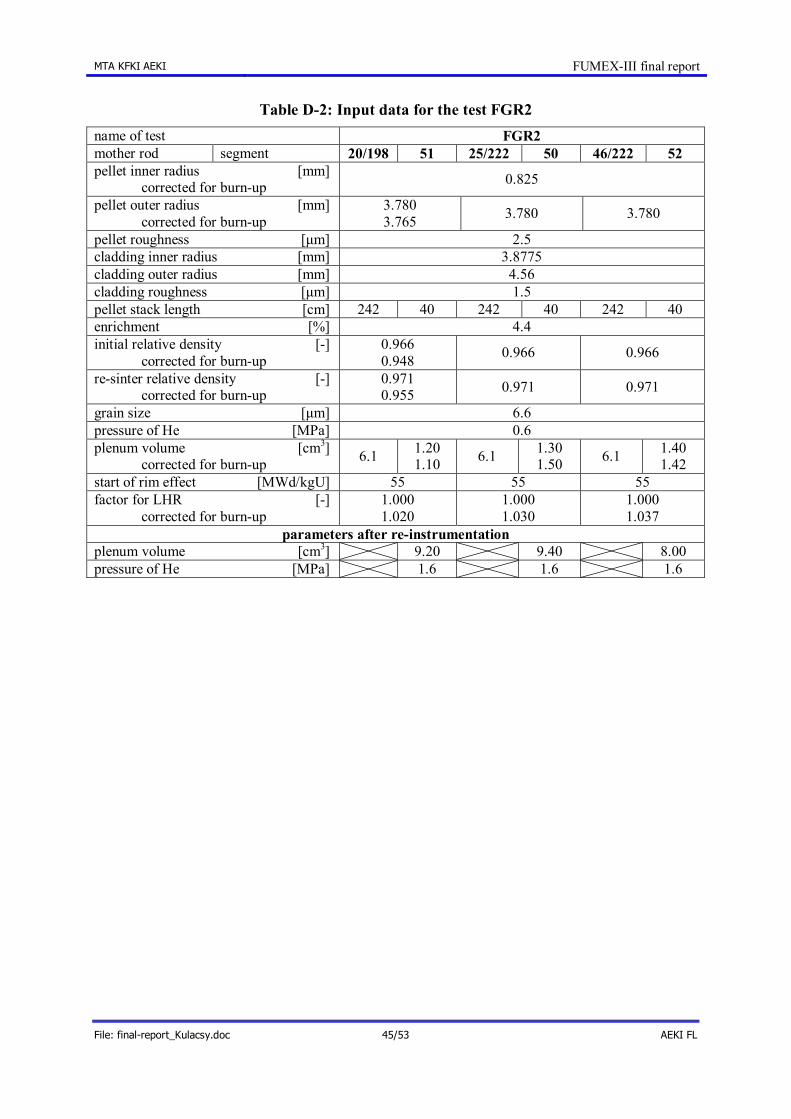
File: final-report_Kulacsy.doc 45/53 AEKI FL
Table D-2: Input data for the test FGR2 name of test FGR2 mother rod segment 20/198 51 25/222 50 46/222 52 pellet inner radius [mm] corrected for burn-up 0.825
pellet outer radius [mm] corrected for burn-up
3.780 3.765 3.780 3.780
pellet roughness [μm] 2.5 cladding inner radius [mm] 3.8775 cladding outer radius [mm] 4.56 cladding roughness [μm] 1.5 pellet stack length [cm] 242 40 242 40 242 40 enrichment [%] 4.4 initial relative density [-] corrected for burn-up
0.966 0.948 0.966 0.966
re-sinter relative density [-] corrected for burn-up
0.971 0.955 0.971 0.971
grain size [μm] 6.6 pressure of He [MPa] 0.6 plenum volume [cm3] corrected for burn-up 6.1 1.20
1.10 6.1 1.30 1.50 6.1 1.40
1.42 start of rim effect [MWd/kgU] 55 55 55 factor for LHR [-] corrected for burn-up
1.000 1.020
1.000 1.030
1.000 1.037
parameters after re-instrumentation plenum volume [cm3] 9.20 9.40 8.00 pressure of He [MPa] 1.6 1.6 1.6

MTA KFKI AEKI FUMEX-III final report
File: final-report_Kulacsy.doc 46/53 AEKI FL
D2. Correction of the in-pile data for the Kola3-MIR test
FGR2 rod 50 Non-existent zeroth time step in the power histories Base irradiation of the short section: FGR2_50_B
o Final time: 1565.2750 days, clad temperature: 153 – 154 ºC. Ramp history of the short section: FGR2_50_R
o Starting time: 1566.1380 days, clad temperature: 107 – 108 ºC. o Time difference: 20.7 hours.
In-pile data: RFR_50_tc.txt and fgr2_PR_cool.txt o Starting time: 0 hours, coolant pressure 0 MPa, clad temperature 20 ºC. Next
time step: 20.7 hours. The „0 hours” time step is absent from both the base and the ramp histories!
An extra time step has to be inserted between the base irradiation and the ramp history, where the linear heat rate (LHR), the flux and the coolant pressure are zero and the entire system is at 20 ºC.
Interpretation of a ‘time step’ The thermocouple is located in axial section 9, close to axial section 8. Comparing the
axial LHR’s provided in the file FGR_51_R with those provided in RFR_51_tc.txt reveals that different interpretations of the notion ‘time step’ were applied. The following graph presents the LHR’s of axial sections 8 and 9, and the LHR provided specifically at the position of the thermocouple: the previous is much more even.
Rod 50, original LHR
0
5
10
15
20
25
30
35
0 50 100 150 200 250 300
time [h]
LHR
[kW
/m]
axial #8axial #9thermocouple position
Figure D-1: LHR at thermocouple position (in-pile data) and at neighbouring sections (history)
MTA KFKI AEKI FUMEX-III final report
File: final-report_Kulacsy.doc 47/53 AEKI FL
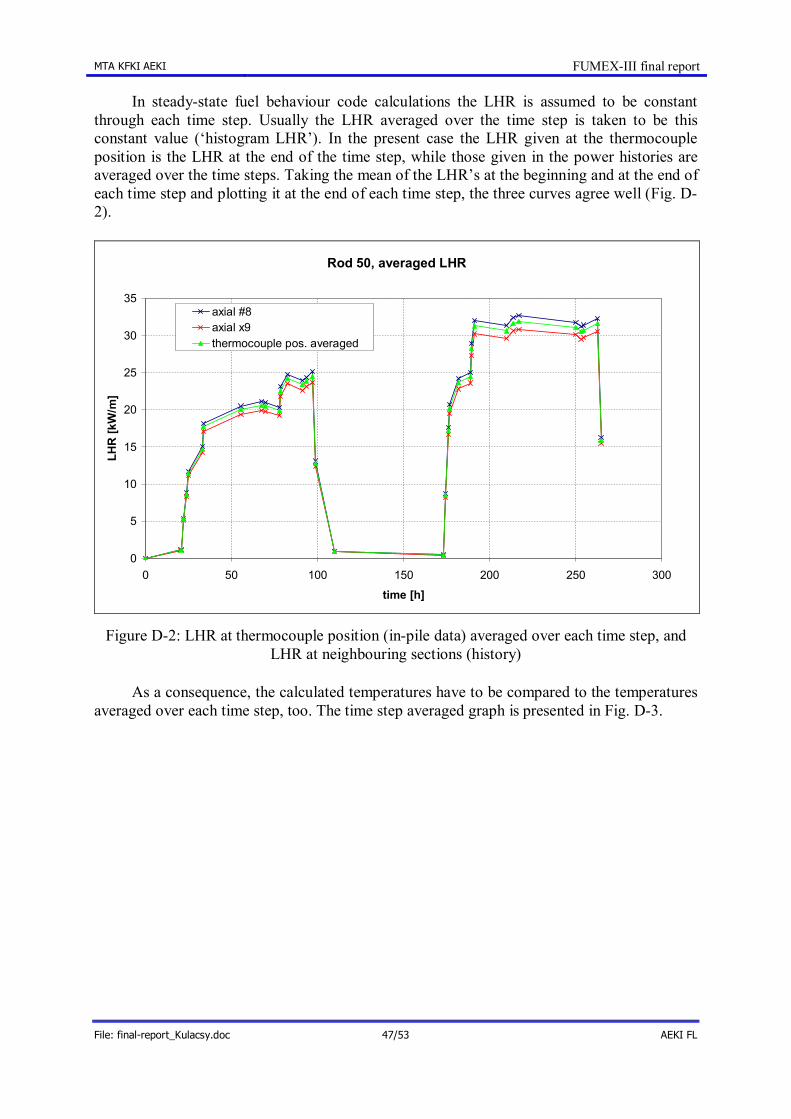
In steady-state fuel behaviour code calculations the LHR is assumed to be constant through each time step. Usually the LHR averaged over the time step is taken to be this constant value (‘histogram LHR’). In the present case the LHR given at the thermocouple position is the LHR at the end of the time step, while those given in the power histories are averaged over the time steps. Taking the mean of the LHR’s at the beginning and at the end of each time step and plotting it at the end of each time step, the three curves agree well (Fig. D-2).
Rod 50, averaged LHR
0
5
10
15
20
25
30
35
0 50 100 150 200 250 300
time [h]
LHR
[kW
/m]
axial #8axial x9thermocouple pos. averaged
Figure D-2: LHR at thermocouple position (in-pile data) averaged over each time step, and LHR at neighbouring sections (history)
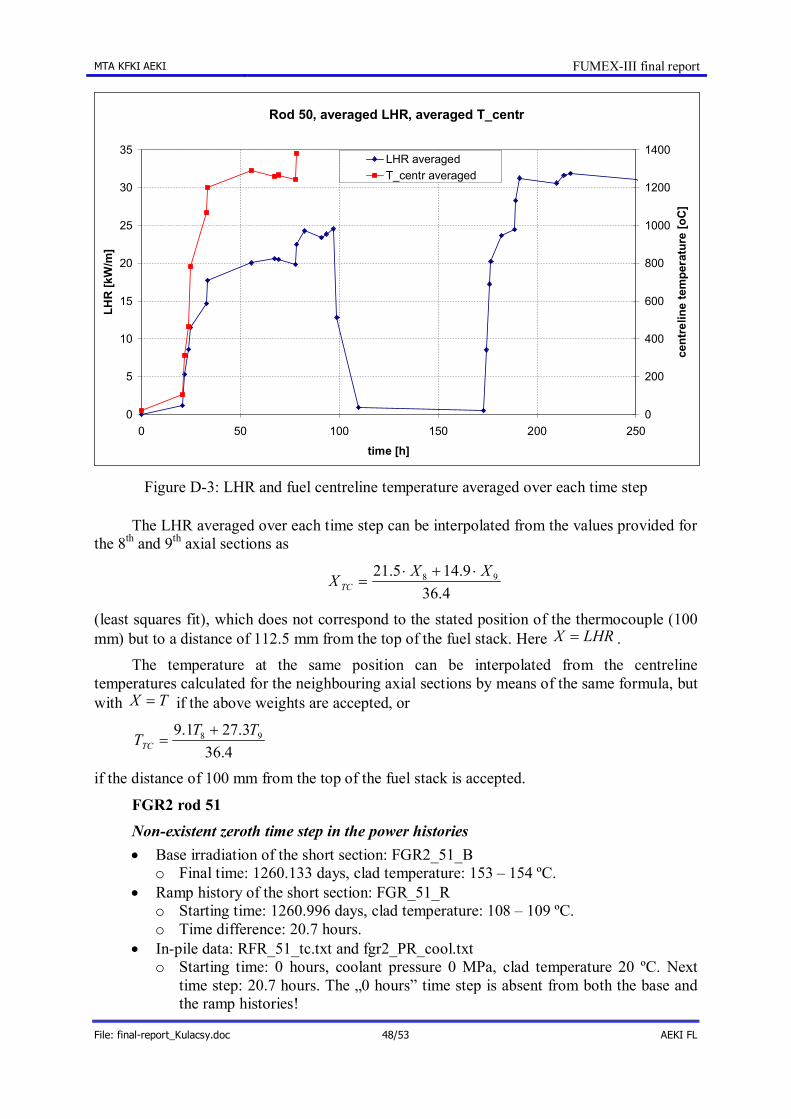
As a consequence, the calculated temperatures have to be compared to the temperatures averaged over each time step, too. The time step averaged graph is presented in Fig. D-3.
MTA KFKI AEKI FUMEX-III final report
File: final-report_Kulacsy.doc 48/53 AEKI FL
Rod 50, averaged LHR, averaged T_centr
0
5
10
15
20
25
30
35
0 50 100 150 200 250
time [h]
LHR
[kW
/m]
0
200
400
600
800
1000
1200
1400
cent
relin
e te
mpe
ratu
re [o
C]
LHR averagedT_centr averaged
Figure D-3: LHR and fuel centreline temperature averaged over each time step
The LHR averaged over each time step can be interpolated from the values provided for the 8th and 9th axial sections as
4.369.145.21 98 XXX TC
(least squares fit), which does not correspond to the stated position of the thermocouple (100 mm) but to a distance of 112.5 mm from the top of the fuel stack. Here LHRX .
The temperature at the same position can be interpolated from the centreline temperatures calculated for the neighbouring axial sections by means of the same formula, but with TX if the above weights are accepted, or
4.363.271.9 98 TTTTC
if the distance of 100 mm from the top of the fuel stack is accepted.
FGR2 rod 51 Non-existent zeroth time step in the power histories Base irradiation of the short section: FGR2_51_B
o Final time: 1260.133 days, clad temperature: 153 – 154 ºC. Ramp history of the short section: FGR_51_R
o Starting time: 1260.996 days, clad temperature: 108 – 109 ºC. o Time difference: 20.7 hours.
In-pile data: RFR_51_tc.txt and fgr2_PR_cool.txt o Starting time: 0 hours, coolant pressure 0 MPa, clad temperature 20 ºC. Next
time step: 20.7 hours. The „0 hours” time step is absent from both the base and the ramp histories!

MTA KFKI AEKI FUMEX-III final report
File: final-report_Kulacsy.doc 49/53 AEKI FL
An extra time step has to be inserted between the base irradiation and the ramp history, where the linear heat rate (LHR), the flux and the coolant pressure are zero and the entire system is at 20 ºC.
Time shift in the data Fig. D-4 shows the LHR at the position of the thermocouple and the centreline
temperature vs. time as provided in the file RFR_51_tc.txt. The temperature does not move together with the LHR, sometimes it rises when the LHR decreases and vice versa.
Rod 51, original T_centr
0
5
10
15
20
25
30
35
40
45
0 50 100 150 200 250
time [h]
LHR
[kW
/m]
0
200
400
600
800
1000
1200
1400
1600
1800
cent
relin
e te
mpe
ratu
re [o
C]
LHRT_centr
Figure D-4: LHR and fuel centreline temperature asynchronous
The given temperature is one time step ahead of the power. It may be assumed that the first measurement was made at 22 hours and the initial temperature was 20 ºC, the 20.7 hours’ time step can therefore be omitted or the temperature can be interpolated. Fig. D-5 presents the corrected situation (temperature shifted by one time step, the 20.7 hours’ time step omitted): the two curves are synchronous.

MTA KFKI AEKI FUMEX-III final report
File: final-report_Kulacsy.doc 50/53 AEKI FL
Rod 51, shifted T_centr, 2nd time step omitted
0
5
10
15
20
25
30
35
40
45
0 50 100 150 200 250
time [h]
LHR
[kW
/m]
0
200
400
600
800
1000
1200
1400
1600
1800
cent
relin
e te
mpe
ratu
re [o
C]
LHRT_centr
Figure D-5: LHR and shifted fuel centreline temperature
Interpretation of a ‘time step’ The same applies as to rod 50 in Fig. D-1 (Fig. D-6).
Rod 51, original LHR
0
5
10
15
20
25
30
35
40
45
0 50 100 150 200 250 300
time [h]
LHR
[kW
/m]
axial #8axial #9thermocouple position
Figure D-6: LHR at thermocouple position (in-pile data) and at neighbouring sections (history)

MTA KFKI AEKI FUMEX-III final report
File: final-report_Kulacsy.doc 51/53 AEKI FL
Averaging over each time step gives the result in Fig. D-7.
Rod 51, averaged LHR
0
5
10
15
20
25
30
35
40
45
0 50 100 150 200 250 300
time [h]
LHR
[kW
/m]
axial #8axial x9thermocouple pos. averaged
Figure D-7: LHR at thermocouple position (in-pile data) averaged over each time step, and LHR at neighbouring sections (history)
As a consequence, the calculated temperatures have to be compared to the temperatures averaged over each time step. The shifted and time step averaged graph is presented in Fig. D-8.

MTA KFKI AEKI FUMEX-III final report
File: final-report_Kulacsy.doc 52/53 AEKI FL
Rod 51, averaged LHR, shifted and averaged T_centr (2nd step omitted)
0
5
10
15
20
25
30
35
40
45
0 50 100 150 200 250
time [h]
LHR
[kW
/m]
0
200
400
600
800
1000
1200
1400
1600
1800
cent
relin
e te
mpe
ratu
re [o
C]
LHR averagedT_centr shifted+averaged
Figure D-3: LHR and fuel centreline temperature averaged over each time step, temperature shifted by 1 time step
The LHR averaged over each time step can be interpolated from the values provided for the 8th and 9th axial sections as
4.36174.19 98 XXX TC
(least squares fit), which does not correspond to the stated position of the thermocouple (100 mm) but to a distance of 107.9 mm from the top of the fuel stack. Here LHRX .
The temperature at the same position can be interpolated from the centreline temperatures calculated for the neighbouring axial sections by means of the same formula, but with TX if the above weights are accepted, otherwise
4.363.271.9 98 TTTTC
if the distance of 100 mm from the top of the fuel stack is accepted.
The corrected in-pile data have been submitted for use in the IFPE database.

MTA KFKI AEKI FUMEX-III final report
File: final-report_Kulacsy.doc 53/53 AEKI FL
E. Input for the IFA-519.9 case Table E-1 shows the technological input data applied for the simulation of the three
rods. Grey data were not given, data in italic had to be calculated.
Table E-1: Technological input data of the rods
rod n° DC DH DK pellet inner radius (mm) 0 0 0
pellet outer radius (mm) 4.648 4.648 4.572
pellet roughness (m) 3 3 3
cladding inner radius (mm) 4.75 4.75 4.75
cladding outer radius (mm) 5.365 5.365 5.360
cladding roughness (m) 1 1 1
fuel stack length (m) 0.244 0.244 0.245
enrichment () 0.13 0.13 0.13
relative density () 0.949 0.947 0.947
re-sinter rel. density () 0.959 0.964 0.957
grain size (m) 17 5.9 17
pressure of He (MPa) 2.59 2.59 2.59
plenum volume (cm3) 1.965 1.865 1.920
coolant pressure (MPa) 3.4 3.4 3.4
volume of instr. head (cm3) – 6.6 6.6
He pressure in instr. head (MPa) – 3 2.36
fast neutron conversion factor (n/m2s)/(kW/m) 1.6·1014 1.6·1014 1.6·1014

![[Alam aeki] Guida illustrata alla modellazione di un dominio con Event Sourcing & Event Storming](https://img.dokumen.tips/doc/110x75/545655bcb1af9f33608b4aa7/alam-aeki-guida-illustrata-alla-modellazione-di-un-dominio-con-event-sourcing-event-storming.jpg)