Embed Size (px)
Citation preview

Final report for the Broadband Stakeholder Group
The costs of deploying fibre-based next-generation broadband infrastructure
Final report
8 September 2008
Ref: 12726-371

This report has been commissioned by the Broadband Stakeholder Group with support from the Department for Business Enterprise & Regulatory Reform.
The Broadband Stakeholder Group and Analysys Mason would like to thank those organisations and individuals that contributed to the development of this report.
Copyright © 2008. The information contained herein is the property of Analysys Mason Limited and is provided on condition that it is sourced to ‘Analysys Mason for BSG’ if it is reproduced for any purpose.
Analysys Mason Limited St Giles Court 24 Castle Street Cambridge CB3 0AJ Tel: 01223 460600 Fax: 01223 460866 [email protected] www.analysysmason.com
Analysys Mason for Broadband Stakeholder Group
Ref: 12726-371

Analysys Mason for Broadband Stakeholder Group
Ref: 12726-371
Foreword
Kip Meek
Chairman, Broadband Stakeholder Group
This is the third in a series of reports published this year by the Broadband Stakeholder Group on next-generation broadband access. It complements our earlier work on economic and social value and public-sector intervention models, and reflects our commitment to ensuring an informed and detailed public debate on next-generation broadband access in the UK. This research was part funded by the Department for Business Enterprise & Regulatory Reform and has been submitted as a contribution to the Caio Review on next-generation broadband. We would like to thank the Department for Business Enterprise & Regulatory Reform, Analysys Mason and all those who have given their time and input to this project.
The report provides a detailed analysis of the deployment costs involved in deploying fixed-line infrastructure to provide next-generation broadband services in the UK. It is based on realistic assumptions that are detailed, clear and transparent and has been modelled on geographical data specific to the UK. The research has been informed and validated by the key commercial players, including network operators, technology vendors, deployment specialists and other industry experts. We believe it is the most comprehensive published assessment of how much fibre deployment might cost in the UK.
Although it contains some discussion on operating costs, the report focuses primarily on the deployment costs involved in deploying fibre to the home (FTTH) and fibre to the cabinet (FTTC). The report does not speculate on revenue models as these will be dependent upon the commercial strategies of individual operators. It should be noted that although deployment costs are fundamental, they are not the only factors that will determine final commercial decisions around either the timing or location of investment or the choice of technology.
The model has been developed to a high level of detail and should provide a valuable resource for those concerned with these issues. However, a number of high-level observations can be drawn from the report regarding: the scale of the costs involved and the factors that drive those costs; the potential migration from FTTC to FTTH; and the potential extent of market driven deployment.

The costs of deploying fibre-based next-generation broadband infrastructure
Costs
In regard to costs, the first and most obvious observation is about their scale. Deploying fibre to the cabinet (the least expensive of the technology options) on a national basis would cost three or four times more than the telecoms sector has spent in deploying the current generation of broadband services.
A second observation is the scale of the cost differential between FTTC and FTTH. Although there are clear benefits for both operators and users in taking fibre to the home, the level of cost involved suggests that FTTC is likely to be the predominant technology deployed in most areas. This does not mean that FTTH should be ruled out, but it is likely that FTTH deployments will be more localised in new-build locations and other areas where it is possible to significantly reduce the civil infrastructure costs involved. The report suggests that these high civil costs could be significantly reduced by the re-use of existing telecommunications ducts; the sharing of alternative infrastructure owned by other utilities, such as water companies; and the use of overhead fibre distribution in some areas.
The third factor that comes out strongly from the report is that the fixed costs of deploying new infrastructure far outweigh the variable costs. This means that the cost per home connected is highly dependent on the level of take-up. This has significant implications both for the likely extent of infrastructure competition and the importance of demand stimulation initiatives, such as pre-registration schemes.
FTTC to FTTH
The second key question for the report is whether an initial deployment of FTTC would inhibit a subsequent upgrade to FTTH. From a pure cost perspective it is not clear that this would be a problem. About 50% of the initial FTTC investment could be re-used in an FTTH upgrade. However a migration to FTTH could become more problematic in a situation where multiple operators have invested in active equipment at the street cabinet. This issue is therefore pertinent to the debate about the regulatory framework and should be considered by Ofcom.
Coverage
On the issue of coverage, the report suggests that deployment costs will be relatively constant across higher density areas. This implies that, if a broadly applicable commercial case for deployment exists, the market should be able to deliver to approximately two thirds of the UK population. However, the costs of deploying in more sparsely populated areas will be significantly higher, making the prospect of commercial deployment to the last third of UK households much more difficult.
The coverage maps contained in the report highlight the need for creative thinking about how to make rural areas more attractive to investment. As our earlier research on public-sector intervention showed, there are many models for how this can be done that stop far short of large-scale subsidy, but do require the private sector to work closely with public bodies and local
Analysys Mason for Broadband Stakeholder Group
Ref: 12726-371

The costs of deploying fibre-based next-generation broadband infrastructure
communities. In particular, demand stimulation initiatives, localised to the level of individual streets or cabinets could prove highly effective in extending the reach of these networks.
It may also be appropriate for the more rural areas to consider other non-fixed-line technologies that can deliver improved broadband services.
Ultimately, deployment costs are just one of the many factors that need to be considered when making investment decisions. Nevertheless, we hope that this clear and detailed analysis of these costs and how they are shaped will help to ensure a more informed public debate on the important policy and regulatory decisions that lie ahead.
Analysys Mason for Broadband Stakeholder Group
Ref: 12726-371

The costs of deploying fibre-based next-generation broadband infrastructure
Contents
1 Executive summary 1 1.1 Methodology 2 1.2 Summary of cost model results 4 1.3 Further analysis 12 1.4 Conclusions 17
2 Introduction 22
3 Methodology 24 3.1 Network topology and cost assumptions 24 3.2 Geotype approach 34
4 Cost model results 44 4.1 Base case 44 4.2 Other scenarios 55 4.3 Operating costs for next-generation broadband access networks 65
5 Further analysis 70 5.1 Comparison of results with other benchmarks 70 5.2 Deployment costs in urban and rural areas 72 5.3 Other issues to be considered in the next-generation broadband business case 78
6 Conclusions 79 6.1 Costs 79 6.2 Transition from FTTC to FTTH 82 6.3 Implications for rural deployment 83 6.4 Competition implications 84
Annex A: General assumptions relating to fibre deployment Annex B: Illustration of model calculations for Inner London geotype Annex C: Selected detailed maps of deployment areas. Annex D: Detailed results tables for the base case
Analysys Mason for Broadband Stakeholder Group
Ref: 12726-371

The costs of deploying fibre-based next-generation broadband infrastructure | 1
1 Executive summary
This report presents the results of Analysys Mason’s quantification of the deployment costs for three different types of fibre-based infrastructure and technology that can be used to deliver the next generation of broadband services in the UK. The report was commissioned by the Broadband Stakeholder Group (BSG), with the support of the Department for Business Enterprise & Regulatory Reform (BERR).
This report analyses the results of a cost model that is based on a transparent approach that has been agreed by the members of the BSG Executive. For each technology option, we have explored a base case scenario, and also a number of possible variations from that scenario, including different assumptions for the rate of take-up of services and access to existing infrastructure. In the base case, only existing BT infrastructure is assumed to be available for re-use. We have also quantified the potential cost savings that could be realised if the duct networks owned by Virgin Media and utilities (e.g. sewers) were available for re-use for next-generation broadband infrastructure.
While it is possible to estimate the deployment costs with relative confidence, the lack of data on the operating costs of next-generation networks means that the operating costs are more difficult to quantify. For this reason we have only provided an indicative illustration of the potential operational cost savings. The revenue potential of next-generation broadband services has not been quantified as it is subject to much greater uncertainty, and is outside the scope of this work.
The objective of this report is to provide a key quantitative input into the independent review of next-generation broadband infrastructure and services being conducted by Francesco Caio at the request of BERR. The report is therefore intended to be used to inform the debate surrounding various next-generation broadband issues.
The cost model considers three different technological options for the provision of next-generation broadband services:
FTTC/VDSL Fibre to the cabinet (FTTC) using very high bit-rate digital subscriber line (VDSL) involves laying fibre-optic cables to street cabinets. Such cabinets are typically within a few hundred metres of the customer premises. Active equipment is then deployed in the street cabinet that connects to the customer premises using existing copper cables. Depending upon the length of the final copper line, download speeds of 30–100Mbit/s can be expected.
FTTH/GPON Fibre to the home (FTTH) using a Gigabit passive optical network (GPON) involves laying fibre-optic cables directly to the customer premises. Each fibre is theoretically capable of providing up to 2.5Gbit/s of download bandwidth to the customer premises. However, this bandwidth is typically shared between more than one customer.
Analysys Mason for Broadband Stakeholder Group
Ref: 12726-371

The costs of deploying fibre-based next-generation broadband infrastructure | 2
FTTH/PTP Fibre to the home can also be deployed using point-to-point (PTP) fibre connections. By using this technology each customer premises has a dedicated fibre that using current technology is capable of supporting symmetric connections of up to 1Gbit/s.
The first two of these technologies (FTTC/VDSL and FTTH/GPON) form the basis of the recently announced next-generation broadband deployment from BT1, which is likely to be heavily weighted towards FTTC/VDSL deployments.
FTTH has been considered in two distinct variations with different characteristics: FTTH/PTP offers greater service flexibility than FTTH/GPON and is more suitable for infrastructure-based competition, but deployment costs are higher.
Our detailed cost model for the deployment costs of each technology contains a geographical dimension, so that differences in costs between areas of the UK can be reflected in the results. We have also undertaken a high-level analysis of the potential differences in operating cost between today’s networks and the three next-generation broadband technologies.
Although detailed results are presented, it should be noted that the results are based upon a model with a large number of assumptions. These are all detailed in this document. The costs presented here should therefore be considered to be indicative estimates, and the actual costs of a real deployment are likely to differ from those presented in this report.
1.1 Methodology
1.1.1 Network topology
For each of the three technologies, we have established a base case, and a number of variations to that base case. In the base case, only lines requiring next-generation broadband services are assumed to be migrated to the new network (partial migration), and the only infrastructure that is assumed to be re-usable is that which is owned by BT.
In addition we have explored a scenario in which all lines are assumed to be migrated to the new network (full migration). We have also explored scenarios in which infrastructure from Virgin Media and utilities is available for re-use. More information on these scenarios is given in Section 3.1.4.
The main cost components in the deployment of FTTC/VDSL are the construction of new cabinets to house active equipment within a few hundred metres of the customer premises, and the installation of fibre-based connections to the street cabinets. The fibre connections to the street cabinets are largely installed in existing ducts owned by BT. In the base case, it is assumed that in
1 For more information on the BT announcement see http://www.btplc.com/superfastbroadband/
Analysys Mason for Broadband Stakeholder Group
Ref: 12726-371

The costs of deploying fibre-based next-generation broadband infrastructure | 3
each location only one new street cabinet is constructed, but that it has enough room for at least two operators to use it for active equipment. We have also considered scenarios in which there is only a single cabinet for one operator, and two cabinets (each for a single operator).
The two FTTH technologies involve the installation of fibre-optic cables from the existing telephone exchanges to the customer premises. Again, a significant proportion of the length of this fibre is assumed to be installed in existing ducts, though this proportion is substantially lower in areas that are closer to customer premises. In the case of FTTH/GPON each fibre connection from the exchange is shared by an average of 32 customers via passive splitters. However, FTTH/PTP has a dedicated fibre from the exchange to each customer premises. FTTH/PTP therefore requires more fibres to be installed, and so has been assumed to require more new ducts than FTTH/GPON due to space constraints.
Another difference between the two FTTH technologies lies in the exchange-based active equipment: FTTH/GPON uses a fibre shared between 32 users, whereas FTTH/PTP has a dedicated fibre to each premises from the telephone exchange.
Full details of the network topologies, dimensioning rules and unit costs for all three technologies are outlined in Section 3.1.
1.1.2 Geotype approach
For the purpose of modelling the deployment costs of next-generation broadband, we have categorised UK households into 13 ‘geotypes’. Each geotype has been chosen to represent areas with particular characteristics and deployment costs per customer premises for next-generation broadband infrastructure. A number of different parameters can be used to define geotypes. In this work we have used a combination of the population of a city or town, the number of lines served by a telephone exchange, and the distance between the customer premises and the telephone exchange. The proximity to the serving telephone exchange is particularly important in rural areas, in order to reflect the fact that significant numbers of rural premises are in relatively dense clusters close to telephone exchanges. The parameters used to define the 13 geotypes are summarised below in Figure 1.1.
Analysys Mason for Broadband Stakeholder Group
Ref: 12726-371

The costs of deploying fibre-based next-generation broadband infrastructure | 4
Geotype Classification criteria (distances are straight line)
Total no. of premises (domestic
+ business)
Avg straight-line distance from exchange to
premises (m)
% of total area
Premises density (per sq.
km)
Inner London Inner London 1 445 789 969 0.2% 3641
>500k pop Major city (pop = 500k+) 3 164 456 1391 1.0% 1282
>200k pop City (pop = 200k+) 2 794 786 1410 1.1% 1016
>20k lines (a) >20k lines, <2km from exchange 2 853 914 1174 0.9% 1360
>20k lines (b) >20 000 lines, >2km from exchange 1 744 926 3364 1.6% 453
>10k lines (a) >10 000 lines, <2km from exchange 4 355 457 1095 2.1% 854
>10k lines (b) >10 000 lines, >2km from exchange 1 553 331 2785 3.4% 190
>3k lines (a) >3000 lines, <1km from exchange 2 759 317 574 1.3% 876
>3k lines (b) >3000 lines, >1km from exchange 3 190 774 3362 14.2% 93
>1k lines (a) >1000 lines, <1km from exchange 1 102 702 487 1.6% 285
>1k lines (b) >1000 lines >1km from exchange 1 149 607 2850 20.8% 23
<1k lines (a) <1000 lines, <1km from exchange 438 430 405 3.0% 61
<1k lines (b) <1000 lines >1km from exchange 702 971 2971 48.9% 6
27 256 460 100%
Figure 1.1: Geotype summary [Source: Analysys Mason for BSG]
The geotypes labelled as ‘a’ refer to areas that are relatively densely populated areas close to telephone exchanges (i.e. the centres of towns and villages). The ‘b’ geotypes are the less densely populated areas that surround exchanges. These ‘a’ and ‘b’ geotypes are used to capture the effects of clustering close to exchanges, particularly in rural areas.
1.2 Summary of cost model results
1.2.1 Base case assumptions
A summary of results for the base case is presented in this section.
The base case was built upon the following common assumptions:
• migration of only broadband customers to the next-generation broadband access network • FTTC/VDSL being provisioned from a single cabinet shared between operators • an overall take-up rate of 31% of all lines nationally, based upon the following assumptions:
– broadband penetration is 80% – the national market share of cable broadband is the same as today, at around 21% (i.e. the
deployment of DOCSIS3.0 is assumed to allow cable to maintain its current share of the broadband market). We have estimated the cable market share based upon the coverage of Virgin Media’s cable network in each geotype. There is at least some coverage from cable in approximately 60% of postcode areas (although the actual number of premises passed is
Analysys Mason for Broadband Stakeholder Group
Ref: 12726-371

The costs of deploying fibre-based next-generation broadband infrastructure | 5
closer to 45%, as not all premises within a covered postcode area will be able to access cable services). Within the 60% coverage areas, this corresponds to a market share of around 35%.
– of the remaining broadband lines, 50% are provided over the FTTC/FTTH network, with the remaining broadband lines on the existing copper-based network.
1.2.2 Deployment costs in the base case
The costs per premises connected for FTTC/VDSL are shown in the figure below. The costs are broken down into six categories (for more information on the components of each cost category, see Section 3.1). The most significant cost categories are cabinets, active equipment, civil works2 and line migration. As would be expected, it is less expensive to connect premises in dense urban areas than in more sparsely populated rural areas. This effect is also seen across ‘a’ and ‘b’ geotypes: ‘a’ geotypes are consistently cheaper to connect than the corresponding ‘b’ geotype due to the shorter line lengths.
-
200
400
600
800
1,000
1,200
1,400
1,600
1,800
2,000
Lond
on
>500
k pop
>200
k pop
>20k
lines
(a)
>20k
lines
(b)
>10k
lines
(a)
>10k
lines
(b)
>3k l
ines (
a)
>3k l
ines (
b)
>1k l
ines (
a)
>1k l
ines (
b)
<1k l
ines (
a)
<1k l
ines (
b)
Nation
alDep
loym
ent c
osts
per
pre
mis
es c
onne
cted
(GB
P)...
Optical distribution frame Cabinet Active equipment Civils Line migration In-home
Figure 1.2: Breakdown of FTTC/VDSL costs per premises connected [Source: Analysys Mason for
BSG]
The costs per premises connected for FTTH/GPON are shown in the figure below. In the case of FTTH/GPON the main costs are from civil works, with other costs being less significant. Once again there are significant differences in the costs between geotype. A similar pattern of results is also seen for FTTH/PTP in Figure 1.4 below.
2 Costs of civil works include the costs of new ducts, fibre-optic cables and installation.
Analysys Mason for Broadband Stakeholder Group
Ref: 12726-371

The costs of deploying fibre-based next-generation broadband infrastructure | 6
-
2,000
4,000
6,000
8,000
10,000
12,000
Lond
on
>500
k pop
>200
k pop
>20k
lines
(a)
>20k l
ines (
b)
>10k
lines
(a)
>10k
lines
(b)
>3k l
ines (
a)
>3k l
ines (
b)
>1k l
ines (
a)
>1k l
ines (
b)
<1k l
ines (
a)
<1k l
ines (
b)
Nation
al
Dep
loym
ent c
osts
per
pre
mis
es c
onne
cted
(GB
P)...
Optical distribution frame Active equipment + splitters Civils (exc. final drop)Civils (final drop) In-building wiring (exc. final drop) CPE
Figure 1.3: Breakdown of FTTH/GPON costs per premises connected [Source: Analysys Mason for
BSG]
The costs for FTTH/PTP are higher than for FTTH/GPON. This is driven by increased costs of civil works due to the fact that the proportion of ducts that can be re-used has decreased, leading to a requirement for more new ducts to accommodate the increased size of the fibre-optic cables.
-
2,000
4,000
6,000
8,000
10,000
12,000
14,000
Lond
on
>500
k pop
>200
k pop
>20k
lines
(a)
>20k l
ines (
b)
>10k
lines
(a)
>10k
lines
(b)
>3k l
ines (
a)
>3k l
ines (
b)
>1k l
ines (
a)
>1k l
ines (
b)
<1k l
ines (
a)
<1k l
ines (
b)
Nation
al
Dep
loym
ent c
osts
per
pre
mis
es c
onne
cted
(GB
P)...
Optical distribution frame Active equipment + splitters Civils (exc. final drop)Civils (final drop) In-building wiring (exc. final drop) CPE
Figure 1.4: Breakdown of FTTH/PTP costs per premises connected [Source: Analysys Mason for
BSG]
Analysys Mason for Broadband Stakeholder Group
Ref: 12726-371

The costs of deploying fibre-based next-generation broadband infrastructure | 7
The total costs for deploying each technology, plotted against cumulative population coverage, are shown in Figure 1.5 and Figure 1.6 below (with the geotypes ordered from least to most expensive per premises connected).
For all three technologies it is seen that there is a significant proportion of geotypes for which the curve remains relatively linear (i.e. the costs per premises connected remain constant), followed by an increasing gradient, and eventually a significantly steeper section for the last few percent of population. These three sections of the graph equate roughly to geographical areas that are respectively urban, rural and remote. This has been captured in our modelling by designating the 13 geotypes as urban A, rural B and remote C. These three categories are slightly different for FTTC and FTTH technologies, and so are designated as follows: AFTTC/AFTTH, BFTTC/BFTTH and CFTTC/CFTTH.
-
1.0
2.0
3.0
4.0
5.0
6.0
0% 10% 20% 30% 40% 50% 60% 70% 80% 90% 100%Cumulative population
Dep
loym
ent c
osts
(GB
P b
illio
ns)...
FTTC/VDSL
AFTTC BFTTC CFTTC
Figure 1.5: Total cost vs. percentage population for FTTC/VDSL [Source: Analysys Mason for BSG]
Analysys Mason for Broadband Stakeholder Group
Ref: 12726-371

The costs of deploying fibre-based next-generation broadband infrastructure | 8
-
5
10
15
20
25
30
35
0% 10% 20% 30% 40% 50% 60% 70% 80% 90% 100%Cumulative population
Dep
loym
ent c
osts
(GB
P b
illio
ns)...
FTTH/GPON FTTH/PTP
AFTTH BFTTH CFTTH
Figure 1.6: Total cost vs. percentage population for FTTH [Source: Analysys Mason for BSG]
The costs of deploying FTTC/VDSL on a national basis are around GBP5.1 billion. This is around a fifth of the costs of deploying FTTH/GPON (GBP24.5 billion), with FTTH/PTP costing around GBP28.8 billion (18% more than FTTH/GPON).
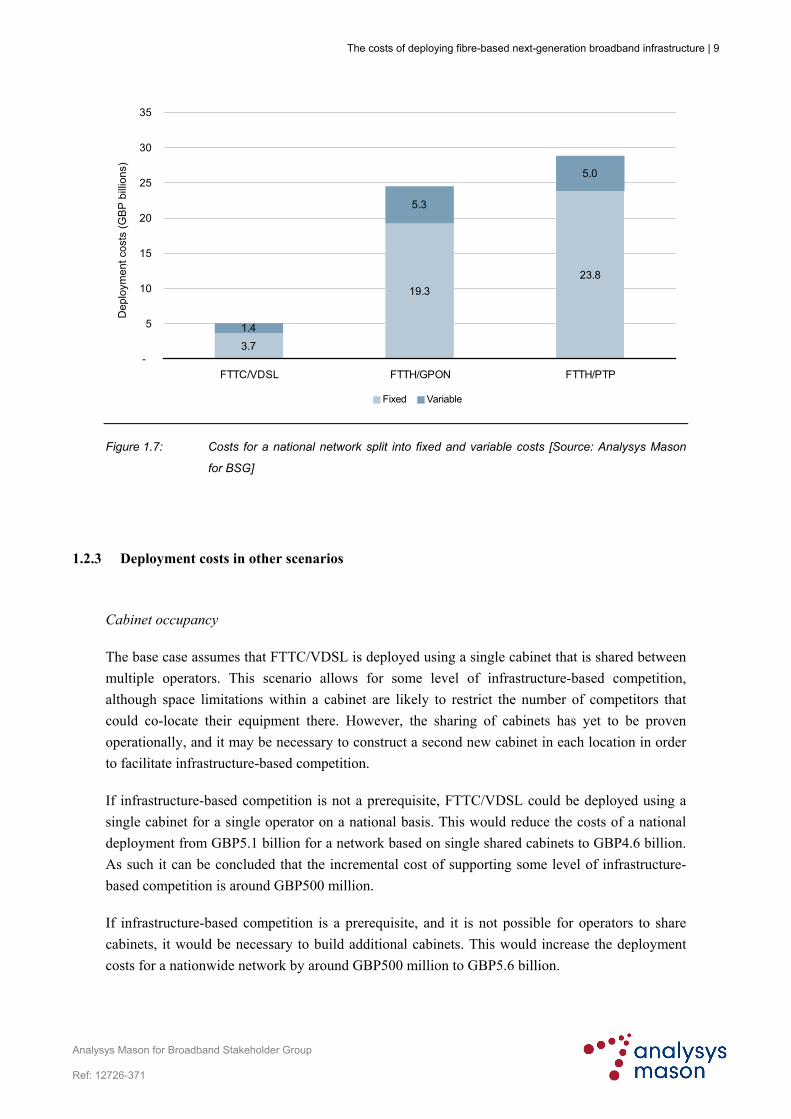
Figure 1.7 shows the deployment costs for a national network under the base case (50% take-up amongst broadband subscribers not on cable networks) split into fixed and variable costs. The fixed costs are for items such as new street cabinets which do not vary with take-up. The variable costs are those that increase with the addition of each new line, and so include costs for active equipment and the final fibre connection to the premises which are only installed when a premises migrates to the new network. It can be seen that for all technologies the fixed costs associated with coverage are dominant, at over 70% of the total costs. As will be seen later in Section 1.2.3, the large proportion of fixed costs means that the costs per premises connected are particularly sensitive to the take-up assumptions.
Analysys Mason for Broadband Stakeholder Group
Ref: 12726-371
The costs of deploying fibre-based next-generation broadband infrastructure | 9
3.7
19.323.8
1.4
5.3
5.0
-
5
10
15
20
25
30
35
FTTC/VDSL FTTH/GPON FTTH/PTP
Dep
loym
ent c
osts
(GB
P b
illio
ns)...
Fixed Variable
Figure 1.7: Costs for a national network split into fixed and variable costs [Source: Analysys Mason
for BSG]
1.2.3 Deployment costs in other scenarios
Cabinet occupancy
The base case assumes that FTTC/VDSL is deployed using a single cabinet that is shared between multiple operators. This scenario allows for some level of infrastructure-based competition, although space limitations within a cabinet are likely to restrict the number of competitors that could co-locate their equipment there. However, the sharing of cabinets has yet to be proven operationally, and it may be necessary to construct a second new cabinet in each location in order to facilitate infrastructure-based competition.
If infrastructure-based competition is not a prerequisite, FTTC/VDSL could be deployed using a single cabinet for a single operator on a national basis. This would reduce the costs of a national deployment from GBP5.1 billion for a network based on single shared cabinets to GBP4.6 billion. As such it can be concluded that the incremental cost of supporting some level of infrastructure-based competition is around GBP500 million.
If infrastructure-based competition is a prerequisite, and it is not possible for operators to share cabinets, it would be necessary to build additional cabinets. This would increase the deployment costs for a nationwide network by around GBP500 million to GBP5.6 billion.
Analysys Mason for Broadband Stakeholder Group
Ref: 12726-371

The costs of deploying fibre-based next-generation broadband infrastructure | 10
Nonetheless, in practice it is unlikely that infrastructure-based competition will be viable in all areas, and is most likely to develop in areas of high demand for services and low cost of deployment. As such, it is likely that infrastructure-based competition may only be viable in the AFTTC areas. If so, the difference in the costs for the scenario with a single cabinet (which is least conducive to infrastructure-based competition), and the scenario with two cabinets (which is most conducive to infrastructure-based competition) would be around GBP310 million in the AFTTC areas. The competition implications of FTTC/VDSL are discussed in greater detail in Section 1.4.4.
Take-up of next-generation broadband services
Given that fixed costs account for a very large proportion of the total costs, an increase in take-up of next-generation broadband services leads to a significant reduction in the costs per premises connected. Figure 1.8 shows how an increase in the national take-up rate from 31% of all lines to 63% of all lines (which would equate to 100% take-up amongst broadband subscribers not on cable networks) would lead to a 41% decrease in the costs per premises connected for FTTH/GPON from around GBP2900 to around GBP1700 (in spite of an increase in total costs from GBP24.5 billion to GBP29.4 billion due to the higher variable costs).
-
1,000
2,000
3,000
4,000
5,000
6,000
7,000
8,000
9,000
0% 10% 20% 30% 40% 50% 60% 70% 80%Take-up of all lines
...D
eplo
ymen
t cos
ts p
er p
rem
ises
con
nect
ed (G
BP)
...
AFTTH BFTTH CFTTH National
Figure 1.8: Impact of overall take-up on the costs per premises connected in the base case by area
for FTTH/GPON [Source: Analysys Mason for BSG]
A scenario has also been considered in which all of the existing lines are migrated to the new network (full migration), and the existing copper-based network is no longer actively used. This full migration of lines leads to a significant increase in deployment costs (increases of around GBP2 billion increase for FTTC/VDSL and GBP5 billion for FTTH/GPON). The increases in cost
Analysys Mason for Broadband Stakeholder Group
Ref: 12726-371

The costs of deploying fibre-based next-generation broadband infrastructure | 11
are due to an increase in the variable costs outlined above, and additional costs for network resiliency (e.g. battery back-up facilities). There may also be significant increases in operating costs to maintain these additional resiliency features. These are quantified in Section 4.3.
Use of alternative infrastructure
The base case assumes a certain level of re-use of existing infrastructure that is owned by BT. Other scenarios have been considered where the infrastructure from Virgin Media and utility firms can also be used. The potential savings that have been estimated using the different infrastructures are shown below in Figure 1.9. The percentage cost saving is greatest in urban areas (AFTTC/AFTTH) and lowest in the rural areas because the cable footprint is more concentrated in the AFTTC/AFTTH areas. Similarly we have assumed that the utility infrastructure becomes less usable in more rural areas. Figure 1.9 shows that the potential cost savings from using alternative infrastructure are most significant for FTTH. The deployment costs for FTTH/GPON could be reduced by over 20%, a cost reduction of over GBP5 billion for nationwide deployment.
Cost savings (GBP millions)
Virgin Media (urban areas)
Virgin Media(nationwide)
Utilities(urban areas)
Utilities(nationwide)
FTTC/VDSL 270 (14%) 549 (11%) 295 (16%) 811 (16%)
FTTH/GPON 719 (7%) 1307 (5%) 2427 (25%) 5654 (23%)
FTTH/PTP 950 (8%) 1733 (6%) 3014 (26%) 7028 (24%)
Figure 1.9: Reduction in
costs due to use of
alternative infrastructure
[Source: Analysys
Mason for BSG]
Urban areas refer to the AFTTC/AFTTH areas; percentage saving in parentheses
Another approach to cost reduction is to increase the use of aerial fibre in locations where existing ducts are not available. This technique could be used in areas where it is possible to install new telegraph poles – though we believe such areas may be limited. The sensitivity of the model to greater use of aerial fibre (primarily in rural areas) has been quantified. This sensitivity is detailed in Section 4.2.5, which shows that the reduction in deployment costs for FTTH could be around GBP5 billion. However, this is not additive with the potential savings from using other duct networks, and may be difficult to achieve due to issues associated with installing new telegraph poles.
Duct re-use
The base case for our modelling assumes that a reasonable proportion of existing BT ducts can be re-used for fibre deployment; this varies from a high level of re-use near to the exchange (80%) to a lower level of re-use nearer to the premises (30% for the final connection to the premises). The assumptions in this area have a large impact upon the overall costs for deploying the different technologies. Under different assumptions for duct re-use the deployment costs for FTTC/VDSL can change by over GBP1 billion, and by over GBP7 billion for FTTH. The assumption behind these sensitivities can be found in Section 4.2.4. Ofcom’s ongoing duct survey is seeking to
Analysys Mason for Broadband Stakeholder Group
Ref: 12726-371

The costs of deploying fibre-based next-generation broadband infrastructure | 12
establish a better understanding of these issues. The findings of this work will be important in helping to inform the likely extent of ducting that can be re-used with minimal investment.
Engineer installation
In the case of FTTC/VDSL, we have explored the sensitivity of the model to a requirement for customer premises equipment to be installed by an engineer rather than by the customer. Installation by an engineer may be necessary to ensure that FTTC/VDSL is able to deliver high speeds reliably. Similar engineer installations were necessary in the early phases of ADSL roll-out, though over time ‘self-installation’ became the most common method. However, FTTC/VDSL may require a professional installation beyond the initial stage of a deployment. Such installations are assumed to cost an additional GBP100 per line. This would increase the total costs of deployment by over GBP850 million, representing a 17% increase in overall costs.
1.2.4 Operating costs
Our analysis of the operating costs in Section 4.3 suggests that in the long term the costs of operating an FTTH network could be in the region of 30% lower than the costs of operating the current copper network. By contrast, the operating costs for an FTTC network could be slightly higher than today’s infrastructure. However, in the short term (or under a low take-up scenario) the total operating costs may increase due to the inefficiencies of operating parallel fibre- and copper-based networks.
The magnitude of the savings in operating costs is relatively small when compared to the overall investment required. In the case of FTTC/VDSL, therefore, the available savings are unlikely to be sufficient to make a business case unattractive; for FTTH/GPON and FTTH/PTP the savings are likely to be substantially less than would be required to fund the investment based solely on savings in operating cost.
For example, under the base case, the cost savings from FTTH are estimated to be around GBP20 per line per annum. This is a material saving, but needs to be weighed against the deployment cost of around GBP1800 per line (in the least expensive urban areas).
1.3 Further analysis
1.3.1 Comparison of results with other benchmarks
The deployment costs modelled in this project have been compared against publicly available costs from BT and AT&T for FTTC/VDSL. When the costs are compared on a like-for-like basis (i.e. the same take-up, similar geography and measure of costs) the costs in this model are similar to the benchmarks, but generally slightly lower than those quoted by other organisations. This difference
Analysys Mason for Broadband Stakeholder Group
Ref: 12726-371

The costs of deploying fibre-based next-generation broadband infrastructure | 13
is likely to be due to other costs being included in the costs from other organisations (e.g. servers for video services, and additional deployments of FTTH in the case of the costs quoted by BT).
The deployment costs for FTTH have been compared to cost benchmarks from Verizon in the USA, OnsNet in the Netherlands, and ARCEP (the French regulator). In all three cases, when the results of this model are compared on a like-for-like basis the costs are similar to , or less than, the international benchmarks. Experience from Verizon in the USA has shown that deployment costs tend to fall over time. As the benchmarks are historical we believe that this is likely to be the main reason for the differences in costs.
The deployment of DOCSIS3.0 by Virgin Media will support download speeds of at least 50Mbit/s, using a network that is similar to a FTTC/VDSL network (i.e. it uses fibre to a street cabinet within a few hundred metres of the customer premises). However, the Virgin Media network does not require significant new infrastructure investments as most of the investment for DOCSIS3.0 is in active electronics. We estimate that under similar take-up assumptions to the base case, the costs per premises connected for DOCSIS3.0 are around GBP50–100, similar to the investment in active electronics for FTTC/VDSL, which is GBP100 per premises connected3.
1.3.2 Deployment costs in urban and rural areas
The model has been designed to calculate deployment costs for 13 different geotypes, within which we have identified three broad groupings of geotypes with similar characteristics and costs. The 13 geotypes have therefore been aggregated into three main types of area (corresponding broadly to urban, rural and remote areas), for FTTC and FTTH technologies respectively.
In the case of FTTC/VDSL the deployment costs per premises are lowest in the urban AFTTC areas, which account for 58% of the UK population; the costs are approximately 50% higher in the rural BFTTC areas than in AFTTC areas, and approximately three times higher in the remote CFTTC areas than in AFTTC areas. Based upon BT’s declared strategy of deploying FTTC/VDSL to around 40% of the UK population, and the variation in costs by geographical area, it is likely that the commercial deployment of FTTC/VDSL will extend to all of the urban AFTTC areas in due course.
A similar approach was also used to classify the costs of FTTH/GPON and FTTH/PTP into the three equivalent areas AFTTH, BFTTH and CFTTH. The differences in costs by area type are even more pronounced for FTTH, with the costs per premises in the approximate ratio of 1:2:4 for the three categories.
The base case for the model assumes the uniform take-up of next-generation broadband services across all of the categories (once the impact of cable coverage is considered). However, the rural BFTTC/BFTTH and remote CFTTC/CFTTH areas tend to have significantly longer copper lines. This means that the performance of the current copper-based broadband technologies (i.e. ADSL and
3 The cost estimate is based upon information supplied by New Street Research
Analysys Mason for Broadband Stakeholder Group
Ref: 12726-371

The costs of deploying fibre-based next-generation broadband infrastructure | 14
ADSL2+) is significantly worse in the BFTTC/BFTTH and CFTTC/CFTTH areas than in the AFTTC/AFTTH areas. Because of this there may be a higher take-up of next-generation broadband in the BFTTC/BFTTH and CFTTC/CFTTH areas.
As discussed earlier in Section 1.2.2, the dominance of fixed costs means that the cost of connecting a premises depends significantly on the level of take-up: higher take-up means lower connection costs. The potential impact of this has been quantified, with the results shown in Figure 1.10. From this chart it can be seen that if the take-up levels in the BFTTC/BFTTH and CFTTC/CFTTH areas were to be 100% of broadband subscribers not on cable networks (instead of the 50% in the base case) the costs per premises connected in the BFTTC/BFTTH areas fall to similar levels as the costs in the AFTTC/AFTTH areas. Similarly, the costs in the CFTTC/CFTTH areas fall to the levels in the BFTTC/BFTTH areas under the base case. These results highlight the impact of high take-up on the commercial business case for next-generation broadband, and the potential role for demand stimulation and aggregation initiatives.
406
2,089
573 363
4,652
2,694
1,175664
9,205
5,352
-
1,000
2,000
3,000
4,000
5,000
6,000
7,000
8,000
9,000
10,000
FTTC/VDSL FTTH/GPON FTTH/PTP
Dep
loym
ent c
osts
per
pre
mis
es c
onne
cted
(GBP
)...
A - base case B - base caseB - 100% take-up
C - base case C - 100% take-up
100% take-up of FTTH/GPON in the CFTTH areas would reduce the cost per
premises by GBP3300
1,774
3,904
8,026
4,755
2,311
406
2,0892,089
573 363573 363
4,652
2,694
4,652
2,694
1,175664
1,175664
9,205
5,352
9,205
5,352
-
1,000
2,000
3,000
4,000
5,000
6,000
7,000
8,000
9,000
10,000
FTTC/VDSL FTTH/GPON FTTH/PTP
Dep
loym
ent c
osts
per
pre
mis
es c
onne
cted
(GBP
)...
A - base case B - base caseB - 100% take-up
C - base case C - 100% take-up
100% take-up of FTTH/GPON in the CFTTH areas would reduce the cost per
premises by GBP3300
1,774
3,904
8,026
4,755
2,311
Figure 1.10: Impact of increased take-up on costs in different areas [Source: Analysys Mason for BSG]
It can be seen from the two maps below in Figure 1.11 and Figure 1.12 that although the AFTTC and AFTTH areas cover 58% and 68% of the population respectively, they cover a significantly lower proportion of the land area. It is also important to note that there are many of the AFTTC/AFTTH and BFTTC/BFTTH areas in the UK are in small pockets. These small pockets are within the areas defined as being close to the centre of exchange coverage areas. These represent small but densely populated towns and villages that are served by smaller telephone exchange in areas away from urban centres.
Analysys Mason for Broadband Stakeholder Group
Ref: 12726-371

The costs of deploying fibre-based next-generation broadband infrastructure | 15
CFTTC
BFTTC
AFTTC
Figure 1.11: Map of the
UK by area type for
FTTC/VDSL [Source:
Analysys Mason for
BSG]
Annex C contains two copies of the above map focused on the South West and North East of England.
Analysys Mason for Broadband Stakeholder Group
Ref: 12726-371

The costs of deploying fibre-based next-generation broadband infrastructure | 16
CFTTH
BFTTH
AFTTH
Figure 1.12: Map of the
UK by area type for
FTTH/GPON and
FTTH/PTP [Source:
Analysys Mason for
BSG]
Despite there being differences in the AFTTC/AFTTH areas, they both include Inner London, and cities with a population in excess of 200 000 (see Figure 3.11 and Figure 3.12 for a full list). The AFTTC/AFTTH areas also include the central portions of smaller cities (such as Aberdeen, Norwich and Reading) to smaller towns (such as Banbury, Doncaster, Thetford, Neath and Buxton) and even extend to the more densely populated areas of smaller towns and villages (such as Southwold, Llangollen, Pitlochry and Sidbury).
The BFTTC/BFTTH areas and the CFTTC/CFTTH areas are generally the sparsely populated areas surrounding the centres of towns and villages, though the CFTTC and BFTTH areas also include the central areas of the smallest exchanges with fewer than 1000 lines.
Analysys Mason for Broadband Stakeholder Group
Ref: 12726-371

The costs of deploying fibre-based next-generation broadband infrastructure | 17
1.3.3 Other issues to be considered in the next-generation broadband business case
This report has focused on the deployment costs of the three main next-generation broadband technologies. These deployment costs are a critical element of the debate surrounding next-generation broadband, but operating costs and the revenue potential of next-generation broadband services must be considered in the full business case. The revenue potential of next-generation broadband services has not been quantified as it is subject to much more uncertainty. Assumptions must be made about the evolution of pricing for current services relative to next-generation broadband access. Additionally, the revenue potential of services such as IPTV has yet to be proven, and must also be offset against other costs such as content acquisition, which can be significant (e.g. for premium sports events). As the market matures and initial roll-outs of next-generation broadband are completed, the revenues associated with new services will become clearer.
1.4 Conclusions
1.4.1 Costs
This work has shown that the deployment costs for FTTH are around five times those for FTTC, and that the deployment costs for FTTH/PTP are over 15% higher than for FTTH/GPON.
Access to alternative infrastructures from Virgin Media and utility networks has the potential to reduce deployment costs by up to GBP800 million (a 16% saving) for FTTC/VDSL and GBP5.6 billion (a 23% saving) for FTTH/GPON under the base case.
For each of the three technologies, the deployment costs remain relatively constant across all urban areas. For FTTC, the urban AFTTC areas cover 58% of the population, and in the case of FTTH/GPON and FTTH/PTP the urban AFTTH areas cover 68% of the population. The relatively constant costs for a large proportion of the population suggest that if the business case is attractive for one of the technologies it may well be attractive for all of the urban AFTTC/AFTTH areas.
The fixed costs of deploying each of the three technologies far outweigh the variable costs, making take-up a major factor in the required investment per premises connected. This has implications in rural areas, which generally have longer copper lines, and consequent bandwidth constraints on existing broadband infrastructure. In these areas, next-generation broadband represents a greater increase in performance over copper-based broadband, and so take-up may be higher. If a very high level of take-up can be achieved, it is possible that the costs in such areas could fall to around the same level as the large urban areas. This highlights the role that demand stimulation and aggregation schemes could play in the development of next-generation broadband infrastructure. However, it should be noted that such initiatives may need to be more localised than previous demand stimulation and aggregation initiatives for ADSL, which were organised according to telephone exchange. This is due to the significant variations in costs between the inner areas of exchanges, and the less densely populated areas surrounding them.
Analysys Mason for Broadband Stakeholder Group
Ref: 12726-371

The costs of deploying fibre-based next-generation broadband infrastructure | 18
A number of sensitivities have been considered in the modelling work, some of which have a very large impact on the costs. However, we believe that the base case represents a reasonable view of the costs of deploying the three different technologies; the sensitivity tests provide guidance on the magnitude of potential cost savings that could be achieved. A summary of the results for the base case (subject to the assumptions presented in Section 1.2.1) is shown below in Figure 1.13.
1.9
9.9 11.6
1.4
9.010.7
1.8
5.7
6.5
-
5
10
15
20
25
30
35
FTTC/VDSL FTTH/GPON FTTH/PTP
Dep
loym
ent c
osts
(GB
P b
illion
s)...
A (58%/68%) B ( 26%/25%) C (16%/7%)
Figure 1.13: Deployment
costs of each technology
split by area (the
corresponding population
coverage for FTTC/FTTH
is shown in parentheses)
[Source: Analysys
Mason for BSG]
1.4.2 Transition from FTTC to FTTH
Many incumbent operators, including BT, are choosing to deploy FTTC ahead of FTTH. This report has shown that FTTC can be deployed at a considerably lower cost than FTTH, with deployment costs around a fifth of those for FTTH. Given the capacity of FTTC to support the vast majority of current applications, there are strong incentives for operators to deploy FTTC rather than FTTH. Furthermore, a strategy of deploying FTTC does not preclude a later deployment of FTTH.
The deployment of FTTC infrastructure may help to drive innovation that leads to the development of applications requiring greater bandwidth, which in turns drives demand for FTTH infrastructure. This process may be accelerated by small-scale deployments of FTTH in areas of new build, or in areas targeted by new entrants deploying FTTH.
There are also some cost synergies between FTTC and FTTH. An important component of the deployment costs for FTTC/VDSL relates to the installation of fibre to the street cabinet. This investment amounts to around GBP2.1 billion for a nationwide network (making up 42% of the total roll-out costs for FTTC), and is a common requirement for both FTTC and FTTH. It should be noted, however, that this GBP2.1 billion amounts to just 9% of the GBP24.5 billion required for a nationwide FTTH deployment, under our base case.
Analysys Mason for Broadband Stakeholder Group
Ref: 12726-371

The costs of deploying fibre-based next-generation broadband infrastructure | 19
A significant proportion of the remaining costs for deploying FTTC/VDSL relates to active electronics, which will be subject to a depreciation period that is much shorter than for fibre and new ducts. It is conceivable that by the time these active electronics have been fully depreciated, there may be a more compelling business case for FTTH. However, there is also a risk that if alternative operators invest in sub-loop unbundling (SLU), some of their SLU assets at the street cabinet could become redundant before their investments are fully recovered.
There may be opportunities to learn lessons from the operational experience of rolling out FTTC that could lead to a more efficient deployment of FTTH in the future. However, as there are significant differences between the technologies, these opportunities may be limited.
There are also some potentially negative impacts of an initial deployment of FTTC. For example, FTTC involves placing active equipment ‘deeper’ into the network. This will require new operational skills and practices for operators, notably in field maintenance. A move to an FTTH network at a later date may then lead to resistance to change as operators’ active equipment will be more centralised, and will require a different set of operational skills.
An initial deployment of FTTC may allow operators to capture most of the additional revenue that is available from next-generation broadband services, leaving little additional revenue for services that are only supported by FTTH. If this were to occur it may make the business case for a subsequent deployment of FTTH more difficult to justify. This could possibly be offset by the effects of innovation outlined earlier in this section.
Finally, operators who do not currently use the existing BT infrastructure may have a different perspective on the business case for FTTH. For example, H2O Networks does not have existing ties with the BT network and is pursuing an FTTH strategy. For operators who do not currently use the copper access networks the difference in economics between FTTC and FTTH may not be as pronounced, making FTTH more attractive.
1.4.3 Implications for rural deployment
For both FTTC and FTTH the significant increase in the costs per premises connected beyond the AFTTC and AFTTH areas suggests that under the base case the commercial business case for next-generation broadband services beyond these areas is likely to be more challenging4. Nonetheless, and as discussed above, a significantly higher level of take-up in these areas could reduce the costs, potentially to levels similar to those in AFTTC and AFTTH areas.
On balance it appears probable that if the more rural areas are to receive next-generation broadband access there will need to be a mixture of demand- and supply-side interventions from the public sector, similar to what happened with the first generation of broadband services.
4 For example, if the additional costs of deploying FTTH/GPON to BFTTH areas were recovered purely through higher retail prices over
20 years (using a discount rate of 15%), it would amount to an increase in retail prices of over GBP28 per month when compared to the AFTTH areas.
Analysys Mason for Broadband Stakeholder Group
Ref: 12726-371

The costs of deploying fibre-based next-generation broadband infrastructure | 20
BT and Virgin Media have announced their intention to deploy next-generation broadband infrastructure. While Virgin Media’s roll-out is dictated by the coverage of its existing network (which is concentrated mainly in urban areas), the geographical location of BT’s deployment is not yet known. However, information currently available from BT suggests that, in the absence of any form of public-sector intervention, its deployment will be focused on more urban areas.
Given the likely urban focus of any purely commercial deployments, it would be appropriate to develop creative policy approaches for the rural BFTTC/BFTTH and remote CFTTC/CFTTH areas that include commercial operators, the public sector and local communities. If these approaches are to include public-sector interventions they should seek to draw upon the recommendations in the report for the BSG on “Models for efficient and effective public-sector interventions in next-generation broadband access networks” 5. It may also be appropriate for the more rural areas to consider other wireless and satellite technologies that can deliver next-generation broadband services.
1.4.4 Competition implications
The plans announced by both BT and Virgin Media to provide competing next-generation broadband infrastructure are likely to include a significant coverage overlap. However, the potential for other alternative operators to compete at the infrastructure level is less clear.
In the case of FTTC/VDSL, operators with limited market share will struggle to gain economies of scale, and so will face significant challenges if they choose to adopt a strategy based on SLU. This has been considered in detail in our two previous reports for the telecoms regulators in the Netherlands6 and Ireland7. Both of these studies concluded that the business case for alternative operators deploying SLU is challenging, and any possible deployments are very likely to be less widespread than LLU. There may be potential for SLU to be successful in some areas, especially if cabinets can be shared between multiple operators. A shared cabinet is assumed to be deployed in the base case for FTTC/VDSL in this report.
We have also considered a scenario in which only a single cabinet is dedicated to a single operator, and a scenario in which separate cabinets are constructed for two different operators. Within the AFTTC areas (which are most likely to see deployments of FTTC/VDSL) the costs of deploying a single dedicated cabinet fall by GBP150 million compared to the base case, and the scenario requiring two cabinets is GBP150 million more expensive than the base case.
However, even if SLU is deployed in some areas it is likely that many alternative operators will be reliant upon wholesale bitstream products. For such products to be successful they will need to
5 http://www.broadbanduk.org/psi
6 http://www.opta.nl/asp/en/publications/document.asp?id=2119
7 http://www.comreg.ie/publications/sub-loop_unbundling__slu__report_prepared_by_analysys_consulting_limited_for_comreg.597.102967.p.html
Analysys Mason for Broadband Stakeholder Group
Ref: 12726-371

The costs of deploying fibre-based next-generation broadband infrastructure | 21
offer sufficient flexibility to service providers to offer innovative services, at a reasonable cost. The ongoing work from Ofcom on Ethernet Active Line Access (ALA) will be particularly important in ensuring that there is a competitive retail market nationally.
There are likely to be large areas of the UK where there is a monopoly over the new cabinets and active equipment supporting FTTC/VDSL. However, it is important to note that this monopoly operator does not necessarily need to be BT, although it is likely that other operators would use wholesale input products from Openreach. One area where this situation may occur is South Yorkshire, where Thales Communication Systems has been selected as the preferred bidder for a public-sector intervention that should see FTTC/VDSL being deployed to the region on an open-access basis.
As part of the debate surrounding SLU it is worth noting that different approaches to infrastructure-based competition may have a significant impact upon the deployment costs.
One option for infrastructure-based competition in FTTH is unbundling fibre at the exchange. In the case of FTTH/PTP this is relatively straightforward and, as highlighted in our recent report for the Dutch regulator,8 it may have a similar business case to LLU. FTTH/GPON, on the other hand, uses shared fibre, and there are technical challenges that must be overcome before it can be unbundled. This may mean that bitstream products will play an important role in maintaining competition over FTTH/GPON infrastructure, at least initially. The additional costs of FTTH/PTP relative to FTTH/GPON should also be considered: under the base case, these amount to GBP1.8 billion for the urban AFTTH areas (68% population coverage).
Another option for competition in FTTH is duct access. This approach is being taken in other European countries, including Portugal (where access to the incumbent’s duct network is mandated) and France (where the regulator is looking closely at regulated duct access). The issues surrounding competition via duct access are being considered by Ofcom.
8 http://www.opta.nl/asp/publicaties/document.asp?id=2672
Analysys Mason for Broadband Stakeholder Group
Ref: 12726-371

The costs of deploying fibre-based next-generation broadband infrastructure | 22
2 Introduction
This report presents the results of Analysys Mason’s quantification of the deployment costs for three different types of fibre-based infrastructure and technology that can be used to deliver the next generation of broadband services in the UK. The report was commissioned by the Broadband Stakeholder Group (BSG), with the support of the Department for Business Enterprise & Regulatory Reform (BERR).
This report analyses the results of a cost model that is based on a transparent approach that has been agreed by the members of the BSG Executive. For each technology option, we have explored a ‘base-case’ scenario, and also a number of possible variations from that scenario, including different assumptions for the rate of take-up of services and access to existing infrastructure. In the base case, only existing BT infrastructure is assumed to be available for re-use. We have also quantified the potential cost savings that could be realised if the duct networks owned by Virgin Media and utilities (e.g. sewers) were available for re-use for next-generation broadband infrastructure.
While it is possible to estimate the deployment costs with relative confidence, the lack of data on the operating costs of next-generation networks means that the operating costs are more difficult to quantify. For this reason we have only provided an indicative illustration of the potential operational cost savings. The revenue potential of next-generation broadband services has not been quantified as it is subject to much greater uncertainty, and is outside the scope of this work.
The objective of this report is to provide a key quantitative input into the independent review of next-generation broadband infrastructure and services being conducted by Francesco Caio at the request of BERR. The report is therefore intended to be used to inform the debate surrounding various next-generation broadband issues.
The cost model considers three different technological options for the provision of next-generation broadband services:
FTTC/VDSL Fibre to the cabinet (FTTC) using very high bit-rate digital subscriber line (VDSL) involves laying fibre-optic cables to street cabinets. Such cabinets are typically within a few hundred metres of the customer premises. Active equipment is then deployed in the street cabinet that connects to the customer premises using existing copper cables. Depending upon the length of the final copper line, download speeds of 30-100Mbit/s can be expected.
FTTH/GPON Fibre to the home (FTTH) using a Gigabit passive optical network (GPON) involves laying fibre-optic cables directly to the customer premises. Each fibre is theoretically capable of providing up to 2.5Gbit/s of download bandwidth to the customer premises. However, this bandwidth is typically
Analysys Mason for Broadband Stakeholder Group
Ref: 12726-371

The costs of deploying fibre-based next-generation broadband infrastructure | 23
shared between more than one customer.
FTTH/PTP Fibre to the home can also be deployed using point-to-point (PTP) fibre connections. By using this technology each customer premises has a dedicated fibre that using current technology is capable of supporting symmetric connections of up to 1Gbit/s.
The first two of these technologies (FTTC/VDSL and FTTH/GPON) form the basis of the recently announced next-generation broadband deployment from BT9, which is likely to be heavily weighted towards FTTC/VDSL deployments.
FTTH has been considered in two distinct variations with different characteristics: FTTH/PTP offers greater service flexibility than FTTH/GPON and is more suitable for infrastructure-based competition, but deployment costs are higher.
The remainder of this document is structured as follows:
•
•
•
•
•
•
•
•
Section 3 outlines the methodology behind the cost model. This is split in to two sub-sections, with the first outlining the network topology and key cost assumptions for the three technologies. The second sub-section explains the rationale behind the geotypes to be modelled, and provides a high-level summary of their characteristics.
Section 4 contains a discussion of the model results.
Section 5 includes further analysis of the results and then moves on to consider other factors that must be considered in a full business case for next-generation access networks and services.
Section 6 outlines the conclusions of this work.
In addition, the following supporting documentation is included as annexes to this report:
Annex A describes in detail the assumptions in the model relating to fibre deployment.
Annex B provides an example of the detailed calculations for the Inner London geotype.
Annex C presents selected detailed maps of deployment areas.
Annex D contains detailed results tables for the base case.
9 For more information on the BT announcement see http://www.btplc.com/superfastbroadband/
Analysys Mason for Broadband Stakeholder Group
Ref: 12726-371
The costs of deploying fibre-based next-generation broadband infrastructure | 24
3 Methodology
There are two key aspects to the modelling of the deployment costs for next-generation broadband access networks. The first aspect is the network topology and cost assumptions, which are set out in Section 3.1. The second aspect, which is outlined in Section 3.2 is the geographical approach, which uses geotypes to allow the variation in deployment costs to be quantified for each area of the UK.
We have also modelled potential changes to the operating costs of the next-generation broadband networks. This analysis has been carried out at a high level and the methodology and assumptions are outlined along with the results in Section 4.3.
3.1 Network topology and cost assumptions
This section discusses the network topology and cost assumptions for the different technology options being considered, namely:
• FTTC/VDSL • FTTH/GPON
FTTH/PTP. •
FTTH/GPON and FTTH/PTP have both been considered as FTTH/PTP offers greater service flexibility and more suitable to infrastructure-based competition. However, these benefits come at the expense of higher deployment costs.
The cost assumptions are based upon the hypothesis that the network roll-out will take place over a number of years, during which time the average costs for certain items (such as active equipment) would be expected to fall. Therefore, in some cases the model assumes unit costs that are below current prices to reflect this.
Under the scenarios where all lines are migrated to the new network (full migration), it may be possible to reduce the number of telephone exchanges as next generation broadband may support much longer lines than is possible with current copper based lines. This has not been considered in this work as its viability is subject to other commercial and regulatory considerations. The model assumes that none of the existing copper needs to be upgraded.
3.1.1 FTTC/VDSL
Under this technology option, we assume the deployment of an FTTC network using VDSL for the ‘last-mile’ connection. A high-level network topology is shown below in Figure 3.1.
Analysys Mason for Broadband Stakeholder Group
Ref: 12726-371

The costs of deploying fibre-based next-generation broadband infrastructure | 25
Local exchange Street cabinet Distribution point
Customer premises
To metro node and core network
FibreCopper
sub loop
A B C D E F
Segment A is shared between all cabinets …
… segment B is unique to each
cabinet
New cabinets required
Fibre backhaul installed
Basic CPEConnection/ migration costs
Local exchange Street cabinet Distribution point
Customer premises
To metro node and core network
FibreCopper
sub loop
A B C D E F
Segment A is shared between all cabinets …
… segment B is unique to each
cabinet
New cabinets required
Fibre backhaul installed
Basic CPEConnection/ migration costs
Figure 3.1: FTTC/VDSL network topology [Source: Analysys Mason for BSG]
The investments required for the FTTC/VDSL network are concentrated in four areas:
• new infrastructure and active equipment at the street cabinet • fibre backhaul between the cabinet and the exchange • additional investment at the exchange •
•
costs of migrating lines to new cabinets and in-home costs.
New infrastructure and active equipment at the street cabinet
Our modelling assumes that existing street cabinets are not suitable for the deployment of VDSL, largely due to the limited physical space within the cabinets.
Therefore, it is necessary to construct new street cabinets to house active equipment: mini-DSLAMs, or mini-MSANs. These are each assumed to support 24 customers,10 with a dedicated fibre backhaul for each. The unit costs of these are GBP1200 for a mini-DSLAM (which does not support voice services), and GBP1440 for a mini-MSAN (which does support voice services).
We have modelled three scenarios for the construction of new street cabinets:
• a single cabinet dedicated to one operator • a single cabinet able to host multiple operators
two cabinets, with each being dedicated to a single operator.
10 The model uses a statistical model to estimate the overall utilisation of the active equipment based upon the number of locations (i.e.
cabinets), active lines, and the number of ports. This statistical model is also used to calculate the number of units required for other equipment (both active and passive) used in each of the three technologies. The model applies these rules differently in the ‘b’ geotypes as they share the same exchanges as the ‘a’ geotypes. The definition of geotypes is described in detail in Section 3.2.
Analysys Mason for Broadband Stakeholder Group
Ref: 12726-371

The costs of deploying fibre-based next-generation broadband infrastructure | 26
Additionally there are two possibilities for the migration of lines to the new network:
• partial migration: only those requiring next-generation broadband services are migrated, similar to shared metallic path facility (SMPF) with only broadband services being migrated full migration: all lines are migrated, with voice services provisioned over the new network, similar to full MPF with voice and broadband services being migrated.
•
In the latter case it is assumed that cabinets will cost more as they will require additional infrastructure to provide the necessary resilience (e.g. battery back-up).
The assumed costs of new cabinets under these six scenarios are shown below in Figure 3.2.
Cabinet type Partial migration Full migration (incl. voice)
Single cabinet dedicated to a single operator
GBP9000 GBP11 000
Single cabinet shared between multiple operators
GBP13 500 GBP16 500
Two cabinets each dedicated to a single operator
GBP18 000 (total cost for two cabinets)
GBP22 000 (total cost for two cabinets)
Figure 3.2: Unit cost
assumptions for new
cabinets [Source:
Analysys Mason for
BSG]
The model assumes that the existing 90 000 BT street cabinets are supplemented by the deployment of an additional 24 000 new cabinets. These new cabinets are for lines that are served directly by exchanges, but are too long to be used for VDSL.11 These are likely to be predominantly located in the areas that are served by smaller exchanges, serving less than 1000 lines. Additional cabinets will be required so that active equipment can be placed sufficiently close to the customers to achieve high-speed broadband.
Fibre backhaul between the cabinet and the exchange
It is necessary to provide fibre connections to the street cabinet to allow for sufficient capacity to provide high-speed broadband to customers. There are three main sources of costs to provide fibre backhaul:
• new ducts (where existing ducts are unsuitable) • costs of fibre cables (materials) •
installation costs of fibre.
11 Even with the additional cabinets there will still be a significant number of lines that are directly connected from the exchange. For
these lines it will be necessary to locate the active equipment at the local exchange. It is likely that these lines will be able to use cheaper active equipment, however, the model has a conservative assumption that this active equipment has the same unit cost as the equipment actually located in a street cabinet.
Analysys Mason for Broadband Stakeholder Group
Ref: 12726-371

The costs of deploying fibre-based next-generation broadband infrastructure | 27
The model assumes that, if voice lines are also migrated, each cabinet contains several mini-DSLAMs or mini-MSANs, each of which is assumed to require its own dedicated fibre back to the exchange. The detailed assumptions for the three costs outlined above are presented in Annex A.
There is an alternative to the tree-based topology that has been assumed in Figure 3.1: a ring-based topology. This would involve shorter distances to connect all the street cabinets, but would not allow the re-use of as much existing infrastructure. A simple calculation indicates that in some areas the total distance of duct required under a ring topology may be 30% less than for a tree topology. However, as the tree topology has an assumed duct re-use of 80% (see Annex A for more details), we believe it is unlikely that the deployment of a ring topology would entail lower overall costs than a tree topology.
Additional investment at the exchange
The fibre backhaul from the cabinet is assumed to terminate on an optical distribution frame (ODF). Each ODF is assumed to support 50 fibres and cost GBP1000. An additional cost of GBP20 is included to connect each fibre.
Within the exchange, we assume that optical Ethernet switches are used to terminate the backhaul from the cabinet. Each switch is assumed to have five ports and to cost GBP5000.
Costs of migrating lines to new cabinets and in-home costs
Once the construction of a new cabinet is complete, the next stage is to migrate the lines. The model considers a scenario in which lines are migrated gradually as customers move to VDSL-based services (partial migration), and a second scenario where all lines (including voice-only lines) are migrated to the FTTC/VDSL network (full migration).
Under the full migration scenario, the unit cost per line is GBP20, and GBP50 under the scenario where there is a partial migration. These costs are lower than the current prices for similar activities from Openreach.
The model also includes an additional cost of GBP5 per line to allow for the provision of a new faceplate in the home.
Information from operators in other markets that offer a full suite of video services (including services in multiple rooms) suggest that there can be significant costs associated with installing the in-home elements of some retail services such as IPTV. Under the partial migration scenario, our model includes only the costs of providing a basic data service; under the full migration scenario, voice plus data are considered.
Analysys Mason for Broadband Stakeholder Group
Ref: 12726-371

The costs of deploying fibre-based next-generation broadband infrastructure | 28
3.1.2 FTTH/GPON
Under this technology option, we assume that an FTTH network is deployed using FTTH/GPON. A high-level network topology is shown below in Figure 3.3.
Under the full migration scenario, it may be possible to reduce the number of telephone exchanges by using technology such as long-range PON. Such technological developments have not been included in this work as the technology is still immature, and the viability of such products is subject to other commercial and regulatory considerations.
Local exchange Splitter at street cabinet
Splitter at distribution
point
Customer premises
To metro node and core network
Fibre
A B C D E F
Splitter: up to 8:1*Shared fibre
Basic CPE
OLT: typically 32 homes per port
Splitter GBP250up to 8:1*
Only installed when customers require a
connection
Fixed cost per building described as ‘vertical costs’, additional cost per home connected ‘horizontal costs’
*A single splitter can have a split of up to 8:1, but we would propose an overall split of 32:1 across both the cabinet and distribution point
Figure 3.3: FTTH/GPON network topology [Source: Analysys Mason for BSG]
The investments required for the FTTH/GPON network are concentrated in the following areas:
• fibre overbuild of the copper network • equipment at the telephone exchange • passive splitters • in-building wiring • customer premises equipment (CPE).
Fibre overbuild of the copper network
The existing copper network is ‘over built’ with the new fibre network. It is assumed that the network consists of the six segments shown in Figure 3.3, as outlined below:
A and B segments run from the exchange to the location of the street cabinet. It is assumed that there is only one A segment per exchange, and that there is one B segment per street cabinet.
•
Analysys Mason for Broadband Stakeholder Group
Ref: 12726-371

The costs of deploying fibre-based next-generation broadband infrastructure | 29
C and D segments run from the street cabinet to the location of the distribution point. It is assumed that there is only one C segment per street cabinet, and that there is one D segment per distribution point.
•
•
•
E and F segments run from the distribution point to the premises. It is assumed that there is only one E segment per distribution point, and that there is one F segment per premises.
In the case of blocks of flats, it is assumed that there is no E or F segment as the distribution point is at the entrance to the building and the in-building wiring costs replace the costs associated with E and F.
When connections are to houses, the final drop (segment F) will only be installed when customers connect. All other fibre will be installed upon the initial roll-out.
Within each segment there are costs relating to:
• new ducts (where existing ducts are unsuitable) • costs of fibre cables (materials)
installation costs of fibre.
Detailed assumptions relating to each of these are given in Annex A.
Equipment at the telephone exchange
An optical line terminator (OLT) is required in the exchange to terminate the fibre connection. It is assumed that there will be an average of 32 lines per fibre terminated at the exchange, with each OLT having 32 ports and costing GBP57 600.
The fibre is assumed to terminate on an ODF. Each of these is assumed to support 1440 fibres and cost GBP5000. An additional cost of GBP20 is included to connect each fibre.
Passive splitters
Passive splitters are installed in the access network at the location where street cabinets and distribution points are currently located. These splitters are capable of an 8:1 split, though on average they will conduct a 32:1 split across two splitters (i.e. they are not fully utilised). Each splitter is assumed to cost GBP70.
The network topology shown above (two splits giving a total of 32:1) is only one possible topology. Other topologies could be deployed, including a single split of 32:1 (probably in between the location of current cabinets and distribution points), or larger splits of up to 128:1. We believe that the topology modelled is a reasonably likely topology, and that if another approach was to be taken it would not have a material impact upon the total deployment costs.
Analysys Mason for Broadband Stakeholder Group
Ref: 12726-371

The costs of deploying fibre-based next-generation broadband infrastructure | 30
In-building wiring
Within a block of flats/offices, in-building wiring will be required. These costs are split in two components:
• vertical costs – which cover the costs of installing fibre in vertical risers and an equipment room (e.g. in the basement); all of these costs are incurred during the initial fibre build horizontal costs – which cover the cost of connecting individual flats/offices; these costs are incurred as individual flats/offices are connected.
•
The costs of vertical wiring are dependent upon the size of a block of flats/offices, as shown below:
Number of premises Vertical cost per building
5 or less GBP1500
10 GBP1700
15 GBP1800
20 GBP2000
50 GBP2250
100 GBP2700
Figure 3.4: Assumptions
for costs of vertical in-
building wiring [Source:
Analysys Mason for
BSG]
The model assumes that the average size of a building varies by geotype. The assumptions for the number of premises in flats, and the average building size by geotype is shown below12:
Geotype Fraction of homes in flats
Average homes per block of flats
Inner London 45% 8.5
>500k pop 16% 6.3
>200k pop 15% 5.7
>20k lines (a) 15% 5.4
>20k lines (b) 7% 5.1
>10k lines (a) 10% 5.2
>10k lines (b) 5% 4.9
>3k lines (a) 8% 4.9
>3k lines (b) 4% 4.7
>1k lines (a) 4% 4.6
>1k lines (b) 2% 5.1
<1k lines (a) 2% 3.8
<1k lines (b) 1% 4.4
National 11% 5.8
Figure 3.5:
Assumptions for
homes in flats
[Source: Analysys
Mason for BSG]
12 More information on the definition of geotypes is provided in Section 3.2
Analysys Mason for Broadband Stakeholder Group
Ref: 12726-371

The costs of deploying fibre-based next-generation broadband infrastructure | 31
The horizontal costs for in-building wiring are assumed to be GBP100 for each premises connected.
CPE
The deployment of FTTH/GPON will require specialised terminating equipment at the customer premises. These are assumed to cost GBP80 under the partial migration scenario, and GBP200 under the full migration scenario. The additional costs are for resiliency features such as battery back-up.
As mentioned previously, information from operators in other markets that offer a full suite of video services (including services in multiple rooms) suggest that there can be significant costs associated with installing the in-home elements of some retail services such as IPTV. Under the partial migration scenario, our model includes only the costs of providing a basic data service; under the full migration scenario, voice plus data are considered.
3.1.3 FTTH/PTP
Under this technology option, we assume that an FTTH network is deployed using PTP Ethernet. A high-level network topology is shown below in Figure 3.6.
Local exchange Customer premises
To metro node and core network
Fibre
A B C D E FBasic CPE
Only installed when customers require a
connection
Fixed cost per building described as ‘vertical costs’, additional cost per home connected ‘horizontal costs’
Single fibreper home
Ethernet switch, one port per home
Figure 3.6: FTTH/PTP network topology [Source: Analysys Mason for BSG]
The investments required for the FTTH/PTP network are concentrated in the following areas:
• fibre overbuild of the copper network • equipment at the telephone exchange • in-building wiring • CPE.
Analysys Mason for Broadband Stakeholder Group
Ref: 12726-371

The costs of deploying fibre-based next-generation broadband infrastructure | 32
Fibre overbuild of the copper network
FTTH/PTP uses a similar architecture to FTTH/GPON. However, a fibre is required for each premise, leading to increased costs due to both more fibre and a lower re-use of existing ducts (resulting from the additional space requirements for more fibre).
Detailed assumptions relating to each of these are given in Annex A.
Equipment at the telephone exchange
An optical Ethernet switch is required in the exchange to terminate the fibre connections. It is assumed that each of these switches has 48 ports and costs GBP5000.
The fibre is assumed to terminate on an ODF. Each ODF is assumed to support 1440 fibres and cost GBP5000. An additional cost of GBP20 is included to connect each fibre.
In-building wiring
The same assumptions apply as for FTTH/GPON, as outlined in Section 0.
CPE
The deployment of FTTH/PTP will require specialised terminating equipment at the customer premises. These are assumed to cost GBP35 under the partial migration scenario, and GBP135 under the full migration scenario. The additional costs are for resiliency features such as battery back-up.
As mentioned previously, information from operators in other markets that offer a full suite of video services (including services in multiple rooms) suggest that there can be significant costs associated with installing the in-home elements of some retail services such as IPTV. Under the partial migration scenario, our model includes only the costs of providing a basic data service; under the full migration scenario, voice plus data are considered.
3.1.4 Alternative infrastructure scenarios
The main scenarios outlined above are based upon the assumption that that it will be possible for BT’s existing infrastructure to be largely re-used. We believe that this is a reasonable base case and that it is likely to minimise the costs of deployment. However, we will also consider the impact on the costs for each of the three technologies of other duct-based infrastructure (e.g. Virgin Media, or sewers) being available for fibre deployment.
Analysys Mason for Broadband Stakeholder Group
Ref: 12726-371

The costs of deploying fibre-based next-generation broadband infrastructure | 33
We would propose to use the following methodology for these scenarios. Results for these scenarios will be presented in the next set of results.
Use of Virgin Media’s network
Virgin Media’s network already includes fibre deployed to its street cabinets. This fibre could be re-used for an FTTC or FTTH network. For the case of an FTTC/VDSL network, we believe that the number – and in many cases the location – of sites with Virgin Media cabinets is broadly similar to that for BT cabinets, and they are predominantly co-located. However, we have assumed that it would not be practical to use Virgin Media’s copper connections into the premises. This is because final-drop connections are not present for all premises passed, and we believe that the additional costs of connecting new premises to the Virgin Media network would not offset the savings in fibre deployment costs.
Thus, for both the FTTC and FTTH scenarios in which Virgin Media’s network is available for use, we assume that it would be possible to provide much of the fibre to the location of the street cabinet without significant investments, it would then be necessary to construct new ducts that would link Virgin Media’s ducts to BT’s network. The model therefore assumes that a 90% saving could be achieved on the costs of constructing new ducts to the location of the street cabinet for both FTTC and FTTH scenarios. For the sections of the network between the street cabinet and the distribution point we have also assumed a 15% reduction in the costs of new ducts. Both of these savings are only applicable in the areas covered by the Virgin Media network.
Use of other utility duct networks
There is considerable interest in re-using other duct networks (such as sewers) for fibre-based networks. However, it is unclear how close to the premises such infrastructure can be used.
We have assumed that these networks can be used to provide connection up to the street cabinet in a large proportion of cases, between the street cabinet and the distribution point in a smaller proportion of cases, and not at all between the distribution point and the premises. As with the Virgin Media scenario, it may be that additional ducts must be constructed that will allow alternative networks and existing networks to interconnect.
Analysys Mason for Broadband Stakeholder Group
Ref: 12726-371

The costs of deploying fibre-based next-generation broadband infrastructure | 34
We have used the following assumptions for the reduction in civil costs for ducts in this scenario:
Geotype Reduction in build for A+B segments
Reduction in build for C+D segments
Reduction in build for E+F segments
Inner London 80% 50% 0%
>500k pop 80% 50% 0%
>200k pop 80% 50% 0%
>20k lines (a) 80% 50% 0%
>20k lines (b) 72% 45% 0%
>10k lines (a) 80% 50% 0%
>10k lines (b) 68% 43% 0%
>3k lines (a) 80% 50% 0%
>3k lines (b) 64% 40% 0%
>1k lines (a) 80% 50% 0%
>1k lines (b) 60% 38% 0%
<1k lines (a) 80% 50% 0%
<1k lines (b) 56% 35% 0%
Figure 3.7: Assumptions for reduction in costs for new ducts if utility ducts are re-used [Source:
Analysys Mason for BSG]
It can be seen that the impact of utility networks is assumed to be reduced in the more rural geotypes as we believe that utility duct networks are less widely available in the more rural geotypes. The utility networks would only be able to provide space in existing ducts, so fibre will still need to be installed. Therefore the costs for fibre cables and installation are assumed to remain unchanged from the base case.
3.2 Geotype approach
For the purpose of modelling the deployment costs of next-generation broadband, we have categorised UK households into 13 ‘geotypes’. This section explains the rationale behind the choices of geotypes to be modelled, and provides a summary of their characteristics.
3.2.1 Primary dimensions for geotypes
It is important that geotypes be defined on the basis of parameters that affect the cost of rolling out a next-generation broadband access network in order for the differences in costs between different area types to be identified. These parameters are typically related to the distribution of population or the topology of the existing broadband supply network. A list of possible geotype parameters is given in the figure below.
Analysys Mason for Broadband Stakeholder Group
Ref: 12726-371

The costs of deploying fibre-based next-generation broadband infrastructure | 35
Parameter Importance Drawbacks Data sources
Population density Potentially correlated to cabinet size, and the length of fibre for FTTH
Takes no account of clustering in rural areas
Analysys Mason holds population and area data for 8877 postal sectors in the UK
Town size Gives an indication of deployment priority; a dimension to which stakeholders can relate
Difficult to define the boundary of towns based on postcodes
Many sources for large cities, poor data for smaller areas such as towns
Line length Affects dig costs; takes account of clustering
Large data set to compute Analysys Mason holds the location of 1 700 000 post-points and the BT exchanges, which can be used to calculate line lengths
Exchange size Linked to the size of the town in smaller areas
Brings little insight to larger areas as exchanges are at ‘max practical size’
Analysys Mason can obtain approximate lines per exchange from mapping analysis or from www.samknows.com
Figure 3.8: Geotype parameter options [Source: Analysys Mason for BSG]
3.2.2 Geotype approach used
We have chosen to use a combination of three parameters to define the geotypes: town size, exchange size and line length.
The exchanges of highly populated areas, such as major urban areas, were segmented first. It is likely that these areas will have the lowest costs of deployment, and will be the first to receive next-generation broadband services during a roll-out. As such, they have been identified separately from the rest of the country. The exchange areas that cover these large urban areas were identified manually.
The rest of the country was divided into areas that could be categorised as belonging to one of 13 geotypes based on the size of the exchange, and the distance of each premises from the exchange.13 Exchange size has been used as it is related to both the size and population density of settlements.
Exchanges tend to cover the central core of a settlement, and wider areas of sparse settlements. To reflect this, we have defined a sub-division into ‘a’ and ‘b’ geotypes (based on distance from exchange) in those geotypes that are primarily based on the number of lines per exchange. This concept is illustrated in the figure below.
13 Royal Mail delivery points (1.7 million in total) have been used as the base data for where households and businesses are located in
the UK. We have aggregated the delivery points on an exchange-level basis: each exchange area or portion of exchange area was assigned a geotype, and the delivery points within that area were captured within that geotype. We performed an initial piece of geo-analysis to ensure each delivery point was assigned to its serving exchange. We have assumed that each delivery point has one telephone line.
Analysys Mason for Broadband Stakeholder Group
Ref: 12726-371

The costs of deploying fibre-based next-generation broadband infrastructure | 36
Geotype ‘a’ Geotype ‘b’Ex
chan
ge
Cab
inet
Figure 3.9: Different
geotypes within an
exchange area [Source:
Analysys Mason for
BSG]
The distance between the central cluster, and the outer sparse region was chosen by examining typical exchanges on a map. This is explained in more detail in the following sections.
The following sections provide more details on the approach we have used to assign geotypes to exchanges.
City geotypes
The first three geotypes were assigned to exchange areas covering the urban extent of Inner London, major cities (>500 000 population) and cities (>200 000 population) respectively. Inner London exchange areas were broadly defined as those areas enclosed by the North and South Circular ring roads. Delivery points within these areas were each assigned to the Inner London geotype. The exchange areas included in the Inner London geotype are shown in the figure below.
The North Circular defines the northern
extent of inner London…
Exchange areas in geotype 1 are shown in blue
… and the South Circular defines the
southern extent
Exchange boundaries are shown in black
The North Circular defines the northern
extent of inner London…
Exchange areas in geotype 1 are shown in blue
… and the South Circular defines the
southern extent
Exchange boundaries are shown in black
Figure 3.10: Inner
London geotype
exchange areas [Source:
Analysys Mason
Analysys Mason for Broadband Stakeholder Group
Ref: 12726-371

The costs of deploying fibre-based next-generation broadband infrastructure | 37
UK major cities (>500k pop.) and cities (>200k pop.) were also allocated to geotypes by comparing the exchange boundaries with maps of urban areas. Summaries of the urban areas included as major cities and cities are given in the tables below.
Major city
Bristol Sheffield
Glasgow Newcastle
Manchester Birmingham
Liverpool Leeds
Figure 3.11: Major cities
assigned to >500k pop.
geotype [Source:
Analysys Mason for
BSG]
Nottingham
City
Aberdeen Cardiff Luton Southampton
Aldershot Coventry Northampton Southend
Belfast Barnsley Norwich Swansea
Birkenhead Derby Plymouth Middlesbrough
Figure 3.12: Cities
assigned to >200k pop.
geotype [Source:
Analysys Mason for
BSG]
Blackpool Edinburgh Portsmouth Gillingham Bournemouth Kingston Preston Stoke-on-Trent Brighton Leicester Reading
Major cities and cities were allocated to geotypes by comparing the extent of the main urban area (guided by breaks in the urban sprawl and any ring road) against exchange boundaries. We first overlaid the exchange areas on a map showing major road routes and urban areas.
Analysys Mason for Broadband Stakeholder Group
Ref: 12726-371

The costs of deploying fibre-based next-generation broadband infrastructure | 38
Urban areas are shown in
grey
Exchange boundaries are in black
Urban areas are shown in
grey
Exchange boundaries are in black
Figure 3.13: Manchester
urban area with
exchange boundaries
[Source: Analysys
Mason for BSG]
We then manually selected the exchange areas that could be included in the urban area using the map underneath as a guide. This is shown in the figure below.
The ring-road provides a
natural boundary
Exchange areas in Major Cities geotype
are shown in blue
Some major towns would be included in a ‘Manchester’
deployment
Figure 3.14: Manchester
urban area with >500k
pop. geotype exchange
areas [Source: Analysys
Mason for BSG]
This process was repeated for all major cities and cities.
Analysys Mason for Broadband Stakeholder Group
Ref: 12726-371

The costs of deploying fibre-based next-generation broadband infrastructure | 39
Other geotypes
Exchange areas outside cities were allocated to geotypes according to the size of the exchange. Within each exchange area, varying levels of clustering are seen and it is important to capture this effect. In order to separately capture clustered and further-out premises, we needed to calculate the distance from each delivery point to its serving exchange.
Analysys Mason used the location of every delivery point and every telephone exchange. Using these two data sets, it was possible to calculate the straight-line distance from each delivery point to the exchange.14 Distances will be factored before use in the wider cost model analysis to account for real line lengths being significantly longer than the straight-line distance.
Having derived data on the distances between the delivery point and the exchange, we next defined the criteria to divide premises into the clustered ‘a’ geotype or the more remote ‘b’ geotype. These distance criteria were defined by comparing the extent of urban areas within a selection of exchanges to judge an appropriate cut-off. The selection of exchange areas was chosen to compare a range of exchange sizes within the geotype. An example of an exchange area for a medium-sized town, with a boundary between ‘a’ and ‘b’ geotypes of 2km, is shown below.
Exchange area boundary shown
in black
Exchange location
Boundary of ‘a’ ‘b’ (2km from
exchange)
Figure 3.15: Stowmarket
exchange location and
boundary (10 167 lines)
[Source: Analysys
Mason for BSG]
Reproduced from the
Ordnance Survey
mapping with the
permission of the
Controller of Her
Majesty's Stationery
Office © Crown copyright
We reduced the distance criteria in smaller settlements to 1km as clustering becomes more concentrated. An example of a smaller exchange that was classified to the geotype with the smallest number of lines is given in the figure below.
14 This was carried out by undertaking a simple analysis using national grid co-ordinates and did not take into account the curvature of
the earth, changes in height along the direct route, or the presence of water. The analysis ensured that distances were based upon the distance to the serving exchange, not the closest exchange.
Analysys Mason for Broadband Stakeholder Group
Ref: 12726-371

The costs of deploying fibre-based next-generation broadband infrastructure | 40
Population further out are included in ‘b’
Clustering around exchange
included in ‘a’Boundary of ‘a’ ‘b’
geotypes (1km from exchange)
Figure 3.16: Embleton
exchange location and
boundary (850 lines)
[Source: Analysys
Mason for BSG]
Reproduced from the
Ordnance Survey
mapping with the
permission of the
Controller of Her
Majesty's Stationery
Office © Crown copyright
Geotype grouping
Our analysis has shown that within the 13 geotypes examined, there are three broad groupings of geotypes with similar characteristics and costs. The 13 geotypes have therefore been aggregated into three main types of area for FTTC and FTTH technologies respectively. These areas are shown in Section 4.1.1, and are labelled as AFTTC/AFTTH, BFTTC/BFTTH and CFTTC/CFTTH (corresponding to urban, rural, and remote areas).
3.2.3 Summary of geotypes
The map below shows exchange areas that have been colour-coded according to geotype. The ‘a’ and ‘b’ geotypes have been grouped together as the ‘a’ geotypes are not easily observable at this scale.
Analysys Mason for Broadband Stakeholder Group
Ref: 12726-371

The costs of deploying fibre-based next-generation broadband infrastructure | 41
London>500k pop.>200k pop.>20k lines>10k lines>3k lines>1k lines<1k lines
Figure 3.17: UK
exchange areas by
geotype [Source:
Analysys Mason for
BSG]
A summary of the results by geotype is given in the table below. We have achieved an even spread of premises through careful adjustment of the geotype parameters. This is important to ensure that the costs of deployment can be considered on a gradual basis.
Analysys Mason for Broadband Stakeholder Group
Ref: 12726-371

The costs of deploying fibre-based next-generation broadband infrastructure | 42
Geotype Classification criteria (distances are straight line)
Total number of premises (domestic +
business)
Avg straight-line distance
from exchange to premises (m)
% of total area
Premises density (per sq.
km)
Inner London Inner London 1 445 789 969 0.2% 3641
>500k pop Major city (pop = 500k+) 3 164 456 1391 1.0% 1282
>200k pop City (pop = 200k+) 2 794 786 1410 1.1% 1016
>20k lines (a) >20k lines, <2km from exchange 2 853 914 1174 0.9% 1360
>20k lines (b) >20 000 lines, >2km from exchange 1 744 926 3364 1.6% 453
>10k lines (a) >10 000 lines, <2km from exchange 4 355 457 1095 2.1% 854
>10k lines (b) >10 000 lines, >2km from exchange 1 553 331 2785 3.4% 190
>3k lines (a) >3000 lines, <1km from exchange 2 759 317 574 1.3% 876
>3k lines (b) >3000 lines, >1km from exchange 3 190 774 3362 14.2% 93
>1k lines (a) >1000 lines, <1km from exchange 1 102 702 487 1.6% 285
>1k lines (b) >1000 lines >1km from exchange 1 149 607 2850 20.8% 23
<1k lines (a) <1000 lines, <1km from exchange 438 430 405 3.0% 61
<1k lines (b) <1000 lines >1km from exchange 702 971 2971 48.9% 6
27 256 460 100%
Figure 3.18: Geotype summary [Source: Analysys Mason for BSG]
The spread of premises across many of the geotypes is relatively even, with the ‘>10k lines (a)’ geotype containing the most premises. The average density of premises decreases with the geotypes, with Inner London being significantly higher than any other. Geotype <1k lines (b) is the most sparsely populated with only 702 971 of premises, but 48.9% of the total land area. There are significant differences between geotypes, with clustered ‘a’ areas being much denser than the farther out ‘b’ areas. It can be seen that, as expected, average straight-line lengths are much higher in ‘b’ geotypes, with most at around 3km.
The key characteristics of the existing BT network are shown for each geotype below. It is worth noting that we have not allocated any cabinets to the geotypes with exchanges with less than 1000 lines as we have assumed that all of the lines in these areas are directly connected to the exchange.
Analysys Mason for Broadband Stakeholder Group
Ref: 12726-371

The costs of deploying fibre-based next-generation broadband infrastructure | 43
Geotype Exchanges Avg. lines per
exchange
Cabinets Avg. lines per cabinet
Distribution points
Avg. lines per DP
Avg line length
(km)
Inner London 86 16 812 2892 500 172 118 8.4 1.24
>500k pop 204 15 512 6329 500 376 721 8.4 1.78
>200k pop 180 15 527 5590 500 332 713 8.4 1.80
>20k lines (a) 167 17 089 6008 475 365 886 7.8 1.50
>20k lines (b) 167 10 449 4362 400 223 708 7.8 4.83
>10k lines (a) 406 10 728 9679 450 604 925 7.2 1.40
>10k lines (b) 406 3826 4142 375 215 740 7.2 4.00
>3k lines (a) 1003 2751 13 455 205 493 569 5.6 0.73
>3k lines (b) 1003 3181 22 227 144 570 745 5.6 4.83
>1k lines (a) 1230 897 5974 185 246 555 4.5 0.62
>1k lines (b) 1230 935 9343 123 257 043 4.5 4.09
<1k lines (a) 2302 190 0 0 130 706 3.4 0.52
<1k lines (b) 2302 305 0 0 209 571 3.4 4.26
National 5578 4886 90 000 303 4 200 000 6.5 2.33
Figure 3.19: Existing BT network by geotype [Source: Analysys Mason for BSG]
When the FTTC/VDSL network is deployed, we have assumed that additional cabinets will be required in the final two geotypes, with 8000 and 16 000 being deployed respectively.
The number of cabinets and distribution points in each geotype has been estimated. The national totals have been calibrated to match data from BT.
An assumed split of the line length into the six network segments (as defined in Figure 3.1) is show in Annex A. This is based upon a calculation that uses the table above to obtain the proportion of distance in each segment (i.e. more cabinets lead to shorter segments beyond the cabinet as each cabinet will then serve a smaller area).
Analysys Mason for Broadband Stakeholder Group
Ref: 12726-371

The costs of deploying fibre-based next-generation broadband infrastructure | 44
4 Cost model results
This section is split into three sub-sections:
Section 4.1 looks in detail at the results for the base case to identify the main drivers of the overall costs, and how they vary by geotype.
•
•
•
•
•
•
•
Section 4.2 considers how the overall costs vary under different scenarios. Assumptions that are considered include the scale of migration, number of street cabinets at each location, duct re-use, and the availability of alternative infrastructures.
Section 4.3 outlines the potential changes to the operating costs of next-generation broadband networks, along with the assumptions that underpin the results.
4.1 Base case
A detailed breakdown of results for the base case is presented in this section. The base case has the following common assumptions:
• migration of only broadband customers to the next-generation broadband access network FTTC/VDSL being provisioned from a single cabinet shared between operators.
The overall take-up rate of 31% of all lines nationally is based upon the following assumptions:
Broadband penetration is 80%.
The national market share of cable broadband is constant (~21%). We have estimated the cable market share in each geotype based upon the coverage by geotype. There is at least some coverage from cable in approximately 60% of postcode areas (though the actual number of premises passed is closer to 45% as not all premises within a covered postcode will be able to access cable services). Within the wider coverage areas, this corresponds to a market share of around 35%.
Of the remaining broadband lines, 50% are provisioned on the FTTC/FTTH network, with the remaining broadband lines on the existing copper-based network.
Analysys Mason for Broadband Stakeholder Group
Ref: 12726-371

The costs of deploying fibre-based next-generation broadband infrastructure | 45
The mix of lines by geotype is illustrated below:
28% 27% 28% 29% 30% 30% 32% 35% 35% 38% 38% 39% 39%31%
28% 27% 28% 29% 30% 30% 32%35% 35%
38% 38% 39% 39%
31%
24% 26% 24% 23% 19% 20% 16% 11% 11%3% 4% 2% 2%
17%
20% 20% 20% 20% 20% 20% 20% 20% 20% 20% 20% 20% 20% 20%
0%
10%
20%
30%
40%
50%
60%
70%
80%
90%
100%
Lond
on
>500
k pop
>200
k pop
>20k
lines
(a)
>20k
lines
(b)
>10k
lines
(a)
>10k
lines
(b)
>3k l
ines (
a)
>3k lin
es (b
)
>1k l
ines (
a)
>1k l
ines (
b)
<1k l
ines (
a)
<1k lin
es (b
)
Nation
al
Mix
of l
ines
by
type
FTTC/FTTH ADSL Cable No broadband
Figure 4.1: Mix of lines in the base case [Source: Analysys Mason for BSG]
Analysys Mason for Broadband Stakeholder Group
Ref: 12726-371

The costs of deploying fibre-based next-generation broadband infrastructure | 46
4.1.1 Cost per premises connected
The cost per premises connected for FTTC/VDSL is shown in the figure below. The costs are broken down into the ODF in the exchange (including the cost of connecting the fibres), the cabinet, the active equipment inside the cabinet, fibre (and duct), the cost of migrating the line and a small home wiring cost. The first four cost categories are all particularly significant, with the fibre and duct, and cabinet costs, being largest in the more rural geotypes. As would be expected, it is less expensive to connect premises in dense urban areas than in more sparsely populated rural areas. This effect is also seen across ‘a’ and ‘b’ geotypes: premises in ‘a’ geotypes are consistently cheaper to connect than in the corresponding ‘b’ geotype. The lowest-cost geotypes to connect are Inner London and ‘>10k lines (a)’, each at around GBP380 per premises connected. The ‘>10k lines (a)’ geotype is less densely populated than some of the other geotypes, and also has relatively low coverage by Virgin Media’s network; this to this leads to a higher overall take-up of next-generation broadband services on FTTC/FTTH networks in this geotype, which in turn leads to a relatively low cost per premises connected.
-
200
400
600
800
1,000
1,200
1,400
1,600
1,800
2,000
Lond
on
>500
k pop
>200
k pop
>20k
lines
(a)
>20k
lines
(b)
>10k l
ines (
a)
>10k
lines
(b)
>3k l
ines (
a)
>3k l
ines (
b)
>1k l
ines (
a)
>1k l
ines (
b)
<1k l
ines (
a)
<1k l
ines (
b)
Nation
alDep
loym
ent c
osts
per
pre
mis
es c
onne
cted
(GB
P)...
Optical distribution frame Cabinet Active equipment Civils Line migration In-home
Figure 4.2: Breakdown of FTTC/VDSL costs per premises connected [Source: Analysys Mason for
BSG]
Analysys Mason for Broadband Stakeholder Group
Ref: 12726-371

The costs of deploying fibre-based next-generation broadband infrastructure | 47
The cost per premises connected for FTTH/GPON is shown in the figure below. The cost of a nationwide deployment of FTTH/GPON (GBP2859 per premises) is around five times higher than for FTTC/VDSL (GBP591). The other noticeable difference is the increased dominance of fibre (and duct) costs in the breakdown. These costs make up over 80% of total costs on a national level. The differences between high- and low-density areas follow a similar pattern to those in FTTC, although the difference between ‘a’ and ‘b’ types is more pronounced. As so much of the cost is taken up with laying fibre, line length becomes critical in determining the cost of connecting a premises: the cost of connecting a premises in the ‘<1k lines (b)’ geotype is around GBP10 300.
-
2,000
4,000
6,000
8,000
10,000
12,000
Lond
on
>500
k pop
>200
k pop
>20k
lines
(a)
>20k
lines
(b)
>10k
lines
(a)
>10k
lines
(b)
>3k l
ines (
a)
>3k lin
es (b
)
>1k l
ines (
a)
>1k l
ines (
b)
<1k l
ines (
a)
<1k l
ines (
b)
Nation
al
Dep
loym
ent c
osts
per
pre
mis
es c
onne
cted
(GB
P)...
Optical distribution frame Active equipment + splitters Civils (exc. final drop)Civils (final drop) In-building wiring (exc. final drop) CPE
Figure 4.3: Breakdown of FTTH/GPON costs per premises connected [Source: Analysys Mason for
BSG]
Analysys Mason for Broadband Stakeholder Group
Ref: 12726-371

The costs of deploying fibre-based next-generation broadband infrastructure | 48
The cost per premises connected for FTTH/PTP is shown in Figure 4.4 below. The costs are higher than for FTTH/GPON across all geotypes. This is driven in part by increased fibre-cable costs (due to each premises requiring its own fibre), but mostly due to the fact that the proportion of ducts that can be re-used has decreased, leading to more new ducts to accommodate the increased size of the fibre-optic cables.
-
2,000
4,000
6,000
8,000
10,000
12,000
14,000
Lond
on
>500
k pop
>200
k pop
>20k
lines
(a)
>20k
lines
(b)
>10k
lines
(a)
>10k
lines
(b)
>3k l
ines (
a)
>3k lin
es (b
)
>1k l
ines (
a)
>1k l
ines (
b)
<1k l
ines (
a)
<1k l
ines (
b)
Nation
al
Dep
loym
ent c
osts
per
pre
mis
es c
onne
cted
(GB
P)...
Optical distribution frame Active equipment + splitters Civils (exc. final drop)Civils (final drop) In-building wiring (exc. final drop) CPE
Figure 4.4: Breakdown of FTTH/PTP costs per premises connected [Source: Analysys Mason for
BSG]
Analysys Mason for Broadband Stakeholder Group
Ref: 12726-371

The costs of deploying fibre-based next-generation broadband infrastructure | 49
4.1.2 Cost versus percentage of population
The total cost for deploying each technology, plotted against cumulative population coverage, is shown in the charts below (ordered from least to most expensive geotype). It can be seen in the above figure that the gradient of costs per premises is constant until around 58% of population, at which point it increases slightly. At 84% population coverage the costs increase again, and there is a significant increase in costs to cover the final few percentages of the population.
The different geotypes have been aggregated in to three different areas: AFTTC, BFTTC and CFTTC15.
As can be seen from the chart below these correspond to larger areas where the deployment costs of FTTC/VDSL are broadly the same.
-
1.0
2.0
3.0
4.0
5.0
6.0
0% 10% 20% 30% 40% 50% 60% 70% 80% 90% 100%Cumulative population
Dep
loym
ent c
osts
(GB
P b
illio
ns)...
FTTC/VDSL
AFTTC BFTTC CFTTC
Figure 4.5: Total cost vs. percentage population for FTTC/VDSL [Source: Analysys Mason for BSG]
15 The AFTTC areas include the geotypes: London, >500k pop, >200k pop, >20k lines (a), >10k lines (a), and >1k lines (a). The BFTTC
areas include the geotypes: >20k lines (b), >10k lines (b), >3k lines, (a) and >1k lines (b). The CFTTC areas include the >3k lines (b), <1k lines (a) and <1k lines (b) geotypes.
Analysys Mason for Broadband Stakeholder Group
Ref: 12726-371

The costs of deploying fibre-based next-generation broadband infrastructure | 50
The curve for FTTH shows a similar trend to FTTC/VDSL. In a similar manner to the results for FTTC/VDSL the FTTH results have also been aggregated in to three areas: AFTTH, BFTTH, and CFTTH
16 that represent larger areas with broadly similar deployment costs. Section 5.2 has additional analysis of the costs in the three areas outlined above.
-
5
10
15
20
25
30
35
0% 10% 20% 30% 40% 50% 60% 70% 80% 90% 100%Cumulative population
Dep
loym
ent c
osts
(GB
P b
illio
ns)...
FTTH/GPON FTTH/PTP
AFTTH BFTTH CFTTH
Figure 4.6: Total cost vs. percentage population for FTTH [Source: Analysys Mason for BSG]
16 The AFTTH areas include the geotypes: London, >500k pop, >200k pop, >20k lines (a), >10k lines (a), >3k lines (a) and >1k lines (a).
The BFTTH areas include the geotypes: >20k lines (b), >10k lines (b), >3k lines (b) and <1k lines (a). The CFTTH areas include the >1k lines (b) and <1k lines (b) geotypes.
Analysys Mason for Broadband Stakeholder Group
Ref: 12726-371

The costs of deploying fibre-based next-generation broadband infrastructure | 51
4.1.3 Total cost by technology
The total costs for connecting 100% of the population using each technology are shown in Figure 4.7 below. Deployment costs for FTTC/VDSL is dominated by fibre and cabinet costs. Again, it can be seen that both types of FTTH are dominated by the costs of civil works17, which also represent the area of greatest difference between the two: The key differences between the two FTTH technologies are in the costs of civil works.
-
5
10
15
20
25
30
35
FTTC/VDSL FTTH/GPON FTTH/PTP
Dep
loym
ent c
osts
(GB
P b
illio
ns)...
Optical distribution frame Cabinet Active equipment + splitters Line migrationCivils (exc. final drop) Civils (final drop) In-home / in-building CPE
Figure 4.7: Costs for nationwide coverage of each technology [Source: Analysys Mason for BSG]
4.1.4 Fixed and variable costs
Figure 4.2 to Figure 4.4 presented the total costs per premises passed (i.e. total cost divided by the total number of premises). It is also valuable to explore the breakdown of deployment costs in terms of fixed costs (per premises passed) and variable costs (per premises connected).
If this definition is used, the total cost for nationwide deployment is calculated as follows:
total_cost = ( fixed_cost_per_ premises_passed × total_ premises_passed ) + ( variable_cost_per_ premises_connected × total_ premises_connected )
17 Civil works include the costs of ducts, fibre-optic cables and installation.
Analysys Mason for Broadband Stakeholder Group
Ref: 12726-371

The costs of deploying fibre-based next-generation broadband infrastructure | 52
Fixed and variable costs for FTTC
For FTTC/VDSL, the following can be considered as fixed costs associated with providing next-generation broadband infrastructure to (or ‘passing’) a given area:
• cabinets costs for upgrading each cabinet so that mini-DSLAMs can then be installed • civil works and fibre costs for providing a high-speed connection to each street cabinet
ODF which is used to terminate the fibres from the street cabinet. •
•
The other costs detailed below can be considered as variable costs associated with the provision of next-generation broadband services to each premises connected:
• active equipment which is deployed only for connected lines • line migration
home wiring.
Figure 4.8 below shows the fixed costs of passing a premises and the variable costs of connecting a premises Splitting the total costs into these two categories are both in.
-
100
200
300
400
500
600
700
Lond
on
>500
k pop
>200
k pop
>20k
lines
(a)
>20k
lines
(b)
>10k
lines
(a)
>10k
lines
(b)
>3k l
ines (
a)
>3k l
ines (
b)
>1k l
ines (
a)
>1k l
ines (
b)
<1k l
ines (
a)
<1k l
ines (
b)
Nation
al
Dep
loym
ent c
osts
per
pre
mis
es (G
BP
)...
Fixed costs per premises passed Variable costs per premises connected
Figure 4.8: Comparison of the fixed costs per premises passed and the variable costs per premises
connected for FTTC/VDSL [Source: Analysys Mason for BSG]
Analysys Mason for Broadband Stakeholder Group
Ref: 12726-371

The costs of deploying fibre-based next-generation broadband infrastructure | 53
Figure 4.8 above shows that the cost to connect a premises does not vary significantly by geotype.18 In contrast, the cost to pass a premises varies significantly by geotype as the average size of cabinets and the distance of fibre required differs.
Fixed and variable costs for FTTH
Similarly for the two variants of FTTH, the following costs are essentially fixed irrespective of take-up:
• fibre (excl. final drop) in-building wiring (excl. final drop). •
The other cost categories for FTTH are variable with take-up. Figure 4.9 and Figure 4.10 below show the fixed costs per premises passed and the variable costs per premises connected for FTTH/GPON and FTTH/PTP.
-
500
1,000
1,500
2,000
2,500
3,000
3,500
Lond
on
>500
k pop
>200
k pop
>20k
lines
(a)
>20k
lines
(b)
>10k l
ines (
a)
>10k
lines
(b)
>3k l
ines (
a)
>3k l
ines (
b)
>1k l
ines (
a)
>1k l
ines (
b)
<1k l
ines (
a)
<1k l
ines (
b)
Nation
al
Dep
loym
ent c
osts
per
pre
mis
es (G
BP
)...
Fixed costs per premises passed Variable costs per premises connected
Figure 4.9: Fixed costs per premises passed and variable costs per premises connected for
FTTH/GPON [Source: Analysys Mason for BSG]
18 The variation in costs per premises connected arises from different utilisation rates of active equipment in the street cabinet. For
example, the geotype <1k lines (a) has street cabinets with an average of around 21 lines per cabinet. These are assumed to be provisioned on 24 port mini-DSLAMs at an average port utilisation of 64%. In contrast, in the London geotype the larger street cabinets mean that the active equipment has a port utilisation of over 90%.
Analysys Mason for Broadband Stakeholder Group
Ref: 12726-371

The costs of deploying fibre-based next-generation broadband infrastructure | 54
-
500
1,000
1,500
2,000
2,500
3,000
3,500
4,000
4,500
Lond
on
>500
k pop
>200
k pop
>20k
lines
(a)
>20k
lines
(b)
>10k l
ines (
a)
>10k
lines
(b)
>3k l
ines (
a)
>3k l
ines (
b)
>1k l
ines (
a)
>1k l
ines (
b)
<1k l
ines (
a)
<1k l
ines (
b)
Nation
al
Dep
loym
ent c
osts
per
pre
mis
es (G
BP
)...
Fixed costs per premises passed Variable costs per premises connected
Figure 4.10: Fixed costs per premises passed and variable costs per premises connected for
FTTH/PTP [Source: Analysys Mason for BSG]
Figure 4.11 below shows the nationwide costs for the base case (50% take-up amongst broadband subscribers not on cable networks) split into fixed and variable costs (as defined above). It can be seen that for all technologies the fixed costs associated with coverage are dominant.
3.7
19.323.8
1.4
5.3
5.0
-
5
10
15
20
25
30
35
FTTC/VDSL FTTH/GPON FTTH/PTP
Dep
loym
ent c
osts
(GB
P b
illio
ns)...
Fixed Variable
Figure 4.11: Costs for a nationwide network split into fixed and variable costs [Source: Analysys Mason
for BSG]
Analysys Mason for Broadband Stakeholder Group
Ref: 12726-371

The costs of deploying fibre-based next-generation broadband infrastructure | 55
4.2 Other scenarios
4.2.1 FTTC/VDSL migration and cabinet occupancy scenarios
Figure 4.12 below shows the total deployment costs for deploying a national FTTC/VDSL network across the following two parameters: the extent of line migration and cabinet occupancy. Six different scenarios are considered: partial and full migration of lines for each of dedicated, shared and separate cabinet occupancy.
-
1
2
3
4
5
6
7
8
Partial migration,single cabinet
Partial migration,shared cabinet
Partial migration,2 cabinets
Full migration,single cabinet
Full migration,shared cabinet
Full migration,2 cabinets
Dep
loym
ent c
osts
(GBP
billi
ons).
..
Optical distribution frame Cabinet Active equipment Civils Line migration In-home
Base case
Figure 4.12: National costs for FTTC/VDSL scenarios [Source: Analysys Mason for BSG]
The total costs for FTTC/VDSL at 100% coverage range from GBP4.6 billion to GBP7.6 billion across the scenarios. As expected, full migration of lines is more expensive than a partial migration that is based on demand for services. However, the increase in cost for migrating all lines (including more fibre and active equipment demands, more expensive cabinets, and the inclusion of voice-capable cards in the cabinets) is offset by the consequent reduction in connection costs. The competition implications of FTTC/VDSL are discussed in more detail in Section 6.4.
4.2.2 FTTH migration scenarios
The two migration scenarios were also applied to the FTTH technologies, as shown in Figure 4.13 below. The deployment costs of providing 100% coverage rise significantly with each technology, although for slightly different reasons. For FTTH/GPON, the cost of fibre (and duct) up to the final drop remains the same for both scenarios (there is sufficient capacity in an FTTH/GPON network laid to meet the demand of broadband to provide all premises with next-generation broadband). The increase in cost comes from a 250% increase in the cost of civil works for the
Analysys Mason for Broadband Stakeholder Group
Ref: 12726-371

The costs of deploying fibre-based next-generation broadband infrastructure | 56
final drop (GBP3.6 billion to GBP9.1 billion), and a five-fold increase in CPE costs (GBP0.7 billion to GBP3.9 billion).
FTTH/PTP showed a similar increase in total cost (around 35%). There was a similar increase in the fibre requirements up to the final drop. However, lower CPE costs were offset by an increase in active equipment costs.
-
5
10
15
20
25
30
35
40
45
GPON - partial migration GPON - full migration PTP - partial migration PTP - full migration
Dep
loym
ent c
osts
(GB
P b
illio
ns)...
Optical distribution frame Active equipment + splitters Civils (exc. final drop)Civils (final drop) In-building wiring (exc. final drop) CPE
Figure 4.13: National costs for FTTH scenarios [Source: Analysys Mason for BSG]
4.2.3 Next-generation broadband take-up scenarios
Under the scenario in which next-generation broadband infrastructure is rolled out based on the demand for services, the level of take-up was varied to show differences in the cost of coverage.
The total cost of rolling out FTTC/VDSL across varying take-up levels is shown in Figure 4.14 below. The costs show a wide variation: GBP4.1 billion at the lower end of take-up projections, and GBP6.1 billion at the upper end. The costs of cabinets and fibre do not vary with take-up: in order to provide next-generation broadband services to a single subscriber, a cabinet must be built. Likewise, in the case of FTTH, all of the ducts (excluding final drops) are installed irrespective of take-up. Active equipment can be added to the cabinet as subscribers sign up, and line migration costs vary with take-up, although the cost of migrating each line is higher than in the full migration case.
Analysys Mason for Broadband Stakeholder Group
Ref: 12726-371

The costs of deploying fibre-based next-generation broadband infrastructure | 57
-
1
2
3
4
5
6
7
10% of DSL /6% of lines
30% of DSL / 19% of lines
50% of DSL / 31% of lines
70% of DSL / 44% of lines
90% of DSL / 57% of lines
Dep
loym
ent c
osts
(GB
P bi
llions
)...
Optical distribution frame Cabinet Active equipment Civils Line migration In-home
Base case
-
1
2
3
4
5
6
7
10% of DSL /6% of lines
30% of DSL / 19% of lines
50% of DSL / 31% of lines
70% of DSL / 44% of lines
90% of DSL / 57% of lines
Dep
loym
ent c
osts
(GB
P bi
llions
)...
Optical distribution frame Cabinet Active equipment Civils Line migration In-home
Base case
Figure 4.14: National costs for FTTC/VDSL take-up scenarios [Source: Analysys Mason for BSG]
The cost of deploying FTTH/GPON based on demand is shown in Figure 4.15 below. As the costs are dominated by the laying of fibre up to the final drop, the total cost shows a proportionately lower change with demand. The cost ranges from GBP21 billion to GBP28 billion. Cost components that do change with demand include investment in CPE and fibre for the final drop.
-
5
10
15
20
25
30
Dep
loym
ent c
osts
(GBP
billi
ons).
..
Optical distribution frame Active equipment + splitters Civils (exc. final drop)Civils (final drop) In-building wiring (exc. final drop) CPE
10% of DSL /6% of lines
30% of DSL / 19% of lines
50% of DSL / 31% of lines
70% of DSL / 44% of lines
90% of DSL / 57% of lines
Base case
Figure 4.15: National costs for FTTH/GPON take-up scenarios [Source: Analysys Mason for BSG]
Analysys Mason for Broadband Stakeholder Group
Ref: 12726-371

The costs of deploying fibre-based next-generation broadband infrastructure | 58
Varying the take-up on an FTTH/PTP deployment gives a similar picture to FTTH/GPON: there is less variation due to the dominance of fibre up to the final drop (ranging from GBP25 billion to GBP33 billion). Again, the costs that show the greatest variation include those of providing civil works for the final drop.
-
5
10
15
20
25
30
35
Dep
loym
ent c
osts
(GB
P bi
llions
)...
Optical distribution frame Active equipment + splitters Civils (exc. final drop)Civils (final drop) In-building wiring (exc. final drop) CPE
10% of DSL /6% of lines
30% of DSL / 19% of lines
50% of DSL / 31% of lines
70% of DSL / 44% of lines
90% of DSL / 57% of lines
Base case
Figure 4.16: National costs for FTTH/PTP take-up scenarios [Source: Analysys Mason for BSG]
The impact of the level of take-up on the economics of deploying each of the three technologies is illustrated by the steep reduction in the total cost per line connected, shown in Figure 4.17 to Figure 4.19 below. It can be seen that for all three technologies there is a reduction of around 40% in the cost per home connected for a national deployment if the take-up of all lines increases from 31% to 63%.
Analysys Mason for Broadband Stakeholder Group
Ref: 12726-371

The costs of deploying fibre-based next-generation broadband infrastructure | 59
-
200
400
600
800
1,000
1,200
1,400
1,600
1,800
2,000
0% 10% 20% 30% 40% 50% 60% 70% 80%Take-up of all lines
Dep
loym
ent c
osts
per
pre
mis
es c
onne
cted
(GBP
) ...
AFTTC BFTTC CFTTC National
Figure 4.17: Impact of overall take-up on the costs per premises connected by area for FTTC/VDSL
[Source: Analysys Mason for BSG]
-
1,000
2,000
3,000
4,000
5,000
6,000
7,000
8,000
9,000
0% 10% 20% 30% 40% 50% 60% 70% 80%Take-up of all lines
...D
eplo
ymen
t cos
ts p
er p
rem
ises
con
nect
ed (G
BP)
...
AFTTH BFTTH CFTTH National
Figure 4.18: Impact of overall take-up on the costs per premises connected by area for FTTH/GPON
[Source: Analysys Mason for BSG]
Analysys Mason for Broadband Stakeholder Group
Ref: 12726-371

The costs of deploying fibre-based next-generation broadband infrastructure | 60
-
1,000
2,000
3,000
4,000
5,000
6,000
7,000
8,000
9,000
10,000
0% 10% 20% 30% 40% 50% 60% 70% 80%Take-up of all lines
...D
eplo
ymen
t cos
ts p
er p
rem
ises
con
nect
ed (G
BP)
AFTTH BFTTH CFTTH National
Figure 4.19: Impact of overall take-up on the costs per premises connected by area for FTTH/PTP
[Source: Analysys Mason for BSG]
4.2.4 Duct re-use scenarios
Laying new ducting for fibre is a major part of the cost of deploying next-generation broadband infrastructure. The potential re-use of existing ducting is therefore also a major factor in the costs of deployment. The assumed level of duct re-use was varied to show how this factor affects the cost of deployment for each of the three technologies. As shown in the table below, three scenarios were considered, to understand the impact of assuming high re-use and low re-use relative to a median base case. A separate parameter was defined for FTTH/PTP as the large bundles of fibre-optic cable may mean that some existing ducting would not be available for re-use.
Re-use Duct re-used
(A+B)
Duct re-used for PTP (A+B)
Ductre-used
(C-D)
Ductre-used for PTP (C-D)
Duct re-used
(E-F)
Duct re-used for PTP (E-F)
Low 50% 40% 25% 20% 15% 15%
Mid-range (base case) 80% 70% 50% 40% 30% 30%
High 95% 80% 70% 50% 60% 60%
Figure 4.20: Duct re-use assumptions [Source: Analysys Mason for BSG]
Analysys Mason for Broadband Stakeholder Group
Ref: 12726-371

The costs of deploying fibre-based next-generation broadband infrastructure | 61
The results of the varying assumed levels of duct re-use are shown in Figure 4.20 below.
4.2
18.3
26.1
5.1
24.5
28.8
6.8
32.335.0
-
5
10
15
20
25
30
35
40
FTTC/VDSL FTTH/GPON FTTH/PTP
Dep
loym
ent c
osts
(GB
P b
illio
ns)...
Higher re-use Base case Lower re-use
Figure 4.21: National deployment costs for duct re-use scenarios [Source: Analysys Mason for BSG]
4.2.5 Increased use of aerial fibre
We have explored the impact on the base case of assuming the amount of fibre that is deployed aerially is increased to 100% in all ‘b’ geotypes, and ‘a’ geotypes with less than 1000 lines. New telegraph poles are assumed to be deployed to achieve this, bringing the average cost per metre of aerial fibre installation to GBP25 per metre. The results for this sensitivity test are shown below in Figure 4.22. It can be seen that the deployment costs for FTTC/VDSL fall from GBP5.1 billion to GBP4.7 billion. Similarly the costs for FTTH/GPON and FTTH/PTP fall from GBP24.5 billion and GBP28.8 billion to GBP20.0 billion and GBP23.3 billion respectively. However, it should be noted that the assumption of a 100% aerial fibre deployment in the geotypes considered may not be practicable (e.g. limited space for telegraph poles).
Analysys Mason for Broadband Stakeholder Group
Ref: 12726-371

The costs of deploying fibre-based next-generation broadband infrastructure | 62
-
1
2
3
4
5
6
Base case Increased aerial
Dep
loym
ent c
osts
(GB
P b
illion
s)...
Optical distribution frame Cabinet
Active equipment Civils
Line migration In-home
Figure 4.22: Impact of
increased aerial
deployment on a
nationwide basis for
FTTC/VDSL [Source:
Analysys Mason for
BSG]
-
5
10
15
20
25
30
35
Base case -FTTH/GPON
Increased aerial -FTTH/GPON
Base case -FTTH/P2P
Increased aerial -FTTH/P2P
Dep
loym
ent c
osts
(GB
P b
illion
s)...
Optical distribution frame Active equipment + splitters
Fibre (exc. final drop) Fibre (final drop)
In-building wiring (exc. final drop) CPE
Figure 4.23: Impact of increased aerial deployment on a national basis for FTTH/GPON and
FTTH/PTP [Source: Analysys Mason for BSG]
4.2.6 Engineer installation
In the case of FTTC/VDSL, we have explored the sensitivity of the model to a requirement for customer premises equipment to be installed by an engineer rather than by the customer.
Analysys Mason for Broadband Stakeholder Group
Ref: 12726-371

The costs of deploying fibre-based next-generation broadband infrastructure | 63
Installation by an engineer may be necessary to ensure that FTTC/VDSL is able to deliver high speeds reliably. Similar engineer installations were necessary in the early phases of ADSL roll-out, though over time ‘self-installation’ became the most common method. However, FTTC/VDSL may require a professional installation beyond the initial stage of a deployment. Such installations are assumed to cost an additional GBP100 per line. This would increase the total costs by over GBP850 million, representing a 17% increase in overall costs.
-
1
2
3
4
5
6
7
Base case Engineer install
Dep
loym
ent c
osts
(GB
P b
illion
s)...
Optical distribution frame Cabinet
Active equipment Civils
Line migration In-home
Figure 4.24: Additional
cost of installation of
FTTC/VDSL by engineer
[Source: Analysys
Mason for BSG]
4.2.7 Use of alternative infrastructure
The use of alternative infrastructure has been considered as outlined in Section 3.1.4. For the case of FTTC/VDSL, the use of Virgin Media’s infrastructure is assumed to cause a 90% reduction in the number of ducts constructed (within the areas covered by Virgin Media), with a reduction of up to 80% (in some areas) in the utilities scenario. This leads to a significant reduction in costs of GBP0.5 billion and GBP0.8 billion for the Virgin Media and utilities scenario respectively.
Analysys Mason for Broadband Stakeholder Group
Ref: 12726-371

The costs of deploying fibre-based next-generation broadband infrastructure | 64
-
1.0
2.0
3.0
4.0
5.0
6.0
BT Virgin Media Utilities
Dep
loym
ent c
osts
(GB
P b
illio
ns)...
Optical distribution frame Cabinet Active equipment Civils Line migration In-home
Figure 4.25: Comparison of deployment costs on a national basis for the different infrastructure
scenarios for FTTC/VDSL [Source: Analysys Mason for BSG]
Similar scenarios have also been considered for FTTH/GPON and FTTH/PTP. In these scenarios, the amount of ducting that is assumed to be constructed between the exchange and the street cabinet is the same as for the FTTC/VDSL scenario. The ducting constructed between the location of the street cabinet and the distribution point is reduced by up to 50% under the utilities scenario in some areas. It can be seen from Figure 4.26 that using Virgin Media’s infrastructure on FTTH/GPON and FTTH/PTP has a limited impact. Using utility infrastructure has a much more significant impact, reducing total costs by GBP5.7 billion for FTTH/GPON and GBP7.0 billion for FTTH/PTP.
Analysys Mason for Broadband Stakeholder Group
Ref: 12726-371

The costs of deploying fibre-based next-generation broadband infrastructure | 65
-
5
10
15
20
25
30
35
FTTH/GPON -BT
FTTH/GPON -Virgin Media
FTTH/GPON -Utilities
FTTH/PTP - BT FTTH/PTP -Virgin Media
FTTH/PTP -Utilities
Dep
loym
ent c
osts
(GB
P b
illio
ns)...
Optical distribution frame Active equipment + splitters Civils (exc. final drop)Civils (final drop) In-building wiring (exc. final drop) CPE
Figure 4.26: Deployment costs for a national network the different infrastructure scenarios for
FTTH/GPON and FTTH/PTP [Source: Analysys Mason for BSG]
4.3 Operating costs for next-generation broadband access networks
The move to a next-generation broadband access network will incur changes to the costs of operating as well as deploying the new network infrastructure. Given the uncertainty over how these costs will change in a next-generation broadband access network, we have not been able to consider these costs at the same level of detail as the deployment costs.
Base case
We have attempted to assess the likely changes in operating costs for FTTC/VDSL, FTTH/GPON, and FTTH/PTP under the base case, and the full migration scenarios. The differences in operating costs have been presented on a per-line basis for a nationwide deployment. We would expect there to be differences in the costs per line by geotype, but we do not have sufficient data to examine operating costs in such detail. We have identified three principal areas where there may be changes to the operating costs of the access network:
• the maintenance costs of the access network beyond the telephone exchange. These costs are currently incurred by Openreach, and are broadly equivalent to the costs associated with the MPF product
• electricity costs for active equipment costs of maintaining battery back-up facilities under the full migration scenario. •
Analysys Mason for Broadband Stakeholder Group
Ref: 12726-371

The costs of deploying fibre-based next-generation broadband infrastructure | 66
We have established the magnitude of the costs for maintaining the current access network using data from Section 11.1 of the current cost financial statements for 2007 for Openreach19. A summary of the current operating costs per residential analogue access line is shown below in Figure 4.27.
Cost category Annual cost per line (GBP)
Provision/maintenance 12.84
Network support 10.44
General support 12.63
General management 14.77
Finance and billing 0.84
Accommodation 6.47
Bad debts 0.05
Others 1.57
Total 59.61
Figure 4.27: Annual
operating costs per line
[Source: Openreach]
The potential changes to the operating costs in each of these areas have been estimated. One of the pieces inputs informing our estimates is the savings being targeted by Verizon in the USA. The main data point we have used is that Verizon has achieved an 80% reduction in faults for outside plant when FTTH/GPON is deployed. We believe that this represents the costs categorised as ‘Provision/maintenance’ by Openreach. It is also reasonable to assume that the other supporting activities will also see declines in operating costs, though these are likely to be less in relative terms. We believe it reasonable to assume that FTTH/PTP will achieve the same savings in this area.
In the case of FTTC/VDSL there may be some reductions in the costs of operating copper lines. Our model suggests that the duct between the exchange and the cabinet is around 15% of the total duct length. Based upon this we believe that it may be possible to achieve a 10% reduction in costs for provision and maintenance (note that line migration costs are included in the deployment costs). However as active equipment is more dispersed in the network we have assumed a 10% increase in network support, with all other costs remaining unchanged.
The assumed changes to the operating costs by category are shown below in Figure 4.28.
19 http://www.btplc.com/Thegroup/Regulatoryinformation/Financialstatements/2007/CurrentCostFinancialStatements.pdf
Analysys Mason for Broadband Stakeholder Group
Ref: 12726-371

The costs of deploying fibre-based next-generation broadband infrastructure | 67
Cost category FTTC/VDSL FTTH/GPON FTTH/PTP
Provision/maintenance -10% -80% -80%
Network support +10% -50% -50%
General support 0% -20% -20%
General management 0% -10% -10%
Finance and billing 0% 0% 0%
Accommodation 0% 0% 0%
Bad debts 0% 0% 0%
Others 0% 0% 0%
Figure 4.28: Assumed
changes in operating
costs by category for
each technology
[Source: Analysys
Mason for BSG]
The resulting changes to the operating costs per line are shown below in Figure 4.29.
Cost category FTTC/VDSL FTTH/GPON FTTH/PTP
Provision/maintenance -1.28 -10.27 -10.27
Network support +1.04 -5.22 -5.22
General support 0.00 -2.53 -2.53
General management 0.00 -1.48 -1.48
Finance and billing 0.00 0.00 0.00
Accommodation 0.00 0.00 0.00
Bad debts 0.00 0.00 0.00
Others 0.00 0.00 0.00
Total -0.24 -19.50 -19.50)
Figure 4.29: Changes
to annual operating
costs per line for each
technology [Source:
Analysys Mason for
BSG]
The changes to the power costs for active equipment are based upon estimates of power per port, and a cost per kWh from Openreach20. The calculations are summarised below:
Current network FTTC/VDSL FTTH/GPON FTTH/PTP
Power per port (W) +1.95 +3.82 +19.20 +4.19
Lines per port +1 +1 +32 +1
Cost per KWh (pence)
+9.68 +9.68 +9.68 +9.68
Power costs +1.20 +2.35 +0.37 +2.58
relative to current - +1.15 -0.83 +1.37
difference 0% 95% -69% 114%
Figure 4.30: Assumed power costs for each technology [Source: Analysys Mason for BSG]
20 This is the price charged by Openreach at the time of publication. While this figure may change over the period under study, we do
not expect any changes to have a material impact on the results of the study.
Analysys Mason for Broadband Stakeholder Group
Ref: 12726-371

The costs of deploying fibre-based next-generation broadband infrastructure | 68
Combining these changes in operating costs in these two areas provides the total change in operating costs under the base case (partial migration), per line. These are summarised below.
Current network
FTTC/VDSL FTTH/GPON FTTH/PTP
Annual operating costs per line (GBP) +60.82 +61.72 +40.48 +42.69
Change in annual operating costs per line (GBP)
0 +0.91 -20.33 -18.12
Percentage difference 0% +1% -33% -30%
Figure 4.31: Annual operating costs per line for the base case [Source: Analysys Mason for BSG]
Under a scenario in which only a small fraction of lines are migrated, there is likely to be an increase in operating costs, irrespective of the technology deployed, as the fixed costs of operating two parallel networks will be greater than any savings that can be achieved. The analysis carried out in this section does not attempt to capture the costs of operating multiple parallel networks. The changes in operating costs should therefore be considered to be the change which could be expected to be obtained at a high level of take-up.
Increases in operating costs at lower take-up levels could arise from areas such as:
• employing maintenance staff with two different skill sets • increased costs of maintaining ducts as they contain more cables due to parallel fibre and
copper networks • fixed costs of maintaining supporting IT systems for different networks
equipment maintenance costs may have a fixed component meaning that may not decline linearly with active lines. For example, the overall cost of two 50% full networks is more than one 100% full network
•
Despite the uncertainty surrounding the potential changes to network operating costs, the increase in operating costs for FTTC/VDSL is unlikely to be sufficient to make a business case unattractive. For FTTH/GPON and FTTH/PTP the savings are substantially smaller than would be required to fund the investment based upon operating cost savings alone.
Full migration
Under the full migration scenario there are additional deployment costs for battery back-up at the street cabinet for FTTC/VDSL, and at the premises for FTTH/GPON and FTTH/PTP. We have estimated that these will need to be replaced on a five-year cycle. For the case of FTTC/VDSL this will require an engineer visit to the cabinet at a cost of GBP150, in addition to battery costs of GBP1000. The battery costs are assumed to be half of the (GBP2000) increase in additional deployment costs per cabinet. Nationally there is an average of around 240 lines per cabinet. Using these assumptions this equates to an additional GBP0.96 per line per annum in maintenance costs.
Analysys Mason for Broadband Stakeholder Group
Ref: 12726-371

The costs of deploying fibre-based next-generation broadband infrastructure | 69
For FTTH/GPON and FTTH/PTP we have assumed that batteries located in the premises will also need replacing every five years. This will include an engineer visit at a cost of GBP20 per line21. Additionally there are assumed to be materials costs of GBP50 (half of the original GBP100 additional costs for FTTH under the full migration scenarios). This equates to a total annual cost per line of GBP15.
The annual operating costs per line under the full migration scenario are shown below:
Current network
FTTC/VDSL FTTH/GPON FTTH/PTP
Annual operating costs per line (GBP) +60.82 +62.68 +55.48 +57.69
Change in annual operating costs per line (GBP)
0.00 +1.87 -5.33 -3.12
Percentage difference 0% +3% -9% -5%
Figure 4.32: Annual operating costs per line for the full migration scenario [Source: Analysys Mason for
BSG]
21 The engineer visit is assumed to be the same cost per line as the migration to FTTC/VDSL under the 'migrate all lines' scenario. This
is because it should be possible for an engineer to visit many premises that are close together during a single day.
Analysys Mason for Broadband Stakeholder Group
Ref: 12726-371

The costs of deploying fibre-based next-generation broadband infrastructure | 70
5 Further analysis
5.1 Comparison of results with other benchmarks
5.1.1 FTTC/VDSL
On 15 July 2008, BT announced its strategy for deploying a mixture of FTTC and FTTH in the UK. Its plans involve covering ten million premises by 2012, with FTTH being reserved for areas of new build. The company estimated that this would involve an investment of GBP1.5 billion, which equates to an overall cost of GBP150 per premises passed. During a presentation by Sally Davis (CEO, BT Wholesale) it was also stated that BT expects costs per premises connected to be around GBP350; this implies that the take-up rate of new services is expected to be 40% of all premises.
If the model is set up to include a scenario of a single dedicated cabinet, the model gives an overall cost of around GBP1.3 billion to pass 10 million homes, with four million of these being connected to the new network.
Possible reasons for this cost being less than that quoted by BT include the following:
•
•
•
•
The GBP1.5 billion cost quoted by BT also includes some FTTH/GPON, which is more expensive; this will lead to an increased cost to cover 10 million homes.
Our model assumes that connection costs for lines at the street cabinet are GBP50 per line; this is lower than the current price from Openreach (GBP127.61).
Our assumption on the costs for active equipment include some expected price declines over the next few years that may not have been included by BT.
BT may have included engineer installations within its costs.
Despite the costs in this report being lower than those quoted by BT, we believe that they are representative of the likely costs if engineer installations can be avoided, and the reductions in the unit costs for line migrations, and active equipment, can be achieved.
As a comparison, AT&T is also deploying FTTC/VDSL in the USA. Recent information on the AT&T deployment suggests that the company expects to spend USD6.5 billion to cover 18 million homes,22 which equates to a cost of GBP2.0 billion23 to cover 10 million homes – higher than the
22 http://www.fierceiptv.com/story/t-u-verse-will-cost-1-4b-more-planned/2007-05-15
23 Assuming an exchange rate of GBP1:USD1.8
Analysys Mason for Broadband Stakeholder Group
Ref: 12726-371

The costs of deploying fibre-based next-generation broadband infrastructure | 71
costs quoted by BT. However, the AT&T costs include costs of equipment to deliver an IPTV service. This is quoted as being a main source of increases in the originally quoted costs. The original costs were quoted as being USD5.1 billion to cover 17 million homes; this equates to GBP1.7 billion to cover 10 million homes.
AT&T has not stated its assumed take-up rate, which will have an impact upon the costs. In addition, the geography of the USA is not the same as the UK, which will lead to a difference in deployment costs. Despite these uncertainties, it appears that the costs of the AT&T deployment are not inconsistent with those for the UK presented in this report.
5.1.2 FTTH/GPON and FTTH/PTP
Verizon is deploying FTTH/PON to a large proportion of its footprint in the USA. The company often quotes costs per premises passed and costs per premises connected, each at about USD800 (GBP444). Assuming that this is calculated using the same definition as we have used in Section 4.1.4, it is higher than the costs in our base case for FTTH/GPON of GBP388 and GBP390.24
There are also cost benchmarks from OnsNet in the Netherlands. This open-access network is based upon FTTH/PTP and has achieved very high take-up rates of around 96%. It is reported that the original deployment in Nuenen cost around EUR2100 (GBP1680),25 with costs in more recent deployments falling to around EUR1400 (GBP1120). If our model is adjusted so that it includes a 96% take-up rate, the deployment cost for FTTH/PTP is GBP1731 per premises connected for a nationwide deployment, or GBP1059 per premises connected for the first 10 million homes passed – which is probably a more representative sample than the nationwide costs.
A study into the costs of FTTH/GPON in France has also been published by the regulator, ARCEP. This study quotes costs of EUR2000 (GBP1680) per premises connected if utility ducts cannot be utilised. A 25% take-up rate is also assumed in areas with a population density of 20 000 per km2, which is more than twice as dense as the Inner London geotype. If the model is set up to calculate the costs at a take-up rate of 25%, the costs per premises connected in Inner London are GBP1855 for FTTH/GPON.
In all three cases above, the cost estimates for our base case are of a similar order but slightly lower than the benchmarks from other countries.
24 Costs have been averaged over the first four geotypes which cover around 10 million homes.
25 Assuming an exchange rate of GBP1 = EUR1.25.
Analysys Mason for Broadband Stakeholder Group
Ref: 12726-371

The costs of deploying fibre-based next-generation broadband infrastructure | 72
5.1.3 Cable broadband (DOCSIS3.0)
Virgin Media is currently in the process of upgrading its broadband network to the DOCSIS3.0 standard. The upgrade is scheduled to be completed by the end of 2008, and at launch is expected to offer download speeds of up to 50Mbit/s. This is broadly similar to the speeds that can be offered over a FTTC/VDSL network. Additionally, the network architecture for DOCSIS3.0 is similar to FTTC/VDSL. Both networks involve having a fibre-based connection to a street cabinet within a few hundred metres of the customer premises. However, in the case of Virgin Media the underlying assets (fibre and street cabinets) require very little investment for DOCSIS3.0. Most of the incremental investment is in additional electronics. Under take-up assumptions consistent with the base case we estimate that the costs per premises connected using DOCSIS3.0 technology is around GBP50-100. This is significantly less than the investment required for FTTC/VDSL, though is similar to the costs of active electronics for VDSL, which equate to around GBP100 per premises connected26.
5.2 Deployment costs in urban and rural areas
The model has been designed to calculate deployment costs for 13 different geotypes, as shown earlier. Analysis has shown that within the 13 geotypes examined, there are three broad groupings of geotypes that have similar costs, allowing the 13 geotypes to be aggregated into three main areas (as defined in Section 4.1.2). These are labelled as AFTTC/AFTTH, BFTTC/BFTTH and CFTTC/CFTTH, with the areas broadly corresponding to urban, rural, and remote areas.
The fixed and variable costs have been calculated for the AFTTC, BFTTC and CFTTC areas (as defined in Section 4.1.2) and are shown in Figure 5.1. It can be seen that the variable costs per premises connected are relatively constant across the three area types. This is due to the costs of migrating lines, being constant, and the limited economies of scale for active equipment in urban areas (due to higher utilisation at larger cabinet). However, the fixed costs per premises connected increase significantly in the more rural areas owing to the smaller number of lines per street cabinet and the need for additional civil works.
26 The cost estimate is based upon information supplied by New Street Research
Analysys Mason for Broadband Stakeholder Group
Ref: 12726-371

The costs of deploying fibre-based next-generation broadband infrastructure | 73
249411
992
157
162
183
-
200
400
600
800
1,000
1,200
1,400
AFTTC(57.7% pop.)
BFTTC(26.4% pop.)
CFTTC(15.9% pop)D
eplo
ymen
t cos
ts p
er p
rem
ises
con
nect
ed (G
BP
)...
Fixed Variable
Figure 5.1: Fixed and
variable costs per
premises connected for
FTTC/VDSL split by
geographical area
[Source: Analysys
Mason for BSG]
The costs per premises connected for FTTH/GPON and FTTH/PTP split by areas AFTTH, BFTTH, and CFTTH are shown below in Figure 5.2 and Figure 5.3. In the case of the two FTTH technologies both the fixed and variable costs increase significantly in rural and remote areas. This is primarily driven by the longer distance of fibre that is required.
1,348
3,107
6,518
427
798
1,508
-
1,000
2,000
3,000
4,000
5,000
6,000
7,000
8,000
9,000
AFTTH(67.8% pop.)
BFTTH(25.4% pop.)
CFTTH(6.8% pop.)D
eplo
ymen
t cos
ts p
er p
rem
ises
con
nect
ed (G
BP
)...
Fixed Variable
Figure 5.2: Fixed and
variable costs per
premises connected for
FTTH/GPON split by
geographical area
[Source: Analysys
Mason for BSG]
Analysys Mason for Broadband Stakeholder Group
Ref: 12726-371

The costs of deploying fibre-based next-generation broadband infrastructure | 74
1,682
3,909
7,707
406
743
1,498
-
1,000
2,000
3,000
4,000
5,000
6,000
7,000
8,000
9,000
10,000
Dep
loym
ent c
osts
per
pre
mis
es c
onne
cted
(GB
P)
...
Fixed Variable
AFTTH(67.8% pop.)
BFTTH(25.4% pop.)
CFTTH(6.8% pop.)
Figure 5.3: Fixed and
variable costs per
premises connected for
FTTH/PTP split by
geographical area
[Source: Analysys
Mason for BSG]
The geographical locations of the AFTTC, BFTTC, and CFTTC areas for the FTTC and AFTTH, BFTTH, and CFTTH areas for FTTH/GPON and FTTH/PTP scenarios are shown below in Figure 5.4 and Figure 5.5.
It can be seen from the two maps below that although the AFTTC/ AFTTH areas cover 58%/68% of the population respectively, the area coverage is significantly less. It is also important to note that there are many small pockets of coverage in the AFTTC/AFTTH and BFTTC/BFTTH areas throughout the UK. These small pockets are within the areas defined as being close to the centre of exchange coverage areas. These represent small, but densely populated towns and villages that are served by smaller telephone exchange in rural areas.
Analysys Mason for Broadband Stakeholder Group
Ref: 12726-371

The costs of deploying fibre-based next-generation broadband infrastructure | 75
CFTTC
BFTTC
AFTTC
Figure 5.4: Map of the
UK by area type for
FTTC/VDSL [Source:
Analysys Mason for
BSG]
Annex C contains two copies of the above map focused on the South West and North East of England.
Analysys Mason for Broadband Stakeholder Group
Ref: 12726-371
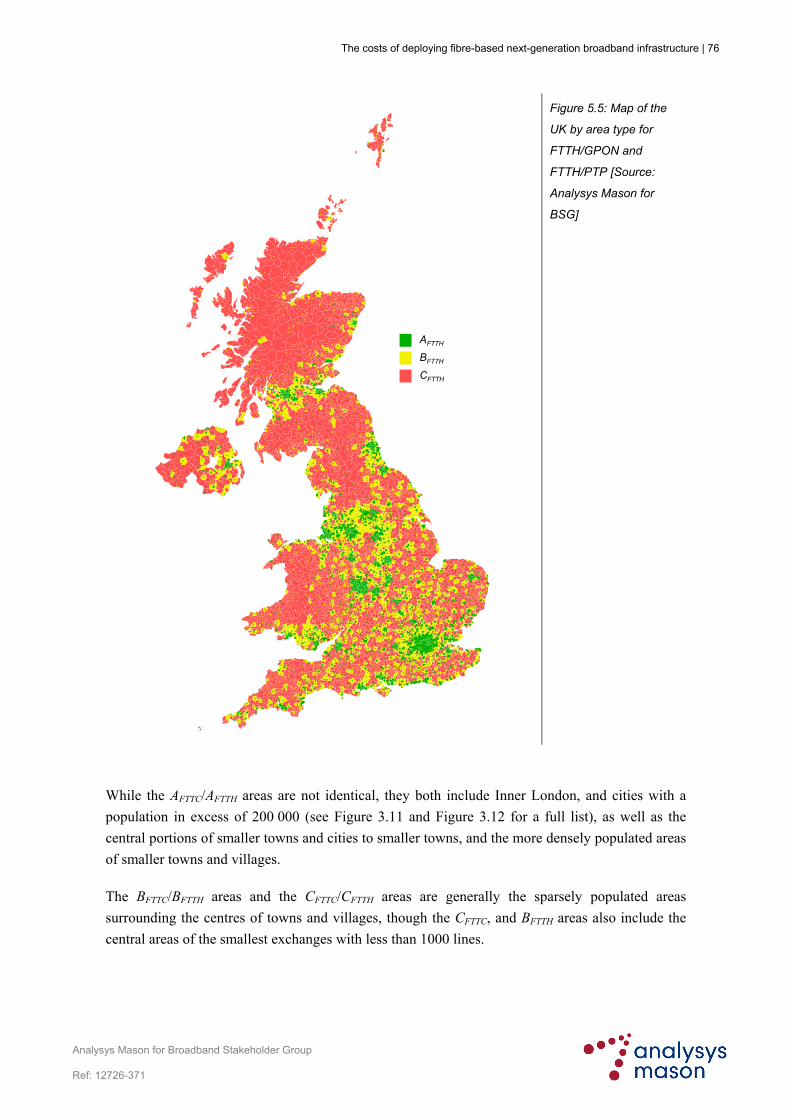
The costs of deploying fibre-based next-generation broadband infrastructure | 76
CFTTH
BFTTH
AFTTH
Figure 5.5: Map of the
UK by area type for
FTTH/GPON and
FTTH/PTP [Source:
Analysys Mason for
BSG]
While the AFTTC/AFTTH areas are not identical, they both include Inner London, and cities with a population in excess of 200 000 (see Figure 3.11 and Figure 3.12 for a full list), as well as the central portions of smaller towns and cities to smaller towns, and the more densely populated areas of smaller towns and villages.
The BFTTC/BFTTH areas and the CFTTC/CFTTH areas are generally the sparsely populated areas surrounding the centres of towns and villages, though the CFTTC, and BFTTH areas also include the central areas of the smallest exchanges with less than 1000 lines.
Analysys Mason for Broadband Stakeholder Group
Ref: 12726-371

The costs of deploying fibre-based next-generation broadband infrastructure | 77
5.2.1 Potential impact of increased rural take-up
The BFTTC/BFTTH and CFTTC/CFTTH areas are typically those characterised by longer line lengths. Given the current copper-based broadband technologies in use over these distances, such areas receive slower (in some cases, quite significantly slower) broadband connections.
In order to understand the full range of possible outcomes and sensitivities, we have considered the relatively extreme scenario in which 100% of non-cable broadband lines in the BFTTC/BFTTH and CFTTC/CFTTH areas are migrated to the next-generation broadband network. Figure 5.6 below compares the costs per premises connected in the AFTTC/AFTTH, BFTTC/BFTTH and CFTTC/CFTTH areas for the base case, and the BFTTC/BFTTH and CFTTC/CFTTH areas with a higher take-up amongst broadband subscribers (assuming a constant 80% broadband penetration in each area).
406
2,089
573 363
4,652
2,694
1,175664
9,205
5,352
-
1,000
2,000
3,000
4,000
5,000
6,000
7,000
8,000
9,000
10,000
FTTC/VDSL FTTH/GPON FTTH/PTP
Dep
loym
ent c
osts
per
pre
mis
es c
onne
cted
(GBP
)...
A - base case B - base caseB - 100% take-up
C - base case C - 100% take-up
100% take-up of FTTH/GPON in the CFTTH areas would reduce the cost per
premises by GBP3300
1,774
3,904
8,026
4,755
2,311
406
2,0892,089
573 363573 363
4,652
2,694
4,652
2,694
1,175664
1,175664
9,205
5,352
9,205
5,352
-
1,000
2,000
3,000
4,000
5,000
6,000
7,000
8,000
9,000
10,000
FTTC/VDSL FTTH/GPON FTTH/PTP
Dep
loym
ent c
osts
per
pre
mis
es c
onne
cted
(GBP
)...
A - base case B - base caseB - 100% take-up
C - base case C - 100% take-up
100% take-up of FTTH/GPON in the CFTTH areas would reduce the cost per
premises by GBP3300
1,774
3,904
8,026
4,755
2,311
Figure 5.6: Impact of increased take-up on costs in different areas [Source: Analysys Mason for BSG]
It can be seen that if a higher take-up can be achieved in the BFTTC/BFTTH and CFTTC/CFTTH areas
(which have longer telephone lines) the average costs per premises connected falls significantly. In general the costs in the BFTTC/BFTTH areas under the higher take-up scenario fall to approximately the same level as the AFTTC/AFTTH area under the base case (which has half the take-up). Similarly the costs in the CFTTC/CFTTH areas fall to the same range as the BFTTC/BFTTH area in the base case. These results highlight the impact of high take-up on the commercial business case for next-generation broadband infrastructure, and the potential importance of demand stimulation and aggregation initiatives.
Analysys Mason for Broadband Stakeholder Group
Ref: 12726-371

The costs of deploying fibre-based next-generation broadband infrastructure | 78
5.3 Other issues to be considered in the next-generation broadband business case
This report has focused on the deployment costs of the three main next-generation broadband technologies. Although a detailed understanding of these deployment costs is an important element of the debate surrounding next-generation broadband services, there are many other areas that also need careful consideration. The potential additional revenues generated from next-generation broadband services relative to current broadband technologies is no less important a consideration than understanding the deployment costs. This is particularly relevant for FTTH, given the substantial additional investment involved above and beyond the investment for deploying FTTC. However, the sources and extent of additional revenues remain unclear. Historically it has been seen that it is difficult to obtain higher revenue for higher broadband speeds alone. Quantifying the additional revenue in a business case for next-generation broadband networks is difficult: assumptions must be made about the evolution of pricing for current services relative to next-generation broadband access.
Additionally, the revenue potential of services such as IPTV has yet to be proven, and must also be offset against other costs such as content acquisition, which can be significant (e.g. for premium sports events). As the market matures and initial roll-outs of next-generation broadband infrastructure are completed, the revenues associated with new services will become clearer. The way that the current business rates regime is applied to fibre assets in the UK has not been quantified in this report. These costs may be a significant operating cost consideration for operators considering the deployment of next-generation broadband networks. This is particularly true of FTTH/PTP as it requires more fibre assets than the other technologies considered. The impact of business rates for fibre assets has not been considered here, but rather falls into the terms of reference of Francesco Caio’s independent review of next-generation broadband access, for which this report will be an input.
Analysys Mason for Broadband Stakeholder Group
Ref: 12726-371

The costs of deploying fibre-based next-generation broadband infrastructure | 79
6 Conclusions
6.1 Costs
6.1.1 Base case
This work has shown that the costs of deploying FTTH are of the order of five times the costs of deploying FTTC, and that the costs of deploying FTTH/PTP are around 15% higher than for FTTH/GPON.
In a market where the business case for any of the technologies is not clear cut, and the availability of funds for investment is uncertain, FTTC/VDSL is likely to be the main technology in the medium term. This is consistent with the strategy announced by BT on 15 July 2008.
For each of the three technologies, the deployment costs remain relatively constant across all urban areas. For FTTC, the urban AFTTC areas cover 58% of the population, and in the case of FTTH/GPON and FTTH/PTP the urban AFTTH areas cover 68% of the population. The relatively constant costs for a large proportion of the population suggest that if the business case is attractive for one of the technologies it may well be attractive for all of the urban AFTTC/AFTTH areas.
A number of sensitivities have been considered in the modelling work, some of which have a very large impact upon the costs. However, we believe that the base case represents a reasonable view of the costs of deploying the three different technologies; the sensitivity tests provide guidance on the magnitude of potential cost savings that could be achieved. A summary of the results for the base case is presented in Figure 6.1.
Analysys Mason for Broadband Stakeholder Group
Ref: 12726-371

The costs of deploying fibre-based next-generation broadband infrastructure | 80
1.9
9.9 11.6
1.4
9.010.7
1.8
5.7
6.5
-
5
10
15
20
25
30
35
FTTC/VDSL FTTH/GPON FTTH/PTP
Dep
loym
ent c
osts
(GB
P b
illion
s)...
A (58%/68%) B ( 26%/25%) C (16%/7%)
Figure 6.1: Deployment
costs of each technology
split by area (the
corresponding population
coverage for FTTC/FTTH
is shown in parentheses)
[Source: Analysys
Mason for BSG]
The base case has the following assumptions:
• migration of only broadband customers to the next-generation broadband access network • FTTC/VDSL being provisioned from a single cabinet shared between operators • national take-up across all geotypes of 31% of all lines
6.1.2 Alternative infrastructure
Access to alternative infrastructure (from Virgin Media and utility networks) has the potential to significantly reduce deployment costs relative to the base case – by up to GBP800 million (16%) for FTTC/VDSL and GBP5.7 billion (23%) for FTTH/GPON under the base case. If full access to such infrastructure is not possible, it may be possible to make significant savings by co-ordinating civil works with utilities. However this modelling is based upon our own assumptions and additional detailed study would allow a more robust understanding of the extent and location of suitable ducts that could be re-used with minimal investment. Of particular importance is the proximity of these ducts to residential and commercial premises, as a large proportion of the total costs are incurred in the many, short lengths of fibre close to the customer premises.
6.1.3 Impact of take-up
For all three of the technologies, the fixed costs of deployment far outweigh the variable costs. This means that the total investment required per premise connected will depend significantly on the extent of take-up of services. In rural areas, which generally have longer copper lines, higher take-up may be achieved as next-generation broadband access represents a more marked improvement in performance over current copper-based broadband services. If a very high level of take-up can be achieved in such rural areas it is possible that the costs per premises could fall to around the same level as in large urban areas. This highlights the importance of demand
Analysys Mason for Broadband Stakeholder Group
Ref: 12726-371

The costs of deploying fibre-based next-generation broadband infrastructure | 81
stimulation and aggregation schemes (which are discussed in more detail in the previous report the BSG on “Models for efficient and effective public-sector interventions in next-generation broadband access networks”27). However, it should be noted that the such initiatives may need to be more localised than previous demand stimulation and aggregation initiatives for ADSL, which were organised by telephone exchange. This is due to the significant variations in costs between the inner areas of exchanges, and the less densely populated areas surrounding them.
6.1.4 Cost reduction sensitivities
Other sensitivities have been considered that may affect the costs of deploying next-generation broadband networks. These sensitivities have shown that the deployment costs are particularly sensitive to the proportion of existing ducts that can be re-used. The ongoing survey of BT ducts by Ofcom will help to provide clarity in this area.
Another approach to cost reduction is to increase the use of aerial fibre where existing ducts are not available. This technique could be used in areas where it is possible to install new telegraph poles – though we believe such opportunities may be limited. A sensitivity where the use of aerial fibre is increased (primarily in rural areas) has been quantified. This sensitivity is detailed in Section 4.2.5, which shows that, if more aerial fibre could be deployed, the costs of deploying FTTH could fall by around GBP5 billion. However, this is not additive with the potential savings from using other duct networks, and may be difficult to achieve due to difficulties in installing new telegraph poles.
6.1.5 Operating costs
Our analysis of operating costs shows that FTTH may offer a reduction of around 30% on the costs under the base case, whereas FTTC/VDSL has slightly higher costs. However, this reduction is only GBP20 and GBP18 per line per annum for FTTH/GPON and FTTH/PTP – significantly less than the deployment costs, and therefore only becomes an important factor when the total costs are considered over a very long timeframe.
Under a full migration scenario – in which the copper network is ‘switched off’ – there may be significant additional operating costs due to the requirement to maintain battery back-up facilities for lifeline services. These costs are particularly large for FTTH as batteries must be maintained at all premises served. Because of the additional costs, the savings for FTTH/GPON fall from around GBP20 per line per annum, to GBP5 per line per annum. Similarly FTTH/PTP falls form GBP18 per line per annum to GBP3 per line per annum.
27 http://www.broadbanduk.org/psi
Analysys Mason for Broadband Stakeholder Group
Ref: 12726-371

The costs of deploying fibre-based next-generation broadband infrastructure | 82
A large number of sensitivities have been considered in the modelling work, some of which have a very large impact upon the costs. However, we believe that the base case represents a reasonable view of the initial costs of deploying the three different technologies.
6.2 Transition from FTTC to FTTH
Many incumbent operators, including BT, are choosing to deploy FTTC ahead of FTTH. This report has shown that FTTC can be deployed at a considerably lower cost than FTTH, with deployment costs around a fifth of those for FTTH. Given the capacity of FTTC to support the vast majority of current applications, there are strong incentives for operators to deploy FTTC rather than FTTH. Furthermore, a strategy of deploying FTTC does not preclude a later deployment of FTTH.
The deployment of FTTC infrastructure may help to drive innovation that leads to the development of applications requiring greater bandwidth, which in turns drives demand for FTTH infrastructure. This process may be accelerated by small-scale deployments of FTTH in areas of new build, or in areas targeted by new entrants deploying FTTH.
There are also some cost synergies between FTTC and FTTH. An important component of the deployment costs for FTTC/VDSL relates to the installation of fibre to the street cabinet. This investment amounts to around GBP2.1 billion for a nationwide network (making up 42% of the total roll-out costs for FTTC), and is a common requirement for both FTTC and FTTH. It should be noted, however, that this GBP2.1 billion amounts to just 9% of the GBP24.5 billion required for a nationwide FTTH deployment, under our base case.
A significant proportion of the remaining costs for deploying FTTC/VDSL relates to active electronics, which will be subject to a depreciation period that is much shorter than for fibre and new ducts. It is conceivable that by the time these active electronics have been fully depreciated, there may be a more compelling business case for FTTH. However, there is also a risk that if alternative operators invest in sub-loop unbundling (SLU), some of their SLU assets at the street cabinet could become redundant before their investments are fully recovered.
There may be opportunities to learn lessons from the operational experience of rolling out FTTC that could lead to a more efficient deployment of FTTH in the future. However, as there are significant differences between the technologies, these opportunities may be limited.
There are also some potentially negative impacts of an initial deployment of FTTC. For example, FTTC involves placing active equipment ‘deeper’ into the network. This will require new operational skills and practices for operators, notably in field maintenance. A move to an FTTH network at a later date may then lead to resistance to change as operators’ active equipment will be more centralised, and will require a different set of operational skills.
An initial deployment of FTTC may allow operators to capture most of the additional revenue that is available from next-generation broadband services, leaving little additional revenue for services
Analysys Mason for Broadband Stakeholder Group
Ref: 12726-371

The costs of deploying fibre-based next-generation broadband infrastructure | 83
that are only supported by FTTH. If this were to occur it may make the business case for a subsequent deployment of FTTH more difficult to justify. This could possibly be offset by the effects of innovation outlined earlier in this section.
Finally, operators who do not currently use the existing BT infrastructure may have a different perspective on the business case for FTTH. For example, H2O Networks does not have existing ties with the BT network and is pursuing an FTTH strategy. For operators who do not currently use the copper access networks the difference in economics between FTTC and FTTH may not be as pronounced, making FTTH more attractive.
6.3 Implications for rural deployment
For both FTTC and FTTH the significant increase in the costs per premises connected beyond the AFTTC and AFTTH areas suggests that under the base case the commercial business case for next-generation broadband services beyond these areas is likely to be more challenging28. Nonetheless, and as discussed above, a significantly higher level of take-up in these areas could reduce the costs, potentially to levels similar to those in AFTTC and AFTTH areas.
On balance it appears probable that if the more rural areas are to receive next-generation broadband access there will need to be a mixture of demand- and supply-side interventions from the public sector, similar to what happened with the first generation of broadband services.
BT and Virgin Media have announced their intention to deploy next-generation broadband infrastructure. While Virgin Media’s roll-out is dictated by the coverage of its existing network (which is concentrated mainly in urban areas), the geographical location of BT’s deployment is not yet known. However, information currently available from BT suggests that, in the absence of any form of public-sector intervention, its deployment will be focused on more urban areas.
Given the likely urban focus of any purely commercial deployments, it would be appropriate to develop creative policy approaches for the rural BFTTC/BFTTH and remote CFTTC/CFTTH areas that include commercial operators, the public sector and local communities. If these approaches are to include public-sector interventions they should seek to draw upon the recommendations in the report for the BSG on “Models for efficient and effective public-sector interventions in next-generation broadband access networks” 29. It may also be appropriate for the more rural areas to consider other wireless and satellite technologies that can deliver next-generation broadband services.
28 For example, if the additional costs of deploying FTTH/GPON to BFTTH areas were recovered purely through higher retail prices over
20 years (using a discount rate of 15%), it would amount to an increase in retail prices of over GBP28 per month when compared to the AFTTH areas.
29 http://www.broadbanduk.org/psi
Analysys Mason for Broadband Stakeholder Group
Ref: 12726-371

The costs of deploying fibre-based next-generation broadband infrastructure | 84
6.4 Competition implications
The plans announced by both BT and Virgin Media to provide competing next-generation broadband infrastructure are likely to include a significant coverage overlap. However, the potential for other alternative operators to compete at the infrastructure level is less clear.
In the case of FTTC/VDSL, operators with limited market share will struggle to gain economies of scale, and so will face significant challenges if they choose to adopt a strategy based on SLU. This has been considered in detail in our two previous reports for the telecoms regulators in the Netherlands30 and Ireland31. Both of these studies concluded that the business case for alternative operators deploying SLU is challenging, and any possible deployments are very likely to be less widespread than LLU. There may be potential for SLU to be successful in some areas, especially if cabinets can be shared between multiple operators. A shared cabinet is assumed to be deployed in the base case for FTTC/VDSL in this report.
We have also considered a scenario in which only a single cabinet is dedicated to a single operator, and a scenario in which separate cabinets are constructed for two different operators. Within the AFTTC areas (which are most likely to see deployments of FTTC/VDSL) the costs of deploying a single dedicated cabinet fall by GBP150 million compared to the base case, and the scenario requiring two cabinets is GBP150 million more expensive than the base case.
However, even if SLU is deployed in some areas it is likely that many alternative operators will be reliant upon wholesale bitstream products. For such products to be successful they will need to offer sufficient flexibility to service providers to offer innovative services, at a reasonable cost. The ongoing work from Ofcom on Ethernet Active Line Access (ALA) will be particularly important in ensuring that there is a competitive retail market nationally.
There are likely to be large areas of the UK where there is a monopoly over the new cabinets and active equipment supporting FTTC/VDSL. However, it is important to note that this monopoly operator does not necessarily need to be BT, although it is likely that other operators would use wholesale input products from Openreach. One area where this situation may occur is South Yorkshire, where Thales Communication Systems has been selected as the preferred bidder for a public-sector intervention that should see FTTC/VDSL being deployed to the region on an open-access basis.
As part of the debate surrounding SLU it is worth noting that different approaches to infrastructure-based competition may have a significant impact upon the deployment costs.
One option for infrastructure-based competition in FTTH is unbundling fibre at the exchange. In the case of FTTH/PTP this is relatively straightforward and, as highlighted in our recent report for
30 http://www.opta.nl/asp/en/publications/document.asp?id=2119
31 http://www.comreg.ie/publications/sub-loop_unbundling__slu__report_prepared_by_analysys_consulting_limited_for_comreg.597.102967.p.html
Analysys Mason for Broadband Stakeholder Group
Ref: 12726-371

The costs of deploying fibre-based next-generation broadband infrastructure | 85
the Dutch regulator,32 it may have a similar business case to LLU. FTTH/GPON, on the other hand, uses shared fibre, and there are technical challenges that must be overcome before it can be unbundled. This may mean that bitstream products will play an important role in maintaining competition over FTTH/GPON infrastructure, at least initially. The additional costs of FTTH/PTP relative to FTTH/GPON should also be considered: under the base case, these amount to GBP1.8 billion for the urban AFTTH areas (68% population coverage).
Another option for competition in FTTH is duct access. This approach is being taken in other European countries, including Portugal (where access to the incumbent’s duct network is mandated) and France (where the regulator is looking closely at regulated duct access). The issues surrounding competition via duct access are being considered by Ofcom.
32 http://www.opta.nl/asp/publicaties/document.asp?id=2672
Analysys Mason for Broadband Stakeholder Group
Ref: 12726-371

The costs of deploying fibre-based next-generation broadband infrastructure | A–1
Annex A: Model assumptions relating to fibre deployment
As outlined in the main body of the report, the existing network is assumed to consist of six segments, labelled A to F. The average lengths of each segment are shown below in Figure A.1, and the total distances covered are shown in Figure A.2.
A segment B segment C segment D segment E segment F segmentLondon 258 775 166 29 4 4 1,>500k pop 359 1,076 280 49 7 8 1,779 >200k pop 354 1,062 314 55 7 9 1,802 >20k lines (a) 294 881 265 47 6 8 1,500 >20k lines (b) 778 2,335 579 102 13 20 3,>10k lines (a) 250 749 327 58 7 10 1,>10k lines (b) 475 1,425 889 157 20 30 2,>3k lines (a) 119 358 205 36 5 9 733 >3k lines (b) 521 1,562 586 103 16 37 2,825 >1k lines (a) 48 144 346 61 7 16 622 >1k lines (b) 176 528 1,099 194 23 70 2,090 <1k lines (a) 16 48 349 62 11 32 <1k lines (b) 205 615 1,093 193 32 126 2,264 National 327 981 425 75 10 20 1,
Average distance (m) TotalGeotype
238
828 400 997
517
839
Figure A.1: Average distances of each network segment [Source: Analysys Mason for BSG]
A segment B segment C segment D segment E segment F segmentLondon 67 2,242 480 5,045 409 991 9,>500k pop 219 6,810 1,771 18,607 2,212 5,618 35,>200k pop 191 5,934 1,758 18,462 2,086 6,004 34,>20k lines (a) 147 5,291 1,595 17,141 1,818 5,556 31,>20k lines (b) 390 10,188 2,524 22,843 2,771 9,839 48,>10k lines (a) 253 7,250 3,165 34,904 3,603 11,781 60,>10k lines (b) 482 5,903 3,683 33,854 4,122 14,334 62,>3k lines (a) 240 4,821 2,758 17,857 2,292 8,212 36,>3k lines (b) 1,045 34,724 13,033 59,060 8,566 38,639 155,066 >1k lines (a) 59 863 2,067 15,052 1,608 6,406 26,>1k lines (b) 216 4,931 10,271 49,867 5,886 29,889 101,060 <1k lines (a) 37 387 2,789 8,042 1,366 5,310 17,<1k lines (b) 472 9,844 17,492 40,433 6,539 33,746 108,527 National 3,819 99,186 63,387 341,166 43,279 176,325 727,
Geotype Total distance (km) Total
234 238 434 549 556 954 378 179
054
933
163
Figure A.2: Total distances of each network segment [Source: Analysys Mason for BSG]
The construction costs for new ducts are assumed to be dependent upon the terrain in which they are deployed. We have modelled four possible terrains in which fibre is deployed: in a road, in a footpath, in a grass verge, or situations in which fibre can be deployed aerially. The proportion of fibre that is deployed in each of these terrains is assumed to vary by geotype and network segment, according to the assumptions shown in the two tables below:
Analysys Mason for Broadband Stakeholder Group
Ref: 12726-371

The costs of deploying fibre-based next-generation broadband infrastructure | A–2
Geotype Fraction in road (A-D segments)
Fraction in footpath (A-D segments)
Fraction in grass verge (A-D segments)
Fraction aerially (A-D segments )
Inner London 15% 85% 0% 0%
>500k pop 15% 85% 0% 0%
>200k pop 15% 85% 0% 0%
>20k lines (a) 10% 85% 5% 0%
>20k lines (b) 10% 85% 5% 0%
>10k lines (a) 5% 75% 20% 0%
>10k lines (b) 5% 75% 20% 0%
>3k lines (a) 5% 45% 50% 0%
>3k lines (b) 5% 45% 50% 0%
>1k lines (a) 5% 35% 60% 0%
>1k lines (b) 5% 35% 60% 0%
<1k lines (a) 5% 25% 70% 0%
<1k lines (b) 5% 25% 70% 0%
Figure A.3: Proportion of fibre installed in different types of terrain, for segments A to D] [Source:
Analysys Mason for BSG]
Geotype Fraction in road (E-F segments)
Fraction in footpath (E-F segments)
Fraction in grass verge (E-F segments)
Fraction aerially (E-F segments)
Inner London 0% 98% 1% 1%
>500k pop 0% 90% 5% 5%
>200k pop 0% 80% 10% 10%
>20k lines (a) 0% 55% 30% 15%
>20k lines (b) 0% 55% 25% 20%
>10k lines (a) 0% 50% 30% 20%
>10k lines (b) 0% 50% 30% 20%
>3k lines (a) 0% 40% 30% 30%
>3k lines (b) 0% 35% 25% 40%
>1k lines (a) 0% 35% 25% 40%
>1k lines (b) 0% 30% 20% 50%
<1k lines (a) 0% 30% 20% 50%
<1k lines (b) 0% 25% 15% 60%
Figure A.4: Proportion of fibre installed in different types of terrain, for segments E to F [Source:
Analysys Mason for BSG]]
Analysys Mason for Broadband Stakeholder Group
Ref: 12726-371

The costs of deploying fibre-based next-generation broadband infrastructure | A–3
Where ducts are used, the model assumes that a proportion of the existing BT ducts can be re-used. The relevant assumptions are shown below in Figure A.5 (note these assumptions are not based upon any public data). The duct re-use assumptions only apply to the non-aerially deployed fibre.
Technology Segments A+B
Segments C+D
Segments E+F
Blended avg.
FTTC/VDSL 80% n/a N/a 80%
FTTH/GPON 80% 50% 30% 58%
FTTH/PTP 70% 40% 30% 45%
Figure A.5: Duct re-use
assumptions [Source:
Analysys Mason for
BSG]
Where existing ducts are re-used it is assumed that this is done at zero cost. In practice, if the ducts were to be used by somebody other than their owner, other charges might be payable (e.g. one-off or annual rental charges).
The installation costs for new ducts in each terrain type are as follows:
• road: GBP100 per metre • footpath: GBP60 per metre • grass verge: GBP40 per metre
final drop to customer: GBP15 per metre, plus a fixed cost of GBP100 per premises. •
The model assumes that none of the existing fibre-optic cable within ducts is re-usable, and that new cable has an installation cost of GBP8 per metre.
It is assumed that all aerially deployed fibre is installed using existing telegraph poles, and is subject to installation costs of GBP8 per metre.
Based upon the assumptions set out above, the resulting mix of fibre deployment methods for the three technologies over the whole network is shown below:
New ducts Re-used ducts Aerial
FTTC/VDSL 20% 80% 0%
FTTH/GPON 33% 55% 11%
FTTH/PTP 40% 48% 11%
Figure A.6: Mix of fibre
deployment techniques
over the whole network
[Source: Analysys
Mason for BSG]
For both ducts and aerial deployment, the following materials costs are included. These are assumed to be dependent upon the number of optical fibres per cable.
Analysys Mason for Broadband Stakeholder Group
Ref: 12726-371

The costs of deploying fibre-based next-generation broadband infrastructure | A–4
Optical fibres per cable Cost per metre (GBP)
276 8.00
240 7.00
192 6.00
144 5.00
96 4.00
48 3.00
24 2.00
12 1.40
8 1.20
4 1.00
2 1.00
Figure A.7: Materials
costs for fibre-optic
cables [Source:
Analysys Mason for
BSG]
A.1.1 Costs of deploying fibre
Based on these assumptions, the average cost of deploying new ducts to hold fibre-optic cables for each geotype is shown below in Figure A.8. It can be seen that, at a national level, the average cost per metre for the construction of new ducts is around GBP57 for FTTC/VDSL and GBP48 for FTTH, with higher costs in urban areas. The lower costs for FTTH are due to lower costs per metre as fibre is deployed closer to the premises.
-
10
20
30
40
50
60
70
80
Lond
on
>500
k pop
>200
k pop
>20k
lines
(a)
>20k
lines
(b)
>10k
lines
(a)
>10k
lines
(b)
>3k l
ines (
a)
>3k l
ines (
b)
>1k l
ines (
a)
>1k l
ines (
b)
<1k l
ines (
a)
<1k l
ines (
b)
Nation
al
Cos
ts o
f duc
t per
met
re in
stal
led
(GB
P p
er m
etre
FTTC/VDSL FTTH/GPON FTTH/PTP
Figure A.8: Average costs of constructing new ducts [Source: Analysys Mason for BSG]
Figure shows the average costs per metre of fibre-optic cable if the costs of new ducts, fibre installation and materials costs are all included. In this chart, the costs are now divided by the total distance of fibre (not the distance of new ducts as before). It can be seen that the lowest overall
Analysys Mason for Broadband Stakeholder Group
Ref: 12726-371

The costs of deploying fibre-based next-generation broadband infrastructure | A–5
cost per metre corresponds to FTTC/VDSL. This is due to this technology option having the highest duct re-use assumption. In the case of both FTTH technologies, a lower duct re-use is assumed beyond the location of the street cabinet. This leads to a higher average cost per metre, with FTTH/PTP being higher due to the assumption of a higher duct congestion with this technology.
-
10
20
30
40
50
60
Lond
on
>500
k pop
>200
k pop
>20k
lines
(a)
>20k
lines
(b)
>10k
lines
(a)
>10k
lines
(b)
>3k l
ines (
a)
>3k l
ines (
b)
>1k l
ines (
a)
>1k l
ines (
b)
<1k l
ines (
a)
<1k l
ines (
b)
Nation
al
Tota
l cos
ts o
f fib
re a
nd d
uct p
er m
etre
of c
able
inst
alle
d (G
Bpe
r met
re)
FTTC/VDSL FTTH/GPON FTTH/PTP
Figure A.9: Average cost per metre for fibre and ducts [Source: Analysys Mason for BSG]
The mix of new ducts, re-used ducts and aerial fibre (across the whole network) for each of the three technologies is shown below in Figure A.10.
New ducts Re-used ducts Aerial
FTTC/VDSL 20% 80% 0%
FTTH/GPON 27% 56% 17%
FTTH/PTP 33% 50% 17%
Figure A.10: Mix of fibre
deployment techniques
over the whole network
[Source: Analysys Mason
for BSG]
The model has assumed that all new ducts are installed specifically for the next-generation broadband network. If the civil works could be shared with other duct networks there may be potential for significant cost savings.
Analysys Mason for Broadband Stakeholder Group
Ref: 12726-371

Annex B: Illustration of model calculations for Inner London geotype
This annex provides a walk-through of the calculations used to generate the costs for deploying next-generation broadband using the figures for a single example geotype, namely Inner London.
B.1 FTTC/VDSL
General parameters: The total number of premises were taken from the geotype analysis. The number of lines to be migrated was calculated from the total premises and from the penetration, market share and take-up scenarios. The total numbers of exchanges and cabinets were divided amongst the geotypes using utilisation and weighting assumptions
.
General parametersPremises 1,445,789Lines migrated 408,895Number of exchanges 86Number of cabinets 2,892
Figure B.1: FTTC/VDSL
General Parameters for
Inner London [Source:
Analysys Mason for
BSG]
Costs for cabinets and active equipment: Total cabinet cost was calculated as the number of existing cabinets multiplied by the unit cost per cabinet. The number of DSLAMs required was calculated based on the number of lines and the capacity of the DSLAM (a minimum of one DSLAM per cabinet is installed). DSLAM utilisation was checked at this point. An additional ‘voice line’ cost was included for the full migration scenario. Costs of exchange switches calculated based on the capacity of the switch and the number of lines.
CabinetsCost per cabinet 13,500
Sub-total (millions) 39.04
Active equipmentDSLAMs 18,483Avg lines per DSLAM 22Utilisation 92%Cost per DSLAM 1,200Cost per voice line 10
Switches in exchanges 3,740 Cost per switch 5,000
Sub-total (millions) 40.88
Figure B.2: FTTC/VDSL
Cabinets and Active
Equipment costs for
Inner London [Source:
Analysys Mason for
BSG]

Costs of duct and fibre: The total length of duct required was calculated based on the total distance between the exchange and cabinet (segments A and B) and the duct re-use factor. The total distance was calculated from the average distances of segments A and B and the number of exchanges and cabinets in the geotype. The length of new duct was calculated from the total distance and the duct re-use factor. The average cost per metre of installing the duct was calculated based on the overall proportion of the different methods used (in road, in pavement, etc.). The total duct cost was then obtained.
Fibre costs were calculated based on the total length and the cost per metre, based on the size of the cable required to provide a fibre to each MSAN.
New ductsAvg distance of A segment (m) 258Avg distance of B segment (m) 775Duct re-use % 80%Distance of new duct (m) 452,895Avg cost per metre 67
Sub-total (millions) 30.48
Fibre and installationTotal distance (m) 2,308,932 Cost per metre 9.62
Sub-total (millions) 22.21
Figure B.3: FTTC/VDSL
Duct and Fibre costs for
Inner London [Source:
Analysys Mason for
BSG]
Costs of migration of lines and home wiring costs: These costs were added based on prices available in the public domain and the number of lines.
Migration of linesUnit cost 50.00
Sub-total (millions) 20.44
New faceplate in the homeUnit cost 5.00
Sub-total (millions) 2.04
Figure B.4: FTTC/VDSL
Migration and home
faceplate costs for Inner
London [Source:
Analysys Mason for
BSG]
Cost of optical distribution frame: Finally, the optical distribution frame costs were calculated based on the capacity required and the number of lines. It was assumed that there was a minimum of one ODF per exchange. Utilisation was also checked.

Optical distribution frameFibres to support 18,483Fibres per ODF 1,440Number of ODF 413Utilisation % 3%Unit cost of ODF 1,000 Connection cost per fibre 20.00
Sub-total (millions) 0.78
Figure B.5: FTTC/VDSL
ODF costs for Inner
London [Source:
Analysys Mason for
BSG]
SUMMARY: A summary of the various cost components is given below.
Summary (GBP millions)Optical Distribution Frame 0.78 Cabinet 39.04 Active Equipment 40.88 Fibre 52.68 Line migration 20.44 Home Wiring 2.04 TOTAL 155.87
Figure B.6: FTTC/VDSL
summary costs for Inner
London [Source:
Analysys Mason for
BSG]
B.2 FTTH/GPON
General parameters: The general parameters used for FTTH (see above) were extended to include the number of distribution points and the fraction of premises in flats (used to calculate in-building wiring costs).
General parametersPremises 1,445,789Lines migrated 408,895Number of exchanges 86Number of cabinets 2,892 Number of DP 172,118Fraction of homes/businesses in MDU 51%
Figure B.7: FTTH/GPON
general parameters for
Inner London [Source:
Analysys Mason for
BSG]
Costs of duct and fibre: Duct and fibre requirements were calculated in the same fashion as for FTTC, but extended beyond the cabinet to the premises. Separate duct re-use factors were defined for the lines before and after the cabinet.

New ducts (exc. final drop)Total fibre distance req'd (m) 8,242,897Aerial % 0%Blended re-use of ducts % 61%New duct req'd (m) 3,224,258Avg cost per metre 71.26
Sub-total (millions) 229.75
Fibre and installation (exc. final drop)Total distance (m) 8,242,897Cost per metre 9.61
Sub-total (millions) 79.20
Figure B.8: FTTH/GPON
duct and fibre costs
(excluding final drop) for
Inner London [Source:
Analysys Mason for
BSG]
Duct and fibre costs in the final drop were separated to allow the calculation of ‘per premises passed’ and ‘per premises connected’ costs.
Final drop (ducts, installation and materials)Houses built to 201,066Avg. distance (m) 5Avg cost per final drop 208
Sub-total (millions) 41.82
Figure B.9: FTTH/GPON
duct and fibre (final drop)
costs for Inner London
[Source: Analysys
Mason for BSG]
Cost of in-building wiring: In-building wiring was separated into vertical and horizontal components. Vertical wiring was assumed to be a per-building cost which increases with the size of the building. Horizontal wiring was assumed to be a fixed cost per premise.
In-building wiring (vertical)Buildings 75,948Premises per building 9Avg cost per building 1,630.40
Sub-total (millions) 123.83
In-building wiring (horizontal)Premises connected 207,829Cost per Premises 100
Sub-total (millions) 20.78
Figure B.10:
FTTH/GPON in-building
wiring costs for Inner
London [Source:
Analysys Mason for
BSG]
Costs of active equipment, splitters and CPE: The costs of active equipment in the exchange and splitters were calculated based on the number of lines and the capacity of the two components. CPE was assumed to be a fixed cost for each line migrated to the network.

Active equipmentOLTs required 442Total ports 14,154Lines supported 452,927Utilisation (lines) 90%Unit cost 57,600
Sub-total (millions) 25.48
SplittersAt cabinet 14,224At DP 137,171Max lines supported 910,320Utilisation (lines) 45%Unit cost 70
Sub-total (millions) 10.60
CPEUnit cost 80
Sub-total (millions) 32.71
Figure B.11:
FTTH/GPON active
equipment, splitter and
CPE costs for Inner
London [Source:
Analysys Mason for
BSG]
Cost of optical distribution frames: The optical distribution frames costs were calculated in a similar manner as for FTTC.
Optical distribution frameFibres to support 12,821Fibres per ODF 1,440Number of ODF 86Utilisation % 10%Unit cost of ODF 5,000 Connection cost per fibre 20.00
Sub-total (millions) 0.69
Figure B.12:
FTTH/GPON ODF costs
for Inner London
[Source: Analysys
Mason for BSG]
SUMMARY: Again, a summary of the various costs is given below.
Summary (GBP millions)Optical Distribution Frame 0.69 Active equipment + splitters 36.07 Fibre (exc. final drop) 308.95 Fibre (final drop) 62.60 In-building wiring (exc. final drop) 123.83 CPE 32.71 TOTAL 564.85
Figure B.13:
FTTH/GPON summary
costs for Inner London
[Source: Analysys
Mason for BSG]
B.3 FTTH/PTP
General parameters: General parameters for FTTH/PTP are the same as for FTTH/GPON (see above).

Costs of duct and fibre: Duct and fibre requirements were calculated in the same way as for FTTH/GPON, although different duct re-use factors were used for FTTH/PTP in recognition of the fact that larger bundles of fibre-optic cable are used. The cost per metre of the fibre is also higher.
New ducts (exc. final drop)Total fibre distance req'd (m) 8,242,897Aerial % 0%Blended re-use of ducts % 48%New duct req'd (m) 4,291,098Avg cost per metre 65.59
Sub-total (millions) 281.45
Fibre and installation (exc. final drop)Total distance (m) 8,242,897Cost per metre 16.65
Sub-total (millions) 137.23
Figure B.14: FTTH/PTP
duct and fibre (excl final
drop) costs for Inner
London [Source:
Analysys Mason for
BSG]
Duct and fibre requirements for the final drop were again calculated separately, using the same method as for FTTH/GPON.
Final drop (ducts, installation and materials)Houses built to 201,066Avg. distance (m) 5Avg cost per final drop 208
Sub-total (millions) 41.82
Figure B.15: FTTH/PTP
duct and fibre (final drop)
costs for Inner London
[Source: Analysys
Mason for BSG]
Cost of in-building wiring: In-building wiring costs were calculated as for FTTH/GPON.
Costs of active equipment and CPE: Costs of Ethernet switches for the exchange were calculated based on switch capacity and the number of lines. CPE costs were again assumed to be a fixed cost per line connected.
Active equipmentEthernet switches required 8,562Lines per switch 48Lines supported 410,959Utilisation (lines) 99%Unit cost 5,000
Sub-total (millions) 42.81
CPEUnit cost 35
Sub-total (millions) 14.31
Figure B.16: FTTH/PTP
active equipment and
CPE costs for Inner
London [Source:
Analysys Mason for
BSG]

Cost of optical distribution frames: Optical distribution frame requirements were calculated in a similar same way to FTTH/GPON, but with additional fibre-optic cables.
Optical distribution frameFibres to support 408,895Fibres per ODF 1,440Number of ODF 327Utilisation % 87%Unit cost of ODF 5,000 Connection cost per fibre 20.00
Sub-total (millions) 9.81
Figure B.17: FTTH/PTP
ODF costs for Inner
London [Source:
Analysys Mason
SUMMARY: A summary of the various cost components is given below.
Summary (GBP millions)Optical Distribution Frame 9.81 Active equipment + splitters 42.81 Fibre (exc. final drop) 418.68 Fibre (final drop) 62.60 In-building wiring (exc. final drop) 123.83 CPE 14.31 TOTAL 672.04
Figure B.18: FTTH/PTP
summary costs for Inner
London [Source:
Analysys Mason for
BSG]]

Annex C: Selected detailed maps of deployment areas
The following maps are detailed versions of Figure 5.4 that focus on the South West and North East of England to illustrate how the AFTTC, BFTTC and CFTTC areas are distributed.
CFTTC
BFTTC
AFTTC
Figure C.1: Map of AFTTC,
BFTTC and CFTTC areas for
the South West of
England [Source:
Analysys Mason for
BSG]
CFTTC
BFTTC
AFTTC
Figure C.2: Map of AFTTC,
BFTTC and CFTTC areas for
the North East of
England [Source:
Analysys Mason for
BSG]]

Annex D: Detailed results tables for the base case

Ann
ex D
: Det
aile
d re
sults
tabl
es fo
r the
bas
e ca
se
Lond
on>5
00k
pop
>200
k po
p>2
0k li
nes
(a)
>20k
line
s (b
)>1
0k li
nes
(a)
>10k
line
s (b
)>3
k lin
es (a
)>3
k lin
es (b
)>1
k lin
es (a
)>1
k lin
es (b
)
Prem
ises
Pre
mis
es p
asse
d1,
445,
789
3,16
4,45
62,
794,
786
2,85
3,91
41,
744,
926
4,35
5,45
71,
553,
331
2,75
9,31
73,
190,
774
1,10
2,70
21,
149,
607
Pre
mis
es c
onne
cted
408,
895
865,
740
783,
542
826,
432
529,
538
1,31
8,72
450
0,10
195
2,08
71,
103,
330
420,
968
435,
085
Ove
rall
take
-up
28%
27%
28%
29%
30%
30%
32%
35%
35%
38%
38%
Pre
mis
es (%
of t
otal
)5.
30%
11.6
1%10
.25%
10.4
7%6.
40%
15.9
8%5.
70%
10.1
2%11
.71%
4.05
%4.
22%
Frac
tion
of h
omes
in fl
ats
51%
18%
17%
17%
7%11
%6%
9%5%
4%2%
Pre
mis
es p
er b
uild
ing
9.32
7.88
7.38
7.40
7.32
7.52
7.97
8.32
9.11
10.3
321
.00
FTTC
/VD
SLS
cena
rio: g
radu
al m
igra
tion,
sin
gle
shar
ed c
abin
et
Set-u
p C
osts
155,
870,
342
38
1,74
7,97
9
338,
196,
874
33
1,62
2,18
7
376,
059,
573
49
6,81
6,69
8
269,
230,
086
44
0,70
8,13
3
1,18
9,38
1,99
0
17
1,29
8,06
5
299,
631,
044
Opt
ical
dis
tribu
tion
fram
e78
2,32
31,
671,
478
1,50
7,69
41,
581,
051
969,
809
2,19
5,72
591
6,34
61,
927,
953
2,28
3,41
51,
410,
550
911,
996
Cab
inet
39,0
36,3
0385
,440
,312
75,4
59,2
2281
,111
,240
58,8
91,2
5313
0,66
3,71
055
,919
,916
181,
639,
277
300,
058,
664
80,6
53,6
1212
6,12
6,49
2A
ctiv
e eq
uipm
ent
40,8
77,7
5986
,831
,293
78,4
23,1
7782
,782
,831
53,3
39,4
9713
2,54
4,73
950
,399
,057
104,
582,
352
125,
587,
814
48,2
35,5
3650
,159
,780
Civ
ils52
,684
,744
160,
189,
202
139,
711,
993
120,
693,
305
233,
734,
445
158,
882,
684
134,
489,
195
100,
193,
783
700,
768,
944
17,8
45,1
1198
,503
,093
Line
mig
ratio
n20
,444
,740
43,2
86,9
9439
,177
,081
41,3
21,6
0026
,476
,882
65,9
36,2
1825
,005
,065
47,6
04,3
3555
,166
,503
21,0
48,4
1521
,754
,258
In-h
ome
2,04
4,47
44,
328,
699
3,91
7,70
84,
132,
160
2,64
7,68
86,
593,
622
2,50
0,50
74,
760,
434
5,51
6,65
02,
104,
841
2,17
5,42
6
Tota
l set
-up
cost
s pe
r pre
mis
es p
asse
d10
8
121
12
1
116
21
6
114
17
3
160
37
3
155
26
1
O
ptic
al d
istri
butio
n fra
me
11
11
11
11
11
1C
abin
et27
2727
2834
3036
6694
7311
0A
ctiv
e eq
uipm
ent
2827
2829
3130
3238
3944
44C
ivils
3651
5042
134
3687
3622
016
86Li
ne m
igra
tion
1414
1414
1515
1617
1719
19In
-hom
e1
11
12
22
22
22
Tota
l set
-up
cost
s pe
r pre
mis
es c
onne
cted
381
44
1
432
40
1
710
37
7
538
46
3
1,07
8
40
7
689
Opt
ical
dis
tribu
tion
fram
e2
22
22
22
22
32
Cab
inet
9599
9698
111
9911
219
127
219
229
0A
ctiv
e eq
uipm
ent
100
10
010
010
010
110
110
111
011
411
511
5C
ivils
129
185
178
146
441
120
269
105
635
4222
6Li
ne m
igra
tion
5050
5050
5050
5050
5050
50In
-hom
e5
55
55
55
55
55
FTTH
/GPO
NS
cena
rio: g
radu
al m
igra
tion
Set-u
p C
osts
564,
846,
922
1,
601,
173,
526
1,53
2,64
4,81
2
1,
404,
776,
916
1,73
0,35
1,58
3
2,
460,
240,
462
2,14
3,15
8,67
9
1,
398,
060,
951
4,45
0,89
3,13
6
93
2,67
7,79
4
2,86
9,43
2,95
2
Opt
ical
dis
tribu
tion
fram
e68
6,41
91,
563,
127
1,39
1,51
41,
353,
190
390,
379
2,85
8,26
337
1,59
35,
620,
084
821,
072
6,42
5,40
533
3,57
3A
ctiv
e eq
uipm
ent +
spl
itter
s36
,074
,745
77,4
48,8
4469
,668
,779
73,3
51,8
1343
,560
,787
121,
805,
711
41,2
96,4
4911
0,60
0,54
594
,883
,990
84,2
90,8
7538
,555
,776
Civ
ils (e
xc. f
inal
dro
p)30
8,94
6,48
81,
134,
628,
531
1,09
5,07
5,38
496
3,17
9,83
11,
385,
186,
335
1,76
0,73
7,83
01,
735,
928,
055
907,
119,
343
3,52
1,43
4,06
565
3,65
8,55
22,
319,
189,
728
Civ
ils (f
inal
dro
p)62
,602
,204
195,
512,
204
190,
105,
767
183,
888,
291
224,
635,
847
338,
215,
734
299,
850,
068
229,
961,
648
702,
527,
292
140,
218,
324
469,
653,
347
In-b
uild
ing
wiri
ng (e
xc. f
inal
dro
p)12
3,82
5,48
312
2,76
1,62
911
3,72
0,04
111
6,88
9,23
134
,215
,224
131,
124,
974
25,7
04,4
1068
,592
,395
42,9
60,3
1314
,407
,174
6,89
3,71
5C
PE
32,7
11,5
8469
,259
,191
62,6
83,3
2966
,114
,560
42,3
63,0
1110
5,49
7,94
940
,008
,104
76,1
66,9
3688
,266
,405
33,6
77,4
6434
,806
,813
Tota
l set
-up
cost
s pe
r pre
mis
es p
asse
d39
1
506
54
8
492
99
2
565
1,
380
507
1,
395
846
2,
496
O
ptic
al d
istri
butio
n fra
me
00
00
01
02
06
0A
ctiv
e eq
uipm
ent +
spl
itter
s25
2425
2625
2827
4030
7634
Civ
ils (e
xc. f
inal
dro
p)21
435
939
233
779
440
41,
118
329
1,10
459
32,
017
Civ
ils (f
inal
dro
p)43
6268
6412
978
193
8322
012
740
9In
-bui
ldin
g w
iring
(exc
. fin
al d
rop)
8639
4141
2030
1725
1313
6C
PE
2322
2223
2424
2628
2831
30
Tota
l set
-up
cost
s pe
r pre
mis
es c
onne
cted
1,38
1
1,
849
1,95
6
1,
700
3,26
8
1,
866
4,28
5
1,
468
4,03
4
2,
216
6,59
5
Opt
ical
dis
tribu
tion
fram
e2
22
21
21
61
151
Act
ive
equi
pmen
t + s
plitt
ers
8889
8989
8292
8311
686
200
89C
ivils
(exc
. fin
al d
rop)
756
1,31
11,
398
1,16
52,
616
1,33
53,
471
953
3,19
21,
553
5,33
0C
ivils
(fin
al d
rop)
153
226
243
223
424
256
600
242
637
333
1,07
9In
-bui
ldin
g w
iring
(exc
. fin
al d
rop)
303
142
145
141
6599
5172
3934
16C
PE
8080
8080
8080
8080
8080
80
FTTH
/PTP
Sce
nario
: gra
dual
mig
ratio
n
Set-u
p C
osts
672,
042,
387
1,
950,
392,
339
1,86
0,07
1,44
8
1,
691,
424,
967
2,19
0,68
5,20
4
2,
902,
688,
375
2,55
4,17
4,20
4
1,
571,
766,
167
5,35
4,89
7,02
6
99
7,90
8,82
5
3,28
1,18
4,37
1
Opt
ical
dis
tribu
tion
fram
e9,
812,
669
20,8
30,8
3918
,841
,463
19,8
15,6
9612
,429
,425
31,9
68,3
9111
,738
,489
24,8
55,0
9125
,897
,608
14,5
69,3
6610
,212
,416
Act
ive
equi
pmen
t + s
plitt
ers
42,8
08,2
0890
,691
,238
82,0
68,9
1886
,504
,167
55,1
60,1
7013
8,38
2,12
152
,093
,886
101,
683,
198
114,
930,
215
46,9
25,8
6445
,321
,371
Civ
ils (e
xc. f
inal
dro
p)41
8,68
2,50
61,
490,
295,
533
1,42
7,91
1,30
41,
255,
402,
462
1,84
5,71
0,72
02,
216,
841,
802
2,14
7,28
3,80
51,
113,
350,
802
4,42
9,96
5,04
576
7,05
4,20
72,
733,
875,
542
Civ
ils (f
inal
dro
p)62
,602
,204
195,
512,
204
190,
105,
767
183,
888,
291
224,
635,
847
338,
215,
734
299,
850,
068
229,
961,
648
702,
527,
292
140,
218,
324
469,
653,
347
In-b
uild
ing
wiri
ng (e
xc. f
inal
dro
p)12
3,82
5,48
312
2,76
1,62
911
3,72
0,04
111
6,88
9,23
134
,215
,224
131,
124,
974
25,7
04,4
1068
,592
,395
42,9
60,3
1314
,407
,174
6,89
3,71
5C
PE
14,3
11,3
1830
,300
,896
27,4
23,9
5628
,925
,120
18,5
33,8
1746
,155
,353
17,5
03,5
4633
,323
,035
38,6
16,5
5214
,733
,890
15,2
27,9
81
Tota
l set
-up
cost
s pe
r pre
mis
es p
asse
d46
5
616
66
6
593
1,
255
666
1,
644
570
1,
678
905
2,
854
O
ptic
al d
istri
butio
n fra
me
77
77
77
89
813
9A
ctiv
e eq
uipm
ent +
spl
itter
s30
2929
3032
3234
3736
4339
Civ
ils (e
xc. f
inal
dro
p)29
047
151
144
01,
058
509
1,38
240
31,
388
696
2,37
8C
ivils
(fin
al d
rop)
4362
6864
129
7819
383
220
127
409
In-b
uild
ing
wiri
ng (e
xc. f
inal
dro
p)86
3941
4120
3017
2513
136
CP
E10
1010
1011
1111
1212
1313
Tota
l set
-up
cost
s pe
r pre
mis
es c
onne
cted
1,64
4
2,
253
2,37
4
2,
047
4,13
7
2,
201
5,10
7
1,
651
4,85
3
2,
371
7,54
1
Opt
ical
dis
tribu
tion
fram
e24
2424
2423
2423
2623
3523
Act
ive
equi
pmen
t + s
plitt
ers
105
105
105
105
104
105
104
107
104
111
104
Civ
ils (e
xc. f
inal
dro
p)1,
024
1,72
11,
822
1,51
93,
486
1,68
14,
294
1,16
94,
015
1,82
26,
284
Civ
ils (f
inal
dro
p)15
322
624
322
342
425
660
024
263
733
31,
079
In-b
uild
ing
wiri
ng (e
xc. f
inal
dro
p)30
314
214
514
165
9951
7239
3416
CP
E35
3535
3535
3535
3535
3535
Ana
lysy
s M
ason
for B
road
band
Sta
keho
lder
Gro
up
1272
6-36
6