Embed Size (px)
Citation preview

Final Report for Air Exchange Rate Analysis
and Protocol Development
Submitted to:
Air Force Center for Engineering and the Environment/AC Building 171 2261 Hughes Ave. Suite 155 Lackland AFB, TX 78236-9853
Prepared by:
Tetra Tech, Inc. 3746 Mt. Diablo Blvd., Suite 300 Lafayette, CA 94549 Tetra Tech, Inc. 301 Mentor Dr., Suite A Santa Barbara, CA 93110
February 2012


Tetra Tech, Inc. i
Table of Contents
1 INTRODUCTION...................................................................................................................1-1
2 SITE BACKGROUND INFORMATION ......................................................................................2-1
2.1 Site Background Information (Facility 1381, CCAFS) ................................................2-1
2.2 Site Background Information (Building 1416, former Kelly AFB) ...............................2-2
2.3 Site Background Information (Building 1130, Travis AFB) .........................................2-4
3 AIR EXCHANGE RATE STUDY FIELD INVESTIGATIONS ...........................................................3-1
3.1 Facility 1381, Cape Canaveral Air Force Station .......................................................3-1
3.1.1 Building Description and Indoor Volume Estimates .....................................3-1
3.1.2 Experimental Design ...................................................................................3-4
3.1.2.1 SF6 Tracer Gas Release ............................................................3-5
3.1.2.2 Helium Gas Release ..................................................................3-7
3.1.3 CCAFS Experiment 1 Implementation .........................................................3-7
3.1.4 CCAFS Experiment 2 Implementation .........................................................3-8
3.1.5 CCAFS Meteorology ...................................................................................3-8
3.2 Building 1416, Former Kelly Air Force Base ..............................................................3-9
3.2.1 Building Description and Indoor Volume Estimates .....................................3-9
3.2.2 Experimental Design ................................................................................. 3-10
3.2.2.1 SF6 Tracer Gas Release .......................................................... 3-11
3.2.2.2 Helium Gas Release ................................................................ 3-12
3.2.3 Kelly AFB Implementation ......................................................................... 3-13
3.2.4 Kelly AFB Meteorology .............................................................................. 3-13
3.3 Building 1130, Travis Air Force Base ...................................................................... 3-13
3.3.1 Building Description and Indoor Volume Estimates ................................... 3-14
3.3.2 Experimental Design ................................................................................. 3-17
3.3.2.1 SF6 Tracer Gas Release .......................................................... 3-18
3.3.2.2 Helium Gas Release ................................................................ 3-18
3.3.3 Travis AFB Implementation ....................................................................... 3-18

Final Report for Air Exchange Rate Analysis and Protocol Development
ii Tetra Tech, Inc.
3.3.4 Travis AFB Meteorology ............................................................................ 3-19
3.3.5 Variances from the Travis AFB Work Plan ................................................. 3-19
4 EXPERIMENTAL RESULTS ...................................................................................................4-1
4.1 Facility 1381, Cape Canaveral Air Force Station (CCAFS) .......................................4-1
4.2 Building 1416, Former Kelly Air Force Base ..............................................................4-8
4.3 Building 1130, Travis Air Force Base ...................................................................... 4-15
5 AIR EXCHANGE RATE ANALYSIS .........................................................................................5-1
5.1 Facility 1381, Cape Canaveral Air Force Station .......................................................5-2
5.1.1 Analysis of He Release Methods for AER Predictions .................................5-2
5.1.2 Analysis of SF6 Release Methods for AER Predictions ................................5-6
5.1.3 Comparison of Results ................................................................................5-9
5.2 Building 1416, Former Kelly Air Force Base ............................................................ 5-10
5.2.1 Analysis of He Release Methods for Air Exchange Rate Predictions ......... 5-11
5.2.2 Analysis of SF6 Release Methods for AER Predictions .............................. 5-12
5.2.3 Comparison of Results .............................................................................. 5-19
5.2.3.1 Least Squares Tests ................................................................ 5-19
5.2.3.2 SUMMA Tests .......................................................................... 5-21
5.3 Building 1130, Travis Air Force Base ...................................................................... 5-21
5.3.1 Analysis of He Release Methods for AER Predictions ............................... 5-22
5.3.2 Analysis of SF6 Release Methods for AER Predictions .............................. 5-23
5.3.3 Comparison of Results .............................................................................. 5-25
6 DISCUSSION AND CONCLUSIONS .........................................................................................6-1
6.1 Cape Canaveral Air Force Station ............................................................................6-1
6.2 Former Kelly Air Force Base .....................................................................................6-1
6.3 Travis Air Force Base ...............................................................................................6-2
6.4 Issues and their Resolutions .....................................................................................6-2
6.4.1 Use of MGD-2002 Field Helium Detector .....................................................6-3
6.4.2 Loss of Helium From Tedlar Bags ...............................................................6-3
6.4.3 Helium Shortage and Cost ..........................................................................6-3
6.5 Cost Comparison ......................................................................................................6-4
6.6 Overall Conclusions ..................................................................................................6-6
6.7 Further Method Development/Validation ...................................................................6-7
7 REFERENCES .....................................................................................................................7-1

Final Report for Air Exchange Rate Analysis and Protocol Development
Tetra Tech, Inc. iii
APPENDIX A PROTOCOL FOR AIR EXCHANGE RATE CALCULATIONS
APPENDIX B THEORY AND SOLUTION TO LEAST SQUARES METHODS FOR INSTANTANEOUS
HE RELEASES
APPENDIX C MODIFIED ASTM METHODS USED DURING PROJECT TO COMPARE AGAINST
LEAST SQUARE RESULTS
APPENDIX D MATLAB CODE

Final Report for Air Exchange Rate Analysis and Protocol Development
iv Tetra Tech, Inc.
This page intentionally left blank.

Tetra Tech, Inc. v
List of Figures
Figure 2-1 Location of Facility 1381, Tower 303, and the Skid Strip weather sensors. .......2-1
Figure 2-2 Photograph of Facility 1381 at CCAFS looking east-northeast. .........................2-2
Figure 2-3 Location of Building 1416 at former Kelly AFB ..................................................2-3
Figure 2-4 View of East Side of Building 1416 at former Kelly AFB, ...................................2-4
Figure 2-5 Location of Building 1130 at Travis AFB ...........................................................2-5
Figure 2-6 View of southeast side of Building 1130 at Travis AFB......................................2-6
Figure 3-1 Floor Plan of Facility 1381 at CCAFS illustrating components of the AER experiments. .....................................................................................................3-2
Figure 3-2 Photographs of cracks in closed doors and building walls that may affect the AER ............................................................................................................3-3
Figure 3-3 Photograph of Room 4 looking northeast. HVAC ducting panel is visible in the upper left. ....................................................................................................3-4
Figure 3-4 Photograph of the SF6 cylinder, two-stage pressure regulator, and flow controller. ..........................................................................................................3-6
Figure 3-5 Photographs of MIRAN SapphIRe portable gas analyzer. .................................3-6
Figure 3-6 Floor Plan of Building 1416 illustrating components of the AER experiment. .......................................................................................................3-9
Figure 3-7 View of manifolded SF6 tubing with blue gas cylinder and rotameters positioned in empty red fire extinguisher fastener. .......................................... 3-10
Figure 3-8 View of SF6 analyzer and two collocated SUMMA canisters on the desk in the shop. ......................................................................................................... 3-12
Figure 3-9 View of SF6 analyzer, hand-held He detector, SF6 cylinder with two-stage regulator connected to variable flow meter and manifold, and two collocated SUMMA canisters .......................................................................... 3-14
Figure 3-10 Floor Plan of Building 1130 schematically illustrating components of the AER experiment. ............................................................................................. 3-15
Figure 3-11 View of the equipment room looking northeast; the front doors are to the right................................................................................................................. 3-16
Figure 3-12 View of equipment room look east toward front door and view of generator room vents from outside of Building 1130 looking north. ................. 3-16
Figure 4-1 Plot of logged SF6 concentrations measured on-site at CCAFS Facility 1381 and laboratory sample results. .................................................................4-5
Figure 4-2 Plot of logged SF6 concentrations at CCAFS Facility 1381 measured on-site and outdoor ambient temperatures. ............................................................4-6

Final Report for Air Exchange Rate Analysis and Protocol Development
vi Tetra Tech, Inc.
Figure 4-3 Plot of logged SF6 concentrations measured on-site at CCAFS Facility 1381 and barometric pressure. .........................................................................4-7
Figure 4-4 Plot of logged SF6 concentrations measured on-site at CCAFS Facility 1381 and wind speed. .......................................................................................4-8
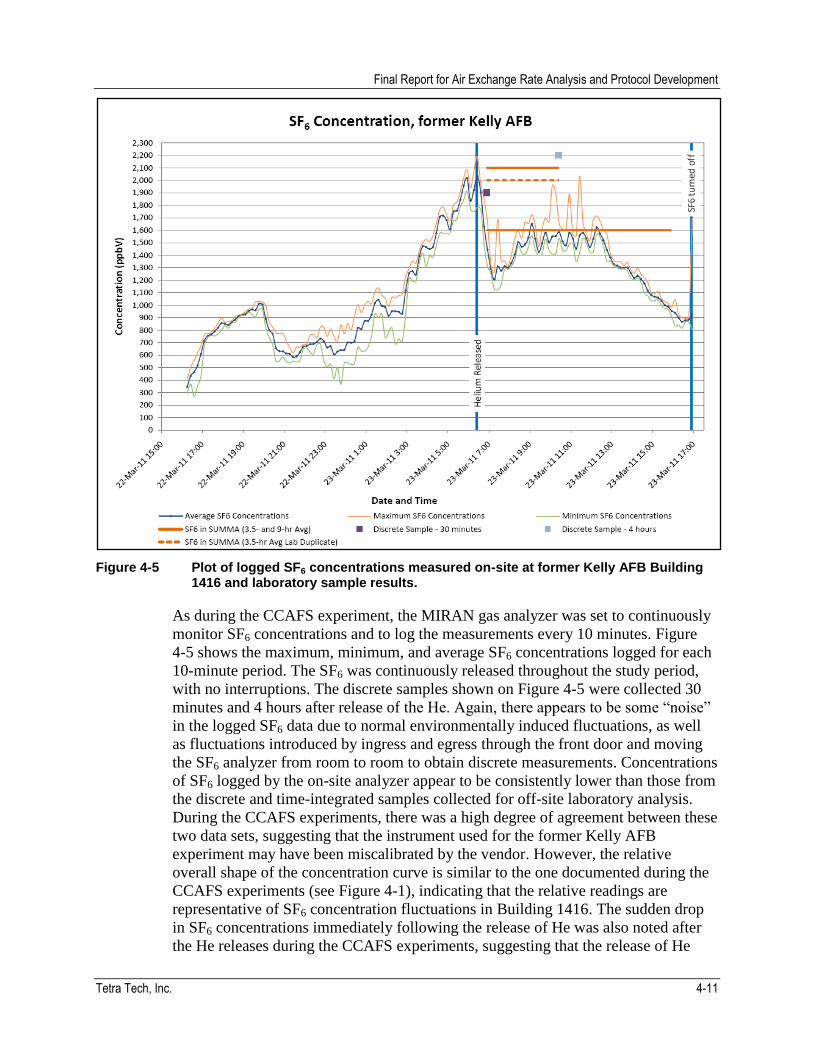
Figure 4-5 Plot of logged SF6 concentrations measured on-site at former Kelly AFB Building 1416 and laboratory sample results. .................................................. 4-11
Figure 4-6 Plot of logged SF6 concentrations measured on-site at former Kelly AFB Building 1416 and outdoor ambient temperatures. .......................................... 4-13
Figure 4-7 Plot of logged SF6 concentrations measured on-site at former Kelly AFB Building 1416 and barometric pressure. .......................................................... 4-14
Figure 4-8 Plot of logged SF6 concentrations measured on-site at former Kelly AFB Building 1416 and wind speed. ....................................................................... 4-15
Figure 4-9 Plot of logged SF6 concentrations measured on-site at Travis AFB Building 1130 and laboratory sample results. .................................................. 4-18
Figure 4-10 Relationship between field measurements and laboratory results ................... 4-20
Figure 4-11 Plot of logged SF6 concentrations measured on-site at Travis AFB Building 1130 and outdoor ambient temperatures. .......................................... 4-22
Figure 4-12 Plot of logged SF6 concentrations measured on-site at Travis AFB Building 1130 and barometric pressure. .......................................................... 4-23
Figure 4-13 Plot of logged SF6 concentrations measured on-site at Travis AFB Building 1130 and wind speed. ....................................................................... 4-24
Figure 5-1 Relationship between tests conducted for air exchange rate analysis at CCAFS.. ...........................................................................................................5-2
Figure 5-2 Results of AER calculations at CCAFS using SUMMA approach and instantaneous helium releases. .........................................................................5-5
Figure 5-3 Predicted AERs from continuous SF6 releases into Facility 1381 at CCAFS. ............................................................................................................5-8
Figure 5-4 AER calculated based on SUMMA data and continuous release of SF6. ...........5-9
Figure 5-5 Relationship between air exchange rate tests for former Kelly AFB. ............... 5-11
Figure 5-6 Plots of distributions of air exchange rates at Building 1416, former Kelly AFB................................................................................................................. 5-15
Figure 5-7 Results of AER calculations using SUMMA approach and instantaneous He releases, Building 1416, former Kelly AFB. ................................................ 5-16
Figure 5-8 Time series of SF6 concentrations and air exchange rates for former Kelly AFB................................................................................................................. 5-17
Figure 5-9 Air exchange rates calculated by continuous SF6 release using SUMMA canisters, former Kelly AFB. ............................................................................ 5-18
Figure 5-10 Relationship between air exchange rate tests for Building 1130 at Travis AFB................................................................................................................. 5-22
Figure 5-11 Predicted AERs and SF6 concentration in Building 1130 at Travis AFB. ......... 5-24
Figure 5-12 AERs calculated based on SUMMA data and continuous release of SF6, Building 1130, Travis AFB.. ............................................................................. 5-25
Figure 5-13 Summary of air exchange rate test results for Travis AFB. .............................. 5-26

Tetra Tech, Inc. vii
List of Tables
Table 1-1 Summary Table for Three Buildings Used in Protocol Development .................1-2
Table 3-1 Summary Table of Indoor Volumes for Facility 1381 .........................................3-3
Table 3-2 Summary of Field Activities at Facility 1381, CCAFS ........................................3-5
Table 3-3 Helium Mass Released into Facility 1381 ..........................................................3-7
Table 3-4 Summary Table of Indoor Volumes for Building 1416 ..................................... 3-10
Table 3-5 Summary of Field Activities at Building 1416, Former Kelly AFB ..................... 3-11
Table 3-6 Helium Mass Released into Building 1416 at former Kelly AFB ....................... 3-12
Table 3-7 Summary Table of Indoor Volumes for Building 1130 ..................................... 3-17
Table 3-8 Summary of Field Activities, Building 1130, Travis AFB .................................. 3-17
Table 3-9 Helium Mass Released into Building 1130 at Travis AFB ................................ 3-18
Table 4-1 Helium Concentrations in Facility 1381 at CCAFS ............................................4-2
Table 4-2 SF6 Concentrations in Facility 1381 at CCAFS ..................................................4-3
Table 4-3 Discrete SF6 Concentrations in Facility 1381 at CCAFS ....................................4-4
Table 4-4 Helium Concentrations in Building 1416 at Former Kelly AFB ...........................4-9
Table 4-5 SF6 Concentrations in Building 1416 at Former Kelly AFB ................................4-9
Table 4-6 Discrete SF6 Concentrations in Building 1416 at Former Kelly AFB ................ 4-10
Table 4-7 Helium Concentrations in Building 1130 at Travis AFB ................................... 4-16
Table 4-8 Helium Concentrations in Building 1130 at Travis AFB as Measured at Multiple Times After Sample Collection ........................................................... 4-16
Table 4-9 SF6 Concentrations in Building 1130, Travis AFB ........................................... 4-17
Table 4-10 Discrete SF6 Concentrations in Building 1130 at Travis AFB ........................... 4-17
Table 5-1 Air Exchange Rate Results for He Tests Conducted at CCAFS using Least-Squares Methods ....................................................................................5-3
Table 5-2 Estimated Percentile Ranges of AERs Calculated using Instantaneous He Releases into Facility 1381 at CCAFS ..............................................................5-4
Table 5-3 Averaged AERs Calculated by Finite Difference Methods for Continuous SF6 Releases into Facility 1381 at CCAFS ........................................................5-9
Table 5-4 Summary of AER Results for Facility 1381 at CCAFS ..................................... 5-10
Table 5-5 Air Exchange Rate Results for He Tests Conducted at Former Kelly AFB using Least-Squares Methods......................................................................... 5-12
Table 5-6 Least Squares Air Exchange Rate Results for He Tests: Monte Carlo Analysis at Building 1416, Former Kelly AFB .................................................. 5-14

Final Report for Air Exchange Rate Analysis and Protocol Development
viii Tetra Tech, Inc.
Table 5-7 Air Exchange Rates, Day-1, Over Interval Shown ............................................ 5-20
Table 5-8 Summary of Air Exchange Rate Analysis for Former Kelly AFB ...................... 5-21
Table 5-9 Air Exchange Rate Results for He Tests Conducted at Building 1130 at Travis AFB ...................................................................................................... 5-23
Table 5-10 Summary of Air Exchange Rate Analysis for Building 1130, Travis AFB ......... 5-26
Table 6-1 Helium vs. SF6 Method Cost Comparison .........................................................6-5
Table 6-2 Helium vs. SF6 Method Cost Comparison .........................................................6-6

Tetra Tech, Inc. 1-1
1 INTRODUCTION
Tetra Tech, Inc. (Tetra Tech) was contracted by the United States Air Force (USAF),
Air Force Center for Engineering and the Environment (AFCEE) to conduct
experiments designed to validate an innovative and cost-effective methodology for
estimating the air exchange rate (AER) of a building. The methodology was
employed during vapor intrusion investigations conducted at four Air Force
installations in 2008 (Tetra Tech 2009a, b, c, d). The objective of this investigation
was to quantitatively validate the methodology against a standard American Society
for Testing and Materials (ASTM) method (ASTM E741-00). Research for this study
was conducted at (1) Cape Canaveral Air Force Station (CCAFS), Florida; (2)
former Kelly Air Force Base (AFB), Texas; and (3) Travis AFB, California.
The AER of a building is critical in determining whether vapor intrusion (VI) may
result in unacceptable concentrations of volatiles in indoor air. A building with
relatively high rates of VI may never develop high indoor air concentrations, as
vapors will be continually flushed out of the building and replaced with ambient air.
Conversely, a building with very low AER could be subject to significant buildup of
indoor air concentrations, even with a relatively low concentration source or low rate
of intrusion. Commonly used methods of measuring AERs tend to be somewhat
cumbersome and costly; however, during previous vapor intrusion investigations
conducted at CCAFS, Travis AFB, former Kelly AFB, and Vandenberg AFB, a
relatively simple and cost-effective method for determining AERs was developed
and used (Tetra Tech 2009a, b, c, d). The method consists of instantaneously
releasing a finite quantity of helium (He) inside a building and then measuring the
helium concentration in the air over time as it dissipates. A formula is then applied to
the results to calculate the building AER.
The purpose of the recent experiments conducted at CCAFS, Kelly AFB, and Travis
AFB, and discussed in this report, was to conduct side by side comparisons of the He
release methodology with an existing published method, with the objective of
validating the He method as a tool for use at other sites. A modified version of
ASTM Method E741-00 was used to obtain an independent estimate of the AERs at
three buildings while simultaneously deploying the helium methodology. The ASTM
method used involves the release of a tracer gas into a building at a constant, known
rate, and then measuring equilibrium concentrations in the building air. A formula is
then applied to calculate the AER.
An additional method using a single data point from a SUMMA canister sample was
also developed to allow for further testing comparisons, and this method is

Final Report for Air Exchange Rate Analysis and Protocol Development
1-2 Tetra Tech, Inc.
introduced later when it is used. However, this method is not documented in detail
and is only meant to allow further comparison due to its simplicity of execution.
Buildings selected for this study were Facility 1381 at CCAFS, Building 1416 at
former Kelly AFB, and Building 1130 at Travis AFB. These buildings were selected
for this study based on a variety of criteria including size (1,000 to 5,000 square
feet), use (commercial/industrial), and availability/access for the study. See Table
1-1 for a summary of the three buildings.
Table 1-1 Summary Table for Three Buildings Used in Protocol Development
Building 1381 CCAFS
FL 1461 Former Kelly AFB
TX 1430 Travis AFB
CA
Stories 1 1 1
Foundation Slab-on-grade Slab-on-grade Slab-on-grade
Effective volume for AER analysis
27,640 ft3 14,200 ft
3 9,900 ft
3
Amount of He released 2.9 kg (HVAC on); 1.8 kg (HVAC off)
3.24 kg (HVAC on) 2.21 kg (HVAC cycled
on and off)
Definitions:
ft3 – cubic feet
He - helium HVAC – heating, ventilation, and air conditioning in – inches kg – kilogram

Tetra Tech, Inc. 2-1
2 SITE BACKGROUND INFORMATION
2.1 Site Background Information (Facility 1381, CCAFS)
Facility 1381 is an unoccupied building located on Armory Road approximately 0.5
mile southwest of the intersection of Central Control Road and Armory Road. The
building is located in a relatively remote area of CCAFS approximately 1.5 miles
southeast of the industrial area (Figure 2-1). The building is located in an
approximately 400-foot diameter cleared area surrounded by forested lands (Figure
2-2).
Figure 2-1 Location of Facility 1381, Tower 303, and the Skid Strip weather sensors (AERial photograph source: USGS Seamless Data Warehouse).

Final Report for Air Exchange Rate Analysis and Protocol Development
2-2 Tetra Tech, Inc.
Figure 2-2 Photograph of Facility 1381 at CCAFS looking east-northeast.
From its construction in 1958 through 1968, Facility 1381 was operated as the
Guidance Azimuth Transfer Building. From 1968 until 1977, it served as the In-
Place Precision Cleaning Lab for Pan Am World Services (Pan Am). During Pan
Am’s operations, the building housed acid and solvent dip tanks that were used for
cleaning metal components. Trichloroethene (TCE) was used on-site during cleaning
operations. Stainless steel acid dip tanks containing “Fozdip” acid, oil, and water
were used on site to clean galvanized steel pipes (Tetra Tech 2007). From 1977 to
approximately 2006, the Site served as an Ordnance Support Facility for the U.S.
Coast Guard. The U.S. Coast Guard moved out of Facility 1381 in 2006. The
building is currently listed for demolition.
2.2 Site Background Information (Building 1416, former Kelly AFB)
Building 1416 is located at the north end of former Kelly AFB, San Antonio, Texas,
on North Frank Luke Drive, near the intersection with Growdon Road (Figure 2-3).
Building 1416 is located immediately southeast of an aircraft hangar in an industrial-
use area.

Final Report for Air Exchange Rate Analysis and Protocol Development
Tetra Tech, Inc. 2-3
Figure 2-3 Location of Building 1416 at former Kelly AFB (AERial photograph source: USGS Seamless Data Warehouse).
Building 1416 is a single story, slab-on-grade building with sheet metal siding, a
pitched roof, and roll-up doors on the east and west ends (Figure 2-4).

Final Report for Air Exchange Rate Analysis and Protocol Development
2-4 Tetra Tech, Inc.
Figure 2-4 View of East Side of Building 1416 at former Kelly AFB, showing front roll-up doors and front door leading into entry (open).
Construction of Building 1416 was completed in 1944 and it was used for paint and
dope storage by the San Antonio Air Service Command. The building was moved
from its original location to the present site in 1956 and it became a reclamation
facility shop in 1963 (U.S. Army Corps of Engineers [USACE] 1997). Currently,
Building 1416 is vacant.
2.3 Site Background Information (Building 1130, Travis AFB)
Building 1130 is located on the southeast side of the Travis AFB runways, off
Perimeter Road near the intersection with Carson Road (Figure 2-5). Building 1130
is located in an open space area in the East Industrial Operable Unit. Building 1130
was used as an ultra-high frequency (UHF) radio transmitter building and is
currently vacant and slated for demolition.

Final Report for Air Exchange Rate Analysis and Protocol Development
Tetra Tech, Inc. 2-5
Figure 2-5 Location of Building 1130 at Travis AFB (Draft Groundwater Sampling and Analysis Program 2006–2007 Annual Report, CH2M Hill, 2007).

Final Report for Air Exchange Rate Analysis and Protocol Development
2-6 Tetra Tech, Inc.
Figure 2-6 View of southeast (front) side of Building 1130 at Travis AFB, showing the front double doors leading into the main building and a single door into the generator room on the right.

Tetra Tech, Inc. 3-1
3 AIR EXCHANGE RATE STUDY FIELD INVESTIGATIONS
3.1 Facility 1381, Cape Canaveral Air Force Station
The AER experiments at CCAFS were conducted from 06 through 08 December
2010. Two experiments were conducted at Facility 1381, one with the heating,
ventilation, and air conditioning (HVAC) system on and one with it turned off. The
following sections detail the field activities.
3.1.1 Building Description and Indoor Volume Estimates
Facility 1381 is a single story slab-on-grade structure. The floor plan and
components of the AER experiments are shown on Figure 3-1. The structural
integrity of the back portion of the building has been compromised by cracks in the
wall, which appear to be widening.
Additionally, the sets of double doors located on the northwest (front) and southeast
(rear) sides of the building do not close completely (Figure 3-2). Room 5 is an
addition to Facility 1381 and there are cracks between the walls and roof of this
room and the rest of the building (Figure 3-2). All these features may lead to an
increase in the flow rate of air into and out of the building. A HVAC system located
in a room in the northern corner of the building services the entire building. The
HVAC room has no internal connections to the rest of the building (i.e., doors or
passageways), other than the HVAC ducting. While the intake for the HVAC system
is located within the building (i.e., design specifications are for 100% re-circulated
air), the HVAC room has vents on the front doors and a fanned vent on the side of
the building.

Final Report for Air Exchange Rate Analysis and Protocol Development
3-2 Tetra Tech, Inc.
Figure 3-1 Floor Plan of Facility 1381 at CCAFS illustrating components of the AER experiments.

Final Report for Air Exchange Rate Analysis and Protocol Development
Tetra Tech, Inc. 3-3
Figure 3-2 Photographs of cracks in closed doors and building walls that may affect the AER: (A) front double doors, (B) rear double doors, and (C) Seam between Room 5 and original building.
Detailed measurements were taken of each room to determine the indoor volume
(Table 3-1). Each room contained various amounts of furniture and equipment that
filled space, and the large center room contains HVAC ducting (Figure 3-3) and
concrete trenches containing sub-floor utility lines creating void spaces that may or
may not be considered part of the indoor volume of the room. Therefore, the volume
estimates presented in Table 3-1 are considered to have a margin of error of ±10
percent.
Table 3-1 Summary Table of Indoor Volumes for Facility 1381
Room Length
(in) Width
(in) Height
(in) Volume
(ft3)
Indoor Air Sample Aliquot
(ml)
HVAC Room 235 214 178 5,180 NA
Room 1 296 233 144 5,747 150
Room 2 233 183 144 3,553 100
Bathroom 66 53 118 239 NA
Room 3 159 125 140 1,610 50
Room 4 575 242 144 11,596 300
Room 5 215 189 128 3,010 75
Room 6 226 121 119 1,883 50
Total Volume without HVAC Room 27,639 725
Definitions:
in – inches ml – milliliters ft
3 – cubic feet
NA – Not applicable, no air samples collected from the bathroom or HVAC room
A B C

Final Report for Air Exchange Rate Analysis and Protocol Development
3-4 Tetra Tech, Inc.
Figure 3-3 Photograph of Room 4 looking northeast. HVAC ducting panel is visible in the upper left.
3.1.2 Experimental Design
Two separate comparison experiments were conducted at Facility 1381, one on 07
December 2010 with the HVAC system on, and the second on 08 December 2010
with the HVAC system off. The objective of this approach was to run the experiment
under two different AERs and thereby provide a more robust comparison of the two
methods.
The AER in Facility 1381 was measured simultaneously using the helium release
methodology and the ASTM E741-00 method during both experiments (HVAC on
and HVAC off). Sulfur hexafluoride (SF6) was used as the tracer gas for the ASTM
method. A Thermo Scientific MIRAN SapphIRe portable gas analyzer calibrated for
SF6 was used on-site to measure and log SF6 concentrations throughout the
experiments. A Radiodetection MGD-2002 hand-held helium (He) meter was used to
take field measurements of He concentrations in air samples collected at pre-
determined intervals after release of the He. Samples for off-site laboratory analysis
were sent to Air Toxics, Ltd., (Air Toxics), located in Folsom, California. Air Toxics
is a Department of Defense (DoD) Environmental Laboratory Accreditation Program
(ELAP) certified analytical laboratory. ASTM method D-1946 was used for analysis
of He and an Air Toxics standard operating procedure (ATL Applications No. 8),
which uses gas chromatography with an electron capture detector (GC/ECD), was
used for analysis of SF6.
The following sections provide details of the field experiments and Table 3-2
summarizes the field activities conducted during the period of the experiments.

Final Report for Air Exchange Rate Analysis and Protocol Development
Tetra Tech, Inc. 3-5
Table 3-2 Summary of Field Activities at Facility 1381, CCAFS
06 December 2010
Arrive at Facility 1381 and set up components of AER experiments
Upon arrival, HVAC system was on but not operating due to the moderate outside temperatures. The thermostat was adjusted to cause the HVAC system to start up and the blower fan to operate.
Steady flow of SF6 tracer gas into building initiated at 1603
Continuous logging of SF6 concentrations in Room 4 initiated at 1604
07 December 2010
SF6 analyzer found to have turned off at 0246; logging re-started at 1022 (SF6 release was not interrupted)
Helium from six 111-cf cylinders released into building at 1126
Indoor air samples for on-site field meter and off-site laboratory analysis of He collected over course of 8 hours
Discrete indoor air samples collected for off-site analysis of SF6 at 1156 and 1926
SF6 analyzer carried through building periodically to collect readings from each room
SUMMA canister deployed in Room 4 next to SF6 analyzer at 1226 to collect 4-hour time-integrated sample for He and SF6 analysis
Final He sample collected at 1926
HVAC turned off at 1945; first experiment completed
08 December 2010
Helium from four 111-cf cylinders released into building at 0820
Indoor air samples for on-site field meter and off-site laboratory analysis of He collected over course of 8 hours
Discrete indoor air samples collected for off-site analysis of SF6 at 0920 and 1620.
SF6 analyzer carried through building periodically to collect readings from each room
SUMMA canister deployed in Room 4 next to SF6 analyzer at 1020 to collect 4-hour time-integrated sample for He and SF6 analysis
Final He sample collected at 1620
Second experiment completed
Site cleaned up and restored to condition as found
3.1.2.1 SF6 Tracer Gas Release
The release of SF6 tracer gas into Facility 1381 for the ASTM method was started on
the afternoon of 06 December 2010 and continued for the duration of both
experiments. Beginning the SF6 release on 06 December allowed time for the gas to
reach equilibrium in the building prior to the start of the first experiment on the
morning of 07 December.
In accordance with ASTM Method E741-00, a pre-determined release rate was
selected based on the building volume and a rough estimate of the expected AER.
For this investigation, the tracer gas was a 2.0 percent mixture of SF6 with pure
nitrogen as the balance gas. The release was started at 1603 on 06 December 2010.
The arrangement for SF6 tracer gas release consisted of a 28-cubic-foot (cf) cylinder,
a two-stage pressure regulator that allowed the pressure to be decreased to
approximately 23 pounds per square inch (psi), and a flow meter (rotameter) that
ensured a constant flow rate of 200 milliliters per minute (ml/min), which equates to
4 ml/min of SF6 tracer gas (Figure 3-4). A series of four manifolded, 1/4-inch
diameter Nylaflow tubing lengths were attached to the flow meter and run to four
locations throughout the building to promote homogenization of the tracer gas
throughout (Figure 3-1). The system was checked for leaks using the MIRAN gas
analyzer (Figure 3-5).

Final Report for Air Exchange Rate Analysis and Protocol Development
3-6 Tetra Tech, Inc.
Figure 3-4 Photograph of (A) the SF6 cylinder, (B) two-stage pressure regulator, and (C) flow controller (rotameter).
Figure 3-5 Photographs of MIRAN SapphIRe portable gas analyzer.
Throughout the experiments, the SF6 gas analyzer logged the SF6 concentration at
10-minute intervals in the center of Room 4 at the location shown on Figure 3-1, on a
free standing shelf, approximately 5 feet off the floor (Figure 3-5). The instrument
was set to continually monitor the SF6 concentration and to log the minimum
maximum, and average concentrations during each 10-minute interval. Periodically,
field personnel took the analyzer to each room to measure the SF6 concentrations in
the individual rooms. Due to a malfunction with the power supply to the MIRAN,
the instrument shut down several times during the study period, which resulted in
gaps in the logged SF6 data, although the release of SF6 continued uninterrupted.
A B C
A B

Final Report for Air Exchange Rate Analysis and Protocol Development
Tetra Tech, Inc. 3-7
3.1.2.2 Helium Gas Release
The He source for Experiment 1 was six 111-cf cylinders of at least 99 percent pure
He, which were placed at the locations shown on Figure 3-1. Only four cylinders
were used for Experiment 2, because the HVAC system had been turned off for this
experiment, and the AER was therefore expected to be lower. For each release, the
valves were fully opened simultaneously by the field crew and the tanks allowed to
empty into the building. Each cylinder emptied in approximately 1 minute. The
cylinders were weighed before and after release to estimate the mass of helium
released (Table 3-3).
Table 3-3 Helium Mass Released into Facility 1381
Tank Start Weight
(kg) End Weight
(kg) Difference
(kg)
12/7/2010 - HVAC On
1 31.67 31.14 0.53
2 33.74 33.25 0.49
3 33.73 33.25 0.48
4 29.54 29.04 0.50
5 30.35 29.88 0.47
6 29.40 28.92 0.48
Total He Released (HVAC On): 2.94
12/8/2010 - HVAC Off
7 28.74 28.30 0.44
8 31.33 30.89 0.44
9 39.51 39.06 0.45
10 33.93 33.46 0.47
Total He Released (HVAC Off): 1.80
Definitions:
He – helium HVAC – heating, ventiliation, and air conditioning kg – kilogram
3.1.3 CCAFS Experiment 1 Implementation
The first experiment was conducted on 07 December 2010, with the HVAC system
on. The HVAC system blower was running constantly during Experiment 1. The He
was released into the building at 1126. Composite indoor air samples were collected
in Tedlar bags for He analysis at 15, 30, 60, 120, 180, 240, 360, and 480 minutes (8
hours) after the release. In addition, indoor air samples were collected in Tedlar bags
for SF6 analysis at 30 and 480 minutes after release of the He. All of the composite
samples were collected by drawing pre-determined volumes of indoor air from
rooms throughout the building into a 60-ml disposable syringe and expelling them
into a Tedlar bag. In order to obtain a sample that was representative of the entire
building space, the volume of each sample aliquot was proportional to the volume of
the room from which it was collected (Table 3-1).

Final Report for Air Exchange Rate Analysis and Protocol Development
3-8 Tetra Tech, Inc.
Samples for He analysis were collected in duplicate. One sample was submitted to
Air Toxics for laboratory for analysis. The second sample was analyzed on-site using
the MGD-2002 helium meter. Due to malfunctions with the instrument, the on-site
He measurements taken at Facility 1381 are considered suspect. Further, as a result
of the instrument malfunction, the planned discrete measurements from the
individual rooms were not collected.
Concentrations of SF6 were continuously logged with the portable SF6 gas analyzer
and discrete measurements were collected in each room approximately once per
hour. In addition, a time integrated indoor air sample for SF6 and He analysis was
collected from Room 4 in a 6-liter SUMMA canister placed at the location shown in
Figure 3-1. The SUMMA canister was equipped with a flow controller calibrated to
fill it in 4 hours, and was filled from 1226 to 1626 (1 hour to 5 hours after the He
release. The SUMMA tests were experimental and are not part of the protocol
developed from this investigation (Appendix A).
3.1.4 CCAFS Experiment 2 Implementation
The second experiment was conducted on 08 December 2010 with the HVAC
system turned off. The system was turned off the previous evening in order to allow
the SF6 concentration to adjust to the lower air exchange rate in time for Experiment
2 (Table 3-2). The He was released into the building at 0820. Indoor air samples
were collected in Tedlar bags for He analysis at 15, 30, 60, 120, 180, 240, 360, and
480 minutes after the release. In addition, indoor air samples were collected in Tedlar
bags for SF6 analysis at 60 and 480 minutes after release of the He. All of the
samples were collected as described for Experiment 1. The time-integrated 4-hr
sample collected with the SUMMA canister was collected between 1020 and 1420 (2
hours to 6 hours after the He release).
3.1.5 CCAFS Meteorology
Meteorological data for the study period was obtained from the 45th
Weather
Squadron, which gathers weather data from a variety of locations across CCAFS.
Data obtained for this study were collected from the southeast end of the Skid Strip
(the runway), and Tower 303, located approximately 1 mile southeast and southwest,
respectively, of Facility 1381 (Figure 2-1). Data collected included wind speed and
direction, ambient air temperature, and barometric pressure (Skid Strip sensor only).
The Skid Strip sensors are located on a tower approximately 33 feet (10 meters)
above the ground surface, and measurements were logged every hour. The
temperature sensor at Tower 303 is positioned at 6 feet above the ground while the
wind sensors are positioned 12 feet above the ground. Measurements at Tower 303
were logged every 5 minutes.
Tower 303 is located in a small clearing in the woods, while the Skid Strip sensors
are located in a large cleared area, at the downwind end of the runway. The
differences in the amount of surrounding trees and the relative heights of the sensors
result in higher wind speeds at the Skid Strip as compared to Tower 303.
Temperatures at the two locations were relatively consistent.

Final Report for Air Exchange Rate Analysis and Protocol Development
Tetra Tech, Inc. 3-9
3.2 Building 1416, Former Kelly Air Force Base
The AER experiment at former Kelly AFB was conducted from 22 through 23
March 2011. The experiment was conducted with the HVAC system turned on,
although the air vents in the shop area of the building did not appear to work. Air
flow was noted in the entry and classroom. The following sections detail the field
activities.
3.2.1 Building Description and Indoor Volume Estimates
Building 1416 is an approximately 2,400-square-foot, single story slab-on-grade
structure. The building consists of five areas: an entry way room, class room, shop,
restroom, and paint room (Figure 3-6). The paint room has a vaulted ceiling, while
the remaining rooms have drop ceilings. The paint room and the shop have an
uncovered concrete floor, while the entry, classroom, and restroom have linoleum
floors. The roll-up door located on the east (front) side of the building does not close
completely and sunlight can be seen coming in through small cracks. As shown on
Figure 3-6, the front door and the double doors leading from the shop area into the
paint room were closed during the experiment. The Paint Room was excuded from
the experiment.
Figure 3-6 Floor Plan of Building 1416 illustrating components of the AER experiment.

Final Report for Air Exchange Rate Analysis and Protocol Development
3-10 Tetra Tech, Inc.
Figure 3-7 View of manifolded SF6 tubing with blue gas cylinder and rotameters positioned in empty red fire extinguisher fastener.
Detailed measurements were taken of each room in order to assess the indoor
volume. Indoor volume estimates are presented in Table 3-4 and are considered to
have a margin of error of ±10 percent.
Table 3-4 Summary Table of Indoor Volumes for Building 1416
Room Length
(in) Width
(in) Height
(in) Volume
(ft3)
Indoor Air Sample Aliquot
(ml)
Classroom 271 179 114 3,200 100
Entry 198 138 114 1,800 75
Shop various various various 8,190 300
Restroom 115 138 114 1,050 25
Total volume of classroom, entry way, shop and restroom 14,240 500
Definitions:
ft3 – cubic feet
in – inches ml – milliliters
3.2.2 Experimental Design
The experiment conducted at Building 1416 at former Kelly AFB consisted of the
same design components as the experiments conducted at CCAFS (see Section

Final Report for Air Exchange Rate Analysis and Protocol Development
Tetra Tech, Inc. 3-11
3.1.2), with the exception that only one experiment (with the HVAC system turned
on) was conducted. The following sections provide details of the former Kelly AFB
field experiments and Table 3-5 summarizes the field activities conducted during the
period of the experiment.
Table 3-5 Summary of Field Activities at Building 1416, Former Kelly AFB
22 March 2011
Arrive at Building 1416 and set up components of AER experiments
Upon arrival, HVAC system was on but not operating due to the moderate outside temperatures. The thermostat was adjusted to cause the HVAC system to start up and the blower fan to operate.
Steady flow of SF6 tracer gas into building initiated at 1526
Continuous logging of SF6 concentrations in the Shop initiated at 1526
23 March 2011
Helium from six 111-cf cylinders released into building at 0625
Indoor air samples for on-site field meter and off-site laboratory analysis of He collected over course of eight hours
Discrete indoor air samples collected for off-site analysis of SF6 at 0655 and 1025
SF6 analyzer carried through building periodically to collect readings from each room
2 collocated SUMMA canisters deployed in Shop next to SF6 analyzer at 0655 to collect 3.5-hour and 9-hour time-integrated samples for He and SF6 analyses
Final He sample collected at 1425 (8 hours after He release)
SF6 gas turned off at 1655
Site cleaned up and restored to condition as found
3.2.2.1 SF6 Tracer Gas Release
The release of SF6 tracer gas into Building 1416 for the ASTM method was started
on the afternoon of 22 March 2011 and continued for the duration of the experiment
through 23 March 2011. Beginning the SF6 release on 22 March allowed time for the
gas to reach equilibrium prior to the start of the experiment.
The SF6 tracer gas was released in the same way as it was for Facility 1381 at
CCAFS with the exception of using a 4.0 percent mixture of SF6 rather than 2.0
percent (Figure 3-6 and Figure 3-7). The 4.0 percent mixture resulted in an SF6
release rate of 8 ml/min. The higher release rate was selected because the AER was
expected to be higher. The system was checked for leaks using the MIRAN gas
analyzer.
Throughout the experiments, the SF6 gas analyzer logged the SF6 concentration at
10-minute intervals in the center of the Shop at the location shown on Figure 3-6, on
a desk, approximately 4 feet off the floor (Figure 3-8). The instrument was set to
continually monitor the SF6 concentration and to log the minimum, maximum, and
average concentrations during each 10-minute interval. Periodically, field personnel
took the analyzer to each room to measure the SF6 concentrations in the individual
rooms. The instrument functioned properly without interruption for the entire
duration of the experiment.

Final Report for Air Exchange Rate Analysis and Protocol Development
3-12 Tetra Tech, Inc.
Figure 3-8 View of SF6 analyzer (grey with black and purple probe) and two collocated SUMMA canisters on the desk in the shop.
3.2.2.2 Helium Gas Release
The He source for the former Kelly AFB experiment was six 111-cf cylinders of at
least 99 percent pure He, which were placed at the locations shown on Figure 3-6.
The valves were fully opened simultaneously by the field crew and the tanks allowed
to empty into the building. The cylinders emptied in approximately 90 seconds. The
cylinders were weighed before and after release to estimate the mass of helium
released (Table 3-6).
Table 3-6 Helium Mass Released into Building 1416 at former Kelly AFB
Tank Start Weight
(kg) End Weight
(kg) Difference
(kg)
1 27.76 27.20 0.56
2 35.80 35.28 0.52
3 34.50 33.96 0.54
4 24.86 24.34 0.52
5 29.88 29.35 0.53
6 25.24 24.67 0.57
Total He Released: 3.24
Definitions:
He – helium HVAC – heating, ventiliation, and air conditioning kg – kilogram

Final Report for Air Exchange Rate Analysis and Protocol Development
Tetra Tech, Inc. 3-13
3.2.3 Kelly AFB Implementation
The experiment was conducted on 23 March 2011, with the HVAC system on. The
He was released into the building at 0625. Composite indoor air samples were
collected in Tedlar bags for He analysis at 15, 30, 60, 90, 120, 180, 240, 360, and
480 minutes (8 hours) after the release. In addition, indoor air samples were collected
in Tedlar bags for SF6 analysis at 30 and 240 minutes after release of the He. All of
the composite samples were collected by drawing pre-determined volumes of indoor
air from rooms throughout the building into a 60-ml disposable syringe and expelling
them into a Tedlar bag. In order to obtain a sample that was representative of the
entire building space, the volume of each sample aliquot was proportional to the
volume of the room from which it was collected (Table 3-4).
Samples for He analysis were collected in duplicate. One sample was submitted to
Air Toxics for laboratory analysis. The second sample was analyzed on-site using the
MGD-2002 helium meter. It was determined during the study that the MGD-2002
instrument, designed as a sensitive leak detection instrument, does not function
correctly when ambient He concentrations are high (i.e., inside a building following
release of the He tracer gas). Therefore, the on-site, room-to-room He measurements
taken at 1416 were not included in the data set used for analysis for this experiment.
However, the integrated samples collected in Tedlar bags and measured using the
helium meter outside the building yielded usable results.
Concentrations of SF6 were continuously logged with the portable SF6 gas analyzer
and discrete measurements were collected in each room approximately once per
hour. In addition, two time-integrated indoor air samples for SF6 and He analysis
were collected from the Shop in two collocated 6-liter SUMMA canisters placed at
the location shown in Figure 3-6. The SUMMA canisters were equipped with flow
controllers calibrated to fill in 3.5 and 12 hours; however, the 12-hour canister was
closed after 9 hours due to low ambient He concentrations as measured from
integrated samples collected in Tedlar bags. The canisters were filled from 0655 to
1025 and 1555 (0.5 to 4 hours and 0.5 to 9.5 hours after the He release. The
SUMMA tests were experimental and are not part of the protocol developed from
this investigation (Appendix A).
3.2.4 Kelly AFB Meteorology
Meteorological data for the study period was obtained from Lackland AFB Weather
Squadron (802 OSS/OSW). Data obtained for this study were collected from the
Lackland Airfield, approximately 0.5 miles west of Building 1416 (Figure 2-3). Data
collected included wind speed and direction, ambient air temperature, and barometric
pressure. Measurements were logged every minute.
3.3 Building 1130, Travis Air Force Base
The AER experiments at Travis AFB were conducted from 12 through 13 July 2011.
The experiment was conducted with the HVAC system turned on. Following
completion of the planned experiment and collection of the last He sample, the
ceiling vents to the outside were sealed in order to evaluate what effects this action
would have on the SF6 gas concentrations in the building.
Final Report for Air Exchange Rate Analysis and Protocol Development
3-14 Tetra Tech, Inc.
Figure 3-9 View of SF6 analyzer (on table), hand-held He detector (on black box on cooler), SF6 cylinder with two-stage regulator connected to variable flow meter and manifold, and two collocated SUMMA canisters; Tedlar bags and sealed sampling syringes can be seen in the foreground on the clipboard.
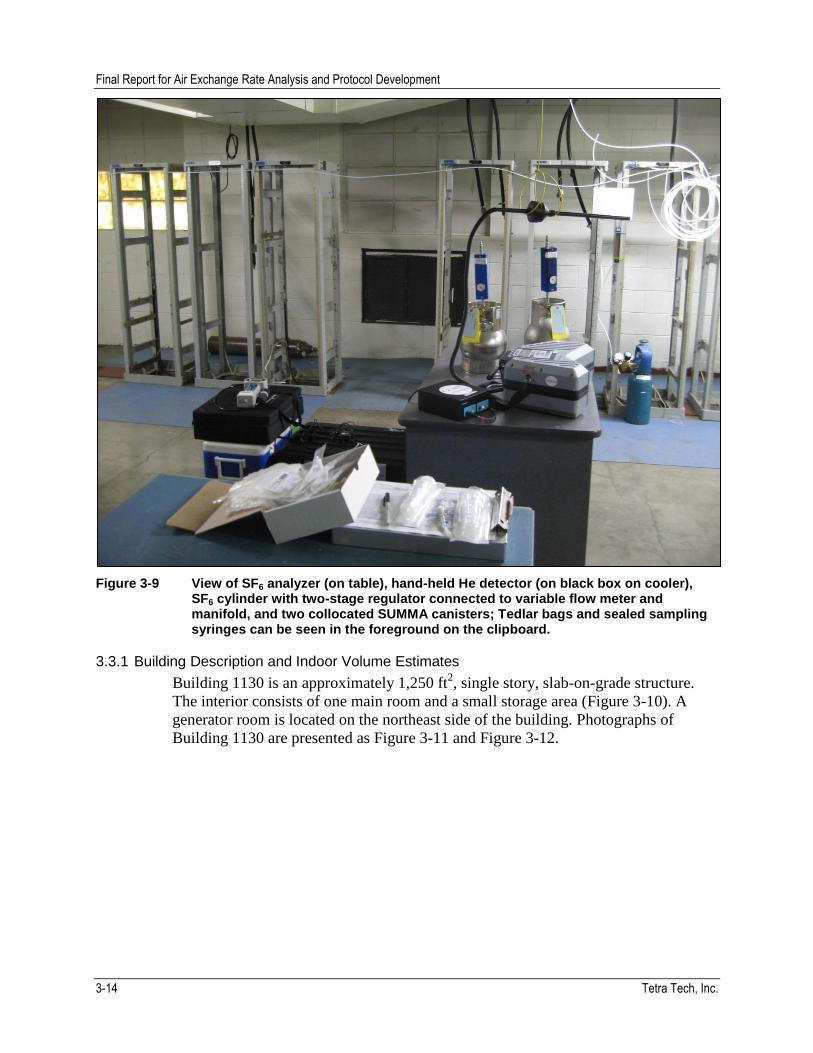
3.3.1 Building Description and Indoor Volume Estimates
Building 1130 is an approximately 1,250 ft2, single story, slab-on-grade structure.
The interior consists of one main room and a small storage area (Figure 3-10). A
generator room is located on the northeast side of the building. Photographs of
Building 1130 are presented as Figure 3-11 and Figure 3-12.
Final Report for Air Exchange Rate Analysis and Protocol Development
Tetra Tech, Inc. 3-15
Figure 3-10 Floor Plan of Building 1130 schematically illustrating components of the AER experiment.

Final Report for Air Exchange Rate Analysis and Protocol Development
3-16 Tetra Tech, Inc.
Figure 3-11 View of the equipment room looking northeast; the front doors are to the right (out of view).
Figure 3-12 View of equipment room look east toward front door (A) and view of generator room vents from outside of Building 1130 looking north.
The generator room was not included in the experiment and indoor volume
calculations. However, air was flowing from the generator room into the equipment
room through a utility trench connecting the two. This opening allowed significant
A B
Final Report for Air Exchange Rate Analysis and Protocol Development
Tetra Tech, Inc. 3-17
flow of air into the equipment room from the generator room, which has open vents,
and to the outside via three celing vents in the equipment room (Figure 3-12). The
open vents of the generator room can be seen from the outside on Figure 3-12A. The
effects on the AER are discussed in Section 5.
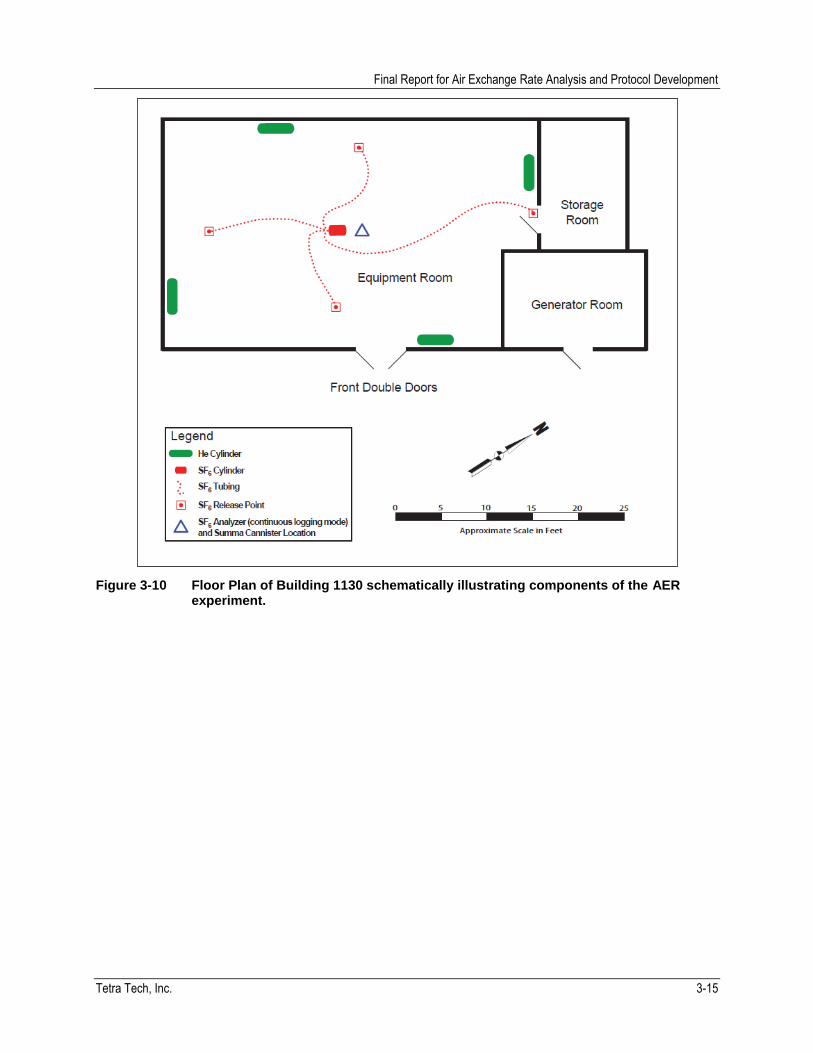
Detailed measurements were taken of each room in order to assess the indoor
volume. Indoor volume estimates are presented in Table 3-7 and are considered to
have a margin of error of ±10 percent.
Table 3-7 Summary Table of Indoor Volumes for Building 1130
Room Length
(in) Width
(in) Height
(in) Volume
(ft3)
Indoor Air Sample Aliquot
(ml)
Equipment Room various various 117 8,800 450
Storage Room 162 103 117 1,100 50
Total Volume of Equipment Room and Storage Room 9,900 500
Definitions:
ft3 – cubic feet
in – inches ml – milliliters
3.3.2 Experimental Design
The experiment conducted at Building 1130 at Travis AFB consisted of the same
design components as the experiments conducted at CCAFS and former Kelly AFB
(see Sections 3.1.2 and 3.2.2). The following sections provide details of the Travis
AFB field experiments and Table 3-8 summarizes the field activities conducted
during the period of the experiment.
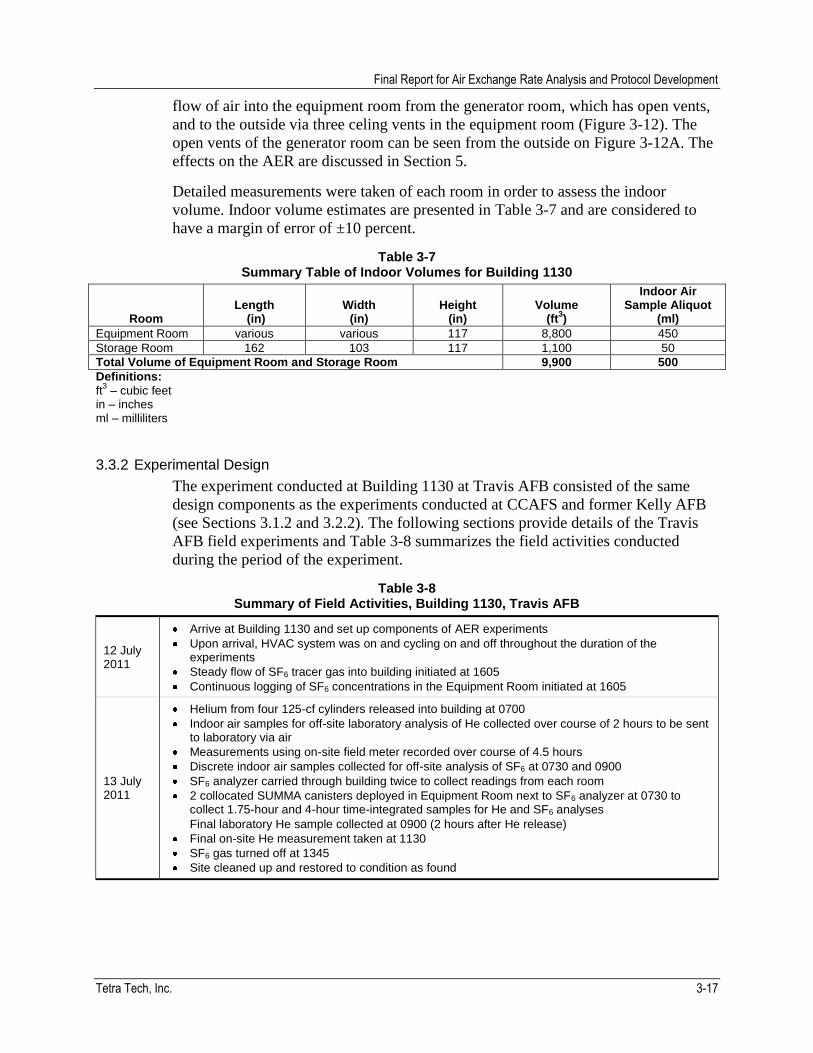
Table 3-8 Summary of Field Activities, Building 1130, Travis AFB
12 July 2011
Arrive at Building 1130 and set up components of AER experiments
Upon arrival, HVAC system was on and cycling on and off throughout the duration of the experiments
Steady flow of SF6 tracer gas into building initiated at 1605
Continuous logging of SF6 concentrations in the Equipment Room initiated at 1605
13 July 2011
Helium from four 125-cf cylinders released into building at 0700
Indoor air samples for off-site laboratory analysis of He collected over course of 2 hours to be sent to laboratory via air
Measurements using on-site field meter recorded over course of 4.5 hours
Discrete indoor air samples collected for off-site analysis of SF6 at 0730 and 0900
SF6 analyzer carried through building twice to collect readings from each room
2 collocated SUMMA canisters deployed in Equipment Room next to SF6 analyzer at 0730 to collect 1.75-hour and 4-hour time-integrated samples for He and SF6 analyses
Final laboratory He sample collected at 0900 (2 hours after He release)
Final on-site He measurement taken at 1130
SF6 gas turned off at 1345
Site cleaned up and restored to condition as found
Final Report for Air Exchange Rate Analysis and Protocol Development
3-18 Tetra Tech, Inc.
3.3.2.1 SF6 Tracer Gas Release
The release of SF6 tracer gas into Building 1130 for the ASTM method was started
on the afternoon of 12 July 2011 and continued for the duration of the experiment
through 13 July 2011. Beginning the SF6 release on 12 July allowed time for the gas
to reach equilibrium prior to the start of the experiment.
The SF6 tracer gas was released in the same way as it was for Building 1416 at
former Kelly AFB with the exception of using a flow rate of 100 ml/min. The 4.0
percent mixture resulted in an SF6 release rate of 4 ml/min. The low release rate was
selected because of the small volume of the building. The system was checked for
leaks using the MIRAN gas analyzer and soapy water.
Throughout the experiments, the SF6 gas analyzer logged the SF6 concentration at
10-minute intervals in the center of the Equipment Room at the location shown on
Figure 3-10, on a desk, with the intake suspended approximately 4 feet off the floor
to coincide vertically with the intakes of the collocated SUMMA canisters (Figure
3-11 and Figure 3-9). The instrument was set to continually monitor the SF6
concentration and to log the minimum, maximum, and average concentrations during
each 10-minute interval. Periodically, field personnel took the analyzer to each room
to measure the SF6 concentrations in the individual rooms. The instrument
functioned properly without interruption for the entire duration of the experiment.
3.3.2.2 Helium Gas Release
The He source for the Travis AFB experiment were four 125-cf cylinders of at least
99 percent pure He, which were placed at the locations shown on Figure 3-10. The
valves were fully opened simultaneously by the field crew and the tanks were
allowed to empty into the building. The cylinders emptied in approximately 40
seconds. The cylinders were weighed before and after release to estimate the mass of
helium released (Table 3-9).
Table 3-9 Helium Mass Released into Building 1130 at Travis AFB
Tank Start Weight
(kg) End Weight
(kg) Difference
(kg)
1 33.97 33.39 0.58
2 35.82 35.25 0.56
3 36.88 36.35 0.54
4 28.86 28.34 0.53
Total He Released: 2.21
3.3.3 Travis AFB Implementation
The experiment was conducted on 13 July 2011. The HVAC system was and the
blower cycled on and off periodically. The He was released into the building at 0700.
Composite indoor air samples were collected in Tedlar bags for He analysis at 15,
30, 45, 60, 90, and 120 minutes after the release. In addition, indoor air samples were
collected in Tedlar bags for SF6 analysis at 30 and 120 minutes after release of the
Final Report for Air Exchange Rate Analysis and Protocol Development
Tetra Tech, Inc. 3-19
He. All of the composite samples were collected by drawing pre-determined volumes
of indoor air from rooms throughout the building into a 60-ml disposable syringe and
expelling them into a Tedlar bag. In order to obtain a sample that was representative
of the entire building space, the volume of each sample aliquot was proportional to
the volume of the room from which it was collected (Table 3-7).
Samples for He analysis were collected in duplicate. One sample was submitted to
Air Toxics for laboratory analysis. The second sample was analyzed on-site using the
MGD-2002 helium meter. Discrete He measurements were not taken inside Building
1130, because high ambient He concentrations (i.e., inside a building following
release of the He tracer gas) interfere with the instrument sensor, inhibiting its ability
to reliably measure concentrations. However, the integrated samples collected in
Tedlar bags and measured using the helium meter outside the building yielded usable
results.
An observation from the experiments conducted at all three study sites is that the
field He measurements were consistently higher than the laboratory results. Two
likely explanations are: (1) the field meter is calibrated differently and yields higher
concentrations than the laboratory method, or (2) He is lost from the Tedlar bags
between the time of collection and time of analysis. To test the latter possibility, the
two He samples collected at Travis AFB at 15 and 90 minutes after the He release
were analyzed three times by the laboratory; once upon receipt along with the other
samples, and again 24 hours and 48 hours after receipt of the samples.
Concentrations of SF6 were continuously logged with the portable SF6 gas analyzer
and discrete measurements were collected only twice in each room due to the short
duration of the experiment. In addition, two time-integrated indoor air samples for
SF6 and He analysis were collected from the Equipment Room in two collocated
6-liter SUMMA canisters placed at the location shown in Figure 3-10. The SUMMA
canisters were equipped with flow controllers calibrated to fill in 4 and 12 hours;
however, the 4-hour canister was closed after 1.75 hours and the 12-hour canister
was closed after only 4 hours due to faster than anticipated He decay inside the
building and early low ambient He concentrations as measured from the integrated
samples collected in Tedlar bags. The canisters were filled from 0730 to 0915 and
1130 (0.5 to 2.25 hours and 0.5 to 4.5 hours after the He release).
3.3.4 Travis AFB Meteorology
Meteorological data for the study period was obtained from Travis AFB Weather
Squadron (60 OSS/OSW). Data obtained for this study were collected from Sensor
21L at the Travis AFB Airfield, located approximately 2.4 miles northeast of
Building 1130 (Figure 2-5). Data collected included wind speed and direction,
ambient air temperature, and barometric pressure. Measurements were logged every
minute.
3.3.5 Variances from the Travis AFB Work Plan
Following the He release, the readings from the hand-held He detector indicated that
He concentrations were decreasing at a significantly faster rate than anticipated

Final Report for Air Exchange Rate Analysis and Protocol Development
3-20 Tetra Tech, Inc.
(indicating higher than anticipated AER). Therefore, a 45-minute sample was added
to the originally planned sampling schedule and the final sample collected was the
120 minute sample from only 2 hours after the He release, when the hand-held meter
measured concentrations below the laboratory detection limit of 500 ppm. Hand-held
measurements were taken until the meter no longer detected He, at 1130, or 4 hours
after the He release.
Although not in the original work plan, a second SUMMA canister, collocated with
the first, was deployed. This SUMMA canister was planned to be deployed for 8 to
12 hours; however, due to high AER, it was closed after only 4 hours. Also due to
the higher than anticipated AER of the building, the first SUMMA canister was
closed after only 1.75 hours, rather than the originally proposed 3.5 hours.
Discrete SF6 samples in Tedlar bags were scheduled to be collected at 30 minutes
and 4 hrs after He release, to bracket the 3.5-hour SUMMA sample; however, due to
the unexpectedly high He concentration decay, these were collected at 30 minutes
and 2 hours after the He release.

Tetra Tech, Inc. 4-1
4 EXPERIMENTAL RESULTS
4.1 Facility 1381, Cape Canaveral Air Force Station (CCAFS)
The He concentrations in the composite Tedlar bag samples and the time integrated
SUMMA canister samples collected during Experiments 1 and 2 at Facility 1381 are
presented in Table 4-1. The corresponding SF6 concentration data are presented in
Table 4-2. On-site measurements of SF6 concentrations in the individual rooms are
presented in Table 4-3 and a plot of the logged SF6 concentrations is presented in
Figure 4-1.
The MIRAN gas analyzer was set to continuously monitor SF6 concentrations and to
log the measurements every 10 minutes. Figure 4-1 shows the maximum, minimum,
and average SF6 concentrations logged for each 10-minute period. The SF6 was
continuously released throughout the study period; however, the logging was
interrupted due to a malfunction with the power supply, as can be seen in Figure 4-1.
The discrete samples shown on Figure 4-1 were collected 30 minutes after release of
the He (12/7/2010), 60 minutes after release of the He (12/8/2010), and 8 hours after
release of the He (both days). It appears from Figure 4-1 that there is some “noise” in
the logged SF6 data. Some of the noise is likely the result of normal fluctuations in
AER related to people entering and exiting the building, and possibly meteorological
inputs. In addition, some of noise, particularly as observed in the plots of minimum
and maximum concentrations, is due to the instrument being moved from the regular
logging location (shown on Figure 3-1) to each of the individual rooms in the
building. As can be seen on Table 4-3, the SF6 concentrations in the individual
rooms was variable, and as the instrument was set to continuously log the
concentration data, when it was moved to other rooms this variability was captured
in the minimum and maximum data points, and it can be assumed also affected the
average concentration for the 10-minute logging period.

Final Report for Air Exchange Rate Analysis and Protocol Development
4-2 Tetra Tech, Inc.
Table 4-1 Helium Concentrations in Facility 1381 at CCAFS
Sample ID Elapsed Time¹
(minutes) Collection
Time Field Result²
(ppmv)
Laboratory Result³ (ppmv)
HVAC On (07 December 2010)
1381-HON-15 15 11:41 15,100 10,000
1381-HON-30 30 11:56 12,275 8,500
1381-HON-60 60 12:26 8,650 6,100
1381-HON-90 90 12:56 6,500 3,800
1381-HON-120 120 13:26 4,700 3,000
1381-HON-180 180 14:26 2,150 1,400
1381-HON-240 240 15:26 1,200 980
1381-HON-360 360 17:26 550 530
1381-HON-480 480 19:26 275 ND
1381-HON-SUMMA 60 – 300 12:26 – 16:26 NA 3,100
HVAC Off (08 December 2010)
1381-HOFF-15 15 08:35 10,500 8,000
1381-HOFF-30 30 08:50 10,500 7,000
1381-HOFF-60 60 09:20 8,850 6,200
1381-HOFF-90 90 09:50 6,650 4,100
1381-HOFF-120 120 10:20 4,850 3,400
1381-HOFF-180 180 11:20 2,875 2,000
1381-HOFF-240 240 12:20 1,875 1,500
1381-HOFF-360 360 14:20 1,175 760
1381-HOFF-480 480 16:20 750 550
1381-HOFF-SUMMA 120 – 360 10:20 – 14:20 NA 2,200
Definitions:
HVAC – heating, ventilation and air conditioning system ppmv – part per million by volume Notes: 1 Elapsed time since release of He.
2 Instrument detection level for He was 25 ppmv
3 Laboratory detection level for He was 500 ppmv

Final Report for Air Exchange Rate Analysis and Protocol Development
Tetra Tech, Inc. 4-3
Table 4-2 SF6 Concentrations in Facility 1381 at CCAFS
Sample ID Elapsed Time¹
(minutes) Collection Time Laboratory Result
(ppbv)
HVAC On (07 December 2010)
1381-HON-30 30 11:56 280
1381-HON-480 480 19:26 600
1381-HON-SUMMA 60 – 300 12:26 – 16:26 330
HVAC Off (08 December 2010)
1381-HOFF-60 60 09:20 820
1381-HOFF-480 480 16:20 810
1381-HOFF-SUMMA 120 – 360 10:20 – 14:20 650
Definitions:
HVAC – heating, ventilation and air conditioning system ppbv – part per billion by volume SF6 – sulfur hexafluoride Notes: 1 Elapsed time since release of He.
Laboratory detection level for SF6 was 0.2 ppbv before dilution Occupational Safety and Health Administration Permissible Exposure Limit for SF6 is 1,000,000 ppbv

Final Report for Air Exchange Rate Analysis and Protocol Development
4-4 Tetra Tech, Inc.
Table 4-3 Discrete SF6 Concentrations in Facility 1381 (ppbv) at CCAFS
Time
Room
1 2 3 4 5 6
HVAC On (07 December 2010)
10:53 170 157 140 156 179 146
11:13 258 260 228 253 271 236
12:15 279 287 254 275 259 293
13:13 279 325 277 292 308 290
14:20 309 342 299 316 320 308
15:09 328 363 321 339 348 321
16:35 410 441 400 419 418 401
18:20 515 538 490 511 502 487
HVAC Off (08 December 2010)
9:05 800 840 812 805 895 813
10:05 699 718 646 658 796 601
11:05 560 612 516 478 633 403
12:10 525 742 440 440 576 345
13:15 572 603 571 517 643 493
14:30 717 709 683 717 685 690
15:12 800 792 782 793 775 748
17:05 984 977 947 1,001 971 952
Definitions:
HVAC – heating, ventilation and air conditioning system ppbv – part per billion by volume SF6 – sulfur hexafluoride Notes:
Detection level for SF6 was 0.2 ppbv before dilution Occupational Safety and Health Administration Permissible Exposure Limit for SF6 is 1,000,000 ppbv Instrument detection level for SF6 was 10 ppbv
Final Report for Air Exchange Rate Analysis and Protocol Development
Tetra Tech, Inc. 4-5
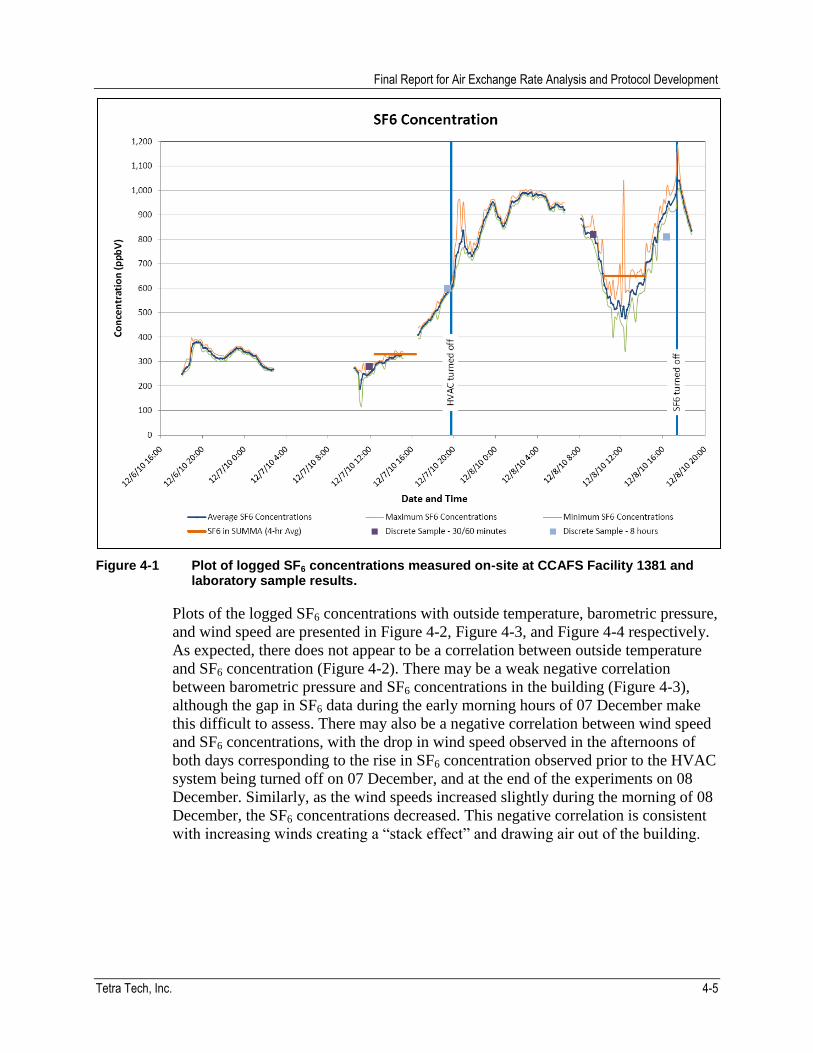
Figure 4-1 Plot of logged SF6 concentrations measured on-site at CCAFS Facility 1381 and laboratory sample results.
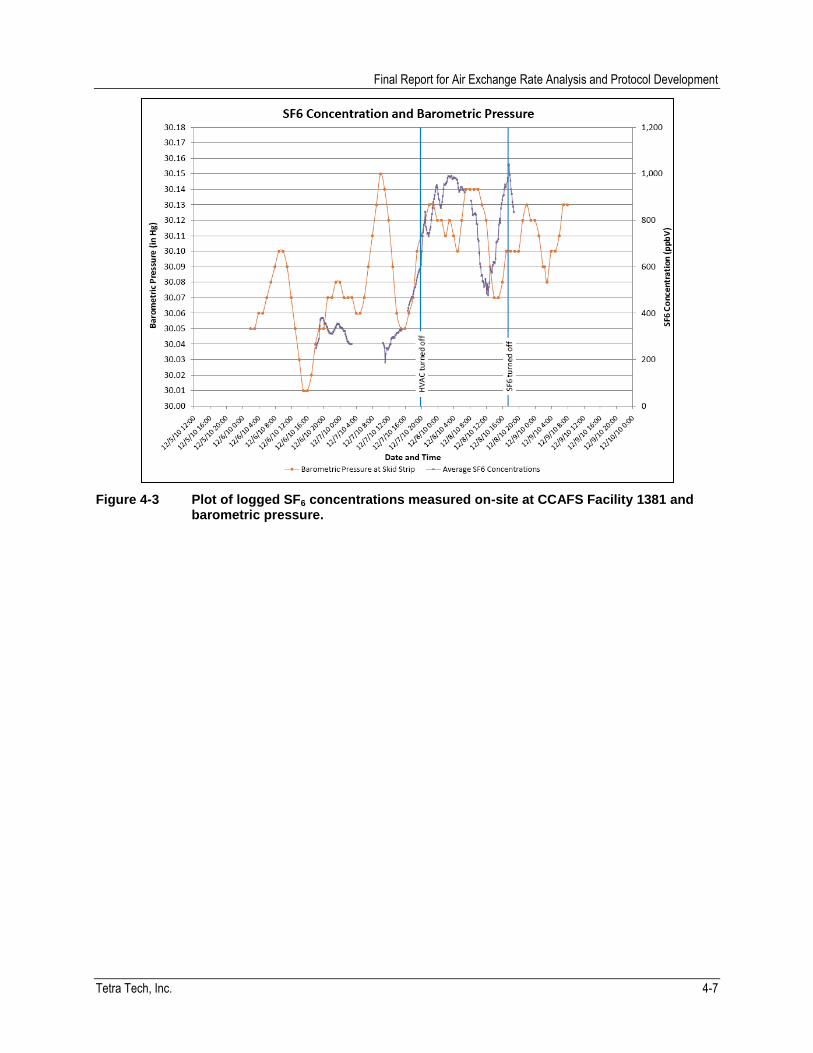
Plots of the logged SF6 concentrations with outside temperature, barometric pressure,
and wind speed are presented in Figure 4-2, Figure 4-3, and Figure 4-4 respectively.
As expected, there does not appear to be a correlation between outside temperature
and SF6 concentration (Figure 4-2). There may be a weak negative correlation
between barometric pressure and SF6 concentrations in the building (Figure 4-3),
although the gap in SF6 data during the early morning hours of 07 December make
this difficult to assess. There may also be a negative correlation between wind speed
and SF6 concentrations, with the drop in wind speed observed in the afternoons of
both days corresponding to the rise in SF6 concentration observed prior to the HVAC
system being turned off on 07 December, and at the end of the experiments on 08
December. Similarly, as the wind speeds increased slightly during the morning of 08
December, the SF6 concentrations decreased. This negative correlation is consistent
with increasing winds creating a “stack effect” and drawing air out of the building.

Final Report for Air Exchange Rate Analysis and Protocol Development
4-6 Tetra Tech, Inc.
Figure 4-2 Plot of logged SF6 concentrations at CCAFS Facility 1381 measured on-site and outdoor ambient temperatures.
Final Report for Air Exchange Rate Analysis and Protocol Development
Tetra Tech, Inc. 4-7
Figure 4-3 Plot of logged SF6 concentrations measured on-site at CCAFS Facility 1381 and barometric pressure.

Final Report for Air Exchange Rate Analysis and Protocol Development
4-8 Tetra Tech, Inc.
Figure 4-4 Plot of logged SF6 concentrations measured on-site at CCAFS Facility 1381 and wind speed.
4.2 Building 1416, Former Kelly Air Force Base
The He concentrations in the composite Tedlar bag samples and the time integrated
SUMMA canister samples collected during the experiments at Building 1416 are
presented in Table 4-4. The corresponding SF6 concentration data are presented in
Table 4-5. On-site measurements of SF6 concentrations in the individual rooms are
presented in Table 4-6 and a plot of the logged SF6 concentrations is presented in
Figure 4-5.

Final Report for Air Exchange Rate Analysis and Protocol Development
Tetra Tech, Inc. 4-9
Table 4-4 Helium Concentrations in Building 1416 at Former Kelly AFB
Sample ID Elapsed Time¹
(minutes) Collection
Time Field Result²
(ppmv) Laboratory Result³
(ppmv)
HVAC On (23 March 2011)
1416-HON-15 15 06:40 36,000 21,000
1416-HON-30 30 06:55 26,000 15,000
1416-HON-60 60 07:25 16,300 9,500
1416-HON-90 90 07:55 10,975 7,300
1416-HON-120 120 08:25 8,425 5,900
1416-HON-180 180 09:25 4,625 3,400
1416-HON-240 240 10:25 2,300 1,800
1416-HON-360 360 12:25 700 ND
1416-HON-480 480 14:25 75 ND
1416-SUMMA-3.5HR 30 – 240 06:55 – 10:25 NA 7,900
1416-SUMMA-9HR 30 – 570 06:55 – 15:55 NA 3,500
Definitions:
HVAC – heating, ventilation and air conditioning system NA – not applicable ppmv – part per million by volume Notes: 1 Elapsed time since release of He.
2 Instrument detection level for He was 25 ppmv
3 Laboratory detection level for He was 500 ppmv
Table 4-5 SF6 Concentrations in Building 1416 at Former Kelly AFB
Sample ID Elapsed Time¹
(minutes) Collection Time Laboratory Result
(ppbv)
HVAC On (23 March 2011)
1416-HON-30 30 06:55 1,900
1416-HON-240 240 10:25 2,200
1416-SUMMA-3.5HR 30 – 240 06:55 – 10:25 2,100
(2,000 lab duplicate)
1416-SUMMA-9HR 30 – 570 06:55 – 15:55 1,600
Definitions:
HVAC – heating, ventilation and air conditioning system ppbv – part per billion by volume SF6 – sulfur hexafluoride Notes: 1 Elapsed time since release of He.
Laboratory detection level for SF6 was 0.2 ppbv before dilution Occupational Safety and Health Administration Permissible Exposure Limit for SF6 is 1,000,000 ppbv

Final Report for Air Exchange Rate Analysis and Protocol Development
4-10 Tetra Tech, Inc.
Table 4-6 Discrete SF6 Concentrations in Building 1416 (ppbv) at Former Kelly AFB
Time
Room
Entry Classroom Shop Restroom
HVAC On (23 March 2011)
06:20 2,138 1,746 1,981 2,067
07:20 1,615 1,408 1,262 1,194
08:40 1,658 1,453 1,434 1,409
09:40 1,626 1,551 1,611 1,537
11:10 1,527 1,351 1,432 1,463
12:40 1,419 1,351 1,440 1,501
14:40 1,130 1,074 1,124 1,153
16:00 937 914 940 1,016
Definitions:
HVAC – heating, ventilation and air conditioning system ppbv – part per billion by volume SF6 – sulfur hexafluoride Notes:
Detection level for SF6 was 0.2 ppbv before dilution Occupational Safety and Health Administration Permissible Exposure Limit for SF6 is 1,000,000 ppbv Instrument detection level for SF6 was 10 ppbv
Final Report for Air Exchange Rate Analysis and Protocol Development
Tetra Tech, Inc. 4-11
Figure 4-5 Plot of logged SF6 concentrations measured on-site at former Kelly AFB Building 1416 and laboratory sample results.
As during the CCAFS experiment, the MIRAN gas analyzer was set to continuously
monitor SF6 concentrations and to log the measurements every 10 minutes. Figure
4-5 shows the maximum, minimum, and average SF6 concentrations logged for each
10-minute period. The SF6 was continuously released throughout the study period,
with no interruptions. The discrete samples shown on Figure 4-5 were collected 30
minutes and 4 hours after release of the He. Again, there appears to be some “noise”
in the logged SF6 data due to normal environmentally induced fluctuations, as well
as fluctuations introduced by ingress and egress through the front door and moving
the SF6 analyzer from room to room to obtain discrete measurements. Concentrations
of SF6 logged by the on-site analyzer appear to be consistently lower than those from
the discrete and time-integrated samples collected for off-site laboratory analysis.
During the CCAFS experiments, there was a high degree of agreement between these
two data sets, suggesting that the instrument used for the former Kelly AFB
experiment may have been miscalibrated by the vendor. However, the relative
overall shape of the concentration curve is similar to the one documented during the
CCAFS experiments (see Figure 4-1), indicating that the relative readings are
representative of SF6 concentration fluctuations in Building 1416. The sudden drop
in SF6 concentrations immediately following the release of He was also noted after
the He releases during the CCAFS experiments, suggesting that the release of He

Final Report for Air Exchange Rate Analysis and Protocol Development
4-12 Tetra Tech, Inc.
into the building space may displace a measurable amount of SF6 gas. Six cylinders
of He represent approximately 650 cubic feet of pure He, which represents
approximately 4.6 percent of the total indoor air volume of Building 1416; however,
this volume is not sufficient to account for the total drop in SF6 concentration. The
SF6 concentration is likely also affected by ingress and egress through the front door
beginning immediately prior to He release and continuing throughout the
experiment, with the greatest frequency occurring during the initial stages of the
experiment, when the sampling frequency is highest.
Plots of the logged SF6 concentrations with outside temperature, barometric pressure,
and wind speed are presented in Figure 4-6, Figure 4-7, and Figure 4-8 respectively.
There may be a weak inverse correlation between outside temperature and SF6
concentration (Figure 4-6). It is important to note that the first hours of the SF6
concentration curve show SF6 concentrations in Building 1416 as they are still
building up towards equilibrium conditions and therefore cannot be used to evaluate
correlative relationships between the curves. There appears to be no correlation
between barometric pressure and SF6 concentrations in the building (Figure 4-7).
There may be a negative correlation between wind speed and SF6 concentrations.
This negative correlation is consistent with increasing winds creating a “stack effect”
and drawing air out of the building.

Final Report for Air Exchange Rate Analysis and Protocol Development
Tetra Tech, Inc. 4-13
Figure 4-6 Plot of logged SF6 concentrations measured on-site at former Kelly AFB Building 1416 and outdoor ambient temperatures.

Final Report for Air Exchange Rate Analysis and Protocol Development
4-14 Tetra Tech, Inc.
Figure 4-7 Plot of logged SF6 concentrations measured on-site at former Kelly AFB Building 1416 and barometric pressure.

Final Report for Air Exchange Rate Analysis and Protocol Development
Tetra Tech, Inc. 4-15
Figure 4-8 Plot of logged SF6 concentrations measured on-site at former Kelly AFB Building 1416 and wind speed.
4.3 Building 1130, Travis Air Force Base
The He and SF6 concentrations collected during the experiments at Building 1130
are presented in Table 4-7 through Table 4-10. The laboratory analytical results for
He analyzed upon receipt and then two additional times at 24 hours and 48 hours
following receipt of the samples are presented along with the corresponding field
measurements in Table 4-8. The corresponding SF6 concentration data are presented
in Table 4-9. On-site measurements of SF6 concentrations in the individual rooms are
presented in Table 4-10 and a plot of the logged SF6 concentrations is presented in
Figure 4-9. After the final He sample was collected, the ceiling vents in the
equipment room were temporarily sealed in order to observe the effect on SF6
concentrations. As expected, the concentration increased after sealing the vents, and
then decreased again after unsealing them (Figure 4-9).
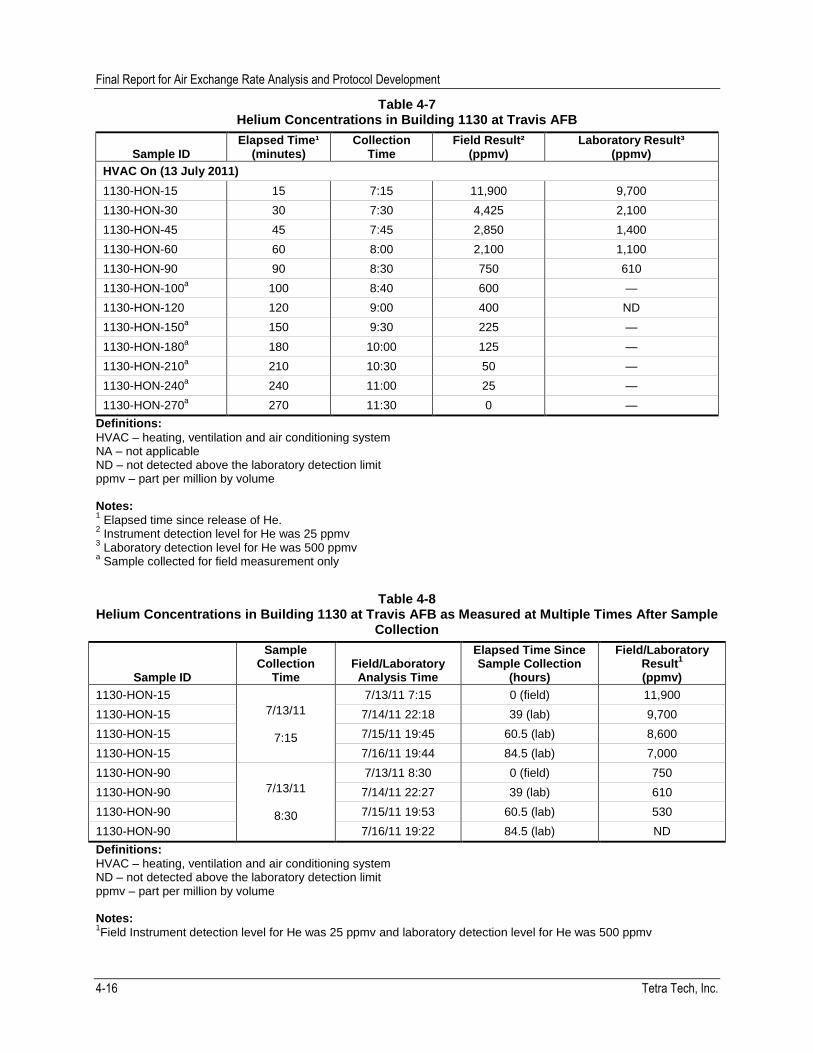
Final Report for Air Exchange Rate Analysis and Protocol Development
4-16 Tetra Tech, Inc.
Table 4-7 Helium Concentrations in Building 1130 at Travis AFB
Sample ID Elapsed Time¹
(minutes) Collection
Time Field Result²
(ppmv) Laboratory Result³
(ppmv)
HVAC On (13 July 2011)
1130-HON-15 15 7:15 11,900 9,700
1130-HON-30 30 7:30 4,425 2,100
1130-HON-45 45 7:45 2,850 1,400
1130-HON-60 60 8:00 2,100 1,100
1130-HON-90 90 8:30 750 610
1130-HON-100a 100 8:40 600 —
1130-HON-120 120 9:00 400 ND
1130-HON-150a 150 9:30 225 —
1130-HON-180a 180 10:00 125 —
1130-HON-210a 210 10:30 50 —
1130-HON-240a 240 11:00 25 —
1130-HON-270a 270 11:30 0 —
Definitions:
HVAC – heating, ventilation and air conditioning system NA – not applicable ND – not detected above the laboratory detection limit ppmv – part per million by volume Notes: 1 Elapsed time since release of He.
2 Instrument detection level for He was 25 ppmv
3 Laboratory detection level for He was 500 ppmv
a Sample collected for field measurement only
Table 4-8 Helium Concentrations in Building 1130 at Travis AFB as Measured at Multiple Times After Sample
Collection
Sample ID
Sample Collection
Time Field/Laboratory Analysis Time
Elapsed Time Since Sample Collection
(hours)
Field/Laboratory Result
1
(ppmv)
1130-HON-15
7/13/11
7:15
7/13/11 7:15 0 (field) 11,900
1130-HON-15 7/14/11 22:18 39 (lab) 9,700
1130-HON-15 7/15/11 19:45 60.5 (lab) 8,600
1130-HON-15 7/16/11 19:44 84.5 (lab) 7,000
1130-HON-90
7/13/11
8:30
7/13/11 8:30 0 (field) 750
1130-HON-90 7/14/11 22:27 39 (lab) 610
1130-HON-90 7/15/11 19:53 60.5 (lab) 530
1130-HON-90 7/16/11 19:22 84.5 (lab) ND
Definitions:
HVAC – heating, ventilation and air conditioning system ND – not detected above the laboratory detection limit ppmv – part per million by volume Notes: 1Field Instrument detection level for He was 25 ppmv and laboratory detection level for He was 500 ppmv

Final Report for Air Exchange Rate Analysis and Protocol Development
Tetra Tech, Inc. 4-17
Table 4-9 SF6 Concentrations in Building 1130, Travis AFB
Sample ID Elapsed Time¹
(minutes) Collection Time Laboratory Result
(ppbv)
HVAC On (13 July 2011)
1130-HON-30 30 7:30 130 (120 lab duplicate)
1130-HON-120 120 9:30 950
1130-SUMMA-1.75HR 30 – 135 9:15 530
1130-SUMMA-4HR 30 – 270 11:30 680
Definitions:
HVAC – heating, ventilation and air conditioning system ppbv – part per billion by volume SF6 – sulfur hexaflouride Notes: 1 Elapsed time since release of He.
Laboratory detection level for SF6 was 0.2 ppbv before dilution Occupational Safety and Health Administration Permissible Exposure Limit for SF6 is 1,000,000 ppbv
Table 4-10 Discrete SF6 Concentrations in Building 1130 (ppbv) at Travis AFB
Time
Room
Equipment Room Storage Room
HVAC On (13 July 2011)
06:40 410 440
09:47 430 460
Definitions:
HVAC – heating, ventilation and air conditioning system ppbv – part per billion by volume SF6 – sulfur hexaflouride Notes:
Occupational Safety and Health Administration Permissible Exposure Limit for SF6 is 1,000,000 ppbv Instrument detection level for SF6 was 10 ppbv

Final Report for Air Exchange Rate Analysis and Protocol Development
4-18 Tetra Tech, Inc.
Figure 4-9 Plot of logged SF6 concentrations measured on-site at Travis AFB Building 1130 and laboratory sample results.
As shown in Table 4-7, field-measured He concentrations decreased from 11,900 to
2,100 ppm within the first hour of the experiment. This represents more than an 80
percent drop, which suggested early on during the experiment that the AER within
Building 1130 was higher than anticipated, prompting field personnel to collect
additional He samples at 45 and 100 minutes after He release and to close the
SUMMA canisters earlier than planned. The fixed laboratory results confirmed the
rapid drop in He concentrations, although the laboratory results were generally lower
than the field measurements, as was the case during the CCAFS and former Kelly
AFB experiments.
The difference in He concentrations observed between the field measurements and
the corresponding laboratory analyses are shown on Table 4-8, along with the
additional laboratory results from sample reanalyses conducted at approximately 24
and 48 hours after the initial analysis. As shown in Table 4-8, concentrations of He
continued to decrease after the laboratory received the samples, suggesting that the
difference in He concentrations between field and laboratory measurements was not
an artifact of the field He meter, but instead was the result of He loss through the
Tedlar bag (Figure 4-10).

Final Report for Air Exchange Rate Analysis and Protocol Development
Tetra Tech, Inc. 4-19
a) At Building 1130, Travis AFB
0
2000
4000
6000
8000
10000
12000
14000
0 20 40 60 80 100
He
Co
nce
ntr
atio
n (
pp
mv)
Time Elapsed Since Sample Collection (hours)
1130-HON-15
Field Measurement
Lab Measurement
0
100
200
300
400
500
600
700
800
0 10 20 30 40 50 60 70
He
Co
nce
ntr
atio
n (
pp
mv)
Time Elapsed Since Sample Collection (hours)
1130-HON-90
Field Measurement
Lab Measurement

Final Report for Air Exchange Rate Analysis and Protocol Development
4-20 Tetra Tech, Inc.
b) At All Three Facilities Examined
Figure 4-10 Relationship between field measurements and laboratory results
A review of all field and analytical He data from the CCAFS, former Kelly AFB, and
Travis AFB experiments revealed that the difference in He concentrations between
the field-measured results and the laboratory analyses remained relatively consistent
with average relative percent differences (RPDs) ranging from 34 percent at CCAFS
to 49 percent at Travis AFB. It was originally suspected that low ambient barometric
pressure during air transport would promote greater diffusion of He out of the Tedlar
bags. However, the samples collected for the Travis AFB experiment were
transported via ground and showed the greatest loss of He between sample collection
in the field and laboratory analysis, suggesting that air transport of samples likely
does not increase the loss of He from the Tedlar bags.
As during the CCAFS and former Kelly AFB experiments, the MIRAN gas analyzer
was set to continuously monitor SF6 concentrations and to log the measurements
every 10 minutes. Figure 4-9 shows the maximum, minimum, and average SF6
concentrations logged for each 10-minute period. The SF6 was continuously released
throughout the study period, with no interruptions. The discrete samples shown on
Figure 4-9 were collected 30 minutes and 2 hours after release of the He. Again,
there appears to be some “noise” in the logged SF6 data due to normal
0
5,000
10,000
15,000
20,000
25,000
30,000
35,000
40,000
0 5,000 10,000 15,000 20,000 25,000 30,000 35,000 40,000
Fie
ld R
esu
lts,
pp
mv
Laboratory Results, ppmv
CCAFS (HVAC on)
CCAFS (HVAC off)
Kelly AFB
Travis AFB
1:1 Line
Final Report for Air Exchange Rate Analysis and Protocol Development
Tetra Tech, Inc. 4-21
environmentally induced fluctuations, as well as fluctuations introduced by ingress
and egress through the front door. Concentrations of SF6 logged by the on-site
analyzer appear to be consistently lower than those from the discrete and time-
integrated samples collected for off-site laboratory analysis, with the exception of the
30-minute discrete sample (Figure 4-9).
As at CCAFS and former Kelly AFB, a sudden drop in SF6 concentrations was
observed immediately following the release of He, which could not be entirely
attributed to displacement by the released helium.
Plots of the logged SF6 concentrations with outside temperature, barometric pressure,
and wind speed are presented in Figure 4-11, Figure 4-12, and Figure 4-13
respectively. There does not appear to be a correlation between outside temperature
and SF6 concentration, as shown by the relatively stable SF6 concentrations
throughout the night despite outside temperature fluctuations of 11 degrees
Fahrenheit (Figure 4-11). There appears to be no correlation between barometric
pressure and SF6 concentrations in the building, as expected based on the relatively
open nature of the building due to the generator vents and utility trenches; it would
not be expected in such a situation for a differential pressure to exist between the
inside and the outside of the building (Figure 4-12). No correlation between wind
speed and SF6 concentrations was observed, although this may be due to the short
observation period and other factors effecting the SF6 (e.g., egress and ingress,
sealing and unsealing the vents). .
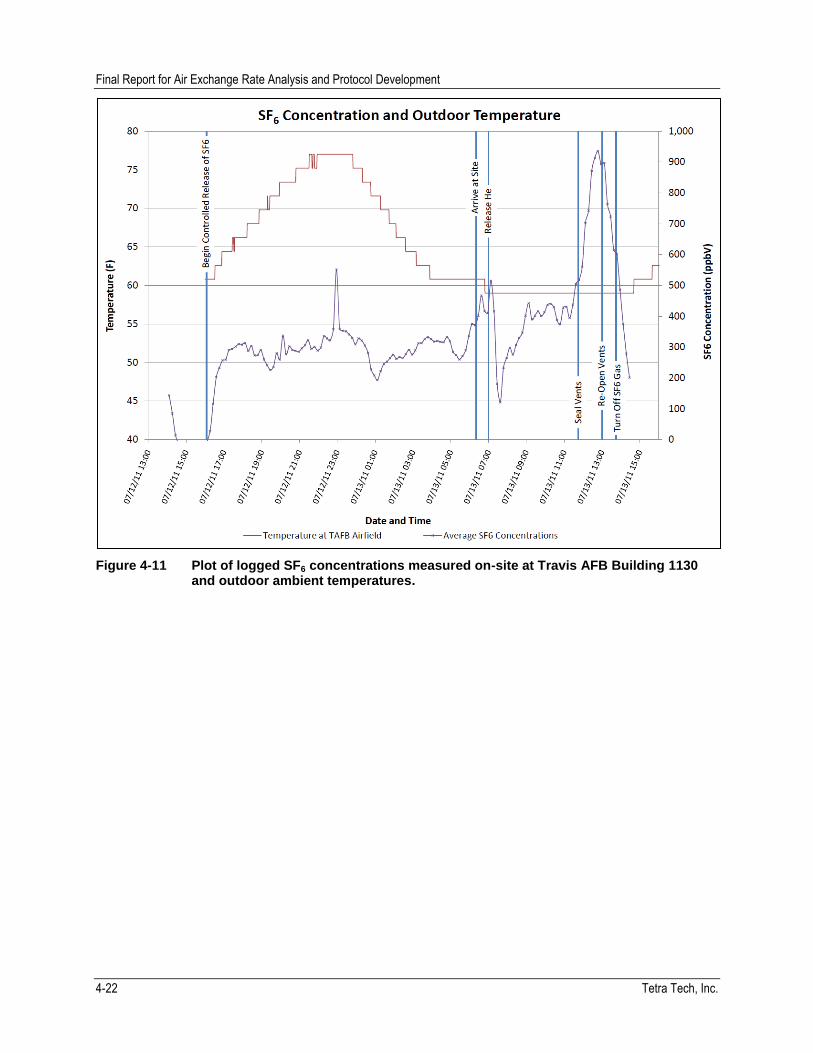
Final Report for Air Exchange Rate Analysis and Protocol Development
4-22 Tetra Tech, Inc.
Figure 4-11 Plot of logged SF6 concentrations measured on-site at Travis AFB Building 1130 and outdoor ambient temperatures.

Final Report for Air Exchange Rate Analysis and Protocol Development
Tetra Tech, Inc. 4-23
Figure 4-12 Plot of logged SF6 concentrations measured on-site at Travis AFB Building 1130 and barometric pressure.

Final Report for Air Exchange Rate Analysis and Protocol Development
4-24 Tetra Tech, Inc.
Figure 4-13 Plot of logged SF6 concentrations measured on-site at Travis AFB Building 1130 and wind speed.

Tetra Tech, Inc. 5-1
5 AIR EXCHANGE RATE ANALYSIS
Analyses of the AER data for each of the three buildings investigated for this study
are presented in the following sections. For each site, the information presented
includes:
Analysis of He release methods: For these methods, He was released
instantaneously and AERs were calculated based on the decay in He
concentrations and using three least-squares (LS) methods.
Analysis of ASTM methods: For these methods SF6 was released
continuously at a known rate, and AERs were calculated. These tests were
conducted simultaneously with the He tests. A modification was made to the
ASTM method for this project to allow the ASTM methods to be excecuted
under conditions that were not at steady-state (not at equilibrium). This was
useful because data collected during the project clearly showed the SF6 tracer
concentrations were not at steady-state during the tests.
Comparison of He-release results and SF6-release results.
Additional information is presented on a site by site basis as warranted based on the
data collected. As discussed previously, at each building, the AER was calculated
using instantaneously released He and continuously released SF6. Multiple
approaches were used for calculating AERs for both the He and SF6 methods (e.g.,
different mathematical equations, different statistical treatment, or different time
intevals). In the following discussion, the term “test” is used to refer to a single AER
calculation. For example, for a single building with a single He release, three “tests”
can be conducted by calculating the AER using the three LS equations.
The three LS methods are documented in Appendix B. The three methods are all
similar to each other, and differ primarily in that for LS method #1 (LS-1), the initial
well-mixed He concentration (C0) is used in the equations to calculate AER, while
for method #2 (LS-2) and method #3 (LS-3), C0 is not required to calculate the AER,
although it can be estimated from the sample data. For LS-1, C0 is calculated in one
of two ways: either by directly calculating the difference in weights of the He
cylinders before and after He release, or using the vendor provided volume of the
cylinders.
The LS methods provide three similar approaches to evaluating helium concentration
decay data in order to calculate an AER. Methods LS-2 and LS-3 offer the nominal
advantage over LS-1 of not requiring knowledge of C0; however, C0 is easily
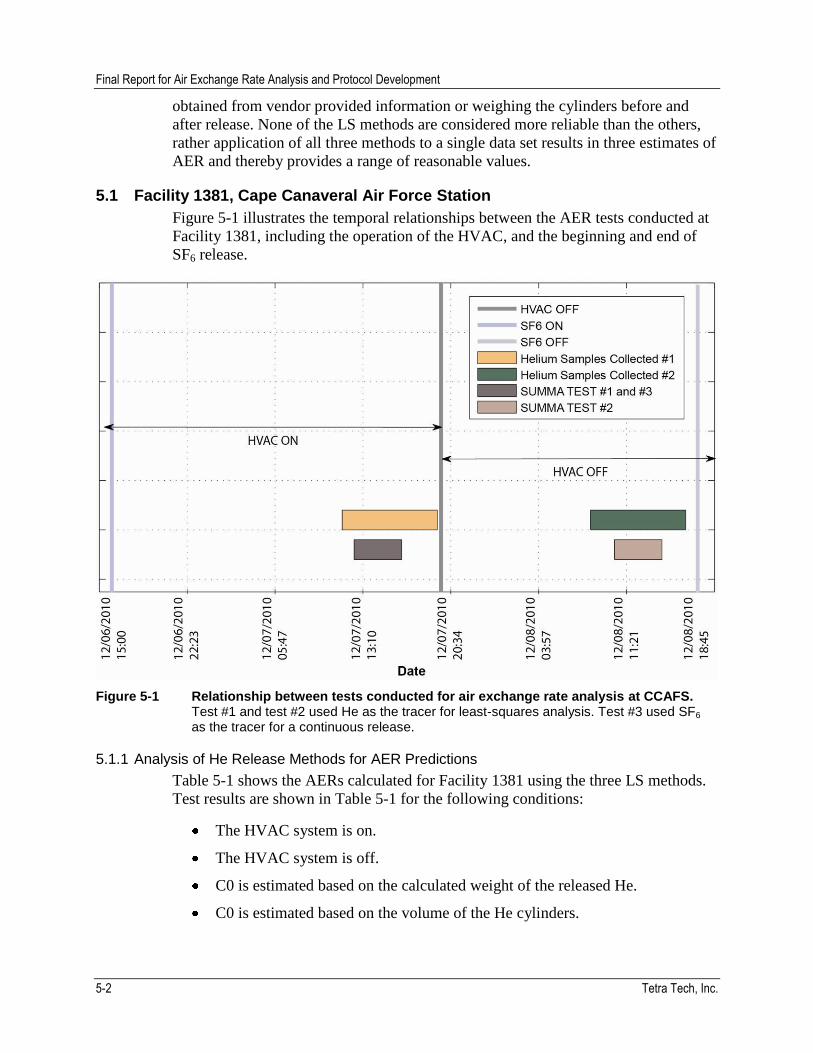
Final Report for Air Exchange Rate Analysis and Protocol Development
5-2 Tetra Tech, Inc.
obtained from vendor provided information or weighing the cylinders before and
after release. None of the LS methods are considered more reliable than the others,
rather application of all three methods to a single data set results in three estimates of
AER and thereby provides a range of reasonable values.
5.1 Facility 1381, Cape Canaveral Air Force Station
Figure 5-1 illustrates the temporal relationships between the AER tests conducted at
Facility 1381, including the operation of the HVAC, and the beginning and end of
SF6 release.
Figure 5-1 Relationship between tests conducted for air exchange rate analysis at CCAFS. Test #1 and test #2 used He as the tracer for least-squares analysis. Test #3 used SF6 as the tracer for a continuous release.
5.1.1 Analysis of He Release Methods for AER Predictions
Table 5-1 shows the AERs calculated for Facility 1381 using the three LS methods.
Test results are shown in Table 5-1 for the following conditions:
The HVAC system is on.
The HVAC system is off.
C0 is estimated based on the calculated weight of the released He.
C0 is estimated based on the volume of the He cylinders.

Final Report for Air Exchange Rate Analysis and Protocol Development
Tetra Tech, Inc. 5-3
Both field results and lab results of He measurements were used as input data
to each method to compare results.
The AERs calculated using the LS methods with the HVAC on ranged from 12.7/day
to 17.5/day, while with the HVAC off they ranged from 8.7/day to 11.4/day. Lower
AERs are expected with the HVAC system turned off.
Table 5-1 Air Exchange Rate Results for He Tests (Instantaneous Release)
Conducted at CCAFS using Least-Squares Methods1
Field Results Laboratory Results
Method LS-1
Method LS-2
Method LS-3
Method LS-1
Method LS-2
Method LS-3
AER, 1/day
C02,
% AER, 1/day
AER, 1/day
AER, 1/day
C02, %
AER, 1/day
AER, 1/day
HVAC ON #1
Initial Concentration by Weight
14.2 1.9
13.7 12.7
17.2 1.9
13.9 12.8 Initial Concentration by Volume
14.4 2.0 17.5 2.0
HVAC OFF #2
Initial Concentration by Weight
9.1 1.2
9.0 8.8
10.8 1.2
9.4 8.7 Initial Concentration by Volume
9.8 1.4 11.4 1.4
Definitions:
LS – least-squares AER – air exchange rate HVAC – heating, ventilation, and air conditioning C0 – initial He concentration (calculated) Notes: 1 The three least-squares methods for calculating AERs are explained in Appendix B.
2 C0 is required for method LS-1 only, and not the other two methods.
A Monte Carlo method was developed and applied to the LS methods, and example
results are shown in Table 5-2. In the table, results are shown when the HVAC
system is on (5-2a) and when the HVAC system is off (5-2b). The percentiles shown
are 5%, 50% (median), and 95%. Other percentiles could have been chosen as well.
Note that the difference between the 5% and 95% is relatively small, a good
indicator of the accuracy of the estimates.

Final Report for Air Exchange Rate Analysis and Protocol Development
5-4 Tetra Tech, Inc.
Table 5-2 Estimated Percentile Ranges of AERs Calculated using Instantaneous He Releases into Facility 1381 at CCAFS
(a) HVAC On
AERs (1/day)
Percentile LS-1 LS-2 LS-3
5% 15.1 11.9 11.6
50% 17.3 14.3 12.7
95% 19.0 16.0 14.2
(b) HVAC Off
AERs (1/day)
Percentile LS-1 LS-2 LS-3
5% 9.2 7.9 7.7
50% 10.7 9.6 8.7
95% 12.3 10.9 9.5
Definitions:
LS – least-squares AER – air exchange rate HVAC – heating, ventilation, and air conditioning
In addition to the three least-squares approaches, a method was developed to
calculate AER that combined instantaneous release of He and laboratory analysis of
a time-integrated sample collected in a SUMMA canister. Features of this method
include:
It is straightforward like the LS methods, and requires the same He tracer gas
release.
Fewer He samples are needed. Theoretically, only one is required (the time-
integrated concentration).
The method can be used to estimate AERs averaged over 12 hours or more.
This method was only used for comparisons with the LS methods, and it is not
documented in detail.
Two applications of this method were completed for the time intervals shown in
Figure 5-1. Test #1 was performed with the HVAC on, and test #2 with the HVAC
off. The results for both tests are shown graphically in Figure 5-2. Figure 5-2(a)
shows the result of test #1, where the SUMMA was activated one hour after the He
release and continued for four hours. The time-integrated He concentration for that
period was 3,100 ppmv. The AER corresponding to this time interval was 16.95/day,
which is in the range of AERs calculated using the LS methods (Table 5-1).

Final Report for Air Exchange Rate Analysis and Protocol Development
Tetra Tech, Inc. 5-5
a) December 7, 2010, Test #1 with the He Tracer (HVAC On)
b) December 8, 2010, Test #2 with the He Tracer (HVAC Off)
Figure 5-2 Results of AER calculations at CCAFS using SUMMA approach and instantaneous helium releases. The curves show the expected time-integrated He concentration for the specified period. By finding the measured He concentration on the curve, the AER can be read off the x-axis.

Final Report for Air Exchange Rate Analysis and Protocol Development
5-6 Tetra Tech, Inc.
For test #2, the SUMMA was activated two hours after the He release and continued
for four hours. The time-integrated He concentration for this period was 2,200 ppmv,
which corresponds to an AER of 11.15/day, which is also in the range of AERs
calculated using the LS methods (Table 5-1).
5.1.2 Analysis of SF6 Release Methods for AER Predictions
The SF6 tests, which are being compared to the He tests, all use continuous releases
of SF6. The start and stop times are shown in Figure 5-1. Figure 5-3(a) shows the
time series of measured SF6 concentrations, and shows where data are missing. To
eliminate the impacts of data oscillations, the mean SF6 concentrations were
converted to seven-point running averages, and the AERs were calculated with the
running average data. Shown in Figure 5-3(b) are the AERs calculated over each of
five time intervals, which in some cases show noise. The running average approach
removed much of the noise, and provides (in most instances) one-hour average
values. For each of the five intervals, the average of each AER was calculated, and
the results are shown in Table 5-3. Note that for each interval the four methods of
calculating AER are very consistent with each other. The higher AERs are associated
with the HVAC on, as anticipated.
The next AER test performed (test #3) used the SUMMA canister to develop an
integrated concentration over the test duration, and these results were used jointly
with the continuous SF6 discharge to calculate AER. The methodology for
developing the modified ASTM method is described in Appendix C.
Test #3 was conducted with the HVAC on, and within the period when the first He
release test was being performed. The results of the tests are shown in Figure 5-4.
The solid sloping line represents the relationship between the AER and the
concentration in the SUMMA canister (which was opened 1 hour after the He was
released and was closed 4 hours later). The SF6 concentration does not have to be at
a constant concentration while the SUMMA canister is open. Rather, the SUMMA
canister yields a time-integrated concentration, and the calculated AER is assumed to
be an average concentration over the sample period. The time-integrated
concentration in the SUMMA at the completion of the test was 330 ppbv. Using that
concentration, the AER is calculated to be 19.1/day. In general the AERs are high
enough that the results typically depend only on the prior 10 to 12 hours before the
tests begin. For example, with an AER of 10/day, the concentration remaining after
12 hours from an instantaneous release is less than 1%.

Final Report for Air Exchange Rate Analysis and Protocol Development
Tetra Tech, Inc. 5-7
(a) SF6 Time Series (Plot shows average SF6 concentrations and seven-point running averages)
Figure 5-3 Predicted AERs from continuous SF6 releases into Facility 1381 at CCAFS. (The seven point running average was intended to lessen or remove spikes in the AER calculations. However, some spikes still remain because of several remaining rapid changes in SF6 concentrations.)

Final Report for Air Exchange Rate Analysis and Protocol Development
5-8 Tetra Tech, Inc.
(b) AER by Forward and Central Finite Difference Methods using Trapezoid Integration Method (Plot shows AERs based on data in Figure 5-3(a))
Figure 5-3 (continued) Predicted AERs from continuous SF6 releases into Facility 1381 at CCAFS. (The seven point running average was intended to lessen or remove spikes in the AER calculations. However, some spikes still remain because of several remaining rapid changes in SF6 concentrations.)
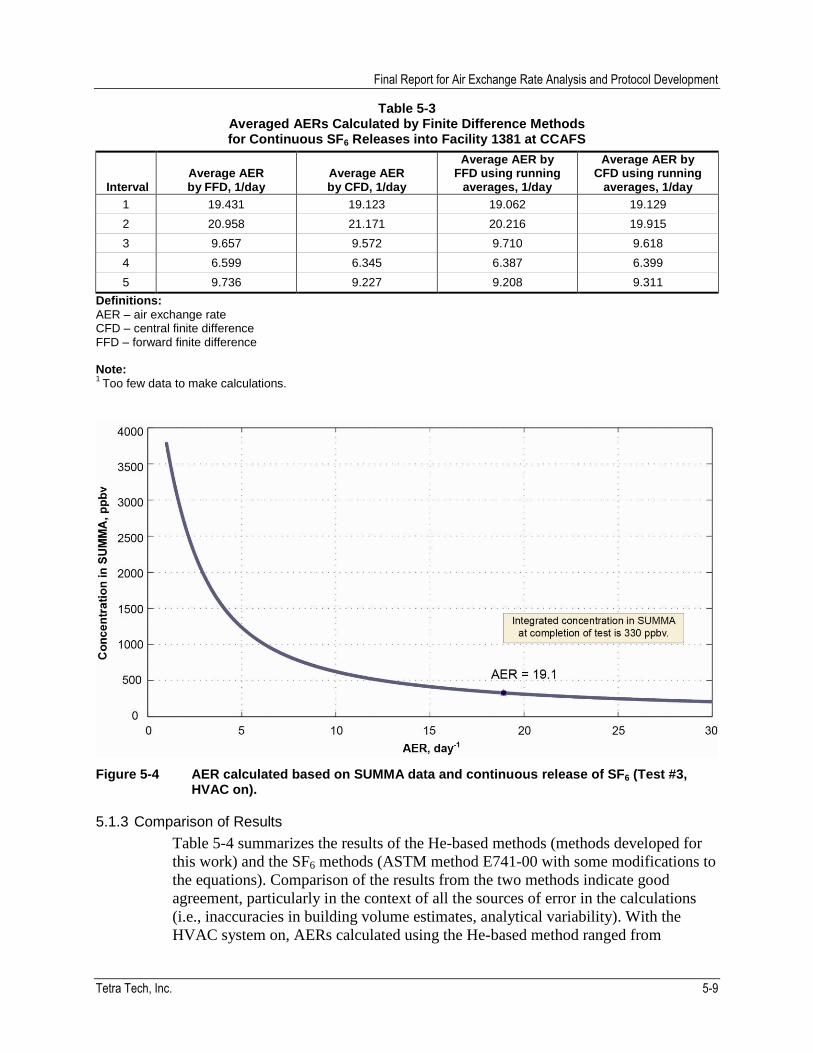
Final Report for Air Exchange Rate Analysis and Protocol Development
Tetra Tech, Inc. 5-9
Table 5-3 Averaged AERs Calculated by Finite Difference Methods for Continuous SF6 Releases into Facility 1381 at CCAFS
Interval Average AER by FFD, 1/day
Average AER by CFD, 1/day
Average AER by FFD using running
averages, 1/day
Average AER by CFD using running
averages, 1/day
1 19.431 19.123 19.062 19.129
2 20.958 21.171 20.216 19.915
3 9.657 9.572 9.710 9.618
4 6.599 6.345 6.387 6.399
5 9.736 9.227 9.208 9.311
Definitions:
AER – air exchange rate CFD – central finite difference FFD – forward finite difference Note: 1
Too few data to make calculations.
Figure 5-4 AER calculated based on SUMMA data and continuous release of SF6 (Test #3, HVAC on).
5.1.3 Comparison of Results
Table 5-4 summarizes the results of the He-based methods (methods developed for
this work) and the SF6 methods (ASTM method E741-00 with some modifications to
the equations). Comparison of the results from the two methods indicate good
agreement, particularly in the context of all the sources of error in the calculations
(i.e., inaccuracies in building volume estimates, analytical variability). With the
HVAC system on, AERs calculated using the He-based method ranged from

Final Report for Air Exchange Rate Analysis and Protocol Development
5-10 Tetra Tech, Inc.
12.8/day to 17.5/day, while AERs calculated using the SF6-based method ranged
from 9.6/day to 20.2/day. AERs calculated with the HVAC off ranged from 8.7/day
to 11.4/day with the He-based method and from 6.4/day to 9.3/day with the SF6-
based method. The greater variability in results for the SF6-based method is in part
due to the fact that AERs were calculated for discrete time intervals (Figure 5-3(a))
while the AERs calculated using the He-based method are for the entire He decay
period. These results suggest that the He test methods are robust and are as accurate
as the SF6 tests. The same conclusions apply when the HVAC is off.
Table 5-4 Summary of AER Results for Facility 1381 at CCAFS
(all AER values are in units of day-1
)
Methods HVAC On HVAC Off
He Tests (instantaneous releases)
LS-1 17.2–17.5 10.8–11.4
LS-2 13.9 9.4
LS-3 12.8 8.7
SUMMA-1a 17.0 NC
SUMMA-2a NC 11.2
SF6 Tests (continuous releases)
FD with Running Averages
Interval 1a 19.1 NC
Interval 2a 19.9–20.2 NC
Interval 3a 9.6–9.7 NC
Interval 4a NC 6.4
Interval 5a NC 9.2–9.3
SUMMA-3 b
19.1 NC
Definitions:
AER – air exchange rate FD – finite difference He – helium HVAC – heating, ventilation, and air conditioning LS – least-squares NC – not calculated SF6 – sulfur hexafluoride Notes: aThese tests were performed with either the HVAC on or off.
b For the SUMMA-3 result, the exchange rate is 19.1/day over both periods.
cThis test was not done because SF6 data were collected over the period when the HVAC was operating and also
over the subsequent period when the HVAC was not operating.
5.2 Building 1416, Former Kelly Air Force Base
The AER analyses for Building 1416 are presented in the following sections. Figure
5-5 illustrates the temporal relationships between the AER tests conducted at
Building 1416. Also shown is when the instantaneous He release occurred, and the
beginning and end of the SF6 release.

Final Report for Air Exchange Rate Analysis and Protocol Development
Tetra Tech, Inc. 5-11
Figure 5-5 Relationship between air exchange rate tests for former Kelly AFB.
5.2.1 Analysis of He Release Methods for Air Exchange Rate Predictions
Table 5-5 shows the results of AER predictions using the three LS methods. The
theory behind each method is documented in Appendix B. Test results are shown for
the following conditions:
The HVAC system is operating throughout the test period.
For method #1 (LS-1), the initial concentration is calculated in one of two
ways: either by directly calculating the difference in weights of the He
cylinders before and after He release, or from the vendor provided volumes of
the cylinders.
Both field results and lab results of He measurements were used as input data
to each method so that results could be compared.

Final Report for Air Exchange Rate Analysis and Protocol Development
5-12 Tetra Tech, Inc.
Table 5-5 Air Exchange Rate Results for He Tests (Instantaneous Releases)
Conducted at Former Kelly AFB using Least-Squares Methods¹
Kelly AFB
Field Results Lab Results
Method LS-1
Method LS-2
Method LS-3
Method LS-1
Method LS-2
Method LS-3
AER, 1/day
C0², %
AER, 1/day
AER, 1/day
AER, 1/day
C0², %
AER, 1/day
AER, 1/day
HVAC ON
Initial Concentration by Weight
18.8 4.9
18.2 17.7
22.6 4.9
16.5 14.8 Initial Concentration by Volume
18.6 4.7 22.3 4.7
Definitions:
LS – least-squares AER – air exchange rate HVAC – heating, ventilation, and air conditioning C0 – initial He concentration (calculated from data available) Notes 1
The three least-squares methods for calculating AERs are explained in Appendix B. 2 C0 is only required for method LS-1.
In all, 8 different estimates of AERs were generated using the LS methods. The
Monte Carlo method discussed in Section 5.1.1was applied to the LS methods, and
example results are shown in Table 5-6. The percentiles shown are 5%, 50%
(median), and 95%. Other percentiles could have been chosen as well, as the
complete distributions are shown in Figure 5-6. Note that the difference between 5%
and 95% is relatively small, a good indicator of the accuracy of the estimates.
As at CCAFS, in addition to the three least-squares approaches, the method using a
single sample collected in a SUMMA canister was used. Two applications of the
SUMMA method were completed for the time intervals shown in Figure 5-5 (6:55 to
10:25 and 6:55 to 15:55). The results for both tests are shown graphically in Figure
5-7. Figure 5-7(a) shows the results of Test #1, where the SUMMA was activated 30
minutes after the He release and continued for 3.5 hours. The time-integrated He
concentration for that period was 7,900 ppmv. The AER corresponding to this time
interval was 24.6/day. This is close to the AER calculated using LS-1 (22.6/day).
For Test #2, the SUMMA was also activated 30 minutes after the He release and
continued for 9 hours. The time-integrated He concentration for this time period was
3,500 ppmv (see Figure 5-7(b), which corresponds to an AER of 23/day, only
slightly different from 22.6/day calculated by LS-1 using lab data.
5.2.2 Analysis of SF6 Release Methods for AER Predictions
The SF6 tests all use continuous releases. The start and stop times were shown in
Figure 5-5. Figure 5-8(a) shows the time series of measured SF6 concentrations and
running averages. Shown in Figure 5-8(b) are the AERs calculated over each time
interval.

Final Report for Air Exchange Rate Analysis and Protocol Development
Tetra Tech, Inc. 5-13
The next AER test performed used the SUMMA canister to develop an integrated
concentration over the test duration, and these results were used jointly with the
continuous SF6 discharge to calculate AER.

Final Report for Air Exchange Rate Analysis and Protocol Development
5-14 Tetra Tech, Inc.
Table 5-6 Least Squares Air Exchange Rate Results for He Tests: Monte Carlo Analysis at Building 1416, Former Kelly AFB
HVAC ON Percentile
Field Data Lab Data
AERs (1/day) AERs (1/day)
LS-1 LS-2 LS-3 LS-1 LS-2 LS-3
Initial Concentration by Weight
5% 18.2 17.22 17.12 21.48 14.48 13.34
50% 18.83 18.24 17.72 22.58 16.61 14.78
95% 19.43 19.14 18.35 23.81 18.35 16.08
Initial Concentration by Volume
5% 18.03 17.19 17.12 21.07 14.59 13.47
50% 18.65 18.21 17.70 22.29 16.50 14.82
95% 19.20 19.19 18.36 23.45 18.45 16.11
Definitions:
AER – air exchange rate C0 – Initial He concentration He – helium HVAC – heating, ventilation and air conditioning system LS – least squares method

Final Report for Air Exchange Rate Analysis and Protocol Development
Tetra Tech, Inc. 5-15
Figure 5-6 Plots of distributions of air exchange rates at Building 1416, former Kelly AFB.

Final Report for Air Exchange Rate Analysis and Protocol Development
5-16 Tetra Tech, Inc.
a) Test #1
b) Test #2
Figure 5-7 Results of AER calculations using SUMMA approach and instantaneous He releases, Building 1416, former Kelly AFB.
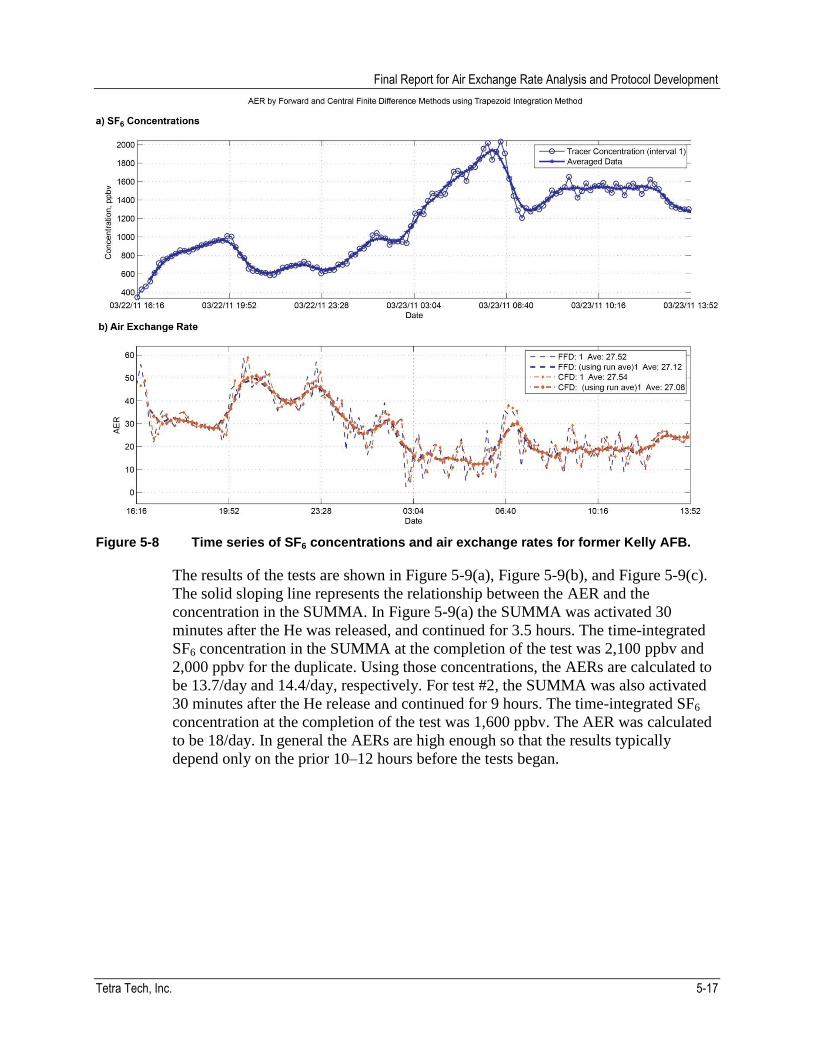
Final Report for Air Exchange Rate Analysis and Protocol Development
Tetra Tech, Inc. 5-17
Figure 5-8 Time series of SF6 concentrations and air exchange rates for former Kelly AFB.
The results of the tests are shown in Figure 5-9(a), Figure 5-9(b), and Figure 5-9(c).
The solid sloping line represents the relationship between the AER and the
concentration in the SUMMA. In Figure 5-9(a) the SUMMA was activated 30
minutes after the He was released, and continued for 3.5 hours. The time-integrated
SF6 concentration in the SUMMA at the completion of the test was 2,100 ppbv and
2,000 ppbv for the duplicate. Using those concentrations, the AERs are calculated to
be 13.7/day and 14.4/day, respectively. For test #2, the SUMMA was also activated
30 minutes after the He release and continued for 9 hours. The time-integrated SF6
concentration at the completion of the test was 1,600 ppbv. The AER was calculated
to be 18/day. In general the AERs are high enough so that the results typically
depend only on the prior 10–12 hours before the tests began.
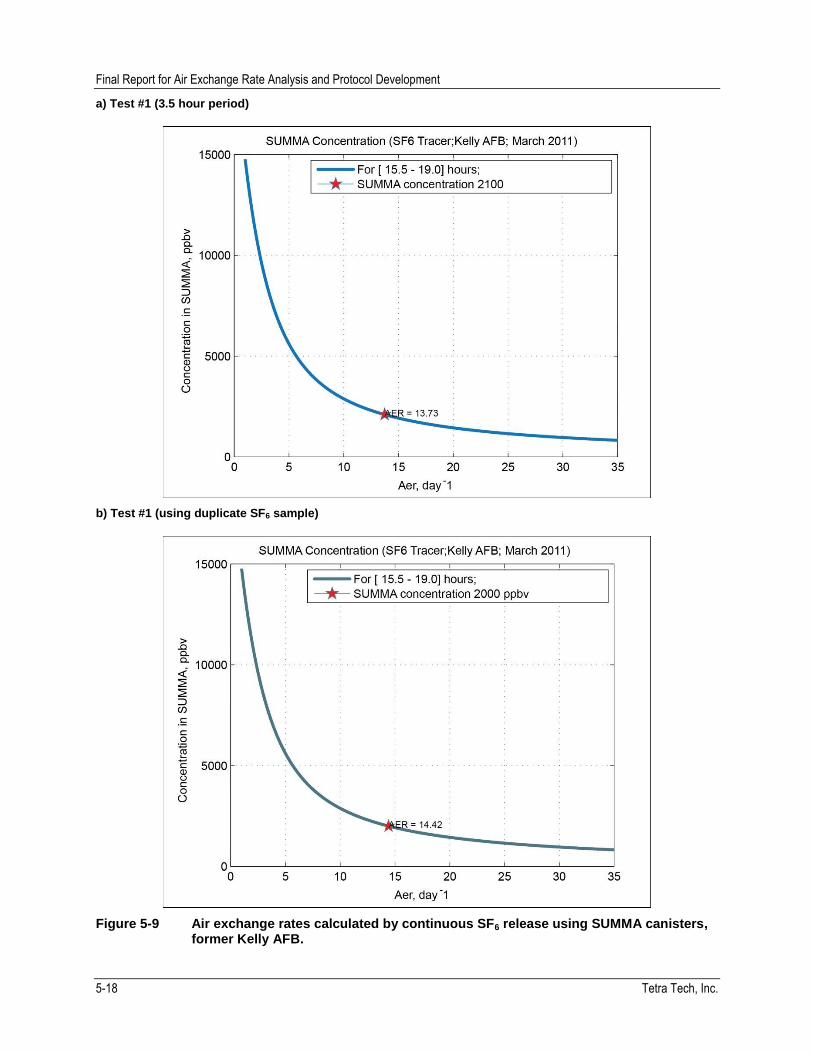
Final Report for Air Exchange Rate Analysis and Protocol Development
5-18 Tetra Tech, Inc.
a) Test #1 (3.5 hour period)
b) Test #1 (using duplicate SF6 sample)
Figure 5-9 Air exchange rates calculated by continuous SF6 release using SUMMA canisters, former Kelly AFB.

Final Report for Air Exchange Rate Analysis and Protocol Development
Tetra Tech, Inc. 5-19
c) Test #2 (9 hour duration)
Figure 5-9 (continued) Air exchange rates calculated by continuous SF6 release using SUMMA canisters, former Kelly AFB.
5.2.3 Comparison of Results
Table 5-7 and Table 5-8 summarize the results of the He-based methods and the SF6-
based methods.
5.2.3.1 Least Squares Tests
By examining Table 5-7 and cross-comparing results from the 13 different tests, the
results are generally consistent with only a few exceptions. These are briefly
described below. Tests #3 and #4, using lab data, show that methods LS-1 produces
higher air exchange rates (~22.2/day) than LS-2 or LS-3 (14.7/day to 16.5/day). One
hypothesis for this is that He is being lost from the Tedlar bags between the time of
sample collection and the time of sample analysis. Since method LS-1 uses a well-
mixed initial He concentration (C0) and if He were lost from the first sample, the
LS-1 method would tend to predict a higher air exchange rate. Methods LS-2 and
LS-3 are less affected because C0 is not imposed as for LS-1.
This hypothesis is supported by the fact that results from tests #1 and #2 (also LS
tests), which use field data, do not show this differential between the results of LS-1
and the remaining two LS tests.

Final Report for Air Exchange Rate Analysis and Protocol Development
5-20 Tetra Tech, Inc.
Table 5-7 Air Exchange Rates, Day
-1, Over Interval Shown

Final Report for Air Exchange Rate Analysis and Protocol Development
Tetra Tech, Inc. 5-21
Table 5-8 Summary of Air Exchange Rate Analysis for Former Kelly AFB
Tracer Range (day-1
) Average (day-1
)
Results for Short Duration Tests (3–4 hours), March 23, 2011
He LS 14.7–22.6 17.9
SUMMA 24.6 24.6
SF6 SUMMA 13.7–14.4 14.1
Finite Difference 16.6–18.6 17.6
Results of Long Duration Tests (8–9 hours)
He LS 17.7–18.8 18.1
SUMMA 22.9 22.9
SF6 SUMMA 18.0 18.0
Finite Difference 17.6–17.7 17.6
Definitions:
He – helium LS – least squares method SF6 – sulfur hexafluoride
5.2.3.2 SUMMA Tests
While the SUMMA tests are not a part of the final protocol document, they were
developed for this project as an independent and simple way to calculate air
exchange rates. One inconsistency with these tests where SF6 was the tracer was test
#7. Lower air exchange rates were calculated than for all other methods.
Overall, the He based methods compared well with the SF6 based method.
5.3 Building 1130, Travis Air Force Base
The AER analysis for Building 1130 is presented in the following sections. Figure
5-10 illustrates the temporal relationships between the AER tests conducted at
Building 1130. Information includes tracer release information and duration of tests.
The SF6 release began at 16:05 on 12 July 2011, well before the He tests began at
07:00 on 13 July 2011. SUMMA tests using SF6 as the tracer began 30 minutes after
He release.

Final Report for Air Exchange Rate Analysis and Protocol Development
5-22 Tetra Tech, Inc.
Figure 5-10 Relationship between air exchange rate tests for Building 1130 at Travis AFB.
5.3.1 Analysis of He Release Methods for AER Predictions
Table 5-9 summarizes the He tests from each of the three methods and for field and
lab results. In general, the calculated AERs were larger than at the previous
buildings. A major contributing reason was an open conduit to the generator room
and open vents from the generator room to the outside air (shown in Figure 3-12),
which allowed for significant flow of outdoor air into the building. Differences in
AERs were also noted between field results and lab results, which may have been
related to loss of He from the Tedlar bags between the time of sample collection and
the time of analysis at the lab (Section 4.3).

Final Report for Air Exchange Rate Analysis and Protocol Development
Tetra Tech, Inc. 5-23
Table 5-9 Air Exchange Rate Results for He Tests (Instantaneous Release)
Conducted at Building 1130 at Travis AFB
Method
Field Results Lab Results
AER, 1/day C0, % AER, 1/day C0, %
LS-1 50.8 4.76 86.7 4.76
LS-2 42.0 1.6 63.4 1.7
LS-3 36.6 1.0 47.1 0.9
Definitions:
AER – air exchange rate C0 – Initial He concentration (calculated using weight change of He canisters) He – helium LS – least squares method
Differences were also noted between the three least squares methods with LS-1
yielding the highest AERs.
5.3.2 Analysis of SF6 Release Methods for AER Predictions
The SF6 release occurred for nearly a day as shown in Figure 5-11a, and the AERs
were calculated over this time period using modified ASTM methods. The modified
ASTM method is described in Appendix C. The AER averaged about 61 to 63/day
(Figure 5-11(b)), about 15 percent higher than the LS-1 result (50.3/day) obtained
using the He data. The lowest AER shown in the figure is about 20/day, and occurred
when the vents in the generator room were closed.

Final Report for Air Exchange Rate Analysis and Protocol Development
5-24 Tetra Tech, Inc.
a) SF6 time series (The averaged data are seven-point running averages).
b) AER by forward and central finite difference methods using trapezoid integration method.
Figure 5-11 Predicted AERs and SF6 concentration in Building 1130 at Travis AFB.
The AER analyses using the SUMMA method are shown in Figure 5-12. Both tests
use SF6 as the tracer, with the SUMMA canisters open for different periods of time
(1.75 hours and 4.0 hours). The calculated AERs were 27/day and 31/day. These are
lower than estimates using other methods. Since these methods are integrated over
periods of time, the high and low AERs are averaged out. The other methods used
the field measurements, while the SUMMA canisters were analyzed at the
laboratory.

Final Report for Air Exchange Rate Analysis and Protocol Development
Tetra Tech, Inc. 5-25
Figure 5-12 AERs calculated based on SUMMA data and continuous release of SF6, Building 1130, Travis AFB. Two SUMMA tests were performed. The first test began 30 minutes after the He release and lasted 1.75 hours. The second SUMMA test also began 30 minutes after the He release and lasted four hours.
5.3.3 Comparison of Results
A summary of the results is shown in Table 5-10 and in Figure 5-13.
The AERs for Building 1130 at Travis AFB were the highest encountered at any of
the buildings investigated. Using lab data the LS results ranged from 47.1/day to
86.7/day. Using field data the results were lower: 36.6/day to 50.8/day. The lower
AER calculated using the field data versus the laboratory data was observed at all
three buildings, and is suspected to be related to loss of He from the Tedlar bags
from time of collection to time of analysis at the laboratory.
Several SF6 tests were completed, and average AER values were within range of the
LS results. Also two SUMMA tests were completed, with AERs of 27/day to 40/day.
While the predicted AERs exhibited more variability than the results from Facility
1381 and Building 1416, values still agreed by a factor of two.
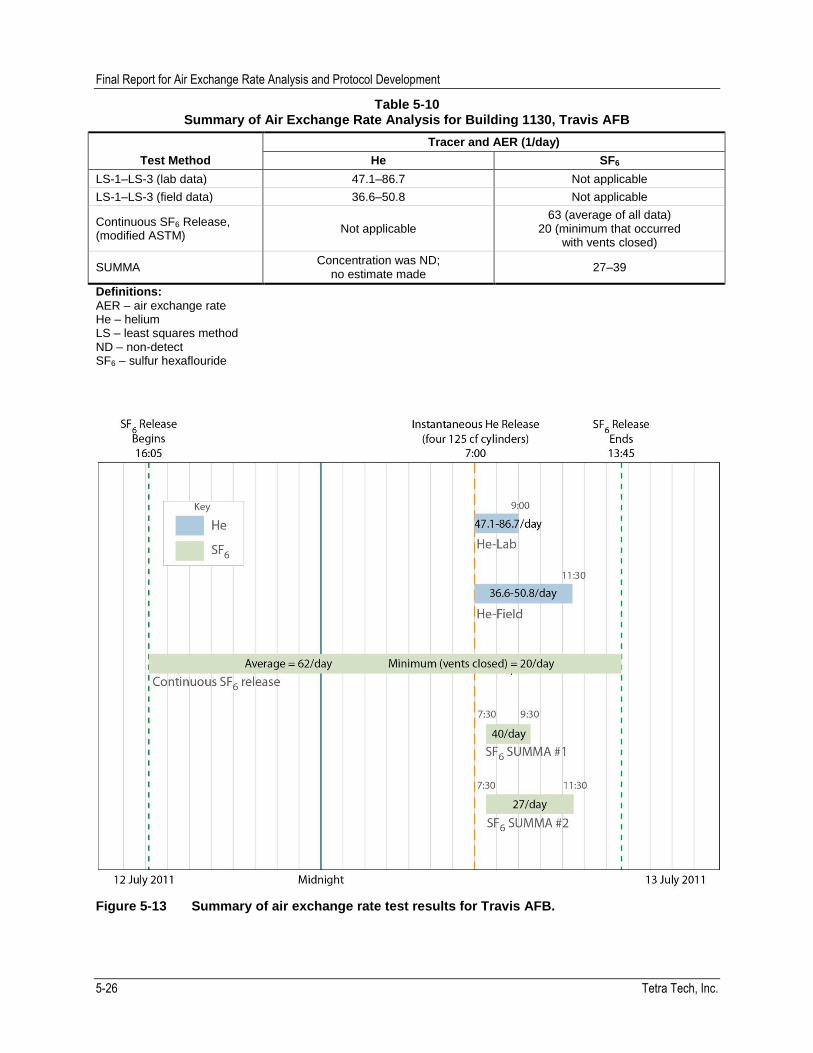
Final Report for Air Exchange Rate Analysis and Protocol Development
5-26 Tetra Tech, Inc.
Table 5-10 Summary of Air Exchange Rate Analysis for Building 1130, Travis AFB
Test Method
Tracer and AER (1/day)
He SF6
LS-1–LS-3 (lab data) 47.1–86.7 Not applicable
LS-1–LS-3 (field data) 36.6–50.8 Not applicable
Continuous SF6 Release, (modified ASTM)
Not applicable 63 (average of all data)
20 (minimum that occurred with vents closed)
SUMMA Concentration was ND;
no estimate made 27–39
Definitions:
AER – air exchange rate He – helium LS – least squares method ND – non-detect SF6 – sulfur hexaflouride
Figure 5-13 Summary of air exchange rate test results for Travis AFB.

Tetra Tech, Inc. 6-1
6 DISCUSSION AND CONCLUSIONS
6.1 Cape Canaveral Air Force Station
From the comparative AER tests completed at CCAFS, the following conclusions
can be reached regarding the two types of tests (He and SF6):
The tests generate comparable results.
Less field equipment is needed for the He tests, reducing costs and reducing
the possibility of equipment failure.
The weight of the He released can be accurately estimated, and this is a useful
feature of the He tests. This information is directly used in the AER tests to
eliminate a source of uncertainty.
It is straightforward to implement an uncertainty analysis of results for the He
methods, so that confidence intervals of results can be estimated. For the SF6
methods, such an analysis is more difficult to implement, and was not
attempted during this work.
Safety issues are of less concern for He. SF6 concentration limits to protect
human health exist, although it is likely not to be an issue for well-designed
tests.
SF6 is a greenhouse gas with a high global warming potential, and is being
phased out as a tracer gas.
These conclusions tend to favor the use of He tests over SF6 tests. However, SF6
continuous release tests may be superior to the He instantaneous tests in the duration
of the tests. Typically He tests last only a fraction of the day, while SF6 tests can
continue for a day or more. It may be desirable for the He test to last longer in order
to get a more accurate estimate of daily AER.
6.2 Former Kelly Air Force Base
The major conclusion from the field investigations at former Kelly AFB are:
Qualitatively, the results of the tests were generally self-consistent.
As at CCAFS, the AERs calculated from the SF6 and He release methods were
similar.
All of the data analysis methods were successfully completed indicating that
the methods and data input are robust.
Final Report for Air Exchange Rate Analysis and Protocol Development
6-2 Tetra Tech, Inc.
6.3 Travis Air Force Base
The AERs for Building 1130 at Travis AFB were the highest encountered at any of
the buildings investigated. Using lab data the LS results ranged from 47.1/day to
86.7/day. Using field data the results were less: 36.6/day to 50.8/day. The difference
in results based on field data vs. lab data appears to be related to loss of He from the
sample containers during transport to the laboratory.
Several SF6 tests were completed and average AER values were within the range of
LS results obtained from the He tests. Also, two SUMMA tests were completed,
calculated AERs ranged from 27/day to 39/day. While the calculated AERs exhibited
more variability than for previous sites, the values generally agreed by a factor of
two.
Overall, the results from Travis AFB are consistent with results from CCAFS and
Former Kelly AFB, and indicate that the instantaneous He release method yields
similar results to the ASTM method.
6.4 Issues and their Resolutions
All AER methods that were developed were tested to ensure their validity. All
methods successfully completed the performance tests. The three least squares
methods were the primary methods developed for use in the protocol (Appendix A).
In totality the following methods were developed:
LS-1 with specified initial concentration (least squares method #1);
LS-2 with initial concentration not used (least squares method #2);
LS-3 with unknown initial concentration (least squares method #3);
Modified ASTM method;
Use of SUMMA canister to estimate time-integrated value of AER; and
A Monte Carlo Method to capture uncertainties in LS estimates.
As stated previously, only the three LS methods are used in the protocol developed
in Appendix A. The remaining methods were used to cross-check with the three LS
methods. The LS methods were successfully compared against the the other
methods. Results were generally within 20%, although for Building 1130 on Travis
AFB, results differed by up to a factor of 2.
Methods LS-1 through LS-3 provide three similar approaches to calculating an AER
based on He tracer gas concentration decay data. The primary difference between the
methods is that LS-1 requires knowledge of the initial helium concentration (C0),
while LS-2 and LS-3 do not; however, C0 is easily obtained from vendor provided
information or by weighing the cylinders before and after release of the helium.
Therefore, none of the three LS methods are considered superior to the others, rather,
they provide three approaches to calculating an AER from the decay in
instantatenously released tracer gas concentrations. It is recommended that when
Final Report for Air Exchange Rate Analysis and Protocol Development
Tetra Tech, Inc. 6-3
estimating a building AER using the He concentration decay methodology, all three
LS methods be applied to the data to provide a range of reasonable AER values.
Use of a single, time-integrated He sample concentration collected in a SUMMA
canister may offer some advantages in terms of simplicity; however, this approach
has not been fully developed and tested.
6.4.1 Use of MGD-2002 Field Helium Detector
One of the objectives of the study was to evaluate whether AERs could be calculated
simply by making direct measurements of He concentrations in the building air using
the MGD-2002 helium detector, without the interim step of collecting samples in
Tedlar bags. In principle, it should be possible to directly measure He concentrations
by analyzing the building air with a field meter and appling the LS methods to the
concentration data. However, it was determined during this study that the MGD-
2002 does not function correctly if the ambient He concentrations are similar to the
concentrations one is trying to measure (which is necessarily the case when
measuring tracer gas concentrations inside a building). The ambient concentrations
apparently interfere with the internal sensor and result in erroneous measurements.
Tetra Tech unsuccessfully attempted to identify an alternative direct reading field
instrument.
The MGD-2002 can be readily used to measure He concentrations in the field;
however, it is necessary to collect samples of indoor air in Tedlar bags (or other
sample container) and then take the sample to a location with low ambient He
concentrations (e.g., outside the test building) to measure the concentration using the
MGD-2002.
6.4.2 Loss of Helium From Tedlar Bags
As discussed in Sections 4.3 and 6.3, a loss of He from Tedlar sample bags was
observed from time of collection to time of analysis at the off-site laboratory, which
introduces some error into the calculated AERs. This error could be mitigated by
using different sample containers, such as SUMMA canisters or metalized laminate
bags; however, these containers are more costly than Tedlar bags, and the AERs
calculated using He data from Tedlar bags analyzed at the off-site laboratory
compared well with the other methods. Therefore, it appears to be a nominal effect
and is likely less important than other sources of error, such as imprecision in
building volume measurements or vendor reported He volumes.
6.4.3 Helium Shortage and Cost
It has been widely reported that He supplies are being depleted and that it may
become more expensive and less readily available in the future. Thus, use of He as a
tracer gas may become less desirable. Although no other tracer gases were tested for
this study, in principle, it is possible to implement the AER measurement
methodologies using any tracer gas that meets the following criteria:
Readily available at a cost-effective price;

Final Report for Air Exchange Rate Analysis and Protocol Development
6-4 Tetra Tech, Inc.
Easily measured in the laboratory and/or in the field at parts-per-million
concentrations;
Non-toxic; and
Nonflammable.
In addition, it is preferable that the gas be colorless and odorless to avoid disturbance
to building occupants.
Carbon dioxide (CO2), meets all of the criteria above and may offer a suitable
alternative to He for AER measurement. The disadvantage to using CO2 is that it is
present in ambient air at a concentration of approximatley 390 ppm; therefore, if it is
used as a tracer gas, the measured concentrations would need to be adjusted to
account for the ambient concentration, although this should be simple. However,
CO2 may offer an advantage over He. Experiments conducted at Travis AFB in 2009
indicate that He released into a building becomes well mixed with the building air
within the first 2 hours after release; however, there is some vertical stratification of
the He (higher concentrations near the ceiling) immediately after release (Tetra Tech
2009c). While He is much lighter than air, CO2 has a similar density to air and
therefore may mix more quickly with the building air.
6.5 Cost Comparison
The results of this study have demonstrated that the instantaneous He release method
yields similar estimates of AER as the modified ASTM method. The He
methodology developed during this study provides two primary advantages over the
ASTM method using SF6. First, SF6 is a powerful greenhouse gas that is being
phased out and will become increasingly difficult to obtain for AER measurement
applications, while He is readily available. Second, the He methodology is simpler
and less costly to implement.
There are a variety of options for implementing both methods that will impact the
total cost; for example, field analysis only, laboratory analysis only, or field and
laboratory analysis. Due to the wide range in AERs at different buildings, it is
advisable to use field meters when conducting either test so that the approach (e.g.
number of samples collected or SF6 flow rate) can be adjusted in response to site
specific conditions. Therefore, for cost comparison purposes, two scenarios are
compared below: (1) implementing the methods using both field and laboratory
analysis (Table 6-1) and (2) using field measurements only (Table 6-2). For both
scenarios, unit costs and labor rates are estimates based on experience implementing
the methods during this study. Actual costs will vary based on location and other
factors. During this study, multiple SF6 samples were collected at each site;
however, in practice, only one is required to calculate an AER. Therefore, for the
first cost comparison scenario (Table 6-1), it is assumed that only one, time-
integrated sample would be collected for SF6 analysis.
It can been seen from Tables 6-1 and 6-2 that the cost of the He methodology is
significantly lower for both scenarios. The primary factors driving the higher

Final Report for Air Exchange Rate Analysis and Protocol Development
Tetra Tech, Inc. 6-5
expense of the SF6 method are the cost of the SF6 gas and the regulator and rotameter
required to release it at a known, steady rate, and the cost of the portable SF6
analyzer. It can also be seen that the difference in cost is less for scenario 1 vs.
scenario 2 due to the cost of analyzing multiple samples for He.
Table 6-1 Helium vs. SF6 Method Cost Comparison (Field and Laboratory Analysis)
Item Unit Cost Unit
SF6 Method He Method
Quantity Extended
Cost Quantity Extended
Cost
Labor
Field Technician $75.00 hr 12 $900 8 $600
Equipment/ODCs
SF6 gas cylinder (28-cf) $600.00 ea 1 $600 0 $0
SF6 gas cylinder two-stage regulator $436.00 ea 1 $436 0 $0
Rotameter (flow-meter) $364.00 ea 1 $364 0 $0
He gas cylinder (110-cf) $75.00 ea 0 $0 6 $450
Scale (to weigh He cylinders) $25.00 ea 0 $0 1 $25
Nylon tubing $2.00 ft 200 $400 0 $0
Fittings/ferrules $15.00 ls 1 $15 0 $0
Portable SF6 analyzer (Miran SapphIRe) $212.50 day 3 $638 0 $0
Portable He detector (MGD 2002) $70.81 day 0 $0 2 $142
6-L Summa canister $45.00 ea 1 $45 0 $0
Summa canister flow controller $25.00 ea 1 $25 0 $0
Tedlar bag with syringe/tubing $15.00 ea 0 $0 11 $165
Incidentals* $100.00 ls 1 $100 0 $0
SUBTOTAL $2,623 $782
Subcontractor (Analytical)
SF6 sample analysis $150.00 ea 1 $150 0 $0
He sample analysis $60.00 ea 0 $0 10 $600
SUBTOTAL $150 $600
TOTAL $3,673 $1,982
Definitions:
AER – air exchange rate He – helium SF6 – sulfur hexafluoride ls – lump sum ea – each cf – cubic feet ODC – other direct cost L – liter

Final Report for Air Exchange Rate Analysis and Protocol Development
6-6 Tetra Tech, Inc.
Table 6-2 Helium vs. SF6 Method Cost Comparison (Field Analysis Only)
Item Unit Cost Unit
SF6 Method He Method
Quantity Extended
Cost Quantity Extended
Cost
Labor
Field Technician $75.00 hr 12 $900 8 $600
Equipment/ODCs
SF6 gas cylinder (28-cf) $600.00 ea 1 $600 0 $0
SF6 gas cylinder two-stage regulator $436.00 ea 1 $436 0 $0
Rotameter (flow-meter) $364.00 ea 1 $364 0 $0
He gas cylinder (110-cf) $75.00 ea 0 $0 6 $450
Scale (to weigh He cylinders) $25.00 ea 0 $0 1 $25
Nylon tubing $2.00 ft 200 $400 0 $0
Fittings/ferrules $15.00 ls 1 $15 0 $0
Portable SF6 analyzer (Miran SapphIRe) $212.50 day 3 $638 0 $0
Portable He detector (MGD 2002) $70.81 day 0 $0 2 $142
Tedlar bag with syringe/tubing $15.00 ea 0 $0 1 $15
Incidentals $100.00 ls 1 $100 0 $0
SUBTOTAL $2,623 $782
TOTAL $3,453 $1,232
Definitions:
AER – air exchange rate He – helium SF6 – sulfur hexafluoride ls – lump sum ea – each cf – cubic feet ODC – other direct cost L – liter
6.6 Overall Conclusions
The primary objective of this project was to develop cost-effective, simple methods
for determining AERs. Simplified methods to determine AERs were developed from
a combination of field investigations and least-squares algorithms.
The AERs calculated for the three test buildings (Facility 1381, Building 1416, and
Building 1130) using instantaneous He release and the LS methods compared well
with the AERs calculated using the modified ASTM method with SF6 tracer gas. The
resuls of this study demonstrate that the He release methodology provides a cost-
effective, easy to implement method of measuring building specific AERs.
The three LS methods help to determine the uncertainty in AER predictions. While a
Monte Carlo method was developed for test analysis, it is not included in the
protocol (Appendix A).

Final Report for Air Exchange Rate Analysis and Protocol Development
Tetra Tech, Inc. 6-7
6.7 Further Method Development/Validation
A number of ideas have evolved from the project that could further generalize the
protocol. They include:
Development of software to implement the air exchange methods. The
software would include methods to set up the field tests as well (such as
estimating the He release needed).
Further testing and implementation of the SUMMA techniques for both
continuous and instantaneous releases. These techniques may be the simplest
and least expensive of all the techniques developed in the report. However,
further testing of the technique is needed.
Inclusion of the modified ASTM method developed for this project. The
method can calculate AERs over short periods of time, and then can be
averaged over any time period desired, within the limits of the test duration.
Development of a cost framework for the alternative methods presented so
that comparative costs can be estimated prior to method implementation.
The methods implemented here are for buildings typically less than 30,000 ft3.
It may be worthwhile to expand the scope to larger buildings. New algorithms
may need to be developed for larger buildings, or the existing algorithm
modified.
Development of a method to calculate air exchange within office buildings
inside aircraft hangers, or adaptation of the present method to those
conditions.
Application of computation fluid dynamics codes to better characterize air
exchange in complex buildings, and to investigate how AER predictions
compare against buildings such as those examined during this project.

Final Report for Air Exchange Rate Analysis and Protocol Development
6-8 Tetra Tech, Inc.
This page intentionally left blank.

Tetra Tech, Inc. 7-1
7 REFERENCES
CH2M Hill. (2007) Draft Groundwater Sampling and Analysis Program 2006–2007
Annual Report.
Johnson, P.C., and R.A. Ettinger. (1991) Heuristic model for predicting the intrusion
rate of contaminant vapors into buildings. Environmental Science & Technology Vol.
25, p 1445–1452.
Mills, William B., S. Liu, M.C. Rigby, and D. Brenner. (2007) Time-Variable
Simulation of Soil Vapor Intrusion into a Building with a Combined Crawl Space
and Basement. Environmental Science & Technology Vol. 41, No. 14., p 4993–5001
Tetra Tech, Inc. (2007) Corrective Measures Implementation Report, Volume I,
Revision 0 – Ordnance Support Facility (Facility 1381), Solid Waste Management
Unit C021, Cape Canaveral Air Force Station, FL.
Tetra Tech, Inc. (2009a) Investigation and Validation of Multiple Lines of Evidence
to Assess Vapor Intrusion at Cape Canaveral Air Force Station, FL for US Air Force
School of Aerospace Medicine (USAFSAM/OE) at Brooks City-Base, TX.
Tetra Tech, Inc. (2009b) Investigation and Validation of Multiple Lines of Evidence
to Assess Vapor Intrusion at Kelly Air Force Base, TX for US Air Force School of
Aerospace Medicine (USAFSAM/OE) at Brooks City-Base, TX.
Tetra Tech, Inc. (2009c) Investigation and Validation of Multiple Lines of Evidence
to Assess Vapor Intrusion at Travis Air Force Base, CA for US Air Force School of
Aerospace Medicine (USAFSAM/OE) at Brooks City-Base, TX.
Tetra Tech, Inc. (2009d) Investigation and Validation of Multiple Lines of Evidence
to Assess Vapor Intrusion at Vandenberg Air Force Base, CA for US Air Force
School of Aerospace Medicine (USAFSAM/OE) at Brooks City-Base, TX.

Final Report for Air Exchange Rate Analysis and Protocol Development
7-2 Tetra Tech, Inc.
This page intentionally left blank.

Tetra Tech, Inc. A-1
APPENDIX A PROTOCOL FOR ESTIMATING AIR EXCHANGE RATE
USING CONCENTRATION DECAY OF INSTANTANEOUSLY
RELEASED HELIUM TRACER GAS
A.1 Scope and Limitations This protocol covers the methodology used for estimating the air exchange rate (AER) of a building, or portion (zone) of a building, by evaluating the concentration decay rate of instantaneously released helium (He) tracer gas. Three mathematical methods to estimate AERs from field-collected data are developed from basic principles in Appendix B. The major assumption that guides these methods is that the He tracer gas is released instantaneously such that it becomes well-mixed in the building before sampling begins (typically 15 to 30 minutes after release). In addition, for Method #1, the value of Co (initial well-mixed concentration) is assumed to be accurately calculated from the initial mass of He released and the estimated volume of the building or building zone. The air exchange rate is calculated by a least-square method that minimizes the root mean square error, and in that sense the method produces a ‘best’ result.
The results from this protocol pertain only to those conditions of weather and building operation (e.g., heating, ventilation, and air conditioning [HVAC] system status) that prevail during the measurements. It is assumed that the He concentration within the test building can be characterized by a single value throughout the building. This test method has been evaluated and validated against an established method described in American Society for Testing and Materials (ASTM) Method E741-00 modified for this project. The method was validated using test buildings with volumes up to approximately 30,000 cubic-feet (cf).
As mentioned above, this methodology may be applied to individual portions or zones of a building, but in these applications, it is important to carefully isolate the zone volume being tested.
A.2 Glossary of Terms The following terminology is used in the sections that describe the air exchange rate equations.
AER = air exchange rate (exchanges per minute or per day)

Final Report for Air Exchange Rate Analysis and Protocol Development
A-2 Tetra Tech, Inc.
Ca, air = moles of air per cubic meter of AER (41.4)
CHe(0), C0 = well-mixed He concentration immediately following release of He gas
CHe(ti) = concentration of He inside the building at time ti after an initial release of He (percent by volume)
ln = natural log
N, NP = number of measurements
Σ = sum of mathematical terms
t = time measured starting from He release (minutes)
ti, = time of ith measurement of He (minutes)
A.3 Field Methodology This test method uses measurements of the decay in concentration of He that is instantaneously released as a tracer gas inside a building. The concentration measurements, which can be obtained on-site using a hand-held helium detector or by laboratory analysis of air samples, are used in calculations to estimate the air exchange rate (AER) of the building. Although three mathematical methods are presented to calculate the AER, both rely on a single field implementation method for gathering the necessary data.
A.3.1 Initial Preparations and Setup of Test
A.3.1.1 Determine Building Volume Once the test building has been selected, the building (or zone) volume must be estimated. The volume can best be estimated by direct measurement of length, width, and height of each room. The room volumes are then added together to attain the total test building/zone volume. For complex or large buildings, see ASTM Method 741-00 for alternative methods of estimating building volumes.
A.3.1.2 Procedure, Required Equipment and Supplies The required equipment and supplies are discussed below and summarized in Table A-1. The following equipment and materials are required to properly conduct the test: (1) appropriate number of helium cylinders or containers; (2) air sample containers and a means to collect samples of indoor air. Tedlar® bags are acceptable for this application, although samples should be analyzed as soon as possible after collection as He will diffuse out of the bag. Aluminized polyethylene sample bags are largely impermeable to He and are therefore technically superior but relatively expensive compared to Tedlar® bags. Collection of air samples into the bags is easily accomplished using an appropriate sized (50 to 100 milliliter [ml]) disposable

Final Report for Air Exchange Rate Analysis and Protocol Development
Tetra Tech, Inc. A-3
syringe equipped with a three-way Luer valve and Tygon® tubing connecting the valve to the sample bag (Figure A-1).
Helium concentrations can be measured on-site or samples of the building air can be submitted to a laboratory for off-site analysis. Off-site laboratory analysis of air samples offers better quality control and may be more precise; however, on-site measurement eliminates concern regarding loss of He from the sample, and is more cost-effective than off-site analysis. A hand-held helium detector is recommended for on-site analysis. The detection range of the helium detector must include trace to percent by volume levels in order to adequately characterize the concentration decay curve. A Radiodetection MGD-2002 hand-held helium meter works well for this application (Figure A-2), although it must be kept at a location outside the investigated building zone (i.e. outside areas of high He concentration) in order to maintain proper zero calibration as samples are analyzed throughout the experiment.
If Method #1 is to be used to calculate the AER (Section A.4), a scale for weighing He cylinders before and after release of the He is recommended to estimate the mass released into the building, although the mass can also be estimated based on the vendor supplied volume. The scale should be capable of weighing the He cylinders with a precision of ±0.05 pound (lbs) or 1 ounce. A typical 125 cf cylinder weighs 65 to 80 lbs and may contain a pound of He. A number of readily available fishing scales are suitable (Figure A-3). A scale is not needed if only Methods #2 and #3 (Section A.4) are used to calculate the AER; however, it is recommended to calculate the AER using all three methods.
For purposes of this test method, balloon grade He gas (97 percent purity) is considered adequate. The Helium gas should be supplied in easily manageable cylinders, which can be strategically placed throughout the building and opened simultaneously to maximize fast mixing. Typical 110 to 125 cf, commercially available He cylinders are suitable. Generally, it is recommended that a volume of He gas equivalent to at least 1 percent of the total building volume be released, although this number should be increased to up to 5 percent in buildings where the AER is expected to be high. Figure A-5 can be used to estimate an appropriate starting concentration of helium. Building conditions such as air leakage sites, pressure differences induced by wind and temperature, mechanical system operation, and occupant behavior should all be factored into a qualitative estimate of whether a high AER is anticipated, in order to estimate an appropriate amount of helium for release.

Final Report for Air Exchange Rate Analysis and Protocol Development
A-4 Tetra Tech, Inc.
Table A-1 Equipment List
Helium cylinders Air sample containers (e.g. Tedlar bags) Syringe, pump, or other sampling device Tubing, valves, and connectors for sample collection Hand-held helium detector Scale to weigh cylinders Chain-of-Custody forms Ear plugs
A.3.1.3 Set Up Field Test Following selection of the test building, measurement of indoor volume, preliminary estimation of the building’s AER, and acquisition of all requisite equipment and materials, the test can be set up. The building HVAC, doors, windows, etc. should be in the desired settings/position before initiating the test. The He cylinders should be weighed and the initial weights documented. Care should be taken when maneuvering and weighing the cylinders to avoid injuries from lifting or accidentally dropping them. The He cylinders should be strategically placed throughout the building to maximize quick homogenization of the released He into the indoor building volume. The He detector must be properly zeroed in accordance with the manufacturer’s guidance and should remain outside the test building in order to retain proper zero calibration throughout the test. Finally, the sampling apparatus (e.g., sample bag, syringe, 3-way valve, and tubing) should be assembled and set aside for immediate use following release of the He into the building.
If the building is occupied, it will be necessary to brief the occupants on the testing. Typically, occupants will want to know what and why the tests are being conducted, and whether breathing the helium is dangerous. Helium is non-toxic, and the only danger from the gas would be displacement of air; however, this is not a concern at the concentrations expected using this protocol (less than 5 percent). Occupants should be provided with hearing protection (ear plugs) or asked to leave the building during the helium release due to the loud noise.
A.3.2 Conducting the Test
A.3.2.1 Release Helium and Collect Samples Once preparations are complete, the He cylinders are opened simultaneously; a 125 cf cylinder can be expected to completely empty in approximately 30 to 60 seconds. It is important to wear hearing protection during the time of release as the escaping gas is very loud. The time of release is noted and samples are collected at 15, 30, 60, 90, 120 minutes after release, and then every two hours thereafter, or until He concentrations decrease to levels below approximately 5 percent of the initial concentration reading taken at 15 minutes.

Final Report for Air Exchange Rate Analysis and Protocol Development
Tetra Tech, Inc. A-5
Samples are collected by integrating sample aliquots from each room throughout the building into a single sample bag (it is not necessary to sample small rooms such as closets or restrooms) (Figure A-4). The aliquot volume should be proportional to the volume of the room from which the sample is collected, with the objective of obtaining a sample that is representative of the average He concentration in the building or building zone at the sample time (Table A-2). For larger rooms, multiple sample aliquots can be collected from different locations in the room in order to better integrate He concentrations throughout the room. Care should be taken to ensure consistent sampling such that the aliquots are collected from the same location in a room each time, and that the same sample aliquot volumes and total sample volumes are collected each time. Additional sample times can be added if it becomes apparent that the decay of He inside the building is occurring at a faster rate than anticipated.
Table A-2 Example Sample Aliquot Distribution
Room Length
(in) Width
(in) Height
(in) Volume
(cf)
Percent Building Volume
Indoor Air Sample Aliquot
(ml)
Percent Sample Volume
Room 1 296 233 144 5,747 21% 150 21% Room 2 233 183 144 3,553 13% 100 14% Bathroom 66 53 118 239 1% NA NA Room 3 159 125 140 1,610 6% 50 7% Room 4 575 242 144 11,596 42% 300 41% Room 5 215 189 128 3,010 11% 75 10% Room 6 226 121 119 1,883 7% 50 7% Total Volume 27,638 100% 725 100% Definitions: cf – cubic feet in – inches ml – milliliters NA – Not applicable, no air samples collected from the bathroom or HVAC room
A.3.2.2 Analyze/Submit Samples and Document Data Collection If measuring He concentrations on-site, each sample should be taken outside the test area immediately after collection and the He concentration measured using the hand-held detector. Each result is documented and a decay curve can then be plotted in real-time, on-site, as the experiment progresses, allowing for adjustments to the sampling schedule, if warranted. If the samples are to be sent to an off-site laboratory for analysis, the containers should be labeled and an identification number assigned to the samples that allow the results to be associated with the collection time, location, etc.
Samples to be analyzed on-site can be collected in the same sample bag as long as the bag is completely evacuated between samples. If samples are to be analyzed off-site, each sample must be collected in a separate sample bag, labeled, and recorded on a chain-of-custody form and shipped to the laboratory. Tedlar sample bags filled

Final Report for Air Exchange Rate Analysis and Protocol Development
A-6 Tetra Tech, Inc.
to approximately two thirds or less of their total capacity can be air-shipped without bursting, although loss of He may occur during transport. The recommended analytical method is ASTM D-1946.
Meteorological data for the test area can be obtained from on-line sources or local weather stations, or a barometer, thermometer, etc. can be used on site to document these conditions as part of the data set. If any of these meteorological conditions or other building conditions such as mechanical system operation or occupant behavior change in the future, the AER may change as well. Because the AER calculated from this test method integrates the conditions throughout the sampling period, it is important to note whether building conditions change during the test (e.g., HVAC system turning on/off, opening/closing of windows, etc.). If multiple air exchange rate tests are performed, it is preferable that these conditions remain constant during each test, and only change between tests.
A.4 Calculation of Air Exchange Rate Three mathematical methods for calculating the AER based on the data collected as described above are presented here. The background theory and derivation of each of the three equations are presented in Appendix B. The equations and example solutions are presented below. As can be seen from the examples, the AER calculated using each method varies slightly. Therefore, it is recommended to calculate the AER using all three methods to obtain a range of estimated AERs.
A.4.1 Example Data Solutions to each of the equations are provided using the example data in Table A-3 below.
Table A-3 t, min CHe
15 0.8 30 0.7 60 0.62 90 0.41
120 0.34 180 0.2 240 0.15 360 0.076 480 0.055
Definitions: t – time in minutes from release of helium CHe – concentration of helium in percent (%)
A.4.1.1 Additional Initial Data for Method 1 Volume of the building: 783 cubic meters (m3)
Mass of He Released: 1,800 grams (g)

Final Report for Air Exchange Rate Analysis and Protocol Development
Tetra Tech, Inc. A-7
Molecular weight of He: 4 grams per mole (g/mole)
Ca, air: 41.40 mole/m3
( ) 2He 10airCa,building theof Volume/
He ofweight MolecularReleased He Mass(0)C ×⋅
= (1)
CHe(0) = Initial He concentration at time t0 = 1.3882 %
A.4.2 Method 1 First, the data presented in Table A-4 are calculated from the Table A-3 data by using the equation
=
(0)C)(tCln)A(t
He
iHei (2)
where
)A(ti = combination of mathematical terms given on right hand side of Equation (2)
Table A-4 t A(ti)
15 -0.55 30 -0.686 60 -0.807 90 -1.22
120 -1.408 180 -1.939 240 -2.226 360 -2.906 480 -3.23
Definitions: t – time in minutes from release of helium
The AER is then calculated using the equation:
∑
∑
=
=
⋅−= NP
1i
2i
NP
1iii
t
t)A(tAER (3)
AER (minutes-1) = 0.00803
AER (day-1) = 11.575

Final Report for Air Exchange Rate Analysis and Protocol Development
A-8 Tetra Tech, Inc.
The conversion factor from minutes to days is 1,440 minutes/day.
A.4.3 Method 2 For Method 2, the following equation is applied to the data presented in Table A-3:
∑
∑
=
=
−
−
−= NP
2i
21i
NP
2i1i
1He
iHe
)t(t
)t(t)(tC)(tCln
AER (4)
AER (minutes-1) = 0.00651
AER (day-1) = 9.386
A.4.4 Method 3 For Method 3, the following equation is applied to the data presentwd in Table A-3:
2i
2i
iiii
ΝΣt)t(ΣtΝΣy)t)(Σy(ΣAER
−−
−= (5)
where
iy = ln CHe(ti)
N = number of measurements
AER (minutes-1) = 0.00603
AER (day-1) = 8.6802
A.5 Procedure to Estimate Air Exchange Rate Test Duration The labeled curves in Figure A-5 represent the time in hours from helium release until concentrations are below a reporting level of 0.05 percent for different AERs. Estimate the expected AER based on observed building conditions. Choose the desired test duration from the curves (3 to 8 hours recommended) then determine the recommended C0 from the horizontal axis. The appropriate number of He cylinders can be determined based on the building volume and the volume of each cylinder.

Final Report for Air Exchange Rate Analysis and Protocol Development
Tetra Tech, Inc. A-9
Figure A-1 Tedlar bag, syringe, and 3-way Luer valve assembly.
Figure A-2 Radiodetection MGD-2002 hand-held helium meter connected to Tedlar® sample
bag.

Final Report for Air Exchange Rate Analysis and Protocol Development
A-10 Tetra Tech, Inc.
Figure A-3 Standard 125-cf He cylinder on fishing scale.
Figure A-4 Sample collection

Final Report for Air Exchange Rate Analysis and Protocol Development
Tetra Tech, Inc. A-11
Figure A-5 Time (hours) to reach reporting level for different combinations of CO and AER.

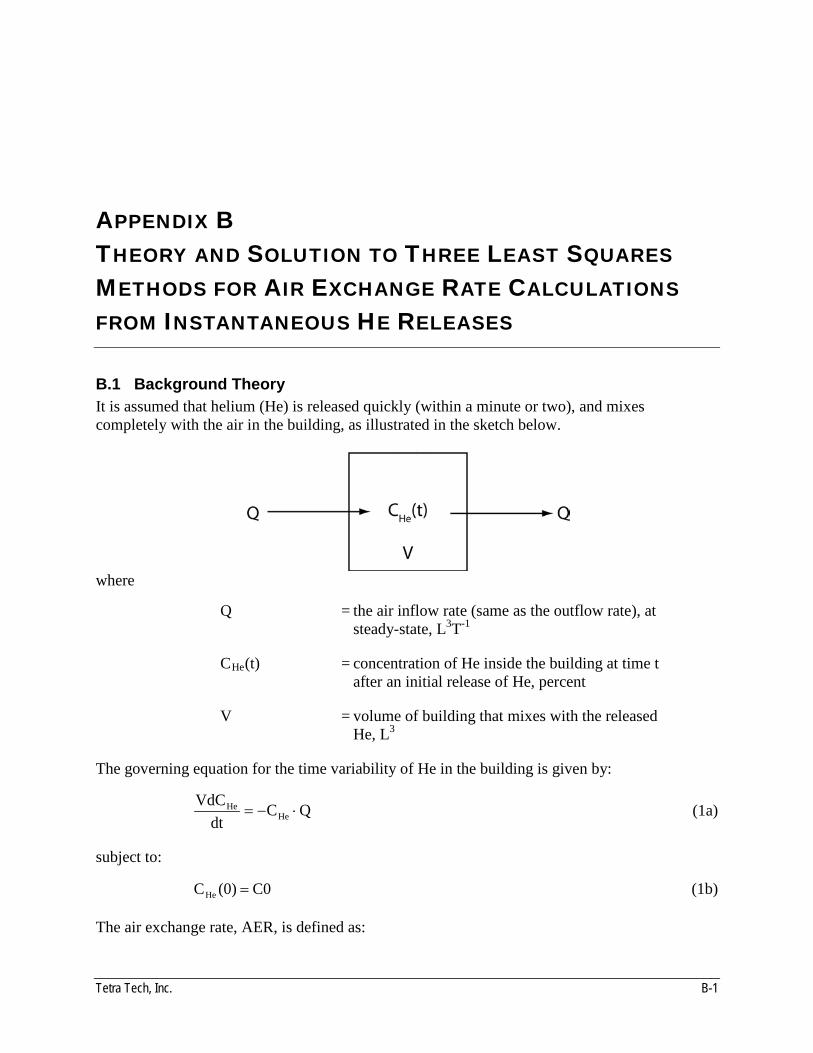
Tetra Tech, Inc. B-1
APPENDIX B THEORY AND SOLUTION TO THREE LEAST SQUARES
METHODS FOR AIR EXCHANGE RATE CALCULATIONS
FROM INSTANTANEOUS HE RELEASES
B.1 Background Theory It is assumed that helium (He) is released quickly (within a minute or two), and mixes completely with the air in the building, as illustrated in the sketch below.
where
Q = the air inflow rate (same as the outflow rate), at steady-state, L3T-1
CHe(t) = concentration of He inside the building at time t after an initial release of He, percent
V = volume of building that mixes with the released He, L3
The governing equation for the time variability of He in the building is given by:
QCdt
VdCHe
He ⋅−= (1a)
subject to:
C0(0)CHe = (1b)
The air exchange rate, AER, is defined as:

Final Report for Air Exchange Rate Analysis and Protocol Development
B-2 Tetra Tech, Inc.
Q/VAER = (1c)
Equation (1a) can be written:
HeHe CAER
dtdC
⋅−= (1d)
The solution to equations (1d) and (1b) is given by:
t)AERexp(C0(t)CHe ⋅−⋅= (2a)
In the section below, three methods are developed to estimate air exchange rate. All three methods start with the same approach and assumptions described in this section. Method 1 (Section B.2.1) requires knowing or calculating CO and is scaled using least-squares, as are the other methods. The other two methods (Section B.2.2 and Section B.2.3) do not require knowledge of CO. If an accurate estimate of CO can be obtained independently of the modeling framework, then Method 1 may produce the most accurate estimates. In Method 2, CO is eliminated from consideration in the mathematical equation and that can be an advantage if CO is not known with certainty. For the third method CO is calculated as part of the mathematical algorithm. Generally all three methods produce results that are similar to each other. The three methods, then, provide a defensible range of predicted air exchange rates.
B.2 Solutions to Each Least-Squares Technique
B.2.1 Solution for Air Exchange Rate: Method 1 The air exchange rate is found using a least-squares technique. To do this, Equation (2a) is linearized in terms of AER:
=⋅−
C0)(tClntAER iHe
i (3a)
Using least squares, minimize:
∑=
−−=N
1i
2ii )t*AER)A(t(mse (3b)
where
=
C0)(tCln)A(t iHe
i (3c)
)A(ti is a combination of mathematical terms with no specific meaning.
To minimize (3b), set 0*AER
mse=
∂∂ . Without showing steps:
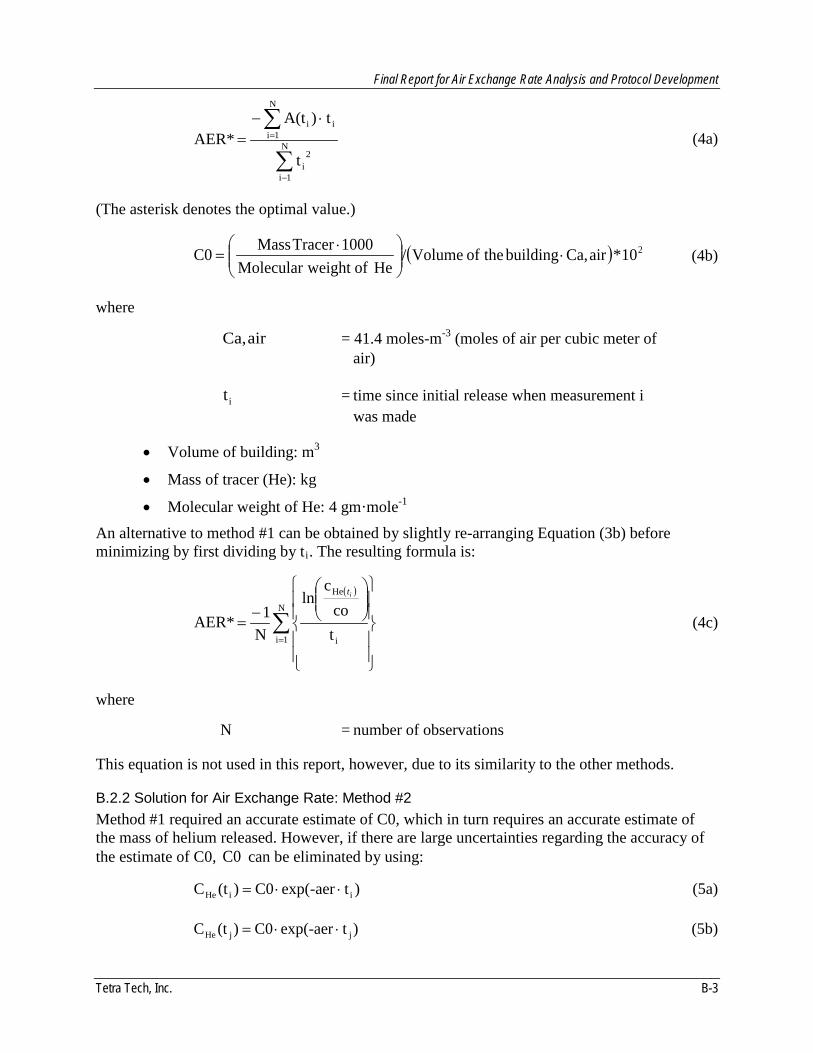
Final Report for Air Exchange Rate Analysis and Protocol Development
Tetra Tech, Inc. B-3
∑
∑
−
=
⋅−= N
1i
2i
N
1iii
t
t)A(tAER* (4a)
(The asterisk denotes the optimal value.)
( ) 210*airCa,buildingtheofVolume/HeofweightMolecular
1000TracerMassC0 ⋅
⋅= (4b)
where
airCa, = 41.4 moles-m-3 (moles of air per cubic meter of air)
it = time since initial release when measurement i was made
• Volume of building: m3
• Mass of tracer (He): kg
• Molecular weight of He: 4 gm·mole-1 An alternative to method #1 can be obtained by slightly re-arranging Equation (3b) before minimizing by first dividing by ti. The resulting formula is:
( )
∑=
−=
N
1i i
He
tco
cln
N1AER*
it
(4c)
where
N = number of observations
This equation is not used in this report, however, due to its similarity to the other methods.
B.2.2 Solution for Air Exchange Rate: Method #2 Method #1 required an accurate estimate of C0, which in turn requires an accurate estimate of the mass of helium released. However, if there are large uncertainties regarding the accuracy of the estimate of C0, C0 can be eliminated by using:
)texp(-aerC0)(tC iiHe ⋅⋅= (5a)
)texp(-aerC0)(tC jjHe ⋅⋅= (5b)

Final Report for Air Exchange Rate Analysis and Protocol Development
B-4 Tetra Tech, Inc.
−=−⋅⇒
)(tC)(tCln)t(tAER
jHe
iHeji
Using least-squares the estimate for AER becomes:
∑
∑
=
=
−
−
−= N
2i
21i
N
2i1i
1He
iHe
)t(t
)t(t)(tC)(tCln
AER (6a)
Note that t1 could be replaced by t2 (or t3,--) to obtain alternative estimates of AERs.
The estimate of C0 can now be made from Equation (5a) or Equation (5b) by finding C0 for each ti, and averaging results:
( )
( )∑= ⋅−
=N
1i i
He
tAERexpC
N1C0 it (6b)
B.2.3 Solution for Air Exchange Rate: Method #3 Start with taking the natural logarithm of (2a):
ln CHe(t) − ln CO = −AER ∙ t (7a)
From this, develop a statistical model with an error term:
iii εtβαy +⋅=− (7b)
where
iy = ln CHe(ti)
α = ln C0
β = -AER
iε = error term
The sum of squares of the errors is:
∑∑==
−−=N
i
N
i 1
2i
**i
1
2i )tβα(yε
To minimize the sum of squares of errors invoke the following:

Final Report for Air Exchange Rate Analysis and Protocol Development
Tetra Tech, Inc. B-5
0αε *
2i =
∂
∂∑ (8a)
0βε *
2i =
∂
∂∑ (8b)
On solving these two equations, the optimal estimates for air exchange rate ( *β− ) and for ln C0 (α *) become:
*2
i2
i
iiii* βΝΣt)t(Σ
tΝΣy)t)(Σy(ΣAER −=−−
−= (9a)
and
)tβy(expC0 ** −= (9b)
where
NΣyy i=
(9c)
NΣtt i=
(9d)
N = Number of observations
B.3 Example Applications
B.3.1 Initial Data ti minutes CHe(ti),%
15 0.8 30 0.7 60 0.62 90 0.41
120 0.34 180 0.2 240 0.15 360 0.076 480 0.055
B.3.2 Additional Initial Data for Method 1 Volume of the building: 783 m3
Mass of He Released: 1.8 kg

Final Report for Air Exchange Rate Analysis and Protocol Development
B-6 Tetra Tech, Inc.
Molecular weight of He: 4 gm-mole-1
Ca, air: 41.40 mole-m-3
( ) 210*airCa,building theof Volume/ Heofweight Molecular
1000MassTracerC0 ⋅
⋅=
(9)
C0 = 1.3882 %
B.3.3 Method 1
By using Equation (3c):
=
C0)(tCln)A(t iHe
i
ti, minutes A(ti) 15 -0.55 30 -0.686 60 -0.807 90 -1.22
120 -1.408 180 -1.939 240 -2.226 360 -2.906 480 -3.23
By using Equation (4a): ∑
∑
=
=
⋅−= N
1i
2i
N
1iii
t
t)A(tAER*
AER, minutes-1 = 0.00803
AER, day-1 = 11.575
The conversion factor from minutes to days = 1440.
B.3.4 Method 2
By using Equation (6a): ∑
∑
=
=
−
−
−= N
2i
21i
N
2i1i
1He
iHe
)t(t
)t(t)(tC)(tCln
AER
AER, minutes-1 = 0.00651
AER, day-1 = 9.386
If t2 were used in place of t1 in equation (6a), the AER would be 9.178.

Final Report for Air Exchange Rate Analysis and Protocol Development
Tetra Tech, Inc. B-7
The estimate of C0 is made by equation (6b): ( )∑
=
=
N
iN 1 i
iHe
)t*exp(-AERtC10C
C0, % = 0.8383
B.3.5 Method 3
By using Equation (9a): *2
i2
i
iiii* βΝΣt)t(Σ
tΝΣy)t)(Σy(ΣAER −=−−
−=
AER, minutes-1 = 0.00603
AER, day-1 = 8.6802
and by using Equation (9b): )NΣtA
NΣy(expC0 i*i* ER+=
C0*, % = 0.7559
This prediction of C0* is lower than expected because the measured concentration at 15 minutes is 0.8%. However, because each of the methods used minimizes errors, but does not eliminate them, such small discrepancies are possible.
To facilitate detectable concentrations (C%) being obtained throughout the period of collection, Figure B-1 can provide guidance. The AER range can be estimated prior to the air exchange rate test to help decide how long the test would last with a given initial concentration C0(%). The initial estimate of AER can be from the data generated in this report. Figure B-1 is divided into two panels: (a) which shows AERs as high as 50/day, and panel (b) focuses on AERs less than10/day. For example, consider an estimated AER of 10/day. If we want an AER test that lasts for about 10 hours, set C0=3% (approximately).

Final Report for Air Exchange Rate Analysis and Protocol Development
B-8 Tetra Tech, Inc.
(a)
(b)
Figure B-1 Time (hours) required to reach reporting level for combinations of C0 and AER.

Tetra Tech, Inc. C-1
APPENDIX C MODIFIED ASTM METHODS USED DURING PROJECT TO
COMPARE AGAINST LEAST SQUARES RESULTS
C.1 Modified ASTM Methods Using Finite Differences Finite difference methods were developed to compare against the least-squares methods. The following methods were developed and tested:
• Forward finite difference (FFD) methods for continuous and instantaneous tracer releases
• Central finite difference (CFD) methods for continuous and instantaneous tracer releases
C.2 Solutions to Each Method
C.2.1 Finite Difference Techniques for Instantaneous Releases For instantaneous releases, the two formulations are (derivation not shown):
FFD,ΔC
)C(C)AER(tii
i1ii ⋅
−−= +
(Forward finite difference) (1a)
CFD,)Δ(ΔC)C(C-)AER(ti1-ii
1-i1ii +⋅
−= +
(Central finite difference) (1b)
where )t(tΔ i1ii −= + and )t(tΔ 1-iit-i −=
C.2.2 Continuous Release Formulations For continuous release, the two formulations are:
FFD,CV
FΔC
)C(C)(tAibii
i1ii
⋅+
⋅−
−=
•
+ER (Forward finite difference) (2a)
( ) CFD,CV
FΔΔ
)C(C-)(tAERibi1-i
1-i1ii ⋅
++−
=
•
+
iC � (Central finite difference)
(2b)

Final Report for Air Exchange Rate Analysis and Protocol Development
C-2 Tetra Tech, Inc.
Often the interval Δi between two sampling times is approximately 10 minutes. Because of this short interval, the air exchange rates can exhibit oscillations. To dampen the oscillations and to generate longer-term averages (such as hourly air exchange rates), a moving average air exchange rate can be calculated. A seven-point moving average, with 10 minute sampling intervals, produces one-hour air exchange rates for example.

Tetra Tech, Inc. D-1
APPENDIX D MATLAB CODE
D
Matlab code is provided in this section for each of the three methods of calculating AERs using instantaneous releases of He. Matlab is a commercially available code and was used for the analyses presented in this report. However, Matlab does not have to be used, and a simpler method is provided at the end of Appendix B. To create the Matlab code for one of the three methods, create a Matlab function and input the required data.
D.1 Method LS-1: function[AER_min AER_day Conc C0 ] = LeastSquareMethod1(C0, C, T_minutes)
convertMinDay = 60*24;
dp = length(T_minutes);
[r c] = size(T_minutes);
if (r>1)
T_minutes = T_minutes';
end
[r c] = size(C);
if (c>1)
C = C';
end
SumT = 0;

Final Report for Air Exchange Rate Analysis and Protocol Development
D-2 Tetra Tech, Inc.
SumAT = 0;
A=zeros(1,dp);
for i = 1 :dp
A(i) = log(C (i)/C0);
SumT = SumT + T_minutes (i)^2;
SumAT = SumAT + A(i) * T_minutes (i);
end
AER_min = -SumAT /SumT ;
AER_day = AER_min * convertMinDay;
Conc = C0 * exp(- AER_min * (T_minutes));
D.2 Method LS-2: function[AER_min AER_day Conc C0] = LeastSquareMethod2(C0, C, T_minutes)
convertMinDay = 60*24;
dp = length(T_minutes );
[r c] = size(T_minutes);
if (r>1)
T_minutes = T_minutes';
end
[r c] = size(C);
if (c>1)
C = C';
end
SumT = 0;

Final Report for Air Exchange Rate Analysis and Protocol Development
Tetra Tech, Inc. D-3
SumAT = 0;
for i = 1:dp
delta= T_minutes (i)-T_minutes(1);
SumAT = SumAT + log(C(i)/C(1)) * delta;
SumT = SumT + delta^2;
end
AER_min = -SumAT /SumT ;
AER_day = AER_min * convertMinDay;
Conc = C(1) * exp(- AER_min * T_minutes (2:dp));
Conc = [C(1) Conc];
C0_m2= C'./(exp(- AER_min* T_minutes));
C0 = mean(C0_m2);
D.3 Method LS-3: function[AER_min AER_day Conc C0] = LeastSquareMethod3(C0, C, T_minutes)
convertMinDay = 60*24;
[r c] = size(T_minutes);
if (r>1)
T_minutes = T_minutes';
end
[r c] = size(C);
if (c>1)
C = C';
end
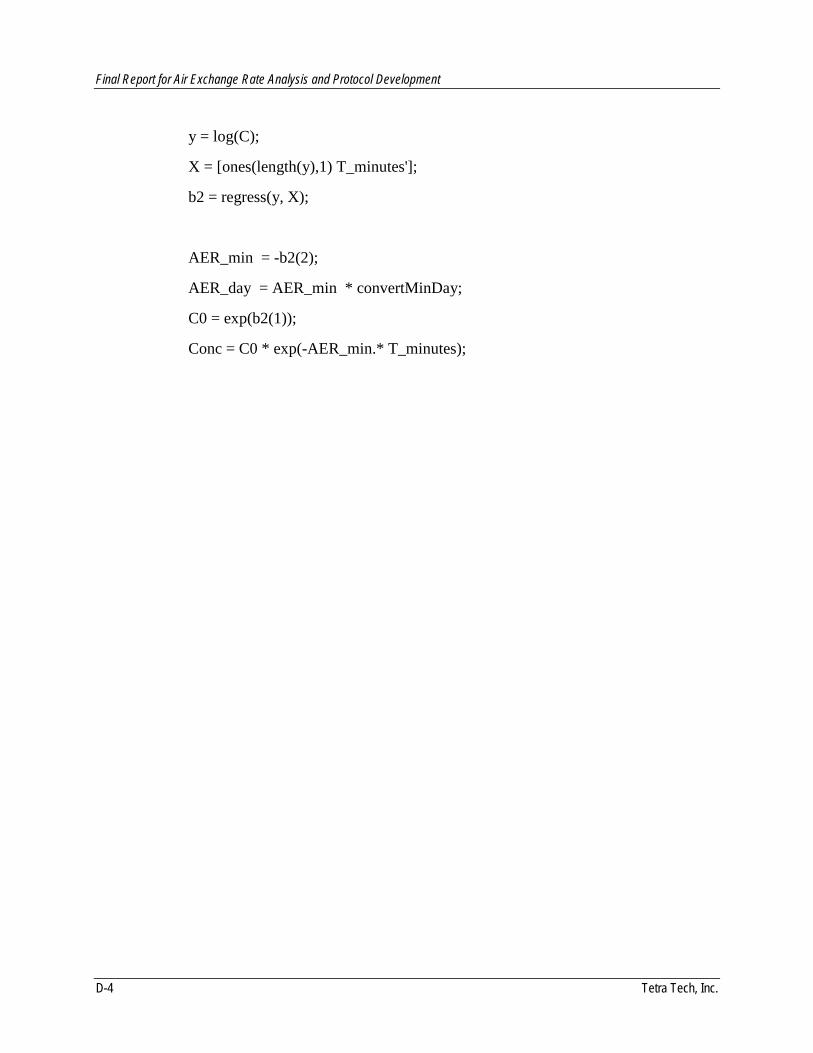
Final Report for Air Exchange Rate Analysis and Protocol Development
D-4 Tetra Tech, Inc.
y = log(C);
X = [ones(length(y),1) T_minutes'];
b2 = regress(y, X);
AER_min = -b2(2);
AER_day = AER_min * convertMinDay;
C0 = exp(b2(1));
Conc = C0 * exp(-AER_min.* T_minutes);


![[MS-IRDA]: IrDA Object Exchange (OBEX) Protocol Profile... · IrDA Object Exchange (OBEX) Protocol Profile ... [MS-IRDA]: IrDA Object Exchange (OBEX) Protocol Profile ... 1 Introduction](https://img.dokumen.tips/doc/110x75/5a7d57c57f8b9a49588d7cc8/ms-irda-irda-object-exchange-obex-protocol-profile-object-exchange-obex-protocol.jpg)