Embed Size (px)
Citation preview

Final Report
Effects of MMT in Gasoline on
Emissions from On-Road Motor Vehicles in Canada
November 11, 2002
For:
Canadian Vehicle Manufacturers’ Association, and
Association of International Automobile Manufacturers of Canada
Air Improvement Resource, Inc.

2
Table of Contents
1.0 Executive Summary...............................................................................................3
2.0 Introduction ...........................................................................................................5
3.0 Background ...........................................................................................................7
4.0 Analysis of Part 1 and Part 2 MMT Data .............................................................10
4.1 Summary of MMT Test Procedures..................................................................10
4.2 Data Analysis ...................................................................................................11
4.3 Results..............................................................................................................13
4.4 MMT Correction Factors..................................................................................14
5.0 Canadian Emission Modeling ..............................................................................18
5.1 MMT Use in Canada ........................................................................................18
5.2 MMT Concentrations .......................................................................................20
5.3 Implications of Canadian MMT Penetration and MMT Concentrations on
Modeling Results .......................................................................................................21
5.4 Mapping of Groups into Vehicle Technologies.................................................23
5.5 Results..............................................................................................................24
5.6 Discussion of Results........................................................................................29
References.....................................................................................................................31
Attachment 1: Group 1-4 Analysis, All Vehicles
Attachment 2: Gasoline Vehicle Emission Inventories For All Cases

3
Effects of MMT in Gasoline on
Emissions from On-Road Motor Vehicles in Canada
1.0 Executive Summary
The gasoline additive methylcyclopentadienyl manganese tricarbonyl, or MMT, is
in widespread use in Canada as an octane enhancer. The manganese (Mn) in MMT forms
manganese oxides during combustion, some of which deposits on the spark plugs,
combustion chamber, and the exhaust system. The remainder of manganese oxides not
deposited in the engine and exhaust system are emitted into the atmosphere. Automakers
have long been concerned that manganese oxides can also have negative impacts on
engines and emission control systems.
The Alliance of Automobile Manufacturers (The Alliance), the Association of
International Automobile Manufacturers (AIAM), and the Canadian Vehicle
Manufacturers Association (CVMA) conducted a multi-year test program to determine
the impacts of MMT on exhaust hydrocarbons (HC), carbon monoxide (CO), and oxides
of nitrogen (NOx) from advanced technology vehicles, notably “Tier 1” vehicles, and
Low Emission Vehicles, or LEVs. This testing program was conducted in two parts. The
first part tested forty Tier 1, transitional low emission vehicles (TLEVs), and low
emission vehicles (LEVs) on both MMT-containing and no-MMT gasoline. The second
part tested sixteen LEVs. The Mn concentration in the test fuel for both testing programs
was 8.3 milligrams per liter manganese, or 0.031grams Mn per U.S. gallon.
The purpose of this modeling study was threefold:
(1) examine the impact of MMT on exhaust HC, CO, and NOx emissions of
different vehicles in the automakers’ test program,
(2) to develop MMT correction factors by vehicle class and technology type that
could be used with standard emission models, and
(3) project HC, CO, and NOx emissions into the future for Canada.
Examination of various sources indicates that MMT use in Canada is around 90%,
so virtually every gasoline vehicle would be expected to contain some MMT. Data from
Environment Canada1 indicate that the average Mn concentration is about 0.022 grams
per U.S. gallon, or a little less than the concentration used in the test program above.
However, maximum Mn levels encountered in Canada are well above the test program
concentration.
Analysis of the data indicates that for Tier 1 vehicles, prolonged fueling with
MMT (through 80,000 km or 50,000 mi) increases hydrocarbon emissions, has little
effect on CO emissions, and reduces NOx emissions. For LEVs, prolonged use of MMT
increases all three emissions – HC, CO, and NOx. The increases in emissions become
more dramatic as vehicles age. The analysis also examined two Low Emission Vehicles
that were very close to EPA’s Tier 2 emission standards. These two vehicles saw very
1 Environment Canada “Additives in Canadian Fuels” March, 2000

4
dramatic increases in HC, CO, and NOx emissions with prolonged use of MMT. The
effects of MMT on both LEVs, and vehicles which are close to the Tier 2 standards raises
serious questions about the continued use of MMT in Canada, since LEVs were
introduced in model year 2000 and Tier 2 vehicles are slated for widespread introduction
into Canada starting with the 2004 model year (October, 2003).
Extensive modeling of fleet emissions for gasoline vehicles in Canada was
conducted for calendar years 1995-2020. The modeling estimated emission differences
between a no-MMT case and two MMT cases. The first case, called the “Base MMT
Case”, assumed that MMT penetration was 100% at 0.031 g Mn/gal, and that the test data
can be used to directly estimate the impacts of MMT in Canada without adjusting for
average manganese concentration differences. The second case, called “MMT
Concentration,” assumed 100% MMT penetration, but MMT effects are adjusted for the
lower average Canadian concentration.
VOC, CO, and NOx emissions inventories were estimated for all gasoline
vehicles except motorcycles for all of Canada, from 1995-2020. Emission inventory
differences between the Base MMT, MMT Concentration, and the no-MMT case were
estimated for calendar years 2010 and 2020, and then the percent differences from the no-
MMT case were estimated (in the no MMT case, MMT was assumed to have been
removed in 1995). The results are shown in Table ES-1 below. The table shows percent
changes for each of the pollutants, and also for VOC + NOx, which are the two primary
pollutants that contribute to ozone formation.
Table ES-1. Percent Changes in Inventories Due to MMT (positive indicates MMT has higher inventory, negative indicates MMT lower)
Year Case VOC + NOx VOC CO NOx
Base MMT 2% 8% 11% -4% 2010
MMT Concentration 1% 6% 8% -3%
Base MMT 46% 36% 75% 65% 2020
MMT Concentration 32% 26% 35% 45%
The table shows that for both the Base MMT and MMT Concentration cases, in
2010 and 2020, VOC + NOx are higher with MMT that without.
For the individual pollutants, VOC and CO are higher with MMT than without,
but NOx is lower in 2010. The NOx effect is primarily due to MMT’s effects on Tier 1
vehicles. This analysis did not examine the effects for pre-Tier 1 vehicles. As low
emission vehicles and Tier 2 vehicles are introduced, however, MMT increases emission
of all three pollutants, regardless of which case is examined.
This analysis indicates that if MMT use is not discontinued before widespread
introduction of NLEVs and Tier 2 vehicles (NLEV introduction started in 2001), VOC,
CO, and NOx emissions from gasoline motor vehicles in Canada in the future may be
significantly higher than those contained in Environment Canada’s (EC) air quality
planning inventories.

5
2.0 Introduction
The gasoline additive methylclopentadienyl manganese tricarbonyl, or MMT, is
in widespread use in Canada as an octane enhancer. The manganese in MMT forms
manganese oxides, sulfides, and phosphates during combustion, some of which deposit
on the spark plugs, combustion chamber, and the exhaust system. The remainder of
manganese compounds not deposited in engine and exhaust system are emitted into the
atmosphere. Automakers have long been concerned that manganese compounds can also
have negative impacts on engines and emission control systems.
The Alliance of Automobile Manufacturers (The Alliance), the Association of
International Automobile Manufacturers (AIAM), and the Canadian Vehicle
Manufacturers (CVMA) conducted a multi-year test program to determine the impacts of
MMT on exhaust hydrocarbons (HC), carbon monoxide (CO), and oxides of nitrogen
(NOx) from advanced technology vehicles, notably “Tier 1” vehicles, and Low Emission
Vehicles, or LEVs. This testing program was conducted in two parts. The first part tested
forty Tier 1, transitional low emission vehicles (TLEVs), and low emission vehicles
(LEVs). The second part tested sixteen LEVs. The test programs are described in two
reports. [1,2] This multi-year testing effort found that MMT increases HC, has little effect
on CO, and slightly reduces NOx emissions from Tier 1 vehicles (through 50,000 miles).
For LEVs, MMT increases HC, CO, and NOx emissions and caused vehicles to exceed
the HC certification standard. The effects of MMT become more dramatic as vehicles
age.
In December of 2001, AIR, Inc. completed the most recent assessment of
emission inventories from on-road vehicles in Canada. [3] This inventory modeling did
not account for the effects of MMT in gasoline because its effects on emissions of
advanced technology vehicles were not fully understood at that time.
The purpose of this study is to:
(1) examine the impact of MMT on exhaust HC, CO, and NOx emissions of different
vehicles in the automakers’ test program
(2) develop MMT correction factors by vehicle class and technology type that could be
used with standard emission models, and
(3) project HC, CO, and NOx emissions into the future for Canada, with and without
MMT.
The scope of this study is to estimate the impacts of MMT on exhaust HC, CO,
and NOx emissions from Tier 1 and later gasoline-fueled vehicles. MMT may have
effects on pre-Tier 1 vehicles, and may have many other effects, for example, it is likely
that there will be increased exhaust PM emissions from the combustion of manganese.
Vehicle fuel economy may also be negatively affected, however, the magnitude of the
impact on total Canadian fuel consumption has not been estimated in the study. Finally,
MMT could significantly increase costs for vehicle owners and manufacturers due to its

6
impacts on emission control systems (increase frequency of OBD MIL illumination,
service, etc.). The total cost impact of MMT has not been estimated in this study.
The remainder of this report is divided into 3 sections. Section 3 (Background)
discusses background information on MMT and recent Canadian emission inventory
modeling used as the baseline in this analysis. Section 4 (Analysis of MMT Data)
discusses our analysis of the automakers’ MMT data for the purpose of developing
emission impacts by vehicle class, technology and vehicle age. This analysis parallels the
analysis done by Professor Richard Gunst for both the Part 1 and Part 2 studies, except
that in this case we have chosen different vehicle groupings to match the various
emission standards as they are phased-in for passenger cars, light duty trucks, and heavy-
duty gasoline vehicles. Finally, Section 5 (Canadian Emission Modeling) estimates
MMT’s impact on HC, CO, and NOx inventories from 1995 through 2020.

7
3.0 Background
The gasoline additive methylclopentadienyl manganese tricarbonyl, or MMT, is
in widespread use in Canada to increase gasoline octane and reduce engine knock from
gasoline vehicles. Engine knock, or pre-ignition, is closely related to the octane number
of gasoline. Although there is no national requirement for the concentration of MMT in
Canada the industry practice limit is set by the Canadian General Standards Board for
manganese in gasoline at 18 mg Mn/liter, or 0.068 g Mn/U.S. gal. Almost 90% of
gasoline sold in Canada contains MMT (more detail on MMT penetration and
concentration in Canada is presented in Section 5).
In the U.S., MMT is banned in California and in areas with federal reformulated
gasoline (RFG). In other parts of the U.S., the legal limit for MMT is 1/32 g Mn/U.S.
gallon, or 0.031 g Mn/gal. This is less than one-half of the limit in Canada. Extensive fuel
surveys conducted by the automobile manufacturers indicate MMT is rarely used in the
U.S. Reasons for this may be that various oxygenates and other blending components are
used in the U.S. to improve octane, as alternatives to MMT.
In 2002, the Canadian Vehicle Manufactures Association (CVMA) and the
Association of International Automobile Manufacturers of Canada (AIAMC) sponsored a
comprehensive review of reports related to MMT. [4] The study, entitled “Impacts
Associated With the Use of MMT as an Octane Enhancing Additive in Unleaded
Gasolines – A Critical Review” was conducted by Sierra Research. Sierra reviewed
dozens of studies related to MMT that have been published in the last 20 years. Among
Sierra’s findings are the following:
• Manganese oxides resulting from the combustion of manganese deposit in the engine
combustion chamber, on spark plugs, and in the exhaust system, including catalytic
converters and oxygen sensors
• Deposits on spark plugs and in combustion chambers lead to engine-out HC
increases, and spark plug deposits can lead to spark plug misfire
• Manganese oxide deposits can, under some conditions, result in plugging of catalytic
converters, and in general, higher PM emissions
• Small improvements in catalytic converter efficiency have been reported, which may
be attributable to preferential adsorption of catalyst poisons by the oxides, and
moderate reductions in NOx emissions in two test programs involving late 1980s and
early 1990s vehicles. However, recent findings demonstrate that the slight
improvement in catalytic converter efficiency is overwhelmed by the increases in
engine-out emissions.
The automobile manufacturers have been concerned that while MMT may
improve octane, it causes manganese oxide deposits on spark plugs, intake and exhaust
valves, combustion chambers, exhaust system, oxygen sensors, and catalytic converters.
A buildup of these deposits has been shown to increase hydrocarbon emissions. However,
most of the testing programs conducted to date have been on vehicles designed for the
1980s and early 1990s (i.e., so called Tier 0 vehicles and earlier).

8
Emission standards of new vehicles are changing very rapidly in this time period
and even over the next decade. Tier 1 vehicles were introduced starting in 1994, and
these vehicles were equipped with onboard diagnostics systems which continually test the
emission control system, illuminating a malfunction indicator light, or MIL, when part of
the emission control system could be compromised. Once the MIL is on, the vehicle
owner is expected to seek a repair. Low emission vehicles were broadly introduced in
2001 for passenger cars and light duty trucks up to 6,000 lbs gross vehicle weight. The
LEV HC standards are 70% lower than the Tier 1 standards, and the NOx standards are
50% below the Tier 1 NOx standards. Tier 2 standards were implemented by the EPA
and proposed by Environment Canada for the 2004 and later time period. These standards
further reduce NOx emissions by another (on average) 65%, and extend the applicability
of the standards to all passenger cars, light duty trucks, and medium duty passenger
vehicles up to and in some cases exceeding 8,500 lbs gross vehicle weight. The Tier 2
standards also increase emission control system durability periods (the mileage over
which vehicles must meet their emission standards) from 100,000 miles to 120,000 miles.
Of course, LEVs and Tier 2 vehicles also are equipped with onboard diagnostics, and
these systems become proportionally more stringent with each reduction in the emission
standards.
Due to the rapid introduction of much lower emitting vehicles, and the lack of
robust test data on how these vehicles respond to MMT, the automobile manufacturers
designed and conducted an extensive research program to determine MMT’s long-term
effects on the emissions and emission control systems from Tier 1 vehicles and LEVs.
This testing program was conducted in two parts. In the first part, Tier 1 and transitional
low emission vehicles (TLEVs), and one model of LEV, were tested on Clear (i.e.,
gasoline containing no MMT) and MMT-containing gasoline for at least 50,000 miles. In
the second part, twenty low emission vehicles, or LEVs were tested on Clear and MMT-
containing fuels for 100,000 miles. These testing programs are described in the two
reports referenced earlier [1,2].
Overall, the results from the automakers’ testing program indicate that MMT
increases HC emissions for Tier 1 and LEV vehicles, it lowers NOx for Tier 1 vehicles
(through 50,000 miles), but increases NOx and CO emission for LEVs. Also, MMT’s
effects on emissions become more dramatic with increasing mileage accumulation. Of
course, LEVs are now the current technology and Tier 2 vehicles are the vehicles of the
near future, so any increase in emissions from these vehicles is particularly troubling.
Because of the mixed effects between technologies and the fact that MMT’s effects
increase with vehicle age, it is necessary to perform emission inventory modeling of the
fleet of on-road vehicles over a number of years to determine the overall MMT effects on
the fleet as new vehicles are added and older ones are retired from the fleet.
The most recent work on inventory modeling in Canada was conducted by AIR
and SENES for Environment Canada (EC) in 2001. [3] In this study, AIR used an

9
updated version of the MOBILE5 model to estimate on-road inventories in Canada from
1995 through 2020.2 Four different scenarios were evaluated, as follows:
1. Baseline: included Tier 1 and NLEV standards for light duty, and 1998 NOx
standards for heavy-duty vehicles, and I/M programs in Ontario and Lower Fraser
Valley
2. Scenario 1: Baseline + light duty Tier 2 standards starting in 2004
3. Scenario 2: Scenario 1 + 2004 heavy-duty NOx standards
4. Scenario 3: Scenario 2 + 2007 heavy-duty NOx/PM standards and low sulphur
diesel fuel
This modeling included EC’s estimate of growth in travel and also its low sulphur
gasoline requirements. For heavy-duty vehicles, all scenarios also included the effects of
off-cycle emissions and the heavy-duty consent decrees, minus the engine rebuild
programs. All scenarios showed significant reductions in HC, CO, NOx and PM out into
the future. The modeling did not include any MMT effects for gasoline vehicles.
This MMT study uses the HC, CO, and NOx emissions from gasoline-fueled
vehicles from Scenario 3 above, which is closest to Canada’s proposed path forward, as a
baseline for making MMT adjustments.
2 MOBILE6 became available in January of 2002.

10
4.0 Analysis of Part 1 and Part 2 MMT Data
Extensive statistical analysis was performed on the Part 1 and Part 2 data as a part
of the original study, so that work does not need to be repeated in this study. [1,2]
However, for modeling purposes, estimates of MMT’s impact must be developed for
different vehicle classes and technologies. For example, MMT effects must be developed
for passenger cars, light duty trucks, medium duty passenger vehicles, and heavy-duty
gasoline vehicles. This study will assume that MMT has no effect on emissions from
motorcycles. Also, MMT effects must be evaluated for Tier 1 vehicles, low emission
vehicles or, LEVs, and Tier 2 vehicles, because the effects are likely to be quite different
for the different technologies.
This section is divided into the following subsections:
• Summary of MMT Test Procedures
• Data Analysis
• Results
• MMT Correction Factors
• Mapping of Groups Into Vehicle Class and Standard Level
4.1 Summary of MMT Test Procedures
A brief summary of testing procedures used in the MMT testing is contained in
this section. Readers are referred to the Part 1 and Part 2 reports for more complete
details of the testing.
Vehicles used in the Part 1 and Part 2 testing are shown in Table 1. All vehicles
were new at the start of the test program. Also shown are their model year and numerical
emission standards. Four identical vehicles of each make and model year were used in the
testing. Two of each vehicle accumulated mileage on Clear gasoline, and the other two
accumulated mileage on gasoline containing MMT. The concentration of MMT used in
both phases of testing was 1/32 gram Mn per US gallon, or 0.031 g Mn/gallon.
Prior to being used in the test program, each vehicle was tested on MMT-free
certification fuel to ensure that each vehicle met its respective emission standards. After
this initial testing, Clear vehicles accumulated mileage on conventional commercial fuel
(with seasonal volatility and without oxygenates) with minimum 87 octane, and MMT
vehicles accumulated mileage on the same gasoline with MMT. Mileage accumulation on
the fuels was conducted using a modification of EPA’s proposed Standard Mileage
Accumulation (SMA) testing cycle.
Part 1 vehicles were tested at the following mileage intervals:
• New
• 4,000 miles

11
• 15,000 miles
• 25, 000 miles
• 35,000 miles
• 50,000 miles
• 75,000 miles (LEV model only)
Part 2 vehicles were tested at the same mileages, and two other mileages were
added:
• 75,000 miles
• 100,000 miles
All emission tests at these mileages for all vehicles were conducted with gasoline
meeting California’s Phase 2 specifications. Emission test procedures consisted of the
1975 Federal Test Procedure, including cold start, hot stabilized, and hot start operation,
and, for Part 1 vehicles, the Highway Fuel Economy Test (HFET). A minimum of two
replicate tests were conducted on each vehicle at each mileage interval, and in some
cases, a third test was performed. For both phases of testing, emissions were collected on
an engine-out and tailpipe basis to allow for evaluation of catalyst efficiencies.
Table 1. Vehicles Used in Testing Program
50,000 Mile Emission Standard
(100,000 mile standards in parentheses)
Part Vehicle
Class
Technology Make Model Model Year HC CO NOx
1 PC Tier 1 Toyota Corolla 1996 0.25 (0.31) 3.4 (4.2) 0.4 (0.6)
TLEV Chevrolet Cavalier 1997 0.125 (0.156) 3.4 (4.2) 0.4 (0.6)
TLEV GM Saturn 1997 0.125 (0.156) 3.4 (4.2) 0.4 (0.6)
TLEV DCX Intrepid 1996 0.125 (0.156) 3.4 (4.2) 0.4 (0.6)
TLEV DCX Neon 1996 0.125 (0.156) 3.4 (4.2) 0.4 (0.6)
TLEV Ford Escort 1996 0.125 (0.156) 3.4 (4.2) 0.4 (0.6)
TLEV Ford Crown Vic 1996 0.125 (0.156) 3.4 (4.2) 0.4 (0.6)
LEV Honda Civic 1996 0.075 (0.090) 3.4 (4.2) 0.2 (0.3)
LDT2 Tier 1 Chevrolet S10 Blazer 1996 0.32 (0.400) 4.4 (5.5) 0.7 (0.9)
TLEV DCX Caravan 1996 0.16 (0.200) 4.4 (5.5) 0.7 (0.9)
2 PC LEV VW Beetle 1999 0.075 (0.090) 3.4 (4.2) 0.2 (0.3)
LEV DCX Breeze 1998 0.075 (0.090) 3.4 (4.2) 0.2 (0.3)
LEV Ford Escort 1998 0.075 (0.090) 3.4 (4.2) 0.2 (0.3)
MDV2 LEV Chevrolet Tahoe 1999 0.195 (0.280) 5 (7.3) 0.6 (0.9)
PC = passenger car
4.2 Data Analysis
AIR obtained the raw emission data for all vehicles from the automobile
manufacturers. Prior to analyzing the data, the data were grouped by approximately
similar numerical HC and NOx emission standards, so that the groupings could be used
to represent the various vehicle classes and emission standard levels. AIR developed four
groups, as follows:

12
• Group 1 – The Part 1 Tier 1 S10 Blazer, and the Part 2 LEV Tahoe (2 models)
• Group 2 – The Part 1 TLEVs, the Part 1 Tier 1 Corolla and S10 Blazer, and the Part 2
LEV Tahoe (10 models)
• Group 3 – The Part 1 Honda LEV Civic, and the Part 2 Beetle, Breeze, and Escort (4
models)
• Group 4 – The Part 1 Honda Civic and the Part 2 Escort (2 models)
The first group was developed to represent Tier 1 and LEV light duty trucks and
heavy-duty vehicles. The Chevrolet S10 has a hydrocarbon standard of 0.32 g/mi, and the
LEV Tahoe is at 0.195 g/mi. The NOx standards are at 0.7 g/mi, and 0.6 g/mi,
respectively. The DCX TLEV Caravan was included in Group 2 because of its lower HC
standard.
The second group was developed to approximately represent Tier 1 passenger
cars. This group contains two Tier 1 vehicles (the Toyota Corolla and the S10), the
TLEVs, and the Part 2 LEV Tahoe. The passenger car TLEV NMOG standard at 0.125
g/mi is lower than the Tier 1 NMHC standard of 0.25, but the NOx standard of 0.4 g/mi
is identical to the Tier 1 passenger car and LDT1 NOx standard. The reader will note that
we have included both the LEV Tahoe and the Chevrolet S10 in both Group 1 and Group
2.
Group 3 was developed to represent LEV passenger cars and LDT1s. All vehicles
are LEV passenger cars in this group.
For Group 4, there were no Tier 2 vehicles tested, because they were not available
during the program. However, two of the passenger car LEVs -- the Part 1 Honda Civic
and the Part 2 Escort -- have 50,000-mile emissions that are very close to the 50,000-mile
Tier 2 Bin 5 NOx standard of 0.05 g/mi.3 This is shown in Figure 1 below. These vehicles
were selected to represent vehicles certified to Tier 2 standards. While it would be
preferable to have one or two larger vehicles, including LDTs included with this group,
since all passenger cars and LDTs from 0-8,500 lbs GVW must meet a Tier 2 average
NOx level of 0.07 g/mi at 120,000 miles, there were no larger vehicles in this test data
with NOx emissions in this range.
3 Tier 2 emission standards are divided into different levels called Bins. Manufacturers can produce
vehicles in any Bin structure as long as an overall NOx average is met. The final Tier 2 NOx average is
0.07 g/mi at 120,000 miles, which is the same standard as Bin 5.

13
After grouping the data, the following process was used to determine emission
rates vs mileage for the Clear and MMT fleets. This process follows a similar process
used by the investigators analyzing the data in the Part 1 and Part 2 reports:
1. All emission tests on California Phase 2 fuel were utilized.
2. The log transformation of emissions was determined for each vehicle and test
point.
3. For each Group, the average of the log of emissions was computed at each
mileage point.
4. The log averages were transformed back to real g/mi space.
5. Linear regressions, and in some cases, power curves were fit through the averages
to determine emissions vs mileage.
6. MMT correction factors vs mileage were determined by taking the ratio of MMT
emissions vs Clear emissions.
4.3 Results
Emissions vs mileage for Clear and MMT vehicles for each group are shown in
Attachment 1. Observations on these plots are found below.
Group 1 – For NMHC, MMT appears to increase emissions at all mileages (every MMT
average is above every Clear average). For CO, MMT appears to have little or no effect.
For NOx, MMT appears to reduce emissions at higher mileages (above 20,000 miles, the
Figure 1. 50K NOx Emissions of Phase 1 and Phase 2 Test Vehicles
on California Phase 2 Gasoline
0
0.05
0.1
0.15
0.2
0.25
0.3
0.35
1996
Civic
1998 Ph
2 Escort
1996 Ph
1 Escort
1998
Breeze
1999
Beetle
1996
Intrepid
1996
Neon
1996
Corolla
1996
Caravan
1999
Tahoe
1997
Saturn
1997
Cavalier
1996
S10
Blazer
1996
Crown
Vic
NO
x (
g/m
i)

14
MMT averages are always below the Clear averages). For all Group 1 vehicles, linear
regressions seem to provide a reasonable fit of the data.
Group 2 – In Group 2, only the LEV Tahoe was tested through 100,000 miles; the
remainder of the vehicles were tested at 50,000 miles and less. For NMHC, MMT
appears to increase emissions at all mileages. CO again shows little or no effects of MMT
(the LEV Tahoe has a CO standard of 5.0 g/mi, which may explain why the points at
higher mileages appear to be much higher than the others below 50,000 miles), but NOx
is lower at all mileages for MMT.
Group 3 – For NMHC, MMT increases emissions at all mileages, and the increase grows
with mileage. CO emissions also increase with MMT. In the case of CO, we have fitted a
power curve (y = exp[ax+b]) to the data because the MMT and Clear emissions at 4,000
miles, 15,000 miles, and 25,000 miles are equal, but at higher mileages the Clear
emissions are much lower than the MMT emissions.4 Finally, NOx is lower at low
mileages (except for the 4,000-mile point) for MMT, but much higher at higher mileages.
We have fitted a power curve through these points because the emissions of MMT and
Clear are equivalent at 4,000 miles.
Group 4 – For HC, MMT increases emissions at all mileage points. MMT also has the
same effect on CO. MMT increases NOx emissions at the higher mileages, with the
crossover point being about 20,000 miles. Again, we have fitted a power curve to the
Clear NOx because at low mileages the emissions are very similar, while at higher
mileages, the emissions from MMT vehicles are much higher than the Clear vehicles.
Overall, these analyses show that MMT increases HC emissions for all vehicles
(Groups 1-4), with the greatest increases coming on the advanced technology vehicles
(Groups 3 and 4). MMT appears to have little effect on CO emissions from higher
mileage vehicles, but starts to have an effect at increasing emissions for the more
advanced technology vehicles. Finally, MMT appears to reduce NOx emissions for
earlier vehicles, but increases NOx significantly for advanced technology vehicles such
as LEVs and Tier 2 vehicles. This effect becomes much more pronounced as these
vehicles increase in age.
4.4 MMT Correction Factors
The modeling work conducted by AIR for Environment Canada in 2001 utilized
the MOBILE5b model and EPA’s emission rates for 1988 and later light duty vehicles
and light duty trucks from EPA’s Tier 2 Final Rule. This modeling did not take into
account the impacts of MMT on emissions, in spite of the fact that MMT is in widespread
use in Canada, because there was not enough information at the time to indicate that
emissions should be adjusted for MMT use. The goal of this study is to estimate MMT’s
impact on these emission rates and emission inventories. Therefore, what is needed is a
4 A linear regression through the Clear data produced a higher 4K level than MMT, when the averages at
low mileages are essentially equivalent.

15
set of MMT correction factors that can be used in conjunction with the 2001 modeling
system to adjust the EPA emission rates for gasoline for MMT use.
MMT correction factors vs age were estimated for Tier 1 and later vehicles from
the above plots to use in modeling emissions in Canada. The MMT correction factors
were estimated with the following equation:
CFMMT = EmissionsMMT/EmissionsClear
Where:
CFMMT = MMT correction factor
EmissionsMMT = emissions with MMT fuel
EmissionsClear = emissions with Clear fuel
The correction factors are used in the MOBILE5 model to correct the emissions
within the model to operation on MMT fuel.
EFMMT = EFEPA * CFMMT
Where:
EFMMT = emission factor in g/mi for a particular model year, adjusted for MMT
EFEPA = EPA emission factor for a particular model year, not adjusted for MMT
CFMMT = MMT correction factor
Since the EPA emission factors include both on-cycle and off-cycle operation,
this analysis will adjust both on-cycle and off-cycle exhaust emissions for the MMT
effect. Also, these MMT correction factors have been developed on so-called “normal-
emitting” vehicles, however the MOBILE model includes both normal emitters and high
emitters. No data is available on MMT’s effects on high emitting vehicles, but if most
high emitting vehicles have some catalytic activity, then we would expect MMT to have
some effect even on high emitters. Therefore, for this analysis, we have assumed that
MMT has the same percentage effect on both normal and high emitting vehicles. The
MMT correction factors for the various groups are shown in Figures 2-4.

16
0.8
1.0
1.2
1.4
1.6
1.8
2.0
2.2
2.4
2.6
0 20,000 40,000 60,000 80,000 100,000 120,000 140,000 160,000
Cor
rect
ion
Fact
or
Odometer (Miles)
Group 1
Group 2
Group 3
Group 4
Air Improvement Resource, Inc.
Figure 2NMHC MMT Correction Factors
0.8
1.0
1.2
1.4
1.6
1.8
2.0
2.2
2.4
2.6
0 20,000 40,000 60,000 80,000 100,000 120,000 140,000 160,000
Cor
rect
ion
Fact
or
Odometer (Miles)
Group 1
Group 2
Group 3
Group 4
Air Improvement Resource, Inc.
Figure 3CO MMT Correction Factors

17
0.6
0.8
1.0
1.2
1.4
1.6
1.8
2.0
2.2
2.4
2.6
0 20,000 40,000 60,000 80,000 100,000 120,000 140,000 160,000
Cor
rect
ion
Fact
or
Odometer (Miles)
Group 1
Group 2
Group 3
Group 4
Air Improvement Resource, Inc.
Figure 4NOx MMT Correction Factors
The correction factors in Figures 2, 3, and 4 were used in conjunction with the
MOBILE5 model to estimate emissions with MMT in Canada. No adjustments were
made to pre-Tier 1 vehicles. The figures above assume 100% MMT use and also assume
that the concentration of MMT used in gasoline in Canada is nearly the same as the Part 1
and Part 2 testing of 0.031 g Mn/U.S. gal. The correction factors were extrapolated
beyond 150,000 miles, in the same way that EPA’s emission factors are often
extrapolated beyond the available data.5 These issues are discussed further in the next
section.
5 As vehicles attain higher mileages, their proportion of activity diminishes significantly, lessening the
impact of the extrapolation.

18
5.0 Canadian Emission Modeling
The previous section showed that the use of MMT affects exhaust HC, CO, and
NOx emissions, and these effects vary dramatically for different technology vehicles, and
as vehicles age. In particular, LEVs, particularly the cleanest LEVs that appear to be
forerunners of Tier 2 vehicles appear to be very sensitive to the use of MMT. Because the
effects vary by vehicle type and age, it is necessary to perform inventory modeling over a
number of years in order to evaluate the overall effects of MMT on the vehicle fleet.
This section discusses how the emission inventory modeling was conducted. The
first section discusses MMT penetration in Canada, and also discusses surveys of MMT
concentration and how this concentration compares to the test data described in Section
4.0.
5.1 MMT Use in Canada
There are several sources of MMT use in Canada, as follows:
• Environment Canada’s “Additives in Canadian Fuel Report, 1999”
• Ethyl Corporation Press Releases
• The auto industry biannual service station fuel survey
Environment Canada
Under the Fuels Information Regulations, No. 1 of the Canadian Environmental
Protection Act, companies producing or importing more than 400 m3 annual of liquid fuel
containing an additive must submit information on the fuel additives used to Environment
Canada. The information must be provided within 60 days of the first use or any change
in the use of an additive.
The most recent information is available in the 1999 Report. [5] Fifteen refiners,
representing 87 percent of Canadian gasoline production and distribution, reported some
use of a metal antiknock and octane improver additive (MMT). The range of
concentration was from 0.0 to 18 mg Mn/L, with a volume-weighted average of 6.04 mg
Mn/L. In terms of g/U.S. gallons, this is 0.0 to 0.067 g Mn/gal, with an average of 0.022
g Mn/U.S. gal.
Ethyl Corporation
Ethyl Corporation, the manufacturer of MMT, indicated in June of 2002 that
“MMT has been used continuously in Canada in over 90% of unleaded petrol for more
than 23 years.” [6]

19
Automakers’ Fuel Surveys
Another source of information on MMT is a service station survey conducted by
The Alliance of Automobile Manufacturers. [7] In Canada, gasoline samples are
collected at service stations in six cities, twice a year (winter and summer), and sent to an
independent laboratory for analysis. The cities in the survey are Vancouver, Edmonton,
Toronto, Montreal, Halifax, and St John. Samples are collected for premium, regular, and
mid-grade, although not all three types of gasoline are surveyed at every service station.
Only major service stations are sampled – the Alliance sample does not include
independent distributors. If MMT use among independent distributors is different than
the major distributors, then MMT use in Canada could be significantly different than
indicated by the Alliance survey.
Data on manganese penetration from the Alliance surveys since the 1998 summer
survey is shown in Figure 5 and in Table 2.6 The figure shows that for the surveys over
the past few years, MMT penetration is in the 80-95% range for both regular gasoline and
premium gasoline. The average over this period is 85% for all fuels, 90% for premium,
and 82% for regular. This is consistent with Ethyl’s claim that MMT use is around 90%.
6 WWFC stands for World Wide Fuel Charter
Figure 5. Percent of Samples With MMTAlliance Surveys
0%
10%
20%
30%
40%
50%
60%
70%
80%
90%
100%
WIN'99 SUM'99 WIN'00 SUM'00 WIN'01 SUM'01 WIN'02
Survey
Perc
en
t o
f S
am
ple
s w
ith
MM
T a
bo
ve W
WF
C M
axim
um
All
Premium
Regular

20
Table 2. MMT Penetration from Alliance Surveys (%)
Fuel Win99 Sum99 Win00 Sum00 Win01 Sum01 Win02 Average
All 88 93 83 90 78 89 76 85
Premium 94 94 90 80 100 90 83 90
Regular 84 92 78 96 63 89 70 82
5.2 MMT Concentrations
Trends in MMT concentration for both premium and regular from the Alliance
surveys are shown in Figure 6 and Table 3. There is a slight upward trend in MMT
concentration for all fuels, which appears to be driven by a trend to higher MMT
concentrations in premium. MMT concentrations in regular appear to have been
relatively constant in the last few years. The average premium concentration for the last
few years is 0.026 g Mn/U.S. gal, for regular is somewhat lower at 0.019 g Mn/U.S. gal,
and for all fuels in the survey is 0.023 g Mn/U.S. gal.
Figure 6. Average Mn Concentrations in Gasoline Containing MMT
0.000
0.005
0.010
0.015
0.020
0.025
0.030
0.035
0.040
0.045
WIN'99 SUM'99 WIN'00 SUM'00 WIN'01 SUM'01 WIN'02
Survey
Co
ncen
trati
on
(g
Mn
/U.S
. g
al)
All
Premium
Regular

21
Table 3. MMT Average Concentrations from Alliance Surveys (g Mn/U.S. gal)
Fuel Win99 Sum99 Win00 Sum00 Win01 Sum01 Win02 Average
All 0.024 0.018 0.022 0.021 0.023 0.024 0.028 0.023
Premium 0.026 0.023 0.025 0.030 0.028 0.030 0.041 0.029
Regular 0.023 0.015 0.020 0.016 0.016 0.019 0.019 0.018
Maximum concentrations from the Alliance survey are shown in Figure 7.
Maximum concentrations vary between 0.030 and 0.085 g Mn/U.S. gal.
5.3 Implications of Canadian MMT Penetration and MMT Concentrations on
Modeling Results
It is clear that MMT use in Canada is very high – perhaps 90% or greater,
depending on the extent of use among the smaller independent gasoline distributors.
Therefore, it is likely that virtually all, Canadian vehicles have some MMT in the fuel
tanks – thus, this analysis will assume 100% penetration of MMT in Canada.
With regard to concentrations, as discussed earlier, the Part 1 and Part 2 testing
was conducted with MMT at a concentration of 0.031 g Mn/gal, which is the legal limit
Figure 7. Maximum Mn Concentrations
0.000
0.010
0.020
0.030
0.040
0.050
0.060
0.070
0.080
0.090
1 2 3 4 5 6 7
Survey
Maxim
um
Mn
Co
ncen
trati
on
(g
/U.S
. g
al)
Premium
Regular

22
in the U.S. for conventional gasoline. It is also much lower than the maximum
concentrations observed in Canada. According to the auto industry’s survey data, regular
gasoline has average about 0.019 g Mn/gal for the last few years, and premium has
averaged about 0.026 g Mn/gal. The data from Environment Canada indicate an overall
volume-weighted average of 0.22 g Mn/gal.
The auto manufacturers MMT testing was very comprehensive, and covered
advanced technology vehicles to very high mileages. This data showed significant effects
of MMT on tailpipe emissions, especially for LEVs. However, given the resources
required to conduct this type of testing, there is not any data at either higher or lower
MMT concentrations (than the level of 0.031 g Mn/gal). We would expect there to be
some effect of MMT on emissions of advanced technologies at all concentrations of
MMT. It is not known, however, if the emission effects over time are proportional to
concentration. The effects could be non-linear, that is, the emission effect could increase
more rapidly at higher concentrations.
Given the difference in the concentration in the test data and the Canadian
average MMT level as determined by the fuel survey data, it was decided to model two
cases: (1) a primary case in which the Canadian emission effects are assumed to be the
same as the test data, and (2) a second case in which MMT effects are assumed to be
proportional to concentration, and the effects are corrected from the 0.031 g Mn/gal level
to 0.022 g Mn/gal, the level estimated by Environment Canada. The equation used to
correct the MMT effects for concentration is shown below:
CFmmt, adj = [1+(mmtc/0.031)*(CFmmt-1)] * mmtf + (1-mmtf)
Where:
CFmmt, adj = adjusted mmt correction factor
mmtc = mmt concentration, in g Mn/gal (input variable)
mmtf = mmt penetration (fraction)
0.031 = concentration in g Mn/gal of the Part 1 and Part 2 testing programs
The above equation essentially mitigates both the positive and negative effects of
MMT in proportion to concentration and penetration. For this analysis, the penetration is
assumed to be 1.0. Table 4 below illustrates how the equation adjusts a hypothetical
unadjusted set of MMT correction factors from 0.8 to 2.0.

23
Table 4. MMT Correction Factors Adjusted for 0.022 g Mn/gal MMT
Concentration
Unadjusted MMT Correction Factor Adjusted MMT Correction Factor
0.8 0.858
1.2 1.142
1.4 1.284
1.6 1.426
1.8 1.568
2.0 1.710
5.4 Mapping of Groups into Vehicle Technologies
In Section 4, MMT effects were developed for four groups of vehicles. These
group effects need to be applied across different vehicle types and emission standard
levels. The vehicle class and model year mapping for the groups is shown in Table 5.
Vehicle class definitions used in Table 5 are as follows:
PC: passenger cars
LDT1: Light duty truck up through 3,750 lbs loaded vehicle weight (LVW)/6,000 lbs
GVW
LDT2: Light duty truck greater than 3,750 lbs LVW/6,000 lbs GVW
LDT3: Heavy light duty truck up through 5,750 lbs LVW/8,500 lbs GVW
LDT4: heavy light duty truck greater than 5,750 lbs LVW/8,500 lbs GVW
MDPV: medium duty passenger vehicles above 8,500 lbs gross vehicle weight (GVW)
HDGV: heavy-duty gasoline vehicle over 8,500 lbs GVW
Table 5. MMT Correction Factor Group Mapping
Vehicles
Years PC and
LDT1
LDT2 LDT3 LDT4 MDPVs HDGV
Tier 1 Period
(1995-2000)
Group 2 Group 1 Group 1 Group 1 Group 1 Group 1
NLEV Period
(2001-2003)
Group 3 Group 3 Group 1 Group 1 Group 1 Group 1
Interim Tier 2
(2004-2006)
Group 4 Group 4 Group 3 Group 3 Group 1 Group 1
Final Tier 2
(2007+)
Group 4 Group 4 Group 4 Group 4 Group 4 Group 3
Group 1: Part 1 Tier 1 S10 Blazer and Part 2 Tahoe LEV
Group 2: Part 1 TLEVs, Part 1 Tier 1 Corolla, Part 2 LEV Tahoe
Group 3: Part 1 and Part 2 LEVs (minus the Tahoe)
Group 4: Part 1 Civic and Part 2 Escort

24
Tier 1 Period – PCs and LDT1s will use the Group 2 MMT correction factors, whereas
all heavier trucks will use the Group 1 MMT correction factors through 2004.
NLEV Period – The NLEV standards applied to PCs, LDT1s, and LDT2s, thus, these two
groups will use the Group 3 correction factors. All others will use Group 1 correction
factors.
Interim Tier 2 – Interim Tier 2 standards apply in the 2004-2006 time period. PCs,
LDT1s, and LDT2s will use the Group 4 correction factors, LDT3s and LDT4s will use
the Group 3 correction factors, and MDPVs and HDGVs will continue to use the Group 1
correction factors.
Final Tier 2 – All vehicles except HDGVs will use the Group 4 correction factors except
HDGVs, which will use the Group 3 correction factors.
The MOBILE5 model contains 3 gasoline truck classes instead of the six truck
classifications shown in Table 5. The 3 gasoline trucks classes in MOBILE5 are LDT1s
(0-6,000 lbs GVW), LDT2s (6,500-8,500 lbs GVW), and HDGVs (8,500+ lbs GVW).
The MOBILE5 nomenclature (LDT1, LDT2, etc.) bears little resemblance to the newer
nomenclature used in Table 5 and used by the EPA in its Tier 2 rule. Thus, the correction
factors above must be weighted together with travel fractions into the MOBILE5
categories. The weighting factors used in this analysis are shown in Table 6. These were
obtained for the year 2020 from the EPA Tier 2 analysis. [8]
Table 6. LDT Truck VKT Fractions Used to Combine LDTs MOBILE5 Model
MOBILE Truck Class Regulatory Vehicle Class Regulatory Class Fraction
LDT1 0.24 LDT1
LDT2 0.76
LDT3 0.68 LDT2
LDT4 0.32
MDPV 0.18 HDGV
Remainder 0.82
5.5 Results
Inventory analyses were conducted for two cases, as follows:
Base MMT Case: Uses Group 1 through Group 4 correction factors, 100% penetration of
MMT at 0.031 g Mn/gal.
MMT Concentration Case: Uses Group 1 through Group 4 correction factors, 100%
penetration of MMT, and adjusts MMT effects for Canadian average concentration of
0.022 g Mn/gal, as determined in Environment Canada 1999 Additives report.
These cases are shown further in Table 7.

25
Table 7. Emission Inventory Case
Case MMT Penetration Correction Factors Adjusted
for Concentration?
Base MMT 100% No
MMT Concentration 100% Yes
In each comparison, VOC (exhaust and evaporative), CO, and NOx results are
shown from 1995 through 2020 for all gasoline vehicles except motorcycles in Canada.
Each plot shows a “with MMT” line and a “without MMT” line. The without MMT line
reflects the same inventories as in the December 21, 2001 AIR report to Environment
Canada. Actual inventories for all cases are shown in Attachment 2.
5.5.1 Base MMT Case Compared to No MMT
Inventory results for the Base Case and for No MMT are shown in Table 8 and
Figures 8, 9, and 10. Table 8 shows that VOC and CO inventories are 8%, 11%, higher in
2010 with MMT than without. NOx inventories are 4% lower due to MMT. In 2020,
however, VOC, CO, and NOx are 36%, 75%, and 65% higher due to the use of MMT.
The figures are shaded in the 1995-2005 time period to indicate that the effects in this
timeframe are somewhat dependent on the MMT response of pre-Tier 1 vehicles, and
these vehicles were not modeled in this study. Pre-1995 Tier 1 vehicles contribute only
14% of the vehicle kilometers traveled in 2005, and this value continues to decline after
2005. The figures show that VOC emissions with MMT are higher than without MMT
starting in 2003-2004, and are much higher in 2020 due to the increased sensitivity of
Tier 2 vehicles. CO inventories are somewhat lower with MMT until about 2007, and
then become much higher. NOx inventories are lower with MMT until about 2010, when
they become much higher.
Table 8. Base Case Emission Inventories (Gasoline Vehicles – annual tonnes)
Year Case VOC CO NOx
2010 Base MMT 162,732 1,682,027 147,849
No MMT 150,430 1,519,655 154,719
Difference 12,302 162,372 6,870
% Difference 8% 11% -4%
2020 Base MMT 183,475 2,485,855 119,400
No MMT 134,932 1,423,428 72,322
Difference 48,543 1,062,427 47,078
% Difference 36% 75% 65%

26

27
5.5.2 MMT Concentration Case Compared to No MMT
In this case, MMT effects for Tier 2 vehicles are based on the Group 4 effects,
and MMT penetration is 100% but the MMT effects have been adjusted for concentration
effects from 0.031 g Mn/gal to 0.022 g Mn/gal. Results are shown in Table 9 and Figures
11, 12 and 13. Table 9 shows that VOC and CO inventories are 6% and 8% higher in
2010 with MMT. NOx inventories are 4% lower with MMT. In 2020, however, VOC,
CO, and NOx inventories are 26%, 35%, and 45% higher with MMT.
Table 9. MMT Concentration Case (Gasoline Vehicles – annual tonnes)
Year Case HC CO NOx
2010 MMT 159,161 1,634,885 149,259
No MMT 150,430 1,519,655 154,719
Difference 8,731 115,230 -5,460
% Difference 6% 8% -4%
2020 MMT 169,382 2,177,412 105,197
No MMT 134,932 1,423,428 72,322
Difference 34,450 753,984 32,875
% Difference 26% 35% 45%

28
29
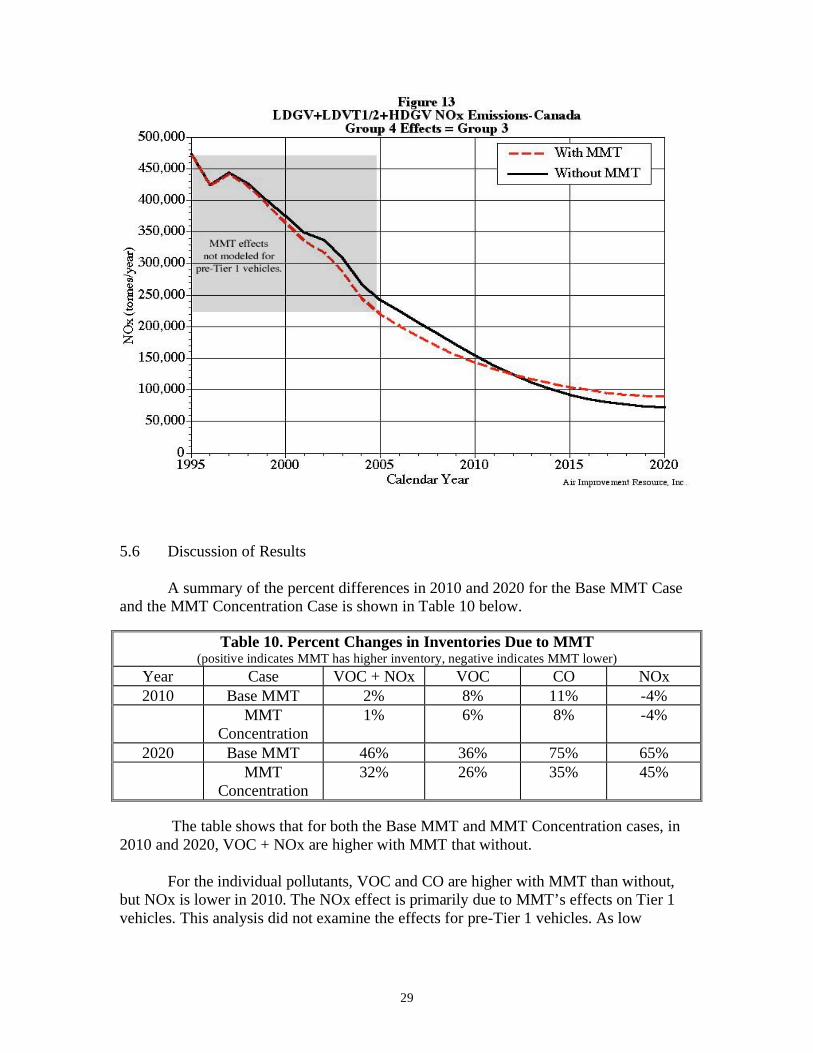
5.6 Discussion of Results
A summary of the percent differences in 2010 and 2020 for the Base MMT Case
and the MMT Concentration Case is shown in Table 10 below.
Table 10. Percent Changes in Inventories Due to MMT (positive indicates MMT has higher inventory, negative indicates MMT lower)
Year Case VOC + NOx VOC CO NOx
2010 Base MMT 2% 8% 11% -4%
MMT
Concentration
1% 6% 8% -4%
2020 Base MMT 46% 36% 75% 65%
MMT
Concentration
32% 26% 35% 45%
The table shows that for both the Base MMT and MMT Concentration cases, in
2010 and 2020, VOC + NOx are higher with MMT that without.
For the individual pollutants, VOC and CO are higher with MMT than without,
but NOx is lower in 2010. The NOx effect is primarily due to MMT’s effects on Tier 1
vehicles. This analysis did not examine the effects for pre-Tier 1 vehicles. As low

30
emission vehicles and Tier 2 vehicles are introduced, however, MMT increases emission
of all three pollutants, regardless of which case is examined.
This analysis indicates that if MMT use is not discontinued before widespread
introduction of NLEVs and Tier 2 vehicles (NLEV introduction started in 2001), VOC,
CO, and NOx emissions from gasoline motor vehicles in Canada in the future may be
significantly higher than those estimated for Environment Canada for air quality planning
purposes.

31
References
1. “The Impact of MMT on Vehicle Emissions and Durability – Part 1”, A Joint
Study by the Alliance of Automobile Manufacturers, The Association of
International Automobile Manufacturers and the Canadian Vehicle Manufacturers
Association, July 29, 2002.
2. “The Impact of MMT on Vehicle Emissions and Durability – Part 2”, A Joint
Study by the Alliance of Automobile Manufacturers, The Association of
International Automobile Manufacturers and the Canadian Vehicle Manufacturers
Association, July 29,2002
3. “Updated Estimate Of Canadian On-Road Vehicle Emissions for the Years 1995-
2020”, Revised 18 December 2001, AIR and SENES for Environment Canada.
4. “Impacts Associated With the Use of MMT as an Octane Enhancing Additive in
Unleaded Gasolines – A Critical Review”, Sierra Research, July 2002.
5. “Additives in Canadian Fuels 1999”, Environment Canada, March 2000.
6. “Scientific Evidence and Real-World Experience on the Safety of MMT in Fuels:
An Overview”, Ethyl Corporation, June 2002.
7. North American Fuel Surveys, 1999-2002, Alliance of Automobile
Manufacturers.
8. “Development of Light-Duty Emission Inventory Estimates in the Notice of
Proposed Rulemaking for Tier 2 and Sulfur Standards”, EPA420-R-99-005,
March 1999.

32
Attachment 1
Group 1-4 Analysis With All Vehicles

33
0.00
0.02
0.04
0.06
0.08
0.10
0.12
0.14
0.16
0.18
0 20,000 40,000 60,000 80,000 100,000 120,000
NM
HC
Em
issi
on F
acto
r (g
/mi)
Odometer (Miles)
NMHC (MMT)
NMHC (Clear)
Air Improvement Resource, Inc.
Group 1 NMHC Emission Factors
0.0
0.5
1.0
1.5
2.0
2.5
0 20,000 40,000 60,000 80,000 100,000 120,000
CO
Em
issi
on F
acto
r (g
/mi)
Odometer (Miles)
CO (MMT)
CO (Clear)
Air Improvement Resource, Inc.
Group 1 CO Emission Factors

34
0.00
0.05
0.10
0.15
0.20
0.25
0.30
0 20,000 40,000 60,000 80,000 100,000 120,000
NO
x E
mis
sion
Fac
tor
(g/m
i)
Odometer (Miles)
NOx (MMT)
NOx (Clear)
Air Improvement Resource, Inc.
Group 1 NOx Emission Factors
0.00
0.02
0.04
0.06
0.08
0.10
0.12
0.14
0.16
0 20,000 40,000 60,000 80,000 100,000 120,000
NM
HC
Em
issi
on F
acto
r (g
/mi)
Odometer (Miles)
NMHC (MMT)
NMHC (Clear)
Air Improvement Resource, Inc.
Group 2 NMHC Emission Factors

35
0.0
0.5
1.0
1.5
2.0
2.5
0 20,000 40,000 60,000 80,000 100,000 120,000
CO
Em
issi
on F
acto
r (g
/mi)
Odometer (Miles)
CO (MMT)
CO (Clear)
Air Improvement Resource, Inc.
Group 2 CO Emission Factors
0.00
0.05
0.10
0.15
0.20
0.25
0.30
0 20,000 40,000 60,000 80,000 100,000 120,000
NO
x E
mis
sion
Fac
tor
(g/m
i)
Odometer (Miles)
NOx (MMT)
NOx (Clear)
Air Improvement Resource, Inc.
Group 2 NOx Emission Factors

36
0.00
0.01
0.02
0.03
0.04
0.05
0.06
0.07
0.08
0.09
0.10
0 20,000 40,000 60,000 80,000 100,000 120,000
NM
HC
Em
issi
on F
acto
r (g
/mi)
Odometer (Miles)
NMHC (MMT)
NMHC (Clear)
Air Improvement Resource, Inc.
Group 3 NMHC Emission Factors
0.0
0.2
0.4
0.6
0.8
1.0
1.2
1.4
0 20,000 40,000 60,000 80,000 100,000 120,000
CO
Em
issi
on F
acto
r (g
/mi)
Odometer (Miles)
CO (MMT)
CO (Clear)
Air Improvement Resource, Inc.
Group 3 CO Emission Factors

37
0.00
0.02
0.04
0.06
0.08
0.10
0.12
0.14
0.16
0.18
0 20,000 40,000 60,000 80,000 100,000 120,000
NO
x E
mis
sion
Fac
tor
(g/m
i)
Odometer (Miles)
NOx (MMT)
NOx (Clear)
Air Improvement Resource, Inc.
Group 3 NOx Emission Factors
0.00
0.02
0.04
0.06
0.08
0.10
0.12
0 20,000 40,000 60,000 80,000 100,000 120,000
NM
HC
Em
issi
on F
acto
r (g
/mi)
Odometer (Miles)
NMHC (MMT)
NMHC (Clear)
Air Improvement Resource, Inc.
Group 4 NMHC Emission Factors

38
0.0
0.2
0.4
0.6
0.8
1.0
1.2
1.4
1.6
0 20,000 40,000 60,000 80,000 100,000 120,000
CO
Em
issi
on F
acto
r (g
/mi)
Odometer (Miles)
CO (MMT)
CO (Clear)
Air Improvement Resource, Inc.
Group 4 CO Emission Factors
0.00
0.05
0.10
0.15
0.20
0.25
0 20,000 40,000 60,000 80,000 100,000 120,000
NO
x E
mis
sion
Fac
tor
(g/m
i)
Odometer (Miles)
NOx (MMT)
NOx (Clear)
Air Improvement Resource, Inc.
Group 4 NOx Emission Factors

39
Attachment 2
Gasoline Vehicle Emission Inventories For All Cases
1 – No MMT
2 – MMT (100% Penetration, 0.031 g Mn/gal Concentration)
3 – MMT (100% Penetration, Concentration Adjusted to 0.022 g Mn/gal)

40
Canadian Emission Inventories – No MMT
Annual Tonnes/Year
Pollutant CY LDGV LDGT1 LDGT2 HDGV LDDV LDDT HDDV MC Total
1995 350,680 97,439 71,357 11,870 655 3,381 45,110 1,585 582,079
1996 287,650 86,902 71,270 11,689 632 3,301 44,645 1,553 507,643
1997 293,991 90,613 65,316 12,701 644 3,567 46,001 1,493 514,325
1998 278,709 83,565 62,164 11,737 639 2,992 41,811 1,485 483,102
1999 242,983 76,893 59,039 11,100 600 2,810 37,580 1,477 432,482
2000 212,055 70,836 55,838 10,583 564 2,687 34,633 1,477 388,674
2001 187,481 65,789 53,200 9,849 533 2,593 31,597 1,477 352,519
2002 168,392 60,745 51,373 9,013 507 2,590 29,234 1,477 323,332
2003 149,370 54,440 46,838 8,328 504 2,601 27,207 1,477 290,766
2004 131,915 48,250 43,483 7,887 489 2,640 25,102 1,477 261,245
2005 120,236 44,009 40,388 7,634 495 2,664 22,893 1,477 239,796
2006 110,448 41,014 37,621 7,431 494 2,720 20,613 1,477 221,819
2007 101,783 38,371 35,319 7,155 495 2,763 18,647 1,477 206,011
2008 94,662 36,099 33,172 6,861 505 2,814 16,299 1,477 191,889
2009 88,653 34,152 31,179 6,361 516 2,853 14,257 1,477 179,448
2010 83,003 32,420 28,794 6,213 527 2,896 12,479 1,477 167,810
2011 79,497 31,086 27,111 6,080 543 2,934 11,511 1,477 160,240
2012 76,282 30,161 25,515 5,914 557 2,979 10,599 1,477 153,483
2013 74,852 29,640 24,376 5,866 571 3,014 9,743 1,477 149,539
2014 74,112 29,373 23,285 5,789 585 3,051 9,052 1,477 146,725
2015 73,939 29,340 22,478 5,723 599 3,078 8,288 1,477 144,922
2016 74,190 29,474 21,808 5,696 612 3,122 7,706 1,477 144,086
2017 74,755 29,804 21,385 5,665 625 3,173 7,163 1,477 144,047
2018 75,437 30,272 21,038 5,635 638 3,228 6,748 1,477 144,474
2019 76,371 30,868 20,786 5,621 652 3,285 6,378 1,477 145,439
Total
VOC
2020 77,480 31,537 20,287 5,628 665 3,345 6,051 1,477 146,469
1995 3,352,131 1,001,402 562,017 159,744 1,470 6,035 209,690 10,361 5,302,851
1996 2,775,296 869,788 550,432 154,717 1,433 6,104 211,856 10,361 4,579,988
1997 2,891,642 922,633 529,673 169,928 1,448 6,612 236,347 10,361 4,768,644
1998 2,747,923 838,013 513,510 156,877 1,462 5,730 236,652 10,300 4,510,466
1999 2,395,283 746,474 488,077 144,403 1,412 5,653 241,623 10,300 4,033,224
2000 2,135,908 676,500 458,648 134,697 1,362 5,619 246,683 10,300 3,669,718
2001 1,924,843 623,738 443,646 122,295 1,317 5,614 247,153 10,300 3,378,906
2002 1,735,579 573,667 414,297 106,979 1,288 5,686 247,851 10,300 3,095,649
2003 1,488,264 499,383 367,306 93,896 1,289 5,764 249,195 10,300 2,715,398
2004 1,288,580 431,964 325,766 86,600 1,282 5,859 250,978 10,300 2,401,329
2005 1,199,639 393,794 309,233 83,163 1,302 5,924 236,595 10,300 2,239,951
2006 1,139,032 370,268 302,584 80,440 1,310 6,019 219,511 10,300 2,129,464
2007 1,075,037 349,618 284,171 77,301 1,319 6,096 196,140 10,300 1,999,984
2008 1,007,909 332,367 267,772 74,148 1,343 6,174 174,917 10,300 1,874,930
2009 966,034 316,368 234,873 63,832 1,366 6,235 155,373 10,300 1,754,382
2010 926,178 305,958 225,032 62,487 1,392 6,297 137,629 10,300 1,675,274
2011 896,115 298,217 214,637 60,924 1,425 6,361 123,370 10,300 1,611,349
2012 869,042 293,228 202,135 61,906 1,458 6,431 107,334 10,300 1,551,835
2013 850,818 290,448 195,207 62,937 1,491 6,495 92,758 10,300 1,510,453
2014 836,541 288,916 189,705 64,059 1,523 6,562 77,647 10,300 1,475,254
2015 830,779 289,330 186,044 65,227 1,557 6,622 64,013 10,300 1,453,872
2016 829,785 291,066 182,517 66,466 1,589 6,700 50,739 10,300 1,439,161
2017 833,696 294,512 180,942 67,759 1,622 6,783 39,517 10,300 1,435,131
2018 839,233 299,039 178,771 69,145 1,655 6,872 31,632 10,300 1,436,647
2019 848,897 304,993 178,969 70,572 1,689 6,966 27,361 10,300 1,449,749
CO
2020 860,746 311,735 178,886 72,061 1,723 7,064 23,402 10,300 1,465,916
1995 313,000 83,883 56,921 18,594 1,714 7,169 493,770 567 975,617
1996 270,303 78,491 56,909 19,041 1,611 7,100 498,420 567 932,442
1997 285,129 83,635 54,265 21,228 1,617 7,637 563,419 567 1,017,497
1998 275,758 78,712 51,888 20,740 1,594 6,439 574,436 561 1,010,127
1999 252,346 75,901 50,568 20,695 1,502 6,101 573,173 561 980,846
2000 232,661 73,126 48,997 20,610 1,416 5,877 520,608 561 903,855
2001 211,778 69,948 47,299 20,343 1,344 5,739 455,455 561 812,466
2002 201,824 68,438 46,944 20,054 1,290 5,743 408,829 561 753,682
NOx
2003 181,333 62,962 43,750 19,948 1,274 5,774 370,508 561 686,109

41
2004 154,198 54,386 39,334 19,838 1,276 5,842 346,917 561 622,352
2005 137,865 49,064 36,117 19,798 1,273 5,889 323,790 561 574,357
2006 125,490 45,558 34,517 19,219 1,265 5,968 300,279 561 532,857
2007 113,165 41,963 32,787 18,398 1,259 6,023 272,786 561 486,942
2008 101,954 38,257 31,302 17,545 1,276 6,090 247,841 561 444,826
2009 91,225 34,684 29,455 16,608 1,292 6,145 224,117 561 404,087
2010 80,811 30,912 27,031 15,965 1,316 6,204 202,900 561 365,699
2011 71,417 27,196 24,961 15,355 1,347 6,266 180,962 561 328,065
2012 62,893 24,193 23,153 14,742 1,378 6,335 159,220 561 292,474
2013 55,286 21,578 21,408 13,750 1,409 6,397 137,713 561 258,101
2014 49,126 19,486 19,970 12,354 1,440 6,463 118,931 561 228,332
2015 44,278 17,894 18,867 11,007 1,471 6,522 102,549 561 203,148
2016 40,771 16,698 17,598 10,224 1,502 6,597 88,253 561 182,205
2017 38,365 16,015 16,730 9,340 1,533 6,680 75,649 561 164,872
2018 36,613 15,670 15,811 8,436 1,564 6,767 64,839 561 150,261
2019 35,598 15,529 15,061 7,664 1,597 6,859 56,783 561 139,652
2020 35,133 15,533 14,522 7,144 1,629 6,954 48,982 561 130,458

42
Canadian Emission Inventories – Base Case With MMT
Tonnes/Year
Pollutant CY LDGV LDGT1 LDGT2 HDGV LDDV LDDT HDDV MC Total
Total 1995 350,774 97,482 71,413 11,870 655 3,381 45,110 1,585 582,271
1996 288,171 87,222 71,557 11,694 632 3,301 44,645 1,553 508,776
1997 294,652 91,040 65,735 12,712 644 3,567 46,001 1,493 515,842
1998 279,686 84,158 62,640 11,755 639 2,992 41,811 1,485 485,167
1999 244,203 77,636 59,589 11,124 600 2,810 37,580 1,477 435,020
2000 213,542 71,744 56,387 10,614 564 2,687 34,633 1,477 391,649
2001 189,194 66,796 53,802 9,885 533 2,593 31,597 1,477 355,876
2002 170,214 61,772 52,014 9,054 507 2,590 29,234 1,477 326,863
2003 151,342 55,493 47,526 8,376 504 2,601 27,207 1,477 294,528
2004 133,945 49,299 44,155 7,944 489 2,640 25,102 1,477 265,052
2005 122,515 45,161 41,034 7,700 495 2,664 22,893 1,477 243,939
2006 113,218 42,416 38,248 7,499 494 2,720 20,613 1,477 226,684
2007 105,338 40,132 35,978 7,223 495 2,763 18,647 1,477 212,055
2008 99,197 38,358 33,878 6,927 505 2,814 16,299 1,477 199,456
2009 94,486 37,065 31,956 6,427 516 2,853 14,257 1,477 189,037
2010 90,530 36,182 29,740 6,280 527 2,896 12,479 1,477 180,113
2011 89,063 35,906 28,261 6,149 543 2,934 11,511 1,477 175,844
2012 88,105 36,061 26,977 5,988 557 2,979 10,599 1,477 172,742
2013 89,229 36,797 26,283 5,943 571 3,014 9,743 1,477 173,057
2014 91,097 37,885 25,707 5,871 585 3,051 9,052 1,477 174,726
2015 93,305 39,061 25,506 5,818 599 3,078 8,288 1,477 177,132
2016 95,889 40,337 25,636 5,815 612 3,122 7,706 1,477 180,594
2017 98,356 41,607 26,034 5,814 625 3,173 7,163 1,477 184,251
2018 100,654 42,880 26,346 5,803 638 3,228 6,748 1,477 187,775
2019 102,873 44,185 26,983 5,811 652 3,285 6,378 1,477 191,645
VOC
2020 105,027 45,401 27,203 5,844 665 3,345 6,051 1,477 195,013
1995 3,353,237 1,001,728 562,197 159,744 1,470 6,035 209,690 10,361 5,304,462
1996 2,780,458 871,944 551,212 154,792 1,433 6,104 211,856 10,361 4,588,162
1997 2,896,083 924,700 530,620 170,033 1,448 6,612 236,347 10,361 4,776,204
1998 2,752,499 840,189 514,371 156,970 1,462 5,730 236,652 10,300 4,518,174
1999 2,397,989 748,000 488,594 144,449 1,412 5,653 241,623 10,300 4,038,020
2000 2,135,419 676,768 458,762 134,663 1,362 5,619 246,683 10,300 3,669,576
2001 1,919,852 622,515 443,102 122,152 1,317 5,614 247,153 10,300 3,372,006
2002 1,722,207 568,913 413,052 106,690 1,288 5,686 247,851 10,300 3,075,989
2003 1,468,946 492,552 364,823 93,342 1,289 5,764 249,195 10,300 2,686,211
2004 1,265,357 423,382 322,001 85,653 1,282 5,859 250,978 10,300 2,364,811
2005 1,175,308 385,055 303,544 81,713 1,302 5,924 236,595 10,300 2,199,742
2006 1,121,790 365,190 295,639 78,637 1,310 6,019 219,511 10,300 2,098,396
2007 1,076,390 351,703 275,670 75,098 1,319 6,096 196,140 10,300 1,992,717
2008 1,037,270 345,549 258,904 71,440 1,343 6,174 174,917 10,300 1,905,896
2009 1,035,616 344,381 227,011 60,696 1,366 6,235 155,373 10,300 1,840,979
2010 1,049,967 353,009 219,840 59,211 1,392 6,297 137,629 10,300 1,837,645
2011 1,084,300 368,675 213,955 57,619 1,425 6,361 123,370 10,300 1,866,005
2012 1,126,929 386,686 207,262 58,496 1,458 6,431 107,334 10,300 1,904,896
2013 1,186,198 409,767 208,839 59,884 1,491 6,495 92,758 10,300 1,975,731
2014 1,247,864 435,007 213,136 61,550 1,523 6,562 77,647 10,300 2,053,590
2015 1,309,993 458,528 221,206 64,153 1,557 6,622 64,013 10,300 2,136,371
2016 1,372,598 481,348 232,852 67,689 1,589 6,700 50,739 10,300 2,223,815
2017 1,427,365 501,751 246,829 72,038 1,622 6,783 39,517 10,300 2,306,205
2018 1,475,493 520,621 257,940 75,524 1,655 6,872 31,632 10,300 2,380,037
2019 1,517,832 539,040 274,162 79,281 1,689 6,966 27,361 10,300 2,456,632
CO
2020 1,557,582 555,704 288,658 83,911 1,723 7,064 23,402 10,300 2,528,343
1995 312,717 83,896 56,972 18,594 1,714 7,169 493,770 567 975,398
1996 268,427 78,478 57,062 19,067 1,611 7,100 498,420 567 930,731
1997 282,256 83,367 54,340 21,244 1,617 7,637 563,419 567 1,014,446
1998 271,087 78,103 51,794 20,700 1,594 6,439 574,436 561 1,004,714
1999 245,978 74,768 50,210 20,574 1,502 6,101 573,173 561 972,866
2000 224,365 71,288 48,410 20,392 1,416 5,877 520,608 561 892,917
2001 201,727 67,347 46,381 20,019 1,344 5,739 455,454 561 798,573
2002 188,666 64,033 45,664 19,595 1,290 5,743 408,829 561 734,381
2003 166,871 57,823 41,884 19,248 1,274 5,774 370,508 561 663,942
NOx
2004 140,264 49,118 36,865 18,796 1,276 5,842 346,917 561 599,640

43
2005 124,069 43,595 32,898 18,330 1,273 5,889 323,790 561 550,405
2006 112,531 40,309 30,779 17,456 1,265 5,968 300,279 561 509,148
2007 102,136 37,324 28,507 16,347 1,259 6,023 272,786 561 464,943
2008 93,635 34,716 26,762 15,223 1,276 6,090 247,841 561 426,105
2009 86,641 32,568 24,994 14,058 1,292 6,145 224,117 561 390,376
2010 80,960 30,742 22,836 13,311 1,316 6,204 202,900 561 358,830
2011 76,831 29,493 21,338 12,596 1,347 6,266 180,962 561 329,394
2012 73,169 28,619 20,115 11,725 1,378 6,335 159,220 561 301,123
2013 70,632 28,190 19,399 10,796 1,409 6,397 137,713 561 275,097
2014 68,488 28,072 19,122 9,510 1,440 6,463 118,931 561 252,587
2015 66,590 27,945 19,215 8,494 1,471 6,522 102,549 561 233,346
2016 65,305 27,882 19,566 7,955 1,502 6,597 88,253 561 217,622
2017 64,288 27,835 20,052 7,348 1,533 6,680 75,649 561 203,945
2018 63,659 27,945 20,298 6,588 1,564 6,767 64,839 561 192,221
2019 63,368 28,197 20,723 5,799 1,597 6,859 56,783 561 183,886
2020 63,840 28,554 21,398 5,608 1,629 6,954 48,982 561 177,526

44
MMT Concentration Case
Canadian Emission Annual Inventories from Passenger Cars, LDT1s, LDT2s and HDGVs With 0.022 g/gal MMT
Tonnes/Year
Pollutant CY LDGV LDGT1 LDGT2 HDGV LDDV LDDT HDDV MC Total
1995 350,747 97,470 71,397 11,870 655 3,381 45,110 1,585 582,215
1996 288,020 87,129 71,474 11,693 632 3,301 44,645 1,553 508,447
1997 294,460 90,916 65,613 12,709 644 3,567 46,001 1,493 515,402
1998 279,403 83,986 62,502 11,750 639 2,992 41,811 1,485 484,568
1999 243,849 77,420 59,430 11,117 600 2,810 37,580 1,477 434,283
2000 213,110 71,480 56,228 10,605 564 2,687 34,633 1,477 390,785
2001 188,697 66,504 53,627 9,875 533 2,593 31,597 1,477 354,902
2002 169,685 61,474 51,828 9,042 507 2,590 29,234 1,477 325,838
2003 150,770 55,187 47,326 8,362 504 2,601 27,207 1,477 293,435
2004 133,356 48,995 43,960 7,928 489 2,640 25,102 1,477 263,947
2005 121,853 44,827 40,847 7,681 495 2,664 22,893 1,477 242,736
2006 112,413 42,009 38,066 7,479 494 2,720 20,613 1,477 225,272
2007 104,306 39,621 35,787 7,203 495 2,763 18,647 1,477 210,300
2008 97,880 37,702 33,673 6,908 505 2,814 16,299 1,477 197,259
2009 92,792 36,219 31,731 6,408 516 2,853 14,257 1,477 186,253
2010 88,345 35,090 29,466 6,260 527 2,896 12,479 1,477 176,541
2011 86,286 34,507 27,927 6,129 543 2,934 11,511 1,477 171,314
2012 84,672 34,348 26,552 5,966 557 2,979 10,599 1,477 167,151
2013 85,055 34,719 25,730 5,920 571 3,014 9,743 1,477 166,229
2014 86,166 35,414 25,004 5,847 585 3,051 9,052 1,477 166,596
2015 87,682 36,239 24,627 5,790 599 3,078 8,288 1,477 167,780
2016 89,589 37,183 24,525 5,780 612 3,122 7,706 1,477 169,995
2017 91,504 38,180 24,684 5,771 625 3,173 7,163 1,477 172,579
2018 93,333 39,220 24,805 5,754 638 3,228 6,748 1,477 175,204
2019 95,179 40,319 25,184 5,756 652 3,285 6,378 1,477 178,231
Total VOC
2020 97,030 41,376 25,195 5,781 665 3,345 6,051 1,477 180,920
1995 3,352,924 1,001,635 562,145 159,744 1,470 6,035 209,690 10,361 5,304,004
1996 2,778,958 871,321 550,987 154,771 1,433 6,104 211,856 10,361 4,585,791
1997 2,894,781 924,100 530,345 170,003 1,448 6,612 236,347 10,361 4,773,997
1998 2,751,170 839,561 514,120 156,944 1,462 5,730 236,652 10,300 4,515,939
1999 2,397,194 747,558 488,444 144,435 1,412 5,653 241,623 10,300 4,036,620
2000 2,135,553 676,693 458,730 134,673 1,362 5,619 246,683 10,300 3,669,614
2001 1,921,296 622,867 443,260 122,194 1,317 5,614 247,153 10,300 3,374,001
2002 1,726,095 570,297 413,413 106,774 1,288 5,686 247,851 10,300 3,081,705
2003 1,474,562 494,536 365,542 93,503 1,289 5,764 249,195 10,300 2,694,692
2004 1,272,102 425,877 323,094 85,928 1,282 5,859 250,978 10,300 2,375,419
2005 1,182,378 387,594 305,196 82,134 1,302 5,924 236,595 10,300 2,211,424
2006 1,126,809 366,667 297,654 79,161 1,310 6,019 219,511 10,300 2,107,430
2007 1,076,003 351,100 278,138 75,738 1,319 6,096 196,140 10,300 1,994,834
2008 1,028,752 341,725 261,478 72,226 1,343 6,174 174,917 10,300 1,896,915
2009 1,015,406 336,249 229,293 61,607 1,366 6,235 155,373 10,300 1,815,830
2010 1,014,021 339,356 221,346 60,162 1,392 6,297 137,629 10,300 1,790,504
2011 1,029,677 348,216 214,154 58,579 1,425 6,361 123,370 10,300 1,792,082
2012 1,052,069 359,550 205,774 59,486 1,458 6,431 107,334 10,300 1,802,403
2013 1,088,832 375,125 204,880 60,770 1,491 6,495 92,758 10,300 1,840,651
2014 1,128,442 392,587 206,334 62,279 1,523 6,562 77,647 10,300 1,885,674
2015 1,170,873 409,399 210,997 64,465 1,557 6,622 64,013 10,300 1,938,226
2016 1,215,025 426,110 218,239 67,334 1,589 6,700 50,739 10,300 1,996,036
2017 1,255,008 441,580 227,703 70,796 1,622 6,783 39,517 10,300 2,053,309
2018 1,290,781 456,294 234,954 73,672 1,655 6,872 31,632 10,300 2,106,160
2019 1,323,628 471,086 246,527 76,753 1,689 6,966 27,361 10,300 2,164,311
CO
2020 1,355,284 484,870 256,788 80,470 1,723 7,064 23,402 10,300 2,219,901
1995 311,824 83,765 56,845 18,583 1,711 7,171 494,766 567 975,231
1996 268,110 78,372 56,924 19,050 1,607 7,099 499,793 567 931,524
1997 282,019 83,335 54,205 21,227 1,612 7,635 564,402 567 1,015,002
1998 271,420 78,188 51,716 20,707 1,588 6,438 575,401 561 1,006,019
1999 246,914 74,985 50,208 20,605 1,496 6,097 574,025 561 974,891
2000 225,964 71,712 48,469 20,446 1,411 5,872 521,305 561 895,739
NOx
2001 203,951 67,982 46,539 20,102 1,341 5,733 456,022 561 802,231

45
2002 191,901 65,195 45,930 19,715 1,289 5,737 409,294 561 739,621
2003 170,540 59,194 42,328 19,434 1,273 5,768 370,897 561 669,995
2004 143,809 50,527 37,486 19,077 1,275 5,838 347,182 561 605,754
2005 127,572 45,059 33,728 18,728 1,272 5,886 324,133 561 556,940
2006 115,811 41,715 31,754 17,935 1,265 5,966 300,845 561 515,851
2007 104,898 38,564 29,636 16,912 1,259 6,023 273,645 561 471,498
2008 95,657 35,636 27,970 15,865 1,276 6,091 248,913 561 431,968
2009 87,617 33,083 26,179 14,771 1,291 6,147 225,327 561 394,976
2010 80,572 30,686 23,950 14,051 1,315 6,205 204,045 561 361,387
2011 74,921 28,712 22,287 13,366 1,347 6,268 182,017 561 329,479
2012 69,860 27,218 20,899 12,571 1,377 6,336 160,400 561 299,223
2013 65,866 26,153 19,882 11,621 1,409 6,399 138,886 561 270,777
2014 62,566 25,461 19,271 10,302 1,439 6,464 120,004 561 246,069
2015 59,819 24,903 19,020 9,173 1,471 6,523 103,554 561 225,023
2016 57,897 24,502 18,903 8,557 1,501 6,599 89,036 561 207,556
2017 56,487 24,264 18,993 7,872 1,532 6,681 76,189 561 192,580
2018 55,541 24,235 18,897 7,074 1,564 6,768 65,295 561 179,936
2019 55,056 24,380 18,980 6,292 1,596 6,860 57,138 561 170,864
2020 55,265 24,637 19,296 5,999 1,628 6,955 49,233 561 163,574
![Real-World Emissions Measurements of a Gasoline 2017-01 ... · 6]. There are a growing number of research studies on particle emissions from direct injection gasoline engines and](https://img.dokumen.tips/doc/110x75/5b039ca97f8b9a89208c7661/real-world-emissions-measurements-of-a-gasoline-2017-01-there-are-a-growing.jpg)