Embed Size (px)
Citation preview

Final report
Econometric modelling and household food waste
Using an econometric modelling approach to understand the influences on food waste and food purchases.
Project code: CFP101-008 ISBN: 978-1-84405-462-6 Research date: February ’12-July ’13 Date: January ’14

WRAP’s vision is a world without waste, where resources are used sustainably. We work with businesses, individuals and communities to help them reap the benefits of reducing waste, developing sustainable products and using resources in an efficient way. Find out more at www.wrap.org.uk
Written by: Erik Britton and Andrew Brigdon (Fathom Consulting) Andrew Parry and Stephen LeRoux (WRAP)
Front cover photography: Supermarket aisle, google images While we have tried to make sure this report is accurate, we cannot accept responsibility or be held legally responsible for any loss or damage arising out of or in connection with this information being inaccurate, incomplete or misleading. This material is copyrighted. You can copy it free of charge as long as the material is accurate and not used in a misleading context. You must identify the source of the material and acknowledge our copyright. You must not use material to endorse or suggest we have endorsed a commercial product or service. For more details please see our terms and conditions on our website at www.wrap.org.uk

Econometric modelling and household food waste 1
Executive summary In 2009, WRAP commissioned Fathom Consulting to develop an econometric model which examines the interplay between: macroeconomic factors, such as household incomes and food prices; household awareness of food waste; and the weight of food purchased and wasted by households. The main objective of the work was to better understand the relationship between the weight of food waste (in tonnes), awareness of food waste (as a proxy for activity aimed at helping consumers reduce food waste), food prices and spending on food (by food type). The results from this work suggested1 that food waste awareness (using media coverage of food waste as a proxy) had a statistically significant impact on food purchasing behaviour and food waste. More precisely, a doubling in media coverage of food waste was found to reduce the weight of food purchased by 8.5% in the long term. But, interestingly, no evidence was found that heightened awareness of food waste had a statistically significant impact on the revenue from food sales2. One interpretation of this finding was that, as consumers find more ways to avoid waste, they change their purchasing behaviour and buy smaller quantities of more expensive food, which is a form of ‘trading up’. New research was commissioned to build on the earlier work with several objectives in mind: To develop a method by which to improve the index of ‘food waste awareness’ (FWAI)
used in the 2010 model to better represent the spectrum of activities, including behavioural changes, that are likely to lead to less food being wasted.
To better understand the factors that led to the overall reduction in food waste between 2007 and 20103.
To evaluate more closely the hypothesis that, by itself, an increase in food waste reduction activities results in households ‘trading up’ to higher value foods.
To quantify the ‘food waste dividend’ arising as a result of consumers wasting less food, and attempt to determine how this might be spent.
The results from the new research suggest that: The model can account for a large proportion of the observed reduction in food waste
between 2007 and 2010, and suggests that 40% is attributable to an increase in factors captured by the updated food waste reduction activity index (FWRAI), and around 35% from the impact of higher real food prices on the proportion of food that is thrown away.
By 2011 consumers had saved around £1.9 billion a year4 as a result of less food being wasted in response to the factors captured by the FWRAI. Consumers chose to spend around half of this ‘food waste dividend’ in ‘trading up’ to higher value foods.
1 The Economics of Food Waste, 2010. A summary of the initial research is available at: http://warrr.org/751 2 Note that the modelling takes into account the impact of changes in food prices and incomes. 3 This date range was chosen because a 1.1 million tonnes reduction in household food waste between 2007 and 2010 was reported by WRAP in 2011, when this work was initiated. Subsequently, WRAP published new research that revealed a 1.3 million tonne reduction in household food waste between 2007 and 2012 (see www.wrap.org.uk/household-food-waste). This new data can be used in future exploration of the model, described here.
Econometric modelling and household food waste 2
Key points from this research A new food waste reduction activity index (FWRAI) has been developed, to reflect a wider
range of activities by WRAP and partners5 to help consumers waste less food. This includes data on behaviour change, visits to www.lovefoodhatewaste.com and media mentions of food waste.
The econometric model suggests that within a six to twelve month period, a one standard deviation increase in FWRAI would lead, on average, to a 0.7% reduction in the constant price value of food purchases6. If we assume that an increase in FWRAI has a similar effect on the weight of food purchases, it would imply a reduction in food waste of 230,000 tonnes per annum.
The model can account for a large proportion of the observed reduction in food waste between 2007 and 2010, and suggests that of the 1.1 million tonne reduction in food waste during that period, 40% is attributable to an increase in factors captured by the updated FWRAI. The index is constructed to reflect the consequences of WRAP and partner activity, but may also be influenced by other wider factors.
A similar contribution of around 35% came from the impact of higher real food prices on the proportion of food that is thrown away. A reduction in income relative to trend and higher food prices relative to trend both accounted for a relatively small part of the decline in food waste.
There may be an effect of factors other than food waste reduction activities within the reduction linked to the FWRAI, and equally whilst higher real food prices and reductions in income may have triggered actions to reduce food waste, it is likely that not all of these would have been realised without the food waste reduction activities enabling changes in behaviour.
Other factors will also influence household food waste, such as changes to the way foods are packaged, labelled and sold, some of which will have required changes to consumer behaviour (e.g. choosing to purchase a particular product with re-closable packaging, and then using the functionality correctly) and some of which would not (e.g. longer shelf-life). These factors are difficult to quantify and whilst further work may allow a more robust estimate to be made, it will be very difficult ever to determine a precise figure in such a complex system.
The econometric analysis using the FWRAI is consistent with earlier work (2010), which found evidence that consumers ‘traded up’ as they learnt how to waste less food.
Overall the data suggest that ‘trading up’ within food categories has occurred in response to a reduction in food waste. However, this effect may be masked at a UK level by the effects of the prevailing economic conditions. It may be that a tendency for households to ‘trade down’ when the economy is weak has, in practice, outweighed a tendency to ‘trade up’ as food waste is reduced.
As consumers become more aware of, and concerned by, the issue of food waste, it appears that they learn techniques for wasting a smaller proportion of the food that they purchase. In terms of the household budget, this is equivalent to a fall in the price of food: households do not need to spend so much in order to consume the same quantity of food and drink. Therefore, the physical quantity of food purchased falls.
4 WRAP’s new 2012 research (see www.wrap.org.uk/household-food-waste) showed that consumers were saving £3.3 billion a year (in 2012) from wasting less food. 5 For the purposes of this analysis the definition of partners is broad, and includes, anyone who has worked with WRAP or made use of WRAPs insights, guidance or materials to influence consumer food waste. This would include Courtauld signatories, ‘formal’ LoveFoodHateWaste (LFHW) campaign partners (i.e. Local Authorities and others that have worked in partnership with WRAP on a LFHW campaign; including the Food Standards Agency, WI etc), other businesses where WRAP have carried out training (for them to cascade to staff and customers), trade bodies and consumer organisations that have passed on WRAP recommendations and messages, community groups that have used WRAP resources, key individuals and influencers who have used WRAP materials to help raise awareness and prompt action, media (including formal tie-ups in various consumer magazines) and Governments (including campaigns influenced by WRAP). 6 The second of the two key equations presented in Table 5A of Appendix 3.

Econometric modelling and household food waste 3
Households who waste less are left with a food waste reduction ‘dividend’. Our analysis suggests that by 2011 the reduction in food purchases implied by the increase in FWRAI since 2006 has resulted in an annual saving of £1.9 billion for UK households. The magnitude of the food waste reduction ‘dividend’ is estimated to be equal in value to 2.1% of all expenditure on food and drink in 2011.
This research suggests that around one half of the food waste ‘dividend’ was used to buy more expensive food and drinks (i.e. to ‘trade up’), while the other half was either saved or spent on other things.
New data was published in November 2013, which has effectively doubled the amount of information on food waste available for analysis in the model, and will allow the project team both to test more rigorously and, where necessary, improve the specification of this econometric model in the future.
Updating the original model In the original econometric model (2010), food waste awareness, as an indicator of food waste reduction activity, was measured by a food waste awareness indicator (FWAI) which had a single input, namely the number of times the phrase ‘food waste’ appeared in news articles captured by the Google News service in a given month. Increases in this index were associated with a reduction in the weight of food purchased, and this association was statistically significant. Nevertheless, it was felt that press mentions of food waste were conceptually quite far removed from both the positive actions taken by consumers in seeking to reduce their own food waste, and the activity by WRAP and partners aimed at helping consumers to reduce food waste. It is important to recognise first that the media is only one channel by which consumer awareness of the issue of food waste can be raised, and second that raising food waste awareness is just one step along the line to reducing actual food waste. Activities that would not be picked up by Google, and would therefore not be incorporated into the model include: Direct engagement with consumers, through advertising, by WRAP staff, local authorities,
food businesses (membership events, staff engagement, in store activities). Any routine or on-going communication from retailers and others, for example via retailer
and local authority magazines, through a wide range of partner websites and newsletters (e.g. www.netmums.com, www.moneysavingexpert.com). This could be explicitly about food waste / linked to Love Food Hate Waste (LFHW) or not (for example the ‘5 a day’ campaign carried messaging to store fruit in the fridge, but did not [need to] refer to this helping avoid waste).
The use by consumers of resources such as www.lovefoodhatewaste.com and associated apps, which contain general advice and tips, but also planning tools and portion calculators etc.
Changes to products, packaging, labelling and the way food is sold, for example the availability of different sizes of bread loaves, extended shelf-life on products, clearer date labelling and storage guidance.
It is these positive actions that ultimately influence the level of food waste, and consequently it is these positive actions that needed to be better reflected in the model. Using this information, the project team sought to develop a method by which to improve the index of ‘food waste awareness’ to better represent the full spectrum of activity, including behavioural changes, that are likely to lead to less food being wasted. The new food waste reduction activity index (FWRAI) has five components. Each component is a time series that aims to capture changes in a distinct aspect of food waste reduction activity. Three of these components are derived from responses to WRAP’s consumer food waste prevention tracker survey. Specifically, the FWRAI includes measures of the proportion of respondents who state that they: plan household meals for the week
Econometric modelling and household food waste 4
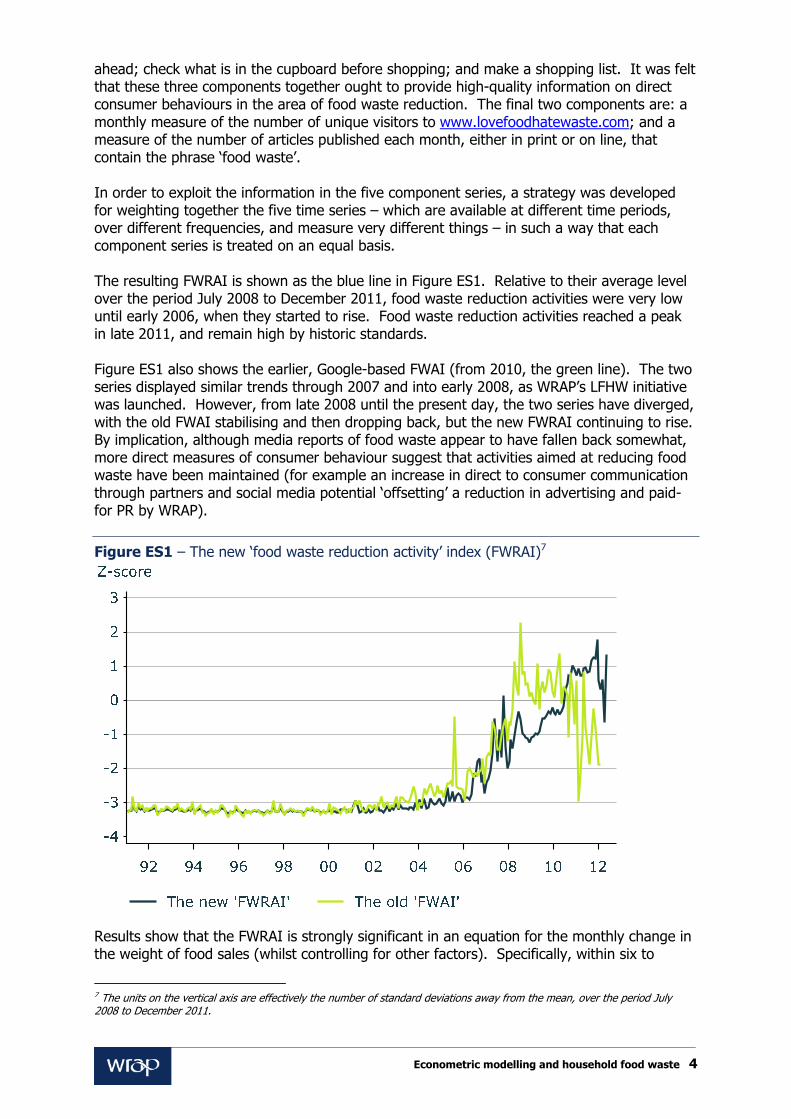
ahead; check what is in the cupboard before shopping; and make a shopping list. It was felt that these three components together ought to provide high-quality information on direct consumer behaviours in the area of food waste reduction. The final two components are: a monthly measure of the number of unique visitors to www.lovefoodhatewaste.com; and a measure of the number of articles published each month, either in print or on line, that contain the phrase ‘food waste’. In order to exploit the information in the five component series, a strategy was developed for weighting together the five time series – which are available at different time periods, over different frequencies, and measure very different things – in such a way that each component series is treated on an equal basis. The resulting FWRAI is shown as the blue line in Figure ES1. Relative to their average level over the period July 2008 to December 2011, food waste reduction activities were very low until early 2006, when they started to rise. Food waste reduction activities reached a peak in late 2011, and remain high by historic standards. Figure ES1 also shows the earlier, Google-based FWAI (from 2010, the green line). The two series displayed similar trends through 2007 and into early 2008, as WRAP’s LFHW initiative was launched. However, from late 2008 until the present day, the two series have diverged, with the old FWAI stabilising and then dropping back, but the new FWRAI continuing to rise. By implication, although media reports of food waste appear to have fallen back somewhat, more direct measures of consumer behaviour suggest that activities aimed at reducing food waste have been maintained (for example an increase in direct to consumer communication through partners and social media potential ‘offsetting’ a reduction in advertising and paid-for PR by WRAP).
Figure ES1 – The new ‘food waste reduction activity’ index (FWRAI)7
Results show that the FWRAI is strongly significant in an equation for the monthly change in the weight of food sales (whilst controlling for other factors). Specifically, within six to
7 The units on the vertical axis are effectively the number of standard deviations away from the mean, over the period July 2008 to December 2011.

Econometric modelling and household food waste 5
twelve months, a one standard deviation increase in FWRAI would lead, on average, to a 0.7% reduction in the constant price value of food purchases (the second of the two key equations presented in Table 5A of Appendix 3). This number may sound small, but if we assume that an increase in FWRAI has a similar effect on the weight of food purchases8, it would imply a reduction in the weight of food purchases, and by assumption food waste, of 230,000 tonnes per annum. This is based on detailed DEFRA data on food purchases by weight for 2011 (Defra Family Food Survey, FFS). The new FWRAI is not without its drawbacks. It is conceptually less straightforward than the old FWAI, and it could also be argued that in weighting together such a disparate set of indicators, we are failing to compare like with like. However, it is our contention that the weighting scheme employed, which is based on a purely statistical approach and yet yields intuitively sensible results, goes someway to addressing these concerns. In short, we feel that the advantages gained in drawing together information from a richer set of data outweigh the disadvantages. Understanding the influences on food waste In November 2011 WRAP announced a reduction in total household food and drink waste of 1.1 million tonnes9, which had occurred between 2007 and 2010. Avoidable food and drink waste reduced by 950,000 tonnes, and the associated value and environmental impact figures were updated10. The econometric model has been used to decompose the overall reduction in food waste between 2007 and 2010 into contributions from FWRAI, higher food prices and lower incomes relative to trend. There is no reason why the estimated contributions should sum precisely to 1.1 million tonnes (the reduction reported by WRAP in 2011). As with any econometric model, there will always be some variation in the data of interest that we cannot adequately explain. On this occasion the estimated contributions suggest a total reduction of 870,000 tonnes, suggesting that the model can account for almost 80% of the observed reduction in food waste. The model suggests that of the 1.1 million tonne reduction in food waste during the three years to 2010, 40% is attributable to an increase in factors captured by the updated FWRAI. The index is constructed to reflect the consequences of WRAP and partner activity, but may also be influenced by other wider factors.. A similar contribution of around 35% came from the impact of higher real food prices. A reduction in income relative to trend accounted for a relatively small part of the decline in food waste. This reduces both the weight of food purchases, and the proportion of food purchased that is thrown away. A reduction in income relative to trend accounted for a relatively small part of the decline in food waste. There may be an effect of factors other than food waste reduction activities within the reduction linked to the FWRAI and, similarly, the waste reduction activities captured may have been driven in part by other market factors as well as initiatives of WRAP and partners. Equally, whilst higher real food prices and reductions in income may have triggered actions to reduce food waste, it is likely that not all of these would have been realised without the food waste reduction activities enabling changes in behaviour. 8 In estimating an equation for the total weight of food purchases using annual data over the period from 1992 to 2011, one could not reject the hypothesis that the elasticity of the weight of food purchases with respect to FWRAI was the same as the elasticity of constant price expenditure on food with respect to FWRAI. See Section 3.0 for more detail. 9 New estimates for household food and drink waste in the UK, WRAP, 2011. 10 Subsequent to the updating of the econometric model WRAP published new research that revealed a 1.3 million tonne reduction in household food waste between 2007 and 2012 (see www.wrap.org.uk/household-food-waste). Given the timing of the two pieces of research, this report details analysis using the 2011 data only.

Econometric modelling and household food waste 6
As described above, there are a wide range of activities that have been carried out that aim to raise awareness of the benefits of reducing food waste, enable behaviour change and to reduce food waste arising through changes to the food bought. The new FWRAI was designed to capture, or at least reflect, more of these than the previously used FWAI, but it is difficult to capture everything. For example, changes to the way foods are packaged, labelled and sold are also likely to have led to less food waste, some of which will have required changes to consumer behaviour (e.g. choosing to purchase a particular product with re-closable packaging, and then using the functionality correctly) and some of which would not (e.g. longer shelf-life). It is inherently difficult to distinguish between the effects and causes of these types of influences on food waste. Further work may allow a more robust estimate to be made, but it will be very difficult ever to determine a precise figure in such a complex system. It is worth noting that WRAP carried out separate qualitative and quantitative analysis (peer reviewed by Databuild) to evaluate the impact related to its last Business Plan11, which concluded that a realistic estimate for the overall impact of its influence, directly and through its partners, could be around 60%. Investigating the ‘trading up’ hypothesis Earlier work in this project (2010) found tentative evidence that households ‘traded up’ as they learnt how to waste less food. This conclusion was based on the observation that increases in the original FWAI were associated with a statistically significant reduction in the weight of sales of food and drink, but had no statistically significant impact on the value of sales of food and drink. Very similar results were obtained with the new index (FWRAI). At the same time, research, presented in DEFRA’s FFS 2011, found that households appeared to ‘trade down’ in their purchases of food and drink over the period 2007 to 2011. This conclusion was based on the observation that, for many different categories of food and drink, the basket of items actually purchased tended to rise in price by less than the increase recorded by the equivalent component of the chain-weighted RPI (retail price index). The FFS methodology was used to compare the extent of any ‘trading up’ or ‘trading down’ across three food groups implied by the FFS, with that implied by data purchased from Kantar. Although the two data sources vary substantially, a similar picture emerges. Specifically, evidence of ‘trading down’ is found, according to the FFS definition, in both fruit and vegetables, and beef, with little evidence found of either ‘trading up’ or ‘trading down’ in the poultry category. These conclusions hold firm whichever data source is chosen. If anything, the extent of ‘trading down’ in both fruit and vegetables, and beef is a little larger using the Kantar data. The finding that, in aggregate, households have ‘traded down’ in their choice of food in recent years need not be inconsistent with the hypothesis that increases in food waste awareness / food waste reduction activities have caused households to ‘trade up’. In other words, without an increase in food waste awareness and reduction activities there could have been an even larger ‘trading down’ effect. Our working hypothesis is that the quality of food purchased by households will depend on a number of factors, and not just on the level of food waste awareness / food waste reduction activities. Any ‘trading up’ could have occurred in a number of different ways. It may be, for example, that consumers bought a similar basket of foods but from a different retailer, where these foods cost more or switched between food types, for example more meat, less staples; more beef, less chicken. Or it may be that they purchased grades of the same food type
11 Available at: www.wrap.org.uk/econometricmodel

Econometric modelling and household food waste 7
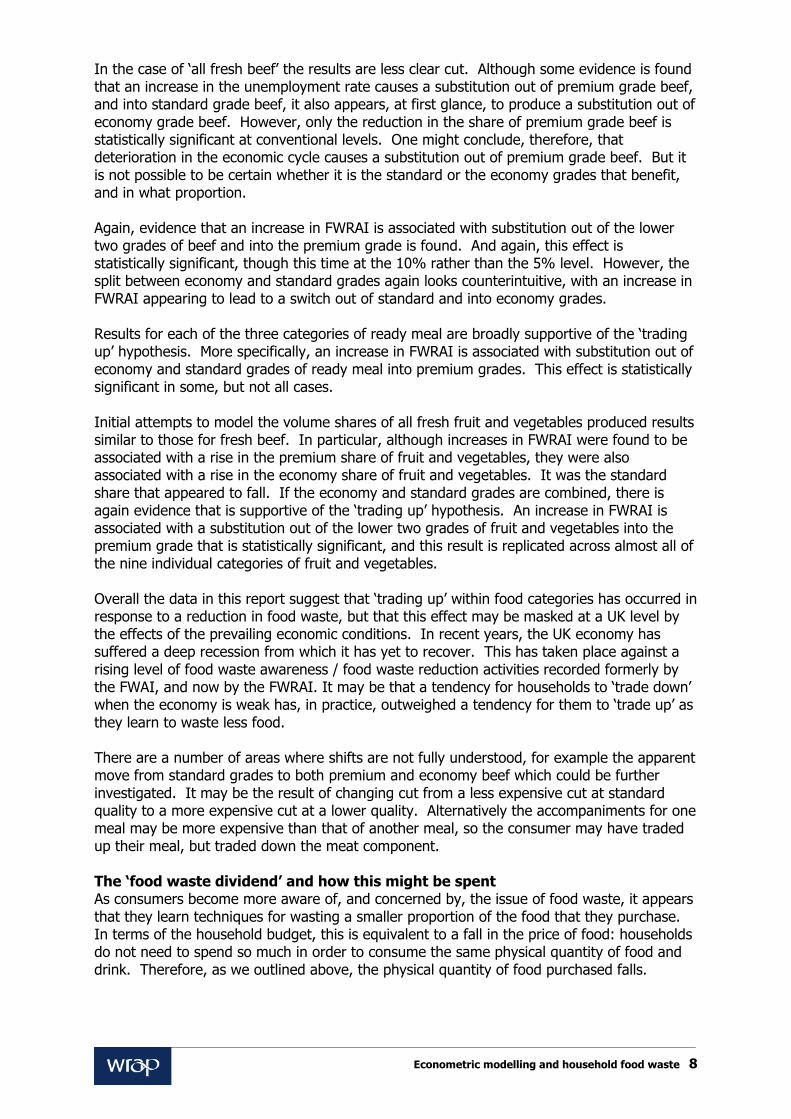
that are perceived as higher quality (for example, by switching from less expensive cuts of meat, such as chicken wings, to more expensive cuts, such as chicken breasts). In this work, we evaluate more closely the hypothesis that, by itself, an increase in food waste reduction activities leads to households ‘trading up’. To do this, we use time series data relating to sales of food (chicken, beef, ready meals, fruit and vegetables) classified according to three explicit quality grades – ‘economy’, ‘standard’ and ‘premium’, as defined (and communicated to the consumer) by retailers. We then looked for a statistically significant relationship between the FWRAI and sales of each quality grade that could be used either to support, or to refute, the ‘trading up’ hypothesis. In this report, economy, standard and premium grades are described as being of different qualities. What is important in the context of this research is that they are offered at different price points, and that the consumer perceives there to be a corresponding variation in quality. This positioning by the retailer will depend on many factors such as size and shape (for fruit and vegetables), cut (for meat), range of ingredients used, packaging materials used and provenance. A deterioration in the economic cycle, represented by an increase in the unemployment rate, is found to be associated with a substitution out of premium and standard grades into economy grades of all fresh chicken. Moreover, these effects are all individually significant to at least the 5% level. These results provide strong evidence that households ‘trade down’ in their purchases of all fresh chicken following deterioration in the economy, as one might expect. By contrast, an increase in FWRAI is associated with substitution out of economy grades of all fresh chicken into both standard and premium grades (Figure ES2). Again, these effects are all statistically significant to at least the 5% level. This behaviour would be expected if an increase in food waste reduction activities caused households to spend some of the proceeds from throwing less food away on buying better quality food. In short, the results for ‘all fresh chicken’ appear supportive of the ‘trading up’ hypothesis advanced in the earlier work (2010). Moreover, the data shows that increases in FWRAI are associated with a statistically significant shift up the value chain across all three types of fresh chicken: breast; pieces; and whole.
Figure ES2 – Impact on sales of all fresh chicken
Econometric modelling and household food waste 8
In the case of ‘all fresh beef’ the results are less clear cut. Although some evidence is found that an increase in the unemployment rate causes a substitution out of premium grade beef, and into standard grade beef, it also appears, at first glance, to produce a substitution out of economy grade beef. However, only the reduction in the share of premium grade beef is statistically significant at conventional levels. One might conclude, therefore, that deterioration in the economic cycle causes a substitution out of premium grade beef. But it is not possible to be certain whether it is the standard or the economy grades that benefit, and in what proportion. Again, evidence that an increase in FWRAI is associated with substitution out of the lower two grades of beef and into the premium grade is found. And again, this effect is statistically significant, though this time at the 10% rather than the 5% level. However, the split between economy and standard grades again looks counterintuitive, with an increase in FWRAI appearing to lead to a switch out of standard and into economy grades. Results for each of the three categories of ready meal are broadly supportive of the ‘trading up’ hypothesis. More specifically, an increase in FWRAI is associated with substitution out of economy and standard grades of ready meal into premium grades. This effect is statistically significant in some, but not all cases. Initial attempts to model the volume shares of all fresh fruit and vegetables produced results similar to those for fresh beef. In particular, although increases in FWRAI were found to be associated with a rise in the premium share of fruit and vegetables, they were also associated with a rise in the economy share of fruit and vegetables. It was the standard share that appeared to fall. If the economy and standard grades are combined, there is again evidence that is supportive of the ‘trading up’ hypothesis. An increase in FWRAI is associated with a substitution out of the lower two grades of fruit and vegetables into the premium grade that is statistically significant, and this result is replicated across almost all of the nine individual categories of fruit and vegetables. Overall the data in this report suggest that ‘trading up’ within food categories has occurred in response to a reduction in food waste, but that this effect may be masked at a UK level by the effects of the prevailing economic conditions. In recent years, the UK economy has suffered a deep recession from which it has yet to recover. This has taken place against a rising level of food waste awareness / food waste reduction activities recorded formerly by the FWAI, and now by the FWRAI. It may be that a tendency for households to ‘trade down’ when the economy is weak has, in practice, outweighed a tendency for them to ‘trade up’ as they learn to waste less food. There are a number of areas where shifts are not fully understood, for example the apparent move from standard grades to both premium and economy beef which could be further investigated. It may be the result of changing cut from a less expensive cut at standard quality to a more expensive cut at a lower quality. Alternatively the accompaniments for one meal may be more expensive than that of another meal, so the consumer may have traded up their meal, but traded down the meat component. The ‘food waste dividend’ and how this might be spent As consumers become more aware of, and concerned by, the issue of food waste, it appears that they learn techniques for wasting a smaller proportion of the food that they purchase. In terms of the household budget, this is equivalent to a fall in the price of food: households do not need to spend so much in order to consume the same physical quantity of food and drink. Therefore, as we outlined above, the physical quantity of food purchased falls.

Econometric modelling and household food waste 9
Households who waste less are left with a food waste reduction ‘dividend’. Our analysis suggests that by 2011 (the latest year for which detailed DEFRA data on purchases of food and drinks are available), 5 years after WRAP began its LFHW initiative, this ‘dividend’ may already be substantial. The reduction in food purchases implied by the increase in FWRAI since 2007 has resulted in an annual saving of £1.9 billion for UK households. The food waste reduction ‘dividend’ may be saved, or it may be spent. If it is spent, it may be spent on food and drink, or on other goods and services. If it is spent on food and drink, it would increase the value of the basket of food and drink purchased but not, according to our analysis, the physical quantity. Or, to put it another way, to the extent that the food waste reduction ‘dividend’ is spent on food and drink, it is used to ‘trade up’, from economy to standard or to premium brands. There may for instance be different ways in which groups of the population respond to wasting less food, some may choose to purchase higher value products whilst others may feel better equipped to make the most from economy products (e.g. cooking from scratch with chicken thighs which may actually have more taste than the more expensive breasts). The magnitude of the food waste reduction ‘dividend’, estimated to be equal in value to 2.1% of all expenditure on food and drink in 2011, was compared with our estimate of the increase in the value of selected baskets of food and drink that resulted from ‘trading up’ from economy, through standard to premium brands, as FWRAI rose. Although the figures vary somewhat between the different food types, in the majority of cases, it would appear that the increase in FWRAI from 2006 to 2011 led to an increase in the value of a typical basket of chicken, of beef, and of most ready meals of the order of 1.1% to 1.2%, excluding inflation. The Kantar data, therefore, suggest that around one half of the food waste ‘dividend’ was used to buy more expensive food and drinks. The conclusions derived from the research based on the Kantar data are more robust than the initial research, that could not reject the conclusion that all of that dividend was used in that way, since the Kantar data have a higher degree of granularity. It is worth noting that the original research could not reject the Kantar conclusion either. One way to reconcile the two pieces of research is to say that the granular Kantar data provide us with a “null” hypothesis, that half of the food waste dividend is used to buy more expensive food and drinks; and the aggregate data cannot reject that null hypothesis. Options for further work The greatest challenge faced in building this model was an acute shortage of data on household food waste arisings. There was only a snapshot of the quantity of many different types of food thrown away at a single point in time; namely, calendar year 200712. New data was published in November 2013, which effectively doubled the amount of information on food waste available for analysis in the model in the future. It will allow the project team both to test more rigorously and, where necessary, improve the specification of this econometric model. The model can also be used to produce projections for the weight of food waste based on different scenarios for the future weight of food purchases, economic growth and the impact of different intensities of food waste reduction activities (as measured by the FWRAI). It would be useful to explore the extent to which consumers recognise that they are saving money through wasting less, and whether there are conscious choices around ‘trading up’, 12 Subsequent to the updating of the econometric model WRAP published new research that revealed a 1.3 million tonne reduction in household food waste between 2007 and 2012 (see www.wrap.org.uk/household-food-waste), and provided updated detailed data on the food categories wasted.

Econometric modelling and household food waste 10
and also to explore how different groups of people respond to wasting less food (for example choosing to ‘trade up’ to higher value foods compared to making use of new skills or confidence to get more from ‘cheaper’ foods). As discussed in the report there are several ways people could shift food purchase patterns in response to wasting less food, and other factors such as food prices and economic conditions, which include the balance of eating in or out of home, where food is bought for in home consumption and moving between different food categories. Understanding this system better would provide useful insights not only for future work on food waste prevention but also for broader work on moving to more healthy and sustainable diets.

Econometric modelling and household food waste 11
Contents 1.0 Introduction ................................................................................................. 13
1.1 Background ............................................................................................... 13 1.2 Model structure ......................................................................................... 14
1.2.1 Food prices ..................................................................................... 14 1.2.2 Food Purchases ............................................................................... 15 1.2.3 Food waste ..................................................................................... 16 1.2.4 Challenges in developing the model .................................................. 16
2.0 Refining and developing the model ............................................................. 19 2.1 Improving the measure of food waste reduction activity ............................... 19 2.2 Summary of key assumptions ..................................................................... 24
3.0 Accounting for the past ................................................................................ 25 4.0 Developing our understanding of the relationship between food waste reduction activities and the quality of food purchased ......................................... 29
4.1 Understanding detailed purchasing behaviour .............................................. 29 4.2 Econometric approach ................................................................................ 30 4.3 Results ...................................................................................................... 32
4.3.1 Results from the chicken dataset ...................................................... 32 4.3.2 Results from the beef dataset ........................................................... 36 4.3.3 Results from the ready meals dataset ............................................... 38 4.3.4 Results from the fruit and vegetables dataset .................................... 40
4.4 Discussion ................................................................................................. 41 4.5 Food waste reduction ‘dividend’ .................................................................. 42
5.0 Summary ...................................................................................................... 45 6.0 Options for further work .............................................................................. 47 Appendix 1 - WRAP’s CFWP tracker survey ........................................................... 48 Appendix 2 - Detailed findings of relationship between food waste reduction activities and the quality of food purchased .......................................................... 49 Appendix 3 - The link between food waste reduction activities and retail sales of food ......................................................................................................................... 51 Appendix 4 - Measure of perishability ................................................................... 55 Appendix 5 – Estimated impact of FWRAI using an alternative measure of the economic cycle ....................................................................................................... 57 Appendix 6 – Econometric validity – Specification and Robustness testing ......... 58

Econometric modelling and household food waste 12
Glossary BLUE – Best Linear Unbiased Estimate CFWP – Consumer Food Waste Prevention ECO – shorthand for ‘economy’ product range FDT – shorthand for the ONS commodity grouping of food, drink and tobacco FFS – Defra Family Food Survey -
http://www.defra.gov.uk/statistics/foodfarm/food/familyfood FWAI – Food Waste Awareness Index FWRAI – Food Waste Reduction Activity Index HHFW – Household Food Waste LFHW – Love Food Hate Waste - www.lovefoodhatewaste.com ONS – Office of National Statistics o/w – shorthand for ‘of which’ PRE – shorthand for ‘premium’ product range RPI – Retail Prices Index STA – shorthand for ‘standard’ product range UVI – Unit Value Index
Econometric model – A set of statistically estimated equations and identities that together define the relationships that are believe to hold between the variables of interest. Elasticitity – In economics, the elasticity of variable x to variable y is the percentage response of variable x to a one percent change in variable y. Endogenise – A variable that is endogenous to a model depends only on variables in that model. The act of endogenising a variable is the process of making that variable endogenous by relating it to other variables in that model. Eviews – A statistical package for Windows, used mainly for time-series oriented econometric analysis. Interpolation – Statistical method by which gaps between observations in a series can be filled in. Lexis Nexis – An online research tool for business and news information from a database of over 20,000 trusted sources (http://www.lexisnexis.co.uk). Trading down / up – DEFRA FFS define ‘trading down / up’ as occurring when the deflated unit value index of a particular food group falls (rises). In the context of this work, we use ‘trading up’ to refer to consumers buying higher value (cost) food. Z-score – A measure of the extent to which, at any point in time, a series is unusually high or unusually low. It is defined as the actual value of the series, minus its sample mean, divided by its sample standard deviation.
Acknowledgements With thanks to colleagues at Defra: James Collis, Stephen Devlin and Jim Holding, and Sophie Easteal at WRAP.

Econometric modelling and household food waste 13
1.0 Introduction WRAP, working together with Fathom Consulting, has carried out extensive research into the linkages between food prices, household food purchases and household food waste, against the backdrop of a rising awareness of the issue of food waste among households. That work culminated in the development of an econometric model that has been used to derive projections for household food waste under a variety of alternative scenarios that can vary according to the assumptions made about: global economic growth; global commodity and food prices; the relative performance of the UK economy; retailer profit margins; and awareness of food waste issues13. 1.1 Background In 2009, WRAP published Household Food and Drink Waste in the UK14. This found that around 8.3 million tonnes of food and drink was thrown away each year in the UK (22% of all the food and drink purchased) and 5.3 million tonnes of this could have been consumed. WRAP announced in November 2011 a reduction in total household food and drink waste of 1.1 million tonnes between 2007 and 201015. Avoidable food and drink waste reduced by 950,000 tonnes, and the associated value and environmental impact figures were updated. Food waste prevention is a key priority for WRAP and its funders. WRAP has run a consumer food waste prevention programme, and consumer facing campaign (LFHW) since 2007. LFHW operates in all four nations of the UK, communicating directly to consumers (primarily through PR, the website and social media) to raise awareness of the benefits of reducing food waste, and providing a wide range of tools and advice. LFHW also enables a wide range of partners (for example, retailers, food brands and other businesses, local authorities, community groups) to help consumers reduce food waste by making insights, templates, toolkits and guidance available. WRAP also undertakes technical activity with the food industry, to change the retail environment (e.g. change products, packaging, labelling and the way food is sold) to help consumers waste less. In 2009, WRAP commissioned Fathom Consulting to develop an econometric model which examines the interplay between: macroeconomic factors, such as household incomes and food prices; household awareness of food waste; and the amounts of food both purchased and wasted. The main objective of the work was to better understand the relationship between the amount of food waste, awareness of food waste (as a proxy for activity aimed at helping consumers reduce food waste), food prices and spending on food (by food type). Fathom constructed an econometric model that captures key relationships in the food supply chain, including the linkages between: global food commodity prices; UK wholesale and retail food prices; food purchases; and food waste. In this model, the weight of food waste depends on the weight of food purchased (see Section 1.2), which in turn, depends, amongst other things, on income levels and food prices. It also depends on food prices, and on the level of food waste awareness among households. The model was used to quantify the impact on food waste in various food categories in a range of scenarios, including shocks to: global growth; global commodity and food prices; the relative performance of the UK economy; retailer profit margins; and publicity about food waste issues.
13 A summary of the initial research is available at: http://warrr.org/751 14 Household Food and Drink Waste in the UK, WRAP, 2009. Available at: http://www.wrap.org.uk/content/household-food-and-drink-waste-uk-2007-estimates 15 New estimates for household food and drink waste in the UK, WRAP, 2011. Subsequent to the updating of the econometric model WRAP published new research that revealed a 1.3 million tonne reduction in household food waste between 2007 and 2012 (see www.wrap.org.uk/household-food-waste).

Econometric modelling and household food waste 14
1.2 Model structure Figure 1 illustrates the structure of the model16. The key outputs of the model are estimates of: the weight of food waste by food type; the weight of food purchased; and retailer revenue from food sales. To arrive at these, the project team first needed to account for what is happening to a) overall consumer spending on goods and services (including food) and b) spending on different categories of food. These, in turn, depend on consumers’ income levels and prices (both food prices and general prices). Retail food prices depend on world food commodity prices, retailers’ profit margins, and the sterling exchange rate. Finally, global food commodity prices are determined by the balance between world demand for and supply of food, which depend among other things on the economic outlook for the global economy, conditions in commodity markets and the food supply chain.
Figure 1: The key relationships in the food prices/purchases/waste model
1.2.1 Food prices From the mid-1970s until the mid-2000s, UK retail food prices were on a long-term downward trend in comparison to the price of all goods and services bought, as measured by the Retail Price Index (RPI), see Figure 2. But this trend was interrupted during the latter part of the previous decade, reflecting a spike in an important element of costs in the food supply chain; namely, world food commodity prices. Food commodity prices are an important influence on the price of food we buy in shops and supermarkets. The econometric model captures the impact of global growth on global commodity prices, and then on retail food prices in the UK. Retail food prices reflect cost pressures on food retailers – including commodity prices. But they are also driven by other components of retailing costs, such as labour costs, energy costs, distribution / storage costs etc., which are not directly included in the model. Moreover, profit margin between food retail prices and underlying costs is not fixed: there is evidence that the profit margin increases during a boom and decreases in a recession. In the part of the model which determines food prices, fluctuations in global demand (a world recession, for example), in global food commodity supply (nature of the harvest), and in economic activity in UK, all combine to drive retail food prices. These impacts are different for different food types because the evidence is that some food commodities are more sensitive to shifts in demand and supply (and prices) than others.
16 For a full description of the AIDs model, used to estimate UK household demand for food, please refer to Appendix 1 of the summary produced of the initial research: http://warrr.org/751
UK food waste
Depends on food prices, incomes, food
type, food waste prevention activity
Global food commodity
prices
UK retail food prices
UK food purchased
Depend on global demand, harvest,
inventories interest rates
Depend on food commodity prices,
exchange rate, retailers’ margins
Depends on retail prices, incomes, food
prices, food waste awareness

Econometric modelling and household food waste 15
Figure 2: Food prices (x axis = year)
1.2.2 Food Purchases The food we buy is part of our overall spending on goods and services. In theory, total consumer spending depends on income levels, wealth, prices and the real interest rate. The share of overall spending allocated to food (and indeed to each individual food type) is sensitive to the price of food (and to the price of each individual food type) and relative to the overall prices of the goods and services we buy, as well as to levels of income and wealth. In addition, other factors are at work that influence the share of income spent on food, and on various food types. These include health concerns, which have seen purchases of red meat and of foods with high-fat or high-salt content, occupy a declining share of the food basket over time17. The model assumes that these long-term trends continue. If the pace at which people are substituting away from eating unhealthy foods were to increase, or if people’s tastes changed in some other way, then the model would be unable to predict this kind of behaviour. This model of food purchases captures these effects for different food types. Income effects on spending are also identified: for some food types, spending increases when income increases; for others, spending decreases when income increases. Food prices also influence spending patterns. The amount of food purchased decreases (for all food types) when the price of that food type increases compared to a measure of overall prices for goods and services. But the degree to which spending on particular categories of food alters when prices change depends on the sensitivity of demand to prices. For most food types, this sensitivity to price changes is low; hence the percentage change in quantity purchased is smaller than the percentage change in prices. These foods tend to be staple foods like bread and milk where the share of spending on these foods increases when prices increase. However, demand for a minority of food types is much more sensitive to price changes. Typically, these items are luxury purchases like premium brands of alcohol or smoked salmon, and for these items the decline in quantity purchased is larger than the increase in prices (in percentage terms) and the share of spending on these items decreases when prices increase18.
17 See e.g. http://www.defra.gov.uk/statistics/foodfarm/food/familyfood 18 For a more in-depth discussion of food price elasticities, please refer to: https://www.gov.uk/government/uploads/system/uploads/attachment_data/file/137726/defra-stats-foodfarm-food-price-elasticities-120208.pdf
Index, Jan 1970 = 100
Relative to the headline RPISources: Reuters EcoWin / Fathom
70 75 80 85 90 95 00 05 10
7580859095
100105110115120

Econometric modelling and household food waste 16
So the model can be used to quantify the impact on the pattern of food purchases of changes in the global economy (weaker or stronger growth, for example) tracing this through to global commodity and food prices, to retail food prices in the UK and to food spending by food type. We can also use the model to quantify the impact on food purchases under alternative scenarios, such as a stronger-than-expected recovery in the UK economy. 1.2.3 Food waste A key objective of this project has been to understand the relationship between the weight of household food waste, food prices and spending on food (by food type). The model incorporates evidence from two previous reports by WRAP19 20. Together these provide estimates of the weight of food waste in 2007, broken down by food type, and a single headline figure for the total weight of food waste in 2010. In general, the more perishable a food type, the higher the proportion that ends up as waste. The impact of ‘perishability’ on the share of purchases of a given food type that is wasted is embedded in our model (see Appendix 4). Other relevant factors are: Changes in income: as income increases, relative to trend, the quantity of food that is
purchased will tend to rise. Other things being equal, this raises food waste. Changes in price: a higher price for a given food type will tend to decrease the proportion
of that food type that is wasted. An increase in the price of food, relative to the price of other goods and services, will tend to reduce the quantity of food purchased. Other things being equal, this too will contribute to lower food waste.
Changes in food waste awareness as an economic and environmental issue, and strategies to avoid food waste.
1.2.4 Challenges in developing the model Detailed data on purchases of many different types of food, measured both by weight, and by cash amount spent, are contained in DEFRA’s annual Family Food Survey (FFS). When research work for this project was completed, these data covered the period from 1974 to 2011. Because the FFS contains information on both the weight, and the value of food purchases, it is possible to construct a set of annual indices measuring the implied price of each different type of food recorded in the report. Moreover, other more timely estimates of food prices are published monthly by the ONS in their Consumer Prices press release21. Although data on both food purchases and food prices are plentiful, data on food waste are not. Specifically, there is detailed data on the amount of food that is wasted, broken down by food type, at just a single point in time; namely, calendar year 2007. An absence of detailed time series data on food waste, broken down by food type, was perhaps the single greatest challenge that was faced in constructing this model. With only a snapshot of food waste at a single point in time, it was not possible to use conventional time series econometric techniques to examine the impact of, for example, changes in the price of food through time on food waste. Instead, the project team set out to gauge the impact of changes in the price of food on food waste by exploiting the cross-sectional nature of WRAP’s food waste dataset. Although there is detailed information on the amount of food that is wasted at just a single point in time, there is also information on the amount of many different types of food that is wasted, at that single point in time. There is also information on the price of each of those different types of food. After controlling for the impact of perishability on food waste (see Appendix 4), a clear, negative relationship was found between the price of a given type of food, and the proportion of that
19 Household Food and Drink Waste in the UK, WRAP, 2009. 20 New Estimates for Household Food and Drink Waste in the UK, WRAP, 2011. 21 http://www.ons.gov.uk/ons/publications/all-releases.html?definition=tcm:77-22462%3F

Econometric modelling and household food waste 17
type of food that is thrown away. Food that has a high unit price, in terms of pence per gramme, and a long shelf-life, is much less likely to be thrown away than food that has a low unit price, and a short shelf-life. An indirect approach was used to estimate the impact of changes in public awareness of the issue of food waste, on the amount of food waste. In the early stages of this project a simple count of the number of times in each month the phrase ‘food waste’ appeared in news articles, as measured by Google News, was used as a proxy for food waste awareness, and termed the food waste awareness index (FWAI). Initial analysis22, using the model, found that an increase in the FWAI led to a statistically significant fall in the weight of retail sales of food, drink and tobacco. It was assumed that this reduction in the weight of food purchases, as food waste awareness rises, occurs purely because people are wasting less food. In other words, that the reduction in food waste due to an increase in food waste awareness matches one-for-one the reduction in food purchases due to that same increase in food waste awareness (i.e. as people waste reduced amounts of food, they buy correspondingly lower amounts of food). It is not possible to be certain that it is the increase in FWAI that led directly to a reduction in the weight of food purchases. The correlation found back in 2009 may just have been a statistical coincidence. Nevertheless, as discussed in Section 2.0, subsequent work found that the correlation held up well over the period from 2009 up to 2012, which provides some additional support. Nor, of course, can we be sure that the reduction in food purchases associated with an increase in FWAI is precisely equal to the reduction in food waste, though it does have strong intuitive appeal. There are of course other factors that could lead to less food being purchased (in home), such as eating more food out of home or eating less generally, as a result of consumers economising, or in response to anti-obesity / health campaigns. Analysis of the amounts and value of food purchased by consumers out of home (see Figure 3) shows that the weight of food eaten away from home has actually drifted down over the past few years, in line with the weight of food purchased for consumption in the home (from ca. 2007). This does not suggest that any reduction in food purchased for in home consumption has occurred due to a shift to more out of home consumption. Similar analysis was reported by WRAP in 201123. This model identifies explicitly the reduction in the weight of food purchased for consumption in the home that is associated with the increase in FWAI and the new FWRAI (see Section 2.1 and Appendix 3). So we can be confident that the reduction is unrelated to any change in purchases of food for consumption outside the home, and is unlikely to be related to other factors such as changing consumption in response to health trends. There is an alternative scenario regarding the relationship between food purchases and food waste, which would suggest that as consumers buy less food, and potentially different types of food (perhaps in response to rising costs, reduced budgets and/or responses to health messages) they automatically waste less food, especially if the amounts of perishable food purchased are reduced. Whilst this may hold true in some cases, the weight of WRAP evidence obtained to date24 suggests that the driving factor is much more likely to be a reduction in waste (as awareness is raised, consumers change behaviour and industry makes
22 A summary of the initial research is available at: http://warrr.org/751 23 New Estimates for Household Food and Drink Waste in the UK, WRAP, 2011. 24 Attribution paper & New Estimates for Household Food and Drink Waste in the UK, WRAP, 2011. Available at: www.wrap.org.uk/econometricmodel

Econometric modelling and household food waste 18
changes to products, packaging and labelling that enables this reduction in waste) leading to a reduction in purchases, rather than the opposite.
Figure 3: Weight of food and drink purchased
At the end of 2013, WRAP will receive a further detailed set of data on food waste broken down by type of food25, almost doubling the amount of information available on UK household food waste arisings. It will provide a good opportunity to evaluate more fully, and where necessary further refine, this econometric model. Our original econometric evidence suggested that media coverage of food waste has a statistically significant impact on food purchasing behaviour (and hence food waste). More precisely, a doubling in media coverage of food waste was found to reduce the weight of food purchased by 8.5% in the long term. But, interestingly, no evidence was found that heightened awareness of food waste had a statistically significant impact on the revenue from food sales26. Taken together, these effects suggest that as consumers become more aware of food waste, they find more ways to avoid wasting food and the amount of food purchased declines. Although consumers spend the same amount of money on food, they purchase a smaller amount because less of what they purchase is wasted27. One interpretation of this finding is that, as consumers find more ways to avoid waste, they change their purchasing behaviour and buy smaller quantities of more expensive food, which is a form of ‘trading up’.
25 Subsequent to the updating of the econometric model WRAP published new research that revealed a 1.3 million tonne reduction in household food waste between 2007 and 2012 (see www.wrap.org.uk/household-food-waste), and provided updated detailed data on the food categories wasted. 26 Note that the modelling takes into account the impact of changes in food prices and incomes. 27 The reduction in the quantity of food purchased is in effect a lower bound for the reduction in food waste that might occur following an increase in media coverage of food waste as a social and environmental issue. It could be that not all of the savings from wasting less food are ploughed back into purchasing a smaller quantity of food.
Econometric modelling and household food waste 19
2.0 Refining and developing the model Work was carried out to review the robustness of the model and identify areas in which it could be improved. 2.1 Improving the measure of food waste reduction activity As outlined above, in the original econometric model, food waste awareness, as an indicator of food waste reduction activity, was measured by the FWAI. This index had a single input, namely the number of times the phrase ‘food waste’ appeared in news articles captured by the Google News service in a given month. Increases in this index were associated with a reduction in the weight of food purchased, and this association was statistically significant. Nevertheless, it was felt that press mentions of food waste were conceptually quite far removed from both the positive actions taken by consumers in seeking to reduce their own food waste, and the activity by WRAP and partners aimed at helping consumers to reduce food waste. It is important to recognise first that the mainstream media is only one channel by which consumer awareness of the issue of food waste can be raised, and second that raising food waste awareness is just one step along the line to reducing actual food waste. Activities that would not be picked up by Google, and would therefore not be incorporated into the model include: Direct engagement with consumers, through advertising, by WRAP staff, local authorities,
food businesses (membership events, staff engagement, in store activities). Any routine or on-going communication from retailers and others, for example via retailer
and local authority magazines, through a wide range of partner websites and newsletters (e.g. www.netmums.com, www.moneysavingexpert.com). This could be explicitly about food waste / linked to LFHW or not (for example the ‘5 a day’ campaign carried messaging to store fruit in the fridge, but did not [need to] refer to this helping avoid waste).
The use by consumers of resources such as www.lovefoodhatewaste.com and associated apps, which contain general advice and tips, but also planning tools and portion calculators etc.
Changes to products, packaging, labelling and the way food is sold, for example the availability of different sizes of bread loaves, extended shelf-life on products, clearer date labelling and storage guidance.
It is these positive actions that ultimately influence the level of food waste, and consequently it is these positive actions that we would like to be reflected in the model. Using this information, the project team sought to develop a method by which to improve the index of ‘food waste awareness’ to better represent the full spectrum of activity, including behavioural changes, that are likely to lead to less food being wasted. The most useful measure - direct measurement of food waste - is costly and technically challenging, meaning it cannot be carried out very often. Therefore, a number of possible datasets were considered. In addition to estimating changes in household food waste (data available for 2007 and 2010 at a UK level), WRAP carries out a twice yearly consumer survey to track key attitudes, knowledge and behaviours, and approximately every two years, a survey of factors thought to influence food waste for key food categories across UK retailers (200928 and 201129 data available).
28 http://www.wrap.org.uk/content/helping-consumers-reduce-food-waste-retail-survey-2009-0 29 http://www.wrap.org.uk/content/helping-consumers-reduce-food-waste-retail-survey-2011

Econometric modelling and household food waste 20
These data were used to construct a new Food Waste Reduction Activities Index (FWRAI). This index exploits information from a wider range of sources than Google News, and in so doing builds up a more direct measure of the activity by WRAP and partners aimed at helping consumers to reduce food waste and the positive steps taken by households to reduce food waste. It builds on work undertaken by WRAP (described above) to show: How WRAP and its partners’ work has led to, or influenced, much of the media coverage
on food waste during this period. That a significant proportion of the work undertaken by WRAP and its partners, to help
consumers reduce food waste, would not have been captured or represented by just looking at media mentions.
However, whilst the index is constructed to reflect the consequences of WRAP and partner activity, it may also be influenced by other wider factors. The new FWRAI has five components. Each component is a time series that aims to capture changes in a distinct aspect of food waste reduction activity. Three of these components are derived from responses to WRAP’s Consumer Food Waste Prevention tracker survey (Appendix 1) (Figure 4). Specifically, the FWRAI includes measures of the proportion of respondents who state that they: plan household meals for the week ahead; check what is in the cupboard before shopping; and make a shopping list. It was felt that these three components together ought to provide high-quality information on direct consumer behaviours in the area of food waste reduction30. The final two components are: a monthly measure of the number of unique visitors to www.lovefoodhatewaste.com (Figure 5); and a measure of the number of articles published each month, either in print or on line, that contain the phrase ‘food waste’. For the purpose of constructing the FWRAI, we chose to move away from Google News to a searchable register of news articles provided by Lexis Nexis (Figure 6).
Figure 4: Behavioural results from CFWP tracker
30 For other behaviours relevant to whether food is wasted or not, such as portion control and using leftovers, changes in how the questions were constructed in the WRAP survey makes comparison over the key time period of interest difficult.
Share reporting behaviour, per cent
Check cupboard Make list Plan weekly shop
08 09 10 11 12
35404550556065707580

Econometric modelling and household food waste 21
Figure 5: Website visitors
Figure 6: Articles containing the phrase ‘food waste
Some of the five component series have a long history and are available at a monthly frequency, while others have a much shorter history, and are available only at semi-annual frequency. Specifically, the Lexis Nexis-based measure of the number of articles appearing in UK publications31 containing the phrase ‘food waste’ is available monthly from January 2000. By contrast, the CFWP tracker survey is conducted only twice each year, starting in October 2008. In order to exploit the information in the five component series, a strategy was developed for weighting together the five time series, which are available at different time periods, over 31 The restriction to UK-only media is designed to get around the fact that the number of global media outlets tends to rise over time, which would otherwise bias any series (including “food waste”) towards stronger growth, even if the “true” level of public awareness of the relevant phrase is unchanged. We also examined UK national newspapers only, and found a slightly more pronounced upwards trend over time than for all UK publications – though the general pattern of an upwards shift during 2007 (albeit in a more noisy series with a much lower mean) was maintained.
Number of articles in UK media per month, from Lexis Nexis
00 01 02 03 04 05 06 07 08 09 10 11 120
50100150200250300350400450500

Econometric modelling and household food waste 22
different frequencies, and measure very different things. The approach taken was first to convert the three semi-annual series to a monthly frequency using the EViews econometrics package. The process, known as interpolation, essentially works by filling in the gaps between observations according to a rule32. The next stage was to transform the five, now monthly series, to make them comparable. This was done by calculating a ‘z-score’ for each series. A z-score is a measure of the extent to which, at any point in time, a series is unusually high or unusually low. It is defined as the actual value of the series, minus its sample mean, divided by its sample standard deviation. The mean and the standard deviation of the five component series were calculated over a common sample period, namely from July 2008 to December 2011. This ensures that each component series is treated on an equal basis. The five ‘z-scores’ are then weighted together to form the FWRAI. It is assumed that any reduction in food purchases that occurs alongside an increase in FWRAI is a measure of the extent to which households have learnt how to waste less food. Consequently, the weights are determined according to the ability of each component series to explain reductions in food purchases33. The resulting FWRAI is shown as the blue line in Figure 734. The units on the vertical axis are effectively the number of standard deviations away from the mean, over the period July 2008 to December 2011. Figure 7 shows that, relative to their average level over the period July 2008 to December 2011, food waste reduction activities were very low until early 2006, when they started to rise. Food waste reduction activities reached a peak in late 2011, and remain very high by historic standards. Figure 7 also shows the old, Google-based FWAI. For ease of comparison, this index has also been transformed into a z-score. The two series displayed similar trends through 2007 and into early 2008, as WRAP’s LFHW initiative was launched. However, from late 2008 until the present day, the two series have diverged, with the old FWAI stabilising and then dropping back, but the new FWRAI continuing to rise. By implication, although media reports of food waste appear to have fallen back somewhat, more direct measures of consumer behaviour reflect that activities aimed at reducing food waste continued to rise (for example an increase in direct to consumer communication through partners and social media). This suggests that the new FWRAI is an improvement over the ‘one dimensional’ FWAI, in that it appears to more accurately reflect how the strategy to reduce food waste changed over time (for example a move away from ‘paid for’ advertising and PR to more delivery via partners). The results show that the FWRAI is significant at the 10% level in an equation for the monthly growth in food sales weights (whilst controlling for other factors). Specifically, within six to twelve months, a 1 standard deviation increase in FWRAI would lead, on average, to a 0.7% reduction in the constant price value of food purchases (the second of the two key equations presented in Table 5A of Appendix 3). This number may sound small, but if we assume that an increase in FWRAI has a similar effect on the weight of food purchases35, it 32 The use of interpolation brings its own difficulties. It forces the investigator to make assumptions about the behaviour of a series during periods where there are no observations. Nevertheless, we felt that the advantages of using survey data that ask directly about behaviours likely to be strongly associated with reductions in food waste outweighed these disadvantages. The use of interpolation means that the resulting FWRAI will be measured with error. Measurement error in variables that appear on the right-hand side of an OLS regression will raise the standard error that applies to each of the estimated coefficients, yet by itself ought not to cause bias in the estimated coefficients. 33 Specifically, the weights we use are the t-statistic attached to each z-score variable in a regression of the growth in food sales weights on the z-score variable, and other likely determinants of food sales weights, such as food prices and household incomes. An alternative approach would be to use the actual coefficient attached to the z-score variable. In practice, this would return the same ordering of the five z-score variables. 34 The maximum period for which all five elements of the FWRAI are available is July 2008 to December 2011. Outside of this period, we include as many of the elements as possible, adjusting the weights accordingly so that they still sum to one. 35 In estimating an equation for the total weight of food purchases using annual data over the period from 1992 to 2011, one could not reject the hypothesis that the elasticity of the weight of food purchases with respect to FWRAI was the same as the elasticity of constant price expenditure on food with respect to FWRAI. See Section 3.0 for more detail.

Econometric modelling and household food waste 23
would imply a reduction in the weight of food purchases, and by assumption food waste, of 230,000 tonnes per annum. This is based on detailed DEFRA data on food purchases by weight for 2011. More detail on the link between food waste reduction activities and retail sales of food can be found in Appendix 3. It might be argued that the original FWAI, based purely on a search of articles indexed by Google News, at least had the virtue of simplicity. The new FWRAI, by contrast, weights together a range of indicators, some of which reflect stated consumer behaviour and one action potentially triggered by a raised awareness of the benefits of reducing food waste (number of visitors to the LFHW website). For example, one might view publication of a newspaper article describing efforts by WRAP to encourage less household food waste as the first step in a process. The article might in turn produce an increase in the number of visitors to www.lovefoodhatewaste.com. The end result might be that a greater number of households take positive actions to reduce food waste. This sequence of events might unfold over a period of hours, days, weeks or even months. In a sense then, in constructing FWRAI we are not comparing like with like. However, it is our contention that, by transforming each series into a z-score, and by constructing the weights according to the ability of each transformed series to explain changes in food purchases, we have gone some way to addressing these concerns. We are, moreover, encouraged by the logical ordering that emerges – with the greatest weight attached to those series that are most closely identified with actual behaviours.
Figure 7: The new ‘food waste reduction activity’ index (FWRAI)

Econometric modelling and household food waste 24
2.2 Summary of key assumptions The latest version of our econometric model of household food waste makes the following key assumptions: The total weight of household food and drink purchased depends positively on real
household incomes relative to trend and negatively on real food prices relative to trend. The model also incorporates long-term influences on purchases by weight of eighteen different categories of food and drink. These long-term influences will include, among other things, demographics and attitudes to healthy eating. If there is a major shift in one of these trends, for example if population growth slows, or if there is a change in tastes away from purchases of one particular type of food or drink, then the user will need to intervene in order to keep model forecasts on track.
The quantity of each different category of food and drink that is wasted varies in proportion to the quantity of that type of food and drink that is purchased, other things being equal. For example, other things being equal, if the quantity of meat that is purchased rises by 10%, then the weight of meat that is wasted will also rise by 10%. But the ‘other things being equal’ caveat is an important one. The model also stipulates that the proportion of each type of food or drink purchased that is thrown away varies in response to changes in the real price of that type of food or drink, and to changes captured in the FWRAI described in Section 2.1 of this paper. Our econometric work suggests that the elasticity of food waste with respect to the real price of food is around 0.536. That means, other things being equal, a 10% increase in the price of meat, relative to the price of other goods and services, will lead to a 5% reduction in the quantity of meat that is thrown away. We also find that a one standard deviation increase in the FWRAI leads ultimately to a 0.7% reduction in the weight of food that is purchased. We assume that the reduction in food waste due to an increase in FWRAI matches tonne for tonne, the reduction in food purchases.
36 This estimate appears to be reasonable. Although not directly comparable, there are examples of studies that attempt to estimate the elasticity of food consumption. a recent study for Defra by the University of Reading, Estimating Food and Drink Elasticities, did not obtain statistically significant estimates of the elasticity of food consumption with relation to food prices (https://www.gov.uk/government/uploads/system/uploads/attachment_data/file/137726/defra-stats-foodfarm-food-price-elasticities-120208.pdf). A US study found that elasticities for the demand for food and non-alcoholic beverages with respect to food prices ranged between 0.27 and 0.81 (in absolute terms ) (https://www.gov.uk/government/uploads/system/uploads/attachment_data/file/137726/defra-stats-foodfarm-food-price-elasticities-120208.pdf )

Econometric modelling and household food waste 25
3.0 Accounting for the past Econometric models are often used in an attempt to explain why events in the past turned out as they did. As set out in Section 1.2, estimates of household food and drink waste across the UK were last updated in 2009 (8.3 million tonnes annually; referring to levels in 2007). This established a UK baseline against which progress could be measured. WRAP commissioned Resource Futures to determine an updated estimate for local authority collected household food waste, based on the most recent compositional studies and WasteDataFlow data, and to estimate the change since 200737. WRAP has used this as a basis for updating the estimate for the overall levels of household food and drink waste in the UK. The approach taken and the new estimates have been peer reviewed, and updated in the light of these comments. The reduction in annual UK household food and drink waste between 2007 and 2010 was around 1.1 million tonnes, or around 13%. The new estimate was 7.2 million tonnes annually, or equivalent to around a fifth of all food and drink purchased38. In this section we ask whether the model can shed light on the reasons behind this reduction. Within the framework set out in Section 1.2, the economic drivers of food waste can be split into two broad groups: Factors that together determine the quantity of food that is purchased. Factors that together determine the proportion of food purchased that is thrown away
Two major determinants of the quantity of food that is purchased are household incomes, and food prices relative to the prices of other goods and services that households buy. As we set out in the preceding section, another important influence on the weight of food purchases is FWRAI – our Food Waste Reduction Activities Index. It is our maintained hypothesis that increases (decreases) in FWRAI reduce (raise) the quantity of food purchased, simultaneously reducing (increasing) food waste by the same amount. We could estimate the sensitivity of the weight of total food purchases to changes in income and to changes in prices – these sensitivities are often referred to as ‘elasticities’ – by weighting up the elasticities implied by each of our 18 individual food and drink purchase equations. An alternative approach is to estimate a single equation for total food purchases, and take the elasticities directly from this single equation. If the focus, above all, is on the total weight of food purchases, and the total weight of food waste, it is most efficient, statistically, to take this alternative approach. That is because each of the 18 pairs of elasticities obtained for the 18 different categories of food and drink will come with its own estimation error. By weighting together the 18 pairs of elasticities, the risk is that the errors surrounding the calculated overall elasticity of the total weight of purchases, with respect to economic activity and to food prices, will increase in size. In estimating an equation for the total weight of food purchases using annual data over the period from 1992 to 2011, one could not reject the hypothesis that the elasticity of the weight of food purchases with respect to FWRAI was the same as the elasticity of constant price expenditure on food with respect to FWRAI. By contrast, we found that the elasticities of the weight of food purchases with respect to incomes and to food prices were significantly less than the elasticities of constant price expenditure on food. We were not surprised by this result. As incomes rise, or as food 37 New Estimates for Household Food and Drink Waste in the UK, WRAP, 2011. 38 Subsequent to the updating of the econometric model WRAP published new research that revealed a 1.3 million tonne reduction in household food waste between 2007 and 2012 (see www.wrap.org.uk/household-food-waste), providing a new UK estimate of 7.0 million tonnes.

Econometric modelling and household food waste 26
prices fall, individuals are likely to trade up, and buy more expensive food, raising their constant price expenditure on food. They may, at the same time, make little or no adjustment to the weight of food actually purchased39. In trying to account for changes in food waste that have occurred in the past, we are often faced with a dilemma. In order to estimate the change in food waste due to the influence that changes in household income and changes in food prices have on the weight of food purchases, we are implicitly using our model to predict the change in the weight of food purchases. However, at the time we undertake this analysis, we are likely already to have an estimate of the actual change in food purchases over the relevant time period from the DEFRA Family Food Survey. In short, we will have two estimates of the change in food purchases – one from DEFRA and one from our model. And it is unlikely that they will be the same40. In Table 1 below we try to account for the 1.1 million tonnes reduction in food waste over the period 2007-2010. We split the drivers into the two groups set out above: factors that influence the quantity of food purchased; and factors that influence the proportion of food purchased that is thrown away. Because we have two alternative measures of the change in food purchases, we need to use some judgment when it comes to estimating the impact of the first set of factors41. Of the 1,100,000 tonne reduction in food waste during the three years to 2010, we estimate that 40% is attributable to an increase in factors captured by the updated FWRAI. The index is constructed to reflect the consequences of WRAP and partner activity, but may also be influenced by other wider factors. The other major contributor was the change in food prices. Food prices affect food waste through two distinct channels: they influence the quantity of food purchased; and they influence the proportion of food purchased that is thrown away. We find that the second of these two channels is more powerful than the first, and estimate that, by reducing the proportion of food purchased that was thrown away, the increase in food prices over the period 2007-2010 accounted for a reduction in food waste of 35%.
39 With fewer than 20 years of annual data, the elasticities of the weight of food purchases with respect to real income and to real food prices were poorly determined, with the latter insignificant at conventional levels, though correctly signed. As the model is currently specified, we have used an elasticity of 0.10 with respect to real income relative to trend, and -0.05 with respect to real food prices relative to trend. There is necessarily some degree of uncertainty with respect to these two parameters. Nevertheless, with the weight of food purchased showing much less cyclical variation than constant price expenditure on food, we can be confident that these elasticities are significantly less than the estimates of 0.4 and -0.3 obtained from the monthly retail sales equation. 40 Over the period 2007-2010, our model predicted a fall of 1.1% in the weight of food purchases due to changes in FWRAI alone. However, according to DEFRA data, that is more or less exactly equal to the total change in the weight of food purchases that occurred over that period. If we take the DEFRA data at face value, that means that changes in household incomes, and in food prices, must have contributed nothing to the change in food purchases, and by extension nothing to the change in food waste. However, over that three-year period household incomes fell relative to trend, and food prices rose relative to trend. According to our model, these two factors should therefore have reduced food purchases, and by extension food waste, by around 0.1% in each case. 41 Whether we take the DEFRA data at face value, or whether we use the model estimate of the change in food purchases, the estimated impact of changes in income relative to trend, and of changes in food prices relative to trend, are both small. Consequently, for these two factors, we report the simple averages of the two estimates.

Econometric modelling and household food waste 27
Table 1: Accounting for the reduction in food waste, 2007-2010 Thousands of tonnes per annum
Food waste in 2007 8300 Food waste in 2010 7200
Change -1100
Amount due to change in quantity of food purchased -60 o/w because of a change in earnings relative to trend -30
o/w because of a change in food prices relative to trend -30
Amount due to a change in the proportion of food purchased that is thrown away -810
o/w because of a change in FWRAI -420 o/w because of a change in real food prices -390
Other unidentified factors -230
With any econometric model, there will always be some variation in the variable of interest that we cannot adequately explain. Looking at all of the factors together, we find that on this occasion our model can account for a reduction in food waste of 870,000 tonnes over the period 2007-2010 – that is around 80% of the total. Other factors not captured by the model will also influence household food waste. These include changes to the way foods are packaged, labelled and sold, some of which will have required changes to consumer behaviour (e.g. choosing to purchase a particular product with re-closable packaging, and then using the functionality correctly) and some of which would not (e.g. longer shelf-life). What can be said from the above about the role that WRAP and partners have played in reducing food waste? One approach would be to view WRAP and partner activity as the driver of changes in FWRAI. On that basis, it could be argued that the activities of WRAP and partners can account for some 40% of the reduction in food waste over the period 2007 to 2010. Some might view this figure of 40% as an underestimate, on the grounds that not all of the activities by WRAP and partners, such as encouraging supermarkets to increase the shelf-life of their products or improving freezing guidelines, will not be picked up by FWRAI as it is currently constructed. In absence of variables in the model to capture these activities it is likely that omitted variable bias has occurred as these other activities (such as increased shelf life and better freezing guidelines) are, based on WRAPs research, likely to contribute to reductions in food waste42. Excluding variables that capture the effects of the changes will result in a regression model that is not correctly specified. The result is that the error term (or the proportion of the reduction in food waste not explained by model) will be inflated and the coefficients of the included variables may be biased upwards or downwards, depending on the relationship between the included variables and the omitted variables. It is also conceivable that, by showing households how to waste less food, WRAP was able to make the proportion of food that is thrown away more sensitive to changes in the price of food at a time when food prices were increasing rapidly. Whilst economic factors will have acted as a driver for changes in behaviour, it is very likely that the full extent (of the 35%) would not have been seen without people having awareness raised that reducing food waste 42 See WRAP’s attribution report, available at: www.wrap.org.uk/econometricmodel; and, for example: http://www.wrap.org.uk/content/impact-using-your-fridge-and-freezer-more-effectively; http://www.wrap.org.uk/content/milk-model-simulating-food-waste-home-0

Econometric modelling and household food waste 28
could contribute to saving money (as opposed to for example buying lower cost food), and having access to the kinds of simple tips and advice provided by WRAP and its partners. For the most part, the model does not explicitly capture the potential alteration in the sensitivity of the change in the weight of food that is wasted in response to changes in real food prices in the presence of changes in food waste reduction activities. This is because the relationship between changes in food waste in response to changes in real food prices was estimated using 2007 data43, before many food waste reduction activities started. It can therefore be argued that if increased food waste reduction activities increased the sensitivity of food waste to real food prices (due to consumers having access to the kinds of simple tips and advice provided by WRAP and its partners) it is likely that some of the proportion of the reduction in food waste not explained by other factors can be attributed to WRAP and partner activities. Some might however argue that this figure of 40% is an overestimate, on the grounds that other factors might have driven at least some of the increase in FWRAI. Whilst part of the index, monitoring visits to the LFHW site, could be seen as more directly attributable to WRAP and partners; other parts capture changes in consumer behaviour that are likely to have been influenced by a number of other factors. For example, it might be that the severity of the economic downturn that took place between 2007 and 2010 led households to take positive steps to waste less food independently of advice given by WRAP and partners. Although it is hard for us to be certain either way, it is worth noting that we were able to find a close statistical relationship between cumulative expenditure by WRAP aimed at reducing household food waste and the FWRAI. We found no such relationship between simple time series measures of the severity of the economic downturn44. We regard this as tentative evidence that the increase in FWRAI over the period 2007 to 2010 was largely driven by the activities of WRAP and partners, rather than by the economic downturn. However, there is insufficient evidence to be certain. Further work may allow a more robust estimate of the impact of the activities of WRAP and partners to be made, but it will be very difficult ever to determine a precise figure in such a complex system.
43 This was necessary as we did not have detailed food waste data for any of the years under investigation other than 2007. 44 More formally, we were able to model FWRAI as a function of the stock of past expenditures by WRAP aimed at reducing food waste, where the impact of past expenditures was assumed to decay with the passage of time. The constructed stock variable was statistically significant. We then tried adding separately a survey-based measure of the perceived improvement in household finances over the past twelve months, and the headline unemployment rate to that model. Neither of these two measures of the economic cycle were statistically significant.

Econometric modelling and household food waste 29
4.0 Developing our understanding of the relationship between food waste reduction activities and the quality of food purchased
Earlier work in this project45 found tentative evidence that households ‘traded up’ as they learnt how to waste less food. This conclusion was based on the observation that increases in the original FWAI were associated with a statistically significant reduction in the weight of sales of food and drink, but had no statistically significant impact on the value of sales of food and drink. As we set out in Appendix 3, very similar results were obtained with the new Food Waste Reduction Activity Index, or FWRAI. At the same time research presented in DEFRA’s FFS 2011, found that households appeared to ‘trade down’ in their purchases of food and drink over the period 2007 to 2011. This conclusion was based on the observation that, for many different categories of food and drink, the basket of items actually purchased tended to rise in price by less than the increase recorded by the equivalent component of the chain-weighted RPI. In this section, we evaluate more closely the hypothesis that, by itself, an increase in food waste reduction activities leads households to ‘trade up’. To do this, we use time series data relating to sales of food classified according to three explicit quality grades – ‘economy’, ‘standard’ and ‘premium’, as defined (and communicated to the consumer) by retailers. We then looked for a statistically significant relationship between the FWRAI and sales of each quality grade that could be used either to support, or to refute, the ‘trading up’ hypothesis. The finding that an increase in food waste awareness was associated with a significant reduction in the weight of retail sales of food drink and tobacco, but with no significant change in the value of those sales, could be explained in a number of ways. It may be, for example, that consumers bought a similar basket of foods but from a different retailer, where these foods cost more. Or it may be that they purchased grades of the same food type that are perceived as higher quality (for example, by switching from less expensive cuts of meat, such as chicken wings, to more expensive cuts, such as chicken breasts). In this part of the report, the hypothesis that in learning how to waste less food, consumers spend some or all of the savings on purchasing food that is labelled explicitly by the retailer as having a higher quality, is tested. 4.1 Understanding detailed purchasing behaviour Four datasets relating to household purchases of four distinct categories of perishable food were used. The datasets were purchased by WRAP from Kantar46, a consumer research organisation; data are based on a panel of up to 30,000 UK households. The contents of each dataset are summarised in Table 2. The four datasets vary according to the level of detail provided. All four datasets provide information on purchases, both by weight and by value, classified according to one of three quality grades. And each dataset contains information on a number of different food types. For example, the ‘beef’ dataset contains information on purchases of frying steak, stewing steak, roasting joints and mince in addition to a headline figure for all beef. The chicken dataset is the richest, however, as the data are further broken down to record purchases from each of six different retailers. The data are presented on a ‘four-week ending’ basis and are not seasonally adjusted. Before conducting any empirical analysis, first the four-week ending data were converted to a monthly frequency, using a process of interpolation, and then were seasonally adjusted.
45 See: http://warrr.org/751 46 http://www.kantarworldpanel.com/en

Econometric modelling and household food waste 30
Table 2: Description of Kantar datasets47 Dataset Food types Food grades Retailer Chicken Fresh chicken breast Economy Asda Fresh whole chicken Standard Morrisons Fresh chicken pieces Premium Tesco Frozen chicken
breast Waitrose
Frozen whole chicken Sainsbury’s Frozen chicken
pieces The Co-operative
Beef Fresh frying steak Economy No detail Fresh stewing steak Standard Fresh roasting joints Premium Fresh mince Ready meals Fish-based Economy No detail Meat-based Standard Vegetarian Premium Fresh produce Apples Economy No detail Cabbage Standard Carrots Premium Grapes Lettuce Onions Potatoes Strawberries Tomatoes 4.2 Econometric approach In order to avoid the need to model the absolute quantity of, for example, fresh chicken breasts that were purchased, which might depend on the price of many substitute products, instead the share of purchases of each quality grade of fresh chicken breasts in total purchases of all three quality grades of fresh chicken breasts, in a three-equation system was modelled. The prior hypothesis was that the share of purchases of each quality grade of product x in total purchases of all three quality grades of product x, should depend on: a measure of the economic cycle, with higher quality products being chosen preferentially
in a ‘boom’, and lower quality products being preferred in a ‘slump’; the price of each quality grade relative to other quality grades; and potentially, the FWRAI.
The claimant count unemployment rate was used as a measure of the economic cycle48. A lagged dependent variable was also included on the right-hand side of each equation in acknowledgment of the fact that adjustment to a change in any of the key economic drivers is unlikely to occur within a single month.
47 For each individual food group, type, grade and retailer, separate time series are available for: weight purchased (in tonnes) and expenditure (in thousands of points). 48 We experimented with alternative measures of the economic cycle, including the ILO unemployment rate and real earnings growth. The coefficients on the FWRAI variables displayed some sensitivity to our measure of the economic cycle. Nevertheless, the sign and the significance of these coefficients were in general unaffected. When we come to assess, in Table 9, the impact of increases in FWRAI on the price of a typical basket of chicken, beef, ready meals and fresh produce, we provide, for comparison, a second set of results based on an alternative measure of the economic cycle. These appear in Appendix 5.

Econometric modelling and household food waste 31
It is worth stressing at this stage that the approach used assumes that the explicit rating assigned by each retailer to their products is a time invariant yardstick of product quality. In other words, it assumes that an economy carrot, for example, is of a lower quality (in terms of how this is positioned by the retailer, and is perceived by the consumer) than a standard carrot, which in turn is of a lower quality than a premium carrot, and that the perceived gaps between the quality of each grade do not vary over time. We cannot know with any certainty whether this assumption holds true for all products. As discussed below, any narrowing, or indeed widening of the gaps between quality grades has the potential to affect the results. In this report, and for the sake of brevity, economy, standard and premium grades are described as being of different qualities. What is important in the context of this research is that they are offered at different price points, and that the consumer perceives there to be a corresponding variation in quality. This positioning by the retailer will depend on many factors such as size and shape distribution (for fruit & veg), range of ingredients used, packaging materials used, provenance and brand values. Before we report the results, it is worth re-considering the FFS finding that, on balance, households ‘traded down’ over the period from 2007 to 2011, and how this might relate to any evidence about ‘trading up’ that we might find in the Kantar data. DEFRA define ‘trading down (up)’ as occurring when the deflated unit value index of a particular food group falls (rises). A Unit Value Index (UVI), for food group x is defined as the price per gramme of food group purchased x using data on purchases by weight and by value from the FFS. Other things equal, the UVI for food group x might be expected to fall, even if the price of each specific item within food group x is held constant, in an environment where people are switching to cheaper brands that have a lower unit cost. The RPI, by contrast is a chain-weighted index that aims to measure the change in the price of a basket of goods and services. The contents of that basket are changed once a year. Nevertheless, the RPI would not record a switch towards lower quality brands as a fall in prices because it is constructed as the weighted sum of the monthly changes in the prices of the 600 or so items that go into the basket, with those weights changing annually. It is intentionally a measure of the rate of change of the price of a typical basket of goods and services, and not a measure of the price level of a typical basket of goods and services. For that reason, any gap between the rate of inflation for food group x recorded by the RPI, and the rate of increase of the UVI for food group x recorded by the FFS, or equivalently any change in the RPI-deflated UVI for food group x, may be interpreted as a measure of the extent of ‘trading up’, or ‘trading down’, across food group x.
Table 3: FFS concept of ‘trading up / down’: A comparison of Defra FFS & Kantar data Changes over the period 2007 to 2011, per cent Defra FFS data Kantar data RPI UVI Deflated UVI UVI Deflated UVI Fruit & vegetables
23.5 15.4 -6.6 10.3 -10.7
Poultry 22.2 20.8 -1.1 24.7 2.1 Beef 28.7 20.9 -6.1 22.8 -4.6 Table 3 uses the DEFRA FFS methodology to compare the extent of any ‘trading up’ or ‘trading down’ across three food groups implied by the FFS, with that implied by the Kantar data. Although the two data sources vary substantially, a similar picture emerges with regard to the three categories of food shown here. Specifically, evidence of ‘trading down’ is found, according to the DEFRA FFS definition, in both fruit and vegetables, and beef. With

Econometric modelling and household food waste 32
little evidence found of either trading up or down in the poultry category. These conclusions hold firm whichever data source is chosen. If anything, the extent of ‘trading down’ in both fruit and vegetables, and beef, is a little larger using the Kantar data. The finding that, in aggregate, households have ‘traded down’ in their choice of food in recent years need not be inconsistent with the hypothesis that increases in food waste awareness / food waste reduction activities have by themselves caused households to ‘trade up’. In other words, without an increase in food waste awareness and reduction activities there could have been an even larger ‘trading down’ effect. Our working hypothesis, set out above, is that the quality of food purchased by households will depend on a number of factors, and not just on the level of food waste awareness / food waste reduction activities. In recent years, the UK economy has suffered a deep recession from which it has yet to recover. This has taken place against a rising level of food waste awareness / food waste reduction activities recorded formerly by the FWAI, and now by the FWRAI. It may be that a tendency for households to ‘trade down’ when the economy is weak has, in practice, outweighed a tendency for them to ‘trade up’ as they learn to waste less food. This possibility is investigated through the remainder of Section 4.0. Retailer launches of different quality ranges since 1999 are shown in Box 1. 4.3 Results 4.3.1 Results from the chicken dataset Figures 8 and 10 show how the volume shares, and the relative prices of each of the three grades of ‘all fresh chicken’ have evolved over the past ten years. It is apparent that sales of standard grade chicken account for the bulk of chicken sales, with the volume shares of economy and premium grades both relatively small49. However, it is notable that there appears to have been a one-off switch away from standard towards economy chicken in late 2008. The most likely cause of this was a sudden price cut in economy whole chickens by one of the major retailers (to £1.99). By cutting the price significantly sales were quadrupled (see Figure 9). When the volume sales peaked, economy whole chickens made up 6% by volume of the entire chicken market. Note that the prices shown in Figure 10 seem to indicate that economy prices are sometimes higher than standard prices – but this is probably misleading. In fact, the mix of different cuts of chicken in the typical economy basket is different from that in the standard basket.
49 This observation holds true for all four food groups that we consider in this paper.

Econometric modelling and household food waste 33
Box 1: Retailer range launches (source: WRAP online search)

Econometric modelling and household food waste 34
Figure 8: Volume shares of all fresh chicken
Figure 9: Impact of a heavy price discount by one retailer on volume of economy whole chickens sold by that retailer
Per cent
Economy Premium Standard
02 03 04 05 06 07 08 09 10 11 120
5
10
15
20
25
70
75
80
85
90
95
0
2
4
6
8
10
12
14
16
0
500
1000
1500
2000
2500
3000
3500Pr
ice
per K
G
Tonn
es o
f chi
cken
sold
by
dis
coun
ting
reta
iler
Sales Volume (LHS) Price per KG (RHS)

Econometric modelling and household food waste 35
Figure 10: Fresh chicken prices
A summary of the results from the system of three equations estimated for ‘all fresh chicken’ is shown in Table 4. Asterisks are used to denote the significance of the estimated parameters, with one, two and three asterisks denoting significance at the 10%, 5% and 1% levels respectively.
Table 4: All fresh chicken50 Long-run impact on volume shares, percentage points UR (1) Price (2) FWRAI (3) ECO 2.07*** -0.21*** -0.98*** STA -1.81*** -1.12*** 0.64** PRE -0.26** -0.04*** 0.34*** (1) Percentage point increase in the unemployment rate. (2) A one per cent increase in the relative price of that grade. (3) A one standard deviation increase in FWRAI. NB Asterisks are used to denote the significance of the estimated parameters, with one, two and three asterisks denoting significance at the 10%, 5% and 1% levels respectively. A deterioration in the economic cycle, represented by an increase in the unemployment rate, is found to be associated with a substitution out of premium and standard grades into economy grades of all fresh chicken. Moreover, these effects are all individually significant to at least the 5% level. These results provide strong evidence that households ‘trade down’ in their purchases of all fresh chicken following a deterioration in the economy, as one might expect. By contrast, an increase in FWRAI is associated with substitution out of economy grades of all fresh chicken into both standard and premium grades (Figure 11). Again, these effects are all statistically significant to at least the 5% level. This behaviour would be expected if an increase in food waste reduction activities caused households to spend some of the
50 When interpreting this table it is worth considering the likelihood of each of the 3 drivers happening. Arguably a one percentage point change in the unemployment rate is the least likely.
Relative to price of all fresh chicken
Economy Standard Premium
02 03 04 05 06 07 08 09 10 11 12
0.6
0.7
0.8
0.9
1.0
1.1
1.2
1.3
1.4

Econometric modelling and household food waste 36
proceeds from throwing less food away on buying better quality food. In short, the results for ‘all fresh chicken’ appear supportive of the ‘trading up’ hypothesis advanced in the earlier work. Moreover, Table A1, shown in Appendix 2, shows that increases in FWRAI are associated with a statistically significant shift up the value chain across all three types of fresh chicken: breast; pieces; and whole.
Figure 11: Impact on sales of all fresh chicken
It should be made clear, at this point, that the units in Table 5 are ‘percentage point changes in the volume share’. Figure 8 shows that the volume share of standard chicken is typically 30 to 40 times the volume share of premium chicken, which means that the percentage increase in purchases of premium chicken following an increase in the FWRAI is substantially higher than the percentage increase in purchases of standard chicken. This point is emphasised by Figure 11, which shows that a one standard deviation increase in FWRAI would be associated with a 14% increase in purchases of premium chicken, but an increase of just 1% in purchases of standard chicken. 4.3.2 Results from the beef dataset Figures 12 and 13 show how the volume shares, and the relative prices, of each of the three grades of ‘all fresh beef’ have evolved since 2004. As with ‘all fresh chicken’, standard grades of beef dominate beef purchases. However, purchases of both economy and premium grades have increased over the sample period. There has been remarkably little variation in the relative price of different grades of fresh beef.

Econometric modelling and household food waste 37
Figure 12: Volume shares of all fresh beef
Figure 13: Fresh beef prices
In the case of ‘all fresh beef’ the results, shown in Table 5, are less clear cut. Although some evidence is found that an increase in the unemployment rate causes a substitution out of premium grade beef, and into standard grade beef, it also appears, at first glance, to produce a substitution out of economy grade beef. However, only the reduction in the share of premium grade beef is statistically significant at conventional levels. One might conclude, therefore, that a deterioration in the economic cycle causes a substitution out of premium grade beef. But it is not possible to be certain whether it is the standard or the economy grades that benefit, and in what proportion.
Per cent
Premium Economy Standard
04 05 06 07 08 09 10 11 120
5
10
15
20
80
85
90
95
100
Relative to price of all fresh beef
Economy Standard Premium
04 05 06 07 08 09 10 11 12
0.4
0.6
0.8
1.0
1.2
1.4
1.6

Econometric modelling and household food waste 38
Again, evidence that an increase in FWRAI is associated with substitution out of the lower two grades of beef and into the premium grade is found. And again, this effect is statistically significant, though this time at the 10% rather than the 5% level. However, the split between economy and standard grades again looks counterintuitive51, with an increase in FWRAI appearing to lead to a switch out of standard and into economy grades.
Table 5: All fresh beef Long-run impact on volume shares, percentage points UR (1) Price (2) FWRAI (3) ECO -0.31 -0.04 1.02** STA 1.49 -2.04*** -1.76** PRE -1.18* -0.20*** 0.74* (1) Percentage point increase in the unemployment rate. (2) A one per cent increase in the relative price of that grade. (3) A one standard deviation increase in FWRAI. When each of the four categories of beef are considered in isolation, results are produced that are very similar to the case where we consider all types of fresh beef together. As Table A2 in Appendix 2 shows, in all four cases, an increase in the FWRAI is associated with an increase in both the economy and the premium shares, but a decrease in the standard share. These effects are generally, though not always statistically significant. 4.3.3 Results from the ready meals dataset Figures 14 and 15 show how the volume shares, and the relative prices, of each of the three grades of ready meals have evolved over the past ten years. Through the early part of the sample, there was a tendency for households to switch out of standard grade ready meals into premium grade ready meals. However, this process appeared to have come to an end in 2007, as the economy started to slow.
Figure 14: Volume shares of all ready meals
51 As stated in Section 4.2 the approach used here assumes that the explicit rating assigned by each retailer to their products is a time invariant yardstick of product quality. We cannot know with any certainty whether this assumption holds true for all products at all times. As discussed below, any narrowing, or indeed widening of the gaps between quality grades has the potential to affect the results.
Per cent
Premium Economy Standard
02 03 04 05 06 07 08 09 10 11 120
5
10
15
80
85
90
95

Econometric modelling and household food waste 39
Figure 15: Fresh ready meal prices
In the case of ready meals, it was not possible to obtain a satisfactory set of results by considering all three categories of ready meals together52. Instead, Table 6 shows the results for fish-based, meat-based and vegetarian ready meals when each system is estimated in isolation53.
Table 6: Ready meals Long-run impact on volume shares, percentage points UR (1) Price (2) FWRAI (3) Fish based ECO 0.25 -0.02* -0.18 STA 0.98 -1.43*** -0.27 PRE -1.23* -0.25*** 0.45 Meat based ECO 0.03 -0.07*** -0.29*** STA 0.45 -1.83*** -0.26 PRE -0.48* -0.21*** 0.55*** Vegetarian ECO -0.09 -0.02* -0.08 STA 0.92* -0.98*** -1.01*** PRE -0.83* -0.16*** 1.09*** (1) Percentage point increase in the unemployment rate. (2) A one per cent increase in the relative price of that grade. (3) A one standard deviation increase in FWRAI. Results for each of the three categories of ready meal are broadly supportive of the ‘trading up’ hypothesis. More specifically, an increase in FWRAI is associated with substitution out of
52 When we tried this approach, key variables of interest, including the unemployment rate, relative prices and FWRAI, were found to be insignificant. 53 It may be that the three categories of ready meal are too dissimilar to be considered as a single food group. For example, the degree of substitutability between vegetarian ready meals, and non-vegetarian ready meals is likely to be low.
Relative to price of all fresh ready mealsy p
Economy Standard Premium
02 03 04 05 06 07 08 09 10 11 12
0.40.50.60.70.80.91.01.11.21.31.41.5

Econometric modelling and household food waste 40
economy and standard grades of ready meal into premium grades. This effect is statistically significant in some, but not all cases (Table A3 in Appendix 2). 4.3.4 Results from the fruit and vegetables dataset Finally, the results from the fruit and vegetable dataset are considered. Two vintages of data were available. Vintage 1 ran from 2003 to 2011 but was then discontinued, while Vintage 2 ran from 2007 to the present day. However, during the period where the series overlapped, their behaviour was quite different. For example, in Vintage 2, the premium share of purchases by weight was around 10 percentage points higher than in Vintage 1, with the standard and economy shares correspondingly lower. Consequently, rather than attempt to splice the two vintages together, we decided to focus on Vintage 1 in isolation54. Figures 16 and 17 show how the volume shares, and the relative prices, of each quality grade of all fresh fruit and vegetables as recorded in Vintage 1 varied over the period from 2003 to 2011. It is clear that the volume shares of both economy and premium fruit and vegetables have risen over the sample. As in the case of ready meals, however, the volume share of premium fruit and vegetables looks to have stabilised from 2007. There has been a significant reduction in the relative price of premium fruit and vegetables over the period, and this is likely to account for some of the rise in their volume share.
Figure 16: Volume shares of all fruit and vegetables
54 Vintage 1 was considered preferable to vintage 2 as it covered a longer time period.
Per cent
Economy Premium Standard
03 04 05 06 07 08 09 10 110
5
10
15
85
90
95
100
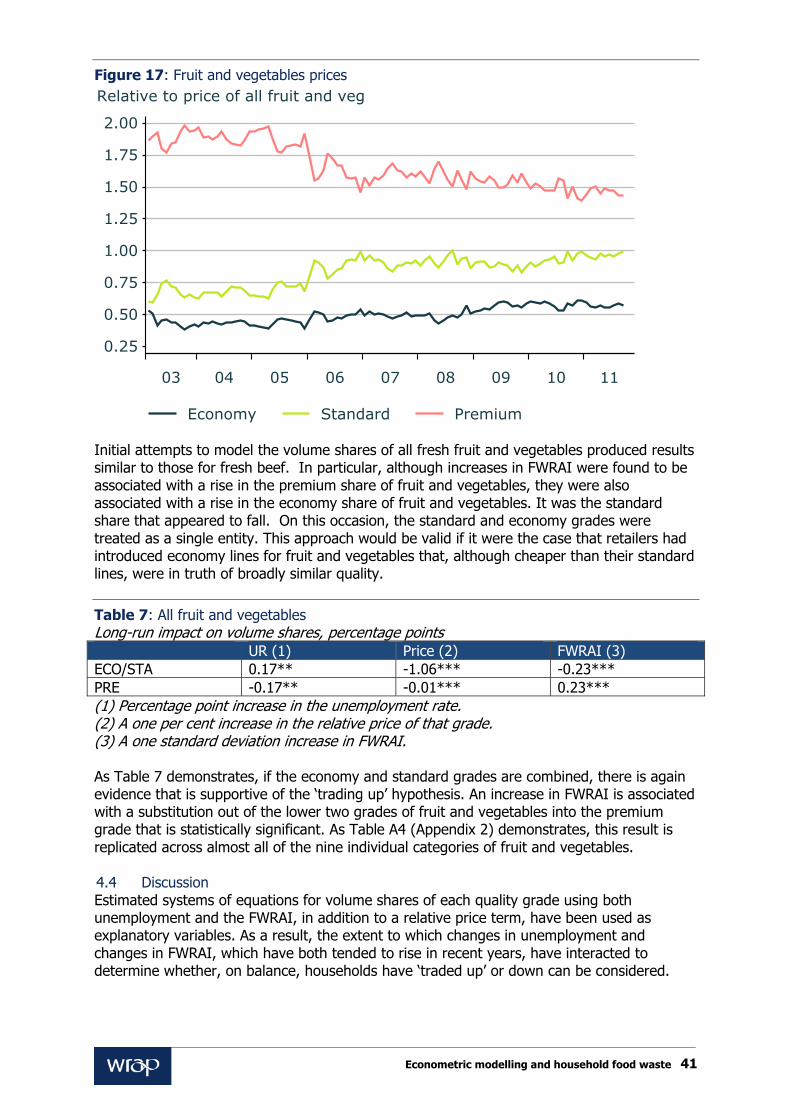
Econometric modelling and household food waste 41
Figure 17: Fruit and vegetables prices
Initial attempts to model the volume shares of all fresh fruit and vegetables produced results similar to those for fresh beef. In particular, although increases in FWRAI were found to be associated with a rise in the premium share of fruit and vegetables, they were also associated with a rise in the economy share of fruit and vegetables. It was the standard share that appeared to fall. On this occasion, the standard and economy grades were treated as a single entity. This approach would be valid if it were the case that retailers had introduced economy lines for fruit and vegetables that, although cheaper than their standard lines, were in truth of broadly similar quality.
Table 7: All fruit and vegetables Long-run impact on volume shares, percentage points UR (1) Price (2) FWRAI (3) ECO/STA 0.17** -1.06*** -0.23*** PRE -0.17** -0.01*** 0.23*** (1) Percentage point increase in the unemployment rate. (2) A one per cent increase in the relative price of that grade. (3) A one standard deviation increase in FWRAI. As Table 7 demonstrates, if the economy and standard grades are combined, there is again evidence that is supportive of the ‘trading up’ hypothesis. An increase in FWRAI is associated with a substitution out of the lower two grades of fruit and vegetables into the premium grade that is statistically significant. As Table A4 (Appendix 2) demonstrates, this result is replicated across almost all of the nine individual categories of fruit and vegetables. 4.4 Discussion Estimated systems of equations for volume shares of each quality grade using both unemployment and the FWRAI, in addition to a relative price term, have been used as explanatory variables. As a result, the extent to which changes in unemployment and changes in FWRAI, which have both tended to rise in recent years, have interacted to determine whether, on balance, households have ‘traded up’ or down can be considered.
Relative to price of all fruit and vegg p
Economy Standard Premium
03 04 05 06 07 08 09 10 11
0.25
0.50
0.75
1.00
1.25
1.50
1.75
2.00

Econometric modelling and household food waste 42
Table 8 shows the estimated impact of the observed changes in both unemployment and FWRAI over the period from 2007 to 2010 on volume shares for each of the quality grades. Results are presented for ‘all fresh chicken’, ‘all fresh beef’, three different types of ready meals, and ‘all fruit and vegetables’. In each case it is found that the observed increase in FWRAI ought to have boosted the volume share of premium. The increase in unemployment, however, has worked in the opposite direction. For the case of chicken, two of the three types of ready meal, and fruit and vegetables, these effects were broadly offsetting. For the case of beef, and fish-based ready meals however, the unemployment effect was seen to be much stronger, suggesting a net substitution out of premium categories for these products. Looking at the movements between the standard and economy grades, one ought to have seen net ‘trading down’ in both chicken and beef, with little ‘trading up’ or down in the case of fruit and vegetables.
Table 8: Estimated impact on volume shares (From 2007 to 2010, percentage points) All fresh chicken Change in UR Change in FWRAI Total ECO 3.93 -1.63 2.31 STA -3.44 1.06 -2.38 PRE -0.49 0.56 0.07 All fresh beef Change in UR Change in FWRAI Total ECO -0.59 1.69 1.10 STA 2.83 -2.92 -0.09 PRE -2.24 1.23 -1.01 All ready meals Change in UR Change in FWRAI Total Fish based ECO 0.48 -0.30 0.18 STA 1.86 -0.45 1.41 PRE -2.34 0.75 -1.59 Meat based ECO 0.06 -0.48 -0.42 STA 0.86 -0.43 0.42 PRE -0.91 0.91 0.00 Vegetarian ECO -0.17 -0.13 -0.30 STA 1.75 -1.68 0.07 PRE -1.58 1.81 0.23 All fruit and vegetables UR (1) Price (2) FWRAI (3) ECO/STA 0.31 -0.39 -0.07 PRE -0.31 0.39 0.07 Over the period 2007-2010, the unemployment rate rose by 1.9 percentage points and the FWRAI rose by 1.7 standard deviations. 4.5 Food waste reduction ‘dividend’ As consumers become more aware of, and concerned by, the issue of food waste, it appears that they learn techniques for wasting a smaller proportion of the food that they purchase.

Econometric modelling and household food waste 43
In terms of the household budget, this is equivalent to a fall in the price of food: households do not need to spend so much in order to consume the same physical quantity of food and drink. Therefore, as we outlined above, the physical quantity of food purchased falls. Households who waste less are left with a food waste reduction ‘dividend’. Our analysis suggests that, five years after WRAP began its LFHW initiative, this ‘dividend’ may already be substantial. Figure 18 uses our estimate of the response of food purchases to a change in FWRAI, together with the series for FWRAI itself shown in Figure 7, to estimate the cumulative impact of greater food waste reduction activities on household budgets – the food waste reduction ‘dividend’. It suggests that, by 2011, the latest year for which detailed DEFRA data on purchases of food and drinks are available, the reduction in food purchases implied by the increase in FWRAI since 2006, resulted in an annual saving of £1.9 billion for UK households.
Figure 18: Food waste reduction ‘dividend’
The food waste reduction ‘dividend’ may be saved, or it may be spent. If it is spent, it may be spent on food and drink, or on other goods and services. If it is spent on food and drink, it would increase the value of the basket of food and drink purchased but not, according to our analysis, the physical quantity. Or, to put it another way, to the extent that the food waste reduction ‘dividend’ is spent on food and drink, it is used to ‘trade up’, from economy to standard or to premium brands. Initially, (prior to using Kantar data), it was necessary to base the estimate of the amount of the food waste reduction ‘dividend’ that was spent on more costly food and drink on a comparison of the equations for the weight and the value of retail sales of food, drink and tobacco. On this basis, it was not possible to reject the hypothesis that the entire food waste dividend was spent on ‘trading up’. But neither, working at conventional levels of significance, could we reject the hypothesis that as little as one third of the food waste ‘dividend’ was spent on ‘trading up’. In Table 9, the magnitude of the food waste reduction ‘dividend’, estimated to be equal in value to 2.1% of all expenditure on food and drink in 2011, is compared with our estimate of the increase in the value of selected baskets of food and drink that resulted from ‘trading up’ from economy, through standard to premium brands, as FWRAI rose. Although the figures vary somewhat between the different food types, in the majority of cases, it would appear

Econometric modelling and household food waste 44
that the increase in FWRAI from 2006 to 2011 led to an increase in the value of a typical basket of chicken, of beef, and of most ready meals of the order of 1.1% to 1.2%, excluding inflation. The Kantar data, therefore, suggest that around one half of the food waste ‘dividend’ was used to buy more expensive food and drinks55.
Table 9: How is the food waste reduction ‘dividend’ spent? Estimated savings from increase in FWRAI assuming no change in food baskets:
£1.9 billion, per annum Or £75 per household, per annum Or 2.1%
Estimated increase in price of selected food baskets implied by Kantar data (1) Fresh chicken +1.1% Fresh beef +1.2% Fresh fruit & vegetables +0.4% Ready meals, o/w Fish based +0.4% Meat based +1.2% Vegetarian +1.2% (a) Estimated increase in price of food baskets following the ‘trading up’ or ‘trading down’ that occurred purely as a consequence of the change in FWRAI.
55 See Appendix 5 for the estimated impact of FWRAI using an alternative measure of the economic cycle.

Econometric modelling and household food waste 45
5.0 Summary The following key points can be made in summary: A new food waste reduction activity index (FWRAI) has been developed, to reflect a wider
range of activities by WRAP and partners to help consumers waste less food. This includes data on behaviour change, visits to www.lovefoodhatewaste.com and media mentions of food waste.
A one standard deviation increase in FWRAI (about one-fifth of the total increase in this indicator over the period 2004 to 2012) would lead (over 6 – 12 months), on average, to a 0.7% reduction in the weight of food purchases, and by assumption food waste (230,000 tonnes per annum).
The model can account for a large proportion of the observed reduction in food waste between 2007 and 2010, and suggests that of the 1.1 million tonne reduction in food waste during that period, 40% is attributable to an increase in factors captured by the updated FWRAI. This index is constructed to reflect the consequences of WRAP and partner activity, but may also be influenced by other wider factors.
A similar contribution of around 35% came from the impact of higher real food prices on the proportion of food that is thrown away. A reduction in income relative to trend and real food prices relative to trend accounted for a relatively small part of the decline in food waste.
There may be an effect of factors other than food waste reduction activities within the reduction linked to the FWRAI, and equally whilst higher real food prices and reductions in income may have triggered actions to reduce food waste, it is likely that not all of these would have been realised without the food waste reduction activities enabling changes in behaviour.
Other factors will also influence household food waste, such as changes to the way foods are packaged, labelled and sold, some of which will have required changes to consumer behaviour (e.g. choosing to purchase a particular product with re-closable packaging, and then using the functionality correctly) and some of which would not (e.g. longer shelf-life). These factors are difficult to quantify and whilst further work may allow a more robust estimate to be made, it will be very difficult ever to determine a precise figure in such a complex system.
Analysis using the new food waste reduction activity index is consistent with earlier work that found evidence that consumers ‘traded up’ as they learnt how to waste less food.
Overall the data suggest that ‘trading up’ within food categories has occurred in response to a reduction in food waste. However, this effect may be masked at a UK level by the effects of the prevailing economic conditions. It may be that a tendency for households to ‘trade down’ when the economy is weak has, in practice, outweighed a tendency to ‘trade up’ as food waste is reduced.
As consumers become more aware of, and concerned by, the issue of food waste, it appears that they learn techniques for wasting a smaller proportion of the food that they purchase. In terms of the household budget, this is equivalent to a fall in the price of food: households do not need to spend so much in order to consume the same quantity of food and drink. Therefore, the physical quantity of food purchased falls.
Households who waste less are left with a food waste reduction ‘dividend’. Our analysis suggests that by 2011 the reduction in food purchases implied by the increase in FWRAI since 2006 has resulted in an annual saving of £1.9 billion for UK households. The magnitude of the food waste reduction ‘dividend’ is estimated to be equal in value to 2.1% of all expenditure on food and drink in 2011.
This research suggests that around one half of the food waste ‘dividend’ was used to buy more expensive food and drinks (i.e. to ‘trade up’), while the other half was either saved or spent on other things.

Econometric modelling and household food waste 46
New data will be available late in 2013, which will effectively double the amount of information on food waste available for analysis in the model, and should allow the project team both to test more rigorously and, where necessary, improve the specification of this econometric model.
It is worth noting that WRAP carried out separate qualitative and quantitative analysis (peer reviewed by Databuild) to evaluate the impact related to its last Business Plan56, which concluded that a realistic estimate for the overall impact of its influence, directly and through its partners, could be around 60%.
56 Available at: www.wrap.org.uk/econometricmodel

Econometric modelling and household food waste 47
6.0 Options for further work The greatest challenge faced in building this model was an acute shortage of data on household food waste arisings. There was only a snapshot of the quantity of many different types of food thrown away at a single point in time; namely, calendar year 2007. New data became available late in 201357, which effectively doubles the amount of information on food waste available for analysis in the model, and should allow the project team both to test more rigorously and, where necessary, improve the specification of this econometric model. Whilst there is uncertainty around the estimates of the extent to which WRAP and partner activity may have influenced the reduction in food waste from 2007 to 2010, the model does highlight that both such activity and food prices / income levels are significant influences on food waste levels. It will be important to refine the model to look at interactions between these two, for instance the degree to which some people may be able to react to economic triggers by reducing food waste without any external support, and make changes to their behaviours and purchasing patterns (e.g. advice and tips from WRAP and partners) vs. those where economic factors may trigger a need to change behaviour, but such a change depends on external support. The model can also be used to produce projections for the weight of food waste based on different scenarios for the future weight of food purchases, economic growth and the impact of different intensities of food waste reduction activities (as measured by the FWRAI). It would be useful to explore the extent to which consumers recognise that they are saving money through wasting less, and whether there are conscious choices around ‘trading up’, and also to explore how different groups of people respond to wasting less food (for example choosing to ‘trade up’ to higher value foods compared to making use of new skills or confidence to get more from ‘cheaper’ foods). As discussed in the report there are several ways people could shift food purchase patterns in response to wasting less food, and other factors such as food prices and economic conditions, which include the balance of eating in or out of home, where food is bought for in home consumption and moving between different food categories. Understanding this system better would provide useful insights not only for future work on food waste prevention but also for broader work on moving to more healthy and sustainable diets.
57 WRAP’s new 2012 research (see www.wrap.org.uk/household-food-waste) showed that consumers were saving £3.3 billion a year (in 2012) from wasting less food.

Econometric modelling and household food waste 48
Appendix 1 - WRAP’s CFWP tracker survey WRAP measures consumer behaviour, attitudes and knowledge relating to food waste on a regular basis via a national survey, conducted by an independent research company. This gives a longitudinal view of the impacts of WRAP’s work, and that of partners, on the UK population as a whole; booster work ensures that the results are robust at the nation level. There are a large number of things that people can do to reduce food waste in the home. It is possible to influence many of these to help people save money. WRAP has identified nine specific behaviours that are particularly significant (see list below) about which WRAP has devised a series of questions. These are not the only behaviours that might link to food waste, but we believe they are indicative of a wider range of food behaviours, and thus representative of behaviour change in this area more broadly. Key Behaviours Planning meals in advance Checking food stocks before shopping Making a shopping list Making use of the freezer Correct storage of fruit and vegetables Correct storage of meat and cheese Use of leftovers Correct portioning Checking dates
More information is available at: http://partners.lovefoodhatewaste.com/resources/monitoring_love_food.rma

Econometric modelling and household food waste 49
Appendix 2 - Detailed findings of relationship between food waste reduction activities and the quality of food purchased Table A1: FWRAI and ‘trading up / down’ (chicken)
Table A2: FWRAI and ‘trading up / down’ (beef)
Table A3: FWRAI and ‘trading up / down’ (ready meal)
FWRAI and 'trading up / down':summary of results for each type of fresh chickenEstimated impact on volume share of 1 S.D. Change in FWRAI
ECO STA PREChicken breast -2.56 *** 2.39 *** 0.17 **Chicken pieces -1.70 *** 1.52 *** 0.18 ***Whole chickens 2.72 *** -3.47 *** 0.75 ***
FWRAI and 'trading up / down':summary of results for each type of fresh beefEstimated impact on volume share of 1 S.D. Change in FWRAI
ECO STA PRE
Frying steak 1.30 *** -2.38 *** 1.08 ***Stewing steak -1.12 1.12Roasting joints 0.61 *** -1.88 *** 1.27 ***
Mince 1.38 ** -1.68 ** 0.30
FWRAI and 'trading up / down':summary of results for each type of ready mealEstimated impact on volume share of 1 S.D. Change in FWRAI
ECO STA PREFish-based -0.18 -0.27 0.45Meat-based -0.29 *** -0.26 0.55 ***Vegetarian -0.08 -1.01 *** 1.09 ***

Econometric modelling and household food waste 50
Table A4: FWRAI and ‘trading up / down’ (fruit and vegetables)
FWRAI and 'trading up / down':summary of results for each type of fruit & vegEstimated impact on volume share of 1 S.D. Change in FWRAI
ECO/STA PREApples -0.27 *** 0.27 ***Cabbages 0.00 0.00Carrots -0.16 ** 0.16 **Grapes 0.00 0.00Lettuce 0.02 -0.02Onions -0.14 *** 0.14 ***Potatoes -1.04 *** 1.04 ***Strawberries -0.32 *** 0.32 ***Tomatoes -0.65 * 0.65 *

Econometric modelling and household food waste 51
Appendix 3 - The link between food waste reduction activities and retail sales of food Our starting position, or initial null hypothesis, is that food waste reduction activities have no impact on food sales values, food sales volumes, the price of food, or the weight of food purchased either in the short run or the long run, once we have controlled properly for the impacts of each of their other determinants. There are a number of potential alternative hypotheses that we can test relative to those nulls. Typically, though, these hypotheses only make sense when expressed across two or all three dimensions of this exercise. So, for example, a finding that food waste awareness has no impact on the value of retail sales of food is not interesting in its own right – it is a failure to reject the null. But put that together with another finding, that food waste awareness is negatively related to the weight of retail sales of food and an interesting hypothesis emerges. And combine those two with a rejection of the null hypothesis with respect to retail food prices and we can start to develop a meaningful story. The theoretical relationship we are exploring is one in which wasting food reduces the utility that consumers extract from their purchases of food. So a reduction in avoidable food waste would unambiguously result in an increase in utility. Put another way, wasting a fifth of all the food we purchase is like adding 25% to the effective price of the food that we end up actually consuming (rather than wasting). A reduction in avoidable food waste therefore acts like a reduction in the ‘effective’ price of food - the price per gram of food actually eaten (not, note, in its retail price). The question is what impact would we expect that to have on our purchases of food? Say, for the sake of argument, that for every kilogram of food we buy, we waste 200 grams that could have been avoided. If we are shown ways to cut our avoidable food waste by 10%, then the wasted proportion would fall from 20% to 18%, to 180 grams in every kilogram. But what would happen to the weight and the value of our total purchases of food? Theory tells us to look for income effects and substitution effects when a price changes. If the price of one element in the basket of goods and services purchased by the typical consumer falls, then that consumer is better off, in real terms, than before, and will therefore tend to buy more of everything, including of the item whose price has fallen. That is the income effect. Moreover, the consumer will tend to increase disproportionately their purchases of the item whose relative price has now fallen, substituting out of other items into that one. That is the substitution effect. Both effects act in the same direction. So far as food is concerned, consumers tend, if anything, to increase the purchases of food in real terms when the price of food falls. The magnitude of, and balance between, income and substitution effects depends on the marginal utility of food compared to that of other goods and services. Most goods and services exhibit diminishing marginal utility and this is likely to be particularly pronounced in the case of food – the marginal utility of another gram of food once we have had ‘enough’ is likely to be very low – though it will be very high when we have none. A sharply diminishing marginal utility of food implies that the income and substitution effects are likely to be small or non-existent with respect to the quantity of food we purchase, in grams.

Econometric modelling and household food waste 52
However, the marginal utility of the next penny spent on food might not diminish nearly as sharply as the marginal utility of the next gram of food. One can continue to extract more utility from eating better food long after the utility one gets from the sheer quantity of food one consumes has reached its maximum. This discrepancy between the marginal utility of the weight of a good and that of its value is not unique to food, of course: it is common across all goods and services. But it is probably much more pronounced in the case of food. Enough is enough with the quantity of food in a much clearer way than, for example, with clothes or electronics. But there is practically no limit to how much one can spend per gram of food in pursuit of more quality. This matters a great deal for the structure of this econometric exercise. Put at its simplest, a reduction in food waste is highly likely to mean a reduction in the weight of food purchased (in grams) but might not have the same implication for the value of food purchased. If the income and substitution effects were zero then the value of food purchased would simply fall in proportion with the weight. If those effects were small but positive, then values would fall but by less than the weight. If they were large and positive then the value of food purchased could increase even while the weight falls. The presence of positive income and substitution effects from the reduction in the effective price of the food actually eaten as a result of a reduction in the proportion of avoidable food waste, would be consistent with the phenomenon of ‘trading up’ – shifting to higher priced, higher quality foodstuffs, but in lower physical weight, when food waste awareness increases. The hypotheses that this project tests are as follows: 1) Higher food waste awareness causes consumers to reduce their retail purchases of food
– they waste less food, so they buy less food, and that is all there is to it. Income and substitution effects on the value of food purchases are insignificant, so the value of food purchases falls in proportion with weights. This would imply: lower weights; proportionately lower values; unchanged price – no ‘trading up’.
2) Higher food waste awareness causes consumers to reduce the weight of food they purchase – they waste less food so they buy less food. But income and substitution effects are positive, so the negative impact on food sales values are smaller than on weights. This would imply: lower weights; less than proportionately lower values; higher price – some ‘trading up’.
3) Higher food waste awareness causes consumers to reduce the weight of food they purchase, but the income and substitution effects are large so the impact on food purchase values is small or even positive. This would imply: lower weights; unchanged or higher values; higher price – full or more than full ‘trading up’.
In order to test those hypotheses robustly, we needed to be sure we had controlled for the impact of all the other important determinants of food retail sales, weights and values. Control variables include real incomes, general retail sales, general retail prices, and global food commodity prices.

Econometric modelling and household food waste 53
Until this point in the discussion, we have used the term ‘food’ as a catch-all to help the exposition of the argument. But in fact the retail sales data are complicated. The ONS produce data for: Retail sales of food, drink and tobacco together in current (but not constant) prices, not
seasonally adjusted58. Retail prices for food, drink and tobacco individually but not in total, not seasonally
adjusted.
So there is no direct way of comparing either food, drink or food & drink retail sales in current and constant prices. As a result, we have taken a different approach. We have estimated a price index for food, drink and tobacco together, using the weights of each of those components in the overall RPI index, and then used that index to deflate the current price retail sales of food, drink and tobacco (which we have seasonally adjusted using a seasonal factor estimator called X12), into an implied constant price corollary. Econometrics Table A5 summarises the results of our two key equations: one for the one-month rate of change of sales of food, drink and tobacco in current prices
– DLOG(NRSFDT); and the other for the one-month rate of change of sales of food, drink and tobacco (FDT)
in constant prices – DLOG(QRSFDT).
The equation for the one-month rate of change of sales of FDT in current prices is specified in such a way that, in the long-run, the level of sales of FDT in current prices depends, potentially, on: earnings measured by the average weekly earnings index (EARN); the level of retail sales of all goods in current prices (NRS); the price of FDT goods relative to the prices of all goods and services measured by the RPI (RPIFDT/RPI); and the FWRAI. The equation for the one-month rate of change of sales of FDT in constant prices is specified in a similar way. The only difference is that all variables on the right hand side are measured in constant rather than current prices.
Table A5: Results of our two key equations
58 In addition, the ONS publishes estimates of retail sales by ‘predominantly food stores’. These are total sales of all goods by shops that sell mainly food, such as supermarkets. But it will also include sales of alcohol, tobacco, clothing and footwear, audio-visual equipment, and potentially many other non-food items. These retail sales measures have the attraction that they are available in both constant, and current prices, and in seasonally-adjusted and non-seasonally adjusted forms. However, they are so distant from the concept of sales of purely of food and drink, that we focus on the alternatives that measures sales by commodity, rather than by store type.
DLOG(NRSFDT) from Mar 1991 to Jul 2012 DLOG(QRSFDT) from Mar 1991 to Jul 2012
Variable Coefficient S.E. Significance Variable Coefficient S.E. Significance
C 1.003827 0.34723 *** C -0.850593 0.21954 ***DLOG(NRSFDT(-1)) -0.358865 0.0589 *** DLOG(QRSFDT(-1)) -0.366395 0.05666 ***LOG(NRSFDT(-1)) -0.365582 0.06398 *** LOG(QRSFDT(-1)) -0.418408 0.06614 ***LOG(RPIFDT(-1)/RPI(-1)) 0.13631 0.05491 ** LOG(RPIFDT(-1)/RPI(-1)) -0.061925 0.05205LOG(EARN(-1)) 0.109296 0.05704 * LOG(EARN(-1)/RPI(-1)) 0.101126 0.05395 *FWRAI(-1) 0.001342 0.00169 FWRAI(-1) -0.002723 0.00149 *LOG(NRS(-1)) -0.042229 0.05493 LOG(QRS(-1)) 0.12252 0.04628 ***@TREND 0.000769 0.00029 *** @TREND -0.000184 0.0001 *
R-bar-squared 0.366584 R-bar-squared 0.386724DW 2.140248 DW 2.164567
Econometric modelling and household food waste 54
A key parameter of interest is the coefficient on FWRAI in both the current price and the constant price equations. Our initial null hypothesis is that changes in the FWRAI have no impact on either the weight, or the value of sales of FDT once we have properly controlled for all the other determinants. The results in Table A5 show that, while we would not reject the null hypothesis that changes in the FWRAI have no impact on the current price value of sales of FDT, we would reject, at the 10% level, the null hypothesis that changes in the FWRAI have no impact on the constant price value of sales of FDT. More specifically, we find evidence that an increase in food waste reduction activity is associated with a reduction in the constant price value of purchases of FDT. Our best-linear unbiased estimate (or BLUE) is that a one standard deviation increase in the FWRAI leads ultimately to a 0.7% reduction in the constant price value of sales of FDT59. Our BLUE for the long-run impact of an increase in the FWRAI on the current price value of sales of FDT is positive. But this long-run coefficient is poorly determined. We can be 95% confident only that the long-run impact of an increase in the FWRAI on the current price value of sales of FDT lies somewhere between -0.5% and +1.3%. Based on this analysis of retail sales of FDT, we can be confident that an increase in the FWRAI leads to a reduction in the constant price value of food purchases. We can be less confident about the impact on the current price value of food purchases. It would appear that at least some of the implied savings from learning how to waste less food are used to buy more expensive food. The proportion of the savings used in this way could be as low as 15%. Alternatively, it could be well in excess of 100%. This second case would imply a very high substitution effect. Using retail sales data alone, we simply do not know how much of the proceeds from wasting less food are spent on purchasing more expensive food. That was one of our main motivations for extending the earlier work to make use of the Kantar datasets (Section 4.0).
59 The BLUE for the long-run impact of a change in FWRAI on the volume of sales of FDT is given by the coefficient on FWRAI divided by the negative of the coefficient on the lagged level of the volume of sales of FDT (LOG(QRSFDT(-1)).

Econometric modelling and household food waste 55
Appendix 4 - Measure of perishability Table A6: Relative perishability and storage life of fresh produce Classification of fresh horticultural crops according to their relative perishability and potential storage life in air at near optimum temperature and relative humidity. Relative perishability
Potential storage life (weeks)
Commodities Index
Very high <2 Apricot, blackberry, blueberry, cherry, fig, raspberry, strawberry, asparagus, bean sprouts, broccoli, cauliflower, green onion, leaf lettuce, mushroom, muskmelon, pea, spinach, sweetcorn, tomato (ripe), most cut flowers and foliage, minimally processed fruits and vegetables.
1
High 2-4 Avocado, banana, grape (without SO2 treatment), guava, loquat, mandarin, mango, melons (honeydew, Crenshaw, Persian), nectarine, papaya, peach, plum, artichoke, green beans, Brussels sprouts, cabbage, celery, eggplant, head lettuce, okra, pepper, summer squash, tomato (partially ripe).
2
Moderate 4-8 Apple and pear (some cultivars), grape (SO2 treated), orange, grapefruit, lime, kiwifruit, persimmon, pomegranate, table beet, carrot, radish, potato (immature).
3
Low 8-16 Apple and pear (some cultivars), lemon, potato (mature), dry onion, garlic, pumpkin, winter squash, sweet potato, taro, yam, bulbs and other propagules of ornamental plants.
4
Very low >16 Tree nuts, dried fruits and vegetables. 5 Source: The Biology of Horticulture – An Introductory Textbook, New York: John Wiley & Sons pp. 353-377.

Econometric modelling and household food waste 56
Splitting food groups from the 2007 household food waste survey into two groups (solid / perishable), a central estimate for the price elasticity of the demand for food waste is -0.39. Dependent Variable: LOG(QWASTE) Method: Least Squares Date: 06/11/09 Time: 15:49 Sample: 1 12 14 79 Included observations: 78
Coefficient Std. Error t-Statistic Prob.
C 2.189703 1.141151 1.918855 0.0589 LOG(QTPA) 0.651037 0.084313 7.721634 0.0000 LOG(PRICE) -0.390637 0.139604 -2.798179 0.0066 SOLID 0.635895 0.216126 2.942242 0.0044 PERISH -0.138268 0.066207 -2.088430 0.0402
R-squared 0.587058 Mean dependent var 9.843001Adjusted R-squared 0.564431 S.D. dependent var 1.163751S.E. of regression 0.768049 Akaike info criterion 2.372029Sum squared resid 43.06261 Schwarz criterion 2.523100Log likelihood -87.50911 Hannan-Quinn criter. 2.432505F-statistic 25.94502 Durbin-Watson stat 1.202810Prob(F-statistic) 0.000000

Econometric modelling and household food waste 57
Appendix 5 – Estimated impact of FWRAI using an alternative measure of the economic cycle Alternative Table 9: How is the food waste reduction ‘dividend’ spent?60 Estimated savings from increase in FWRAI assuming no change in food baskets:
£1.9 billion, per annum Or £75 per household, per annum Or 2.1%
Estimated increased in price of selected food baskets implied by Kantar data (1) Fresh chicken +0.9% Fresh beef +0.7% Fresh fruit & vegetables +0.3% Ready meals, o/w Fish based +0.3% Meat based +0.9% Vegetarian +1.1% (a) Estimated increase in price of food baskets following the ‘trading up’ or ‘trading down’ that occurred purely as a consequence of the change in FWRAI.
60 The figures presented in this alternative version of Table 9 differ from those in the main text. Here we have used growth in real earnings as a measure of the economic cycle instead of the claimant count unemployment rate. In general, this leads to a set of estimated coefficients on FWRAI that are slightly smaller in absolute terms. Consequently the estimated impact of the increase in FWRAI on the price of the typical basket of each food type is slightly reduced.

Econometric modelling and household food waste 58
Appendix 6 – Econometric validity – Specification and Robustness testing61 Testing the statistical properties of the monthly rate of change of the volume of retail sales of the food, drink and tobacco equation Our intention was to develop a single quantitative summary statistic of food waste reduction activities. We did this by weighting together five different time series. In our opinion, each one of these series might potentially contain useful information about food waste reduction activities. Some of the series, such as the Lexis Nexis measure of press mentions, were likely to be quite distant from, but nevertheless maybe reflective of actual consumer behaviour. Others, including those from the CFWP (Consumer Food Waste Prevention) tracker, are in principle a good deal closer to capturing the consumer behaviours we are interested in. As we set out in Section 2.1, the weights used to combine these series were based on the ability of each, once normalised to have zero mean and unit standard deviation, by itself to explain reductions in the volume of retail sales of food, drink and tobacco (FDT). In terms of assessing the robustness we found that the ordering among the series was identical whether the weights were based on the coefficient attached to the normalised series, or whether they were based on its t-statistic. We believe that this approach is not only logically coherent but also robust. The ranking of the five series was invariant to the two alternative selection criteria that we considered. Moreover, the ranking has intuitive appeal, with those indicators that are a priori closest to actual consumer behaviours receiving the highest weight. At the specification stage we considered that FWRAI, constructed in this way, might well be non-stationary particularly over the sample period we consider in the study. Indeed, our prior belief was that it would exhibit non-stationarity, essentially because it was highly likely that WRAP and partner activity would have raised the mean of food waste reduction activities over time, and not least since the LFWH initiative was launched in 2007. Nevertheless, from an econometric perspective we do not believe that the potential non-stationarity of FWRAI necessarily makes invalid the specification of the equation for DLOG(QRSFDT), the monthly rate of change of the volume of retail sales of FDT. Considering the time-series properties of the regressors and the dependent variable, a priori it seemed plausible to us that the variables on the right-hand side of this specification could be non-stationary. They are: FWRAI; LOG(QRSDFT); LOG(RPIFDT/RPI); LOG(EARN/RPI); and LOG(QRS). At the same time we considered that the variable on the left-hand side – DLOG(QRSFDT) – would likely be stationary. Of course, this specification would still be statistically valid if the potentially non-stationary series on the right-hand side of this specification were in fact co-integrated but this would be a matter for formal empirical testing. There are clearly many examples of this type of error-correction specification in the literature, with perhaps the first being DHSY62.
61 This appendix is based on the response to comments made by an external peer reviewer, Prof Walter Distaso (Professor of Financial Econometrics, Imperial College London). 62 Davidson, J, Hendry, D, Srba, F and Yeo, S (1978) ‘Econometric Modelling of the Aggregate Time Series Relationship Between Consumers’ Expenditure and Income in the United Kingdom’, The Economic Journal, Vol. 88, No. 352, pp.661-692.
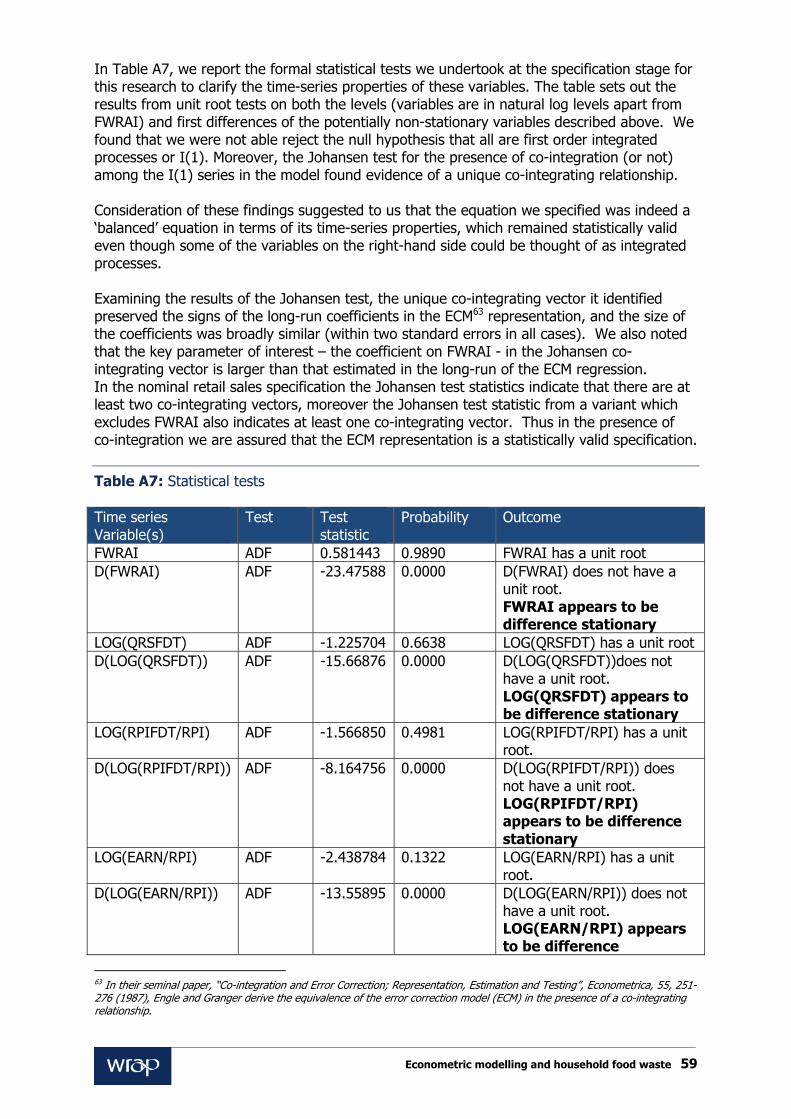
Econometric modelling and household food waste 59
In Table A7, we report the formal statistical tests we undertook at the specification stage for this research to clarify the time-series properties of these variables. The table sets out the results from unit root tests on both the levels (variables are in natural log levels apart from FWRAI) and first differences of the potentially non-stationary variables described above. We found that we were not able reject the null hypothesis that all are first order integrated processes or I(1). Moreover, the Johansen test for the presence of co-integration (or not) among the I(1) series in the model found evidence of a unique co-integrating relationship. Consideration of these findings suggested to us that the equation we specified was indeed a ‘balanced’ equation in terms of its time-series properties, which remained statistically valid even though some of the variables on the right-hand side could be thought of as integrated processes. Examining the results of the Johansen test, the unique co-integrating vector it identified preserved the signs of the long-run coefficients in the ECM63 representation, and the size of the coefficients was broadly similar (within two standard errors in all cases). We also noted that the key parameter of interest – the coefficient on FWRAI - in the Johansen co-integrating vector is larger than that estimated in the long-run of the ECM regression. In the nominal retail sales specification the Johansen test statistics indicate that there are at least two co-integrating vectors, moreover the Johansen test statistic from a variant which excludes FWRAI also indicates at least one co-integrating vector. Thus in the presence of co-integration we are assured that the ECM representation is a statistically valid specification.
Table A7: Statistical tests Time series Variable(s)
Test Test statistic
Probability Outcome
FWRAI ADF 0.581443 0.9890 FWRAI has a unit root D(FWRAI) ADF -23.47588 0.0000 D(FWRAI) does not have a
unit root. FWRAI appears to be difference stationary
LOG(QRSFDT) ADF -1.225704 0.6638 LOG(QRSFDT) has a unit root D(LOG(QRSFDT)) ADF -15.66876 0.0000 D(LOG(QRSFDT))does not
have a unit root. LOG(QRSFDT) appears to be difference stationary
LOG(RPIFDT/RPI) ADF -1.566850 0.4981 LOG(RPIFDT/RPI) has a unit root.
D(LOG(RPIFDT/RPI)) ADF -8.164756 0.0000 D(LOG(RPIFDT/RPI)) does not have a unit root. LOG(RPIFDT/RPI) appears to be difference stationary
LOG(EARN/RPI) ADF -2.438784 0.1322 LOG(EARN/RPI) has a unit root.
D(LOG(EARN/RPI)) ADF -13.55895 0.0000 D(LOG(EARN/RPI)) does not have a unit root. LOG(EARN/RPI) appears to be difference
63 In their seminal paper, “Co-integration and Error Correction; Representation, Estimation and Testing”, Econometrica, 55, 251-276 (1987), Engle and Granger derive the equivalence of the error correction model (ECM) in the presence of a co-integrating relationship.

Econometric modelling and household food waste 60
Time series Variable(s)
Test Test statistic
Probability Outcome
stationary LOG(QRS) ADF -0.789838 0.8199 LOG(QRS) has a unit root. D(LOG(QRS)) ADF -18.66712 0.0000 D(LOG(QRS))does not have a
unit root. LOG(QRS) appears to be difference stationary
FWRAI LOG(QRSFDT) LOG(RPIFDT/RPI) LOG(EARN/RPI) LOG(QRS)
Johansen Trace test indicates 1 cointegrating equations at the 0.05 level Maximum Eigenvalue test indicates 1 cointegrating equations at the 0.05 level The five I(1) series are cointegrated and there is a single co-integrating vector
ADF: Augmented Dickey-Fuller test Johansen: Johansen test for Cointegration Model specification and testing The main theoretical prior informing the choice of econometric model is that a strategy for reducing food waste would represent a reduction in the effective price per gram of food consumed (eaten, rather than purchased). Consequently, the consumer decision would be affected in a similar way – via income and substitution effects – as if the relative price of food had actually fallen. The only difference would flow from the fact that the effective price reduction arises because of an initial reduction in the physical quantity of food purchased per unit of food actually consumed. A reduction in the effective price of food amounts to a relaxation of the household budget constraint: a positive income effect. That effect will tend to increase the amount spent on all items including food – though the delta with respect to food from this source must, by construction, be smaller than the initial reduction in spending on food that arises thanks to the reduction in food waste. And a reduction in the relative price of food means that consumers can shift to a higher level of welfare by substituting into the item that has become cheaper: food. Depending on underlying consumer preferences and the respective magnitudes of these income and substitution effects, together they could combine in such a way as to imply either a reduction in the amount spent on food, or no change, or an increase in the amount spent on food: that is an empirical question – the one which we set out to address in this econometric model. Consumers unambiguously improve their welfare if they are shown ways in which they can waste less food – and unambiguously reduce the proportion of food that they waste. It is highly likely that the weight of food consumed will fall, or remain unchanged. But the impact on the value of expenditure on food is ambiguous. If total expenditure on food falls by less than the weight of food purchased as a result of increasing understanding of the strategies available to reduce the proportion of food that is wasted, that would be consistent with households “trading up” in response to increased food waste reduction activities. Such trading up should show up in the difference between the

Econometric modelling and household food waste 61
real volume of food consumption (at constant prices) and the value of food consumption (at current prices). If constant price food sales fall more rapidly than current price food sales in response to a rise in FWRAI, then consumers must be shifting into higher priced items within the overall basket of foods: trading up. So our econometric strategy was to identify the impact of FWRAI on retail sales of food in both current and constant prices, controlling for the impacts of the “normal” determinants of such consumption decisions – income, prices, etc. FWRAI is an I(1) variable and we included it in the long-run part of the ECM specification, finding that it was statistically insignificant in the current price specification but significant (and negative) in the constant price version. The Durbin-Watson test in the dynamic equation for DLOG(QRSFDT) reported in Table A5 of the Appendix will be biased towards two and that more robust tests for serial correlation in the residuals should be carried out. We also agree that evidence of serial correlation would point to potential inconsistency in the estimator. We do find evidence of serial correlation using LM tests for serial correlation in the residuals in the constant price and current price model specifications. On that basis, we consider alternative estimators of the variance-covariance matrix and the parameter estimates that are robust to the presence of serial correlation. We report the results using alternative, consistent estimates of the model parameters and the variance-covariance matrix due to Newey-West in Table A8. Very similar results are produced when using the variance-covariance matrix due to White and it is therefore not reported here. In each case, we reject at the 5% level the null hypothesis that the true coefficient on the FWRAI term is zero. In the current price specification the consistent estimators show FWRAI remains insignificant under both White and Newey-West estimators. The statistical significance of the FWRAI term in the constant price specification is robust to alternative estimators of the coefficients of interest and the variance and covariance matrices. Indeed, one would reject at the 5% level the null that the FWRAI coefficient is zero using either the Newey-West or the White estimators. Using the standard OLS estimator, one would reject this hypothesis at the 10% level but not at the 5% level – in other words, the key empirical result here is slightly more significant using consistent estimators compared to OLS. To address the robustness of the estimated models we have undertaken a series of diagnostic tests (Chow, RESET, Jarque-Bera) for the specification and robustness of the models64. For the Chow break-point tests, we have chosen two potential break points: first, when the FWRAI series starts to increase in 2006; and second when FWRAI increases sharply after the introduction of the LFHW initiative in 2007. These points potentially mark the major non-linearities among the explanatory variables in the model – but the diagnostics do not indicate evidence of a major shift in the structure of the model. Both the constant and current price model specifications pass the Ramsey RESET tests, but fail the Jarque-Bera residual normality tests and the Chow tests. The finding that the residuals are not normally distributed provides grounds for doubt in relation to the confidence intervals around the coefficients – but not in relation to the coefficient values themselves: the OLS estimator is the best linear unbiased estimator even when the residuals are not normally distributed.
64 The results are not reported here but are available upon request from the authors.

Econometric modelling and household food waste 62
In considering the outcome from the Chow tests we look at estimates of recursive coefficients which indicate that the intercept term in the models is the reason for failing – the parameters of interest in the models exhibit stability. Chow tests on variant specifications looking at the long run variables are passed which provides assurance that the parameters we are interested in this study are stable.
Table A8: Regression output Test for significance of FWRAI using Newey-West standard errors and covariances that is robust to serial correlation in the residuals. The results are similar when White’s Heteroskedasticity-consistent standard errors and covariances are used. Dependent Variable: DLOG(QRSFDT_NSA_SA)
Method: Least Squares
Sample (adjusted): 1991M03 2012M07
Included observations: 257 after adjustments
HAC standard errors & covariance (Bartlett kernel, Newey-West fixed
bandwidth = 5.0000)
Variable Coefficient Std. Error t-Statistic Prob.
C -0.850593 0.223580 -3.804424 0.0002
DLOG(QRSFDT_NSA_SA(-1)) -0.366395 0.047555 -7.704653 0.0000
LOG(QRSFDT_NSA_SA(-1)) -0.418408 0.067234 -6.223204 0.0000
LOG(RPIFDT(-1)/RPI(-1)) -0.061925 0.066080 -0.937112 0.3496
LOG(EARN(-1)/RPI(-1)) 0.101126 0.047745 2.118051 0.0352
FWRAI(-1) -0.002723 0.001136 -2.398076 0.0172
LOG(QRS(-1)) 0.122520 0.048431 2.529753 0.0120
@TREND -0.000184 0.000107 -1.720861 0.0865
R-squared 0.403494 Mean dependent var 0.000149
Adjusted R-squared 0.386724 S.D. dependent var 0.014752
S.E. of regression 0.011553 Akaike info criterion -6.053156
Sum squared resid 0.033233 Schwarz criterion -5.942679
Log likelihood 785.8305 Hannan-Quinn criteria. -6.008727
F-statistic 24.06151 Durbin-Watson stat 2.164567
Prob(F-statistic) 0.000000

www.wrap.org.uk/food