Embed Size (px)
Citation preview

The author(s) shown below used Federal funds provided by the U.S. Department of Justice and prepared the following final report: Document Title: Final Report: Developing A Common Metric For
Evaluating Police Performance In Deadly Force Situations
Author(s): Bryan Vila, Ph.D., Lois James, Ph.D., Stephen M.
James, M.A., Lauren B. Waggoner, Ph.D. Document No.: 247985 Date Received: August 2014 Award Number: 2008-IJ-CX-0015 This report has not been published by the U.S. Department of Justice. To provide better customer service, NCJRS has made this Federally-funded grant report available electronically.
Opinions or points of view expressed are those of the author(s) and do not necessarily reflect
the official position or policies of the U.S. Department of Justice.
FINAL REPORT: DEVELOPING A COMMON METRIC FOR EVALUATING POLICE
PERFORMANCE IN DEADLY FORCE SITUATIONS
National Institute of Justice
Award 2008-IJ-CX-0015
(Grants.gov Funding Opportunity No. 2008-NIJ-1743)
by:
Bryan Vila, Ph.D., Professor of Criminal Justice and Criminology, Principal Investigator
Lois James, Ph.D., Assistant Research Professor
Stephen M. James, M.A., Doctoral Research Assistant
Lauren B. Waggoner, Ph.D., Postdoctoral Research Associate1
Simulated Hazardous Operational Tasks Laboratory
Sleep and Performance Research Center
Washington State University, Spokane
Submitted: August 27, 2012
1 Dr. Waggoner is now employed by the Naval Postgraduate School, Monterrey, Calif.
This document is a research report submitted to the U.S. Department of Justice. This report has not been published by the Department. Opinions or points of view expressed are those of the author(s)
and do not necessarily reflect the official position or policies of the U.S. Department of Justice.

NIJ Metric Development Final Report
08/27/12 ii
EXECUTIVE SUMMARY
Background
There is a critical lack of scientific evidence about whether deadly force management,
accountability and training practices actually have an impact on police officer performance in
deadly force encounters, the strength of such impact, or whether alternative approaches to
managing deadly force could be more effective. The primary cause of this lack is that current
tools for evaluating officer-involved shootings are too coarse or ambiguous to adequately
measure such highly variable and complex events. There also are substantial differences in how
key issues associated with police deadly encounters are conceptualized, even by subject matter
experts, how agencies can or should train for them, and what officers should—or reasonably
can—be held accountable for. As a consequence, trainers and policy makers have generally been
limited by subjective or rough assessments2 of deadly force performance or how challenging a
deadly force situation was.
Our research addressed this problem by using a novel pairing of two well-established
research methods, Thurstone scaling and concept mapping. With them, we developed
measurement scales that dramatically improve our ability to measure police officer performance
in deadly force encounters. We expect that these metrics will make it possible to better evaluate
the impact of management and training practices, refine them, and make assessment of
accountability more just and reasonable.
2 For example measuring by categories such as “poor, fair, good, very good, excellent” or “none, some, lots.”
This document is a research report submitted to the U.S. Department of Justice. This report has not been published by the Department. Opinions or points of view expressed are those of the author(s)
and do not necessarily reflect the official position or policies of the U.S. Department of Justice.

NIJ Metric Development Final Report
08/27/12 iii
Methods Summary
Deadly force experts often disagree about fundamental concepts such as “command
presence,” “situational awareness” or “tactical advantage.” In order to increase agreement about
key concepts, our research team first conducted an intense, two-day concept mapping focus
group with a diverse group of seventeen leading experts on policing and deadly force. Concept
mapping is a well-recognized technique for helping experts unpack their concepts, develop clear
definitions of terms, and discuss tangible ways to measure the variables that underlie their
concepts. In the concept mapping process, experts were driven to “dive below” the concepts that
structure their own thinking about deadly encounters in order to focus only on variables that
affect the difficulty of a deadly encounter and officer performance within an encounter. The
outcome of this process was a long list of statements about discrete, tangible and measurable
variables which affect difficulty or performance. With guidance from three additional top experts
who had not been able to attend the focus group, and conventions from previous data and
research on deadly encounters, we then developed Likert scales3 for each statement over a period
of months in order to specify the range of values within each difficulty or performance statement.
In order to determine the meaning of the different values assigned to the increments on
each statement’s Likert scale—how much a given increment contributed to the difficulty of a
deadly encounter, or to an officer’s performance in that encounter, we next had 289 use-of-force
trainers from 209 different agencies across the United States score them independently using an
online Thurstone equal-appearing-interval scaling process.
3 Likert-type scales are a widely used approach to scaling responses in survey research where respondents identify how much they agree or disagree with a series of statements using a symmetric agree/disagree scale.
This document is a research report submitted to the U.S. Department of Justice. This report has not been published by the Department. Opinions or points of view expressed are those of the author(s)
and do not necessarily reflect the official position or policies of the U.S. Department of Justice.

NIJ Metric Development Final Report
08/27/12 iv
As a result of this process, we were able to produce interval-level metrics for each
difficulty or performance statement that could be used to measure situational difficulty or officer
performance. In order to obtain a preliminary assessment of their validity, reliability, and utility,
we then pilot tested the scales using experimental and quasi-experimental research designs.
These pilot studies also helped us develop an instruction manual for using the metrics.
Findings Summary
The experts who participated in the concept mapping workshop generated 111 statements
related to the difficulty of deadly encounters, and 105 statements related to officer performance
within a deadly encounter. When these statements were operationalized and broken into
measurable Likert-scale items, we had a total of 311 difficulty statement items and 289
performance statement items. The use-of-force trainers assigned scores ranging from 0 (no
impact) to 6 (highest impact) for difficulty statements, and scores ranging from -6 (extremely
negative impact) to +6 (extremely positive impact) for performance statements (where 0 was no
impact on performance). Statistical analyses of their scoring produced DFJDM metrics with
interval-level precision. This improvement over existing metrics increased both precision and
analytical power. During pilot testing, we found that the metrics can be used to score data from
experiments using deadly force judgment and decision-making simulators and data from field
training experiments that evaluate officer performance using role-play scenarios.
More recently, we have begun using this novel technique for measuring what matters—
rather than just what is easy to measure—in complex, fast-paced, high-risk situations that require
great expertise. We now have two large studies underway, one on the impact of fatigue on
officer performance (funded by the Office of Naval Research and the California Commission on
Peace Officer Standards and Training), and another funded by the Defense Advanced Research
This document is a research report submitted to the U.S. Department of Justice. This report has not been published by the Department. Opinions or points of view expressed are those of the author(s)
and do not necessarily reflect the official position or policies of the U.S. Department of Justice.
NIJ Metric Development Final Report
08/27/12 v
Projects Agency (DARPA) that centers on police and warfighter’s tactical social interactions
with non-combatants.
Discussion Summary
The deadly force judgment and decision making metrics (DFJDM) developed by this
research can be used to compare officer performance across different deadly force situations by:
1) Consistently measuring performance criteria that veteran police trainers and policy
makers agree are most important;
2) Controlling for the relative difficulty of the highly-variable social encounters in which
deadly force judgment, decision making, and use of force take place; and
3) Making these measurements at the interval-level, which makes it possible to use more
powerful statistical techniques to understand performance and difficulty in these
encounters.
This novel capability will be useful for researchers, trainers, and policy makers because it
makes it possible to compare the extent to which a management or training intervention affects
the probability that officers will be able to achieve an optimal—or at least acceptable—outcome
in a deadly force encounter. It will improve our ability to evaluate organizational policies and
procedures and develop more effective deadly force training. With regard to justice and
accountability, research using the DFJDM metrics will also help ensure that our expectations for
police performance are reasonable. Despite these improvements, we emphasize that outcomes
from police actions in complex social encounters such as those that involve violence or threats of
violence are inherently probabilistic. Both the mathematics of complexity and experience on the
This document is a research report submitted to the U.S. Department of Justice. This report has not been published by the Department. Opinions or points of view expressed are those of the author(s)
and do not necessarily reflect the official position or policies of the U.S. Department of Justice.
NIJ Metric Development Final Report
08/27/12 vi
street make it clear that sometimes officers do everything as well as a person possibly could and
things still turn out tragically—and vice versa.
Dissemination of Research and Translation to Practice Summary
Translation of this research into practice was a high priority throughout the grant and
continues now that the project is complete. We disseminate research results as they emerged
making a concerted effort to disseminate information about our work to policy makers,
researchers, police managers, trainers, and training simulator manufacturers throughout the
study. Approaches used included formal presentations to members of these groups, giving
interviews to news media specializing in police topics about the project, and personally
informing influential members of both law enforcement communities and the military about this
work and how it applies to their own areas of interest.
We also cultivated interest in the importance of building our capacity to measure what
matters in deadly encounters among researchers and policy makers, and created a consumer base
for the metrics in the police training community. In particular, the many organizations that
assisted with this research, and the hundreds of police experts who participated in either the
focus group or the survey, provide an influential foundation for translating the DFJDM metrics
into practice. We also have taken active steps to encourage commercial transition of the DFJDM
metrics into the training simulation industry. Data for this project and a DFJDM instruction
manual were archived with the National Archive of Criminal Justice Data (NACJD) on
December 17, 2011.
This document is a research report submitted to the U.S. Department of Justice. This report has not been published by the Department. Opinions or points of view expressed are those of the author(s)
and do not necessarily reflect the official position or policies of the U.S. Department of Justice.

NIJ Metric Development Final Report
08/27/12 vii
Recommendations for Future Research Summary
The DFJDM metrics improve our ability to understand the dynamics of deadly
encounters, but they clearly require further validation and refinement. The results of this
research provide a new benchmark for measuring deadly force judgment and decision making,
but that benchmark must evolve as researchers and practitioners use evidence-based approaches
to refine them. Examples of studies that would be made possible or improved by using DFJDM
measurement scales include:
• Experimental comparisons of the efficacy of different deadly force training regimes,
policies and practices, and their costs and benefits;
• Experimental evaluations of the causal link between deadly force standards,
accountability systems, or training and real-world performance.
• Experimental comparisons of the efficacy of different accountability systems and their
costs and benefits;
• Research to better understand why officers refrain from using deadly force even though
they would have been justified to do so, and the situational and interpersonal dynamics
that influence their exercise of restraint;
• Explorations of links between individual characteristics (e.g., experience, training, risk-
tolerance, cognitive abilities, etc.) and how officers tend to perform in deadly encounters;
• Refinement of DFJDM items through the use of scale-development and validation
techniques to winnow out less important or less valid items and collapse strongly co-
varying items into indices; and
• Analysis of the interactions between DFJDM variables and how they influence police use
of deadly force and the relative difficulty of different deadly encounters;
This document is a research report submitted to the U.S. Department of Justice. This report has not been published by the Department. Opinions or points of view expressed are those of the author(s)
and do not necessarily reflect the official position or policies of the U.S. Department of Justice.

NIJ Metric Development Final Report
08/27/12 viii
• Experimental evaluations of the impact of different work-hour practices and officer
fatigue on performance in simulated and real deadly force encounters;
• Experiments on the impact of team training regimes such as those currently used to
prepare officers to respond to active-shooter situations; and
• Research and development studies intended to refine, improve and innovate deadly force
training technologies and techniques.
These next steps are critical for building our understanding of the dynamics of deadly
encounters and for determining the kinds of policies, practices and training that will work best to
promote justice and keep our communities and the police officers who serve them safe.
This document is a research report submitted to the U.S. Department of Justice. This report has not been published by the Department. Opinions or points of view expressed are those of the author(s)
and do not necessarily reflect the official position or policies of the U.S. Department of Justice.

NIJ Metric Development Final Report
08/27/12 ix
ACKNOWLEDGEMENTS
The following members of the Simulation Lab team at WSU’s Sleep and Performance
Research Centre made major contributions to this report and the research that underlies it: Lois
James, Ph.D., Stephen M. James, M.A. and Lauren B. Waggoner, Ph.D.
We are most grateful for the expert guidance and assistance of project consultants Lorie
Fridell, Ph.D., David Klinger, Ph.D. and Gregory B. Morrison, Ph.D and our NIJ project
manager, Brett Chapman, Ph.D. And we greatly appreciate the technical support and advice
provided by the Federal Law Enforcement Training Center at Glynco, Ga., especially Deputy
Assistant Director Valerie Atkins, Senior Research Psychologist Terry Wollert, Ph.D., and
CRADA manager Dee Sheppe.
Finally, we are deeply indebted to the hundreds of law enforcement professionals who
participated in this project whom we are unable to name because human subjects regulations and
research ethics require their anonymity: the distinguished subject matter experts who participated
in the concept mapping focus group, the hundreds of certified and highly experienced police
trainers who spent hours scoring the metrics items on-line, and the dozens of police officers who
participated in our experiments.
This document is a research report submitted to the U.S. Department of Justice. This report has not been published by the Department. Opinions or points of view expressed are those of the author(s)
and do not necessarily reflect the official position or policies of the U.S. Department of Justice.

NIJ Metric Development Final Report
08/27/12 x
Table of Contents
EXECUTIVE SUMMARY ................................................................................................. ii Background ................................................................................................................................ ii Methods Summary .................................................................................................................... iii Findings Summary .................................................................................................................... iv Discussion Summary ................................................................................................................ v Dissemination of Research and Translation to Practice Summary ........................................... vi Recommendations for Future Research Summary .................................................................. vii
ACKNOWLEDGEMENTS ............................................................................................... ix INTRODUCTION .............................................................................................................. 1
Research Purpose, Goals and Objectives ................................................................................ 1 REVIEW OF RELEVANT LITERATURE ......................................................................... 6
Understanding Deadly Force Encounters ................................................................................. 6 Managing the Use of Deadly Force .......................................................................................... 8 Deadly Force Training ............................................................................................................. 10 Conclusions ............................................................................................................................ 14
RESEARCH METHODS ................................................................................................ 16 CONCEPT MAPPING RESEARCH ............................................................................... 19
Research Design .................................................................................................................... 19 Focus Group Leadership ........................................................................................................ 21 Subjects .................................................................................................................................. 22 Materials ................................................................................................................................. 23 Procedures .............................................................................................................................. 23 Results .................................................................................................................................... 28
THURSTONE SCALING RESEARCH ........................................................................... 30 Research Design .................................................................................................................... 30 Subjects .................................................................................................................................. 30 Materials ................................................................................................................................. 31 Procedures .............................................................................................................................. 31 Results .................................................................................................................................... 33
PILOT TESTING METRICS UTILITY, VALIDITY AND RELIABILITY .......................... 36 Testing the Metrics with Experimental Data ............................................................................ 36 Testing the Metrics with Data Collected from Field Studies .................................................... 41 Replication of Metric Development Technique ....................................................................... 45
DISCUSSION OF PILOT STUDY RESEARCH RESULTS ........................................... 47 Interpretation of Pilot Test Results .......................................................................................... 47 Current DFJDM Limitations ..................................................................................................... 49
SUMMARY OF ACCOMPLISHMENTS ......................................................................... 54 Objectives Achieved ............................................................................................................... 54 Policy Implications .................................................................................................................. 55 Recommendations for Future Metric Validation and Refinement Research ........................... 58 Dissemination of Research Results ........................................................................................ 62 Conclusions ............................................................................................................................ 67
This document is a research report submitted to the U.S. Department of Justice. This report has not been published by the Department. Opinions or points of view expressed are those of the author(s)
and do not necessarily reflect the official position or policies of the U.S. Department of Justice.

NIJ Metric Development Final Report
08/27/12 xi
REFERENCES ............................................................................................................... 69 Legal Cases ............................................................................................................................ 78
APPENDICES ................................................................................................................ 79 Appendix A: Subject Matter Experts’ Concept Mapping Workshop Agenda .......................... 79 Appendix B: Slides Used To Facilitate Concept Mapping Workshop ..................................... 81 Appendix C: Subject Matter Expert Demographics ................................................................. 84 Appendix D: List of Original Difficulty And Performance Statements ...................................... 85 Appendix E: List of Operationalized Difficulty and Performance Statements ......................... 96 Appendix F: Maps and Charts Generated During the Concept Mapping Process ............... 125 Appendix G: Use of Force Instructor Raters Demographics ................................................. 129 Appendix H: Scores Assigned to the Difficulty and Performance Statements ...................... 130 Appendix I: Handbook for Using the DFJDM Metrics ........................................................... 159 Appendix J: NACJD Data Deposit Online Transaction ......................................................... 162
This document is a research report submitted to the U.S. Department of Justice. This report has not been published by the Department. Opinions or points of view expressed are those of the author(s)
and do not necessarily reflect the official position or policies of the U.S. Department of Justice.

NIJ Metric Development Final Report
08/27/12 1
INTRODUCTION
Research Purpose, Goals and Objectives
This project developed a set of metrics for evaluating police performance in real or
simulated deadly force encounters. Prior to the development of these metrics, our ability to
evaluate performance in these types of social encounters was very limited and, as a consequence,
so was our ability to understand the dynamics of police deadly force confrontations or to
evaluate what kinds of policies, practices and training work best. The Deadly Force Judgment
and Decision Making Metrics (DFJDM)5 developed under this grant from the National Institute
of Justice are comprised of two scales, one that measures the most important dimensions of
performance in deadly force situations (the P-scale) and another that measures the relative
difficulty of different deadly force situations (the D-scale). This second scale improves the
validity and utility of the P-scale by making it possible to control for the impact of situational
difficulty on performance. It improves our ability to measure and understand the social
dynamics that structure deadly force encounters in order to assure that performance standards
and training are realistic. Taken together, these metrics are expected to substantially improve the
ability of policy makers, law enforcement managers and trainers, and researchers to assess the
impact of policies, practices and training on performance among groups of police officers.
Officer-involved shootings put bystanders, officers and suspects at extreme risk, and the
consequences of these incidents often shake communities to their very core. During the past
decade, more than 500,000 police officers were assaulted in the United States. Of those, 575
were killed and more than 160,000 were injured (FBI annual). On average, police officers 5 Pronounced “Dêf-jâm” by our research team.
This document is a research report submitted to the U.S. Department of Justice. This report has not been published by the Department. Opinions or points of view expressed are those of the author(s)
and do not necessarily reflect the official position or policies of the U.S. Department of Justice.

NIJ Metric Development Final Report
08/27/12 2
justifiably kill about 400 people each year and handle an estimated 664,500 encounters where
they use or threaten to use force (Brown & Langan 2001, Durose, Schmitt & Langan 2005). The
critical importance of teaching officers to make sound decisions in deadly force confrontations—
despite the fact that they often occur in complex, fast-paced, ambiguous and low-information
situations—is reflected in the fact that recruit academies devote more time to firearms training
than to any other major activity (Hickman 2005).
Law enforcement agencies manage the use of deadly force by establishing performance
standards, holding people accountable for meeting those standards and training them how to do
so. Performance standards include laws, written policies and procedures as well as usual and
accepted practices for meeting those standards. Deadly force performance standards need to be
clear, unambiguous, measurable, comprehensive and consistent. In the interest of work-place
justice, they also must be attainable. As Princeton ethicist Kwame Anthony Appiah put it, “If
you say somebody ought to do something, you must be supposing that it is something they can
do” (2008: 22). In order to be attainable, deadly force performance standards must be based on a
clear understanding of the real-world challenges presented by deadly force situations, and the
limits of human performance (Vila 2010). Accountability systems are used to enforce deadly
force performance standards, punish officers who violate them and deter others from doing so.
Accountability is accomplished through direct supervision, performance monitoring
systems that “red flag” potentially problematic patterns of behavior, and by adjudication.
Training teaches officers about standards for performance and what an agency’s goals and
priorities are. It also must provide them with knowledge, skills and abilities that enable them to
manage deadly force encounters consistent with performance standards. Major components of
the training process generally include: 1) setting performance, knowledge and skill goals and
This document is a research report submitted to the U.S. Department of Justice. This report has not been published by the Department. Opinions or points of view expressed are those of the author(s)
and do not necessarily reflect the official position or policies of the U.S. Department of Justice.
NIJ Metric Development Final Report
08/27/12 3
objectives, 2) developing training materials, processes and measurement instruments, 3)
choosing the manner in which materials should be presented, and in what order, 4) conducting
training, testing and measuring performance, obtaining self-assessments of performance,
critiquing trainee performance and identifying lessons learned, then 5) refining and expanding
the scope of training until goals are met. Ultimately, trainees are either failed or certified as
possessing the knowledge, skills and abilities required to meet performance standards.
It is not possible for a law enforcement agency to adequately manage the use of deadly
force without valid and sufficiently accurate measures of deadly force performance. The lack of
such measures makes it difficult to assess whether policies and procedures are being adhered to,
or to hold people accountable for doing so. It also is extremely difficult for an organization to
evaluate whether management practices and training are having the desired impact or to identify
effective ways of improving performance. Performance measures are the tools that enable law
enforcement managers to navigate in a very challenging world. Without them, they sail blind.
Police deadly force training provides a good example of the consequences of our current
limited ability to measure performance, because training is the primary conduit through which
changes in policy and practice are assumed to be accomplished. Despite the fact that police
deadly force training has changed dramatically over the past three decades, we still don’t know
what those changes have accomplished. When the PI was a street cop 40+ years ago, most
officers qualified on ranges by standing, weapons at the ready, 60-75 feet from a black silhouette
target, then firing on command. Today, firearms and deadly force training varies from more
realistic range shooting to high-tech simulators which involve officers in training scenarios
which integrate tactics, decision making, marksmanship and gun-handling skills. Instead of
focusing on the mechanics of target shooting, these computerized deadly force judgment and
This document is a research report submitted to the U.S. Department of Justice. This report has not been published by the Department. Opinions or points of view expressed are those of the author(s)
and do not necessarily reflect the official position or policies of the U.S. Department of Justice.

NIJ Metric Development Final Report
08/27/12 4
decision making simulators—a.k.a. firearms training simulators (FTS)—attempt to approximate
the dynamic complexity of potentially deadly situations like those officers encounter in the field.
Although it seems intuitively obvious that changes such as the increased use of FTS or
newer deadly force policies and field practices should have improved performance in deadly
force situations, no scientific research has been done to evaluate the impact of these changes on
officer performance in the field. Researchers currently are unable to meet this need empirically
because the instruments available for studying officer-involved shootings are too crude. Like
civil engineers trying to build a complex modern office building with ancient measuring rods
instead of computerized lasers that accurately measure distance, height and azimuth, scientists
are hampered by an inability to analyze the complex interactions between officers, offenders and
bystanders in the highly variable, fast-paced, low-information confrontations where deadly force
decisions are often made and shootings occur.
Such analysis requires clearly defined performance goals for deadly force confrontations
and an ability to compare performance across many such confrontations despite enormous
differences in their relative difficulty. The lack of this ability blocks us from evaluating the
impact of training regimes, policies and practices on performance in deadly force confrontations
with sufficient precision to understand whether a training regime, policy or practice tends to
cause better performance and why.
Our research has attempted to fill this critical need by developing valid and reliable
measurement scales that provide trainers, policy makers and researchers with a common metric
for measuring officer-involved shooting performance and the relative difficulty of potential
deadly force situations. Because the DFJDM scales provide interval-level data, they make it
This document is a research report submitted to the U.S. Department of Justice. This report has not been published by the Department. Opinions or points of view expressed are those of the author(s)
and do not necessarily reflect the official position or policies of the U.S. Department of Justice.

NIJ Metric Development Final Report
08/27/12 5
possible to conduct substantially more nuanced and precise research that responds better to the
needs of our communities and the officers who serve them.
The goal of our DFJDM scale development process was to uncover the important
structural elements that are common to all deadly force situations and develop a tool for
measuring those elements. We pursued that goal using well-understood statistical techniques
and a theoretical and practical understanding of deadly force situations and risk management in
complex situations. We accomplished it by achieving three objectives:
Objective 1: We developed interval-level scales for measuring both the difficulty of
deadly force situations and officer performance in those situations. Our approach
involved having police deadly force training experts and executives work with our
research team to identify and define key concepts that the scales must measure, then
engaging a large number of certified police trainers to independently participate in a well-
accepted scale-development protocol.
Objective 2: We pilot tested the hypothesis that scenario difficulty as measured by the
D-scale has a significant effect on officer performance in deadly force scenarios as
measured by the P-scale in an experiment using a computerized high-fidelity firearms
judgment and decision making simulator. Here the refined scales were tested
experimentally based on the performance of experienced field officers in a controlled yet
realistic setting.
Objective 3: We conducted preliminary tests of the validity, reliability and utility of the
DFJDM scales using data collected from field research. Here the performance metrics
were used to score police officer performance in role-playing simulations of active
shooter scenarios, where situational difficulty was held constant.
This document is a research report submitted to the U.S. Department of Justice. This report has not been published by the Department. Opinions or points of view expressed are those of the author(s)
and do not necessarily reflect the official position or policies of the U.S. Department of Justice.

NIJ Metric Development Final Report
08/27/12 6
REVIEW OF RELEVANT LITERATURE
Even though deadly force is viewed as a last resort, every official interaction between an
officer and a citizen contains the potential for police use of deadly force (Bittner 1975). Good
police work requires that officers skillfully manage encounters without backing down, both
gaining control over a situation and doing their best to avoid unnecessarily putting themselves
into vulnerable situations in which they will have no choice but to shoot (Fyfe 1997: 6; see also
Fyfe 2000). Even police shootings that are morally, legally and procedurally justified can have
potentially devastating consequences. As Geller and Scott (1992: 1) note, “Any experienced
police officer knows the potentially devastating effects of even justified shootings by police–loss
of life and bereavement, risks to an officer’s career, the government’s liability to civil suits,
strained police-community relations, rioting and all the economic and social crises that attend
major civil disturbances.” Equally important, incorrect decisions not to shoot, missed shots, and
inappropriate tactics can cost officers or bystanders their lives, or leave them grievously injured.
Understanding Deadly Force Encounters
Situational variability makes it especially difficult to conduct research that can be used
for data-driven management practices because of the extreme diversity of deadly force
encounters. An intricate set of interactions begin at the moment an officer directs a person to
stop a vehicle, pause to answer a question, open a door or put down a weapon. Artwohl and
Christensen (1997) describe this as the “survival triangle” in which officers must balance
physical, psychological and legal imperatives. Officers attempt to manage this process in a way
that results in a more desirable outcome (e.g., fewer and less serious injuries to bystanders,
officers and suspects, as well as less use of force). This is often accomplished through a nuanced
This document is a research report submitted to the U.S. Department of Justice. This report has not been published by the Department. Opinions or points of view expressed are those of the author(s)
and do not necessarily reflect the official position or policies of the U.S. Department of Justice.
NIJ Metric Development Final Report
08/27/12 7
process in which both the officer and his or her opponent communicate back and forth using
language, gestures and body language in an effort to assess threats, weigh risks and make
counter-threats while escaping serious injury themselves. This process follows a well-
understood dynamic common to all “rational,” self-interested uses of aggression (e.g., see Barash
1982; Parker 1974). Unfortunately, officers’ opponents often are not rational or even acting in
their own interests because a large proportion of them are cognitively impaired, delusional or
suicidal (Klinger 2001).
Klinger’s (2005) theory of deadly force incidents that is based on Normal Accident
Theory (Perrow 1984) was critical to the development of our metrics. Perrow’s approach has
been used to understand many types of catastrophic incidents involving human systems ranging
from the space shuttle Challenger disaster to railway accidents, airplane crashes and public
health crises. Klinger’s theory applies Perrow’s concepts to explain why deadly force
performance and decision-making become increasingly difficult and error prone as a function of
two variables: complexity and coupling. Taken together, these constructs capture important
dimensions of variability such as distance between officer and suspect, number of officers and
bystanders, availability/use of cover, and how quickly the encounter unfolds.
A situation becomes more complex both as the number of key elements (e.g., more
officers, suspects, bystanders, victims, weapons) and the number of interactions between those
elements increases.6 Increasing complexity makes it more difficult to understand the situation
and formulate appropriate responses in a given length of time. Coupling between elements refers
to the extent to which change in one element affects another, causing the situational aspects of
these social encounters to become more volatile. Coupling further compounds the level of 6 For an accessible introduction to the science of complexity, see W. Brian Arthur, “Complexity and the Economy,” Science, 2 April 1999, 284, 107-109.
This document is a research report submitted to the U.S. Department of Justice. This report has not been published by the Department. Opinions or points of view expressed are those of the author(s)
and do not necessarily reflect the official position or policies of the U.S. Department of Justice.

NIJ Metric Development Final Report
08/27/12 8
difficulty that challenges effective performance by causing unexpected cascades of interactions
that can suddenly produce undesirable consequences. For example, when a club-wielding
suspect produces a handgun, the lethal zone around him instantly expands and the consequences
of strategies for neutralizing him become much more complex. Suddenly, an officer confronting
the suspect must factor into her analysis bystanders who are many yards away instead of just
those who are within reach. As both the complexity and coupling of a deadly force situation
increase, difficulty and the probability of an undesirable outcome also increase.
One of the most important insights of Normal Accident Theory is that unexpected,
disastrous outcomes are inevitable in hazardous, complicated human endeavors such as potential
deadly force encounters. This means two things: 1) sometimes a catastrophe occurs even when
an officer does everything skillfully and professionally, and 2) it is possible to reduce the
probability of a disaster by understanding the roles of complexity and coupling in deadly
encounters and addressing those vulnerabilities.
Managing the Use of Deadly Force
Law enforcement agencies manage the use of deadly force by establishing performance
standards, effectively and diligently monitoring performance, holding people accountable for
meeting those standards and training them how to do so. Effective deadly force management is
imperative because police officers exercise a great deal of discretion about how and when they
use powers that are unique to this occupation such as their authority to use force to coerce
compliance without due process. This discretion is a fundamental necessity for justice because
the enforcement of laws requires officers to use common sense and flexibility to solve the
effectively infinite range of varied, nuanced and potentially deadly problems that they encounter.
However, these discretionary powers also must be carefully controlled because the abuse of
This document is a research report submitted to the U.S. Department of Justice. This report has not been published by the Department. Opinions or points of view expressed are those of the author(s)
and do not necessarily reflect the official position or policies of the U.S. Department of Justice.

NIJ Metric Development Final Report
08/27/12 9
discretion is a major source of injustice. As Goldstein put it, the proper use of discretion “... is
essential if the police are to achieve a system of law enforcement that is not only efficient, but
also fair and effective” (Goldstein 1967a).
This means that managing the use of deadly force is one of a police executive’s most
important responsibilities. As Ronald C. Ruecker, a past president of the International
Association of Chiefs of Police, noted, “There is little doubt that managing and dealing with the
questions and problems surrounding the use of force by our officers is one of the most difficult
issues that confronts law enforcement executives” (2007). With regard to managing the risks
associated with deadly force, the late James J. Fyfe, another prominent police executive and
scholar, noted that “…the best way to protect a jurisdiction’s pocketbook against lawsuits is to
assure that the professional law enforcement standard of care is reflected in its policies, training,
and practices” (1997:9). In order to assure the proper and just use of discretion, we develop
policies, screen new employees, then train, educate and develop officers with the goal of
assuring that they understand how to use discretion properly. We also attempt to assure that they
know they will be held accountable for misusing their powers. Then we watch what they do,
correcting where possible and punishing when necessary (Goldstein 1967b: 161). Our
assumption is that the right combination of moral fiber, ethical standards, training, supervision
and deterrence will do a satisfactory job of keeping police use of deadly force within the limits
set by law and official policy.
Unfortunately, this assumption is largely taken on faith because we lack the tools to
adequately measure whether standards, practices or training have an impact on how well officers
use deadly force. This same lack of measures also hinders our ability to improve practices by
This document is a research report submitted to the U.S. Department of Justice. This report has not been published by the Department. Opinions or points of view expressed are those of the author(s)
and do not necessarily reflect the official position or policies of the U.S. Department of Justice.

NIJ Metric Development Final Report
08/27/12 10
identifying problems, developing potential solutions, then evaluating whether those solutions
worked.
Policing agencies have made great strides using strategic performance measures to bring
focus and discipline to their mission and increase effectiveness and accountability. For example,
see DeLorenzi et al.’s discussion of CompStat (2006) and the discussion by Pateman and Grus
(2004) of the RCMP’s use of the “balanced scorecard” approach to measuring strategic
performance (Kaplan 2002). Unfortunately, current strategic performance metrics only make it
possible to measure high-level organizational goals. Even though deadly force management is
such a high priority, policing agencies have not been able to bring performance measurement
techniques to bear on this problem effectively because metrics haven’t been available to make
them meaningful.
Our relative inability to measure deadly force performance also undermines the
accountability systems used to enforce deadly force performance standards, punish officers who
violate them and deter others from doing so. Accountability systems include oversight boards,
direct supervision, performance monitoring that “red flags” potentially problematic patterns of
behavior, and adjudication. None of these mechanisms is able to function well in the absence of
clear, empirically-based and realistic measures of what constitutes good performance in a
situation with a given level of difficulty. Managers can’t control or improve what they can’t
measure, and things that can only be measured poorly cannot be managed well.
Deadly Force Training
Training teaches officers about standards for performance and what an agency’s goals
and priorities are. It also must provide them with knowledge, skills and abilities that enable them
This document is a research report submitted to the U.S. Department of Justice. This report has not been published by the Department. Opinions or points of view expressed are those of the author(s)
and do not necessarily reflect the official position or policies of the U.S. Department of Justice.

NIJ Metric Development Final Report
08/27/12 11
to manage deadly force encounters in a manner consistent with performance standards.
Ultimately, trainees are either failed or certified as possessing the knowledge, skills and abilities
required to meet performance standards. And those standards are the result of many years of
concerted and thoughtful work by law enforcement professionals. As Patrick Bradley, a
nationally-recognized leader on law enforcement standards and training described it,
Each POST agency,7 in cooperation with and supported by community leaders, elected
officials, professional law enforcement administrators, academicians, and the directors'
association, has established a standard that each officer has passed. These standards are
not arbitrary, not based on lore, supposition, or wishful thinking; rather, each required
characteristic has been identified and validated as predictive of the officer's capacity to
perform the job's essential functions [emphasis added]. (Bradley 2005)
Unfortunately, the “validation” that Bradley refers to is seldom the result of empirical research
that can establish a causal link between what officers are trained to do and how they perform in
the field (Morrison 2002, 2003; Morrison and Vila 1998).
Deadly force training in particular, reflects only how well officers perform on training
tests designed by experienced police officers and firearms experts over the course of many years.
The personal experiences and insights and the received wisdom of a profession drive training
methods, topics, and techniques—not science. Until now, no one has had the ability to do a
better job of evaluating police performance in deadly force encounters than to rely on the, mostly
subjective, evaluations of subject matter experts.
A brief history of police deadly force training helps explain the current state of affairs.
U.S. policing traces its ancestry to the mid-1800s, but handgun training did not become
7 Statewide police officer standards and training organizations.
This document is a research report submitted to the U.S. Department of Justice. This report has not been published by the Department. Opinions or points of view expressed are those of the author(s)
and do not necessarily reflect the official position or policies of the U.S. Department of Justice.

NIJ Metric Development Final Report
08/27/12 12
widespread until the 1920s. From then until the 1950s, training consisted primarily of daylight
target shooting where officers would shoot an already-unholstered weapon from a standing
position at a single paper bull’s-eye target placed between 45 to 75 feet away. Such training was
wholly unrelated to the real-life situations in which officers were likely to use their handguns
(Morrison 2002, 2003; Morrison & Vila, 1998). Subsequent improvements to firearms training
were designed to be more realistic. For example, the FBI’s Practical Pistol Course (PPC)
gradually replaced bull’s-eye target shooting. Although the PPC was far more practical, many of
its emphases were still unrealistic (e.g., see Miller and Kurata 2007; Pinizzotto, Davis and Miller
2006).
Dramatic increases in the number of officers killed feloniously in the line of duty during
the 1960s and into the early 1970s (see e.g., Fridell and Pate 1997a, 2001) sparked renewed
attention to training designed to improve “officer survival.” As a consequence, practitioners
began trying out novel ways to reduce officers’ exposure to risk while increasing combat
shooting proficiency. For the most part, these changes focused on marksmanship and gun-
handling techniques, routine field procedures and tactics for dangerous encounters. And they
rarely relied upon rigorous scientific methods. By the 1980s, improved practices began to
coalesce under the influence of organizations such as state police officer standards and training
or “POST” commissions, the Commission on Accreditation of Law Enforcement Agencies, the
International Association of Law Enforcement Firearms Instructors and the American Society of
Law Enforcement Trainers. The U.S. Supreme Court’s landmark decisions in Tennessee v.
Garner, Graham v. Connor, and City of Canton v. Harris also drove important changes in
police deadly force policies and practices.
This document is a research report submitted to the U.S. Department of Justice. This report has not been published by the Department. Opinions or points of view expressed are those of the author(s)
and do not necessarily reflect the official position or policies of the U.S. Department of Justice.
NIJ Metric Development Final Report
08/27/12 13
Scenario-based training of various forms has become a critical part of training since the
1970s as increased emphasis was placed on teaching judgment and decision making skills.
Almost all recruit academies currently use reality-based scenarios to teach use-of-force topics
(Hickman 2005:14). Three popular scenario-based training platforms are role playing exercises
such as Simunitions® that use “marking cartridges;” live-fire range exercises featuring humanoid
targets; and high-tech, computer-controlled, interactive video or CGI8 simulations projected on
large screens (referred to as FTS throughout this report). All of these methods attempt to
simulate interactions with potentially dangerous subjects in order to generate some semblance of
the physiological and psychological challenges that can affect officers’ performance in real-life
confrontations.
However, in state and municipal law enforcement training, only computer-based firearms
training simulators approach what human factors engineers consider “high fidelity” simulation.
High fidelity simulators (e.g., trainers for astronauts, pilots and submariners) attempt to provide
realistically complex and stimulating environments for training and research that bridge the gap
between highly abstracted laboratory performance tasks and uncontrolled field exercises (Friedl
et al. 2004; Cooke & Shope 2004; Martin et al. 1998). We used this kind of high-fidelity
simulators to validate and refine the DFJDM scales.
The current state of the art for deadly force training in the United States is a far cry from
earlier years (Fridell 2005), but recent changes in deadly force training have not been uniformly
adopted by agencies across the nation. Training regimes vary substantially between agencies in
terms of timing, dosage, instructor quality, content and methods (Morrison 2001, 2002, 2003,
8 Computer Generated Imagery
This document is a research report submitted to the U.S. Department of Justice. This report has not been published by the Department. Opinions or points of view expressed are those of the author(s)
and do not necessarily reflect the official position or policies of the U.S. Department of Justice.

NIJ Metric Development Final Report
08/27/12 14
2005, 2006, 2007 and 2008). Moreover, there is a general lack of research evaluating the impact
of deadly force standards, practices or training.
Considerable research has been done on police use of deadly force itself (for summaries,
see Geller and Scott, 1992; Binder and Fridell, 1984; Alpert and Fridell, 1992; Fridell, 2005).
Most of these studies have been descriptive and none of them have attempted to evaluate the
causal link between deadly force standards, accountability systems, or training and real-world
performance. Early descriptive studies include a federally-funded study conducted by McManus
et al., (1970) and the 1974 and 1978 National Manpower Survey administered by the National
Institute of Law Enforcement and Criminal Justice (NILECJ) that collected information on
academy firearms training. Descriptive studies by Skillen and Williams (1977) and Matulia
(1982) came a bit later, while more recent information regarding the nature and extent of deadly
force use and training comes from the BJS census of law enforcement academies and the Police
Executive Research Forum (PERF) study on violence against police (e.g., Brand and Peak 1995;
Fridell et al. 2005; Hickman 2005; Holmes et al. 1992; Kaminski and Martin 2000; Marion 1998;
Marsh and Grosskopf 1991; Ness 1991; Talley 1984; Traut et al. 2000). There also have been a
number of “satisfaction with training” studies involving academy graduates and their perceptions
of the adequacy of their preparatory training that Morrison (2006) reviewed as a part of his
research on instructors’ perceptions of the adequacy of Washington State’s academy training for
recruits. Essentially, there is no body of research that evaluates the impact of standards,
practices or training on officer performance in field encounters.
Conclusions
Every policing agency has policies to establish acceptable practices within the bounds set
by law, and systems for holding officers accountable for their performance in deadly force
This document is a research report submitted to the U.S. Department of Justice. This report has not been published by the Department. Opinions or points of view expressed are those of the author(s)
and do not necessarily reflect the official position or policies of the U.S. Department of Justice.

NIJ Metric Development Final Report
08/27/12 15
encounters. Every police officer receives training to enable him or her to handle the terrible
responsibility for deciding when and how to use deadly force in the field and, when necessary, to
apply that force with skill. Every state has minimum standards for certifying that officers are
competent to make those decisions. Yet we have almost no scientific evidence that these policies,
procedures, practices, accountability systems or training actually have an impact on how
officers perform in deadly force encounters, whether any such impact is in the desired direction,
or whether alternative approaches to managing deadly force would be more effective.
The primary cause of this lack is the disparity between officer-involved shootings, which
are highly variable and complex events, and the coarse evaluation tools that are currently
available. Our research addressed this problem by developing measurement scales that are
intended to substantially improve our ability to measure police officer performance in these
encounters—and thus make it possible to evaluate the impact of management, policy, and
training practices. We achieved this end through the following research design.
This document is a research report submitted to the U.S. Department of Justice. This report has not been published by the Department. Opinions or points of view expressed are those of the author(s)
and do not necessarily reflect the official position or policies of the U.S. Department of Justice.

NIJ Metric Development Final Report
08/27/12 16
RESEARCH METHODS
Our research goal was to create and pilot test two interval-level scales that were
intended to be used together, one of which measures difficulty (D-scale) and the other
performance (P-scale). The D-scale is intended to measure attributes of a deadly force situation
that affect the probability of an unforeseen or undesirable outcome, and thus make it more
difficult for an officer to steer it—or force it—toward an optimal outcome. The P-scale measure,
on the other hand, is intended to measure or predict the quality of the outcome-relevant behavior
of an officer in that deadly force situation. We utilized two major techniques in the development
of these scales: a “concept mapping” process and a Thurstone scaling approach. We then tested
the validity, reliability and utility of these scales using data collected from experimental trials,
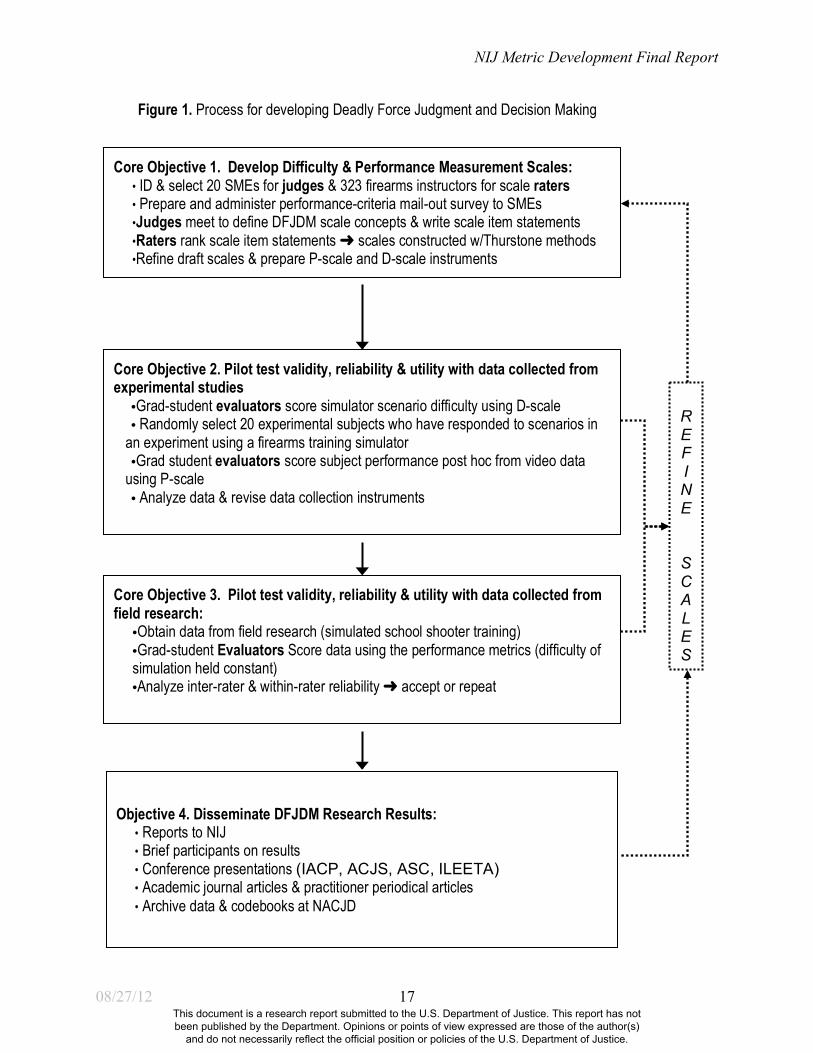
and data collected from field research. Figure 1 (following) outlines the research design we used
to develop and test these scales.
This document is a research report submitted to the U.S. Department of Justice. This report has not been published by the Department. Opinions or points of view expressed are those of the author(s)
and do not necessarily reflect the official position or policies of the U.S. Department of Justice.
NIJ Metric Development Final Report
08/27/12 17
Figure 1. Process for developing Deadly Force Judgment and Decision Making
Core Objective 3. Pilot test validity, reliability & utility with data collected from field research: •Obtain data from field research (simulated school shooter training) •Grad-student Evaluators Score data using the performance metrics (difficulty of simulation held constant) •Analyze inter-rater & within-rater reliability ➜ accept or repeat
Core Objective 2. Pilot test validity, reliability & utility with data collected from experimental studies •Grad-student evaluators score simulator scenario difficulty using D-scale • Randomly select 20 experimental subjects who have responded to scenarios in
an experiment using a firearms training simulator •Grad student evaluators score subject performance post hoc from video data
using P-scale • Analyze data & revise data collection instruments
Core Objective 1. Develop Difficulty & Performance Measurement Scales: • ID & select 20 SMEs for judges & 323 firearms instructors for scale raters • Prepare and administer performance-criteria mail-out survey to SMEs •Judges meet to define DFJDM scale concepts & write scale item statements •Raters rank scale item statements ➜ scales constructed w/Thurstone methods •Refine draft scales & prepare P-scale and D-scale instruments
Objective 4. Disseminate DFJDM Research Results: • Reports to NIJ • Brief participants on results • Conference presentations (IACP, ACJS, ASC, ILEETA) • Academic journal articles & practitioner periodical articles • Archive data & codebooks at NACJD
R E F I N E
S C A L E S
This document is a research report submitted to the U.S. Department of Justice. This report has not been published by the Department. Opinions or points of view expressed are those of the author(s)
and do not necessarily reflect the official position or policies of the U.S. Department of Justice.

NIJ Metric Development Final Report
08/27/12 18
The remainder of this report is split into five sections:
1. Concept Mapping Research, which reports the concept mapping focus group work
in detail. This includes a description of research design, subjects, materials, and
procedures and results.
2. Thurstone Scaling Research, which reports the DFJDM scale development
process in detail. This includes a description of the research design, subjects,
materials, and procedures and results.
3. Pilot Testing Metrics Utility, Validity and Reliability, which reports these efforts
in detail. This includes a description of the data used to test the metrics, steps
taken in applying the metrics, study variables and hypotheses examined, and
findings from the pilot testing process.
4. Discussion of Research Results, which provides a unified interpretation of results
from each of the pilot studies and discusses their limitations.
5. Summary of Accomplishments, which discusses the policy implications of our
work, makes recommendations for future research, reports efforts to disseminate
research results and translate them into practice, then provides a concise
conclusion.
This document is a research report submitted to the U.S. Department of Justice. This report has not been published by the Department. Opinions or points of view expressed are those of the author(s)
and do not necessarily reflect the official position or policies of the U.S. Department of Justice.

NIJ Metric Development Final Report
08/27/12 19
CONCEPT MAPPING RESEARCH
Research Design
Concept mapping is a widely used research method for identifying, visualizing and
transforming key concepts into measurement scales in situations where no widely-accepted,
objective measurement criteria are available, but participants in the research are able to provide
substantial amounts of subjective expertise about the issue of interest. As a first step, the PI was
qualified as a concept mapping facilitator after participating in a three-day training course at
concept Systems, Inc. in Ithaca, N.Y., conducted by Drs. William M. Trochim and Mary Kane,
who pioneered this technique and developed the software we used to implement it (Kane and
Trochim 2007).
Although the concept mapping process often is used to extract latent concepts from the
more concrete knowledge of subject matter experts, our goal was to do just the opposite—to
obtain the measurable variables underlying the expert judges’ elaborate conceptualizations of
deadly force encounters. We sought to dive under the abstract conceptualizations that produced
so many differences of opinion among these experts to get at the measurable details that they
agree are important. For example, many of these experts disagree about fundamentals such as
how to define situational awareness, whether officers should endanger themselves in deadly
encounters in order to save a bystander, and whether officers tend to respond automatically in
those encounters rather than go through existing decision making processes. They also have a
myriad of disagreements about training techniques and goals, weapons and weapon use, etc.
The concept mapping process we employed consisted of well-defined steps. First,
participants were given the opportunity to sequentially nominate a statement in response to a
This document is a research report submitted to the U.S. Department of Justice. This report has not been published by the Department. Opinions or points of view expressed are those of the author(s)
and do not necessarily reflect the official position or policies of the U.S. Department of Justice.
NIJ Metric Development Final Report
08/27/12 20
predetermined “focus prompt” that was accepted by all participants. After a statement was
nominated, group discussion facilitated by the PI followed until the statement was either
modified to satisfy all of the participants or rejected by consensus. Once the group was satisfied
that all of the critical dimensions of the issue at hand (in our case situational difficulty of a
deadly encounter or performance within that encounter) were addressed, over-lapping statements
were integrated based on further discussion and duplicates were removed to create a final list of
statements. Second, participants went online to sort the statements into categories and rate them
in terms of both their importance and feasibility. Third, maps, charts and go-zones were created
to determine which statements were most relevant (both in terms of importance and feasibility)
with regard to the focus prompt.
To these well-established concept mapping steps we added two components after
obtaining an expert opinion from Drs. Trochim and Kane that these modifications to the process
were sound:
The rules-of-engagement modification was a preliminary group discussion with
participants about the most basic possible “rules of engagement” for a police officer in a
potentially deadly encounter. This was necessary because law enforcement agencies have a
broad array of policies governing police use of force—many of which are long, convoluted legal
documents. In order to guide our focus group, we needed a concise statement to provide a
common starting point about this most basic issue:
The goal of a police officer in a deadly force encounter is to accurately identify a threat
and neutralize it while minimizing harm to bystanders, officers and suspects.
The second modification was to constrain the syntax of statements participants would
generate in response to focus prompts (described below) so that they would either provoke a
This document is a research report submitted to the U.S. Department of Justice. This report has not been published by the Department. Opinions or points of view expressed are those of the author(s)
and do not necessarily reflect the official position or policies of the U.S. Department of Justice.
NIJ Metric Development Final Report
08/27/12 21
yes/no response or allow direct, objective, interval-level measurement. This modification was
required to make the statements amenable to the Thurstone scaling process that would assign
values and the measurement intervals to the statement items in order to transform them into
useful metrics.
Focus Group Leadership
One of the important challenges of working with highly experienced police officers—and
policing experts—is that they tend to be very strong personalities. After all, they generally are
leaders of highly independent people whose forte is taking the lead in highly unstructured, often
ambiguous, stressful and often dangerous situations. The success of our research hinged on
bringing together a highly diverse group of top-tier experts—many of whom were on different
sides of long-running debates about police deadly force encounters, tactics, training, practices
and policies. In order to keep this group in a closed setting for several long days of intense
discussion, we needed a firm, yet impartial leader. The PI’s unique background gave him
credibility with the group and the interpersonal skills to manage this group effectively. He is a
former Marine, 17-year police veteran who had worked as a street cop and supervisor in Los
Angeles slums (1969-78), a police trainer (1974-84), police chief in the vast, remote and diverse
U.S. Trust Territory of the Pacific (1978-84), and a federal agent (1982-86). He also was a
respected academic researcher whose work focuses on crime control and prevention as well as
the limits of police officer performance. In his 20+ year academic career, he has held tenured
faculty positions at the University of California, Irvine, University of Wyoming and Washington
State University. He also led the National Institute of Justice’s Crime Control and Prevention
Research Division from 2002-05.
This document is a research report submitted to the U.S. Department of Justice. This report has not been published by the Department. Opinions or points of view expressed are those of the author(s)
and do not necessarily reflect the official position or policies of the U.S. Department of Justice.

NIJ Metric Development Final Report
08/27/12 22
Subjects
We convened a diverse panel of 17 expert judges with extensive experience in policing,
firearms training and deadly force research to participate in the concept mapping focus group.
Although human subjects concerns prevent us from identifying the participants by name, they
included:
• Six leading policing researchers, three of whom had prior street experience as police
officers, and three of whom are active police trainers;
• 15 people with extensive current or past experience as police officers in large, medium,
or small agencies that were situated in different regions of the nation. Their experience
included rural, suburban and urban policing, and several had worked in all three settings;
• Half a dozen who had worked their way up through the ranks to top leadership positions
and had multiple decades of police service;
• One experienced police trainer who had less than 15 years on the job, was currently
working patrol, and had been nominated by his peers as the best street cop they knew;
• Two women;
• Leaders of three major law enforcement training associations as well as representatives of
a prominent national association that has played a prominent role in advocating firearms
training for police; and
• Current trainers from local, state and federal law enforcement training facilities, several
of whom held executive roles and several who had spent a decade or more as lead
trainers;
• This high level of participant diversity was imperative in order to assure that we could
generalize results to America’s highly diverse, 18,000 policing agencies.
This document is a research report submitted to the U.S. Department of Justice. This report has not been published by the Department. Opinions or points of view expressed are those of the author(s)
and do not necessarily reflect the official position or policies of the U.S. Department of Justice.

NIJ Metric Development Final Report
08/27/12 23
In addition, we convened a separate group of three of the nation’s top experts on police
deadly force encounters, Anthony Pinizzotto, Ph.D., Shannon Bohrer and Geoffry Alpert, Ph.D.
to assist us in breaking the statements out into measurable variables. Half of the expert judges
were paid from the ASTRO research budget, and the rest from this NIJ grant in order to expand
the number of focus group participants and increase the diversity of that group. All recruitment
was done by way of personal request from the PI, although he had not previously met or worked
with more than half of the participants prior to the focus group.
Materials
The concept mapping software was purchased from Concept Systems, Inc.
(www.conceptsystems.com). This software allowed each of the experts to independently and
simultaneously sort and rate the statements on computers provided during the focus group.
Because the data were collected using the ConceptSystems software, all of the participants’ input
was automatically integrated, making it possible for the group to view summary data about their
responses immediately after the sorting process. The software then generated alternate clusters
(a.k.a., “concept maps”) based on the experts’ grouping of statements. The concept maps were
used to stimulate discussions about alternate constructs associated with the statements. They
also were used to assure that the diverse concepts each participant had brought to each day’s
focus group were accounted for by the sets of statements.
Procedures
In July, 2009, the 17 expert judges travelled to Washington State University (WSU)
Spokane for a two-day (July 23rd – 24th) concept mapping workshop to determine exactly what
makes a deadly force encounter difficult and what constitutes “good” performance within that
This document is a research report submitted to the U.S. Department of Justice. This report has not been published by the Department. Opinions or points of view expressed are those of the author(s)
and do not necessarily reflect the official position or policies of the U.S. Department of Justice.

NIJ Metric Development Final Report
08/27/12 24
encounter. The PI, Bryan Vila, facilitated this two-day workshop. Despite his considerable
expertise in policing, firearms training and deadly force research, it was important that the
outcome of this process reflect an impartial sampling from the expertise of the diverse group of
top experts, rather than that of a single researcher or research team. We also believed that it was
critical for Dr. Vila to be an impartial facilitator, and that his own opinions not taint the process.
See Appendix A for the concept mapping agenda and Appendix B for the slides used to facilitate
the workshop.
On the first day of the workshop/focus group, we used the concept mapping process to
create a D-scale (list of difficulty-related statements) and on the second day the process was
repeated for the P-scale (list of performance-related statements). During the morning session on
the first day, each expert was given approximately twenty minutes to write down as many
statements that relate to measurable variables affecting the difficulty of a deadly force encounter
as they could (for example “the encounter contained multiple suspects”). They were given a pre-
determined prompt to assist them:9
“An element of deadly force situations commonly encountered by police officers that
increases the difficulty of achieving this goal is…”
We then went around the room and carefully recorded each statement. This led to a
brainstorming session in which other statements relating to the difficulty of a deadly force
encounter were suggested. During this process the researchers were careful to facilitate, but not
to direct or guide the workshop in any way, in order to avoid having our own preconceptions
about scenario difficulty cloud the participants suggestions.
9 “Goal” in the focus prompt refers to the goal set forth in the rules of engagement.
This document is a research report submitted to the U.S. Department of Justice. This report has not been published by the Department. Opinions or points of view expressed are those of the author(s)
and do not necessarily reflect the official position or policies of the U.S. Department of Justice.

NIJ Metric Development Final Report
08/27/12 25
One technique used to facilitate the session and avoid having the facilitator bias expert
judges’ responses was “flagging.” Each time that any of the three doctoral students supporting
the focus group by recording the statements and running the concept mapping software thought
that Dr. Vila was beginning to insert his own expertise into the process, they would raise a hand
and “call a flag” on him. This served to minimize any bias he might introduce. It also provide a
moment of levity among the participants who got to watch the facilitator being called up short,
just as they sometimes were called up short by him when the discussion began to wander too far
afield or when it became unproductively heated. This ensured the highest level of objectivity
possible.
In the afternoon session, each expert independently rated each statement on a seven-point
scale, once for importance (“How important is this statement to the difficulty of a deadly force
encounter?”), and again for feasibility (“How easy is it to measure this element of difficulty?”).
The experts did this rating online using the concept mapping software described in the Materials
section above.
After all of the experts had finished rating each of the statements twice, we generated
concept maps using the concept mapping software. These maps showed how statements
clustered together into categories (for example one set of statements were grouped around
situational difficulty—“the encounter occurred at night”, while another set were grouped around
suspect demographics—“the suspect was a young Black male”). The concept mapping software
also generated graphs of quadrants that could be manipulated to identify the statements that were
consistently rated as both most important and most measurable. (Appendix F provides copies of
the graphics produced by the concept mapping software.) For the purposes of pilot testing the
metrics, we did not eliminate any statements based on their lower importance and measurability
This document is a research report submitted to the U.S. Department of Justice. This report has not been published by the Department. Opinions or points of view expressed are those of the author(s)
and do not necessarily reflect the official position or policies of the U.S. Department of Justice.
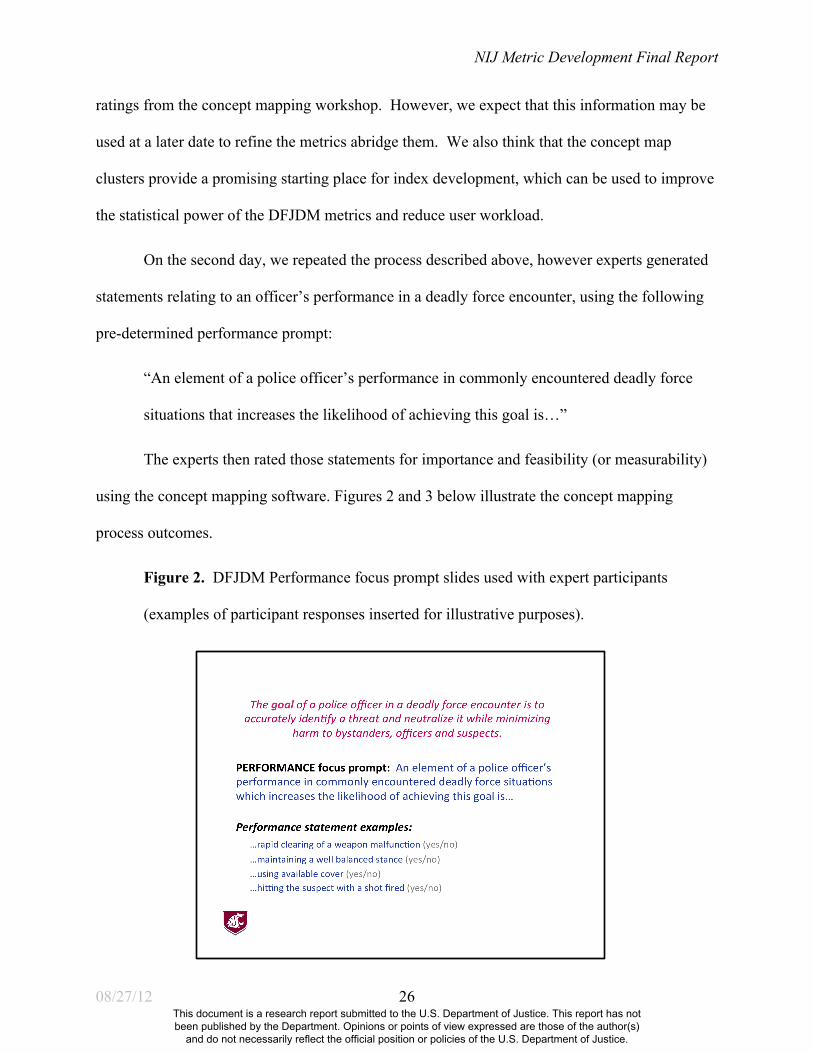
NIJ Metric Development Final Report
08/27/12 26
ratings from the concept mapping workshop. However, we expect that this information may be
used at a later date to refine the metrics abridge them. We also think that the concept map
clusters provide a promising starting place for index development, which can be used to improve
the statistical power of the DFJDM metrics and reduce user workload.
On the second day, we repeated the process described above, however experts generated
statements relating to an officer’s performance in a deadly force encounter, using the following
pre-determined performance prompt:
“An element of a police officer’s performance in commonly encountered deadly force
situations that increases the likelihood of achieving this goal is…”
The experts then rated those statements for importance and feasibility (or measurability)
using the concept mapping software. Figures 2 and 3 below illustrate the concept mapping
process outcomes.
Figure 2. DFJDM Performance focus prompt slides used with expert participants
(examples of participant responses inserted for illustrative purposes).
This document is a research report submitted to the U.S. Department of Justice. This report has not been published by the Department. Opinions or points of view expressed are those of the author(s)
and do not necessarily reflect the official position or policies of the U.S. Department of Justice.

NIJ Metric Development Final Report
08/27/12 27
Figure 3. DFJDM Difficulty focus prompt slides used with expert participants
(examples of participant responses inserted for illustrative purposes).
In late August, 2009, the separate group of three deadly force experts met at WSU
Spokane for a day-long focus group to help us operationalize and assign distinct intervals to the
difficulty and performance statements that had been generated in the concept mapping workshop.
This extra effort had not been anticipated by the researchers, and added considerably to the scope
of the project. In preparation for the Thurstone scaling process, these experts worked with our
research team to establish statement increments for the Likert scales we would use in the
Thurstone process. All of these experts had been nominated to assist with this stage of the
process by the concept mapping focus group because they had been unable to attend the concept
mapping workshop—and because they were universally respected. With their assistance, we
identified increments for the Likert scales that were consistent with previous data collection and
research on deadly encounters, then spent several months specifying the range of values within
This document is a research report submitted to the U.S. Department of Justice. This report has not been published by the Department. Opinions or points of view expressed are those of the author(s)
and do not necessarily reflect the official position or policies of the U.S. Department of Justice.

NIJ Metric Development Final Report
08/27/12 28
each difficulty or performance statement. As an example of this process, the statement “number
of suspects present” which had been developed by the focus group needed to be broken into “the
encounter had a single suspect,” “the encounter had two suspects,” “the encounter had between
three and five suspects,” “the encounter had between five and ten suspects,” etc.
As the specification process for the Likert-scale items unfolded after the consultation
with the three deadly force experts, innate differences between the difficulty and performance
statements began to emerge. Specifically, difficulty statements were unidirectional (all of the
statements would increase difficulty), whereas performance statements often were bi-directional
(some statements would increase performance and others would decrease performance). After
additional research on scale development issues, and consultation with other researchers with
substantial psychometric experience, we decided that difficulty and performance scales did not
need to be the same length, so long as they both used clear intervals that would be suitable for
later regression analysis. We chose a seven-point scale for difficulty statements, where 1=no
effect on difficulty, and 7=extreme effect on difficulty. Given that the performance scale needed
both positive and negative sides with a neutral point in the middle, the team decided to give this
scale 13 points so that a value of -6 characterized extreme negative effect on performance, 0
characterized no effect on performance, and +6 characterized extreme positive effect on
performance.
Results
For a breakdown of subject matter expert demographics see Appendix C. During the
concept mapping workshop, the expert judges generated 111 statements relating to the difficulty
of a deadly force encounter, and 105 statements relating to officer performance in a deadly force
encounter. Examples of the difficulty statements include:
This document is a research report submitted to the U.S. Department of Justice. This report has not been published by the Department. Opinions or points of view expressed are those of the author(s)
and do not necessarily reflect the official position or policies of the U.S. Department of Justice.

NIJ Metric Development Final Report
08/27/12 29
• “The suspect's verbal behavior is aggressive”
• “The suspect feigns a weapon”
• “The type of weapon the officer confronts is a hand gun”
Examples of performance statements include:
• “The officer adjusts to the unexpected”
• “The officer appears to be professional and ready to respond to threats effectively”
• “The officer is able to use communication skills to defuse or de-escalate a potentially
violent situation”
See Appendix D for a full list of original difficulty and performance statements.
Next, the second, smaller group of expert judges helped us break the statements into
measurable items. This resulted in 311 difficulty (D) statements and 289 performance (P)
statements. For example, “distance from suspect” (relating to difficulty) was broken into: “the
distance between the officer and the suspect is 0-5 feet,” “the distance between the officer and
the suspect is 6-10 feet,” “the distance between the officer and the suspect is 11-20 feet,” “the
distance between the officer and the suspect is 21-50 feet,” and “the distance between the officer
and the suspect is greater than 51 feet.” These increments were chosen based on conventions in
official statistics and previous research on officer-involved shootings. The number of
operationalized difficulty and performance statements was far greater than we had originally
anticipated. For the full list of incrementalized difficulty and performance statements see
Appendix E. Appendix F contains the graphics generated during the concept mapping
workshop.
This document is a research report submitted to the U.S. Department of Justice. This report has not been published by the Department. Opinions or points of view expressed are those of the author(s)
and do not necessarily reflect the official position or policies of the U.S. Department of Justice.
NIJ Metric Development Final Report
08/27/12 30
THURSTONE SCALING RESEARCH
Research Design
The Thurstone equal-appearing interval scaling approach (see Miller & Salkind 2002;
Thurstone & Chave 1929; Trochim 2001) is a method for assigning values to statements by
rating them on a Likert-type scale (e.g. 1=least impact on difficulty or performance, 7=greatest
impact on difficulty or performance). This approach determines the meaning of the different
value increments assigned to each statement (in our case, how much a given value contributes to
the difficulty of a deadly encounter, or to an officer’s performance in that encounter). Scores
assigned to statements during the Thurstone scaling process are tabulated using what is known as
the equal-appearing interval method using median weighting. For example, suppose expert
judges identify the statement: “The officer maintained a well-balanced stance” as an element of
performance. Each instructor would then rate this statement from 1-7 (“extremely unfavorable”
to “extremely favorable” to performance). If the median score obtained from the raters for the
statement was 6, that would be the value assigned to the overall performance score of an officer
who maintained a well-balanced stance.
Subjects
Our subjects for the Thurstone scaling process were 323 police officers from 209
different agencies across the United States who were use-of-force instructors. For ease of
interpretation, we referred to these subjects as “raters” (so as not to confuse them with the expert
judges from the concept mapping workshop). We used a snowball recruiting process, whereby
experts from the concept mapping group recommended our survey to colleagues, police agencies
and departments, and police fraternal orders around the country. Requests for officers to
This document is a research report submitted to the U.S. Department of Justice. This report has not been published by the Department. Opinions or points of view expressed are those of the author(s)
and do not necessarily reflect the official position or policies of the U.S. Department of Justice.

NIJ Metric Development Final Report
08/27/12 31
participate in the survey were also sent to members of the Force Science Institute, the National
Tactical Officers Association, the International Law Enforcement Training Association, and
other organizations via their respective websites. Police officers were instructed to e-mail us
with requests to participate if they were interested. After their employment was verified and they
were enrolled as survey participants, they also were encouraged to contact other use-of-force
instructors and ask them to participate in the survey. For a breakdown of use-of-force instructor
raters’ demographics see Appendix G.
Materials
We used “Survey Monkey” (www.surveymonkey.com), an online survey service, to
enable efficient scoring of the statements by the raters. Each rater was provided with a unique
PIN and password to access Survey Monkey (this also ensured confidentiality). After all rating
was completed, Survey Monkey generated an output that was uploaded into Excel and SPSS.
Survey Monkey also was used to gather demographic information from each of the use-of-force
instructors.
Procedures
Online surveys were prepared in Survey Monkey that contained the difficulty statements
(D- statements) and performance statements (P-statements). All D-statements were randomized,
and then all P-statements were randomized. Unfortunately, the statement sets were much larger
than we had originally anticipated—requiring roughly 600 items to be scored by the raters.
These were far too many items for raters to complete a single, one-time survey due to time-on-
task effects, completion rates, and, we expected, response rates.
This document is a research report submitted to the U.S. Department of Justice. This report has not been published by the Department. Opinions or points of view expressed are those of the author(s)
and do not necessarily reflect the official position or policies of the U.S. Department of Justice.

NIJ Metric Development Final Report
08/27/12 32
In order to counter the large number of response items, the D- statement set was divided
into four random subsets of items to be scored (D1-D4) and the P- statement set was divided into
four random subsets of items to be scored (P1-P4). Time to complete a Dn+Pn subset (~150
items) was estimated to be between 38 and 50 minutes, based on a pilot test we conducted with
four police officer volunteers prior to dividing the P- and D-subsets.
Once an e-mail request to participate was received, each candidate rater was sent an
informed consent form, which they had to reply to indicating they had read the consent form and
were willing to participate in order to participate. After recruitment and selection, each rater
received a unique PIN and a link to the survey. The unique PIN ensured that their answers to the
survey were confidential and allowed the rater to log into the survey. Upon logging in, each
scorer received a random P+D subset selected from the sixteen P+D subsets in order to minimize
interaction effects between their content. Table 1 below shows the structure of this
randomization:
Table 1. Performance (Pn) and Difficulty (Dn) statement scoring item subset
combinations that were assigned randomly to each use-of-force instructor during the
online rating process.
Statement Sets
P1 P2 P3 P4
D1 P1+D1 P2+ D1 P3+ D1 P4+ D1
D2 P1+D2 P2+ D2 P3+ D2 P4+ D2
D3 P1+D3 P2+ D3 P3+ D3 P4+ D3
D4 P1+D4 P2+ D4 P3+ D4 P4+ D4
This document is a research report submitted to the U.S. Department of Justice. This report has not been published by the Department. Opinions or points of view expressed are those of the author(s)
and do not necessarily reflect the official position or policies of the U.S. Department of Justice.
NIJ Metric Development Final Report
08/27/12 33
Once a rater had completed a subset pair, he/she was offered an opportunity to score
another pair at a later date. If willing, raters were re-contacted the next day and offered a random
pair that did not duplicate subsets they had scored previously. Thus, each rater had the
opportunity to score all of the items, with a maximum total time investment of from 152 to 200
minutes.
As an incentive, each time a rater completed a D+P pair, he/she received a chance for a
drawing for police safety equipment worth approximately $300. Five of these drawings were
held during the course of the survey. After completing the first D+P pair, the raters also received
a memento and had a letter of appreciation sent to their chief or sheriff (but only if they wished
to). Due to the interest shown in the metrics by law enforcement officers and agencies, we kept
the on-line scoring process open longer than anticipated (from 10/01/2010 to 03/01/2011). This
decision was driven by a desire to maximize the statistical power of the equal-appearing interval
scaling technique, and we also thought that having more deadly force trainers participate—and
from more agencies—would tend to improve translation of research results into practice, which
was one of the major objectives of this project.
This process gave us interval-level scales for measuring the concepts judged to be most
relevant for understanding officer deadly force performance and the relative difficulty of
different deadly force situations. For a full discussion of why this process yields interval-level
data from ordinal-level expert rankings, see Thurstone and Chave (1929).
Results
When broken out in the manner illustrated in table 1, the subset of difficulty statements
one through four (D1-D4) respectively contained 78, 78, 78 and 77 statements. The subset of
This document is a research report submitted to the U.S. Department of Justice. This report has not been published by the Department. Opinions or points of view expressed are those of the author(s)
and do not necessarily reflect the official position or policies of the U.S. Department of Justice.

NIJ Metric Development Final Report
08/27/12 34
performance statements one through four (P1-P4) respectively contained 73, 72, 72 and 72
statements.
The scores assigned to difficulty statements by the use-of-force instructors ranged from 1
(no impact on difficulty) to 7 (highest impact on difficulty). Consistent with the Thurstone
scaling process, the median value given to each statement by the raters then was assigned as that
statement’s value. Examples of statements that received the highest difficulty score (7) are:
• “The portion of the suspect exposed to the officer’s view is 0%”
• “There are eleven or more hostages under direct threat at the scene”
• “There are eleven or more suspects present at the scene”
Examples of statements that received the lowest difficulty score (1) are:
• “The suspect’s apparent physical strength is weak”
• “The suspect has no visible gang identifiers”
• “Potential threats can come from only one direction”
The scores assigned to difficulty statements by the use-of-force instructors ranged from -
6 (extremely negative impact on performance) to 0 (no impact on performance) and up to +6
(extremely positive impact on performance). Examples of statements that received the highest
performance score (+6) are:
• “The officer used proper tactical movement”
• “The officer makes timely decisions regarding pre-assault indicators”
• “The officer accurately identified multiple opponents”
Examples of statements that received the lowest performance score (-6) are:
• “The officer has averaged 0-3 hours sleep in recent days”
This document is a research report submitted to the U.S. Department of Justice. This report has not been published by the Department. Opinions or points of view expressed are those of the author(s)
and do not necessarily reflect the official position or policies of the U.S. Department of Justice.

NIJ Metric Development Final Report
08/27/12 35
• “The officer doesn’t expect to be involved in a deadly force situation”
• “The officer doesn’t apply deadly force rules of engagement (laws and policies) in a
combat situation”
See Appendix H for the full list of scores assigned to each difficulty and performance
statement.
This document is a research report submitted to the U.S. Department of Justice. This report has not been published by the Department. Opinions or points of view expressed are those of the author(s)
and do not necessarily reflect the official position or policies of the U.S. Department of Justice.

NIJ Metric Development Final Report
08/27/12 36
PILOT TESTING METRICS UTILITY, VALIDITY AND RELIABILITY
Testing the Metrics with Experimental Data
Research Question, Goal Statement, and Working Hypothesis
Once we had developed the metrics, we conducted preliminary pilot tests of their utility,
reliability, and validity using data collected in our lab from experimental research. Our goals in
the first set of experiments were to determine: (a) whether the metrics are suitable for scoring the
difficulty of high fidelity video scenarios designed for use in computerized a deadly force
judgment and decision-making simulator; and (b) whether they are suitable for scoring the
performance of subjects responding to the simulator scenarios.
The data we used was from an experiment we conducted which was funded by the
Defence Advanced Research Projects Agency (DARPA).11 The experiment was designed to test
methods for accelerating simulator-based learning of deadly-force judgment and decision making
skills. We were especially interested in the sorts of skills required to strike an effective balance
between aggression and restraint in small-unit infantry counterinsurgency, stabilization and
humanitarian operations. Civilian, police, and military subjects were tested for performance in
the deadly force judgment and decision-making simulators at our Simulated Hazardous
Operational Tasks lab, part of the Sleep and Performance Research Center of WSU in Spokane.
These data were appropriate for pilot testing the difficulty and performance metrics
because subjects responded to the scenarios we developed for use in the Simulated Hazardous
Operational Tasks lab. These scenarios were developed based on data collected from the past 30
years of officer involved shootings, and are grounded in Normal Accident Theory, which relies
11 “Accelerating Realistic Deadly-Force Judgment and Decision Making Training.” Funded by the Defense Advanced Research Projects Agency through Advanced Brain Monitoring, Inc., (contract no. NBCHC090054-1).
This document is a research report submitted to the U.S. Department of Justice. This report has not been published by the Department. Opinions or points of view expressed are those of the author(s)
and do not necessarily reflect the official position or policies of the U.S. Department of Justice.
NIJ Metric Development Final Report
08/27/12 37
on the twin concepts of complexity and coupling. While developing these scenarios, we tried to
manipulate complexity and coupling to create distinct difficulty categories. The scenarios were
categorized as “naïve,” “intermediate,” or “journeyman” depending on the level of expertise a
panel of subject matter experts thought was required of the police officer or warfighter
responding to the scenario. This set of scenarios appeared to be well-suited for validating the
difficulty metrics, as our initial difficulty categories were grounded in theory, and were therefore
assumed to be meaningful. The range in subject combat experience—from veteran police
officers and active duty military personnel to civilians with no firearms experience—also seemed
well-suited for scoring the performance metric, given the assumption that greater experience is
related to better performance.
Part of our original rationale for pilot testing the validity, reliability and utility of the
metrics was to investigate the working hypothesis that as the difficulty of a deadly encounter
increases, performance will tend to decrease. The experimental data we used was well suited for
testing this hypothesis. The difficulty scores assigned to each scenario by the subject matter
experts represented our predictor or independent variable, and the performance scores assigned
to subjects represented our response or dependent variable. Our working hypothesis was:
H1=There exists a negative correlation between D- and P-scales; as scenario difficulty
increases, subject performance will decrease.
Subjects
A power analysis was conducted to determine the number of subjects necessary to score
using the metrics. Before DFJDM metric development had been completed, we had analyzed the
impact of scenario difficulty during a research project funded by DARPA as part of their
Accelerated Learning research program. In that research, we assessed the extent to which
This document is a research report submitted to the U.S. Department of Justice. This report has not been published by the Department. Opinions or points of view expressed are those of the author(s)
and do not necessarily reflect the official position or policies of the U.S. Department of Justice.

NIJ Metric Development Final Report
08/27/12 38
difficulty (which was operationalized categorically as naïve, intermediate, or journeyman level)
affected subject performance (operationalized as reaction-time to shoot, in milliseconds). In that
research (Behneman et al., 2012), we found that the difficulty category had a strong effect on
reaction time to shoot. Difficulty had a significant impact on reaction time, with a standardized
beta coefficient of 0.39. We used this effect size to calculate the number of subjects that needed
to be scored for performance to achieve at least 80% power (using a 0.05 alpha level) in
validating the performance metrics. According to Cohen’s (1988) Statistical Power Analysis for
the Behavioral Sciences, when residual degrees of freedom are 4 or more in an analysis of
variance (which they were in the experimental data we used), an effect size of 0.39 requires a
sample size of 16 to achieve 80% power at the 0.05 alpha level. Being conservative, we elected
to score 20 subjects for performance. Each participant was scored for a single observation. This
would ensure 90% power in our metric validation process.
Among the subjects in this experiment, six were experienced police patrol officers, six
were active duty Marines or soldiers with at least one tour of duty in Iraq or Afghanistan as
infantrymen, and eight were civilians with no policing, military, or firearms experience. This mix
of subjects was intended to maximize performance variation.
Procedures
Two doctoral-students from our research team used the difficulty metric to score all 60 of
the deadly force judgment and decision making scenarios we had created for use with the high-
definition deadly force judgment and decision making simulators. This involved carefully going
through all of the difficulty statements and isolating the ones that were applicable for scoring.
For example, the statement “the officer encountered precipitous terrain” was not suitable for
scoring the scenarios, as the floors of the DFJDM simulators are level. Once a set of applicable
This document is a research report submitted to the U.S. Department of Justice. This report has not been published by the Department. Opinions or points of view expressed are those of the author(s)
and do not necessarily reflect the official position or policies of the U.S. Department of Justice.
NIJ Metric Development Final Report
08/27/12 39
statements had been identified, all three of the doctoral students carefully viewed each scenario
several times to ensure that each element of difficulty was rated. Scoring involved checking
“yes” or “no” for each difficulty statement. To ensure within-rater reliability, they worked
together to reach consensus for each statement. This process was straightforward because of the
unambiguous nature of the metrics.
Next, the data obtained from the Boolean scoring process were converted into discrete
difficulty scores using the median value assigned to each statement by the raters. When all
scenarios were scored, the PI randomly scored ten-percent of them and compared his
interpretation to scores assigned by the graduate students, to ensure inter-rater reliability. Inter-
rater reliability was effectively identical because of the unambiguous nature of the metrics.
After the scenarios were scored for difficulty, the same two graduate-students scored
twenty subjects’ performance using the DFJDM performance metric. This involved carefully
going through each performance statement and identifying which were applicable for scoring
subjects in each of the different scenarios. For example, the statement “the officer made use of
available cover” was not applicable for scoring subjects, because cover was not provided in the
simulators during this experiment. However, the statement “the officer appears to be
professional and ready to respond to threats effectively” was applicable for scoring subjects
responding to the simulator scenarios. Once a set of applicable DFJDM statements had been
identified, the video recordings of subject performance in the simulator were carefully viewed
several times for each subject in order to ensure that each element of subject performance that
applied to that scenario was rated. This involved checking “yes”, “no” or “NA” for each
performance statement, again, by consensus between the two graduate students. These data then
were converted into concrete performance scores using the median score assigned to each
This document is a research report submitted to the U.S. Department of Justice. This report has not been published by the Department. Opinions or points of view expressed are those of the author(s)
and do not necessarily reflect the official position or policies of the U.S. Department of Justice.
NIJ Metric Development Final Report
08/27/12 40
statement by the use-of-force instructors. Once all 20 subjects’ performance had been scored, the
PI randomly scored a random 10 percent of scenarios and compared his assessment to scores
assigned by the graduate students, to ensure inter-rater reliability, which again was effectively
identical because of the unambiguous nature of the metrics.
A potentially important weakness of this test of the DFJDM performance metrics was
that we were unable to include items that were predictors of performance. The performance
metric measures include many items that can only be assessed in the context of an encounter.
For example, the statement “the officer effectively dealt with weapon malfunctions.” But the
performance metrics also have elements that can be used to predict performance. For example,
“the officer was under stress due to personal reasons.” Similar statements relating to officer
fatigue, shift patterns, personal biases, prior experiences, training, and department policy are all
predictors of performance that can be assessed a priori. Unfortunately, we were unable to collect
data on the prospective performance metrics because we conducted the experiments before the
metrics were completed due to time restrictions. So our pilot assessment of the performance
metric was based entirely on elements of performance that were measurable during the
encounter.
Analysis
Ranges and means were established for difficulty scores and performance scores. A
simple bivariate correlation analysis was done in SPSS to test the working hypothesis that as
scenario difficulty increases, subject performance decreases.
Results
First, we rated each of our 60 scenarios for difficulty using the metrics. Difficulty scores
assigned to our scenarios ranged from 31 to 87, with a mean of 54.
This document is a research report submitted to the U.S. Department of Justice. This report has not been published by the Department. Opinions or points of view expressed are those of the author(s)
and do not necessarily reflect the official position or policies of the U.S. Department of Justice.
NIJ Metric Development Final Report
08/27/12 41
Second, using data from the DARPA experiment we scored 20 participants for
performance using the metrics. For each subject we first calculated the total number of points
that could be earned. This was necessary because some subjects received “NA” for a statement
(for example “officer accurately identified multiple opponents” applied to subjects who were
responding to scenarios with more than one suspect but not to other subjects who were
responding to single suspect scenarios). If subjects were responding to scenarios with more than
one suspect, but did not accurately identify those suspects, the number of points related to this
statement was added to the total number of points that could be earned, but not to their overall
score. This insured that points were not deducted when a subject did not have an opportunity to
earn them. We then calculated an overall score for each subject using the points associated with
each performance statement. To standardize scores, we then converted them into percentages.
Performance scores ranged from 50% to 100%, with a mean of 84%.
Third, we conducted a simple bivariate correlation analysis between difficulty and
performance scores to test our working hypothesis. We did not find a statistically significant
correlation between difficulty and performance. The likely reasons for this finding are
considered in the unified Discussion of Research Results section.
Testing the Metrics with Data Collected from Field Studies
Research Design and Goal Statement
We had originally intended to further pilot test the validity, reliability and utility of the
metrics using investigative reports from officer-involved shootings (OIS). However, due to
unforeseen delays in completing the development of the metrics (described below), we decided
to use field research data to accomplish this objective. The reason for adapting our test methods
was the immediate availability of data gathered during a field experiment in which we evaluated
This document is a research report submitted to the U.S. Department of Justice. This report has not been published by the Department. Opinions or points of view expressed are those of the author(s)
and do not necessarily reflect the official position or policies of the U.S. Department of Justice.

NIJ Metric Development Final Report
08/27/12 42
the impact of police active shooter training software on officer performance in a set of well
structured role-playing exercises.
Active Shooter Training for the Responding Officer (ASTRO) software was developed
through the Sheriffs’ Association of Texas (SAT) by Destineer Studios, LLC and Signature
Science, LLC under contract to SAT through NIJ’s Rural Law Enforcement Technology Center
(RULTC). ASTRO is simulation software designed to help police officers learn and retain the
skills necessary for responding to active shooter situations in public places such as schools or
malls (Schuster 2009:46). This capability is important because active shooter responses require
very different tactical thinking than the everyday situations that officers handle on the job. The
simulation is operated on a personal computer, in either the first- or third-person mode, within a
realistic three-dimensional representation of a high school or college environment.
The ASTRO study used a quasi-experimental research design in which a sample of
experienced police patrol officer subjects were randomly drawn from a larger population of such
officers in Washington state; received identical classroom training; and then were randomly
sorted into roughly equal sized control, placebo and treatment (ASTRO) groups. Police trainers
rated seven elements of subject performance (arrival, team set-up, entry, movement, contact,
post-contact, and conclusion) using an ordinal-level tool that they had developed themselves
(where 1=unacceptable, 2=minimal, 3=acceptable, 4=superior and 5=excellent performance).
Subjects were assessed while participating in realistic active shooter role-playing scenarios.
Subjects completed the role-play scenario in combat teams of four. In addition, subject
performance was video-recorded, making it possible to rate performance using relevant items
from the performance metric. Our goal was to determine whether the metrics are suitable for
This document is a research report submitted to the U.S. Department of Justice. This report has not been published by the Department. Opinions or points of view expressed are those of the author(s)
and do not necessarily reflect the official position or policies of the U.S. Department of Justice.
NIJ Metric Development Final Report
08/27/12 43
scoring officer performance in active role-play simulations. A secondary goal was to determine
whether the metrics are suitable for scoring officers’ performance as part of combat teams.
Subjects
To pilot test the reliability, utility and validity of the metrics using data collected from
field research, we scored the performance of 78 experienced police patrol officers from our
impact evaluation of ASTRO using the performance metric (scenario difficulty was the same for
each officer because they participated as members of five-person teams in identical active
shooter role-playing simulations).
Procedures
The PI and three graduate-students scored the first two subjects in order to assure that the
scoring technique behaved as expected—and that all of us agreed about how the metrics should
be applied. Then two of the graduate students rated the remaining subjects using the
performance metric (using a consensus approach). This involved carefully going through each
performance statement and isolating the statements that were applicable for scoring subjects.
During this process we excluded statements such as “the officer is biased against Hispanic
suspects” as unsuitable for scoring video data, because information on subjects’ biases was not
available. Once the set of suitable statements had been identified, the videos of subject behavior
in the role playing simulations—which were recorded from three different vantage points by our
research team—were watched several times for each subject, to ensure that each element of
subject performance was rated. This involved checking “yes,” “no” or “NA” for each
performance statement. The resulting scores then were converted into interval-level performance
scores using the DFJDM performance metrics median value that had been assigned to each
statement by the raters. When all subjects’ performance had been scored, the PI randomly scored
This document is a research report submitted to the U.S. Department of Justice. This report has not been published by the Department. Opinions or points of view expressed are those of the author(s)
and do not necessarily reflect the official position or policies of the U.S. Department of Justice.

NIJ Metric Development Final Report
08/27/12 44
ten percent of subjects and compared his results to scores assigned by the graduate students to
ensure inter-rater reliability, which was effectively identical because of the unambiguous nature
of the metrics.
Analysis
Ranges in performance scores and mean scores across subjects were calculated in Excel.
Results
Using video footage from the ASTRO field training study, we rated each of the 78
subjects using the performance metric. (Recall that subjects in this training were randomly
assigned to ad-hoc response teams, just as they would have been in the event of a real active
shooter situation.) For each subject, we first calculated the total number of points that could be
earned. This was necessary because some subjects received “NA” for a statement (for example
“officer made use of cover” may have applied to some subjects who were near cover but not to
other subjects who were in a more open area). If subjects were near cover, but did not make use
of cover, the number of points related to this statement was added to their total number of points
that could be earned, but not to their overall score. This insured that points were not deducted
from subjects who did not have the opportunity to earn them.
We then calculated an overall score for each subject using the points associated with each
performance statement. To standardize scores, we then converted them into percentages.
Percentages awarded to the ASTRO subjects ranged from 45% to 100%. The average percent
awarded was 90%, indicating a negative skew, with most scores clustering between 90% and
100%. The likely reasons for this finding are considered in the unified Discussion of Research
Results section.
This document is a research report submitted to the U.S. Department of Justice. This report has not been published by the Department. Opinions or points of view expressed are those of the author(s)
and do not necessarily reflect the official position or policies of the U.S. Department of Justice.

NIJ Metric Development Final Report
08/27/12 45
Replication of Metric Development Technique
Beginning in January 2012, our research team has applied the same metric development
techniques pioneered in this study to a different type of social problem: strategic social
interactions between police officers and the public or among line infantry personnel in
counterinsurgency, stabilization and humanitarian operations. Our research is part of a large
DARPA program12 attempting to develop novel techniques and technologies for training military
and police personnel to interact effectively with non-combatants in operational settings. The
metric-development process is being used to nail down logic models and metrics in order to give
give trainers, evaluators, and technology developers involved in the program a unified
framework from which they can proceed. This is critical in such a large, interdisciplinary
program because it helps assure that each team’s work complements that of the others. The
interval-level performance metrics also give research teams, trainers, technology developers, and
evaluators a common yardstick that makes it possible to use powerful mathematical and
statistical techniques. And they provide a basis for scoring algorithms used in training software
and hardware being developed as part of this program.
Thus far in this first replication of the metric development process, we have been able to
perform each of the metric development steps much more quickly, doing what took more than
two years during the DFJDM endeavour in 8 months. This is an ongoing project, but so far we
have successfully:
• Concept Mapping: Used an expert focus group composed of law enforcement trainers,
distinguished military experts, and other cross-cultural experts to nail down logic models,
12 Our research is entitled “Empowering the Strategic Corporal: Training Young Warfighters to be Socially Adept with Strangers in Any Culture.” (DARPA grant no. W911NF-12-0039). It is part of the DARPA SSIM program www.darpa.mil/Our_Work/DSO/Programs/Strategic_Social_Interaction_Modules_%28SSIM%29.aspx .
This document is a research report submitted to the U.S. Department of Justice. This report has not been published by the Department. Opinions or points of view expressed are those of the author(s)
and do not necessarily reflect the official position or policies of the U.S. Department of Justice.

NIJ Metric Development Final Report
08/27/12 46
specify key concepts related to successful interaction with strangers in foreign
operational settings, and specify important measurable indicators associated with
successful cross-cultural interaction. The results of this activity were specification of a
concise generic desired outcome for relevant the type of interactions with strangers,
“difficulty indicators” (objectively measureable variables that make the desired outcome
harder to achieve), and “performance indicators” (objectively measureable variables that
effect the likelihood of reaching the desired outcome).
• Thurstone Scaling: Interval-level metrics are roughly 2/3 completed. Thus far, we have
distributed the difficulty and performance indicators specified during the focus group to a
sample of >200 expert police trainers, who subjectively weighed each indicator on a
Likert-type scale. A similar number of military trainers have been identified and we are
prepared to survey them as soon as final approval from the DoD institutional review
board is received.
Even before the scaling process has been completed, it has been possible to use the
difficulty and performance metric items to help bootstrap curriculum development, social and
behavioral science research activities, and software and hardware development. We also have
used the metric items to guide development of a set of 60, relatively long tactical social
interaction scenarios for use in our decision making simulators. Those scenarios have been
completed and fully implemented, they will be used in the near future to conduct laboratory
experiments which will provide baseline data for evaluating the impact of training on
participant’s performance in tactical social interactions.
This document is a research report submitted to the U.S. Department of Justice. This report has not been published by the Department. Opinions or points of view expressed are those of the author(s)
and do not necessarily reflect the official position or policies of the U.S. Department of Justice.

NIJ Metric Development Final Report
08/27/12 47
DISCUSSION OF PILOT STUDY RESEARCH RESULTS
The primary reasons for pilot testing the DFJDM metrics were to obtain a preliminary
assessment of their validity and reliability. This part of the project also was important for more
practical reasons: It provided an opportunity to use the metrics in experimental and quasi-
experimental research designs and develop an instruction manual for their use. This section of
the report provides a unified interpretation of results from each of the pilot studies and discusses
their limitations.
Interpretation of Pilot Test Results
The experts involved in the concept mapping workshop generated 111 statements related
to the difficulty of a deadly encounter, and 105 statements related to officer performance within a
deadly encounter. When these statements were operationalized and broken into measurable
items, we had a total of 311 difficulty statements and 289 performance statements. The use-of-
force trainers who rated the statement increments assigned scores ranging from 1 (no impact) to
7 (highest impact) for difficulty statements, and scores ranging from -6 (extremely negative
impact) to 6 (extremely positive impact) for performance statements (where 0 was no impact on
performance).
During pilot testing, we found that, in their unrefined state, the metrics can be used to
score data from experiments using deadly force judgment and decision-making simulators.
However, as described below in more detail, too many elements of performance that are
measurable using the metrics could not be tested using the experimental data available to us.
The scenarios used in the simulations were developed prior to the metrics to: (1) test the
dimensions of Normal Accidents Theory; (2) conform to the primary real-world dimensions of
This document is a research report submitted to the U.S. Department of Justice. This report has not been published by the Department. Opinions or points of view expressed are those of the author(s)
and do not necessarily reflect the official position or policies of the U.S. Department of Justice.

NIJ Metric Development Final Report
08/27/12 48
the Deadly Mix research of Pinizzotto, Davis, and Miller (2006); (3) maximize experimental
power by carefully scripting them so that between-scenario variation focused as much as
possible on only major constructs of interest; and (4) to maximize realism by using professional
actors and film crews and videoing scenarios in natural settings. We also were limited in the
number of branches in the scenarios because of our tight budget.13
Unfortunately, this limited the scenarios’ utility for testing the metrics. For example,
participants were not provided with cover (i.e., something to duck behind to protect them) in the
simulations, they were not given the opportunity to negotiate with the suspect to prevent a use-
of-force outcome, and they were not given the opportunity to use less-lethal force options such as
compliance holds, foot- or hand-strikes, baton, chemical spray or Taser. Perhaps as a result of
the limited variation in performance that we were able to capture, we found that our working
hypothesis (a negative correlation exists between difficulty and performance) was not supported.
There was no significant correlation between difficulty and performance.
When we pilot tested the metrics with data from field studies evaluating officer
performance during role-playing scenarios we found that, although the metrics could measure
performance, they were not appropriate for measuring individual performance of officers while
they were acting as members of a combat team. Combat teams work together, dividing roles and
responsibilities. Team members, therefore, often don’t respond as they would in the solo-
encounters that characterize most police encounters in the United States. Instead, they act as
members of a super-organism by, for example, exposing themselves to fire instead of taking
cover because their fellow team members are covering them by being prepared to supress fire
from an opponent. The implications of these limitations are discussed below. 13 Note that the new tactical social interaction scenarios we developed earlier this year have seven decision-making branches, the DFJDM scenarios have two.
This document is a research report submitted to the U.S. Department of Justice. This report has not been published by the Department. Opinions or points of view expressed are those of the author(s)
and do not necessarily reflect the official position or policies of the U.S. Department of Justice.
NIJ Metric Development Final Report
08/27/12 49
Current DFJDM Limitations
Application of DFJDM metrics to team encounters
The pilot tests highlight two limitations for the DFJDM metrics. First, as analysis of the
ASTRO field data demonstrated, the metrics do not appear to be useful for analyzing
performance when officers are working as part of a small, tightly bound team. This issue should
be examined further to determine whether the difficulty we encountered using members of the
active-shooter teams as subjects arose because individual performance was masked by group
dynamics. It also would be important to compare these group dynamics with less rigid groups.
For example, when one officer arrives at the scene of a police activity such as a traffic stop,
burglary alarm, or suspicious person, he or she will work more or less autonomously depending
on the nature of the encounter. Sometimes, officers stand away from an encounter to avoid
interfering with interpersonal dynamics, but still can assist quickly should the need arise. They
also may work at the direction of the first officer, or on their own initiative.
In the era when most police patrol officers worked in pairs, partners tended to develop a
strong sense of what the other person would do in a given situation. But still, with two officer
teams such as those, it was not unusual for situational factors or events to effectively force an
officer to independently judge a deadly encounter, make a decision and act. Examples include
handling multiple suspects in a car stop, foot pursuits, or any situation where they were unable to
communicate readily with one another. Another issue that should be examined further is
whether it is possible to use the DFJDM metrics at the small-team level, assessing performance
based on how well performance criteria are met by the group as a hole, rather than focusing on
individual-level performance. This is a non-trivial problem, but one with special import in
This document is a research report submitted to the U.S. Department of Justice. This report has not been published by the Department. Opinions or points of view expressed are those of the author(s)
and do not necessarily reflect the official position or policies of the U.S. Department of Justice.

NIJ Metric Development Final Report
08/27/12 50
military and SWAT applications where close teamwork is the norm, rather than the exception as
is currently the case in American policing.
Application of DFJDM metrics to highly constrained encounters
A second limitation of the DFJDM metrics in their current form appears to be that they
are not well suited to encounters where potential performance variability is highly constrained.
Examples include encounters that unfold in less than a minute or so or occur in places or
situations where options for action are very limited (e.g., a narrow hallway, in the midst of a
crowd, in a dark room).
Although the DARPA data were well suited for this sort of research in terms of variation
in within-scenario difficulty and participant performance, they were limited by the options
available to performers in our simulation scenarios. For example, many statements from the
performance metrics were not applicable due to the nature of the deadly force judgment and
decision-making simulations. For example, “officer made use of environmental conditions” or
“officer adjusted to threats from multiple directions” could not be tested because those options
were not available in the simulated environment. Although this simplicity was an intentional
compromise—we sought to strike a balance between the extreme parsimony/low external
validity of laboratory experiments and the experimental noise/high external validity of field
experiments—it turned out to be less than optimal for our validation experiments. Because
videography, professional actors, and adaptation of video into branching shooting simulator
scenarios was an expensive process—more than $100,000 for 60 scenarios—we were unable to
redo this part of the research.14 This issue will be examined further by the research team as we
analyze data from the DARPA strategic social interaction scenarios we recently developed.
14 This research grant was for a total of $282,551, including indirect costs.
This document is a research report submitted to the U.S. Department of Justice. This report has not been published by the Department. Opinions or points of view expressed are those of the author(s)
and do not necessarily reflect the official position or policies of the U.S. Department of Justice.

NIJ Metric Development Final Report
08/27/12 51
Those scenarios are two to three times longer than the first set we developed, and they have
seven branches. Figure 4 illustrates these new scenarios’ decision points at which the simulation
action branches in response to the research subject’s performance.
Figure 4. Tactical social interaction scenario pathways, transitions, and outcomes.
Using DFJDM metrics to compare performance between types of encounters
A third limitation was revealed when we pilot tested the reliability, validity and utility of
the difficulty metrics using scenarios that fell into three distinct categories. The scenarios used
in the first set of DARPA studies depicted potentially deadly encounters during three types of
encounters: vehicle stops, investigations of suspicious persons in public places, and disputes in
buildings (domestic disturbances and disputes in a convenience store). These types of encounters
are the most frequent settings for deadly force situations reported according to data collected
from the past 30 years of officer-involved shootings in the United States (Pinizzotto, Davis, and
Miller 2006). As such, the have high external validity. However, these three types of scenarios
are not necessarily comparable with regard to difficulty because of their innate differences.
This document is a research report submitted to the U.S. Department of Justice. This report has not been published by the Department. Opinions or points of view expressed are those of the author(s)
and do not necessarily reflect the official position or policies of the U.S. Department of Justice.

NIJ Metric Development Final Report
08/27/12 52
For example, due to the confined nature of a vehicle stop, even the most difficult deadly
encounter during a vehicle stop is likely to be more straightforward that the easiest domestic
dispute, which constitutes a more complex social system in a more complex physical
environment. Figure 5 maps difficulty scores for each type of encounter, making a subcategory
out of the null scenarios—those in which no weapon was apparent—which generally were
somewhat easier to bring to a successful outcome under the rules of engagement. As this figure
shows, vehicle stops received lower difficulty scores overall than suspicious person stops, which
also are easier than domestic disturbances, with store robberies falling somewhere in the middle.
Although using these scenarios provided an arguably realistic assessment of a broad range of
encounters that vary in difficulty, it is likely that the differences in difficulty across category
significantly swayed the correlation analysis, resulting in finding of no significance.
Potential interactions between DFJDM metrics variables
A final limitation of the DFJDM metrics is that the variables are measured in isolation.
For example, “distance from suspect” has a discrete value, which is independent of the value
given to “number of persons in the encounter.” Clearly, however, many of the variables
measured by the metrics are not independent. In fact, some of them are derivatives of the same
underlying construct. For example, speed is a derivative of time and distance, visibility affects
time to make decisions and respond, and the impact of distance on lethality of a weapon varies
with the characteristics of the weapons. We measured each of the variables in isolation as part of
a proof of concept with regard to this novel approach to developing performance and difficulty
metrics. Future scale-development research is needed to address this issue.
Steps necessary to overcome the limitations discussed above are explored in the
Recommendations for Future Metric Refinement and Validation Research sub-section below.
This document is a research report submitted to the U.S. Department of Justice. This report has not been published by the Department. Opinions or points of view expressed are those of the author(s)
and do not necessarily reflect the official position or policies of the U.S. Department of Justice.
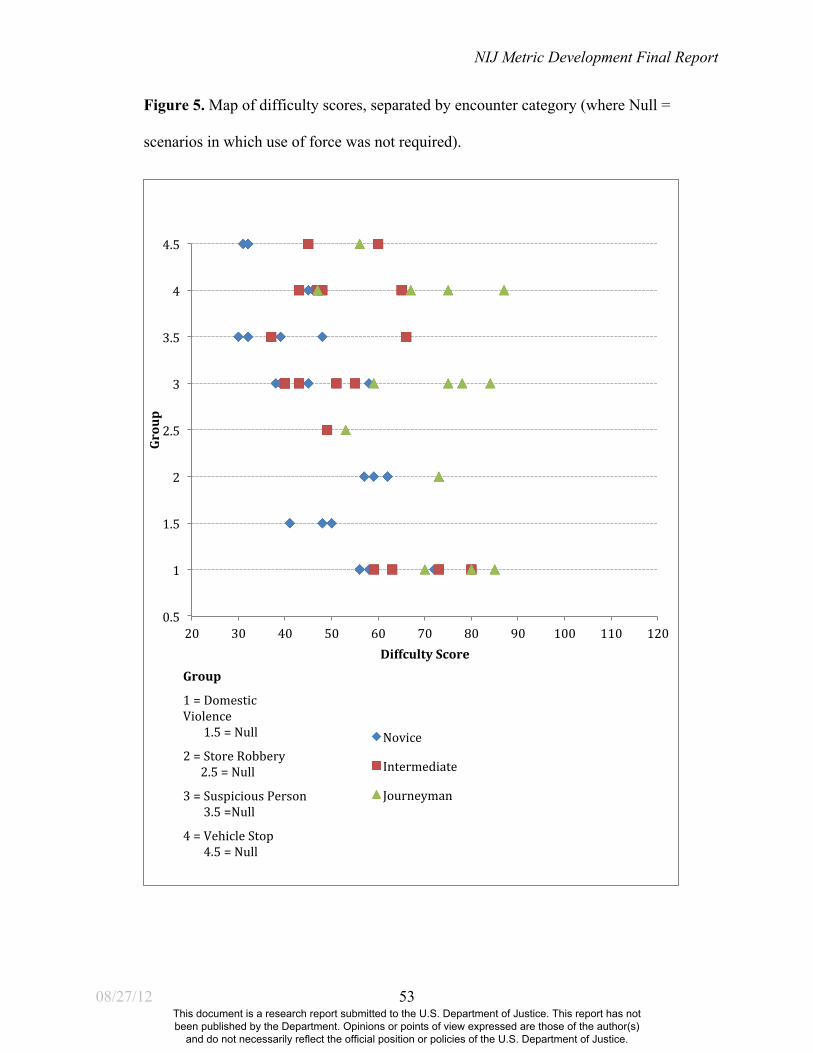
NIJ Metric Development Final Report
08/27/12 53
Figure 5. Map of difficulty scores, separated by encounter category (where Null =
scenarios in which use of force was not required).
0.5
1
1.5
2
2.5
3
3.5
4
4.5
20 30 40 50 60 70 80 90 100 110 120
Group
Diffculty Score
Novice
Intermediate
Journeyman
Group
1 = Domestic Violence 1.5 = Null
2 = Store Robbery 2.5 = Null
3 = Suspicious Person 3.5 =Null
4 = Vehicle Stop 4.5 = Null
This document is a research report submitted to the U.S. Department of Justice. This report has not been published by the Department. Opinions or points of view expressed are those of the author(s)
and do not necessarily reflect the official position or policies of the U.S. Department of Justice.
NIJ Metric Development Final Report
08/27/12 54
SUMMARY OF ACCOMPLISHMENTS
Objectives Achieved
We successfully developed difficulty and performance metrics using a novel research
approach that combined concept mapping and Thurstone scaling. We then pilot tested the
validity, reliability and utility of the metrics using data collected from original experimental and
field research. We also made substantial progress with research dissemination activities which
are reported below after the Recommendations for Future Research sub-section. All of the
following project objectives for developing, pilot testing, and disseminating the DFJDM metrics
were accomplished:
Core Objective 1. Develop Difficulty & Performance Measurement Scales
• ID & select 20 SMEs for judges & 323 firearms instructors for scale raters
• Prepare and administer performance-criteria mail-out survey to SMEs
• Judges meet to define DFJDM scale concepts & write scale item statements
• Raters rank scale item statements ➜ scales constructed w/Thurstone methods
• Refine draft scales & prepare P-scale and D-scale instruments
Core Objective 2. Pilot test validity, reliability & utility with data collected from
experimental studies
• Grad-student evaluators score simulator scenario difficulty using D-scale
• Randomly select 20 experimental subjects who have responded to scenarios in an
experiment using a firearms training simulator
• Grad student evaluators score subject performance post hoc from video data using P-
scale
• Analyze data & revise data collection instruments
This document is a research report submitted to the U.S. Department of Justice. This report has not been published by the Department. Opinions or points of view expressed are those of the author(s)
and do not necessarily reflect the official position or policies of the U.S. Department of Justice.

NIJ Metric Development Final Report
08/27/12 55
Core Objective 3. Pilot test validity, reliability & utility with data collected from field
research
• Obtain data from field research (simulated school shooter training)
• Grad-student Evaluators score data using the performance metrics (difficulty of
simulation held constant)
• Analyze inter-rater & within-rater reliability ➜ accept or repeat
Objective 4. Disseminate DFJDM Research Results
• Reports to NIJ
• Brief participants on results
• Conference presentations (IACP, ACJS, ASC, ILEETA)
• Academic journal articles & practitioner periodical articles
• Archive data & codebooks at NACJD
Policy Implications
Identifying baseline performance in officer-involved shootings
As was discussed in the literature review, one of the most fundamental things we do not
know is how well police officers tend to perform in combat shootings. Without this knowledge,
we are unable to identify gaps in training or assess the impact of training. Nor can we assess the
effectiveness of polices, procedures or laws at the population level.
The DFJDM metrics should be used to develop baselines for officer performance in
different types of situations and at various levels of difficulty. They provide an exhaustive list of
objectively measurable items that deadly force experts think are important for assessing the
difficulty of a deadly force encounter or predicting and assessing officer performance in that
encounter. They also provide an interval-level measure for these key variables that makes them
more amenable to analysis using multivariate statistical techniques. The knowledge gained from
This document is a research report submitted to the U.S. Department of Justice. This report has not been published by the Department. Opinions or points of view expressed are those of the author(s)
and do not necessarily reflect the official position or policies of the U.S. Department of Justice.
NIJ Metric Development Final Report
08/27/12 56
future research made possible by this improvement has the potential to save lives and increase
government efficiency by increasing the validity and precision of efficacy studies and
cost/benefit analyses, and thus help policy makers and trainers improve practices.
Implementing the DFJDM metrics as we did in the pilot studies described above will
make it possible to address questions such as “Did a management or training intervention affect
the probability that officers would be able to achieve an optimal—or at least acceptable—
outcome while holding constant the relative difficulty of different shooting scenarios or
situations?” This capability is vital for effective training and training evaluation, organizational
performance evaluation, and cost-benefit analyses. For example, DFJDM will make it possible to
measure the overall deadly force performance of an agency’s officers according to uniform
standards and assist in development of those standards (see Cizek and Bunch 2007). However, it
is important to emphasize that tools such as the DFJDM scales cannot be used to judge the
appropriateness of an officer’s actions in a particular field encounter. Every researcher
understands that probabilistic tools can only be used on aggregated events or populations, not on
a single event.
Reassessing how we think about judgment and decision making in deadly encounters
Another contribution of the DFJDM metrics will be to reassess the way we think about
key training and research issues. They should be used to operationalize and test Klinger’s (2005)
theoretical characterization of deadly encounters as systematic social interactions that conform to
Normal Accident Theory. And the results of that inquiry may be expected to inform both
training and research. For example, a better understanding of the systematic ways in which key
DFJDM constructs interact may help trainers develop new programs. In particular, trainees
might benefit from being taught about how to assess the complexity and coupling of a situation,
This document is a research report submitted to the U.S. Department of Justice. This report has not been published by the Department. Opinions or points of view expressed are those of the author(s)
and do not necessarily reflect the official position or policies of the U.S. Department of Justice.
NIJ Metric Development Final Report
08/27/12 57
how those factors affect the risk of an unexpected and disastrous outcome, and how to take
appropriate countermeasures. The metrics also could open new areas of research on police
officer performance and safety. For example, the DFJDM is currently being used by our
research team to directly test the impact of fatigue and long work hours on officers’ ability to
make deadly force decisions in an experimental setting.15 Based on pilot study data (Waggoner
et al. In press), we expect this study to provide policy makers and policing advocates with badly-
needed information that can guide their decisions regarding work hours, staffing and scheduling.
These are thorny problems for almost every police agency in the United States (Rajaratnam et
al., 2011; Vila et al. 2002; Vila 2000, 2006, 2010).
Examples of such studies that would be enabled or improved by using DFJDM
measurement scales include:
• Experimental evaluations of the causal link between deadly force standards,
accountability systems, or training and real-world performance;
• Experimental comparisons of the efficacy of different accountability systems and their
costs and benefits;
• Research to better understand why officers refrain from using deadly force even though
they would have been legally or procedurally justified to do so, and the situational and
interpersonal dynamics that influence their exercise of restraint;
• Experimental evaluations of the impact of different work-hour practices and officer
fatigue on performance in simulated and real deadly force encounters;
15 This is a combined project funded by the California Commission on Police Officer Standards and Training (contract no. 00112338) and the Office of Naval Research (grant no. N000141110185) entitled “Impact of Work-Shift Related Fatigue on Deadly Force Judgment and Decision Making, Driving, Cognition, and Tactical Social Interaction Performance.”
This document is a research report submitted to the U.S. Department of Justice. This report has not been published by the Department. Opinions or points of view expressed are those of the author(s)
and do not necessarily reflect the official position or policies of the U.S. Department of Justice.
NIJ Metric Development Final Report
08/27/12 58
• Exploring individual characteristics (e.g., experience, training, risk-tolerance, cognitive
abilities, etc.) that may predict how an officer will perform in a deadly encounter;
• Experiments on the impact of team training regimes such as those currently used to
prepare officers to respond to school active-shooter situations; and
• Exploring the utility of the DFJDM metrics for measuring performance among members
of various types and sizes of operational teams.
Development of more deadly force training simulators
Another potentially important use for the DFJDM metrics is in development of advanced
deadly force training simulators for use by police and military. Because the metrics provide
detailed guidance about what should be measured as well as interval-level values for Boolean
difficulty and performance assessment, they should be readily convertible into simulator scoring
software. Currently, most of these devices measure marksmanship, latency between when a shot
first becomes appropriate and when it is taken, whether bystanders were mistakenly shot, and the
number and timing of shots. The difficulty metrics make it possible to assess performance while
controlling for relative scenario difficulty, something that current simulators can only do in very
gross terms. The tactical social interaction metrics and simulation scenarios developed for the
DARPA SSIM program (above, p. 46) have demonstrated the utility of these techniques for both
training and research.
Recommendations for Future Metric Validation and Refinement Research
The goal of this research was to lay the foundation for development of interval-level
metrics for measuring difficulty and performance in potentially deadly police confrontations.
Future research is needed to further establish the utility, reliability and validity of the DFJDM
metrics.
This document is a research report submitted to the U.S. Department of Justice. This report has not been published by the Department. Opinions or points of view expressed are those of the author(s)
and do not necessarily reflect the official position or policies of the U.S. Department of Justice.

NIJ Metric Development Final Report
08/27/12 59
Testing the utility of DFJDM metrics for analyzing data from official reports
The DFJDM metrics’ utility should be tested with official reports of officer-involved
shootings. This would involve using them to create a measurement instrument that can be used
efficiently to collect data on performance and difficulty. This step would use the same process
we in the experimental tests and field tests described in this report: Identify all statements that
are applicable for measuring performance and difficulty from the reported data being assessed,
determine which of those statements are true, assign appropriate values for each true statement,
then compare the proportion of points received for D-scores and P-scores to the number of
possible points in the statements selected. This initially was an objective for this study, but the
concept mapping process, scoring, and initial scale-development processes required much more
effort and time than we anticipated.
Testing the impact of key difficulty factors in test scenarios
Work also needs to be done to further validate the metrics by testing subjects’ responses
to simulation scenarios under conditions in which key difficulty factors are carefully
manipulated. For example, distance from suspect, level of ambient light, level of ambient noise
and information about the suspect were all elements of difficulty that have been constant in our
prior experiments. However, these difficulty factors could be manipulated to expand the range of
possible difficulty scores achievable for each scenario. Distance from suspect can be
manipulated by placing the subject closer to the simulator screen. Light level can be adjusted
using simulator controls. Ambient noise could be added to influence cognitive effort, and thus
difficulty.
Another important potential difficulty issue that should be tested is “threat congruity”—
the extent to which an officer’s initial information about hazardous situational characteristics is
This document is a research report submitted to the U.S. Department of Justice. This report has not been published by the Department. Opinions or points of view expressed are those of the author(s)
and do not necessarily reflect the official position or policies of the U.S. Department of Justice.
NIJ Metric Development Final Report
08/27/12 60
consistent with the reality he or she encounters. The amount of information a subject has about
the scenario (for example homicidal intent of the suspect) can be varied in a simulation by
changing the extent to which the pre-scenario focus prompt (e.g., “You have received a domestic
disturbance call at the location, there are weapons in the house.”) is congruent with the threat
encountered.
Expanding the range of possible performance in test scenarios
It also would be possible to expand the range of possible performance scores achievable.
For example, in our prior experiments using the DFJDM metrics, subjects have not been
provided with cover, use of which is an element of performance; this constraint was imposed in
order to maintain a narrower empirical focus on decision making in early studies. It is possible
to provide future test subjects with cover specifically to measure this element of performance.
The same thing applies to another element of performance, effective clearing of weapon
malfunctions. In prior experiments these malfunctions have been very rare, however their
occurrence could be increased by using air-munitions (air filled ammunition that creates recoil in
modified training firearms and is more likely to cause jams) instead of the dry-fire option that we
have used thus far. In sum, now that the DFJDM metrics have been developed and pilot tested, it
is possible to expand the scope of metrics testing to allow for more well-focused experimental
measurements of difficulty and performance.
Use of scale-development and validation to refine DFJDM metrics
Both the DFJDM difficulty and performance metrics contain a great number of items.
Over the long term, the metrics should be refined through the use of scale-development and
validation techniques in order to winnow out less important or less valid items and, where
appropriate, create indices. This could be done using traditional scale development approaches
This document is a research report submitted to the U.S. Department of Justice. This report has not been published by the Department. Opinions or points of view expressed are those of the author(s)
and do not necessarily reflect the official position or policies of the U.S. Department of Justice.
NIJ Metric Development Final Report
08/27/12 61
such as factor analysis or principal components analysis that cluster highly correlated statements
into uncorrelated factors or components. For example, difficulty statements could be grouped
into “situational difficulty,” “difficulty related to suspects,” “difficulty related to officers,”
“difficulty due to the physical environment,” etc. Performance statements could be grouped into
“communication,” “management of situation,” “marksmanship,” etc. These refinements will
increase the statistical power of the metrics, and they also will make them easier to use.
Differentiating between performance predictors and performance behaviors
A further refinement that should be made is to separate the DFJDM performance metrics
into two separate components: (1) personal attributes that predict officer performance and are
measurable a priori (e.g., training, experience, education, communications skills, personal
biases); and (2) behaviors during a potentially deadly encounter (e.g., marksmanship, weapons
handling, control of the suspect, perceptual acuity).
This will streamline the use of performance behaviour metrics for use in operational and
training settings where performance scoring needs to be done contemporaneously. It also invites
exploration of the relationship between attributes that the experts in our concept mapping focus
group identified as predicting performance (e.g., type, recency, duration, and quality of training)
and how an officer actually performs in deadly force training or real-world deadly encounters.
Analysis of interactions between DFJDM metric items
It is critically important to understand how the variables in the complex social system of
a deadly encounter interact to influence police use of deadly force, and the relative difficulty of
those encounters. The research reported here has been a first step toward objectively measuring
officer performance within a deadly encounter, while controlling for encounter difficulty.
Isolating and assigning values to difficulty and performance variables has enabled us to assess
This document is a research report submitted to the U.S. Department of Justice. This report has not been published by the Department. Opinions or points of view expressed are those of the author(s)
and do not necessarily reflect the official position or policies of the U.S. Department of Justice.

NIJ Metric Development Final Report
08/27/12 62
what makes an encounter more or less difficult, and what tends to produce better or worse
performance in a simplistic manner—albeit one that is much more precise and broad ranging
than has been available previously.
The logical, and important, next step is to treat difficulty and performance as part of a
dynamic system, where variables interact and cause change in other variables. This is important
for improving the analytical power of the metrics because of the importance of interaction issues
and independence in multivariate analyses. More fundamentally, it also is necessary to test the
promising theoretical approach to understanding deadly encounters that Klinger described in his
2005 paper. By measuring the fluctuations of complex interactions, we expect to be able to
provide a deeper understanding of the dynamics of deadly encounters, and what officers need to
do to achieve the best possible outcome. Although, as was described previously, we have begun
addressing this issue as performers in the DARPA SSIM project, the scope of this research
problem is quite substantial.
Dissemination of Research Results
Translation of this research into practice was a high priority throughout the grant and
continues now that the project is complete. This section describes our efforts to disseminate
research results as they emerged, build interest in the importance of building our capacity to
measure what matters in criminal justice, create a consumer base for the metrics in the police
training community, and encourage commercial transition of the DFJDM metrics into the
training simulation industry.
This document is a research report submitted to the U.S. Department of Justice. This report has not been published by the Department. Opinions or points of view expressed are those of the author(s)
and do not necessarily reflect the official position or policies of the U.S. Department of Justice.

NIJ Metric Development Final Report
08/27/12 63
Dissemination of Research Activities
Our strategies for disseminating our research results to policy makers, researchers, police
managers, trainers, and training simulator manufacturers included formal presentations to
members of these groups, giving interviews to news media specializing in police topics about the
project, and personally informing influential members of both law enforcement communities and
the military about this work and how it applies to their own areas of interest. Examples of
dissemination activities include:
2009 Talk: “More Precise Deadly Force Metrics: Developing New Tools for Research
& Practice.” National Institute of Justice Research and Evaluation Conference,
Crystal City, Va., 16 June.
2009 Talk: “Adapting Training Simulators to Measure the Impact of Fatigue on Police
Performance.” National Institute of Justice Research and Evaluation Conference,
Crystal City, Va., 17 June.
2009 Media article: “New project seeks ‘first reliable tool’ for measuring performance
in OISs.” Force Science News article by Chuck Remsburg, 29 Oct.
2009 Workshop: “Experimental Evaluation: A Tool for Developing Training Simulation
Technologies.” National Institute of Justice Technology Institute for Law
Enforcement, Annapolis, Md., 3 Nov.
2010 Talk: “Simulation and Modeling for Critical Incident Tactical Training.”
Technologies for Critical Incident Response Annual Conference, Philadelphia, 4
Feb.
This document is a research report submitted to the U.S. Department of Justice. This report has not been published by the Department. Opinions or points of view expressed are those of the author(s)
and do not necessarily reflect the official position or policies of the U.S. Department of Justice.
NIJ Metric Development Final Report
08/27/12 64
2010 Talk: “Development of Realistic Deadly Force Judgment and Decision Making
Scenarios for Experimentation and Training.” American Society of Criminology
Annual Conference, San Francisco, Calif., 18 Nov. (with Lois James).
2010 Talk: “Interval-level Metrics for Evaluating Police Performance in Deadly Force
Situations.” American Society of Criminology Annual Conference, San
Francisco, Calif., 19 Nov.
2010 Research Meeting: “Accelerating Learning Phase II: Deadly Force Judgment and
Decision Making Neurophysiological Feedback Experimental Results and Future
Opportunities.” Defense Advanced Projects Research Agency, Defense Science
Office, St. Michaels, Md., 08 Dec.
2011 Talk: “Experiments Bridging Laboratory and Field: Novel Approaches for
Studying Deadly Force, Race Effects, and Training.” American Society of
Criminology Annual Conference, Washington, D.C., 16 Nov.
2011 Media: Announcement re Metrics research in International Association of Law
Enforcement Firearms Instructors monthly newsletter, Jan 17.
2012 “Bridging Lab and Field Experiments: High-Fidelity Simulation to Measure What
Matters for Cops and Marines.” U. Pennsylvania Perelman School of Medicine,
Division of Sleep and Chronobiology, Philadelphia, Penn. 21 May.
2012 “Measuring What Matters: To Enhance Justice, Improve Safety and Reduce Costs.”
National Institute of Justice Conference (Plenary), Arlington, Va., 20 June.
Data archiving
Data for this project and a DFJDM instruction manual were archived with the National
Archive of Criminal Justice Data (NACJD) on December 17, 2011. On December 21, receipt
This document is a research report submitted to the U.S. Department of Justice. This report has not been published by the Department. Opinions or points of view expressed are those of the author(s)
and do not necessarily reflect the official position or policies of the U.S. Department of Justice.
NIJ Metric Development Final Report
08/27/12 65
was acknowledged by Justin Noble, the lead research technician, who requested additional
information, which was sent two hours later, and acknowledged that same day. A copy of this e-
mail transaction is attached as Appendix J.
Translation of research into practice
The research design we developed to develop DFJDM metrics included two natural
channels for translating research into practice:
• Each of the expert judges who participated in the concept mapping process was deeply
connected with at least one, and sometimes all, of the constituencies that we hoped would
one day adopt the metrics. They went through the hard-nosed focus group process
together, argued over which items should be included and how they should be defined,
and watched the research team at work. As soon as this final report is accepted by NIJ, a
copy of the final report will be sent to each of these experts personally by the PI.
• During the Thurstone scaling process from 2010-11, we used a snowball approach to
reach out personally to thousands of experienced police firearms trainers, more than 300
of whom participated in the DFJDM survey process. One reason for keeping the survey
process open for a full year, rather than two months as we originally planned, was to
reach more trainers in more agencies in order to improve translation of research results
into practice. As soon as this final report is accepted by NIJ, the PI will send a copy of
the final report to each of the trainers who rated the metric items.
We think that these dynamics highlight yet another important benefit from combining concept
mapping and Thurstone scaling as we have done.
The Department of Homeland Security’s Federal Law Enforcement Training Center’s
Training Innovation Division’s support for this project also has opened many doors for
This document is a research report submitted to the U.S. Department of Justice. This report has not been published by the Department. Opinions or points of view expressed are those of the author(s)
and do not necessarily reflect the official position or policies of the U.S. Department of Justice.

NIJ Metric Development Final Report
08/27/12 66
translation of research into practice. They train law enforcement officers for 91 federal agencies
and also provide training programs for state, local and international police officers. More than
50,000 officers are trained each year by FLETC. At the beginning of this project in 2008, we
negotiated a Cooperative Research and Development Agreement with FLETC’s Training
Innovations Research Division, which is a federal laboratory, that enabled us to share staff and
resources. As soon as this report is accepted by NIJ, copies will be provided to FLETC.
Finally, our work with DARPA in the Accelerated Learning program16 and the Strategic
Social Interaction Module program17 exposed more than 100 cutting edge researchers to our
metrics development process in the course of eight PI meetings. This same dynamic is currently
at work in our ongoing research on the impact of police officer fatigue and shift work on their
performance in deadly force situations as well as on other critical operational capabilities such as
driving, cognition and strategic social interaction. This project, which is jointly funded by the
Office of Naval Research and the California Commission on Peace Officer Standards and
Training,18 exposes the PI and other members of our team to researchers and practitioners from
around the nation at 5-7 meetings each year as well as at an average of four to six workshops the
PI conducts each year for police executives and officers. In every one of these venues, we
explain how the DFJDM metrics are being used to measure officer performance in our
simulation-based experiments.
16 See the Testing Metrics with Experimental Data section beginning on p. 36. 17 See the Replication of Metric Development Technique section beginning on p. 45. 18 Project title “Impact of Work-Shift Related Fatigue on Deadly Force Judgment and Decision Making, Driving, Cognition, and Tactical Social Interaction Performance,” ONR grant no. N000141110185 and Calif. POST contract no. 00112338.
This document is a research report submitted to the U.S. Department of Justice. This report has not been published by the Department. Opinions or points of view expressed are those of the author(s)
and do not necessarily reflect the official position or policies of the U.S. Department of Justice.

NIJ Metric Development Final Report
08/27/12 67
Commercialization
While developing custom deadly force judgment and decision making simulation
scenarios for this project and the DARPA SSIM project, we have developed a close working
relationship with Advanced Interactive Systems, Inc., which manufactures the PRISim DFJDM
simulators used in the WSU Sleep and Performance Research Center’s Simulated Hazardous
Operational Tasks laboratory. In July 2012, we began exploring opportunities for applying the
DFJDM metrics and other aspects of our approach to increasing the precision and validity of
performance measurement to their simulation devices and training activities. No formal
agreements or contracts have been made between our organizations or staff other than two
contracts in which we paid AIS to develop video scenarios for this project, ASTRO and the
DARPA SSIM.
Conclusions
The DFJDM metrics make it possible to compare officer performance across deadly force
situations by 1) consistently measuring performance criteria that veteran police trainers, policy
makers and researchers agree are most important, and 2) controlling for differences in the
relative difficulty of the dynamic social setting in which deadly encounters take place. These
metrics obviously will benefit from further refinement and validation. In their current state,
however, we expect them to make it possible to compare the extent to which a management or
training intervention affects the probability that officers will be able to achieve an acceptable
outcome in a deadly force encounter. This capability is vital for evaluating organizational
performance, developing effective deadly force training, and improving practices. It is expected
to save lives and increase government efficiency.
This document is a research report submitted to the U.S. Department of Justice. This report has not been published by the Department. Opinions or points of view expressed are those of the author(s)
and do not necessarily reflect the official position or policies of the U.S. Department of Justice.
NIJ Metric Development Final Report
08/27/12 68
This research is the first step in understanding police use of deadly force in a much more
objective and measurable way. However, there still are major gaps in our knowledge relating to
the complex interaction of variables within a deadly encounter. Future research needs to explore
the elements that predict how an officer will perform in a deadly encounter, and analyze how
those elements interact to influence police use of deadly force. These next steps are critical for
furthering our understanding of the dynamics of deadly encounters and for evaluating what kinds
of deadly force policies, practices and training are most effective—and efficient.
This document is a research report submitted to the U.S. Department of Justice. This report has not been published by the Department. Opinions or points of view expressed are those of the author(s)
and do not necessarily reflect the official position or policies of the U.S. Department of Justice.

NIJ Metric Development Final Report
08/27/12 69
REFERENCES
Adams R., McTernan J., C. Remsberg (1980). Street Survival: Tactics for Armed Encounters.
Northbrook, IL: Calibre Press.
Alpert G.P. (1989). Metro-Date Police Department Discharge of Firearm Study: 1984-1988.
Unpublished consulting report to the Metro-Dade Police Department.
Alpert G.P. and R.G. Dunham (1995). Police Use of Deadly Force: A Statistical Analysis of
the Metro-Dade Police Department. Washington, DC: Police Executive Research Forum.
Alpert, G.P. and L. Fridell (1992). Police Vehicles and Firearms: Instruments of Deadly Force.
Prospect Heights, IL: Waveland Press.
Appiah, K. Anthony. 2008. Experiments in Ethics. Cambridge, Mass.: Harvard University Press.
Artwohl, Alexis and Loren W. Christensen. (1997) Deadly Force Encounters. Boulder, Colo.:
Paladin Press.
Barash, David P. 1982. Sociobiology and Behavior, 2nd Ed. New York, Elsevier.
Behneman, Adrienne, Chris Berka, Ronald Stevens, Bryan Vila, Veasna Tan, Trysha Galloway,
Robin Johnson, Giby Raphael. (2012) “Neurotechnology to Accelerate Learning: During
Marksmanship Training.” IEEE Pulse, 3:1:60-63
Binder A. and L. Fridell (1984). "Lethal Force as a Police Response." Criminal Justice
Abstracts, 16(2):250-280.
Bittner E. (1975). The Functions of the Police in Modern Society. New York: Jason Aronson.
Bland JM, Altman DG. 1995a. Calculating correlation coefficients with repeated observations:
Part 1 – correlation within subjects. Br Med J, 310: 446.
Bland JM, Altman DG. 1995b. Calculating correlation coefficients with repeated observations:
Part 2 – correlation between subjects. Br Med J, 310: 633.
Brand R.F. and Peak, K. (1995).“Assessing Police Training Curricula: ‘Consumer Reports’ ”,
The Justice Professional, 9(1):45-58.
Bradley, Patrick L. (2005) “21st Century Issues Related to Police Training and Standards.” The
Police Chief, 72:10.
Brooks P. (1975).“…officer down, code three.” Schiller Park, IL: Motorola Teleprograms, Inc.
This document is a research report submitted to the U.S. Department of Justice. This report has not been published by the Department. Opinions or points of view expressed are those of the author(s)
and do not necessarily reflect the official position or policies of the U.S. Department of Justice.

NIJ Metric Development Final Report
08/27/12 70
Brown, Patrick A., Lawrence A. Greenfeld, Steven K. Smith, Matthew R. Durose and David J.
Levin (2001). Contacts between Police and the Public: Findings from the 1999 National
Survey. Bureau of Justice Statistics, U.S. Department of Justice: Washington, D.C., NCJ
184957.
Brown, Jodi M. and Patrick A. Langan. (2001) Policing and Homicide, 1976-98: Justifiable
Homicide by Police, Police Officers Murdered by Felons. Washington, D.C.: Bureau of
Justice Statistics, NCJ 180987.
Cerar J.C. (1992). Firearms Discharge Assault Report, 1992: New York City Police Department
Academy Firearms and Tactics Section. Unpublished annual report by the New York
City Police Department.
Cizek, Gregory J. and Michael B. Bunch. (2007) Standard Setting: A Guide to Establishing and
Evaluating Performance Standards on Tests. Thousand Oaks, Calif.: Sage.
Cooke NJ & Shope SM (2005). Synthetic task environments for teams: CERTT’s UAV-STE.
Handbook on Human Factors and Ergonomics Methods. CLC Press: Boca Raton, Fla.:
46-1 to 46-6.
Crookall, Paul. (2006) “RCMP and the Balanced Scorecard: Mounties attain excellence with
management tool.” downloaded 8Feb08 from
www.networkedgovernment.ca/ManagementExcellenceCrookall.
DeLorenzi, Daniel, Jon M. Shane and Karen Amendola. (2006) “The CompStat Process:
Managing Performance on the Pathway to Leadership.” The Police Chief, 73:9.
Durose, Matthew R., Erica L. Schmitt and Patrick A. Langan (2005). Contacts between Police
and the Public: Findings from the 2002 National Survey. Washington, D.C.: Bureau of
Justice Statistics, U.S. Department of Justice, NCJ 207845.
Ellis, Beth H., Wade M. Bannister, Jacquilyn Kay Cox, Brenda M. Fowler, Erin Dowd
Shannon, David Drachman, Randall W. Adams and Laura A. Giordano (2003).
“Utilization of the propensity score method: An exploratory comparison of proxy-
completed to self-completed responses in the Medicare Health Outcomes Survey.”
Health and Quality of Life Outcomes, 1:47:1-12.
Federal Bureau of Investigation (1998).Uniform Crime Report. Washington, DC: US
Government Printing Office.
This document is a research report submitted to the U.S. Department of Justice. This report has not been published by the Department. Opinions or points of view expressed are those of the author(s)
and do not necessarily reflect the official position or policies of the U.S. Department of Justice.
NIJ Metric Development Final Report
08/27/12 71
Ederheimer, J. and L.A. Fridell, Eds. (2005). Chief Concerns: Exploring the Challenges of
Police Use of Force. Washington, DC: The Police Executive Research Forum.
Fridell L. and T. Pate (1997). “Death on Patrol: Killings of Police Officers.” In Dunham, Roger
G. and Geoffrey P. Alpert (Eds). Critical Issues in Policing: Contemporary Readings.
Third edition. Prospect Heights, IL: Waveland Press, 580-608.
Fridell L. and Tony P. (1997). “Use of Force: A Matter of Control.” In Mark Dantzker (Ed).
Police Today and Tomorrow: Contemporary Personnel Issues and Trends. Butterworth-
Heinemann, 217-256.
Fridell L. and T. Pate (2001). “The Other Side of Deadly Force: The Felonious Killings of
Police Officers.” In Dunham, Roger G. and Geoffrey P. Alpert (Eds). Critical Issues in
Policing: Contemporary Readings. Fourth edition. Prospect Heights, IL: Waveland
Press.
Fridell L. (2005). “Improving Use-of-Force Policy, Policy Enforcement, and Training.” In Josh
Ederheimer and Lorie A. Fridell (Eds). Chief Concerns: Exploring the Challenges of
Police Use of Force. Washington, DC: The Police Executive Research Forum.
Fridell L. (2006). “Building Community Trust Around Issues of Force.” In Josh Ederheimer
(Ed). Chief Concerns: Strategies for Resolving Conflict and Minimizing Use of Force.
Washington, D.C.: The Police Executive Research Forum.
Friedl K, Mallis M, Ahlers S, Popkin S, Larkin W (2004). Research requirement for operational
decision-making .
using models of fatigue and performance. Aviat Space Environ Med 75: A192-A199.
Fyfe J.J. (1978)."Shots Fired: An Examination of New York City Police Firearms Discharges."
Ann Arbor, MI: University Microfilms International.
Fyfe J.J. (1981).“Observations on Police Deadly Force.” Crime and Delinquency, 27(3):376-89
Fyfe, James J. 1980. “Always Prepared: Police Off-Duty Guns,” Annals of the American
Agademy of Political and Social Science, 452 (Nov.): 72-81.
Fyfe, James, J., “Police Liability: What Leading Law Enforcement Executives Need to Know,”
In CALEA Update, Vol. 65, Pp. 6-13 (Sept., 1997).
Fyfe, James, J., “Urban Policing in Australia and the United States,” In Policing Issues, Issue #1,
Pp. 1-12 (Sept., 2000).
This document is a research report submitted to the U.S. Department of Justice. This report has not been published by the Department. Opinions or points of view expressed are those of the author(s)
and do not necessarily reflect the official position or policies of the U.S. Department of Justice.

NIJ Metric Development Final Report
08/27/12 72
Geller W.A. (1985).“Officer Restraint in the Use of Deadly Force: The Next Frontier in Police
Shooting Research.” Journal of Police Science and Administration, 13(2):153-171.
Geller W.A. and K.J. Karales (1981). Split-Second Decisions: Shootings of and by Chicago
Police. Chicago, IL: The Chicago Law Enforcement Study Group.
Geller W.A. and M.S. Scott (1992). Deadly Force: What We Know. Washington, DC: Police
Executive Research Forum.
Gibbons Jean D. (1993). Nonparametric Measures of Association. Newbury Park, Calif.: Sage,
pp. 29-47.
Goldstein, Herman. (1967a) “Police Policy Formulation: A Proposal for Improving Police
Performance,” In Michigan Law Review, Vol. 65, No. 6, Pp. 1123-1146.
Goldstein, Herman. (1967b) “Administrative Problems in Controlling the Exercise of Police
Authority,” In The Journal of Criminal Law, Criminology, and Police Science, Vol. 58,
No. 2, Pp. 160-172.
Goldstein, Herman., “Police Discretion: The Ideal versus the Real,” In Public Administration
Review, Vol. 23, No. 3, Pp. 140-148 (Sep., 1963).
Hickman, M.J. (2005). State and Local Law Enforcement Training Academies. Washington,
DC: US Department of Justice.
Holmes G.R., Cole E., and L. Hicks (1992).“Curriculum development: Relevancy and
innovation.” The Police Chief, 59(11):51-52.
Jeffers H.P. (1994).Commissioner Roosevelt: The Story of Theodore Roosevelt and the New
York City Police, 1895-1897. New York John Wiley & Sons.
Jordan W.H. (1965).No Second Place Winner. Shreveport, LA: self-published
Kaminski, Robert J. and Jeffrey Martin (2000). An Analysis of Police Officer Satisfaction with
Defense and Control Tactics." Policing: An International Journal of Police Strategies
and Management, 23(2).
Kaplan, Robert S. (2002) “The Balanced Scorecard and Nonprofit Organizations.” Balanced
Scorecard Report, Sept.–Oct. Cambridge, Mass.: Harvard Business School Publishing.
Kane, M. and Trochim, W. (2007). Concept Mapping for Planning and Evaluation. Sage:
Thousand Oaks, Calif.
This document is a research report submitted to the U.S. Department of Justice. This report has not been published by the Department. Opinions or points of view expressed are those of the author(s)
and do not necessarily reflect the official position or policies of the U.S. Department of Justice.

NIJ Metric Development Final Report
08/27/12 73
Kawachi, Ichiro. (1997). Heart rate variability. Allostatic Load Working Paper, John D. and
Catherine T. MacArthur Research Network on Socioeconomic Status and Health.
www.macses.ucsf.edu/Research/Allostatic/notebook/heart.rate.html. Download
28Jan2007, 2205hrs. PST.
Klinger, David. (2001) “Suicidal Intent in Victim-Precipitated Homicide: Insights From the
Study of ‘Suicide-by-
Cop.’” Homicide Studies, 5(3):206-226.
Klinger, D. (2004). Into the Kill Zone: A Cop’s Eye View of Deadly Force. San Francisco:
Jossey-Bass.
Klinger, D. (2005). Social Theory and the Street Cop: The Case of Deadly Force. Ideas in
American Policing, No. 7. Washington, D.C.: Police Foundation.
Marion N. (1998).“Police academy training: Are we teaching recruits what they need to know?”
Policing: An International Journal of Police Strategies & Management, 21(1):54.
Marsh H.L. and E. Grosskopf (1991).“The key factors in law enforcement training:
Requirements, assessments and methods.” The Police Chief, 58(11):64-66.
Martin E, Lyon DR, Schreiber BT. (1998). Designing synthetic tasks for human factors
research: An application to uninhabited air vehicles. Proceedings of the Human Factors
and Ergonomics Society 42nd Annual Meeting (pp. 123-127). Human Factors and
Ergonomics Society, Santa Monica, Calif.
Mason J.D. (1976).Combat Handgun Shooting. Springfield, IL: Charles C. Thomas, Publisher,
Publisher.
Matulia K.J. (1982). A Balance of Forces. Gaithersberg, MD: International Association of
Chiefs of Police.
McEwen BS. 1998. Protective and damaging effects of stress mediators. New England J Med.
338: 171-179.
McLellan, T.M., G.H. Kamimori, D.G. Bell, I.F. Smith, D. Johnson and G. Belenky (2005)
Caffeine Maintains Vigilance and Marksmanship in Simulated Urban Operations with
Sleep Deprivation. Aviat Space Environ Med, 76, 39-45.
McGee F. (1981). “New York City Police Department Analysis of Police Combat Situations.”
Unpublished internal report by the New York City Police Department.
This document is a research report submitted to the U.S. Department of Justice. This report has not been published by the Department. Opinions or points of view expressed are those of the author(s)
and do not necessarily reflect the official position or policies of the U.S. Department of Justice.
NIJ Metric Development Final Report
08/27/12 74
McManus G.P., Griffen J.I., Witterroth W.J., Boland M., and P.T. Hines. (1970). Police
Training and Performance Study. Washington, DC: US Government Printing Office.
Meeker, James, Bryan Vila and Katie J.B. Parsons (2002). “GITS: A Comprehensive Regional
Approach to Street Gang Crime.” In Winfred Reed, ed. Responding to Gangs:
Evaluation and Research. Washington, D.C.: National Institute of Justice.
Mehta, R.L., B. McDonal, F. Gabbai, M. Pahl, A. Farkas, M.T.A. Pascual, S. Zhuang, R.M.
Kaplan and G.M. Chertow (2002). “Nephrology consultation in acute renal failure: Does
timing matter?” American Journal of Medicine, 113:456-528.
Miller, Bank and Ben Kurata. (2007) “12 critical elements of a modern firearms training
program.” The Police Marksman. Download from www.PoliceOne.com 21Aug2007.
Miller DC and Salkind NJ. 2002. Handbook of Research Design and Social Measurement, 6th
Ed. Thousand Oaks, Calif.: Sage.
Milton C.H., Halleck J.W., Lardner J., and G. Albrecht (1977). Police Use of Deadly Force.
New York, NY: John Wiley and Sons.
Morrison G.B. (1995).“A Critical History and Evaluation of American Police Firearms Training
to 1945. Ann Arbor, MI: Microfilms International.
Morrison G.B. (2001).Police and Correctional Officer Handgun Training in Washington State:
A Report to the Washington State Criminal Justice Training Commission. Unpublished
report available from the Washington State Criminal Justice Training Commission or the
author.
Morrison G.B. (2002).“Police Firearms Training Survey−2001: Policies, programs and
practices: Final Report.” (May).Unpublished report available from the author at the
Department of Criminal Justice & Criminology, Ball State University.
Morrison G.B. and P.L. Shave (2002). “Firearms Training Challenges in the Smaller
Department.” Police Chief, 69(6):17-24.
Morrison G.B. (2003).“Police and Correctional Department Firearm Training Frameworks in
Washington State.” Police Quarterly, 6(2):192-221.
Morrison G.B. (2005).“Police Inservice Deadly Force Training and Requalification in
Washington State.” Law Enforcement Executive Forum, 5(2):67-86.
This document is a research report submitted to the U.S. Department of Justice. This report has not been published by the Department. Opinions or points of view expressed are those of the author(s)
and do not necessarily reflect the official position or policies of the U.S. Department of Justice.

NIJ Metric Development Final Report
08/27/12 75
Morrison G.B. (2006).“Police Department and Instructor Perspectives on Pre-service Firearm
and Deadly Force Training.” Policing: An International Journal of Police Strategies &
Management, 29(2):226-245.
Morrison G.B. (2006).“Deadly Force Programs among larger US Police Departments.” Police
Quarterly, 9(3):331-360.
Morrison, Gregory B. (2007) “Police Firearms Training prior to Tennessee v. Garner.” Paper
presented at the annual meetings of the American Society of Criminology in Atlanta,
Georgia.
Morrison, Gregory B. (2008) “The FBI’s Practical Pistol Course: Police Reform, Officer Safety
and Handgun Training in the Mid-20th Century.” Law Enforcement Executive Forum,
8(1), 41-64 .
Morrison G.B. and B.J. Vila (1998). “Police Handgun Qualification: Practical measure or
aimless activity?” Policing: An International Journal of Police Strategies and
Management, 21(3):510-533.
National Institute of Law Enforcement and Criminal Justice (1978), The National Manpower
Survey of the Criminal Justice System: Volume 5, Criminal Justice Education and
Training, US Department of Justice, Washington, DC
Ness J.J. (1991).“The relevance of basic law enforcement training: Does the curriculum prepare
recruits for police work; a survey study.” Journal of Criminal Justice, 19(2):181-193.
Parker, G.A. (1974) “Assessment strategy and the evolution of fighting behaviour.” Journal of
Theoretical Biology, 47:223-243.
Pate A. and L. Fridell (1993). Police Use of Force: Official Reports, Citizen Complaints, and
Legal Consequences, Volumes I and II. Washington, DC: The Police Foundation.
Pateman, Andrew J. and Geoff Gruson. (2004) “Creating Organizational Alignment at the
RCMP with the Scorecard.” Balanced Scorecard Report, Sept.–Oct. 2004. Cambridge,
Mass.: Harvard Business School Publishing.
Perrow C. (1984) Normal Accidents: Living with High-Risk Technologies. New York: Basic
Books.
Pinizzotto, Anthony J., Edward F. Davis, Charles E. Miller, III (2006). Violent Encounters: A
Study of Felonious Assaults on our Nation’s Law Enforcement Officers. Washington,
D.C.: Federal Bureau of Investigation.
This document is a research report submitted to the U.S. Department of Justice. This report has not been published by the Department. Opinions or points of view expressed are those of the author(s)
and do not necessarily reflect the official position or policies of the U.S. Department of Justice.
NIJ Metric Development Final Report
08/27/12 76
Rajaratnam, SMW, Barger LK, Lockley, SW Czeisler, CA, et al. (2011). “Sleep Disorders,
Health, and Safety in Police Officers.” JAMA, 306:23: 2567-78.
Reaves, Brian A. and Matthew J. Hickman (2002) Census of State and Local Law Enforcement
Agencies, 2000. Washington, D.C.: Bureau of Justice Statistics, US Department of
Justice, NCJ 194006.
Reaves B. and T. Hart (1999). Law Enforcement Management and Administrative Statistics,
1997: Data for Individual State and Local Agencies with 100 or More Officers. Bureau
of Justice Statistics, US Department of Justice.
Rosenbaum P.R. and Rubin D.B. (1983). “The central role of the propensity score in
observational studies for causal effects.” Biometrika, 70:41-55.
Ruecker, Ronald C. (2008) “Examining the Use of Force.” The Police Chief, 74:12.
Schade, T.V., G.H. Bruns and G. B. Morrison (1989)."Armed Confrontations: Police Shooting
Performance in Armed Confrontations." American Journal of Police, 8(2):31-48.
Scharf, P. and A. Binder (1983). The Badge and the Bullet: Police Use of Deadly Force. New
York, NY: Praeger Publishers.
Schuster, Beth (2009) “Preventing, Preparing for Critical Incidents in Schools.” NIJ Journal,
262: 42-42, NCJ 225765. www.ncjrs.gov/pdffiles1/.../225758.pdf
Strawbridge, P. and D. Strawbridge (1990).“A Networking Guide to Recruitment, Selection and
Probationary Training of Police Officers in Major Police Departments of the United
States of America.” New York: The Commonwealth Fund of New York and the John Jay
College of Criminal Justice.
Skillen, C.R. and M. Williams (1977). American Police Handgun Training. Springfield, IL:
Charles C. Thomas.
Sundin EC & Horowitz MJ. 2003. Horowitz’s impact of events scale evaluation of 20 years of
use. Psychosomatic Medicine, 65:870-876.
Talley R.A. (1984), A task inventory follow-up evaluation of the Oakland Police Academy
curriculum. A survey study, Michigan State University, Lansing, Michigan [Unpublished
doctoral dissertation].
Thurstone L and Chave E. 1929. The Measurement of Attitude. Chicago: University of
Chicago Press.
This document is a research report submitted to the U.S. Department of Justice. This report has not been published by the Department. Opinions or points of view expressed are those of the author(s)
and do not necessarily reflect the official position or policies of the U.S. Department of Justice.

NIJ Metric Development Final Report
08/27/12 77
Traut, C.A., S.Feimer, C.F. Emmert and K. Thom. (2000). “Law Enforcement Recruit
Training at the State Level: An Evaluation.” Police Quarterly, 3(3):294-314.
Trochim WM. 2001. The Research Methods Knowledge Base, 2nd Edition. Cincinnati: Atomic
Dog.
Tufte, Edward. (1994) Envisioning Information. Cheshire, Conn.: Graphics Press.
Vila Bryan, Gregory B. Morrison and Dennis Jay Kenney (2002). “Improving Shift Schedule
and Work-Hour Policies and Practices to Increase Police Officer Health, Safety and
Performance.” Police Quarterly, 5:1:4-24.
Vila Bryan J. and Gregory B. Morrison (1994).“Biological Limits to Police Combat Handgun
Shooting Accuracy.” American Journal of Police, 13(1):1-30.
Vila, Bryan and James W. Meeker (1997). “A Regional Gang Incident Tracking System.”
Journal of Gang Research 4:3:23-36.
Vila, Bryan. (2000) Tired Cops: The Importance of Managing Police Fatigue. Washington,
D.C.: Police Executive Research Forum.
Vila, Bryan. (2006) “Impact of Long Work Hours on Police Officers and the Communities They
Serve.” American Journal of Industrial Medicine 49:11, 972-980.
Vila, Bryan. (2010) The Effects of Officer Fatigue on Accountability and the Exercise of Police Discretion. In Candace McCoy (ed.), Holding Police Accountable. Washington, D.C: Urban Institute Press, chapter 7.
Violanti JM, Vena JE, Petralia S. 1998. Mortality of a police cohort: 1950-1990. Am J Ind Med
33:366-373.
Violanti JM, Vena JE, Marshall JR, Petralia S. 1996. A comparative evaluation of police
suicide rate validity. Suicide Life-Threat Behav 26:79-85.
Walker Sam and Lorie Fridell (1993). "Forces of Change in Police Policy: The Impact of
Tennessee v. Garner on Deadly Force Policy." American Journal of Police 11(3):97-112.
Waggoner*, Lauren, Devon Grant, Hans Van Dongen, Gregory Belenky and Bryan Vila. (In
press.) “A Combined Field and Laboratory Design for Assessing the Impact of Night-
Shift Work on Police Officer Operational Performance.” SLEEP.
Weston P. B. (1960).Combat Shooting for Police. Springfield, IL: Charles C. Thomas,
Publisher.
Williams M. (1977).The Law Enforcement Books of Weapons, Ammunition, and Training
Procedures. Springfield, IL: Charles C. Thomas, Publisher.
This document is a research report submitted to the U.S. Department of Justice. This report has not been published by the Department. Opinions or points of view expressed are those of the author(s)
and do not necessarily reflect the official position or policies of the U.S. Department of Justice.
NIJ Metric Development Final Report
08/27/12 78
Yanovitzkya, Itzhak, Elaine Zanutto and Robert Hornik (2005). “Estimating causal effects of
public health education campaigns using propensity score methodology.” Evaluation and
Program Planning, 28:209–220.
Legal Cases
City of Canton, Ohio v. Harris, 489 US 378 (1989)
Tennessee v. Garner, 471 US 1 (1985)
Graham v. Connor, 490 US 386 (1989)
This document is a research report submitted to the U.S. Department of Justice. This report has not been published by the Department. Opinions or points of view expressed are those of the author(s)
and do not necessarily reflect the official position or policies of the U.S. Department of Justice.

NIJ Metric Development Final Report
08/27/12 79
APPENDICES
Appendix A: Subject Matter Experts’ Concept Mapping Workshop Agenda
This document is a research report submitted to the U.S. Department of Justice. This report has not been published by the Department. Opinions or points of view expressed are those of the author(s)
and do not necessarily reflect the official position or policies of the U.S. Department of Justice.

NIJ Metric Development Final Report
08/27/12 80
This document is a research report submitted to the U.S. Department of Justice. This report has not been published by the Department. Opinions or points of view expressed are those of the author(s)
and do not necessarily reflect the official position or policies of the U.S. Department of Justice.

NIJ Metric Development Final Report
08/27/12 81
Appendix B: Slides Used To Facilitate Concept Mapping Workshop
This document is a research report submitted to the U.S. Department of Justice. This report has not been published by the Department. Opinions or points of view expressed are those of the author(s)
and do not necessarily reflect the official position or policies of the U.S. Department of Justice.

NIJ Metric Development Final Report
08/27/12 82
This document is a research report submitted to the U.S. Department of Justice. This report has not been published by the Department. Opinions or points of view expressed are those of the author(s)
and do not necessarily reflect the official position or policies of the U.S. Department of Justice.

NIJ Metric Development Final Report
08/27/12 83
This document is a research report submitted to the U.S. Department of Justice. This report has not been published by the Department. Opinions or points of view expressed are those of the author(s)
and do not necessarily reflect the official position or policies of the U.S. Department of Justice.
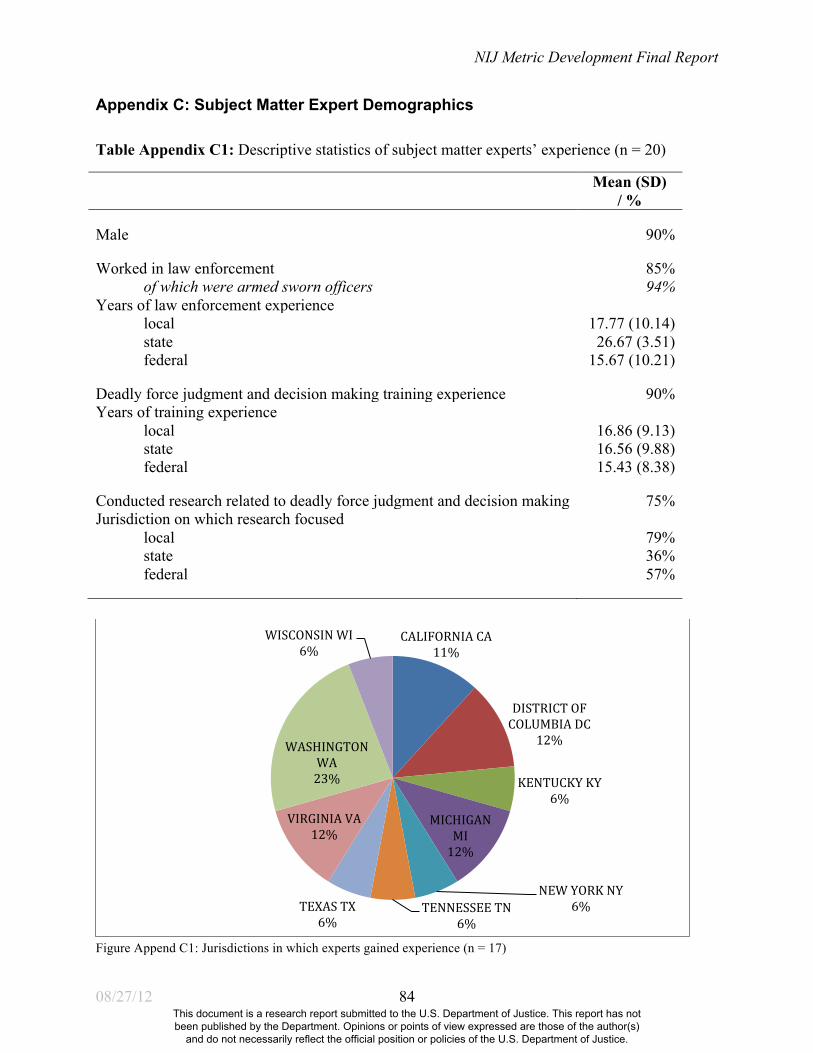
NIJ Metric Development Final Report
08/27/12 84
Appendix C: Subject Matter Expert Demographics
Table Appendix C1: Descriptive statistics of subject matter experts’ experience (n = 20)
Mean (SD) / %
Male 90% Worked in law enforcement 85%
of which were armed sworn officers 94% Years of law enforcement experience
local 17.77 (10.14) state 26.67 (3.51) federal 15.67 (10.21)
Deadly force judgment and decision making training experience 90% Years of training experience
local 16.86 (9.13) state 16.56 (9.88) federal 15.43 (8.38)
Conducted research related to deadly force judgment and decision making 75% Jurisdiction on which research focused
local 79% state 36% federal 57%
Figure Append C1: Jurisdictions in which experts gained experience (n = 17)
CALIFORNIA CA 11%
DISTRICT OF COLUMBIA DC
12%
KENTUCKY KY 6%
MICHIGAN MI 12%
NEW YORK NY 6% TENNESSEE TN
6% TEXAS TX
6%
VIRGINIA VA 12%
WASHINGTON WA 23%
WISCONSIN WI 6%
This document is a research report submitted to the U.S. Department of Justice. This report has not been published by the Department. Opinions or points of view expressed are those of the author(s)
and do not necessarily reflect the official position or policies of the U.S. Department of Justice.

NIJ Metric Development Final Report
08/27/12 85
Appendix D: List of Original Difficulty And Performance Statements
Statement # Statement
Difficulty 1 number of officers present at scene
Difficulty 2 race of suspect
Difficulty 3 opponent’s observable emotional state
Difficulty 4 time from beginning of encounter to deadly force application
Difficulty 5 time from threat appears to threat employed
Difficulty 6 quickness of assault on officer or another person
Difficulty 7 distance between officer and suspect
Difficulty 8 suspect movement
Difficulty 9 direction of suspect movement relative to officer
Difficulty 10 proportion of suspect exposed to view
Difficulty 11 proportion of suspect vulnerable to officer
Difficulty 12 suspect lethal areas vulnerable
Difficulty 13 hands are visible
Difficulty 14 number of suspects present
Difficulty 15 number of bystanders present
Difficulty 16 number of potentially threatening people present
Difficulty 17 number of bystanders under direct threat
Difficulty 18 number of hostages under direct threat
Difficulty 19 distance between officer and bystander
Difficulty 20 distance between suspect and bystander
This document is a research report submitted to the U.S. Department of Justice. This report has not been published by the Department. Opinions or points of view expressed are those of the author(s)
and do not necessarily reflect the official position or policies of the U.S. Department of Justice.

NIJ Metric Development Final Report
08/27/12 86
Difficulty 21 distance between officer and other officer
Difficulty 22 vertical distance of officer from suspect
Difficulty 23 position of officer standing
Difficulty 24 position of officer kneeling
Difficulty 25 position of officer prone
Difficulty 26 position of officer supine
Difficulty 27 officer movement is restricted
Difficulty 28 incident occurs out of doors
Difficulty 29 incident occurs inside a structure
Difficulty 30 incident occurs alongside a roadway
Difficulty 31 incident occurs in an alley
Difficulty 32 incident occurs in a high crime rate area
Difficulty 33 extent to which location constrains officer's tactical options
Difficulty 34 population density
Difficulty 35 climate
Difficulty 36 size of area in which to maneuver
Difficulty 37 element of surprise an officer experiences on entering a situation
Difficulty 38 type, amount and quality of information an officer posses
Difficulty 39 match between prior information and what presents at the scene
Difficulty 40 multiple threat angles
Difficulty 41 light direction
Difficulty 42 reflected light
This document is a research report submitted to the U.S. Department of Justice. This report has not been published by the Department. Opinions or points of view expressed are those of the author(s)
and do not necessarily reflect the official position or policies of the U.S. Department of Justice.

NIJ Metric Development Final Report
08/27/12 87
Difficulty 43 ambient light levels
Difficulty 44 perceived light levels
Difficulty 45 suspect's size
Difficulty 46 suspect dress
Difficulty 47 suspect’s structure
Difficulty 48 suspect’s sex
Difficulty 49 suspect’s age
Difficulty 50 equipment immediately available to the officer
Difficulty 51 ambient noise
Difficulty 52 ability to be heard
Difficulty 53 ability to hear
Difficulty 54 auditory distractions
Difficulty 55 loss or inability to communicate with fellow officers
Difficulty 56 loss or inability to communicate with dispatch
Difficulty 57 types of weapons confronted: long guns, hand guns, edged weapons, blunt force weapons, biohazard, hands, and feet.
Difficulty 58 officer's level of aggressiveness
Difficulty 59 officer familiarity with weapon system
Difficulty 60 characteristics of officer on the scene such as rank structure, assignment, familiarity with one another, experience.
Difficulty 61 officer’s lack of options such as LTL, expectation of backup, inability to disengage
Difficulty 62 location of bystanders in relation to suspect
Difficulty 63 communication barriers between officers, bystanders, and suspects as language
Difficulty 64 officer lacks information about intent of suspect (suicidal, homicidal,…)
This document is a research report submitted to the U.S. Department of Justice. This report has not been published by the Department. Opinions or points of view expressed are those of the author(s)
and do not necessarily reflect the official position or policies of the U.S. Department of Justice.

NIJ Metric Development Final Report
08/27/12 88
Difficulty 65 seriousness and type of preceding events during the day that affects officer's mindset
Difficulty 66 opponent level of drug/alcohol intoxication or other impairment
Difficulty 67 availability or lack of physical cover that protects against threat being presented
Difficulty 68 suspect's behavior is defiantly non-compliant
Difficulty 69 known or perceived training or skill level of opponent or suspect
Difficulty 70 officer must deal with threat even though injured during initial response to the scene or during engagement
Difficulty 71 escape potential of the suspect
Difficulty 72 handgun was holstered when the decision was made to shoot
Difficulty 73 suspect has means, opportunity, or perceived intent to cause injury, so that officer has no resort except to use deadly force
Difficulty 74 organizational cultural/mindset that influences officer's ability to make optimal decision
Difficulty 75 disconnect between departmental policy and the law
Difficulty 76 knowledge of location that officer brings to the scene and that is developed after arrival
Difficulty 77 officer equipment failures, malfunction, or out of ammunition
Difficulty 78 recent media reports of alleged excessive use of force
Difficulty 79 presence of media at the scene of a deadly-force encounter
Difficulty 80 officer has dealt with suspect before
Difficulty 81 general perceptions of skills and abilities formed through departmental training
Difficulty 82 known officer down at the scene
Difficulty 83 intensity of light at the scene
Difficulty 84 suspect feigns a weapon
Difficulty 85 extreme environmental conditions (cold, heat, weather, rain, fog)
Difficulty 86 extreme terrain (precipitous, unstable…)
This document is a research report submitted to the U.S. Department of Justice. This report has not been published by the Department. Opinions or points of view expressed are those of the author(s)
and do not necessarily reflect the official position or policies of the U.S. Department of Justice.

NIJ Metric Development Final Report
08/27/12 89
Difficulty 87 type of call or reported crime that led to officer's response
Difficulty 88 ability to isolate the target, low probability of hitting unintended persons or objects
Difficulty 89 persons or conditions that distract from perceiving actual threat
Difficulty 90 officers respond based on actions of others rather than their own direct perceptions
Difficulty 91 time on shift, number of hours on duty prior to encounter
Difficulty 92 number of previous use-of-deadly force incidents of the involved officer
Difficulty 93 suspect's friends or relatives at the scene interfere with officer’s actions to use deadly force.
Difficulty 94 officer has no escape routes
Difficulty 95 effect of time of day, time on shift recent, shift changes on officer’s tactical awareness
Difficulty 96 presence or absences of identifiers on suspect (e.g. badge, gang tattoos, etc.)
Difficulty 97 whether officer is on or off duty
Difficulty 98 officer(s) are in uniform or plain clothes
Difficulty 99 suspect’s hand movements (compliant, non-compliant).
Difficulty 100 does responding officer have jurisdiction under color of authority
Difficulty 101 number and type of prior offenses of the suspect
Difficulty 102 officer does not know number and type of prior offenses by the suspect
Difficulty 103 seriousness of the underlying crime leading to encounter
Difficulty 104 injuries sustained by officer during previous deadly force encounters
Difficulty 105 no back up available
Difficulty 106 potential lethality of the weapon displayed
Difficulty 107 conflicting commands from multiple officers at the scene
Difficulty 108 suspect feigns compliance
This document is a research report submitted to the U.S. Department of Justice. This report has not been published by the Department. Opinions or points of view expressed are those of the author(s)
and do not necessarily reflect the official position or policies of the U.S. Department of Justice.
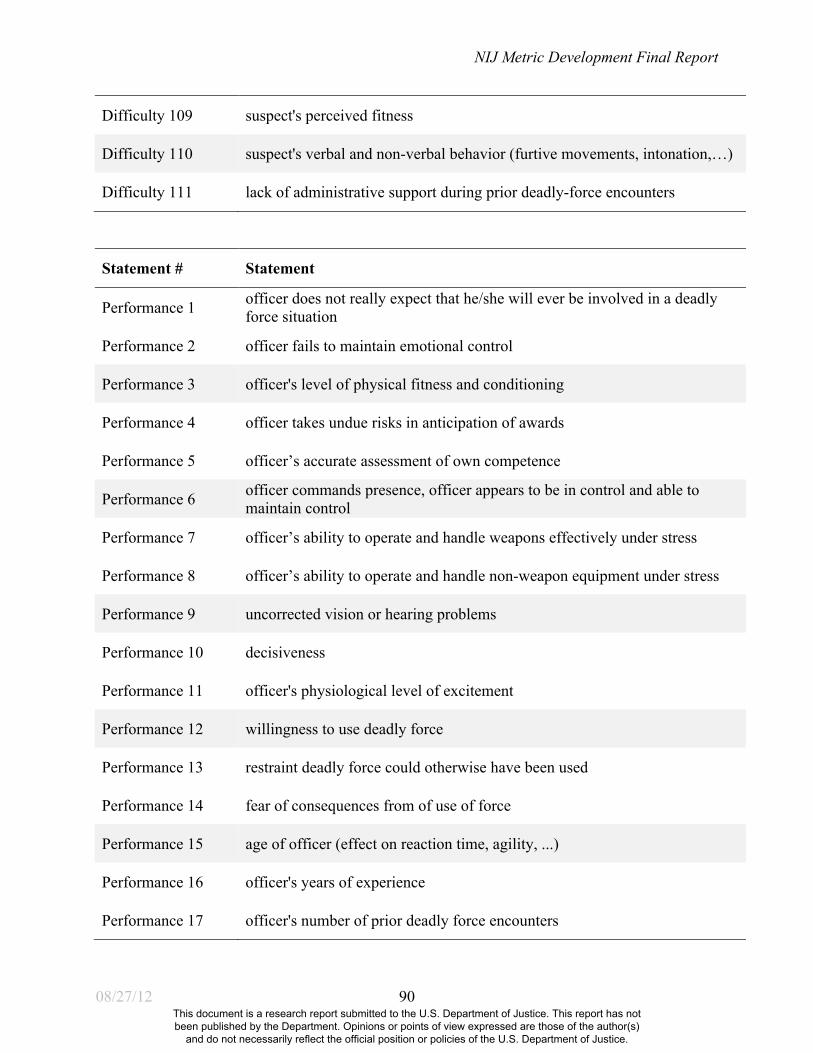
NIJ Metric Development Final Report
08/27/12 90
Difficulty 109 suspect's perceived fitness
Difficulty 110 suspect's verbal and non-verbal behavior (furtive movements, intonation,…)
Difficulty 111 lack of administrative support during prior deadly-force encounters
Statement # Statement
Performance 1 officer does not really expect that he/she will ever be involved in a deadly force situation
Performance 2 officer fails to maintain emotional control
Performance 3 officer's level of physical fitness and conditioning
Performance 4 officer takes undue risks in anticipation of awards
Performance 5 officer’s accurate assessment of own competence
Performance 6 officer commands presence, officer appears to be in control and able to maintain control
Performance 7 officer’s ability to operate and handle weapons effectively under stress
Performance 8 officer’s ability to operate and handle non-weapon equipment under stress
Performance 9 uncorrected vision or hearing problems
Performance 10 decisiveness
Performance 11 officer's physiological level of excitement
Performance 12 willingness to use deadly force
Performance 13 restraint deadly force could otherwise have been used
Performance 14 fear of consequences from of use of force
Performance 15 age of officer (effect on reaction time, agility, ...)
Performance 16 officer's years of experience
Performance 17 officer's number of prior deadly force encounters
This document is a research report submitted to the U.S. Department of Justice. This report has not been published by the Department. Opinions or points of view expressed are those of the author(s)
and do not necessarily reflect the official position or policies of the U.S. Department of Justice.

NIJ Metric Development Final Report
08/27/12 91
Statement # Statement
Performance 18 medications in officer's system (stimulants, anti-anxiety, anti-depressants, cold medications, caffeine,…)
Performance 19 officer's ability to assess threats
Performance 20 officer's physical fatigue level
Performance 21 officer's ability to prioritize threats
Performance 22 officer following through encounter to a controlled resolution
Performance 23 officer stopping, quitting, or relaxing too soon
Performance 24 officer's accuracy during a deadly force encounter
Performance 25 proficiency with non-lethal force
Performance 26 officer's moral and/or faith-based values regarding taking of life
Performance 27 assess to appropriate equipment for the situation
Performance 28 appropriate use of attention skills to control performance anxiety (cognitive discipline)
Performance 29 understanding deadly force rule of engagement, laws, rules, policies
Performance 30 communication skills to diffuse or de-escalate potentially violent situations
Performance 31 officer's daily or general style of approaching routine activities of the day (laid back, assertive, demeanor, service orientation, friendliness, attention to detail, tactical fidelity)
Performance 32 appearing ready for combat
Performance 33 previous military/combat experience
Performance 34 number and type of confrontational contacts handled in the past
Performance 35 gun handling skills (draws, presentation of weapon, reload, clear malfunction, holstering)
Performance 36 giving relevant and meaningful commands
Performance 37 time since last deadly force training (regency)
Performance 38 ability to identify suspect’s mental and physical status (mentally ill, deaf, diabetic, …)
This document is a research report submitted to the U.S. Department of Justice. This report has not been published by the Department. Opinions or points of view expressed are those of the author(s)
and do not necessarily reflect the official position or policies of the U.S. Department of Justice.

NIJ Metric Development Final Report
08/27/12 92
Statement # Statement
Performance 39 speed at which accurate, follow-on shots are delivered
Performance 40 distracted attention from trauma
Performance 41 ability to identify and understand process and act on pre-assault indicators
Performance 42 the biases he or she bring to a confrontation (race, gender, age, SES, appearance, ex-prison, religion, …)
Performance 43 communicating key information to fellow officers at the scene of the incident
Performance 44 non-traumatic stress that an officer brings to a confrontation (bureaucratic, domestic, financial…)
Performance 45 officer's level of anxiety, anger, or other emotional state
Performance 46 officer's pre-planning/pre-assessment (pursuit, escape, identifying potential cover/concealment, discussion of these with partner…)
Performance 47 officer's ability to escalate and de-escalate in response to the situation (during shooting, during fight, during confrontation, after submission)
Performance 48 ability to recognize weapons, person carrying weapons, and other indicators
Performance 49 types of duty assignments held in the past
Performance 50 use of cover and concealment
Performance 51 previous training
Performance 52 officer's emotional maturity
Performance 53 affect of an officer's gender or other physical attributes (size, …)
Performance 54 acting too quickly (prior to back up arriving or fully assessing the situation)
Performance 55 being aggressive or assertive (can be too much or too little...)
Performance 56 officer's patience (identifying best moment to act)
Performance 57 ability to recognize the need to transition to other force options
Performance 58 officer movement (tactical, dynamic, changing position, choosing while moving)
Performance 59 officer's fatigue (sleep during last 24 hours)
This document is a research report submitted to the U.S. Department of Justice. This report has not been published by the Department. Opinions or points of view expressed are those of the author(s)
and do not necessarily reflect the official position or policies of the U.S. Department of Justice.
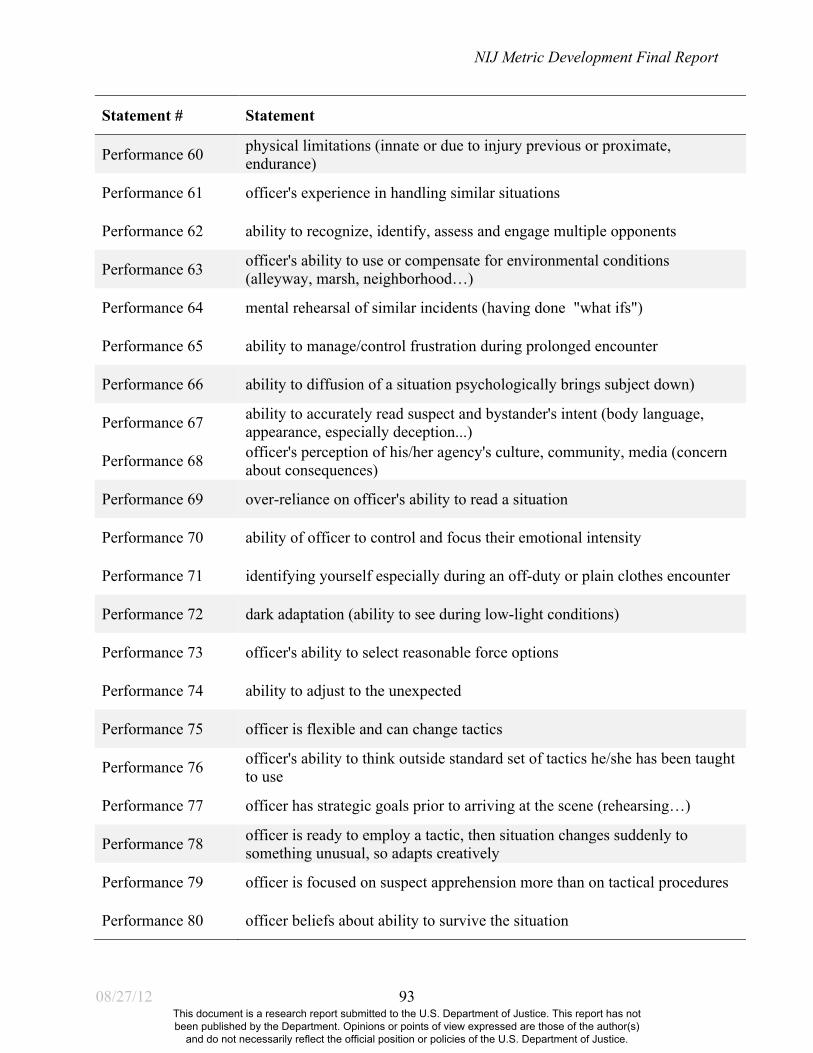
NIJ Metric Development Final Report
08/27/12 93
Statement # Statement
Performance 60 physical limitations (innate or due to injury previous or proximate, endurance)
Performance 61 officer's experience in handling similar situations
Performance 62 ability to recognize, identify, assess and engage multiple opponents
Performance 63 officer's ability to use or compensate for environmental conditions (alleyway, marsh, neighborhood…)
Performance 64 mental rehearsal of similar incidents (having done "what ifs")
Performance 65 ability to manage/control frustration during prolonged encounter
Performance 66 ability to diffusion of a situation psychologically brings subject down)
Performance 67 ability to accurately read suspect and bystander's intent (body language, appearance, especially deception...)
Performance 68 officer's perception of his/her agency's culture, community, media (concern about consequences)
Performance 69 over-reliance on officer's ability to read a situation
Performance 70 ability of officer to control and focus their emotional intensity
Performance 71 identifying yourself especially during an off-duty or plain clothes encounter
Performance 72 dark adaptation (ability to see during low-light conditions)
Performance 73 officer's ability to select reasonable force options
Performance 74 ability to adjust to the unexpected
Performance 75 officer is flexible and can change tactics
Performance 76 officer's ability to think outside standard set of tactics he/she has been taught to use
Performance 77 officer has strategic goals prior to arriving at the scene (rehearsing…)
Performance 78 officer is ready to employ a tactic, then situation changes suddenly to something unusual, so adapts creatively
Performance 79 officer is focused on suspect apprehension more than on tactical procedures
Performance 80 officer beliefs about ability to survive the situation
This document is a research report submitted to the U.S. Department of Justice. This report has not been published by the Department. Opinions or points of view expressed are those of the author(s)
and do not necessarily reflect the official position or policies of the U.S. Department of Justice.

NIJ Metric Development Final Report
08/27/12 94
Statement # Statement
Performance 81 officer tenacity or determination
Performance 82 officer's prioritization of primary goals (bystanders’/innocents' lives, officer’s life, suspect’s life, evidence, and other property)
Performance 83 knowledge about relevant (law, tactics, policy, courts, elements of force)
Performance 84 knowledge about relevant post shooting events such as coroner inquest, support, post shooting,
Performance 85 knowledge about relevant case studies of OIS
Performance 86 knowledge about potential stress-related effects,
Performance 87 knowledge about limitations of equipment (terminal ballistics, soft body armor…)
Performance 88 realism of training
Performance 89 relevance of training
Performance 90 physical skills training (marksmanship, tactics, weapons handling, etc.)
Performance 91 training that simulates deadly force encounters
Performance 92 hours of training (in each area)
Performance 93 quality of training
Performance 94 scanning, ability to shift focus from broad to narrow, processing, interpretation, acting
Performance 95 knowledge of where officer is relative to threats
Performance 96 maximize distance from identified threat
Performance 97 pre-information about what to look for in that type of situation (mental schematics or models)
Performance 98 ability to differentiate what is relevant from what is irrelevant
Performance 99 optimizing distance from identified threat
Performance 100 awareness of where officer is relative to friendliest and innocents
Performance 101 awareness of what is going on in the periphery of your vision, hearing, …
This document is a research report submitted to the U.S. Department of Justice. This report has not been published by the Department. Opinions or points of view expressed are those of the author(s)
and do not necessarily reflect the official position or policies of the U.S. Department of Justice.

NIJ Metric Development Final Report
08/27/12 95
Statement # Statement
Performance 102 awareness of the space around the officer and position of objects around the officer
Performance 103 leadership awareness of the officer in charge of the situation
Performance 104 avoiding perception narrowing
Performance 105 ability of officer to use tools automatically and without conscious attention
This document is a research report submitted to the U.S. Department of Justice. This report has not been published by the Department. Opinions or points of view expressed are those of the author(s)
and do not necessarily reflect the official position or policies of the U.S. Department of Justice.

NIJ Metric Development Final Report
08/27/12 96
Appendix E: List of Operationalized Difficulty and Performance Statements
Set Page Order Difficulty Statements
1 1 1 ...an officer is down at the scene.
1 1 2 …there are between eight and twelve bystanders under direct threat at the scene.
1 1 3 …there are three hostages under direct threat at the scene.
1 1 4 …the distance between the officer and any other officers is 6-10 feet.
1 1 5 …the suspect was not moving immediately prior to the assault.
1 1 6 …the officer has been on duty for 7-8hrs prior to the encounter.
1 1 7 ...the incident occurs inside a business or government building.
1 1 8 …the distance between the officer and the suspect is greater than 51 feet.
1 1 9 ...the time from the threat becoming apparent to the threat being employed by the suspect is :16-:30 seconds.
1 1 10 …the sex of the suspect is female.
1 1 11 …the officer is unfamiliar with other officers on the scene.
1 1 12 …the suspect feigns compliance.
1 1 13 ...the incident occurs outside in a fenced yard.
1 1 14 …there are eleven or more hostages under direct threat at the scene.
1 1 15 …the age of the suspect is between 18-24.
1 1 16 …there are fifty-one or more bystanders under direct threat at the scene.
1 1 17 …the distance between the officer and the suspect is 11-20 feet.
1 1 18 …the proportion of the suspect vulnerable to the officer is greater than 40%.
1 1 19 …the type of call or reported crime that led to the officer's response was a suspicious person or circumstances.
1 1 20 …eleven or more officers are present at the scene.
This document is a research report submitted to the U.S. Department of Justice. This report has not been published by the Department. Opinions or points of view expressed are those of the author(s)
and do not necessarily reflect the official position or policies of the U.S. Department of Justice.
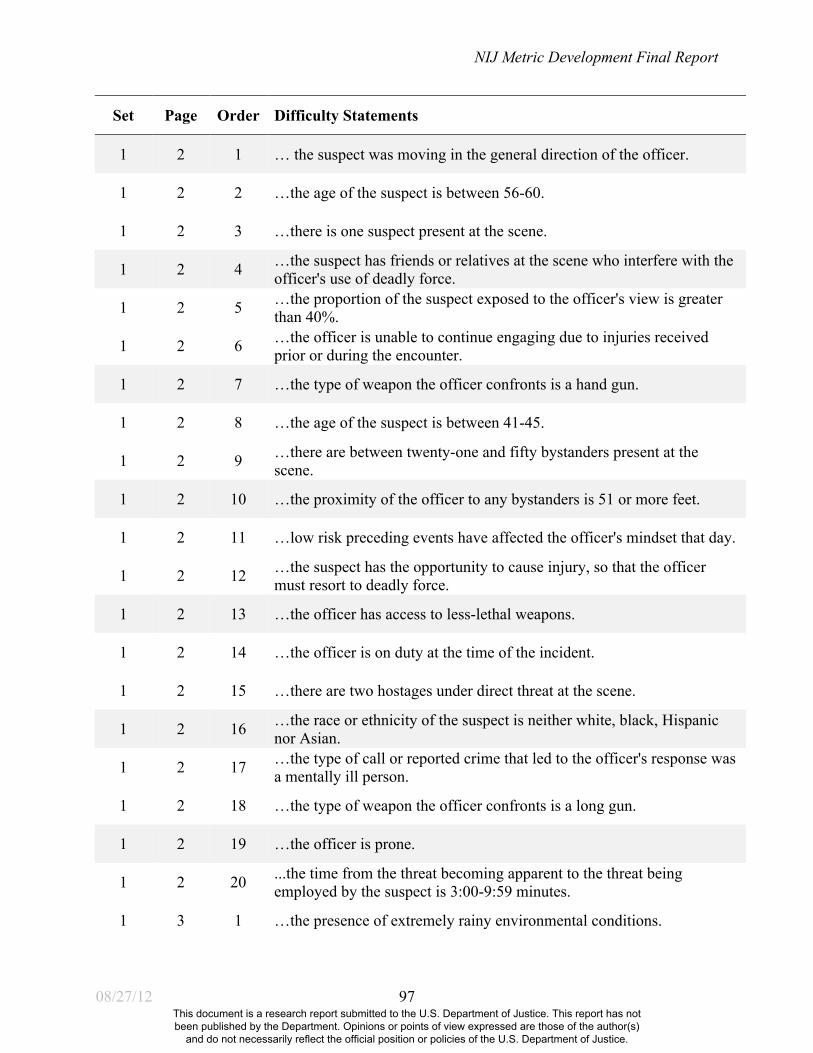
NIJ Metric Development Final Report
08/27/12 97
Set Page Order Difficulty Statements
1 2 1 … the suspect was moving in the general direction of the officer.
1 2 2 …the age of the suspect is between 56-60.
1 2 3 …there is one suspect present at the scene.
1 2 4 …the suspect has friends or relatives at the scene who interfere with the officer's use of deadly force.
1 2 5 …the proportion of the suspect exposed to the officer's view is greater than 40%.
1 2 6 …the officer is unable to continue engaging due to injuries received prior or during the encounter.
1 2 7 …the type of weapon the officer confronts is a hand gun.
1 2 8 …the age of the suspect is between 41-45.
1 2 9 …there are between twenty-one and fifty bystanders present at the scene.
1 2 10 …the proximity of the officer to any bystanders is 51 or more feet.
1 2 11 …low risk preceding events have affected the officer's mindset that day.
1 2 12 …the suspect has the opportunity to cause injury, so that the officer must resort to deadly force.
1 2 13 …the officer has access to less-lethal weapons.
1 2 14 …the officer is on duty at the time of the incident.
1 2 15 …there are two hostages under direct threat at the scene.
1 2 16 …the race or ethnicity of the suspect is neither white, black, Hispanic nor Asian.
1 2 17 …the type of call or reported crime that led to the officer's response was a mentally ill person.
1 2 18 …the type of weapon the officer confronts is a long gun.
1 2 19 …the officer is prone.
1 2 20 ...the time from the threat becoming apparent to the threat being employed by the suspect is 3:00-9:59 minutes.
1 3 1 …the presence of extremely rainy environmental conditions.
This document is a research report submitted to the U.S. Department of Justice. This report has not been published by the Department. Opinions or points of view expressed are those of the author(s)
and do not necessarily reflect the official position or policies of the U.S. Department of Justice.

NIJ Metric Development Final Report
08/27/12 98
Set Page Order Difficulty Statements
1 3 2 ...the time from the threat becoming apparent to the threat being employed by the suspect is 1:00-2:59 minutes.
1 3 3 …the type of call or reported crime that led to the officer's response was a drug-related matter.
1 3 4 …the officer doesn't have access to less-lethal weapons.
1 3 5 …the time from the beginning of the encounter to the application of deadly force is 3:00-:5.59 minutes.
1 3 6 …the officer cannot communicate with dispatch.
1 3 7 …the light at the incident's location is shining in the direction of the officer's back.
1 3 8 …the proportion of the suspect exposed to the officer's view is 21-30%.
1 3 9 …the officer is somewhat familiar with other officers on the scene.
1 3 10 …the time from the beginning of the encounter to the application of deadly force is :00-:05 seconds.
1 3 11 …the time from the beginning of the encounter to the application of deadly force is :16-:30 seconds.
1 3 12 …the time from the beginning of the encounter to the application of deadly force is 6:00-14:59 minutes.
1 3 13 …the distance between the officer and the suspect is 6-10 feet.
1 3 14 ...the time from the threat becoming apparent to the threat being employed by the suspect is :00-:02 seconds.
1 3 15 ...the incident occurs in a low crime rate area.
1 3 16 …the age of the suspect is between 51-55.
1 3 17 …the suspect's position is lower than the officer's.
1 3 18 …the type of call or reported crime that led to the officer's response was a domestic disturbance.
1 3 19 …the ability of the officer to hear is high.
1 3 20 …potential threats can come from only one direction.
1 4 1 …the suspect has visible gang identifiers.
1 4 2 …there are nine hostages under direct threat at the scene.
This document is a research report submitted to the U.S. Department of Justice. This report has not been published by the Department. Opinions or points of view expressed are those of the author(s)
and do not necessarily reflect the official position or policies of the U.S. Department of Justice.

NIJ Metric Development Final Report
08/27/12 99
Set Page Order Difficulty Statements
1 4 3 …the ability of the officer to hear is medium.
1 4 4 …potential threats can come from multiple directions.
1 4 5 ...the time from the threat becoming apparent to the threat being employed by the suspect is :06-:10 seconds.
1 4 6 …the distance between the officer and any other officers is 11-20 feet.
1 4 7 …organizational culture/mindset influence the officer's ability to make an otherwise optimal decision.
1 4 8 …the type of preceding events that day that have affected the officer's mindset have been generally peaceful.
1 4 9 …the time from the beginning of the encounter to the application of deadly force is :31-:59 seconds.
1 4 10 …the officer is kneeling.
1 4 11 …the race or ethnicity of the suspect is black.
1 4 12 ...the time from the threat becoming apparent to the threat being employed by the suspect is :11-:15 seconds.
1 4 13 …the size of the suspect is large.
1 4 14 …the potential lethality of the weapon displayed is high.
1 4 15 ...the incident occurs inside a private dwelling.
1 4 16 …none of the bystanders appear to be hostile to police.
1 4 17 …the suspect was moving erratically immediately prior to the assault.
1 4 18 …the average level of experience of officers at the scene is rookie.
2 1 1 …the type of weapon the officer confronts is a biohazard weapon.
2 1 2 …the time from the beginning of the encounter to the application of deadly force is :06-:15 seconds.
2 1 3 …the suspect has no visible gang identifiers.
2 1 4 …the size of the suspect is small.
2 1 5 …the officer has information regarding a suspect's suicidal intent.
This document is a research report submitted to the U.S. Department of Justice. This report has not been published by the Department. Opinions or points of view expressed are those of the author(s)
and do not necessarily reflect the official position or policies of the U.S. Department of Justice.
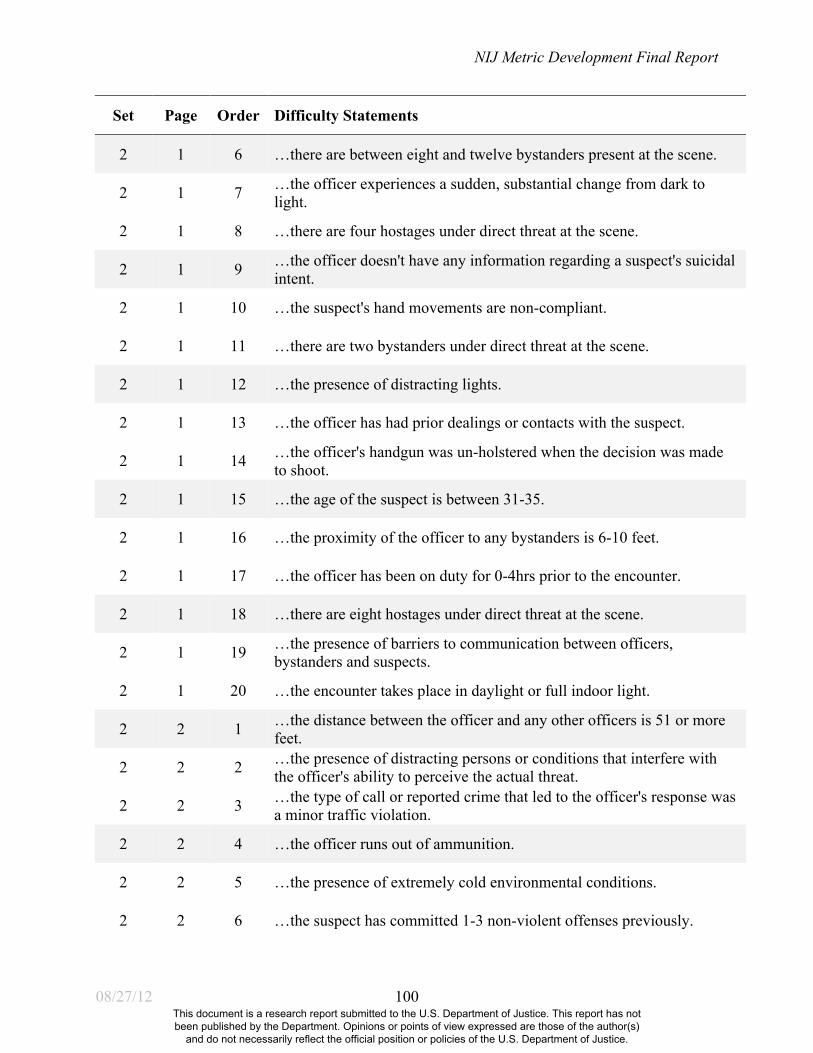
NIJ Metric Development Final Report
08/27/12 100
Set Page Order Difficulty Statements
2 1 6 …there are between eight and twelve bystanders present at the scene.
2 1 7 …the officer experiences a sudden, substantial change from dark to light.
2 1 8 …there are four hostages under direct threat at the scene.
2 1 9 …the officer doesn't have any information regarding a suspect's suicidal intent.
2 1 10 …the suspect's hand movements are non-compliant.
2 1 11 …there are two bystanders under direct threat at the scene.
2 1 12 …the presence of distracting lights.
2 1 13 …the officer has had prior dealings or contacts with the suspect.
2 1 14 …the officer's handgun was un-holstered when the decision was made to shoot.
2 1 15 …the age of the suspect is between 31-35.
2 1 16 …the proximity of the officer to any bystanders is 6-10 feet.
2 1 17 …the officer has been on duty for 0-4hrs prior to the encounter.
2 1 18 …there are eight hostages under direct threat at the scene.
2 1 19 …the presence of barriers to communication between officers, bystanders and suspects.
2 1 20 …the encounter takes place in daylight or full indoor light.
2 2 1 …the distance between the officer and any other officers is 51 or more feet.
2 2 2 …the presence of distracting persons or conditions that interfere with the officer's ability to perceive the actual threat.
2 2 3 …the type of call or reported crime that led to the officer's response was a minor traffic violation.
2 2 4 …the officer runs out of ammunition.
2 2 5 …the presence of extremely cold environmental conditions.
2 2 6 …the suspect has committed 1-3 non-violent offenses previously.
This document is a research report submitted to the U.S. Department of Justice. This report has not been published by the Department. Opinions or points of view expressed are those of the author(s)
and do not necessarily reflect the official position or policies of the U.S. Department of Justice.
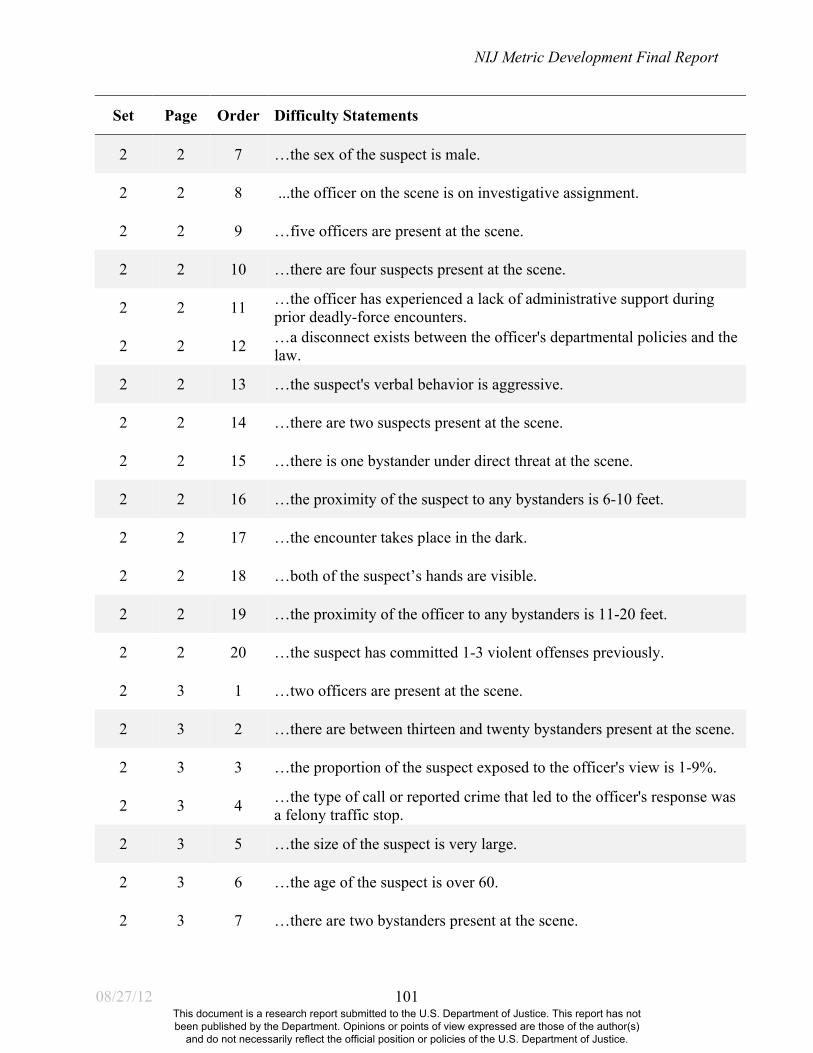
NIJ Metric Development Final Report
08/27/12 101
Set Page Order Difficulty Statements
2 2 7 …the sex of the suspect is male.
2 2 8 ...the officer on the scene is on investigative assignment.
2 2 9 …five officers are present at the scene.
2 2 10 …there are four suspects present at the scene.
2 2 11 …the officer has experienced a lack of administrative support during prior deadly-force encounters.
2 2 12 …a disconnect exists between the officer's departmental policies and the law.
2 2 13 …the suspect's verbal behavior is aggressive.
2 2 14 …there are two suspects present at the scene.
2 2 15 …there is one bystander under direct threat at the scene.
2 2 16 …the proximity of the suspect to any bystanders is 6-10 feet.
2 2 17 …the encounter takes place in the dark.
2 2 18 …both of the suspect’s hands are visible.
2 2 19 …the proximity of the officer to any bystanders is 11-20 feet.
2 2 20 …the suspect has committed 1-3 violent offenses previously.
2 3 1 …two officers are present at the scene.
2 3 2 …there are between thirteen and twenty bystanders present at the scene.
2 3 3 …the proportion of the suspect exposed to the officer's view is 1-9%.
2 3 4 …the type of call or reported crime that led to the officer's response was a felony traffic stop.
2 3 5 …the size of the suspect is very large.
2 3 6 …the age of the suspect is over 60.
2 3 7 …there are two bystanders present at the scene.
This document is a research report submitted to the U.S. Department of Justice. This report has not been published by the Department. Opinions or points of view expressed are those of the author(s)
and do not necessarily reflect the official position or policies of the U.S. Department of Justice.

NIJ Metric Development Final Report
08/27/12 102
Set Page Order Difficulty Statements
2 3 8 …the ability of the officer to be heard is low.
2 3 9 ...the time from the threat becoming apparent to the threat being employed by the suspect is greater than 10 minutes.
2 3 10 ...the time from the threat becoming apparent to the threat being employed by the suspect is :03-:05 seconds.
2 3 11 …the suspect has the perceived intent to cause injury, so that the officer must resort to deadly force.
2 3 12 …the distance between the officer and any other officers is 5 feet or less.
2 3 13 …there are fifty-one or more bystanders present at the scene.
2 3 14 …necessary and usual safety equipment is not immediately available to the officer.
2 3 15 ...the incident occurs outside in an alley.
2 3 16 …neither of the suspect’s hands are visible.
2 3 17 …there are three bystanders under direct threat at the scene.
2 3 18 …the presence of dazzling lights that interfere with the officer's vision.
2 3 19 …the officer doesn't have any information regarding a suspect's homicidal intent.
2 3 20 …the suspect has committed 4-6 violent offenses previously.
2 4 1 …the officer is unable to isolate the target.
2 4 2 …the race or ethnicity of the suspect is Asian.
2 4 3 …three officers are present at the scene.
2 4 4 …the officer's movement is restricted by the environment.
2 4 5 …the proportion of the suspect vulnerable to the officer is 31-40%.
2 4 6 …the officer is surprised by an assault.
2 4 7 …the officer's handgun was holstered when the decision was made to shoot.
2 4 8 …the suspect has committed no non-violent offenses previously.
This document is a research report submitted to the U.S. Department of Justice. This report has not been published by the Department. Opinions or points of view expressed are those of the author(s)
and do not necessarily reflect the official position or policies of the U.S. Department of Justice.

NIJ Metric Development Final Report
08/27/12 103
Set Page Order Difficulty Statements
2 4 9 …the way the suspect is dressed.
2 4 10 …there are ten suspects present at the scene.
2 4 11 …the suspect's known or perceived level of skill or training is unskilled.
2 4 12 …the officer responds to a threat based on the actions of others rather than on his/her own direct perceptions.
2 4 13 …there are between twenty-one and fifty bystanders under direct threat at the scene.
2 4 14 …the suspect has no escape potential
2 4 15 …ten officers are present at the scene.
2 4 16 …the proportion of the suspect exposed to the officer's view is 31-40%.
2 4 17 …the encounter takes place in the dim light.
2 4 18 … the suspect was moving away from the officer.
3 1 1 …the officer's movement is restricted by cover or concealment.
3 1 2 …there are five suspects present at the scene.
3 1 3 …there are eleven or more suspects present at the scene.
3 1 4 …the level of ambient noise is high.
3 1 5 …the proximity of the officer to any bystanders is 5 feet or less.
3 1 6 …there are five hostages under direct threat at the scene.
3 1 7 …the proportion of the suspect exposed to the officer's view is 10-20%.
3 1 8 …the distance between the officer and any other officers is 21-50 feet.
3 1 9 …the presence of extremely foggy environmental conditions.
3 1 10 …the proportion of the suspect vulnerable to the officer is 10-20%.
3 1 11 ..the underlying crime that led to the encounter was a non-violent felony.
This document is a research report submitted to the U.S. Department of Justice. This report has not been published by the Department. Opinions or points of view expressed are those of the author(s)
and do not necessarily reflect the official position or policies of the U.S. Department of Justice.
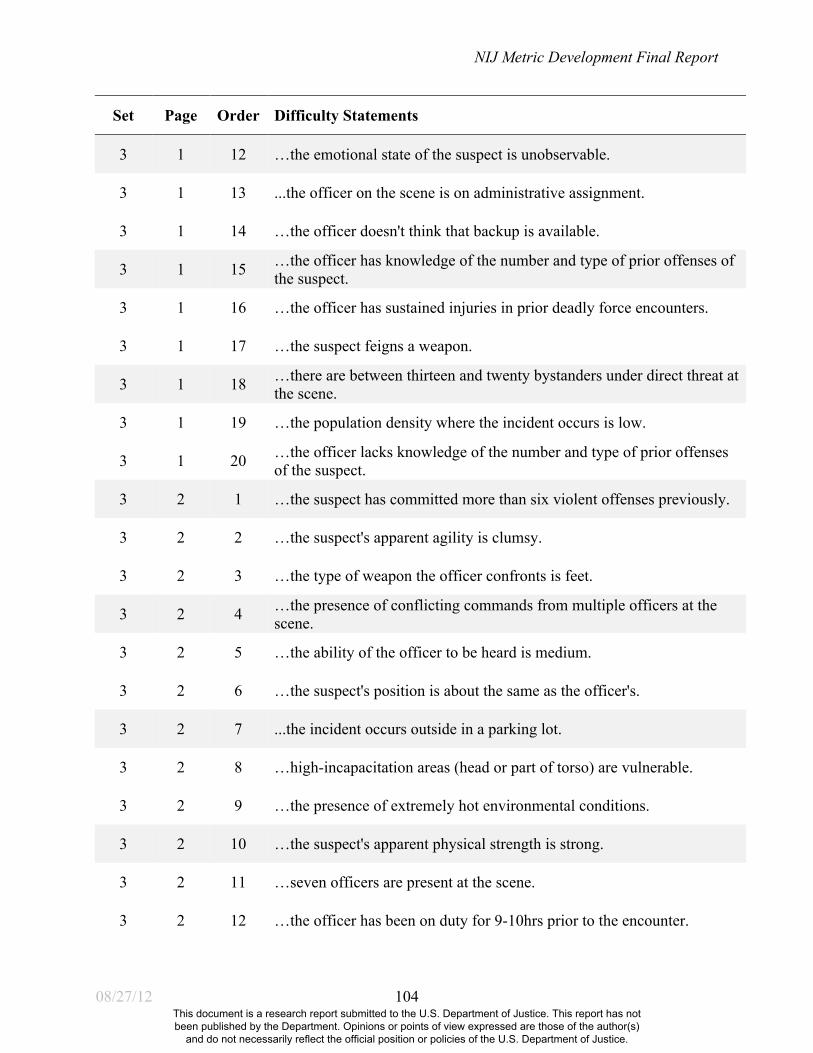
NIJ Metric Development Final Report
08/27/12 104
Set Page Order Difficulty Statements
3 1 12 …the emotional state of the suspect is unobservable.
3 1 13 ...the officer on the scene is on administrative assignment.
3 1 14 …the officer doesn't think that backup is available.
3 1 15 …the officer has knowledge of the number and type of prior offenses of the suspect.
3 1 16 …the officer has sustained injuries in prior deadly force encounters.
3 1 17 …the suspect feigns a weapon.
3 1 18 …there are between thirteen and twenty bystanders under direct threat at the scene.
3 1 19 …the population density where the incident occurs is low.
3 1 20 …the officer lacks knowledge of the number and type of prior offenses of the suspect.
3 2 1 …the suspect has committed more than six violent offenses previously.
3 2 2 …the suspect's apparent agility is clumsy.
3 2 3 …the type of weapon the officer confronts is feet.
3 2 4 …the presence of conflicting commands from multiple officers at the scene.
3 2 5 …the ability of the officer to be heard is medium.
3 2 6 …the suspect's position is about the same as the officer's.
3 2 7 ...the incident occurs outside in a parking lot.
3 2 8 …high-incapacitation areas (head or part of torso) are vulnerable.
3 2 9 …the presence of extremely hot environmental conditions.
3 2 10 …the suspect's apparent physical strength is strong.
3 2 11 …seven officers are present at the scene.
3 2 12 …the officer has been on duty for 9-10hrs prior to the encounter.
This document is a research report submitted to the U.S. Department of Justice. This report has not been published by the Department. Opinions or points of view expressed are those of the author(s)
and do not necessarily reflect the official position or policies of the U.S. Department of Justice.

NIJ Metric Development Final Report
08/27/12 105
Set Page Order Difficulty Statements
3 2 13 …high-incapacitation areas (head or part of torso) are not vulnerable.
3 2 14 ...the size of the area in which the officer can maneuver.
3 2 15 …auditory distractions are present.
3 2 16 …the officer thinks that backup is available.
3 2 17 …there are seven suspects present at the scene.
3 2 18 …the ability of the officer to be heard is high.
3 2 19 …the age of the suspect is between 46-50.
3 2 20 …the race or ethnicity of the suspect is unknown.
3 3 1 …the officer is familiar with other officers on the scene.
3 3 2 …the light at the incident's location is shining in the direction of the officer's face.
3 3 3 ...the incident occurs outside in a street or roadway.
3 3 4 …there are three suspects present at the scene.
3 3 5 …no officers of different ranks are present at the scene.
3 3 6 …the officer's equipment fails or malfunctions.
3 3 7 …there are seven hostages under direct threat at the scene.
3 3 8 …the officer has been on duty for more than 12hrs prior to the encounter.
3 3 9 …the suspect's position is higher than the officer's.
3 3 10 …the presence of precipitous terrain.
3 3 11 …the suspect's apparent agility is agile.
3 3 12 …the level of ambient noise is low.
3 3 13 …there is one hostage under direct threat at the scene.
This document is a research report submitted to the U.S. Department of Justice. This report has not been published by the Department. Opinions or points of view expressed are those of the author(s)
and do not necessarily reflect the official position or policies of the U.S. Department of Justice.

NIJ Metric Development Final Report
08/27/12 106
Set Page Order Difficulty Statements
3 3 14 …the proportion of the suspect vulnerable to the officer is 1-9%.
3 3 15 …the officer has been on duty for 5-6hrs prior to the encounter.
3 3 16 ..the underlying crime that led to the encounter was a non-violent misdemeanor.
3 3 17 …the officer doesn't have legal jurisdiction.
3 3 18 …the type of call or reported crime that led to the officer's response was a robbery in progress.
3 3 19 …the emotional state of the suspect is observable.
3 3 20 …the officer experiences a sudden, substantial change from light to dark.
3 4 1 …the distance between the officer and the suspect is 0-5 feet.
3 4 2 …the suspect has committed more than six non-violent offenses previously.
3 4 3 …the type of call or reported crime that led to the officer's response was a disturbance other than domestic.
3 4 4 …the level of ambient noise is medium.
3 4 5 …the suspect is defiantly non-compliant.
3 4 6 …the proximity of the suspect to any bystanders is 21-50 feet.
3 4 7 …the population density where the incident occurs is high.
3 4 8 …the officer has information regarding a suspect's homicidal intent.
3 4 9 …nine officers are present at the scene.
3 4 10 …the proximity of the suspect to any bystanders is 5 feet or less.
3 4 11 … the race or ethnicity of the suspect is white.
3 4 12 …the race or ethnicity of the suspect is Hispanic.
3 4 13 …the suspect's known or perceived level of skill or training is skilled.
3 4 14 …the time from the beginning of the encounter to the application of deadly force is 1:00-2:59 minutes.
This document is a research report submitted to the U.S. Department of Justice. This report has not been published by the Department. Opinions or points of view expressed are those of the author(s)
and do not necessarily reflect the official position or policies of the U.S. Department of Justice.
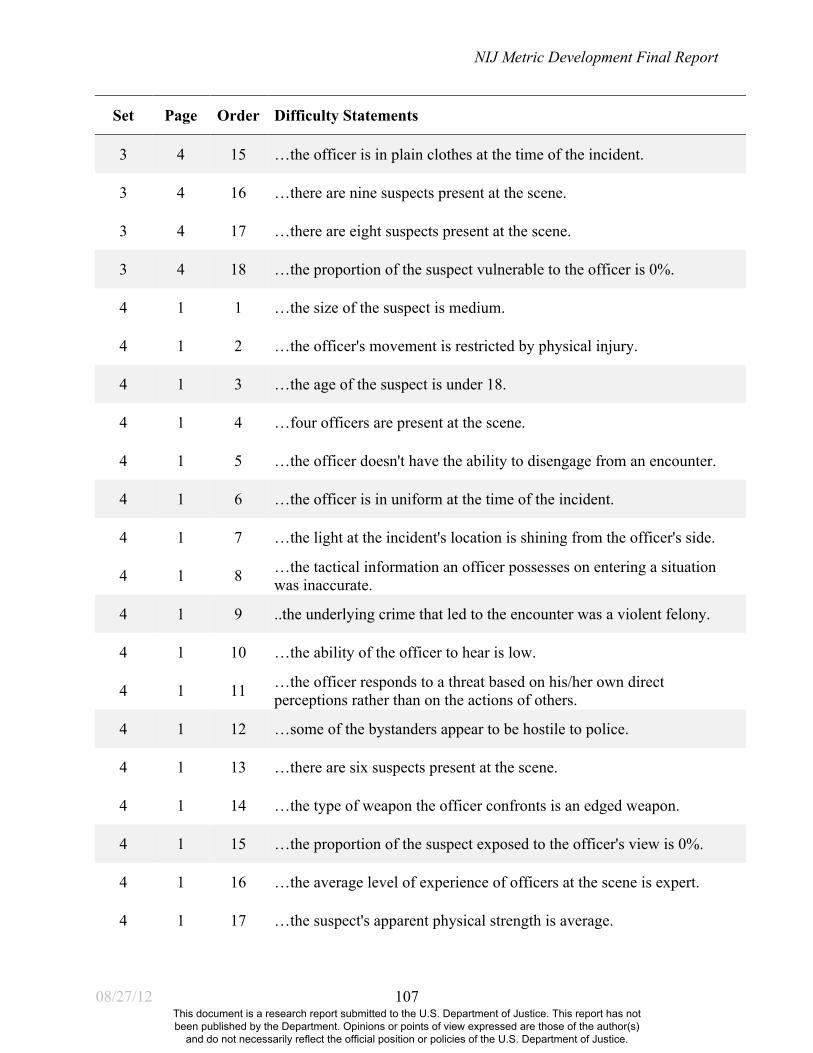
NIJ Metric Development Final Report
08/27/12 107
Set Page Order Difficulty Statements
3 4 15 …the officer is in plain clothes at the time of the incident.
3 4 16 …there are nine suspects present at the scene.
3 4 17 …there are eight suspects present at the scene.
3 4 18 …the proportion of the suspect vulnerable to the officer is 0%.
4 1 1 …the size of the suspect is medium.
4 1 2 …the officer's movement is restricted by physical injury.
4 1 3 …the age of the suspect is under 18.
4 1 4 …four officers are present at the scene.
4 1 5 …the officer doesn't have the ability to disengage from an encounter.
4 1 6 …the officer is in uniform at the time of the incident.
4 1 7 …the light at the incident's location is shining from the officer's side.
4 1 8 …the tactical information an officer possesses on entering a situation was inaccurate.
4 1 9 ..the underlying crime that led to the encounter was a violent felony.
4 1 10 …the ability of the officer to hear is low.
4 1 11 …the officer responds to a threat based on his/her own direct perceptions rather than on the actions of others.
4 1 12 …some of the bystanders appear to be hostile to police.
4 1 13 …there are six suspects present at the scene.
4 1 14 …the type of weapon the officer confronts is an edged weapon.
4 1 15 …the proportion of the suspect exposed to the officer's view is 0%.
4 1 16 …the average level of experience of officers at the scene is expert.
4 1 17 …the suspect's apparent physical strength is average.
This document is a research report submitted to the U.S. Department of Justice. This report has not been published by the Department. Opinions or points of view expressed are those of the author(s)
and do not necessarily reflect the official position or policies of the U.S. Department of Justice.
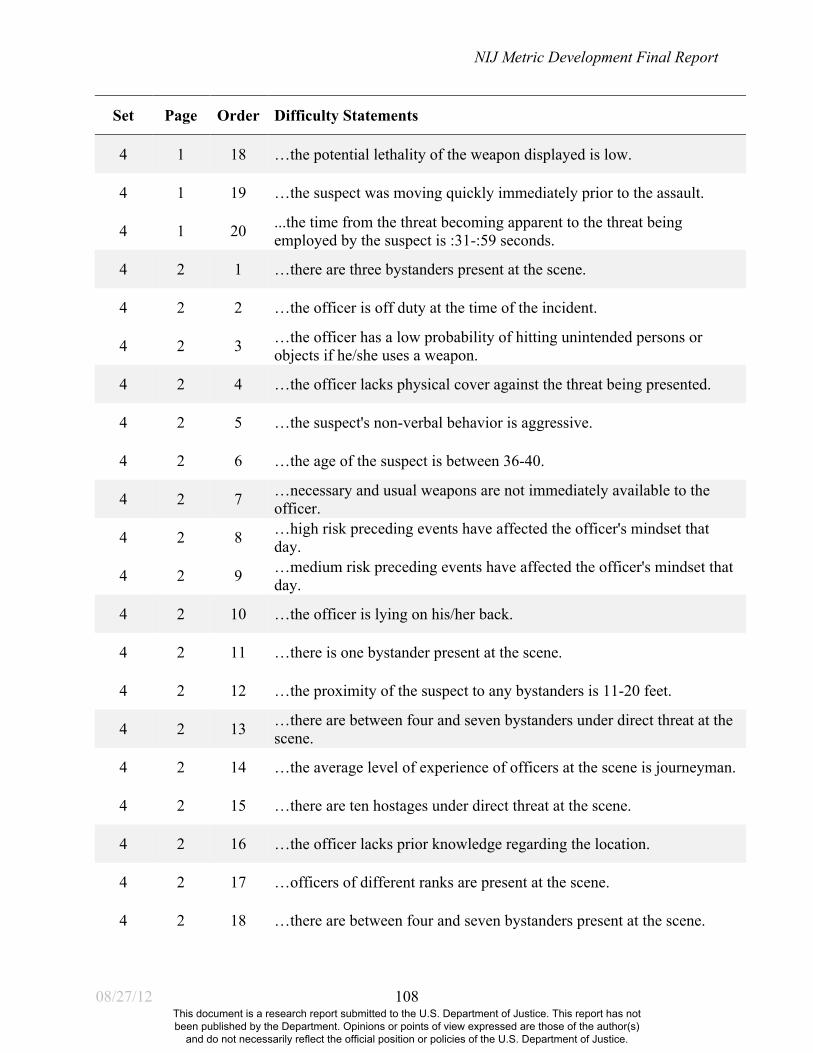
NIJ Metric Development Final Report
08/27/12 108
Set Page Order Difficulty Statements
4 1 18 …the potential lethality of the weapon displayed is low.
4 1 19 …the suspect was moving quickly immediately prior to the assault.
4 1 20 ...the time from the threat becoming apparent to the threat being employed by the suspect is :31-:59 seconds.
4 2 1 …there are three bystanders present at the scene.
4 2 2 …the officer is off duty at the time of the incident.
4 2 3 …the officer has a low probability of hitting unintended persons or objects if he/she uses a weapon.
4 2 4 …the officer lacks physical cover against the threat being presented.
4 2 5 …the suspect's non-verbal behavior is aggressive.
4 2 6 …the age of the suspect is between 36-40.
4 2 7 …necessary and usual weapons are not immediately available to the officer.
4 2 8 …high risk preceding events have affected the officer's mindset that day.
4 2 9 …medium risk preceding events have affected the officer's mindset that day.
4 2 10 …the officer is lying on his/her back.
4 2 11 …there is one bystander present at the scene.
4 2 12 …the proximity of the suspect to any bystanders is 11-20 feet.
4 2 13 …there are between four and seven bystanders under direct threat at the scene.
4 2 14 …the average level of experience of officers at the scene is journeyman.
4 2 15 …there are ten hostages under direct threat at the scene.
4 2 16 …the officer lacks prior knowledge regarding the location.
4 2 17 …officers of different ranks are present at the scene.
4 2 18 …there are between four and seven bystanders present at the scene.
This document is a research report submitted to the U.S. Department of Justice. This report has not been published by the Department. Opinions or points of view expressed are those of the author(s)
and do not necessarily reflect the official position or policies of the U.S. Department of Justice.

NIJ Metric Development Final Report
08/27/12 109
Set Page Order Difficulty Statements
4 2 19 …the suspect has committed 4-6 non-violent offenses previously.
4 2 20 …eight officers are present at the scene.
4 3 1 …the potential lethality of the weapon displayed is moderate.
4 3 2 ..the underlying crime that led to the encounter was a violent misdemeanor.
4 3 3 …the suspect doesn't appear intoxicated through alcohol or drugs, or otherwise impaired.
4 3 4 …the suspect has the means to cause injury, so that the officer must resort to deadly force.
4 3 5 ...the incident occurs in a high crime rate area.
4 3 6 …the type of call or reported crime that led to the officer's response was a SWAT-type situation.
4 3 7 …the type of preceding events that day that have affected the officer's mindset have included some minor confrontations.
4 3 8 …the proximity of the officer to any bystanders is 21-50 feet.
4 3 9 …the officer has had no prior dealings or contacts with the suspect.
4 3 10 …the suspect was moving slowly immediately prior to the assault.
4 3 11 … the suspect was moving directly toward the officer.
4 3 12 …the amount of tactical information an officer possesses on entering a situation was inadequate.
4 3 13 …the proximity of the suspect to any bystanders is 51 or more feet.
4 3 14 …the type of call or reported crime that led to the officer's response was a burglary in progress.
4 3 15 …recent media reports exist concerning alleged excessive use of force.
4 3 16 …the distance between the officer and the suspect is 21-50 feet.
4 3 17 …the type of preceding events that day that have affected the officer's mindset have included a major confrontation.
4 3 18 …there are six hostages under direct threat at the scene.
4 3 19 …the officer lacks escape routes.
This document is a research report submitted to the U.S. Department of Justice. This report has not been published by the Department. Opinions or points of view expressed are those of the author(s)
and do not necessarily reflect the official position or policies of the U.S. Department of Justice.

NIJ Metric Development Final Report
08/27/12 110
Set Page Order Difficulty Statements
4 3 20 …the age of the suspect is between 25-30.
4 4 1 …one officer is present at the scene.
4 4 2 …six officers are present at the scene.
4 4 3 …the presence of unstable ground.
4 4 4 …the suspect appears intoxicated through alcohol or drugs, or otherwise impaired.
4 4 5 …the suspect's apparent agility is average.
4 4 6 …the officer has a high probability of hitting unintended persons or objects if he/she uses a weapon.
4 4 7 …the type of weapon the officer confronts is a blunt force weapon.
4 4 8 …the officer is standing.
4 4 9 …the proportion of the suspect vulnerable to the officer is 21-30%.
4 4 10 …the type of weapon the officer confronts is hands.
4 4 11 ...the officer on the scene is on patrol.
4 4 12 …the suspect has committed no violent offenses previously.
4 4 13 …one of the suspect’s hands is visible.
4 4 14 …the media are present at the scene of a deadly force encounter.
4 4 15 …the officer cannot communicate with fellow officers.
4 4 16 …the time from the beginning of the encounter to the application of deadly force is greater than 15:00 minutes.
4 4 17 …the officer has been on duty for 11-12hrs prior to the encounter.
4 4 18 …the suspect's apparent physical strength is weak.
This document is a research report submitted to the U.S. Department of Justice. This report has not been published by the Department. Opinions or points of view expressed are those of the author(s)
and do not necessarily reflect the official position or policies of the U.S. Department of Justice.

NIJ Metric Development Final Report
08/27/12 111
Set Page Order Performance Statements
1 1 1 …the officer doesn't have religious biases that influence his/her decision making.
1 1 2 …the officer has been in a situation where he or she used, or legally could have used, deadly force between eleven and fifteen times.
1 1 3 …the officer doesn't have status biases (ex: wealth, poverty, power, position) that influence his/her decision making in the encounter.
1 1 4 …the officer selects reasonable force options.
1 1 5 …the officer's perception narrows during a deadly encounter.
1 1 6 …the officer isn't physically limited due to any innate condition.
1 1 7 …the officer was patient and identified an advantageous moment to act.
1 1 8 …the officer escalates, but not de-escalates during a confrontation.
1 1 9 …the officer has received 120 hours of training in marksmanship, tactics and weapons handling during the course of his/her career.
1 1 10 …the officer's emotional control takes away from his/her command presence.
1 1 11 …the officer has over 30 years of experience.
1 1 12 …the officer correctly identifies threats.
1 1 13 …the officer gives relevant and meaningful commands.
1 1 14 …the officer has racial biases that influence his/her decision making in the encounter.
1 1 15 …the officer can shoot proficiently under combat conditions.
1 1 16 …the officer isn't angry.
1 1 17 …the officer's attention is not distracted by trauma he/she has experienced in the encounter.
1 1 18 …the officer has assessed/planned potential cover/concealment prior to the encounter.
1 1 19 …the officer properly used dynamic movement.
1 1 20 …the officer doesn't know about potential stress-related effects of officer-involved shootings.
1 2 1 …the officer is knowledgeable about relevant laws concerning the use of force.
This document is a research report submitted to the U.S. Department of Justice. This report has not been published by the Department. Opinions or points of view expressed are those of the author(s)
and do not necessarily reflect the official position or policies of the U.S. Department of Justice.
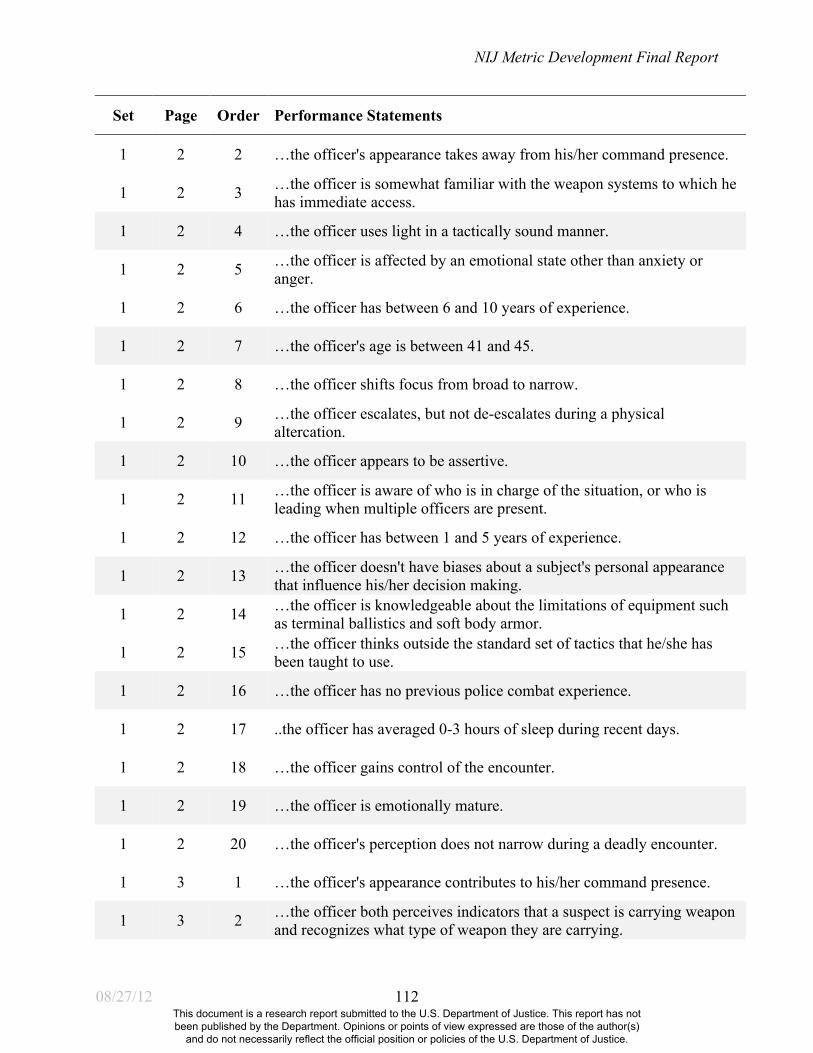
NIJ Metric Development Final Report
08/27/12 112
Set Page Order Performance Statements
1 2 2 …the officer's appearance takes away from his/her command presence.
1 2 3 …the officer is somewhat familiar with the weapon systems to which he has immediate access.
1 2 4 …the officer uses light in a tactically sound manner.
1 2 5 …the officer is affected by an emotional state other than anxiety or anger.
1 2 6 …the officer has between 6 and 10 years of experience.
1 2 7 …the officer's age is between 41 and 45.
1 2 8 …the officer shifts focus from broad to narrow.
1 2 9 …the officer escalates, but not de-escalates during a physical altercation.
1 2 10 …the officer appears to be assertive.
1 2 11 …the officer is aware of who is in charge of the situation, or who is leading when multiple officers are present.
1 2 12 …the officer has between 1 and 5 years of experience.
1 2 13 …the officer doesn't have biases about a subject's personal appearance that influence his/her decision making.
1 2 14 …the officer is knowledgeable about the limitations of equipment such as terminal ballistics and soft body armor.
1 2 15 …the officer thinks outside the standard set of tactics that he/she has been taught to use.
1 2 16 …the officer has no previous police combat experience.
1 2 17 ..the officer has averaged 0-3 hours of sleep during recent days.
1 2 18 …the officer gains control of the encounter.
1 2 19 …the officer is emotionally mature.
1 2 20 …the officer's perception does not narrow during a deadly encounter.
1 3 1 …the officer's appearance contributes to his/her command presence.
1 3 2 …the officer both perceives indicators that a suspect is carrying weapon and recognizes what type of weapon they are carrying.
This document is a research report submitted to the U.S. Department of Justice. This report has not been published by the Department. Opinions or points of view expressed are those of the author(s)
and do not necessarily reflect the official position or policies of the U.S. Department of Justice.

NIJ Metric Development Final Report
08/27/12 113
Set Page Order Performance Statements
1 3 3 ...the officer responds to pre-assault indicators in a timely manner.
1 3 4 …the officer doesn't have biases about ex-convicts that influence his/her decision making.
1 3 5 …the officer is able to decide whether to use deadly force in a timely manner.
1 3 6 …the officer is physically fit enough for the encounter.
1 3 7 …the officer's level of physiological excitement increases from normal.
1 3 8 …the officer de-escalates after a suspect submits.
1 3 9 …the officer makes partial use of available cover and concealment.
1 3 10 …the officer's age is between 31 and 35.
1 3 11 …the officer quickly delivers accurate follow-on shots.
1 3 12 …the officer recognized the need to transition to other force options.
1 3 13 ..the officer has averaged 8 or more hours of sleep during recent days.
1 3 14 …the officer has received unrealistic training (e.g. shooting at a bull’s-eye target).
1 3 15 …the officer has biases about a subject's personal appearance that influence his/her decision making.
1 3 16 …the officer's level of physical fatigue due to 26-30 consecutive hours awake.
1 3 17 …the officer doesn't have gender biases that influence his/her decision making in the encounter.
1 3 18 …the officer meets agency hearing standards.
1 3 19 …the absence of steroids in the officer's system.
1 3 20 …the officer takes risks in anticipation of awards or special recognition.
1 4 1 …the officer prioritizes threats.
1 4 2 …the officer's last marksmanship training was during the past 2-3 months.
1 4 3 …the officer understands pre-assault indicators.
This document is a research report submitted to the U.S. Department of Justice. This report has not been published by the Department. Opinions or points of view expressed are those of the author(s)
and do not necessarily reflect the official position or policies of the U.S. Department of Justice.
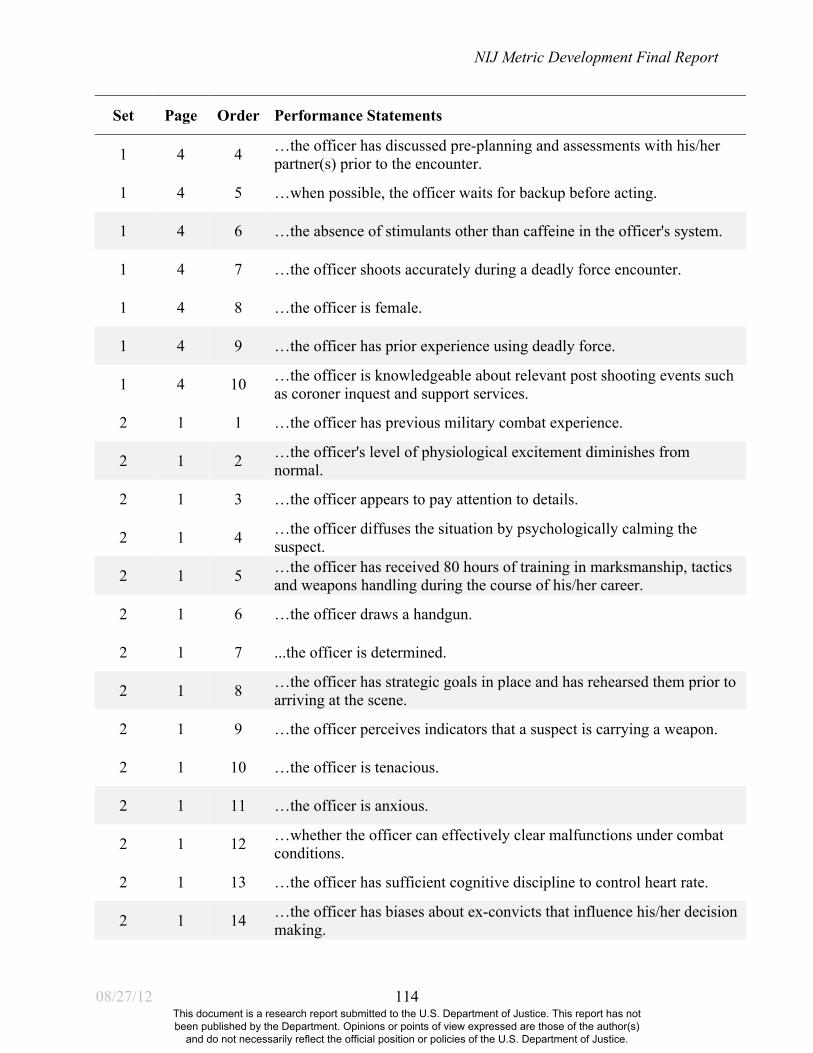
NIJ Metric Development Final Report
08/27/12 114
Set Page Order Performance Statements
1 4 4 …the officer has discussed pre-planning and assessments with his/her partner(s) prior to the encounter.
1 4 5 …when possible, the officer waits for backup before acting.
1 4 6 …the absence of stimulants other than caffeine in the officer's system.
1 4 7 …the officer shoots accurately during a deadly force encounter.
1 4 8 …the officer is female.
1 4 9 …the officer has prior experience using deadly force.
1 4 10 …the officer is knowledgeable about relevant post shooting events such as coroner inquest and support services.
2 1 1 …the officer has previous military combat experience.
2 1 2 …the officer's level of physiological excitement diminishes from normal.
2 1 3 …the officer appears to pay attention to details.
2 1 4 …the officer diffuses the situation by psychologically calming the suspect.
2 1 5 …the officer has received 80 hours of training in marksmanship, tactics and weapons handling during the course of his/her career.
2 1 6 …the officer draws a handgun.
2 1 7 ...the officer is determined.
2 1 8 …the officer has strategic goals in place and has rehearsed them prior to arriving at the scene.
2 1 9 …the officer perceives indicators that a suspect is carrying a weapon.
2 1 10 …the officer is tenacious.
2 1 11 …the officer is anxious.
2 1 12 …whether the officer can effectively clear malfunctions under combat conditions.
2 1 13 …the officer has sufficient cognitive discipline to control heart rate.
2 1 14 …the officer has biases about ex-convicts that influence his/her decision making.
This document is a research report submitted to the U.S. Department of Justice. This report has not been published by the Department. Opinions or points of view expressed are those of the author(s)
and do not necessarily reflect the official position or policies of the U.S. Department of Justice.

NIJ Metric Development Final Report
08/27/12 115
Set Page Order Performance Statements
2 1 15 …the officer has previous police combat experience.
2 1 16 …the officer's last deadly force skills training other than marksmanship was 5 or more years ago.
2 1 17 …the officer appears to be relaxed and easygoing.
2 1 18 …the officer's perceptions of the consequences of using deadly force don't reflect the culture of his/her agency, community, and local news media.
2 1 19 …the officer has between 21 and 25 years of experience.
2 1 20 …the officer's age is between 51 and 55.
2 2 1 …the officer is of small build.
2 2 2 ..the officer has received physical skills training in marksmanship, tactics and weapons handling.
2 2 3 …the officer makes full use of available cover and concealment.
2 2 4 …the officer expects to be involved in a deadly force situation.
2 2 5 …the officer has assessed/planned potential pursuit issues prior to the encounter.
2 2 6 …the officer makes no use of available cover and concealment.
2 2 7 …the officer overestimates his/her ability to read a situation.
2 2 8 …the officer doesn't bring any non-traumatic, everyday stress to a confrontation.
2 2 9 …the officer's last marksmanship training was during the last month.
2 2 10 …the officer doesn't take risks in anticipation of awards or special recognition.
2 2 11 …the officer has been in a situation where he or she used, or legally could have used, deadly force six times.
2 2 12 …the officer is confident in skills and abilities gained during departmental training.
2 2 13 …the officer meets agency vision standards.
2 2 14 …the officer shifts focus from narrow to broad.
2 2 15 …the officer is emotionally immature.
This document is a research report submitted to the U.S. Department of Justice. This report has not been published by the Department. Opinions or points of view expressed are those of the author(s)
and do not necessarily reflect the official position or policies of the U.S. Department of Justice.

NIJ Metric Development Final Report
08/27/12 116
Set Page Order Performance Statements
2 2 16 …the officer has received 160 or more hours of training in marksmanship, tactics and weapons handling during the course of his/her career.
2 2 17 …the presence of steroids in the officer's system.
2 2 18 …the officer has religious biases that influence his/her decision making.
2 2 19 …the officer is focused on tactical procedures more than suspect apprehension.
2 2 20 …the presence of caffeine in the officer's system.
2 3 1 …the officer's physical attributes contribute to his/her command presence.
2 3 2 …the officer can effectively operate and handle vehicle emergency equipment under emergency conditions.
2 3 3 ..the officer has averaged 6-7 hours of sleep during recent days.
2 3 4 …the officer's level of physiological excitement remains normal.
2 3 5 …the officer's last marksmanship training was during the past 4-6 months.
2 3 6 …the officer selected among force options while moving.
2 3 7 …the officer's perceptions of the consequences of using deadly force reflect the culture of his/her agency, community, and local news media.
2 3 8 …the officer isn't confident in skills and abilities gained during departmental training.
2 3 9 …the officer applies deadly force rules of engagement (laws and policies) in a combat situation.
2 3 10 …the effect of recent shift changes on the officer's tactical awareness.
2 3 11 …the officer doesn't apply deadly force rules of engagement (laws and policies) in a combat situation.
2 3 12 …the officer is able to identify the suspect's mental or physical health.
2 3 13 …the officer's age is 25 or under.
2 3 14 …the officer's level of physical fatigue due to 9-10 consecutive hours awake.
2 3 15 …the officer's level of physical fatigue due to 17-20 consecutive hours awake.
2 3 16 …the officer knows what to look for in that type of situation (possesses necessary mental schemas or models).
This document is a research report submitted to the U.S. Department of Justice. This report has not been published by the Department. Opinions or points of view expressed are those of the author(s)
and do not necessarily reflect the official position or policies of the U.S. Department of Justice.
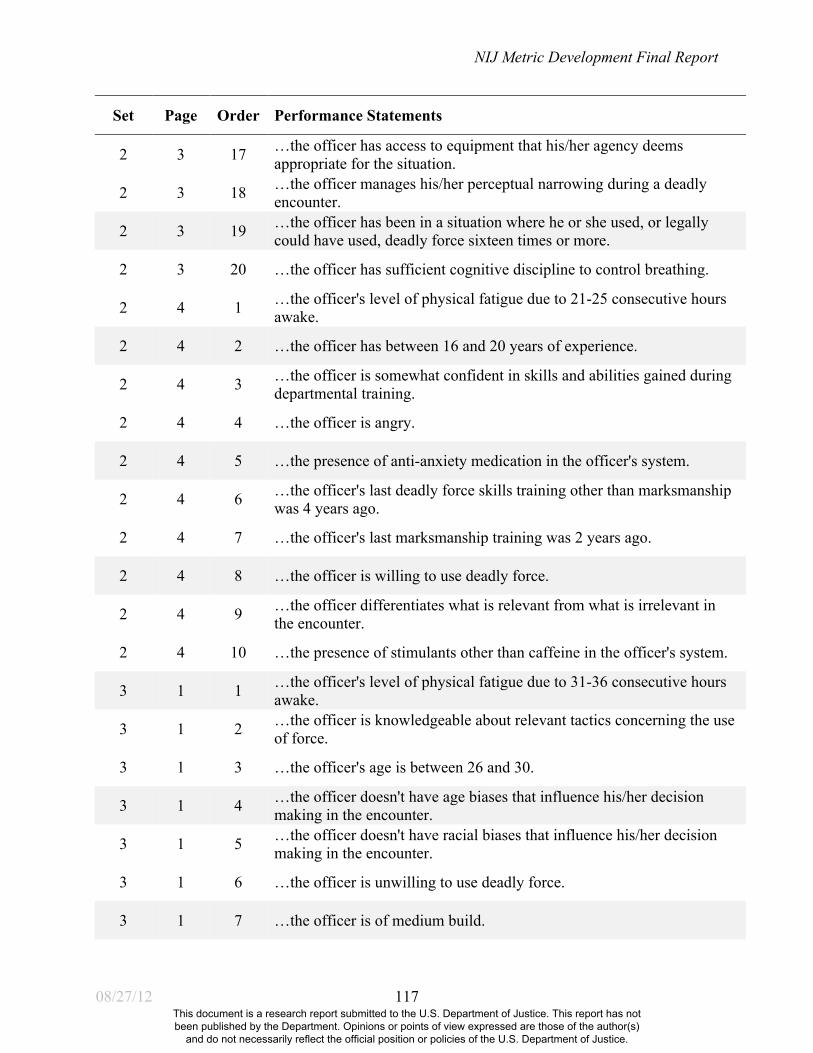
NIJ Metric Development Final Report
08/27/12 117
Set Page Order Performance Statements
2 3 17 …the officer has access to equipment that his/her agency deems appropriate for the situation.
2 3 18 …the officer manages his/her perceptual narrowing during a deadly encounter.
2 3 19 …the officer has been in a situation where he or she used, or legally could have used, deadly force sixteen times or more.
2 3 20 …the officer has sufficient cognitive discipline to control breathing.
2 4 1 …the officer's level of physical fatigue due to 21-25 consecutive hours awake.
2 4 2 …the officer has between 16 and 20 years of experience.
2 4 3 …the officer is somewhat confident in skills and abilities gained during departmental training.
2 4 4 …the officer is angry.
2 4 5 …the presence of anti-anxiety medication in the officer's system.
2 4 6 …the officer's last deadly force skills training other than marksmanship was 4 years ago.
2 4 7 …the officer's last marksmanship training was 2 years ago.
2 4 8 …the officer is willing to use deadly force.
2 4 9 …the officer differentiates what is relevant from what is irrelevant in the encounter.
2 4 10 …the presence of stimulants other than caffeine in the officer's system.
3 1 1 …the officer's level of physical fatigue due to 31-36 consecutive hours awake.
3 1 2 …the officer is knowledgeable about relevant tactics concerning the use of force.
3 1 3 …the officer's age is between 26 and 30.
3 1 4 …the officer doesn't have age biases that influence his/her decision making in the encounter.
3 1 5 …the officer doesn't have racial biases that influence his/her decision making in the encounter.
3 1 6 …the officer is unwilling to use deadly force.
3 1 7 …the officer is of medium build.
This document is a research report submitted to the U.S. Department of Justice. This report has not been published by the Department. Opinions or points of view expressed are those of the author(s)
and do not necessarily reflect the official position or policies of the U.S. Department of Justice.

NIJ Metric Development Final Report
08/27/12 118
Set Page Order Performance Statements
3 1 8 …the officer's last marksmanship training was during the past 7-12 months.
3 1 9 …the officer knows his/her position relative to bystanders.
3 1 10 ...the officer has handled a large number of violent confrontations in the past in which deadly force was an option.
3 1 11 …the officer is aware of the space around him/her and the position of nearby objects.
3 1 12 …the officer adjusts to the unexpected.
3 1 13 …the officer prioritizes his/her primary goals as protecting bystander/innocent lives, protecting officer lives, protecting suspect lives, preserving evidence, and protecting property.
3 1 14 …the impact of nighttime on the officer's tactical awareness.
3 1 15 …the officer is knowledgeable about relevant policies concerning the use of force.
3 1 16 …the officer escalates and de-escalates during a physical altercation.
3 1 17 …the officer effectively managed his/her frustration during a prolonged encounter.
3 1 18 …the officer has been in a situation where he or she used, or legally could have used, deadly force four times.
3 1 19 …the officer can effectively operate and handle flashlights under emergency conditions.
3 1 20 …the officer adapts his/her tactics creatively when an encounter changes into something unusual or out of the ordinary.
3 2 1 …the officer used or compensated for environmental conditions where the incident occurred.
3 2 2 ...the officer makes timely decisions regarding pre-assault indicators.
3 2 3 ... the officer used proper tactical movement.
3 2 4 …the officer fears the consequences of using deadly force.
3 2 5 …the officer has between 26 and 30 years of experience.
3 2 6 …the officer isn't physically limited due to any injury.
3 2 7 …the officer is knowledgeable about potential stress-related effects of officer-involved shootings.
3 2 8 …the officer isn't anxious.
This document is a research report submitted to the U.S. Department of Justice. This report has not been published by the Department. Opinions or points of view expressed are those of the author(s)
and do not necessarily reflect the official position or policies of the U.S. Department of Justice.

NIJ Metric Development Final Report
08/27/12 119
Set Page Order Performance Statements
3 2 9 …the officer can effectively operate and handle communications equipment under emergency conditions.
3 2 10 …the officer appears to be friendly.
3 2 11 …the officer accurately assesses his/her knowledge and skills.
3 2 12 …the officer doesn't fear the consequences of using deadly force.
3 2 13 …the officer accurately identified multiple opponents.
3 2 14 …the officer has been in a situation where he or she used, or legally could have used, deadly force three times.
3 2 15 …the officer maintains control of the encounter until it is resolved.
3 2 16 …the officer's last deadly force skills training other than marksmanship was 3 years ago.
3 2 17 …the officer is knowledgeable about relevant case studies on officer-involved shootings.
3 2 18 …the officer's level of physical fatigue due to 0-4 consecutive hours awake.
3 2 19 …the officer has been in a situation where he or she used, or legally could have used, deadly force between seven and ten times.
3 2 20 …the absence of caffeine in the officer's system.
3 3 1 …the officer has received excellent quality training in marksmanship, tactics and weapons handling.
3 3 2 …the officer has received poor quality training in marksmanship, tactics and weapons handling.
3 3 3 …the officer doesn't maintain control over his/her emotions.
3 3 4 ...the officer has handled a small number of violent confrontations in the past in which deadly force was an option.
3 3 5 …the officer's age is between 46 and 50.
3 3 6 …the officer's age is over 60.
3 3 7 …the officer is able to communicate key information to fellow officers at the scene of the incident.
3 3 8 …the officer has been in a situation where he or she used, or legally could have used, deadly force once.
3 3 9 …the officer's level of physical fatigue due to 13-16 consecutive hours awake.
This document is a research report submitted to the U.S. Department of Justice. This report has not been published by the Department. Opinions or points of view expressed are those of the author(s)
and do not necessarily reflect the official position or policies of the U.S. Department of Justice.

NIJ Metric Development Final Report
08/27/12 120
Set Page Order Performance Statements
3 3 10 …the officer scans, processes, interprets and acts.
3 3 11 …the officer's last marksmanship training was 5 or more years ago.
3 3 12 …the officer's last deadly force skills training other than marksmanship was during the past 2-3 months.
3 3 13 …the officer has received 40 hours of training in marksmanship, tactics and weapons handling during the course of his/her career.
3 3 14 …the officer is aware of what is going on in the periphery of his/her vision.
3 3 15 …the officer is flexible and changes tactics when necessary.
3 3 16 …the officer has received training that simulates deadly force encounters.
3 3 17 …the officer's level of physical fatigue due to 11-12 consecutive hours awake.
3 3 18 …the officer is able to use communication skills to defuse or de-escalate a potentially violent situation.
3 3 19 …the officer's last deadly force skills training other than marksmanship was 2 years ago.
3 3 20 …the officer brings a low level of non-traumatic, everyday stress to a confrontation.
3 4 1 …the officer's last deadly force skills training other than marksmanship was during the last month.
3 4 2 …the officer is very familiar with the weapon systems to which he has immediate access.
3 4 3 …the officer's last deadly force skills training other than marksmanship was during the past 7-12 months.
3 4 4 …the officer's level of physical fatigue due to over 36 consecutive hours awake.
3 4 5 …the impact of daytime on the officer's tactical awareness.
3 4 6 …the officer's level of physical fatigue due to 5-6 consecutive hours awake.
3 4 7 …the officer accurately read a bystander's body language and appearance to infer deceptive intent.
3 4 8 …the officer isn't affected by an emotional state other than anxiety or anger.
3 4 9 …the officer used an appropriate level of aggressiveness.
4 1 1 …the officer has received somewhat realistic training (e.g. shooting at an image of an offender).
This document is a research report submitted to the U.S. Department of Justice. This report has not been published by the Department. Opinions or points of view expressed are those of the author(s)
and do not necessarily reflect the official position or policies of the U.S. Department of Justice.

NIJ Metric Development Final Report
08/27/12 121
Set Page Order Performance Statements
4 1 2 …the officer re-holsters a handgun.
4 1 3 …the officer is aware of what is going on in the periphery of his/her hearing.
4 1 4 …the officer has been in a situation where he or she used, or legally could have used, deadly force five times.
4 1 5 ...the officer adapts to the dark in a low light condition.
4 1 6 …the officer's emotional control contributes to his/her command presence.
4 1 7 …the officer knows his/her position relative to identified threats.
4 1 8 …the officer controls and focuses his/her emotional intensity.
4 1 9 …the officer is proficient with force options that are less-lethal than firearms.
4 1 10 …the officer has assessed/planned potential escape routes prior to the encounter.
4 1 11 …whether the officer effectively engaged multiple opponents.
4 1 12 …the officer's last marksmanship training was 4 years ago.
4 1 13 …the officer has less than 1 year of experience.
4 1 14 …the officer clearly identifies him or herself during an off-duty or plainclothes encounter.
4 1 15 …the officer is of large build.
4 1 16 …the officer optimizes the distance between him or herself and the identified threat.
4 1 17 …the absence of anti-depressants in the officer's system.
4 1 18 …the officer has between 11 and 15 years of experience.
4 1 19 …when possible, the officer assesses the situation fully before acting.
4 1 20 …the officer has sufficient cognitive discipline to focus attention.
4 2 1 …the officer doesn't have moral or faith-based beliefs regarding the taking of a life.
4 2 2 …the officer escalates, but not de-escalates during shooting.
This document is a research report submitted to the U.S. Department of Justice. This report has not been published by the Department. Opinions or points of view expressed are those of the author(s)
and do not necessarily reflect the official position or policies of the U.S. Department of Justice.
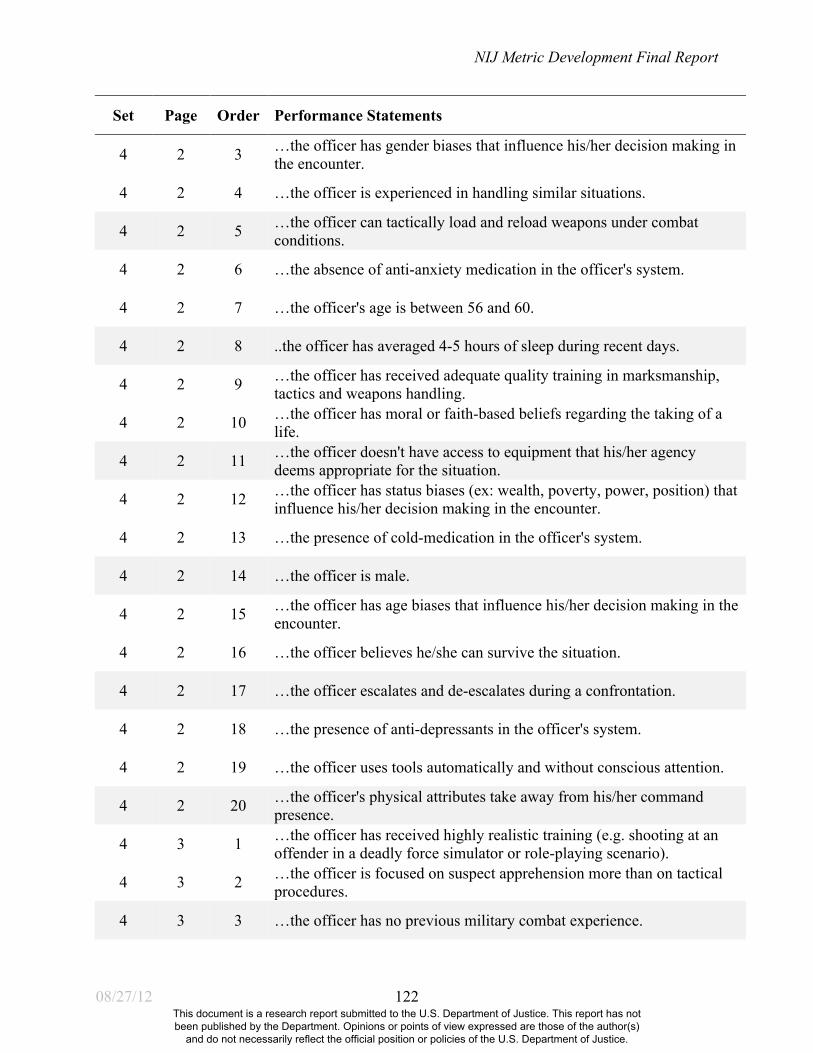
NIJ Metric Development Final Report
08/27/12 122
Set Page Order Performance Statements
4 2 3 …the officer has gender biases that influence his/her decision making in the encounter.
4 2 4 …the officer is experienced in handling similar situations.
4 2 5 …the officer can tactically load and reload weapons under combat conditions.
4 2 6 …the absence of anti-anxiety medication in the officer's system.
4 2 7 …the officer's age is between 56 and 60.
4 2 8 ..the officer has averaged 4-5 hours of sleep during recent days.
4 2 9 …the officer has received adequate quality training in marksmanship, tactics and weapons handling.
4 2 10 …the officer has moral or faith-based beliefs regarding the taking of a life.
4 2 11 …the officer doesn't have access to equipment that his/her agency deems appropriate for the situation.
4 2 12 …the officer has status biases (ex: wealth, poverty, power, position) that influence his/her decision making in the encounter.
4 2 13 …the presence of cold-medication in the officer's system.
4 2 14 …the officer is male.
4 2 15 …the officer has age biases that influence his/her decision making in the encounter.
4 2 16 …the officer believes he/she can survive the situation.
4 2 17 …the officer escalates and de-escalates during a confrontation.
4 2 18 …the presence of anti-depressants in the officer's system.
4 2 19 …the officer uses tools automatically and without conscious attention.
4 2 20 …the officer's physical attributes take away from his/her command presence.
4 3 1 …the officer has received highly realistic training (e.g. shooting at an offender in a deadly force simulator or role-playing scenario).
4 3 2 …the officer is focused on suspect apprehension more than on tactical procedures.
4 3 3 …the officer has no previous military combat experience.
This document is a research report submitted to the U.S. Department of Justice. This report has not been published by the Department. Opinions or points of view expressed are those of the author(s)
and do not necessarily reflect the official position or policies of the U.S. Department of Justice.
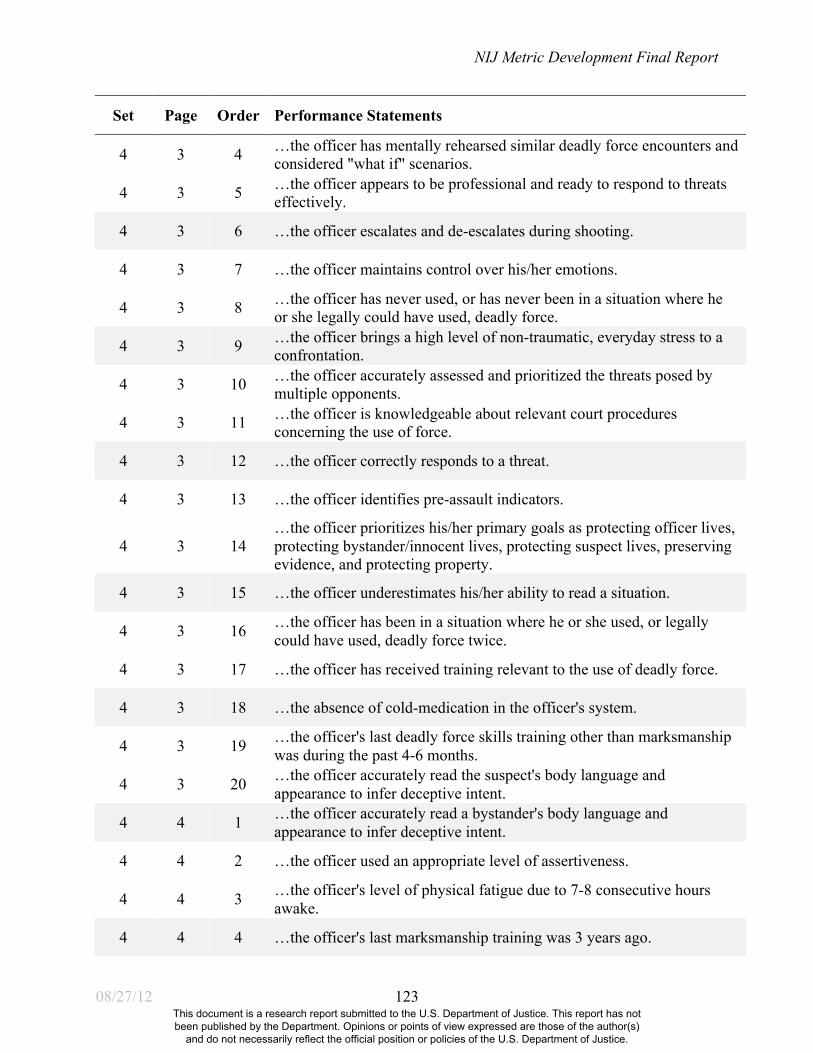
NIJ Metric Development Final Report
08/27/12 123
Set Page Order Performance Statements
4 3 4 …the officer has mentally rehearsed similar deadly force encounters and considered "what if" scenarios.
4 3 5 …the officer appears to be professional and ready to respond to threats effectively.
4 3 6 …the officer escalates and de-escalates during shooting.
4 3 7 …the officer maintains control over his/her emotions.
4 3 8 …the officer has never used, or has never been in a situation where he or she legally could have used, deadly force.
4 3 9 …the officer brings a high level of non-traumatic, everyday stress to a confrontation.
4 3 10 …the officer accurately assessed and prioritized the threats posed by multiple opponents.
4 3 11 …the officer is knowledgeable about relevant court procedures concerning the use of force.
4 3 12 …the officer correctly responds to a threat.
4 3 13 …the officer identifies pre-assault indicators.
4 3 14 …the officer prioritizes his/her primary goals as protecting officer lives, protecting bystander/innocent lives, protecting suspect lives, preserving evidence, and protecting property.
4 3 15 …the officer underestimates his/her ability to read a situation.
4 3 16 …the officer has been in a situation where he or she used, or legally could have used, deadly force twice.
4 3 17 …the officer has received training relevant to the use of deadly force.
4 3 18 …the absence of cold-medication in the officer's system.
4 3 19 …the officer's last deadly force skills training other than marksmanship was during the past 4-6 months.
4 3 20 …the officer accurately read the suspect's body language and appearance to infer deceptive intent.
4 4 1 …the officer accurately read a bystander's body language and appearance to infer deceptive intent.
4 4 2 …the officer used an appropriate level of assertiveness.
4 4 3 …the officer's level of physical fatigue due to 7-8 consecutive hours awake.
4 4 4 …the officer's last marksmanship training was 3 years ago.
This document is a research report submitted to the U.S. Department of Justice. This report has not been published by the Department. Opinions or points of view expressed are those of the author(s)
and do not necessarily reflect the official position or policies of the U.S. Department of Justice.

NIJ Metric Development Final Report
08/27/12 124
Set Page Order Performance Statements
4 4 5 …the officer changed positions when appropriate.
4 4 6 …the officer doesn't expect to be involved in a deadly force situation.
4 4 7 …the officer's age is between 36 and 40.
4 4 8 …the officer presents a handgun.
4 4 9 …the officer doesn't think outside the standard set of tactics that he/she has been taught to use.
This document is a research report submitted to the U.S. Department of Justice. This report has not been published by the Department. Opinions or points of view expressed are those of the author(s)
and do not necessarily reflect the official position or policies of the U.S. Department of Justice.

NIJ Metric Development Final Report
08/27/12 125
Appendix F: Maps and Charts Generated During the Concept Mapping Process
Figure F-5: Difficulty Statements sorted by measurability and importance.
This document is a research report submitted to the U.S. Department of Justice. This report has not been published by the Department. Opinions or points of view expressed are those of the author(s)
and do not necessarily reflect the official position or policies of the U.S. Department of Justice.

NIJ Metric Development Final Report
08/27/12 126
Figure F-6: Performance statements relating to officer/agency factors sorted by measurability and importance.
This document is a research report submitted to the U.S. Department of Justice. This report has not been published by the Department. Opinions or points of view expressed are those of the author(s)
and do not necessarily reflect the official position or policies of the U.S. Department of Justice.

NIJ Metric Development Final Report
08/27/12 127
Figure F-7: Difficulty statements relating to suspect characteristics sorted by measurability and importance.
This document is a research report submitted to the U.S. Department of Justice. This report has not been published by the Department. Opinions or points of view expressed are those of the author(s)
and do not necessarily reflect the official position or policies of the U.S. Department of Justice.
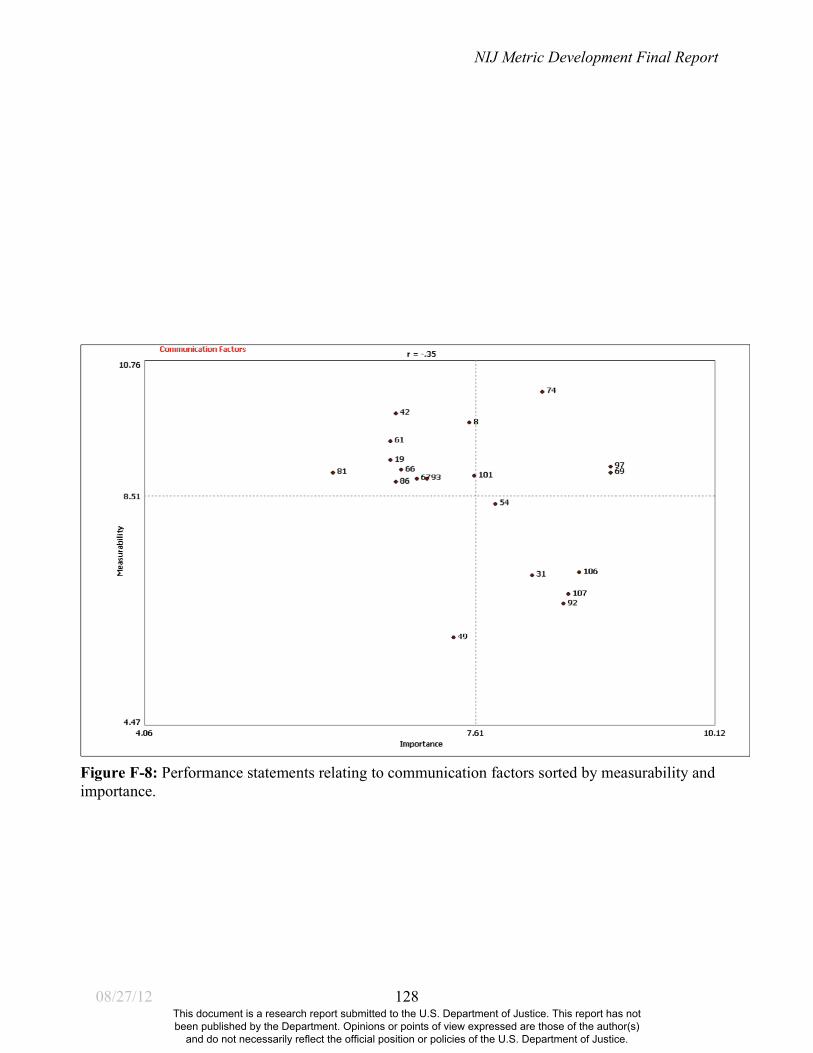
NIJ Metric Development Final Report
08/27/12 128
Figure F-8: Performance statements relating to communication factors sorted by measurability and importance.
This document is a research report submitted to the U.S. Department of Justice. This report has not been published by the Department. Opinions or points of view expressed are those of the author(s)
and do not necessarily reflect the official position or policies of the U.S. Department of Justice.
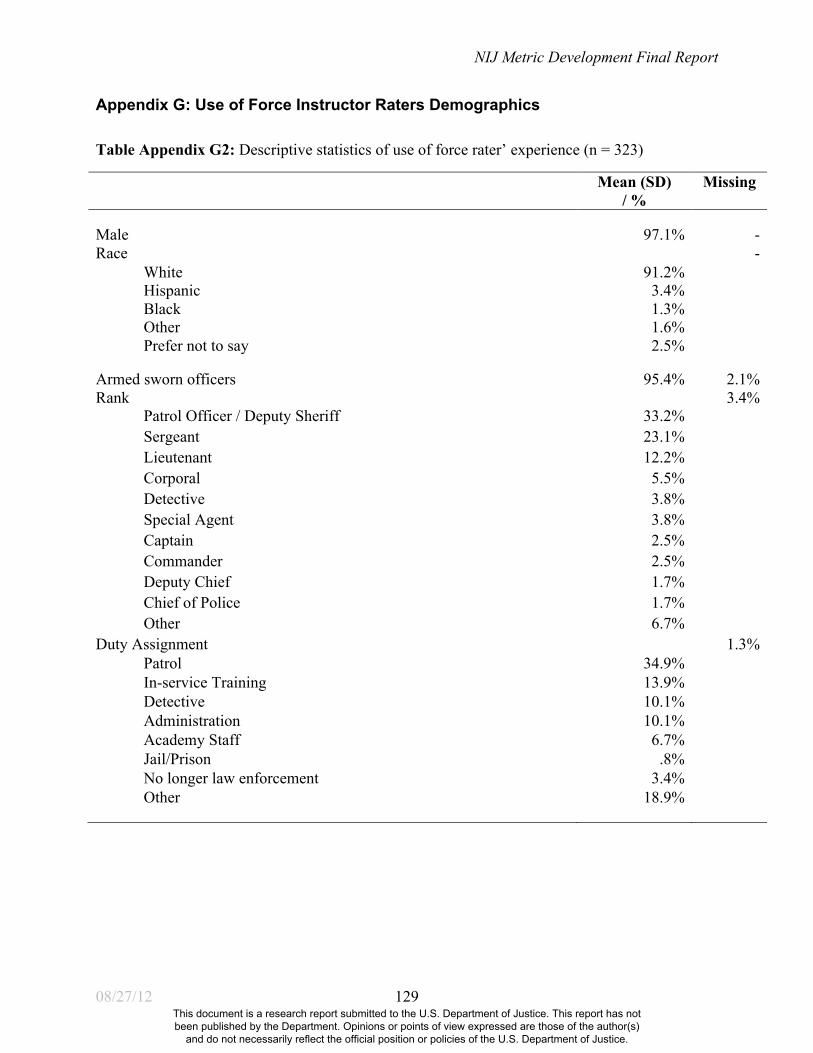
NIJ Metric Development Final Report
08/27/12 129
Appendix G: Use of Force Instructor Raters Demographics
Table Appendix G2: Descriptive statistics of use of force rater’ experience (n = 323)
Mean (SD) / %
Missing
Male 97.1% - Race -
White 91.2% Hispanic 3.4% Black 1.3% Other 1.6% Prefer not to say 2.5%
Armed sworn officers 95.4% 2.1% Rank 3.4%
Patrol Officer / Deputy Sheriff 33.2% Sergeant 23.1% Lieutenant 12.2% Corporal 5.5% Detective 3.8% Special Agent 3.8% Captain 2.5% Commander 2.5% Deputy Chief 1.7% Chief of Police 1.7% Other 6.7%
Duty Assignment 1.3% Patrol 34.9% In-service Training 13.9% Detective 10.1% Administration 10.1% Academy Staff 6.7% Jail/Prison .8% No longer law enforcement 3.4% Other 18.9%
This document is a research report submitted to the U.S. Department of Justice. This report has not been published by the Department. Opinions or points of view expressed are those of the author(s)
and do not necessarily reflect the official position or policies of the U.S. Department of Justice.

NIJ Metric Development Final Report
08/27/12 130
Appendix H: Scores Assigned to the Difficulty and Performance Statements
Difficulty Statements Score
...an officer is down at the scene. 5
...the incident occurs in a high crime rate area. 4
...the incident occurs in a low crime rate area. 2
...the incident occurs inside a business or government building. 3
...the incident occurs inside a private dwelling. 4
...the incident occurs outside in a fenced yard. 2.5
...the incident occurs outside in a parking lot. 3
...the incident occurs outside in a street or roadway. 3
...the incident occurs outside in an alley. 4
...the officer on the scene is on administrative assignment. 4.5
...the officer on the scene is on investigative assignment. 4
...the officer on the scene is on patrol. 3
...the size of the area in which the officer can maneuver. 4.5
...the time from the threat becoming apparent to the threat being employed by the suspect is :00-:02 seconds. 6
...the time from the threat becoming apparent to the threat being employed by the suspect is :03-:05 seconds. 5.5
...the time from the threat becoming apparent to the threat being employed by the suspect is :06-:10 seconds. 5
...the time from the threat becoming apparent to the threat being employed by the suspect is :11-:15 seconds. 4.5
...the time from the threat becoming apparent to the threat being employed by the suspect is :16-:30 seconds. 4
...the time from the threat becoming apparent to the threat being employed by the suspect is :31-:59 seconds. 5
This document is a research report submitted to the U.S. Department of Justice. This report has not been published by the Department. Opinions or points of view expressed are those of the author(s)
and do not necessarily reflect the official position or policies of the U.S. Department of Justice.

NIJ Metric Development Final Report
08/27/12 131
Difficulty Statements Score
...the time from the threat becoming apparent to the threat being employed by the suspect is 1:00-2:59 minutes. 4
...the time from the threat becoming apparent to the threat being employed by the suspect is 3:00-9:59 minutes. 3.5
...the time from the threat becoming apparent to the threat being employed by the suspect is greater than 10 minutes. 3.5
..the underlying crime that led to the encounter was a non-violent felony. 3
..the underlying crime that led to the encounter was a non-violent misdemeanor. 3
..the underlying crime that led to the encounter was a violent felony. 5
..the underlying crime that led to the encounter was a violent misdemeanor. 4
… the race or ethnicity of the suspect is white. 1
… the suspect was moving directly toward the officer. 4
… the suspect was moving in the general direction of the officer. 4
…a disconnect exists between the officer's departmental policies and the law. 5
…auditory distractions are present. 4
…both of the suspects hands are visible. 2
…eight officers are present at the scene. 2
…eleven or more officers are present at the scene. 2
…five officers are present at the scene. 1.5
…four officers are present at the scene. 2
…high risk preceding events have affected the officer's mindset that day. 5
…high-incapacitation areas (head or part of torso) are not vulnerable. 4.5
…high-incapacitation areas (head or part of torso) are vulnerable. 3
…low risk preceding events have affected the officer's mindset that day. 3.5
This document is a research report submitted to the U.S. Department of Justice. This report has not been published by the Department. Opinions or points of view expressed are those of the author(s)
and do not necessarily reflect the official position or policies of the U.S. Department of Justice.

NIJ Metric Development Final Report
08/27/12 132
Difficulty Statements Score
…medium risk preceding events have affected the officer's mindset that day. 4
…necessary and usual safety equipment is not immediately available to the officer. 5
…necessary and usual weapons are not immediately available to the officer. 6
…neither of the suspect’s hands are visible. 5
…nine officers are present at the scene. 2
…no officers of different ranks are present at the scene. 1
…none of the bystanders appear to be hostile to police. 2
…officers of different ranks are present at the scene. 4
…one of the suspect’s hands is visible. 4
…one officer is present at the scene. 4
…organizational culture/mindset influence the officer's ability to make an otherwise optimal decision. 5
…potential threats can come from multiple directions. 5
…potential threats can come from only one direction. 2
…recent media reports exist concerning alleged excessive use of force. 4
…seven officers are present at the scene. 2
…six officers are present at the scene. 3
…some of the bystanders appear to be hostile to police. 5
…ten officers are present at the scene. 2
…the ability of the officer to be heard is high. 2
…the ability of the officer to be heard is low. 5
…the ability of the officer to be heard is medium. 4
This document is a research report submitted to the U.S. Department of Justice. This report has not been published by the Department. Opinions or points of view expressed are those of the author(s)
and do not necessarily reflect the official position or policies of the U.S. Department of Justice.

NIJ Metric Development Final Report
08/27/12 133
Difficulty Statements Score
…the ability of the officer to hear is high. 1
…the ability of the officer to hear is low. 5
…the ability of the officer to hear is medium. 3
…the age of the suspect is between 18-24. 3
…the age of the suspect is between 25-30. 4
…the age of the suspect is between 31-35. 2
…the age of the suspect is between 36-40. 4
…the age of the suspect is between 41-45. 3
…the age of the suspect is between 46-50. 2.5
…the age of the suspect is between 51-55. 3.5
…the age of the suspect is between 56-60. 3
…the age of the suspect is over 60. 4
…the age of the suspect is under 18. 3
…the amount of tactical information an officer possesses on entering a situation was inadequate. 5
…the average level of experience of officers at the scene is expert. 2
…the average level of experience of officers at the scene is journeyman. 4
…the average level of experience of officers at the scene is rookie. 5
…the distance between the officer and any other officers is 11-20 feet. 3
…the distance between the officer and any other officers is 21-50 feet. 4
…the distance between the officer and any other officers is 5 feet or less. 3.5
…the distance between the officer and any other officers is 51 or more feet. 4
This document is a research report submitted to the U.S. Department of Justice. This report has not been published by the Department. Opinions or points of view expressed are those of the author(s)
and do not necessarily reflect the official position or policies of the U.S. Department of Justice.
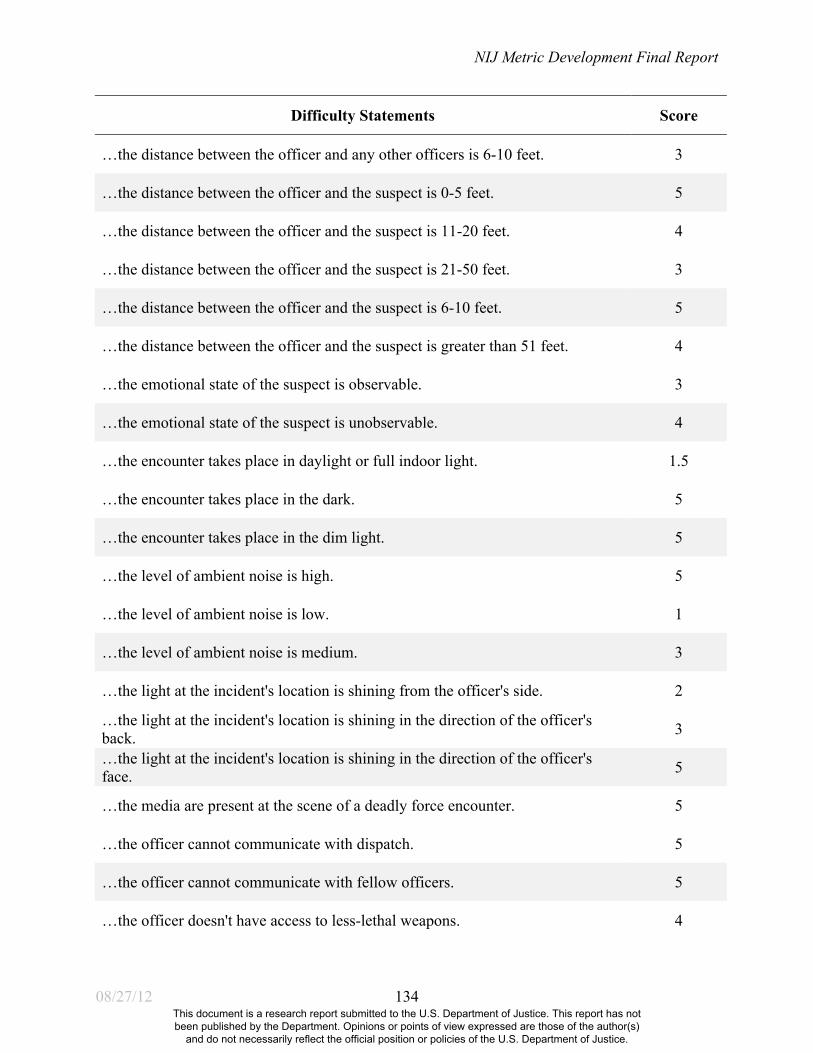
NIJ Metric Development Final Report
08/27/12 134
Difficulty Statements Score
…the distance between the officer and any other officers is 6-10 feet. 3
…the distance between the officer and the suspect is 0-5 feet. 5
…the distance between the officer and the suspect is 11-20 feet. 4
…the distance between the officer and the suspect is 21-50 feet. 3
…the distance between the officer and the suspect is 6-10 feet. 5
…the distance between the officer and the suspect is greater than 51 feet. 4
…the emotional state of the suspect is observable. 3
…the emotional state of the suspect is unobservable. 4
…the encounter takes place in daylight or full indoor light. 1.5
…the encounter takes place in the dark. 5
…the encounter takes place in the dim light. 5
…the level of ambient noise is high. 5
…the level of ambient noise is low. 1
…the level of ambient noise is medium. 3
…the light at the incident's location is shining from the officer's side. 2
…the light at the incident's location is shining in the direction of the officer's back. 3
…the light at the incident's location is shining in the direction of the officer's face. 5
…the media are present at the scene of a deadly force encounter. 5
…the officer cannot communicate with dispatch. 5
…the officer cannot communicate with fellow officers. 5
…the officer doesn't have access to less-lethal weapons. 4
This document is a research report submitted to the U.S. Department of Justice. This report has not been published by the Department. Opinions or points of view expressed are those of the author(s)
and do not necessarily reflect the official position or policies of the U.S. Department of Justice.

NIJ Metric Development Final Report
08/27/12 135
Difficulty Statements Score
…the officer doesn't have any information regarding a suspect's homicidal intent. 5
…the officer doesn't have any information regarding a suspect's suicidal intent. 4
…the officer doesn't have legal jurisdiction. 5
…the officer doesn't have the ability to disengage from an encounter. 5
…the officer doesn't think that backup is available. 5
…the officer experiences a sudden, substantial change from dark to light. 5
…the officer experiences a sudden, substantial change from light to dark. 6
…the officer has a high probability of hitting unintended persons or objects if he/she uses a weapon. 6
…the officer has a low probability of hitting unintended persons or objects if he/she uses a weapon. 3
…the officer has access to less-lethal weapons. 2.5
…the officer has been on duty for 0-4hrs prior to the encounter. 1.5
…the officer has been on duty for 11-12hrs prior to the encounter. 5
…the officer has been on duty for 5-6hrs prior to the encounter. 2
…the officer has been on duty for 7-8hrs prior to the encounter. 3
…the officer has been on duty for 9-10hrs prior to the encounter. 4
…the officer has been on duty for more than 12hrs prior to the encounter. 5
…the officer has experienced a lack of administrative support during prior deadly-force encounters. 6
…the officer has had no prior dealings or contacts with the suspect. 4
…the officer has had prior dealings or contacts with the suspect. 3
…the officer has information regarding a suspect's homicidal intent. 4
…the officer has information regarding a suspect's suicidal intent. 4
This document is a research report submitted to the U.S. Department of Justice. This report has not been published by the Department. Opinions or points of view expressed are those of the author(s)
and do not necessarily reflect the official position or policies of the U.S. Department of Justice.

NIJ Metric Development Final Report
08/27/12 136
Difficulty Statements Score
…the officer has knowledge of the number and type of prior offenses of the suspect. 2.5
…the officer has sustained injuries in prior deadly force encounters. 5
…the officer is familiar with other officers on the scene. 1
…the officer is in plain clothes at the time of the incident. 5
…the officer is in uniform at the time of the incident. 2
…the officer is kneeling. 4
…the officer is lying on his/her back. 6
…the officer is off duty at the time of the incident. 4
…the officer is on duty at the time of the incident. 1
…the officer is prone. 4
…the officer is somewhat familiar with other officers on the scene. 2
…the officer is standing. 3
…the officer is surprised by an assault. 6
…the officer is unable to continue engaging due to injuries received prior or during the encounter. 6
…the officer is unable to isolate the target. 5
…the officer is unfamiliar with other officers on the scene. 4
…the officer lacks escape routes. 5
…the officer lacks knowledge of the number and type of prior offenses of the suspect. 4
…the officer lacks physical cover against the threat being presented. 4
…the officer lacks prior knowledge regarding the location. 5
…the officer responds to a threat based on his/her own direct perceptions rather than on the actions of others. 4
This document is a research report submitted to the U.S. Department of Justice. This report has not been published by the Department. Opinions or points of view expressed are those of the author(s)
and do not necessarily reflect the official position or policies of the U.S. Department of Justice.

NIJ Metric Development Final Report
08/27/12 137
Difficulty Statements Score
…the officer responds to a threat based on the actions of others rather than on his/her own direct perceptions. 5
…the officer runs out of ammunition. 6
…the officer thinks that backup is available. 3
…the officer's equipment fails or malfunctions. 5
…the officer's handgun was holstered when the decision was made to shoot. 4.5
…the officer's handgun was un-holstered when the decision was made to shoot. 1
…the officer's movement is restricted by cover or concealment. 4
…the officer's movement is restricted by physical injury. 6
…the officer's movement is restricted by the environment. 5
…the population density where the incident occurs is high. 4
…the population density where the incident occurs is low. 2.5
…the potential lethality of the weapon displayed is high. 5
…the potential lethality of the weapon displayed is low. 3
…the potential lethality of the weapon displayed is moderate. 4
…the presence of barriers to communication between officers, bystanders and suspects. 5.5
…the presence of conflicting commands from multiple officers at the scene. 4
…the presence of dazzling lights that interfere with the officer's vision. 5
…the presence of distracting lights. 5
…the presence of distracting persons or conditions that interfere with the officer's ability to perceive the actual threat. 5
…the presence of extremely cold environmental conditions. 5
…the presence of extremely foggy environmental conditions. 6
This document is a research report submitted to the U.S. Department of Justice. This report has not been published by the Department. Opinions or points of view expressed are those of the author(s)
and do not necessarily reflect the official position or policies of the U.S. Department of Justice.

NIJ Metric Development Final Report
08/27/12 138
Difficulty Statements Score
…the presence of extremely hot environmental conditions. 4
…the presence of extremely rainy environmental conditions. 4
…the presence of precipitous terrain. 4
…the presence of unstable ground. 4
…the proportion of the suspect exposed to the officer's view is 0%. 7
…the proportion of the suspect exposed to the officer's view is 10-20%. 5.5
…the proportion of the suspect exposed to the officer's view is 1-9%. 5.5
…the proportion of the suspect exposed to the officer's view is 21-30%. 4
…the proportion of the suspect exposed to the officer's view is 31-40%. 4
…the proportion of the suspect exposed to the officer's view is greater than 40%. 2.5
…the proportion of the suspect vulnerable to the officer is 0%. 6
…the proportion of the suspect vulnerable to the officer is 10-20%. 5.5
…the proportion of the suspect vulnerable to the officer is 1-9%. 5
…the proportion of the suspect vulnerable to the officer is 21-30%. 4
…the proportion of the suspect vulnerable to the officer is 31-40%. 4
…the proportion of the suspect vulnerable to the officer is greater than 40%. 3
…the proximity of the officer to any bystanders is 11-20 feet. 3.5
…the proximity of the officer to any bystanders is 21-50 feet. 3
…the proximity of the officer to any bystanders is 5 feet or less. 5
…the proximity of the officer to any bystanders is 51 or more feet. 3
…the proximity of the officer to any bystanders is 6-10 feet. 4.5
This document is a research report submitted to the U.S. Department of Justice. This report has not been published by the Department. Opinions or points of view expressed are those of the author(s)
and do not necessarily reflect the official position or policies of the U.S. Department of Justice.

NIJ Metric Development Final Report
08/27/12 139
Difficulty Statements Score
…the proximity of the suspect to any bystanders is 11-20 feet. 4
…the proximity of the suspect to any bystanders is 21-50 feet. 4
…the proximity of the suspect to any bystanders is 5 feet or less. 5
…the proximity of the suspect to any bystanders is 51 or more feet. 3
…the proximity of the suspect to any bystanders is 6-10 feet. 4
…the race or ethnicity of the suspect is Asian. 1
…the race or ethnicity of the suspect is black. 1.5
…the race or ethnicity of the suspect is Hispanic. 1
…the race or ethnicity of the suspect is neither white, black, Hispanic nor Asian. 1
…the race or ethnicity of the suspect is unknown. 1
…the sex of the suspect is female. 4
…the sex of the suspect is male. 3.5
…the size of the suspect is large. 4
…the size of the suspect is medium. 2
…the size of the suspect is small. 3
…the size of the suspect is very large. 4.5
…the suspect appears intoxicated through alcohol or drugs, or otherwise impaired. 4
…the suspect doesn't appear intoxicated through alcohol or drugs, or otherwise impaired. 4
…the suspect feigns a weapon. 5.5
…the suspect feigns compliance. 5
…the suspect has committed 1-3 non-violent offenses previously. 2.5
This document is a research report submitted to the U.S. Department of Justice. This report has not been published by the Department. Opinions or points of view expressed are those of the author(s)
and do not necessarily reflect the official position or policies of the U.S. Department of Justice.
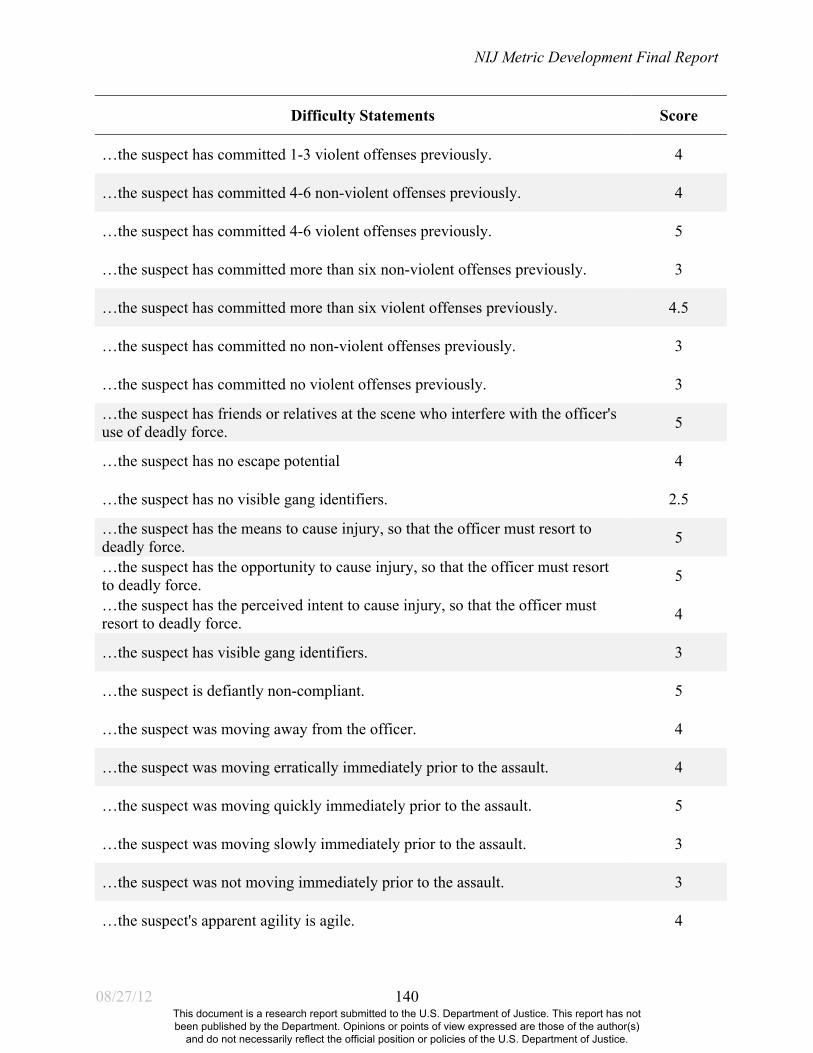
NIJ Metric Development Final Report
08/27/12 140
Difficulty Statements Score
…the suspect has committed 1-3 violent offenses previously. 4
…the suspect has committed 4-6 non-violent offenses previously. 4
…the suspect has committed 4-6 violent offenses previously. 5
…the suspect has committed more than six non-violent offenses previously. 3
…the suspect has committed more than six violent offenses previously. 4.5
…the suspect has committed no non-violent offenses previously. 3
…the suspect has committed no violent offenses previously. 3
…the suspect has friends or relatives at the scene who interfere with the officer's use of deadly force. 5
…the suspect has no escape potential 4
…the suspect has no visible gang identifiers. 2.5
…the suspect has the means to cause injury, so that the officer must resort to deadly force. 5
…the suspect has the opportunity to cause injury, so that the officer must resort to deadly force. 5
…the suspect has the perceived intent to cause injury, so that the officer must resort to deadly force. 4
…the suspect has visible gang identifiers. 3
…the suspect is defiantly non-compliant. 5
…the suspect was moving away from the officer. 4
…the suspect was moving erratically immediately prior to the assault. 4
…the suspect was moving quickly immediately prior to the assault. 5
…the suspect was moving slowly immediately prior to the assault. 3
…the suspect was not moving immediately prior to the assault. 3
…the suspect's apparent agility is agile. 4
This document is a research report submitted to the U.S. Department of Justice. This report has not been published by the Department. Opinions or points of view expressed are those of the author(s)
and do not necessarily reflect the official position or policies of the U.S. Department of Justice.

NIJ Metric Development Final Report
08/27/12 141
Difficulty Statements Score
…the suspect's apparent agility is average. 3
…the suspect's apparent agility is clumsy. 3
…the suspect's apparent physical strength is average. 3
…the suspect's apparent physical strength is strong. 5
…the suspect's apparent physical strength is weak. 3
…the suspect's hand movements are non-compliant. 5
…the suspect's known or perceived level of skill or training is skilled. 5
…the suspect's known or perceived level of skill or training is unskilled. 3
…the suspect's non-verbal behavior is aggressive. 4
…the suspect's position is about the same as the officer's. 4
…the suspect's position is higher than the officer's. 5
…the suspect's position is lower than the officer's. 2
…the suspect's verbal behavior is aggressive. 4
…the tactical information an officer possesses on entering a situation was inaccurate. 5
…the time from the beginning of the encounter to the application of deadly force is :00-:05 seconds. 6
…the time from the beginning of the encounter to the application of deadly force is :06-:15 seconds. 5.5
…the time from the beginning of the encounter to the application of deadly force is :16-:30 seconds. 5
…the time from the beginning of the encounter to the application of deadly force is :31-:59 seconds. 4
…the time from the beginning of the encounter to the application of deadly force is 1:00-2:59 minutes. 5
…the time from the beginning of the encounter to the application of deadly force is 3:00-:5.59 minutes. 3
…the time from the beginning of the encounter to the application of deadly force is 6:00-14:59 minutes. 3
This document is a research report submitted to the U.S. Department of Justice. This report has not been published by the Department. Opinions or points of view expressed are those of the author(s)
and do not necessarily reflect the official position or policies of the U.S. Department of Justice.

NIJ Metric Development Final Report
08/27/12 142
Difficulty Statements Score
…the time from the beginning of the encounter to the application of deadly force is greater than 15:00 minutes. 5
…the type of call or reported crime that led to the officer's response was a burglary in progress. 4
…the type of call or reported crime that led to the officer's response was a disturbance other than domestic. 3
…the type of call or reported crime that led to the officer's response was a domestic disturbance. 4
…the type of call or reported crime that led to the officer's response was a drug-related matter. 3.5
…the type of call or reported crime that led to the officer's response was a felony traffic stop. 3.5
…the type of call or reported crime that led to the officer's response was a mentally ill person. 3.5
…the type of call or reported crime that led to the officer's response was a minor traffic violation. 3
…the type of call or reported crime that led to the officer's response was a robbery in progress. 3
…the type of call or reported crime that led to the officer's response was a suspicious person or circumstances. 3
…the type of call or reported crime that led to the officer's response was a SWAT-type situation. 5
…the type of preceding events that day that have affected the officer's mindset have been generally peaceful. 3
…the type of preceding events that day that have affected the officer's mindset have included a major confrontation. 5
…the type of preceding events that day that have affected the officer's mindset have included some minor confrontations. 4
…the type of weapon the officer confronts is a biohazard weapon. 6
…the type of weapon the officer confronts is a blunt force weapon. 4
…the type of weapon the officer confronts is a hand gun. 5
…the type of weapon the officer confronts is a long gun. 6
…the type of weapon the officer confronts is an edged weapon. 6
…the type of weapon the officer confronts is feet. 3.5
…the type of weapon the officer confronts is hands. 4
This document is a research report submitted to the U.S. Department of Justice. This report has not been published by the Department. Opinions or points of view expressed are those of the author(s)
and do not necessarily reflect the official position or policies of the U.S. Department of Justice.
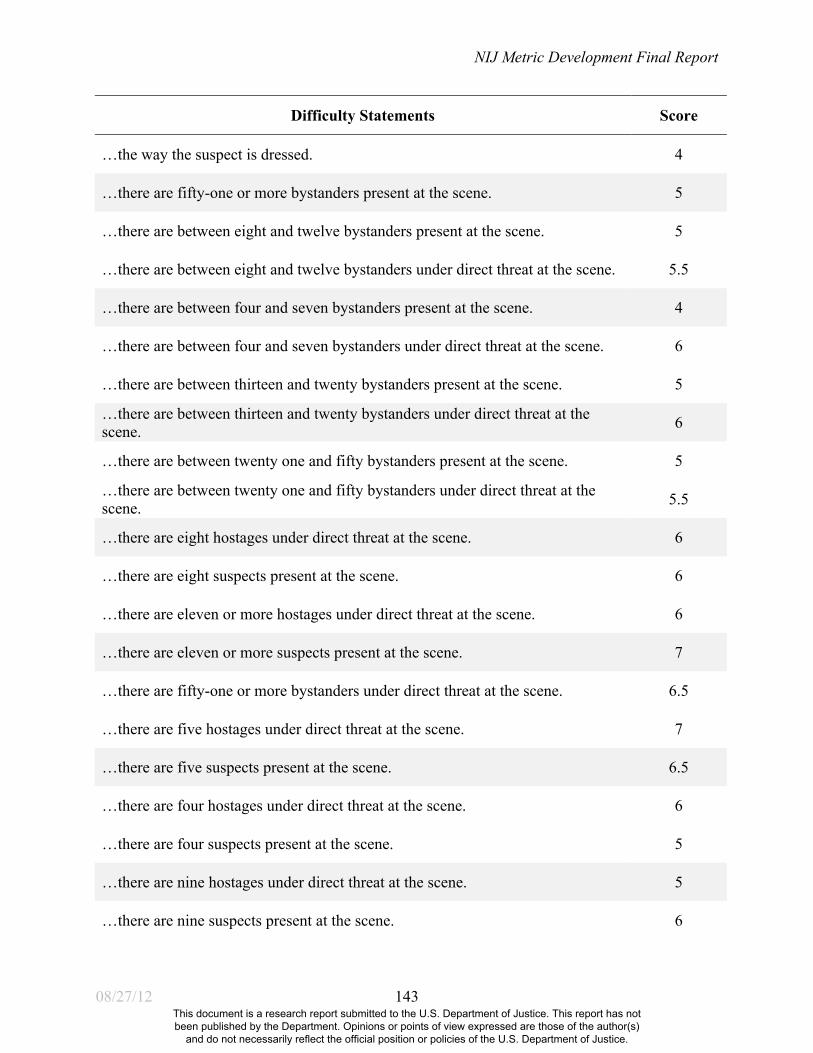
NIJ Metric Development Final Report
08/27/12 143
Difficulty Statements Score
…the way the suspect is dressed. 4
…there are fifty-one or more bystanders present at the scene. 5
…there are between eight and twelve bystanders present at the scene. 5
…there are between eight and twelve bystanders under direct threat at the scene. 5.5
…there are between four and seven bystanders present at the scene. 4
…there are between four and seven bystanders under direct threat at the scene. 6
…there are between thirteen and twenty bystanders present at the scene. 5
…there are between thirteen and twenty bystanders under direct threat at the scene. 6
…there are between twenty one and fifty bystanders present at the scene. 5
…there are between twenty one and fifty bystanders under direct threat at the scene. 5.5
…there are eight hostages under direct threat at the scene. 6
…there are eight suspects present at the scene. 6
…there are eleven or more hostages under direct threat at the scene. 6
…there are eleven or more suspects present at the scene. 7
…there are fifty-one or more bystanders under direct threat at the scene. 6.5
…there are five hostages under direct threat at the scene. 7
…there are five suspects present at the scene. 6.5
…there are four hostages under direct threat at the scene. 6
…there are four suspects present at the scene. 5
…there are nine hostages under direct threat at the scene. 5
…there are nine suspects present at the scene. 6
This document is a research report submitted to the U.S. Department of Justice. This report has not been published by the Department. Opinions or points of view expressed are those of the author(s)
and do not necessarily reflect the official position or policies of the U.S. Department of Justice.

NIJ Metric Development Final Report
08/27/12 144
Difficulty Statements Score
…there are seven hostages under direct threat at the scene. 6
…there are seven suspects present at the scene. 5
…there are six hostages under direct threat at the scene. 6
…there are six suspects present at the scene. 7
…there are ten hostages under direct threat at the scene. 6
…there are ten suspects present at the scene. 6
…there are three bystanders present at the scene. 4
…there are three bystanders under direct threat at the scene. 5
…there are three hostages under direct threat at the scene. 6.5
…there are three suspects present at the scene. 4
…there are two bystanders present at the scene. 4
…there are two bystanders under direct threat at the scene. 5.5
…there are two hostages under direct threat at the scene. 5
…there are two suspects present at the scene. 4
…there is one bystander present at the scene. 3
…there is one bystander under direct threat at the scene. 5
…there is one hostage under direct threat at the scene. 5
…there is one suspect present at the scene. 2.5
…three officers are present at the scene. 2
…two officers are present at the scene. 2
This document is a research report submitted to the U.S. Department of Justice. This report has not been published by the Department. Opinions or points of view expressed are those of the author(s)
and do not necessarily reflect the official position or policies of the U.S. Department of Justice.

NIJ Metric Development Final Report
08/27/12 145
Performance Statements Score
...the officer used proper tactical movement. 5
...the officer adapts to the dark in a low light condition. 5
...the officer has handled a large number of violent confrontations in the past in which deadly force was an option. 4
...the officer has handled a small number of violent confrontations in the past in which deadly force was an option. 1
...the officer is determined. 4
...the officer makes timely decisions regarding pre-assault indicators. 5
...the officer responds to pre-assault indicators in a timely manner. 5
...the officer has averaged 0-3 hours of sleep during recent days. -5
...the officer has averaged 4-5 hours of sleep during recent days. -4
...the officer has averaged 6-7 hours of sleep during recent days. 1
...the officer has averaged 8 or more hours of sleep during recent days. 4
...the officer has received physical skills training in marksmanship, tactics and weapons handling. 4
…the absence of anti-anxiety medication in the officer's system. 3
…the absence of anti-depressants in the officer's system. 4
…the absence of caffeine in the officer's system. 0
…the absence of cold-medication in the officer's system. 1
…the absence of steroids in the officer's system. 3
…the absence of stimulants other than caffeine in the officer's system. 3
…the effect of recent shift changes on the officer's tactical awareness. -3
…the impact of daytime on the officer's tactical awareness. 1
This document is a research report submitted to the U.S. Department of Justice. This report has not been published by the Department. Opinions or points of view expressed are those of the author(s)
and do not necessarily reflect the official position or policies of the U.S. Department of Justice.
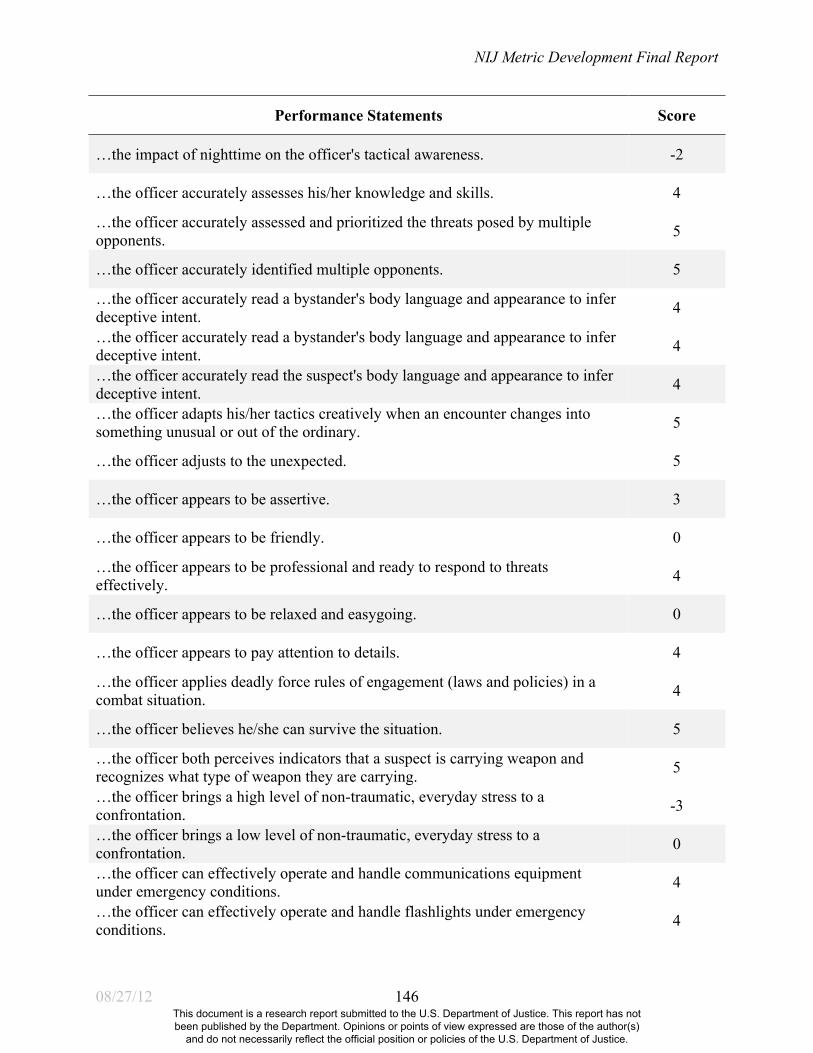
NIJ Metric Development Final Report
08/27/12 146
Performance Statements Score
…the impact of nighttime on the officer's tactical awareness. -2
…the officer accurately assesses his/her knowledge and skills. 4
…the officer accurately assessed and prioritized the threats posed by multiple opponents. 5
…the officer accurately identified multiple opponents. 5
…the officer accurately read a bystander's body language and appearance to infer deceptive intent. 4
…the officer accurately read a bystander's body language and appearance to infer deceptive intent. 4
…the officer accurately read the suspect's body language and appearance to infer deceptive intent. 4
…the officer adapts his/her tactics creatively when an encounter changes into something unusual or out of the ordinary. 5
…the officer adjusts to the unexpected. 5
…the officer appears to be assertive. 3
…the officer appears to be friendly. 0
…the officer appears to be professional and ready to respond to threats effectively. 4
…the officer appears to be relaxed and easygoing. 0
…the officer appears to pay attention to details. 4
…the officer applies deadly force rules of engagement (laws and policies) in a combat situation. 4
…the officer believes he/she can survive the situation. 5
…the officer both perceives indicators that a suspect is carrying weapon and recognizes what type of weapon they are carrying. 5
…the officer brings a high level of non-traumatic, everyday stress to a confrontation. -3
…the officer brings a low level of non-traumatic, everyday stress to a confrontation. 0
…the officer can effectively operate and handle communications equipment under emergency conditions. 4
…the officer can effectively operate and handle flashlights under emergency conditions. 4
This document is a research report submitted to the U.S. Department of Justice. This report has not been published by the Department. Opinions or points of view expressed are those of the author(s)
and do not necessarily reflect the official position or policies of the U.S. Department of Justice.

NIJ Metric Development Final Report
08/27/12 147
Performance Statements Score
…the officer can effectively operate and handle vehicle emergency equipment under emergency conditions. 4
…the officer can shoot proficiently under combat conditions. 5
…the officer can tactically load and reload weapons under combat conditions. 5
…the officer changed positions when appropriate. 4
…the officer clearly identifies him or herself during an off-duty or plainclothes encounter. 3
…the officer controls and focuses his/her emotional intensity. 5
…the officer correctly identifies threats. 5
…the officer correctly responds to a threat. 5
…the officer de-escalates after a suspect submits. 4
…the officer differentiates what is relevant from what is irrelevant in the encounter. 5
…the officer diffuses the situation by psychologically calming the suspect. 5
…the officer doesn't apply deadly force rules of engagement (laws and policies) in a combat situation. -5
…the officer doesn't bring any non-traumatic, everyday stress to a confrontation. 3
…the officer doesn't expect to be involved in a deadly force situation. -6
…the officer doesn't fear the consequences of using deadly force. 5
…the officer doesn't have access to equipment that his/her agency deems appropriate for the situation. -4
…the officer doesn't have age biases that influence his/her decision making in the encounter. 3
…the officer doesn't have biases about a subject's personal appearance that influence his/her decision making. 3
…the officer doesn't have biases about ex-convicts that influence his/her decision making. 1
…the officer doesn't have gender biases that influence his/her decision making in the encounter. 2
…the officer doesn't have moral or faith-based beliefs regarding the taking of a life. 0
This document is a research report submitted to the U.S. Department of Justice. This report has not been published by the Department. Opinions or points of view expressed are those of the author(s)
and do not necessarily reflect the official position or policies of the U.S. Department of Justice.

NIJ Metric Development Final Report
08/27/12 148
Performance Statements Score
…the officer doesn't have racial biases that influence his/her decision making in the encounter. 3
…the officer doesn't have religious biases that influence his/her decision making. 0
…the officer doesn't have status biases (ex: wealth, poverty, power, position) that influence his/her decision making in the encounter. 2
…the officer doesn't know about potential stress-related effects of officer-involved shootings. -3
…the officer doesn't maintain control over his/her emotions. -5
…the officer doesn't take risks in anticipation of awards or special recognition. 3
…the officer doesn't think outside the standard set of tactics that he/she has been taught to use. -4
…the officer draws a handgun. 2
…the officer effectively managed his/her frustration during a prolonged encounter. 4
…the officer escalates and de-escalates during a confrontation. 4
…the officer escalates and de-escalates during a physical altercation. 4
…the officer escalates and de-escalates during shooting. 5
…the officer escalates, but not de-escalates during a confrontation. -3
…the officer escalates, but not de-escalates during a physical altercation. -4
…the officer escalates, but not de-escalates during shooting. -3
…the officer expects to be involved in a deadly force situation. 5
…the officer fears the consequences of using deadly force. -5
…the officer gains control of the encounter. 5
…the officer gives relevant and meaningful commands. 5
…the officer has access to equipment that his/her agency deems appropriate for the situation. 4
…the officer has age biases that influence his/her decision making in the encounter. -3
This document is a research report submitted to the U.S. Department of Justice. This report has not been published by the Department. Opinions or points of view expressed are those of the author(s)
and do not necessarily reflect the official position or policies of the U.S. Department of Justice.

NIJ Metric Development Final Report
08/27/12 149
Performance Statements Score
…the officer has assessed/planned potential cover/concealment prior to the encounter. 5
…the officer has assessed/planned potential escape routes prior to the encounter. 5
…the officer has assessed/planned potential pursuit issues prior to the encounter. 5
…the officer has been in a situation where he or she used, or legally could have used, deadly force between eleven and fifteen times. 4
…the officer has been in a situation where he or she used, or legally could have used, deadly force between seven and ten times. 4
…the officer has been in a situation where he or she used, or legally could have used, deadly force five times. 4
…the officer has been in a situation where he or she used, or legally could have used, deadly force four times. 4
…the officer has been in a situation where he or she used, or legally could have used, deadly force once. 2
…the officer has been in a situation where he or she used, or legally could have used, deadly force six times. 4
…the officer has been in a situation where he or she used, or legally could have used, deadly force sixteen times or more. 5
…the officer has been in a situation where he or she used, or legally could have used, deadly force three times. 4
…the officer has been in a situation where he or she used, or legally could have used, deadly force twice. 2
…the officer has between 1 and 5 years of experience. -1
…the officer has between 11 and 15 years of experience. 3
…the officer has between 16 and 20 years of experience. 3
…the officer has between 21 and 25 years of experience. 2
…the officer has between 26 and 30 years of experience. 2
…the officer has between 6 and 10 years of experience. 2
…the officer has biases about a subject's personal appearance that influence his/her decision making. -3
…the officer has biases about ex-convicts that influence his/her decision making. -3
…the officer has discussed pre-planning and assessments with his/her partner(s) prior to the encounter. 5
This document is a research report submitted to the U.S. Department of Justice. This report has not been published by the Department. Opinions or points of view expressed are those of the author(s)
and do not necessarily reflect the official position or policies of the U.S. Department of Justice.
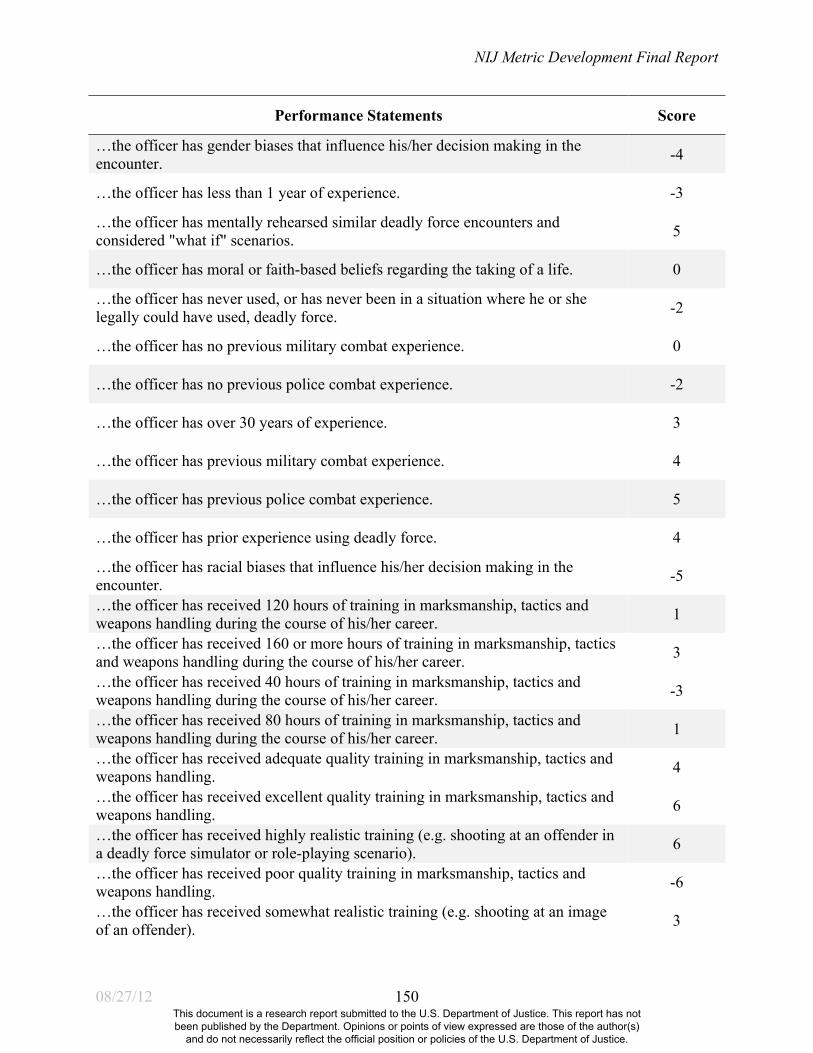
NIJ Metric Development Final Report
08/27/12 150
Performance Statements Score
…the officer has gender biases that influence his/her decision making in the encounter. -4
…the officer has less than 1 year of experience. -3
…the officer has mentally rehearsed similar deadly force encounters and considered "what if" scenarios. 5
…the officer has moral or faith-based beliefs regarding the taking of a life. 0
…the officer has never used, or has never been in a situation where he or she legally could have used, deadly force. -2
…the officer has no previous military combat experience. 0
…the officer has no previous police combat experience. -2
…the officer has over 30 years of experience. 3
…the officer has previous military combat experience. 4
…the officer has previous police combat experience. 5
…the officer has prior experience using deadly force. 4
…the officer has racial biases that influence his/her decision making in the encounter. -5
…the officer has received 120 hours of training in marksmanship, tactics and weapons handling during the course of his/her career. 1
…the officer has received 160 or more hours of training in marksmanship, tactics and weapons handling during the course of his/her career. 3
…the officer has received 40 hours of training in marksmanship, tactics and weapons handling during the course of his/her career. -3
…the officer has received 80 hours of training in marksmanship, tactics and weapons handling during the course of his/her career. 1
…the officer has received adequate quality training in marksmanship, tactics and weapons handling. 4
…the officer has received excellent quality training in marksmanship, tactics and weapons handling. 6
…the officer has received highly realistic training (e.g. shooting at an offender in a deadly force simulator or role-playing scenario). 6
…the officer has received poor quality training in marksmanship, tactics and weapons handling. -6
…the officer has received somewhat realistic training (e.g. shooting at an image of an offender). 3
This document is a research report submitted to the U.S. Department of Justice. This report has not been published by the Department. Opinions or points of view expressed are those of the author(s)
and do not necessarily reflect the official position or policies of the U.S. Department of Justice.

NIJ Metric Development Final Report
08/27/12 151
Performance Statements Score
…the officer has received training relevant to the use of deadly force. 3
…the officer has received training that simulates deadly force encounters. 5
…the officer has received unrealistic training (e.g. shooting at a bull’s-eye target). -4
…the officer has religious biases that influence his/her decision making. -4
…the officer has status biases (ex: wealth, poverty, power, position) that influence his/her decision making in the encounter. -4
…the officer has strategic goals in place and has rehearsed them prior to arriving at the scene. 5
…the officer has sufficient cognitive discipline to control breathing. 5
…the officer has sufficient cognitive discipline to control heart rate. 4
…the officer has sufficient cognitive discipline to focus attention. 5
…the officer identifies pre-assault indicators. 5
…the officer is able to communicate key information to fellow officers at the scene of the incident. 4
…the officer is able to decide whether to use deadly force in a timely manner. 6
…the officer is able to identify the suspect's mental or physical health. 3
…the officer is able to use communication skills to defuse or de-escalate a potentially violent situation. 4
…the officer is affected by an emotional state other than anxiety or anger. -3
…the officer is angry. -3
…the officer is anxious. -3
…the officer is aware of the space around him/her and the position of nearby objects. 4
…the officer is aware of what is going on in the periphery of his/her hearing. 4
…the officer is aware of what is going on in the periphery of his/her vision. 4
…the officer is aware of who is in charge of the situation, or who is leading when multiple officers are present. 4
This document is a research report submitted to the U.S. Department of Justice. This report has not been published by the Department. Opinions or points of view expressed are those of the author(s)
and do not necessarily reflect the official position or policies of the U.S. Department of Justice.

NIJ Metric Development Final Report
08/27/12 152
Performance Statements Score
…the officer is confident in skills and abilities gained during departmental training. 4
…the officer is emotionally immature. -5
…the officer is emotionally mature. 4
…the officer is experienced in handling similar situations. 4
…the officer is female. 0
…the officer is flexible and changes tactics when necessary. 5
…the officer is focused on suspect apprehension more than on tactical procedures. -3
…the officer is focused on tactical procedures more than suspect apprehension. 1
…the officer is knowledgeable about potential stress-related effects of officer-involved shootings. 4
…the officer is knowledgeable about relevant case studies on officer-involved shootings. 3
…the officer is knowledgeable about relevant court procedures concerning the use of force. 4
…the officer is knowledgeable about relevant laws concerning the use of force. 4
…the officer is knowledgeable about relevant policies concerning the use of force. 4
…the officer is knowledgeable about relevant post shooting events such as coroner inquest and support services. 3
…the officer is knowledgeable about relevant tactics concerning the use of force. 4
…the officer is knowledgeable about the limitations of equipment such as terminal ballistics and soft body armor. 3
…the officer is male. 0
…the officer is of large build. 1
…the officer is of medium build. 0
…the officer is of small build. -1
…the officer is physically fit enough for the encounter. 5
This document is a research report submitted to the U.S. Department of Justice. This report has not been published by the Department. Opinions or points of view expressed are those of the author(s)
and do not necessarily reflect the official position or policies of the U.S. Department of Justice.

NIJ Metric Development Final Report
08/27/12 153
Performance Statements Score
…the officer is proficient with force options that are less-lethal than firearms. 5
…the officer is somewhat confident in skills and abilities gained during departmental training. 1
…the officer is somewhat familiar with the weapon systems to which he has immediate access. -2
…the officer is tenacious. 4
…the officer is unwilling to use deadly force. -6
…the officer is very familiar with the weapon systems to which he has immediate access. 5
…the officer is willing to use deadly force. 5
…the officer isn't affected by an emotional state other than anxiety or anger. 0
…the officer isn't angry. 3
…the officer isn't anxious. 3
…the officer isn't confident in skills and abilities gained during departmental training. -5
…the officer isn't physically limited due to any injury. 4
…the officer isn't physically limited due to any innate condition. 4
…the officer knows his/her position relative to bystanders. 3
…the officer knows his/her position relative to identified threats. 5
…the officer knows what to look for in that type of situation (possesses necessary mental schemas or models). 4
…the officer maintains control of the encounter until it is resolved. 5
…the officer maintains control over his/her emotions. 5
…the officer makes full use of available cover and concealment. 5
…the officer makes no use of available cover and concealment. -5
…the officer makes partial use of available cover and concealment. 2
This document is a research report submitted to the U.S. Department of Justice. This report has not been published by the Department. Opinions or points of view expressed are those of the author(s)
and do not necessarily reflect the official position or policies of the U.S. Department of Justice.

NIJ Metric Development Final Report
08/27/12 154
Performance Statements Score
…the officer manages his/her perceptual narrowing during a deadly encounter. 4
…the officer meets agency hearing standards. 2
…the officer meets agency vision standards. 3
…the officer optimizes the distance between him or herself and the identified threat. 4
…the officer overestimates his/her ability to read a situation. -5
…the officer perceives indicators that a suspect is carrying a weapon. 5
…the officer presents a handgun. 2
…the officer prioritizes his/her primary goals as protecting bystander/innocent lives, protecting officer lives, protecting suspect lives, preserving evidence, and protecting property.
5
…the officer prioritizes his/her primary goals as protecting officer lives, protecting bystander/innocent lives, protecting suspect lives, preserving evidence, and protecting property.
4
…the officer prioritizes threats. 5
…the officer properly used dynamic movement. 5
…the officer quickly delivers accurate follow-on shots. 5
…the officer recognized the need to transition to other force options. 5
…the officer re-holsters a handgun. 0
…the officer scans, processes, interprets and acts. 4
…the officer selected among force options while moving. 3
…the officer selects reasonable force options. 5
…the officer shifts focus from broad to narrow. -1
…the officer shifts focus from narrow to broad. 3
…the officer shoots accurately during a deadly force encounter. 6
This document is a research report submitted to the U.S. Department of Justice. This report has not been published by the Department. Opinions or points of view expressed are those of the author(s)
and do not necessarily reflect the official position or policies of the U.S. Department of Justice.

NIJ Metric Development Final Report
08/27/12 155
Performance Statements Score
…the officer takes risks in anticipation of awards or special recognition. -5
…the officer thinks outside the standard set of tactics that he/she has been taught to use. 4
…the officer underestimates his/her ability to read a situation. -3
…the officer understands pre-assault indicators. 5
…the officer used an appropriate level of aggressiveness. 4
…the officer used an appropriate level of assertiveness. 4
…the officer used or compensated for environmental conditions where the incident occurred. 4
…the officer uses light in a tactically sound manner. 4
…the officer uses tools automatically and without conscious attention. 5
…the officer was patient and identified an advantageous moment to act. 5
…the officer's age is 25 or under. 0
…the officer's age is between 26 and 30. 2
…the officer's age is between 31 and 35. 1
…the officer's age is between 36 and 40. 0
…the officer's age is between 41 and 45. 0
…the officer's age is between 46 and 50. 0
…the officer's age is between 51 and 55. 0
…the officer's age is between 56 and 60. -2
…the officer's age is over 60. -2
…the officer's appearance contributes to his/her command presence. 3
…the officer's appearance takes away from his/her command presence. -3
This document is a research report submitted to the U.S. Department of Justice. This report has not been published by the Department. Opinions or points of view expressed are those of the author(s)
and do not necessarily reflect the official position or policies of the U.S. Department of Justice.

NIJ Metric Development Final Report
08/27/12 156
Performance Statements Score
…the officer's attention is not distracted by trauma he/she has experienced in the encounter. 4
…the officer's emotional control contributes to his/her command presence. 5
…the officer's emotional control takes away from his/her command presence. -4
…the officer's last deadly force skills training other than marksmanship was 2 years ago. -4
…the officer's last deadly force skills training other than marksmanship was 3 years ago. -5
…the officer's last deadly force skills training other than marksmanship was 4 years ago. -5
…the officer's last deadly force skills training other than marksmanship was 5 or more years ago. -5
…the officer's last deadly force skills training other than marksmanship was during the last month. 4
…the officer's last deadly force skills training other than marksmanship was during the past 2-3 months. 3
…the officer's last deadly force skills training other than marksmanship was during the past 4-6 months. 2
…the officer's last deadly force skills training other than marksmanship was during the past 7-12 months. 1
…the officer's last marksmanship training was 2 years ago. -5
…the officer's last marksmanship training was 3 years ago. -5
…the officer's last marksmanship training was 4 years ago. -5.5
…the officer's last marksmanship training was 5 or more years ago. -6
…the officer's last marksmanship training was during the last month. 3
…the officer's last marksmanship training was during the past 2-3 months. 3
…the officer's last marksmanship training was during the past 4-6 months. 0
…the officer's last marksmanship training was during the past 7-12 months. -2
…the officer's level of physical fatigue due to 0-4 consecutive hours awake. 0
…the officer's level of physical fatigue due to 11-12 consecutive hours awake. -2
This document is a research report submitted to the U.S. Department of Justice. This report has not been published by the Department. Opinions or points of view expressed are those of the author(s)
and do not necessarily reflect the official position or policies of the U.S. Department of Justice.
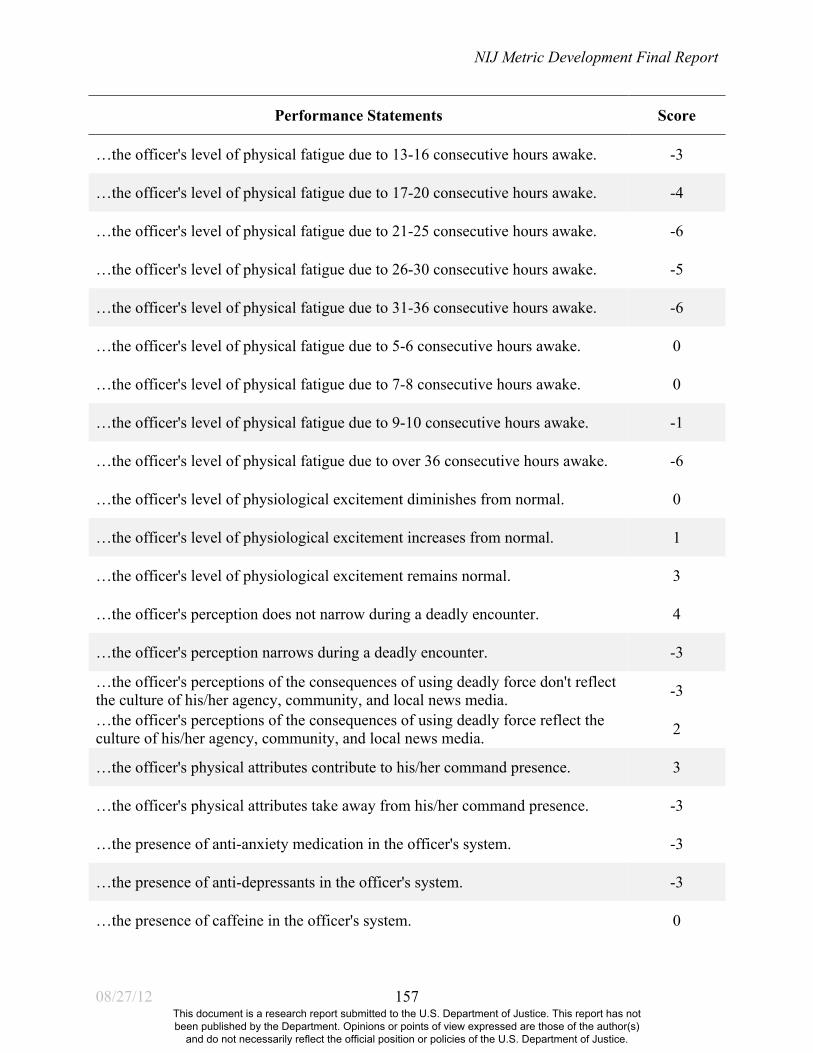
NIJ Metric Development Final Report
08/27/12 157
Performance Statements Score
…the officer's level of physical fatigue due to 13-16 consecutive hours awake. -3
…the officer's level of physical fatigue due to 17-20 consecutive hours awake. -4
…the officer's level of physical fatigue due to 21-25 consecutive hours awake. -6
…the officer's level of physical fatigue due to 26-30 consecutive hours awake. -5
…the officer's level of physical fatigue due to 31-36 consecutive hours awake. -6
…the officer's level of physical fatigue due to 5-6 consecutive hours awake. 0
…the officer's level of physical fatigue due to 7-8 consecutive hours awake. 0
…the officer's level of physical fatigue due to 9-10 consecutive hours awake. -1
…the officer's level of physical fatigue due to over 36 consecutive hours awake. -6
…the officer's level of physiological excitement diminishes from normal. 0
…the officer's level of physiological excitement increases from normal. 1
…the officer's level of physiological excitement remains normal. 3
…the officer's perception does not narrow during a deadly encounter. 4
…the officer's perception narrows during a deadly encounter. -3
…the officer's perceptions of the consequences of using deadly force don't reflect the culture of his/her agency, community, and local news media. -3
…the officer's perceptions of the consequences of using deadly force reflect the culture of his/her agency, community, and local news media. 2
…the officer's physical attributes contribute to his/her command presence. 3
…the officer's physical attributes take away from his/her command presence. -3
…the presence of anti-anxiety medication in the officer's system. -3
…the presence of anti-depressants in the officer's system. -3
…the presence of caffeine in the officer's system. 0
This document is a research report submitted to the U.S. Department of Justice. This report has not been published by the Department. Opinions or points of view expressed are those of the author(s)
and do not necessarily reflect the official position or policies of the U.S. Department of Justice.

NIJ Metric Development Final Report
08/27/12 158
Performance Statements Score
…the presence of cold-medication in the officer's system. -2
…the presence of steroids in the officer's system. -4
…the presence of stimulants other than caffeine in the officer's system. -4
…when possible, the officer assesses the situation fully before acting. 5
…when possible, the officer waits for backup before acting. 5
…whether the officer can effectively clear malfunctions under combat conditions. 4
…whether the officer effectively engaged multiple opponents. 4
This document is a research report submitted to the U.S. Department of Justice. This report has not been published by the Department. Opinions or points of view expressed are those of the author(s)
and do not necessarily reflect the official position or policies of the U.S. Department of Justice.

NIJ Metric Development Final Report
08/27/12 159
Appendix I: Handbook for Using the DFJDM Metrics
Steps involved in scoring data using the DFJDM metrics:
1. Examine the data for broad elements of difficulty and performance. This involves
determining data format (investigative written reports, video data of simulation trials
etc.), then going through the data and noting broad elements of difficulty (such as
whether variation exists in number of suspects, weapon types, distances from suspects,
types of threat, time of day, and suspect demographics) and performance (such as
whether variation exists in officer demographics, level of force used, communication
skills, spatial awareness, and tactics used).
2. Identify relevant difficulty and performance statements. This involves carefully going
through each difficulty statement and isolating the statements that are suitable for
scoring, keeping in mind the broad elements of difficulty and performance that are
apparent in the data (for example the difficulty statement “the officer encountered
precipitous terrain” is not suitable for scoring data gathered in a deadly force judgment
and decision-making simulator, and the performance statement “the officer made use of
available cover” is not suitable unless the individuals being scored had cover available).
3. Create a spreadsheet with each relevant difficulty statement and columns labeled “yes”
and “no.” When a set of suitable statements has been identified, go through the data
several times to ensure that each element of difficulty is rated. This involves checking
“yes” if the element of difficulty is observed and “no” if the element of difficulty is not
observed.
This document is a research report submitted to the U.S. Department of Justice. This report has not been published by the Department. Opinions or points of view expressed are those of the author(s)
and do not necessarily reflect the official position or policies of the U.S. Department of Justice.
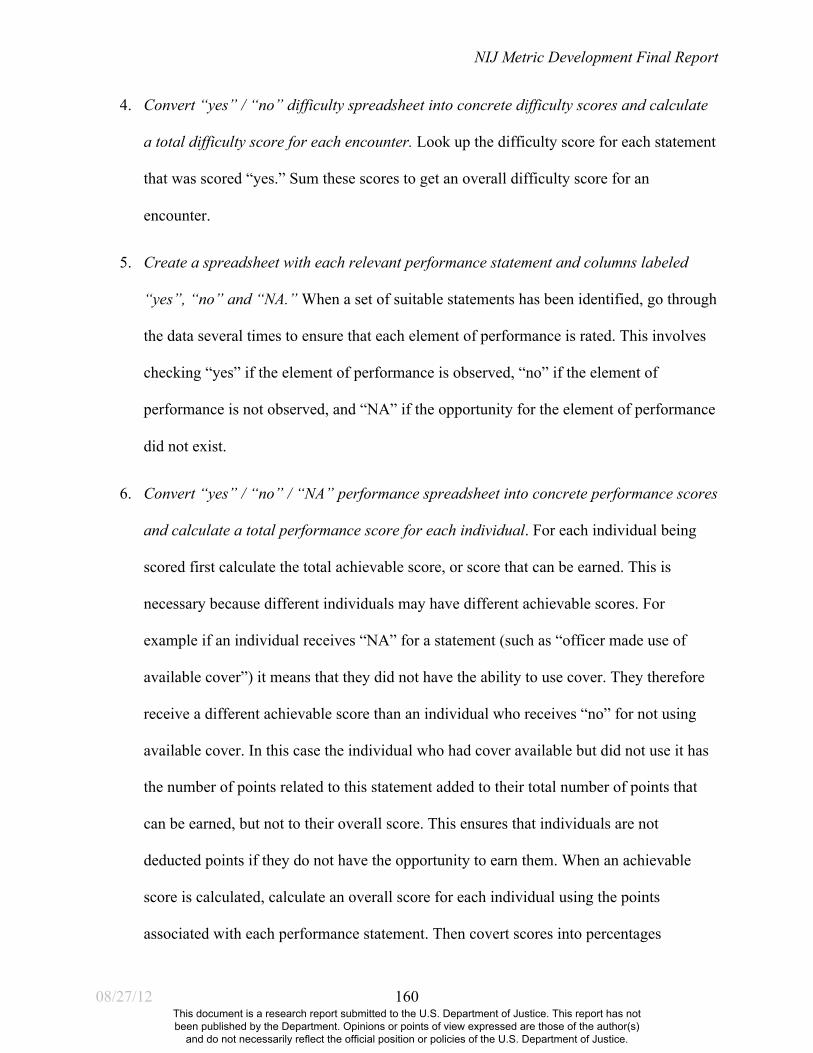
NIJ Metric Development Final Report
08/27/12 160
4. Convert “yes” / “no” difficulty spreadsheet into concrete difficulty scores and calculate
a total difficulty score for each encounter. Look up the difficulty score for each statement
that was scored “yes.” Sum these scores to get an overall difficulty score for an
encounter.
5. Create a spreadsheet with each relevant performance statement and columns labeled
“yes”, “no” and “NA.” When a set of suitable statements has been identified, go through
the data several times to ensure that each element of performance is rated. This involves
checking “yes” if the element of performance is observed, “no” if the element of
performance is not observed, and “NA” if the opportunity for the element of performance
did not exist.
6. Convert “yes” / “no” / “NA” performance spreadsheet into concrete performance scores
and calculate a total performance score for each individual. For each individual being
scored first calculate the total achievable score, or score that can be earned. This is
necessary because different individuals may have different achievable scores. For
example if an individual receives “NA” for a statement (such as “officer made use of
available cover”) it means that they did not have the ability to use cover. They therefore
receive a different achievable score than an individual who receives “no” for not using
available cover. In this case the individual who had cover available but did not use it has
the number of points related to this statement added to their total number of points that
can be earned, but not to their overall score. This ensures that individuals are not
deducted points if they do not have the opportunity to earn them. When an achievable
score is calculated, calculate an overall score for each individual using the points
associated with each performance statement. Then covert scores into percentages
This document is a research report submitted to the U.S. Department of Justice. This report has not been published by the Department. Opinions or points of view expressed are those of the author(s)
and do not necessarily reflect the official position or policies of the U.S. Department of Justice.

NIJ Metric Development Final Report
08/27/12 161
(percentage of an individual’s achievable scores that were gained) or ratios (of points
possible to points earned). It is recommended that percentages are used when all
performance statements are positive (add points to an overall performance score) and
ratios are used when performance statements are a mix of positive and negative (where
the presence of a statement takes away from an overall score, for example “the officer
failed to effectively clear a weapon malfunction”).
Check inter-rater and within-rater reliability. When all data is scored for difficulty and
performance, it is recommended that ten percent of the data is randomly re-scored. If major
differences are found, data should be re-scored. Scorers should ideally reach a consensus before
scoring takes place.
This document is a research report submitted to the U.S. Department of Justice. This report has not been published by the Department. Opinions or points of view expressed are those of the author(s)
and do not necessarily reflect the official position or policies of the U.S. Department of Justice.

NIJ Metric Development Final Report
08/27/12 162
Appendix J: NACJD Data Deposit Online Transaction
The following is a copy of the e-mail transactions through which data from this project
were deposited in the National Archive of Criminal Justice Data at the University of Michigan
(in order to save space, font sizes have been standardized, some paragraph and line spacing has
been reduced, and some line feeds have been removed):
Sent: Wednesday, December 21, 2011 2:49 PM
To: James, Stephen Michael
Subject: RE: Data for NIJ Grant 2008-IJ-CX-0015
Hi Steve,
Thank you for your responses and the additional files. I’m going to be out of the office until the new year but I’m going to review these files in more detail when I’m back in the office in early January. Specifically, I’m going to review the demographic variables more closely. We may ask that you provide us with a resupply of the data that includes the demographic variables that were removed. I recognize that these variables were removed because they contain identifiable information, however as long as they are indirect identifiers and not direct identifiers we usually permanently preserve that data. We’ll then either mask sensitive variables completely or only make them available through restricted access procedures. Either way, I’ll follow up in early January and let you know.
Thanks,
Justin
Justin Noble, Research Technician Lead National Archive of Criminal Justice Data Inter-university Consortium for Political and Social Research University of Michigan 330 Packard St. Ann Arbor, MI 48104
734.615.7678
From: James, Stephen Michael [mailto:[email protected]]
Sent: Wednesday, December 21, 2011 5:28 PM
To: Justin Noble
Cc: Vila, Bryan
This document is a research report submitted to the U.S. Department of Justice. This report has not been published by the Department. Opinions or points of view expressed are those of the author(s)
and do not necessarily reflect the official position or policies of the U.S. Department of Justice.

NIJ Metric Development Final Report
08/27/12 163
Subject: RE: Data for NIJ Grant 2008-IJ-CX-0015
Some files have been sent to you via the YouSendIt File Delivery Service.
Download the file - Vila_NIJ_Metirc_Data_Dic_2011-12-21.spv; NIJ_Metric_Dd.pdf; NIJ_Metric_Dc.pdf; NIJ_Metric_Db.pdf; NIJ_Metric_Da.pdf; NIJ_Metric_Pd.pdf; NIJ_Metric_Pc.pdf; NIJ_Metric_Pb.pdf; NIJ_Metric_Pa.pdf; NIJ_Metric_Demo.pdf; Vila_NIJ_DF_Metric_2011_12_21.sav
Your files will expire after 14 days or 500 downloads.
Please see below…
Stephen James MA SHOT Laboratory Sleep & Performance Research Center and Department of Criminal Justice and Criminology Washington State University – Spokane Office: (509) 358-7571 Cell: (509) 385-9385
"Education is an admirable thing, but it is well to remember from time to time that nothing that is worth knowing can be taught. " Oscar Wilde
From: Justin Noble [mailto:[email protected]]
Sent: Wednesday, December 21, 2011 1:39 PM
To: James, Stephen Michael
Subject: RE: Data for NIJ Grant 2008-IJ-CX-0015
Hi Steve,
Thank you for your prompt reply and for the draft final report.
The draft report contains “Appendix E: List of operationalized difficulty and performance statements”. Can you please provide the original data collection instruments that correspond to the set, page, and order information listed in Appendix E? For the data collection instruments, PDF files are preferred; Word, RTF, or ASCII file formats are acceptable. It looks like you used survey monkey, so screen shots would also be acceptable.
If available, we’d also like to archive and disseminate the original data collection instruments that correspond to the demographic variables in the dataset…
I removed many of the fields used in the original demographic data collection
This document is a research report submitted to the U.S. Department of Justice. This report has not been published by the Department. Opinions or points of view expressed are those of the author(s)
and do not necessarily reflect the official position or policies of the U.S. Department of Justice.

NIJ Metric Development Final Report
08/27/12 164
instrument as the results could be used to identify the officers in the study.
In regards to a codebook, we don’t have a particular template. The submission guidelines for depositing quantitative data for NIJ research (http://www.icpsr.umich.edu/files/NACJD/pdf/quantitative-data-nij.pdf) state that the codebook or data dictionary should be computer-readable and meet the following specifications:
• PDF or SPSS output files preferred; Word, RTF, or ASCII files are acceptable.
• Include variable labels, value labels, and/or missing value declarations.
• Include information on linking variables.
See attached.
Lastly, I noticed that there were a few undocumented codes in the dataset. Can you please provide variable labels to add to the 9999, -1, and -7 codes in the data that do not currently have value labels assigned to them. These codes appear in multiple variables. For example, 9999 is in Da01, Da02, etc.; -1 is in Da21, Da22, etc.; and -7 is in Pb21, Pb22, etc.
9999 is the missing value code – they did not rate that section.
-1 and -7 means the subject did not rate the statement.
I have updated the labels in the SPSS File Attached.
Please let me know if you have any questions.
Thanks,
Justin
Justin Noble, Research Technician Lead National Archive of Criminal Justice Data Inter-university Consortium for Political and Social Research University of Michigan 330 Packard St. Ann Arbor, MI 48104 734.615.7678
From: James, Stephen Michael [mailto:[email protected]]
Sent: Wednesday, December 21, 2011 3:28 PM
To: Justin Noble
Subject: FW: Data for NIJ Grant 2008-IJ-CX-0015
Justin,
This document is a research report submitted to the U.S. Department of Justice. This report has not been published by the Department. Opinions or points of view expressed are those of the author(s)
and do not necessarily reflect the official position or policies of the U.S. Department of Justice.

NIJ Metric Development Final Report
08/27/12 165
Attached is the DRAFT Final Report.
Do you have a template for the codebook you would like me to use?
Kind Regards,
Steve
Stephen James MA SHOT Laboratory Sleep & Performance Research Center and Department of Criminal Justice and Criminology Washington State University – Spokane Office: (509) 358-7571 Cell: (509) 385-9385 "Education is an admirable thing, but it is well to remember from time to time that nothing that is worth knowing can be taught. " Oscar Wilde
From: Vila, Bryan
Sent: Wednesday, December 21, 2011 11:38 AM
To: James, Stephen Michael
Subject: FW: Data for NIJ Grant 2008-IJ-CX-0015
Steve,
Can you plz handle this? If there are any problems, we can put it on hold until tomorrow as Lois and I are doing budget stuff today.
Thank you!
Bryan
Bryan Vila, Ph.D. Professor of Criminal Justice and Criminology Simulated Hazardous Operational Tasks Lab Sleep & Performance Research Center Washington State University – Spokane P.O. Box 1495 Spokane, WA 99210-1495 v: +1-509-358-7711 e: [email protected] http://spokane.wsu.edu/academics/CrimJ/crimj_vila.html www.micronesianblues.com
This document is a research report submitted to the U.S. Department of Justice. This report has not been published by the Department. Opinions or points of view expressed are those of the author(s)
and do not necessarily reflect the official position or policies of the U.S. Department of Justice.

NIJ Metric Development Final Report
08/27/12 166
From: Justin Noble <[email protected]>
Date: Wed, 21 Dec 2011 13:47:30 -0500
To: Bryan Vila <[email protected]>
Subject: Data for NIJ Grant 2008-IJ-CX-0015
Dear Dr. Vila,
Thank you for submitting files from your grant on a “Developing a Common Metric for Evaluating Police Performance in Deadly Force Situations” that were deposited on December 17, 2011 via ICPSR Deposit 28386. I’m in the process of reviewing the materials that were submitted and noticed that the final report for this project was not included in the original submission. Accordingly, can you please email me the full NIJ final report with appendices. The report won’t be disseminated by ICPSR; it is used by us for internal purposes so a draft version of the final report is acceptable if it is still under review at NIJ.
Additionally, it doesn’t appear that a codebook or data collection instrument(s) (e.g. scoring forms) were submitted that correspond to the SPSS data file (Vila_NIJ_DF_Metric_2011_12_06.sav). If this type of documentation is available, can you also please email it to me. Please let me know if you have any questions. Happy holidays!
Regards,
Justin Justin Noble, Research Technician Lead National Archive of Criminal Justice Data Inter-university Consortium for Political and Social Research University of Michigan 330 Packard St., Ann Arbor, MI 48104 734.615.7678
[END E-MAIL TRANSACTION TRANSCRIPT]
This document is a research report submitted to the U.S. Department of Justice. This report has not been published by the Department. Opinions or points of view expressed are those of the author(s)
and do not necessarily reflect the official position or policies of the U.S. Department of Justice.