Embed Size (px)
Citation preview

Final Report Study Title PFH Ammonium Salt: Fish, Early Life Stage Toxicity
Test to Oncorhynchus mykiss (Rainbow Trout)
Study Guideline OPPTS Biological Effects Test Guidelines 850.1400 Fish Early-Life Stage Toxicity Test
Authors
Sponsor Planning Dept. Chemical Division Daikin Industries, LTD. Umeda Center Bldg., 2-4-12, Nakazaki-Nishi Kita-Ku, Osaka, 530-8323 Japan
Study Monitor
Test Facility Covance Laboratories Ltd Otley Road, Harrogate North Yorkshire HG3 1PY UNITED KINGDOM
Study Number 2901/001
Covance Report Number
2901/001-D2149
Report issued August 2008
Page Number 1 of 64
All procedures to be carried out on live animals as part of this study will be subject to the provisions of United Kingdom National Law, in particular the Animals (Scientific Procedures) Act 1986, to ensure that minimum suffering and distress is caused to animals on study.


Covance Study Number 2901/001
Final Report
- 5 -
RESPONSIBLE PERSONNEL
PFH Ammonium Salt: Fish, Early Life Stage Toxicity Test to Oncorhynchus mykiss (Rainbow Trout)
The following personnel were responsible for key elements of the study:
STUDY MANAGEMENT NAME Study Director (from 20 May 2008 to present) Study Director (from 1 November 2008 to 20 May 2008) Scientific Reviewer Study Co-ordinator
OPERATIONAL SUPERVISION Biology Chemistry Named Veterinary Surgeon Named Animal Care Welfare Officer
QUALITY ASSURANCE Director, Quality Systems

Covance Study Number 2901/001
Final Report
- 6 -
ARCHIVE STATEMENT
PFH Ammonium Salt: Fish, Early Life Stage Toxicity Test to Oncorhynchus mykiss (Rainbow Trout)
All primary data (including electronic data), or authenticated copies thereof, specimens and the final report will be retained using appropriate storage media in the Covance Laboratories Limited archives for one year after issue of the final report. At this time the Sponsor will be contacted to determine whether the data should be returned, retained or destroyed on their behalf. Sponsors will be notified of the financial implications of each of these options at that time.

Covance Study Number 2901/001
Final Report
- 7 -
CONTENTS
STUDY DIRECTOR AUTHENTICATION AND GLP COMPLIANCE STATEMENT ...................... 2
QUALITY ASSURANCE STATEMENT............................................................................................... 3
REVIEWING AND RESPONSIBLE SCIENTISTS’ STATEMENTS ................................................... 4
RESPONSIBLE PERSONNEL ............................................................................................................... 5
ARCHIVE STATEMENT ....................................................................................................................... 6
CONTENTS............................................................................................................................................. 7
SUMMARY ............................................................................................................................................. 9
INTRODUCTION.................................................................................................................................. 10
MATERIALS AND METHODS ........................................................................................................... 11 Protocol Adherence......................................................................................................................... 11 Test Substance................................................................................................................................. 11 Test Organism ................................................................................................................................. 11 Preparation of Test Media ............................................................................................................... 11 Appearance of Test Media .............................................................................................................. 12 Test Procedures ............................................................................................................................... 12 Egg Fertilization, Addition and Observations ................................................................................. 13 Test Medium Renewal Procedure ................................................................................................... 14 Feeding............................................................................................................................................ 14 Water Quality and Environmental Conditions ................................................................................ 14 Statistical Analysis .......................................................................................................................... 15 Chemical Analysis of PFH Ammonium Salt in Test Media............................................................ 15 Validity Criteria .............................................................................................................................. 16
RESULTS .............................................................................................................................................. 17 Test Organism ................................................................................................................................. 17 Chemical Analysis of PFH Ammonium Salt in Test Media............................................................ 17 Appearance of Stock and Test Media.............................................................................................. 17 Hatching Success ............................................................................................................................ 17 Survival ........................................................................................................................................... 17 Fish Total Lengths and Dry Weights .............................................................................................. 18 Abnormalities.................................................................................................................................. 18 Water Quality and Environmental Conditions ................................................................................ 18
CONCLUSIONS.................................................................................................................................... 19
REFERENCES....................................................................................................................................... 20
TABLES................................................................................................................................................. 21 Table 1 PFH Ammonium Salt (expressed as mg/L of the active moiety) in concentrated stock media during the fish early-life stage test with Oncorhyncus mykiss.............................................. 22 Table 2 PFH Ammonium Salt (expressed as mg/L of the active moiety) in test media during the fish early-life stage test with Oncorhyncus mykiss.................................................................... 23 Table 3 Hatching success and fish larval survival during the fish early-life stage test ................... 24 Table 4 Post-hatch observed larval fish mortality during the fish early-life stage test.................... 25 Table 5 Total Length of Fish (cm) at the End of the Fish, Early-life Stage Test - 28 Days Post-Hatch ............................................................................................................................................... 27

Covance Study Number 2901/001
Final Report
- 8 -
Table 6 Dry Weights of Fish (g) at the End of the Fish, Early-life Stage Test - 28 Days Post-Hatch ............................................................................................................................................... 29 Table 7 Temperature (°C) Measurements during the Fish, Early Life Stage Test .......................... 33 Table 8 pH Measurements during the Fish, Early Life Stage Test.................................................. 34 Table 9 Dissolved Oxygen (% ASV) Measurements during the Fish, Early Life Stage Test ......... 36 Table 10 Dissolved Oxygen (mg/L) Measurements during the Fish, Early Life Stage Test ........... 38 Table 11 Water Hardness and Residual Chlorine Measurements in Dilution Water during the Fish, Early Life Stage Test.............................................................................................................. 40
FIGURES ............................................................................................................................................... 41 Figure 1 Chromatogram of a 0.02 µg/mL Standard Solution of Perfluorohexanoic acid in hplc mobile phase (Internal Standard of Perfluoroheptanoic acid at 0.01 µg/mL).......................... 42 Figure 2 Chromatogram of a 0.0002 µg/mL Standard Solution of Perfluorohexanoic acid in HPLC mobile phase (Internal Standard of Perfluoroheptanoic acid at 0.01 µg/mL) ...................... 42 Figure 3 Chromatogram of a Control Test Water Sample at Day 0.) (Dilution factor = 10).......... 43 Figure 4 Chromatogram of a 0.2 mg/L Test Water Sample at Day 0 (Dilution factor = 10) .......... 43 Figure 5 Chromatogram of a 21 mg/L Test Water Sample at Day 0 (Dilution factor = 1000) ....... 44 Figure 6 Chromatogram of a 0.2 mg/L Test Water Sample at Day 1 (Dilution factor = 100) ........ 44 Figure 7 Chromatogram of a 21 mg/L Test Water Sample at Day 1 (Dilution factor =1000) ........ 45 Figure 8 Chromatogram of a 0.2 mg/L Test Water Sample at Day -1 Post Hatch (Dilution factor = 100).................................................................................................................................... 45 Figure 9 Chromatogram of a 21 mg/L Test Water Sample at Day -1 Post Hatch (Dilution factor = 1000).................................................................................................................................. 46 Figure 10 Chromatogram of a 0.2 mg/L Test Water Sample at Day 0 Post Hatch (Dilution factor = 100).................................................................................................................................... 46 Figure 11 Chromatogram of a 21 mg/L Test Water Sample at Day 0 Post Hatch (Dilution factor = 1000).................................................................................................................................. 47 Figure 12 Chromatogram of a Control Test Water Sample at Day 28 Post Hatch (Dilution factor = 100).................................................................................................................................... 47 Figure 13 Chromatogram of a 0.2 mg/L Test Water Sample at Day 28 Post Hatch (Dilution factor = 100).................................................................................................................................... 48 Figure 14 Chromatogram of a 21 mg/L Test Water Sample at Day 28 Post Hatch (Dilution factor = 1000).................................................................................................................................. 48 Figure 15 Chromatogram of a New 3.2 mg/L Stock Solution at Day 0 (Dilution factor = 200) .... 49 Figure 16 Chromatogram of a New 356 mg/L Stock Solution at Day 0 (Dilution factor = 20000) ............................................................................................................................................. 49 Figure 17 Chromatogram of an Old 3.2 mg/L Stock Solution at Day 4 (Dilution factor = 200) ... 50 Figure 18 Chromatogram of an Old 356 mg/L Stock Solution at Day 4 (Dilution factor = 20000) ............................................................................................................................................. 50 Figure 19 Typical Calibration Line for Perfluorohexanoic Acid over the range of 0.0002 to 0.02 µg/mL...................................................................................................................................... 51
APPENDICES........................................................................................................................................ 52 Appendix 1 Typical Water Characteristics...................................................................................... 53 Appendix 2 Analytical Procedure ................................................................................................... 55 Appendix 3 Statistical Analysis ...................................................................................................... 62 Appendix 4 Protocol Deviations ..................................................................................................... 64

Covance Study Number 2901/001
Final Report
- 9 -
SUMMARY
Introduction The objective of the study was to establish the effect of PFH Ammonium Salt on the growth and development of embryos and larvae of the freshwater fish species Oncorhynchus mykiss (Rainbow trout) in a Fish Early-Life Stage (ELS) Toxicity Test. The study was performed in accordance with the OPPTS Biological Effect Test Guideline No. 850.1400, Fish Early-Life Stage Toxicity Test (1996).
Toxicity was determined in terms of the active moiety as the salt does not exist in aquatic environments. The test was conducted at nominal concentrations of 0.095, 0.304, 0.972, 3.11 and 9.96 mg/L active moiety, equivalent to 0.2, 0.641, 2.05, 6.56 and 21.0 mg/L in terms of PFH ammonium salt with a purity of 50% and conversion factor of 1.054. These concentrations were based on the results of an acute toxicity test. Both solvent and dilution water controls were included in the test design, with duplicate test vessels at all exposure concentrations including the controls.
The test was conducted with a flow through test design.
Concentrated stock solutions and test media were analysed during the ELS test. Measured concentrations of PFH active moiety in the concentrated stock solutions ranged between 98 and 100% of the nominal concentrations, test media concentrations ranged between 94 and 108% of nominal corresponding to geometric mean measured concentrations of 0.103, 0.310, 0.916, 3.14 and 10.1 mg/L.
Hatching success in the control group was 74%, satisfying the validation criterion for hatching success (>66%). The NOEC and LOEC for hatching success were determined as 9.96 and >9.96 mg/L, respectively.
Larval survival until Day 28 post-hatch in the control group was 93% thereby exceeding and satisfying the validity criteria for post-hatch survival (70%). Post-hatch survival across all remaining treatments ranged between 96 and 100%. In terms of nominal concentrations, the NOEC and LOEC for post-hatch larval survival until Day 28 were both considered to be equal to or greater than 9.96 mg/L.
For fish total lengths, the NOEC and LOEC determined on Day 28 post-hatch were 9.96 and >9.96 mg/L PFH active moiety, respectively.
For fish dry weights, the NOEC and LOEC determined on Day 28 post-hatch were 9.96 and >9.96 mg/L PFH active moiety, respectively.
All validity criteria were satisfied during the test, therefore the test was considered to be valid.

Covance Study Number 2901/001
Final Report
- 10 -
INTRODUCTION
The objective of the study was to establish the effect of PFH Ammonium Salt on growth and development of embryos and larvae of the freshwater fish species, Oncorhynchus mykiss (Rainbow trout), in a Fish Early-Life Stage Toxicity Test (ELS).
The study was conducted in accordance with the requirements of OPPTS Biological Effects Test Guideline 850.1400, Fish Early-Life Stage Toxicity Test.
PFH ammonium salt is an ammonium salt of perfluorohexanoic acid, that dissociates (ca 100%) to the active moiety on contact with water. The conversion factor between the salt and active moiety is 1.054, therefore 105 mg/L PFH ammonium salt is equivalent to 100 mg of the active moiety. Toxicity in this ELS test was determined in terms of the active moiety as the salt does not exist in aquatic environments.
The study was initiated (protocol issued) on 1 November 2007. Study completion is defined as the date of signing of the final report by the Study Director.
The experimental work (in-life and chemical analysis) was conducted between 18 February 2008 and 19 May 2008. The study was conducted in the Department of Environmental Sciences, Covance Laboratories Ltd., Harrogate, North Yorkshire, United Kingdom.

Covance Study Number 2901/001
Final Report
- 11 -
MATERIALS AND METHODS
Protocol Adherence The study was conducted in accordance with the agreed definitive protocol and three protocol amendments. Minor deviations that do not affect the integrity of the study are presented in Appendix 4.
Test Substance Test substance name PFH Ammonium Salt Sponsor batch number Lot 7001 Description Clear liquid Purity 50% solution Storage Refrigerated (1-10°C) in the dark Expiry date 3 June 2009 Date received 4 November 2007
Test substance details were supplied by the Sponsor.
Test Organism The Rainbow trout (Oncorhynchus mykiss) eggs and milt used in this study were supplied by a recognised external supplier. Supplier details are maintained in the study raw data.
At the start of the test, approximately 40 fertilised eggs were added randomly to each test vessel, divided equally between two incubation chambers per vessel. The fertilised eggs were less than 24 hours old on addition to the test system.
Egg addition was achieved by careful addition of the required number of eggs directly to the incubation chambers as soon as possible after receipt to avoid handling stress. The test started after the final batch of eggs had been added to the last incubation chamber.
Preparation of Test Media The dilution water used for conducting the definitive test was dechlorinated mains water that had been passed through particulate and activated charcoal filters and treated with ozone (O3) to remove residual algal cells and fungal spores for improved water quality. The typical constituents of dilution water are presented in Appendix 1.
The definitive test was conducted at nominal concentrations of 0.095, 0.304, 0.972, 3.11 and 9.96 mg/L PFH active moiety (equivalent to 0.2, 0.641, 2.05, 6.56 and 21.0 mg/L in terms of PFH ammonium salt with a purity of 50% and conversion factor of 1.054).
Concentrated aqueous stocks were prepared by direct addition of ca 48, 154, 492, 1574 and 5040 mg and made to a final volume of 15 L with treated mains water at each treatment level.
Covance Study Number 2901/001
Final Report
- 12 -
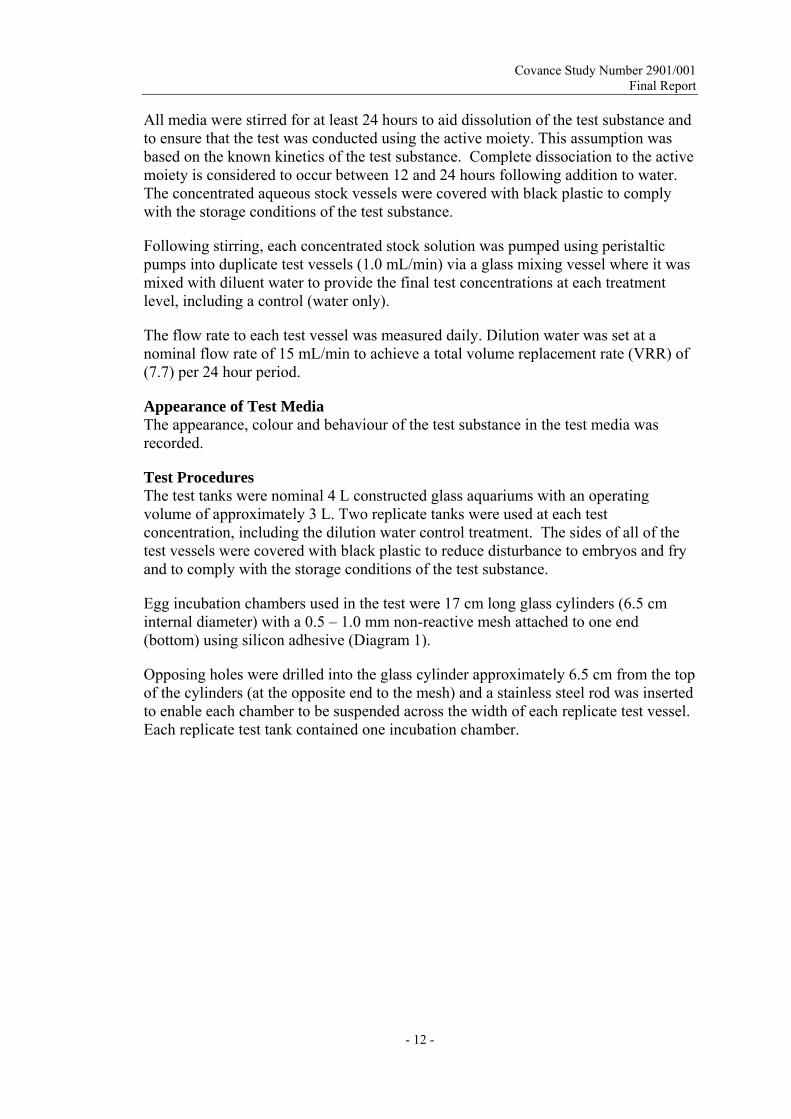
All media were stirred for at least 24 hours to aid dissolution of the test substance and to ensure that the test was conducted using the active moiety. This assumption was based on the known kinetics of the test substance. Complete dissociation to the active moiety is considered to occur between 12 and 24 hours following addition to water. The concentrated aqueous stock vessels were covered with black plastic to comply with the storage conditions of the test substance.
Following stirring, each concentrated stock solution was pumped using peristaltic pumps into duplicate test vessels (1.0 mL/min) via a glass mixing vessel where it was mixed with diluent water to provide the final test concentrations at each treatment level, including a control (water only).
The flow rate to each test vessel was measured daily. Dilution water was set at a nominal flow rate of 15 mL/min to achieve a total volume replacement rate (VRR) of (7.7) per 24 hour period.
Appearance of Test Media The appearance, colour and behaviour of the test substance in the test media was recorded.
Test Procedures The test tanks were nominal 4 L constructed glass aquariums with an operating volume of approximately 3 L. Two replicate tanks were used at each test concentration, including the dilution water control treatment. The sides of all of the test vessels were covered with black plastic to reduce disturbance to embryos and fry and to comply with the storage conditions of the test substance.
Egg incubation chambers used in the test were 17 cm long glass cylinders (6.5 cm internal diameter) with a 0.5 – 1.0 mm non-reactive mesh attached to one end (bottom) using silicon adhesive (Diagram 1).
Opposing holes were drilled into the glass cylinder approximately 6.5 cm from the top of the cylinders (at the opposite end to the mesh) and a stainless steel rod was inserted to enable each chamber to be suspended across the width of each replicate test vessel. Each replicate test tank contained one incubation chamber.


Covance Study Number 2901/001
Final Report
- 14 -
At the start of the post-hatch phase (>90% hatching in the control, equal to 28 days after fertilisation) an estimate of hatching success was determined.
On Day 28 of the post-hatch phase, hatching success was further confirmed by definitive counts of all surviving fish. These counts, for each vessel, were then corrected for larvae lost during the post-hatch phase. Discrepancies between the corrected hatched larvae counts and the number of eggs added to each chamber were considered to be due to losses during the pre-hatch phase.
On Day 28, the total numbers of surviving larvae were counted and individual total fish lengths and dry weights of all remaining fish were determined.
The percentage post-hatch survival was determined by expressing the number of surviving larvae on Day 28 post-hatch as a percentage of the hatched larvae at Day 0 (post-hatch).
Test Medium Renewal Procedure The test was conducted with continuous renewal of the test media (flow through).
Individual concentrated stock solutions were prepared for each treatment level. Following preparation each bulk test medium was pumped, using a peristaltic pump, at a rate of 1 mL/minute into a mixing vessel. Dilution water (treated mains water) was pumped at a rate of 15 mL/minute into each mixing vessel. The test medium and dilution water were mixed using a magnetic stirrer and then continually added to the appropriate test vessels.
Feeding The developing larvae were fed using Nutrafry trout feed. Between days 10 and 13 a 40 g/L solution of ground Nutrafry 01 in treated mains water was added drop-wise to the test vessels. From day 14 onwards the fish were fed with Nutrafry 00 ad libitum, in excess, three times per day.
Surplus feed and faecal material were siphoned from the test vessel on (at least) daily intervals during the test.
Water Quality and Environmental Conditions Water temperatures (°C) were measured in freshly prepared and old test media on each test media renewal occasion and were monitored continuously in two vessels (V1 (control) and V12 (nominal 21 mg/L)) using minimum / maximum digital thermometers. Temperature ranges in vessels V1 and V12 were 11.6 to 12.6°C and 11.7 to 12.9°C, respectively, over the duration of the test.
The test was conducted in a light-controlled facility, with a 16-hour photoperiod.
The pH and dissolved oxygen concentration, expressed as a percentage of the air saturation value (% ASV) and as mg/L O2, were measured in freshly prepared and old test media at each renewal. In addition, the total hardness (mg/L CaCO3) and residual chlorine were measured in fresh control media at the start of the test and at each renewal.

Covance Study Number 2901/001
Final Report
- 15 -
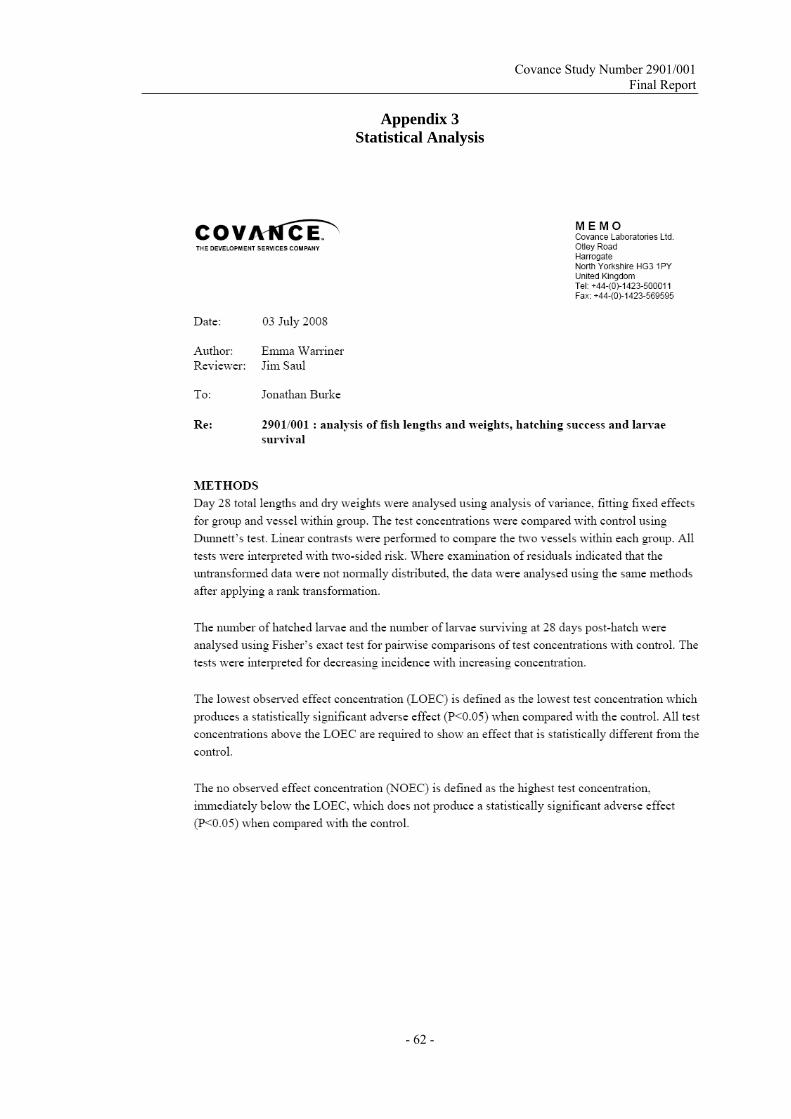
Statistical Analysis The statistical analysis results are presented in Appendix 3.
Day 28 total lengths and dry weights were analysed using analysis of variance, fitting fixed effects for group and vessel within group. The test concentrations were compared with the water control using Dunnett's test. Linear contrasts were performed to compare the two vessels within each group. All tests were interpreted with two-sided risk.
The number of hatched larvae and hatched larvae surviving at Day 28 post-hatch were analysed using a Fisher's exact test for pairwise comparisons of test concentrations with the control. The tests were interpreted for decreasing incidence with increasing concentration.
The Lowest Observed Effect Concentration (LOEC) is defined as the lowest test concentration, which produces a statistically significant adverse effect (P<0.05) when compared with the control(s). All test concentrations above the LOEC were required to show an effect that is statistically different from the control.
The No Observed Effect Concentration (NOEC) is defined as the highest test concentration, immediately below the LOEC, which does not produce a statistically significant adverse effect (P<0.05) when compared with control(s).
Chemical Analysis of PFH Ammonium Salt in Test Media The Analytical Procedure CLE (E) 2901-001-01V, used to confirm the concentration PFH Ammonium Salt (as the active moiety) in samples of test media during this test is presented in Appendix 2.
Concentrations of PFH Ammonium Salt in fish dilution water were determined LC-MS/MS.
Samples of fresh and expired media were taken at least weekly for analytical determination.
Duplicate samples (20 mL) of test media from each of the test and control vessels were taken for analysis on days 0, 1, 8, 14, 22 and 28 during the pre-hatch period, and on days 0, 7, 11, 14, 17, 21, 27 and 28 during the post-hatch period.
Samples of freshly prepared concentrated aqueous stock solutions were taken for analysis at -24 hours, Day 0, 4, 8, 12, 16, 20, 24 and 28 pre-hatch and on Day 3, 7, 11, 14, 15, 19, 23 and 27 during the post-hatch period.
Samples of expired concentrated aqueous stock solutions were taken for analysis on Day 4, 8, 12, 16, 20, 24 and 28 pre-hatch and on Day 3, 7, 11, 19, 23 and 27 during the post-hatch period.
Throughout the results, some numerical data may have been rounded for presentation purposes. Therefore, manual recalculation of the data may result in slightly different values to those shown.

Covance Study Number 2901/001
Final Report
- 16 -
Validity Criteria The criteria for test validity were as follows:
− the dissolved oxygen concentration must be maintained above 60% of the air saturation value,
− the water temperature must not differ by more than 1.5°C between test chambers or successive days at any time during the test,
− hatching success in the control treatments must be > 66%,
− post-hatch survival of fish larvae in the control treatments must be > 70%.

Covance Study Number 2901/001
Final Report
- 17 -
RESULTS
Test Organism Eggs were fertilised and added to test vessels within 30 minutes of arrival at the laboratory.
Chemical Analysis of PFH Ammonium Salt in Test Media The results of the chemical analysis for PFH Ammonium Salt (as the active moiety) in samples of aqueous stock and test media taken during the test are presented in Table 1 and 2
Example chromatograms for fresh and expired aqueous stock and test media prepared are presented in Figure 4 to Figure 18.
The overall geometric mean measured concentrations of PFH active moiety in samples of test media were 0.103, 0.310, 0.916, 3.14 and 10.1 mg/L. These concentrations corresponded to between 94 and 108% of the nominal concentrations.
The limit of detection for PFH Ammonium Salt (as the active moiety) was 0.012 µg/mL.
Appearance of Stock and Test Media On preparation the stock and test media appeared as colourless solutions.
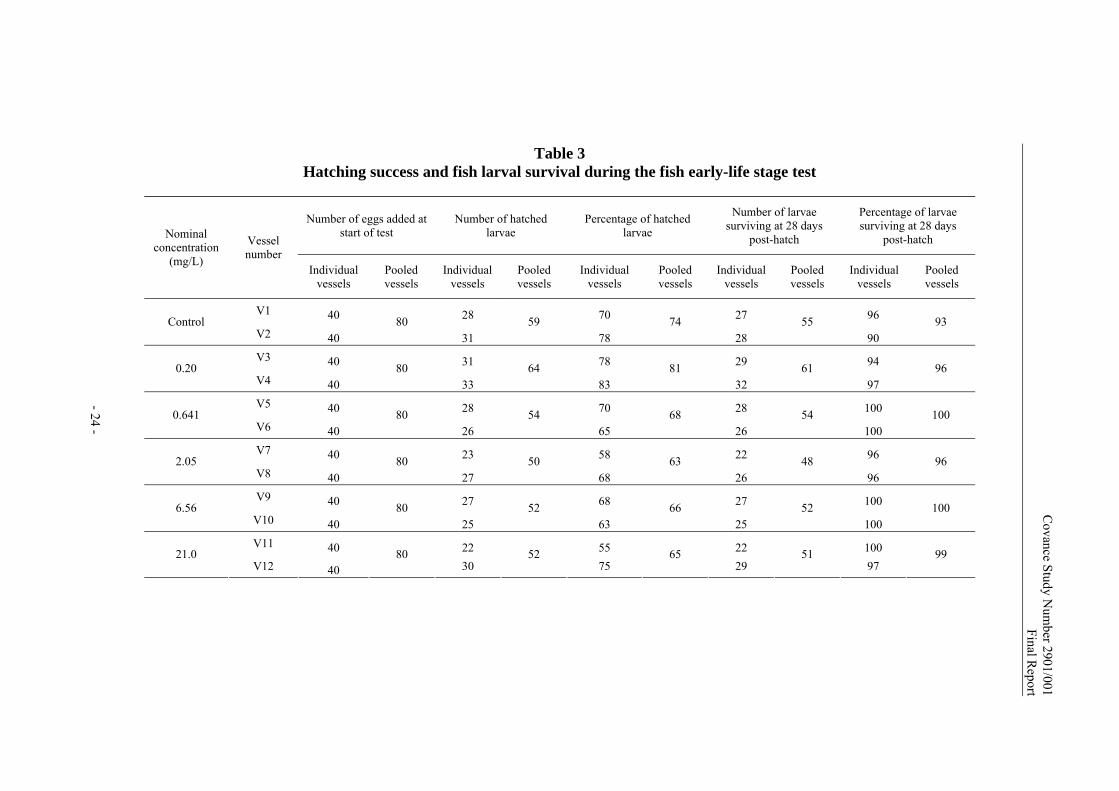
Hatching Success The results of hatching success and fish larval survival are presented in Table 3.
Hatching success in the control group was 74%. As this exceeded 66%, the validity criterion for hatching success was satisfied.
First egg hatch in treatment and control vessels occurred in the 24-hour period between the Day 25 and Day 26 pre-hatch observation timepoints. This indicated no difference in time to first hatch across all treatments when compared to the control group.
NOEC and LOEC were determined as nominal concentrations of 9.96 and >9.96 mg/L as PFH active moiety.
Survival Post-hatch larval survival results are presented in Table 3.
Larval survival until Day 28 post-hatch in the control group was 93%. As this exceeded 70%, the validity criterion for larval survival was satisfied.
Post-hatch larval survival across all remaining treatments ranged between 96 and 100%.
In terms of measured concentrations, the NOEC and LOEC for post-hatch larval survival until Day 28 were both considered to be equal to or greater than 10.1 mg/L (highest mean measured concentration).

Covance Study Number 2901/001
Final Report
- 18 -
Fish Total Lengths and Dry Weights Fish total lengths and dry weights are presented in Table 5 and Table 6.
The NOEC and LOEC for both total fish length and fish weight were determined on Day 28 post-hatch and were considered to be 9.96 and >9.96 mg/L respectively.
Abnormalities There were no dose related abnormalities recorded during the test.
Water Quality and Environmental Conditions Results of water quality determinations during the fish early-life stage test are shown in Table 7 to Table 11.
All water quality parameters were within the specified ranges stated in the Guidelines.

Covance Study Number 2901/001
Final Report
- 19 -
CONCLUSIONS
The toxicity of PFH Ammonium Salt to fish embryos and hatched fish larvae was determined.
Hatching Success Hatching success in the control group was 74%, satisfying the validity criterion for hatching success (>66%). The NOEC and LOEC were determined as 9.96 and >9.96 mg/L, respectively.
Survival Larval survival until Day 28 post-hatch in the control group exceeded 70% (93%), satisfying the validity criterion for post-hatch survival.
In terms of nominal concentrations, the NOEC and LOEC for post-hatch survival until Day 28 were 9.96 and >9.96 mg/L, respectively.
Fish Total Lengths and Dry Weights For both fish total lengths and dry weights, the NOEC and LOEC determined on Day 28 post-hatch were 9.96 and >9.96 mg/L, respectively.
Validity Criteria All validity criteria were satisfied during the test, therefore the test was considered to be valid.
Covance Study Number 2901/001
Final Report
- 20 -
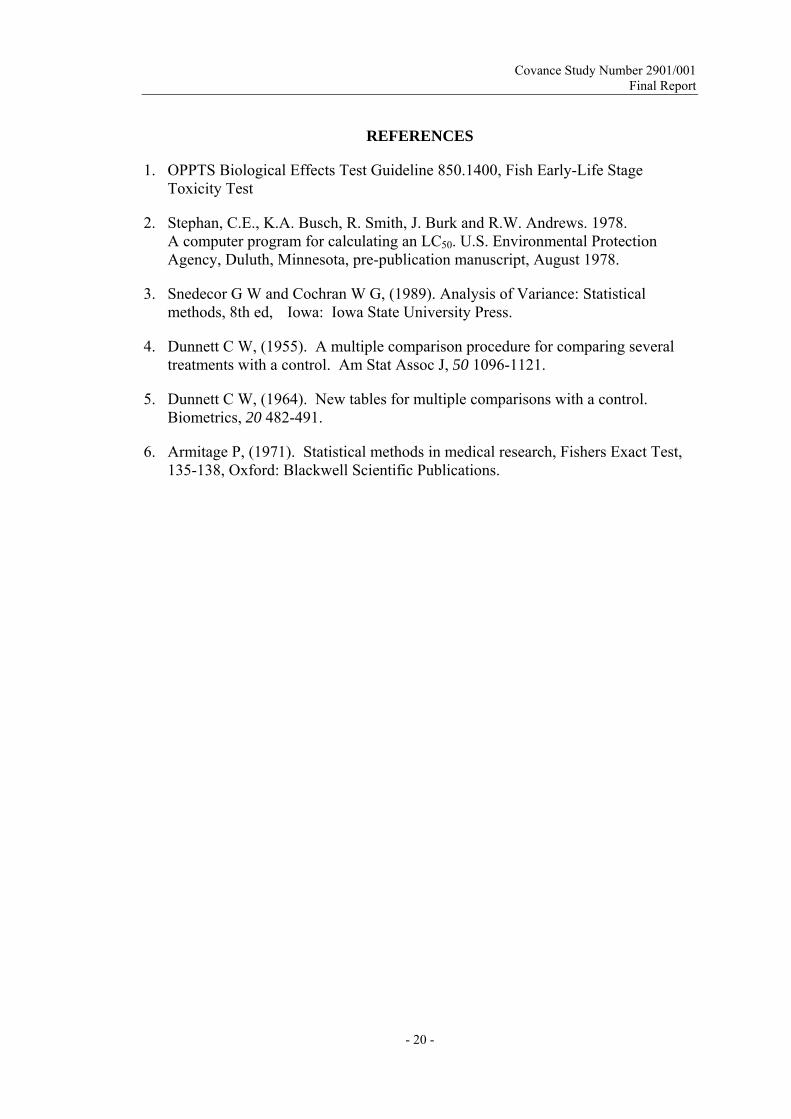
REFERENCES
1. OPPTS Biological Effects Test Guideline 850.1400, Fish Early-Life Stage Toxicity Test
2. Stephan, C.E., K.A. Busch, R. Smith, J. Burk and R.W. Andrews. 1978. A computer program for calculating an LC50. U.S. Environmental Protection Agency, Duluth, Minnesota, pre-publication manuscript, August 1978.
3. Snedecor G W and Cochran W G, (1989). Analysis of Variance: Statistical methods, 8th ed, Iowa: Iowa State University Press.
4. Dunnett C W, (1955). A multiple comparison procedure for comparing several treatments with a control. Am Stat Assoc J, 50 1096-1121.
5. Dunnett C W, (1964). New tables for multiple comparisons with a control. Biometrics, 20 482-491.
6. Armitage P, (1971). Statistical methods in medical research, Fishers Exact Test, 135-138, Oxford: Blackwell Scientific Publications.

Covance Study Number 2901/001
Final Report
- 21 -
TABLES

Covance Study N
umber 2901/001FinalR
epor t
- 22 -
Table 1 PFH Ammonium Salt (expressed as mg/L of the active moiety) in concentrated stock media during the fish early-life
stage test with Oncorhyncus mykiss
Pre-hatch
Nominal concentration (mg/L)
Nominal PFHA
concentration (mg/L)
-1 day (New)
0 day (New)
8 day (Old)
8 day (New)
16 day (Old)
16 day (New)
28 day (Old)
28 day (New)
Pre-hatch mean
measured concentration
(mg/L) 3.2 1.52 1.65 1.77 1.72 1.75 1.99 1.79 1.64 1.16 1.67
10.3 4.89 7.11 5.27 4.83 4.76 11.5 5.02 4.48 4.29 5.59 32.8 15.6 17.1 17.4 16.0 16.5 16.6 16.8 15.1 15.6 16.4 105 49.8 53.4 55.9 47.0 50.3 44.7 51.1 47.5 48.6 49.7 336 159 178 189 153 155 183 168 171 172 171
Post-hatch
Nominal concentration
(mg/L)
Nominal PFHA
concentration (mg/L)
3 day (Old)
3 day (New)
7 day (Old)
7 day (New)
14 day (New)
23 day (Old)
23 day (New)
27 day (Old)
27day (New)
Post-hatch mean
measured concentration
(mg/L)
$Mean measured
concentration (mg/L)
Mean as % of
nominal
3.2 1.52 1.23 1.15 1.18 1.30 1.51 1.56 1.46 1.51 1.48 1.49 1.53 98
10.3 4.89 4.85 4.68 4.96 3.98 4.66 5.10 4.93 5.13 4.94 4.78 4.98 98
32.8 15.6 16.9 15.3 16.4 17.1 14.8 16.8 16.4 17.1 17.0 15.7 15.9 101
105 49.8 52.0 47.1 53.4 52.3 42.2 53.3 53.1 53.4 53.2 49.6 49.6 100
336 159 174 146 166 168 157 167 171 174 172 157 160 98 $ Overall geometric mean measured concentration for the complete duration of the test.

Covance Study N
umber 2901/001FinalR
epor t
- 23 -
Table 2 PFH Ammonium Salt (expressed as mg/L of the active moiety) in test media during the fish early-life stage test with Oncorhyncus mykiss
Pre-hatch Nominal TA concentration
(mg/L)
Nominal PFHA
concentration (mg/L) 0 day 1 day 8 day 14 day 22 day 28 day
Pre-hatch mean
measured concentration
(mg/L) - - - 0.0139 - 0 Control 0 0 0 0 - 0 0.0301 -
0.0886 0.106 0.106 0.120 0.107 0.125 0.20 0.0949 0.105 0.129 0.0975 0.114 0.118 0.109 0.104
0.285 0.36 0.287 0.344 0.336 0.343 0.641 0.304 0.286 0.319 0.279 0.347 0.303 0.333 0.312
0.835 0.979 1.04 1.01 0.923 0.937 2.05 0.972 0.876 1.02 0.974 0.963 0.967 1.01 0.929
3.04 3.31 3.04 3.71 3.18 3.61 6.56 3.11 3.42 3.42 3.21 3.89 3.11 3.45 3.19
9.97 10.8 10.2 12.5 10.2 16.4 21.0 9.96 8.86 12.6 10.3 10.6 9.83 11.6 10.3
Post-hatch Nominal TA
concentration (mg/L)
Nominal PFHA
concentration (mg/L) 0 day 7 day 11 day 14 day 17 day 21 day 27 day 28 day
Post-hatch mean measured
concentration (mg/L)
$Mean measured
concentration (mg/L)
Mean as % of nominal
0 0 0 0 - 0 0 0 Control 0 0 0 0 0 - 0 0 0 - - -
0.101 0.112 0.101 0.119 0.0760 0.0993 0.0973 0.0995 0.20 0.0949 0.123 0.0967 0.0922 0.111 0.0904 0.0920 0.0971 0.101 0.100 0.103 108
0.345 0.308 0.300 0.331 0.327 0.240 0.296 0.302 0.641 0.304 0.460 0.288 0.284 0.314 0.319 0.249 0.286 0.307 0.306 0.310 102
0.928 0.848 0.678 0.840 0.860 0.722 0.963 1.03 2.05 0.972 0.991 0.892 0.798 0.856 0.902 1.15 0.94 0.992 0.892 0.916 94
3.00 2.96 2.84 2.68 3.11 2.93 3.53 3.62 6.56 3.11 2.69 2.95 2.64 2.85 3.08 2.90 3.45 3.62 3.04 3.14 101
11.8 8.54 8.20 8.51 9.13 9.23 10.1 11.1 21.0 9.96 10.6 9.49 9.05 8.55 9.70 9.39 10.0 10.9 9.59 10.1 101
- Not detected above limit of detection (0.012 µg/mL)
Covance Study N
umber 2901/001FinalR
epor t
- 24 -
Table 3 Hatching success and fish larval survival during the fish early-life stage test
Number of eggs added atstart of test
Number of hatched larvae
Percentage of hatched larvae
Number of larvae surviving at 28 days
post-hatch
Percentage of larvae surviving at 28 days
post-hatch Nominal concentration
(mg/L)
Vessel number
Individualvessels
Pooled vessels
Individualvessels
Pooled vessels
Individual vessels
Pooled vessels
Individualvessels
Pooled vessels
Individualvessels
Pooled vessels
V1 40 28 70 27 96 Control V2 40
80 31
59 78
74 28
55 90
93
V3 40 31 78 29 94 0.20 V4 40
80 33
64 83
81 32
61 97
96
V5 40 28 70 28 100 0.641 V6 40
80 26
54 65
68 26
54 100
100
V7 40 23 58 22 96 2.05 V8 40
80 27
50 68
63 26
48 96
96
V9 40 27 68 27 100 6.56 V10 40
80 25
52 63
66 25
52 100
100
V11 40 22 55 22 100 21.0 V12 40
80 30
52 75
65 29
51 97
99

Covance Study N
umber 2901/001FinalR
epor t
- 25 -
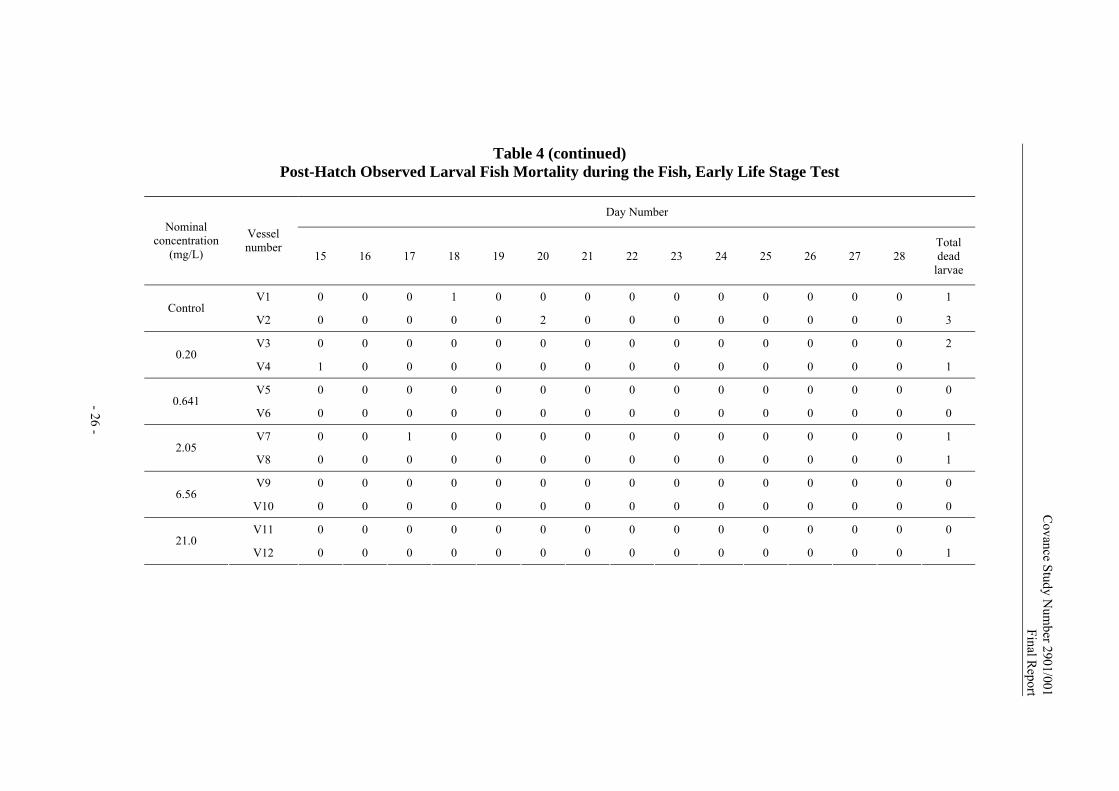
Table 4 Post-hatch observed larval fish mortality during the fish early-life stage test
Day Number Nominal concentration
(mg/L)
Vessel number
0 1 2 3 4 5 6 7 8 9 10 11 12 13 14
V1 0 0 0 0 0 0 0 0 0 0 0 0 0 0 0 Control
V2 0 0 0 0 0 0 0 0 0 0 0 0 0 1 0
V3 0 0 0 0 0 0 0 0 0 0 0 2 0 0 0 0.20
V4 0 0 0 0 0 0 0 0 0 0 0 0 0 0 0
V5 0 0 0 0 0 0 0 0 0 0 0 0 0 0 0 0.641
V6 0 0 0 0 0 0 0 0 0 0 0 0 0 0 0
V7 0 0 0 0 0 0 0 0 0 0 0 0 0 0 0 2.05
V8 0 0 0 0 0 0 0 0 0 0 0 0 0 0 1
V9 0 0 0 0 0 0 0 0 0 0 0 0 0 0 0 6.56
V10 0 0 0 0 0 0 0 0 0 0 0 0 0 0 0
V11 0 0 0 0 0 0 0 0 0 0 0 0 0 0 0 21.0
V12 0 1 0 0 0 0 0 0 0 0 0 0 0 0 0
Covance Study N
umber 2901/001FinalR
epor t
- 26 -
Table 4 (continued) Post-Hatch Observed Larval Fish Mortality during the Fish, Early Life Stage Test
Day Number Nominal
concentration(mg/L)
Vessel number
15 16 17 18 19 20 21 22 23 24 25 26 27 28 Total dead
larvae
V1 0 0 0 1 0 0 0 0 0 0 0 0 0 0 1 Control
V2 0 0 0 0 0 2 0 0 0 0 0 0 0 0 3
V3 0 0 0 0 0 0 0 0 0 0 0 0 0 0 2 0.20
V4 1 0 0 0 0 0 0 0 0 0 0 0 0 0 1
V5 0 0 0 0 0 0 0 0 0 0 0 0 0 0 0 0.641
V6 0 0 0 0 0 0 0 0 0 0 0 0 0 0 0
V7 0 0 1 0 0 0 0 0 0 0 0 0 0 0 1 2.05
V8 0 0 0 0 0 0 0 0 0 0 0 0 0 0 1
V9 0 0 0 0 0 0 0 0 0 0 0 0 0 0 0 6.56
V10 0 0 0 0 0 0 0 0 0 0 0 0 0 0 0
V11 0 0 0 0 0 0 0 0 0 0 0 0 0 0 0 21.0
V12 0 0 0 0 0 0 0 0 0 0 0 0 0 0 1

Covance Study Number 2901/001
Final Report
- 27 -
Table 5 Total Length of Fish (cm) at the End of the Fish, Early-life Stage Test - 28 Days
Post-Hatch
Nominal concentration (mg/L)
Control 0.20 0.641 2.05 6.56 21.0
Vessel number Fish
Number
V1 V2 V3 V4 V5 V6 V7 V8 V9 V10 V11 V12
1 3.6 3.5 3.5 3.4 3.3 3.3 3.5 3.5 3.5 3.6 3.6 3.3
2 3.6 3.6 3.5 3.2 3.7 3.5 3.4 3.1 3.3 3.5 3.6 3.4
3 3.8 3.1 3.6 2.7 3.6 3.2 3.6 3.4 3.5 3.4 3.5 3.3
4 3.0 3.5 3.7 3.5 3.6 3.1 3.5 3.5 3.3 3.4 3.6 3.4
5 3.6 3.6 3.5 3.5 3.0 3.5 3.5 3.1 3.6 3.4 3.5 3.5
6 3.2 3.3 3.4 3.2 3.0 3.3 3.6 3.3 3.5 3.2 3.4 3.4
7 3.5 3.6 3.6 3.3 3.7 3.7 3.5 3.3 3.4 2.9 3.6 3.3
8 3.4 3.5 3.5 3.6 3.5 2.7 3.5 3.3 3.5 3.6 3.6 3.4
9 3.4 3.6 3.2 3.7 3.3 3.2 3.4 3.1 3.4 3.6 3.6 3.6
10 3.4 3.6 3.6 3.6 3.5 3.3 3.6 3.0 3.5 3.5 3.2 3.3
11 3.6 3.5 3.5 3.5 3.5 3.4 3.4 3.5 3.6 3.6 3.2 3.4
12 3.5 3.4 3.3 3.5 3.7 3.3 3.4 3.5 3.5 3.4 3.5 3.2
13 3.7 3.2 3.6 3.5 3.6 3.3 3.2 3.4 3.5 3.3 3.4 3.6
14 3.6 3.4 3.5 3.5 3.5 3.3 3.6 3.4 3.5 3.5 3.4 3.2
15 3.4 3.5 3.4 3.4 3.4 3.1 3.5 2.7 3.5 3.5 3.4 3.5
16 3.6 3.5 3.6 3.6 3.3 3.3 3.4 3.5 3.6 3.4 3.3 3.4
17 3.5 3.4 3.2 3.5 3.3 3.6 3.3 3.3 3.5 3.1 3.5 3.4
18 3.5 3.4 3.4 3.2 3.4 3.5 3.3 3.5 3.5 3.3 3.4 3.5
19 3.5 3.4 3.3 3.6 3.2 3.4 3.3 3.6 3.5 3.5 3.5 3.4
20 3.6 3.6 3.3 3.3 3.3 3.0 3.0 3.5 3.3 3.0 3.2 3.4
21 3.4 3.6 3.6 3.5 3.3 3.4 3.4 3.3 3.6 3.5 3.3 3.6
22 3.4 3.5 3.3 3.4 3.5 3.5 3.3 3.5 3.4 3.5 3.1 3.5
23 3.2 3.3 3.4 3.3 3.3 3.2 - 3.4 3.5 3.6 - 3.4
24 3.4 3.5 3.6 3.3 3.4 3.5 - 3.5 3.5 3.4 - 3.1
25 2.6 3.1 3.5 3.4 3.3 3.2 - 3.1 3.3 3.5 - 3.3
26 3.4 3.2 3.6 3.4 3.3 3.3 - 3.2 3.5 - - 3.5
27 2.6 3.6 3.5 3.4 3.6 - - - 3.4 - - 3.3
28 - 3.1 3.5 3.6 3.3 - - - - - - 3.4
29 - - 3.4 3.4 - - - - - - - 2.5
30 - - - 3.2 - - - - - - - -
- Not applicable

Covance Study Number 2901/001
Final Report
- 28 -
Table 5 (continued) Total Length of Fish (cm) at the End of the Fish, Early-life Stage Test - 28 Days
Post-Hatch
Nominal concentration (mg/L)
Control 0.20 0.641 2.05 6.56 21.0
Vessel number Fish
Number
V1 V2 V3 V4 V5 V6 V7 V8 V9 V10 V11 V12
31 - - - 3.6 - - - - - - - -
32 - - - 3.1 - - - - - - - -
- Not applicable
Individual mean 3.4 3.4 3.5 3.4 3.4 3.3 3.4 3.3 3.5 3.4 3.4 3.4
Pooled mean 3.4 3.5 3.4 3.4 3.5 3.4
Individual minimum 2.6 3.1 3.2 2.7 3.0 2.5 3.0 2.7 3.3 2.9 3.1 2.5
Pooled minimum 2.6 2.7 2.7 2.7 2.9 2.5
Individual maximum 3.8 3.6 3.7 3.7 3.7 3.6 3.6 3.6 3.6 3.6 3.6 3.6
Pooled maximum 3.8 3.7 3.7 3.6 3.6 3.6
Individual standard deviation
0.284 0.166 0.129 0.196 0.186 0.204 0.147 0.209 0.091 0.187 0.155 0.204
Pooled standard deviation
0.230 0.170 0.199 0.187 0.147 0.186

Covance Study Number 2901/001
Final Report
- 29 -
Table 6 Dry Weights of Fish (g) at the End of the Fish, Early-life Stage Test - 28 Days
Post-Hatch
Nominal concentration (mg/L)
Control 0.20 0.641 2.05 6.56
Vessel number Fish
Number
V1 V2 V3 V4 V5 V6 V7 V8 V9 V10
1 0.0682 0.0579 0.0571 0.0528 0.0470 0.0515 0.0705 0.0693 0.0672 0.0657
2 0.0694 0.0713 0.0709 0.0440 0.0657 0.0632 0.0650 0.0494 0.0521 0.0622
3 0.0535 0.0440 0.0632 0.0275 0.0625 0.0360 0.0756 0.0535 0.0599 0.0616
4 0.0328 0.0585 0.0683 0.0544 0.0585 0.0355 0.0601 0.0639 0.0483 0.0563
5 0.0640 0.0580 0.0583 0.0612 0.0365 0.0647 0.0626 0.0512 0.0660 0.0637
6 0.0389 0.0556 0.0602 0.0476 0.0343 0.0481 0.0794 0.0590 0.0570 0.0421
7 0.0697 0.0725 0.0794 0.0494 0.0705 0.0654 0.0524 0.0591 0.0569 0.0351
8 0.0628 0.0613 0.0633 0.0824 0.0600 0.0281 0.0571 0.0580 0.0630 0.0652
9 0.0534 0.0688 0.0415 0.0785 0.0539 0.0526 0.0488 0.0454 0.0582 0.0659
10 0.0459 0.0688 0.0675 0.0752 0.0511 0.0429 0.0603 0.0383 0.0543 0.0596
11 0.0707 0.0652 0.0633 0.0465 0.0592 0.0583 0.0576 0.0624 0.0605 0.0653
12 0.0578 0.0510 0.0503 0.0515 0.0789 0.0534 0.0535 0.0563 0.0672 0.0546
13 0.0717 0.0416 0.0755 0.0513 0.0660 0.0503 0.0482 0.0518 0.0610 0.0489
14 0.0624 0.0505 0.0613 0.0744 0.0690 0.0536 0.0624 0.0529 0.0536 0.0603
15 0.0564 0.0674 0.0475 0.0471 0.0612 0.0415 0.0586 0.0230 0.0592 0.0661
16 0.0697 0.0636 0.0688 0.0592 0.0538 0.0597 0.0623 0.0713 0.0566 0.0573
17 0.0612 0.0495 0.0532 0.0652 0.0500 0.0742 0.0593 0.0531 0.0584 0.0375
18 0.0644 0.0571 0.0624 0.0475 0.0631 0.0677 0.0553 0.0616 0.0520 0.0445
19 0.0539 0.0534 0.0550 0.0724 0.0435 0.0636 0.0546 0.0730 0.0598 0.0551
20 0.0644 0.0751 0.0476 0.0518 0.0554 0.0371 0.0524 0.0565 0.0441 0.0373
21 0.0455 0.0629 0.0543 0.0661 0.0605 0.0522 0.0568 0.0508 0.0674 0.0680
22 0.0554 0.0582 0.0548 0.0535 0.0740 0.0646 0.0507 0.0644 0.0526 0.0625
23 0.0407 0.0485 0.0618 0.0484 0.0591 0.0547 - 0.0563 0.0631 0.0779
24 0.0701 0.0609 0.0740 0.0569 0.0654 0.0577 - 0.0600 0.0617 0.0657
25 0.0185 0.0360 0.0603 0.0518 0.0569 0.0558 - 0.0424 0.0497 0.0634
26 0.0585 0.0498 0.0756 0.0541 0.0532 0.0519 - 0.0478 0.0603 -
27 0.0249 0.0577 0.0564 0.0449 0.0700 - - - 0.0515 -
28 - 0.0308 0.0595 0.0581 0.0563 - - - - -
29 - - 0.0730 0.0676 - - - - - -
30 - - - 0.0598 - - - - - -
- Not applicable

Covance Study Number 2901/001
Final Report
- 30 -
Table 6 (continued) Dry Weights of Fish (g) at the End of the Fish, Early-life Stage Test - 28 Days
Post-Hatch
Nominal concentration (mg/L)
Control 0.20 0.641 2.05 6.56
Vessel number Fish
Number
V1 V2 V3 V4 V5 V6 V7 V8 V9 V10
31 - - - 0.0601 - - - - - -
32 - - - 0.0027 - - - - - -
- Not applicable
Individual mean 0.0557 0.0570 0.0615 0.0551 0.0584 0.0532 0.0593 0.0550 0.0578 0.0577
Pooled mean 0.0564 0.0583 0.0558 0.0571 0.0578
Individual minimum 0.0185 0.0308 0.0415 0.0027 0.0343 0.0281 0.0482 0.0230 0.0441 0.0351
Pooled minimum 0.0185 0.0027 0.0281 0.0230 0.0351
Individual maximum 0.0717 0.0751 0.0794 0.0824 0.0789 0.0742 0.0794 0.0730 0.0674 0.0779
Pooled maximum 0.0751 0.0824 0.0789 0.0794 0.0779
Individual standard deviation
0.0144 0.0108 0.0093 0.0150 0.0103 0.0112 0.0080 0.0106 0.0060 0.0110
Pooled standard deviation
0.0126 0.0129 0.0110 0.0097 0.0087
Covance Study Number 2901/001
Final Report
- 31 -
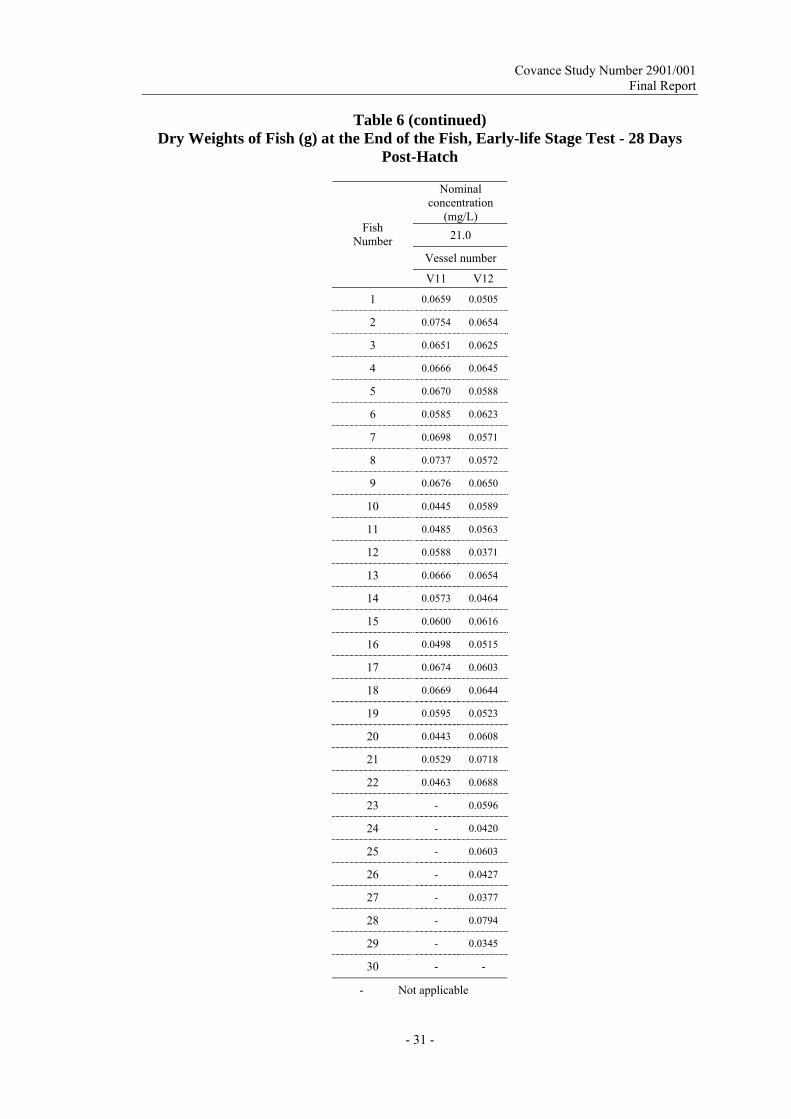
Table 6 (continued) Dry Weights of Fish (g) at the End of the Fish, Early-life Stage Test - 28 Days
Post-Hatch
Nominal concentration
(mg/L) 21.0
Vessel number
Fish Number
V11 V12
1 0.0659 0.0505
2 0.0754 0.0654
3 0.0651 0.0625
4 0.0666 0.0645
5 0.0670 0.0588
6 0.0585 0.0623
7 0.0698 0.0571
8 0.0737 0.0572
9 0.0676 0.0650
10 0.0445 0.0589
11 0.0485 0.0563
12 0.0588 0.0371
13 0.0666 0.0654
14 0.0573 0.0464
15 0.0600 0.0616
16 0.0498 0.0515
17 0.0674 0.0603
18 0.0669 0.0644
19 0.0595 0.0523
20 0.0443 0.0608
21 0.0529 0.0718
22 0.0463 0.0688
23 - 0.0596
24 - 0.0420
25 - 0.0603
26 - 0.0427
27 - 0.0377
28 - 0.0794
29 - 0.0345
30 - -
- Not applicable

Covance Study Number 2901/001
Final Report
- 32 -
Table 6 (continued) Dry Weights of Fish (g) at the End of the Fish, Early-life Stage Test - 28 Days
Post-Hatch
Nominal concentration
(mg/L)
21.0
Vessel number
Fish Number
V11 V12
31 - -
32 - -
- Not applicable
Individual mean 0.0606 0.0571
Pooled mean 0.0588
Individual minimum 0.0443 0.0345
Pooled minimum 0.0345
Individual maximum 0.0754 0.0794
Pooled maximum 0.0794
Individual standard deviation
0.0094 0.0107
Pooled standard deviation
0.0102

Covance Study N
umber 2901/001FinalR
epor t
- 33 -
Table 7 Temperature (°C) Measurements during the Fish, Early Life Stage Test
Day number pre-hatch Day number post-hatch Nominal
concentration(mg/L)
Vessel number 21
(new) 23
(new) 25
(new) 28
(new) 1
(new) 3
(new) 6
(new) 8
(new) 10
(new) 13
(new) 15
(new) 17
(new) 21
(new) 23
(new) 26
(new) 28
(new)
V1 12.1 12.1 12.1 12.0 12.0 11.8 11.7 11.8 11.9 11.8 12.2 12.4 11.8 12.0 12.0 11.9 Control
V2 12.2 12.1 12.2 12.0 12.0 12.0 11.7 11.7 12.0 11.7 12.3 12.4 11.8 12.0 12.0 11.9
V3 12.2 12.2 12.2 11.9 12.1 11.8 11.8 11.8 12.0 11.8 12.3 12.3 11.7 11.8 11.9 11.9 0.20
V4 12.2 12.2 12.2 12.1 12.1 11.8 11.8 11.8 11.9 11.9 12.3 12.3 11.6 11.8 11.9 11.9
V5 12.2 12.1 12.2 12.1 12.1 12.0 11.8 11.7 11.8 11.8 12.2 12.3 11.6 11.8 11.9 11.8 0.641
V6 12.3 12.1 12.2 12.1 12.0 11.9 11.8 11.7 11.9 11.8 12.2 12.2 11.6 11.9 11.8 11.8
V7 12.2 12.0 12.3 12.1 12.0 12.0 11.9 11.8 12.0 11.7 12.3 12.2 11.6 11.9 11.8 11.8 2.05
V8 12.2 12.0 12.1 12.2 12.0 12.0 12.0 11.8 12.0 11.7 12.3 12.1 11.8 11.9 11.7 11.9
V9 12.2 12.2 12.1 12.1 12.0 11.8 11.8 11.7 11.8 11.8 12.3 12.1 11.8 12.0 11.9 12.0 6.56
V10 12.2 12.2 12.2 12.2 12.1 11.8 12.0 11.7 12.0 11.8 12.3 12.2 12.0 12.1 12.0 12.1
V11 12.3 12.2 12.3 12.2 12.1 11.8 12.0 11.8 11.9 11.7 12.4 12.3 12.0 12.1 12.0 12.1 21.0
V12 12.4 12.3 12.3 12.2 12.2 11.8 12.0 11.8 11.9 11.8 12.4 12.4 12.1 12.2 12.1 12.2

Covance Study N
umber 2901/001FinalR
epor t
- 34 -
Table 8 pH Measurements during the Fish, Early Life Stage Test
Day number pre-hatch Nominal
concentration(mg/L)
Vessel number 0
(new) 1
(new) 2
(new) 3
(new) 6
(new) 7
(new) 9
(new) 11
(new) 14
(new) 16
(new) 18
(new) 21
(new) 23
(new) 25
(new) 28
(new)
V1 7.2 7.3 - 7.3 7.2 7.3 7.6 7.6 7.4 7.5 7.4 7.3 7.2 7.1 7.3 Control
V2 7.2 7.3 - 7.3 7.2 7.3 7.6 7.6 7.4 7.5 7.4 7.3 7.2 7.1 7.3
V3 7.2 - - 7.4 7.2 7.4 7.6 7.6 7.4 7.6 7.4 7.3 7.2 7.1 7.3 0.20
V4 7.2 - - 7.3 7.3 7.4 7.6 7.7 7.5 7.5 7.5 7.3 7.2 7.2 7.2
V5 7.3 - - 7.3 7.3 7.4 7.7 7.7 7.5 7.5 7.5 7.3 7.2 7.2 7.2 0.641
V6 7.3 7.3 - 7.3 7.3 7.4 7.7 7.7 7.5 7.5 7.5 7.3 7.2 7.2 7.2
V7 7.3 7.3 - 7.3 7.3 7.4 7.7 7.7 7.6 7.5 7.5 7.3 7.2 7.2 7.2 2.05
V8 7.3 - - 7.3 7.3 7.4 7.7 7.7 7.5 7.4 7.5 7.3 7.2 7.2 7.2
V9 7.3 - - 7.3 7.3 7.4 7.7 7.7 7.6 7.4 7.5 7.2 7.2 7.2 7.2 6.56
V10 7.3 - - 7.3 7.3 7.4 7.7 7.8 7.6 7.4 7.5 7.2 7.2 7.2 7.2
V11 7.3 7.3 - 7.3 7.3 7.4 7.7 7.8 7.6 7.4 7.5 7.2 7.2 7.2 7.2 21.0
V12 7.3 7.3 - 7.3 7.3 7.4 7.7 7.8 7.6 7.4 7.5 7.2 7.2 7.2 7.2

Covance Study N
umber 2901/001FinalR
epor t
- 35 -
Table 8 (continued) pH Measurements during the Fish, Early Life Stage Test
Day number post-hatch Nominal
concentration(mg/L)
Vessel number 1
(new) 3
(new) 6
(new) 8
(new) 10
(new) 13
(new) 15
(new) 17
(new) 21
(new) 23
(new) 26
(new) 28
(new)
V1 7.3 7.2 7.2 7.2 7.1 7.1 7.2 7.2 7.6 7.5 7.4 7.1 Control
V2 7.3 7.2 7.2 7.3 7.1 7.1 7.2 7.2 7.6 7.5 7.4 7.1
V3 7.3 7.2 7.1 7.3 7.0 7.0 7.2 7.2 7.6 7.5 7.4 7.1 0.20
V4 7.3 7.2 7.2 7.2 7.0 7.0 7.2 7.2 7.5 7.5 7.4 7.1
V5 7.3 7.2 7.1 7.2 7.0 7.0 7.1 7.2 7.5 7.5 7.4 7.1 0.641
V6 7.3 7.2 7.1 7.2 7.0 7.0 7.1 7.2 7.5 7.4 7.3 7.1
V7 7.4 7.2 7.1 7.2 6.9 7.0 7.1 7.2 7.5 7.4 7.3 7.1 2.05
V8 7.4 7.2 7.1 7.3 6.9 7.0 7.1 7.2 7.4 7.4 7.3 7.0
V9 7.4 7.2 7.1 7.2 7.0 7.0 7.1 7.2 7.4 7.4 7.3 7.0 6.56
V10 7.4 7.2 7.1 7.2 6.9 7.0 7.1 7.2 7.4 7.4 7.3 7.0
V11 7.4 7.2 7.1 7.2 6.9 7.0 7.1 7.2 7.4 7.4 7.3 7.0 21.0
V12 7.3 7.2 7.1 7.3 6.9 7.0 7.1 7.2 7.4 7.4 7.3 7.0

Covance Study N
umber 2901/001FinalR
epor t
- 36 -
Table 9 Dissolved Oxygen (% ASV) Measurements during the Fish, Early Life Stage Test
Day number pre-hatch Nominal
concentration(mg/L)
Vessel number 0
(new) 1
(new) 2
(new) 3
(new) 6
(new) 7
(new) 9
(new) 11
(new) 14
(new) 16
(new) 18
(new) 21
(new) 23
(new) 25
(new) 28
(new)
V1 98 93 - 94 95 96 95 91 92 95 96 98 92 94 95 Control
V2 99 94 - 93 94 95 95 91 92 94 97 95 93 93 95
V3 97 - - 92 93 94 96 92 92 96 96 96 94 92 96 0.20
V4 98 - - 93 93 96 97 93 94 96 96 96 94 92 96
V5 98 - - 94 93 94 96 91 91 97 93 95 94 94 94 0.641
V6 99 95 - 95 94 95 96 91 90 95 94 96 93 95 96
V7 101 93 - 95 95 95 97 95 90 96 94 95 94 92 95 2.05
V8 100 - - 94 95 96 97 94 92 96 95 96 95 92 95
V9 99 - - 94 94 95 95 93 92 96 95 97 94 93 96 6.56
V10 98 - - 95 94 92 96 93 95 96 96 96 92 93 97
V11 97 92 - 93 93 95 96 91 94 94 96 96 93 94 93 21.0
V12 97 93 - 95 95 94 96 91 93 95 95 96 94 94 98

Covance Study N
umber 2901/001FinalR
epor t
- 37 -
Table 9 (continued) Dissolved Oxygen (% ASV) Measurements during the Fish, Early Life Stage Test
Day number post-hatch Nominal
concentration(mg/L)
Vessel number 1
(new) 3
(new) 6
(new) 8
(new) 10
(new) 13
(new) 15
(new) 17
(new) 21
(new) 23
(new) 26
(new) 28
(new)
V1 89 103 105 100 95 102 93 83 90 85 81 88 Control
V2 90 103 98 89 96 103 93 85 90 86 80 89
V3 90 104 92 94 96 102 91 85 92 87 83 89 0.20
V4 88 105 104 95 96 105 94 83 89 86 79 90
V5 90 104 105 96 97 102 94 84 91 88 81 88 0.641
V6 91 104 104 95 97 104 92 84 92 88 81 88
V7 89 103 104 96 97 104 92 86 89 89 77 90 2.05
V8 89 104 105 95 97 105 93 81 88 86 82 90
V9 90 105 104 96 96 105 92 82 89 87 80 88 6.56
V10 91 104 98 95 96 102 95 83 93 87 84 87
V11 90 105 98 96 97 103 90 83 92 88 83 89 21.0
V12 90 103 96 96 97 104 94 85 90 88 80 89

Covance Study N
umber 2901/001FinalR
epor t
- 38 -
Table 10 Dissolved Oxygen (mg/L) Measurements during the Fish, Early Life Stage Test
Day number pre-hatch Nominal
concentration(mg/L)
Vessel number 0
(new) 1
(new) 2
(new) 3
(new) 6
(new) 7
(new) 9
(new) 11
(new) 14
(new) 16
(new) 18
(new) 21
(new) 23
(new) 25
(new) 28
(new)
V1 10.90 10.38 - 10.11 10.21 10.41 10.21 9.72 9.85 10.41 10.31 10.01 9.31 10.00 10.51 Control
V2 10.95 10.42 - 10.05 10.18 10.32 10.23 9.73 9.83 10.38 10.38 9.72 9.50 9.91 10.49
V3 10.81 - - 9.93 10.07 10.22 10.29 9.80 9.83 10.52 10.32 9.70 9.53 9.82 10.59 0.20
V4 10.91 - - 10.04 10.06 10.37 10.38 9.92 10.00 10.50 10.30 9.75 9.55 9.82 10.61
V5 10.90 - - 10.13 10.05 10.28 10.30 9.78 9.73 10.61 10.01 9.69 9.54 10.01 10.45 0.641
V6 10.94 10.55 - 10.20 10.16 10.32 10.31 9.76 9.62 10.40 10.08 9.72 9.50 10.13 10.58
V7 11.10 10.32 - 10.20 10.19 10.38 10.36 10.09 9.70 10.48 10.11 9.70 9.56 9.81 10.50 2.05
V8 11.00 - - 10.15 10.22 10.32 10.37 10.05 9.72 10.52 10.20 9.76 9.68 9.80 10.50
V9 10.95 - - 10.11 10.18 10.30 10.23 9.90 9.80 10.52 10.21 9.90 9.52 9.89 10.58 6.56
V10 10.90 - - 10.19 10.16 10.31 10.30 9.90 10.08 10.54 10.28 9.79 9.30 9.87 10.66
V11 10.82 10.27 - 10.05 10.06 10.42 10.30 9.70 10.00 10.36 10.25 9.76 9.45 10.03 10.21 21.0
V12 10.81 10.32 - 10.20 10.20 10.40 10.29 9.72 9.91 10.45 10.20 9.75 9.52 10.04 10.77

Covance Study N
umber 2901/001FinalR
epor t
- 39 -
Table 10 (continued) Dissolved Oxygen (mg/L) Measurements during the Fish, Early Life Stage Test
Day number post-hatch Nominal
concentration(mg/L)
Vessel number 1
(new) 3
(new) 6
(new) 8
(new) 10
(new) 13
(new) 15
(new) 17
(new) 21
(new) 23
(new) 26
(new) 28
(new)
V1 9.61 10.74 11.28 10.45 9.34 11.12 9.72 8.72 9.31 9.00 9.02 9.51 Control
V2 9.70 10.73 10.58 9.34 9.66 11.17 9.70 8.91 9.32 9.09 8.92 9.62
V3 9.71 11.03 9.99 9.97 9.67 11.09 9.49 8.92 9.50 9.12 9.26 9.61 0.20
V4 9.52 11.23 11.30 10.23 9.92 11.49 9.81 8.76 9.23 9.05 8.86 9.72
V5 9.73 11.17 11.48 10.34 10.06 11.20 9.82 8.81 9.41 9.20 9.04 9.51 0.641
V6 9.80 11.20 11.39 10.29 10.12 11.38 9.65 8.81 9.56 9.22 9.05 9.51
V7 9.65 11.01 11.41 10.40 10.10 11.36 9.61 8.99 9.17 9.32 8.79 9.72 2.05
V8 9.60 11.21 11.57 10.37 10.08 11.48 9.73 8.52 9.12 9.04 9.12 9.71
V9 9.70 11.39 11.44 10.42 9.88 11.55 9.58 8.60 9.17 9.12 8.92 9.49 6.56
V10 9.82 11.22 10.73 10.39 9.90 11.28 9.90 8.70 9.60 9.14 9.36 9.42
V11 9.75 11.35 10.71 10.45 10.30 11.30 9.39 8.71 9.54 9.25 9.27 9.53 21.0
V12 9.74 10.88 10.51 10.52 10.34 11.31 9.81 8.92 9.36 9.21 8.94 9.54

Covance Study Number 2901/001
Final Report
- 40 -
Table 11 Water Hardness and Residual Chlorine Measurements in Dilution Water during
the Fish, Early Life Stage Test
Day number Water hardness (mg/L as CaCO3)
Residual chlorine (mg/L)
0 pre-hatch (new) 61 0.01
3 pre-hatch (new) 75 0.00
7 pre-hatch (new) 65 0.02
14 pre-hatch (new) 68 0.01
18 pre-hatch (new) 68 0.01
21 pre-hatch (new) 61 0.00
28 pre-hatch (new) 50 0.02
6 post-hatch (new) 55 0.08
13 post-hatch (new) 57 0.08
21 post-hatch (new) 60 0.02
26 post-hatch (new) 59 0.00
28 post-hatch (new) 60 0.01

Covance Study Number 2901/001
Final Report
- 41 -
FIGURES
Covance Study Number 2901/001
Final Report
- 42 -
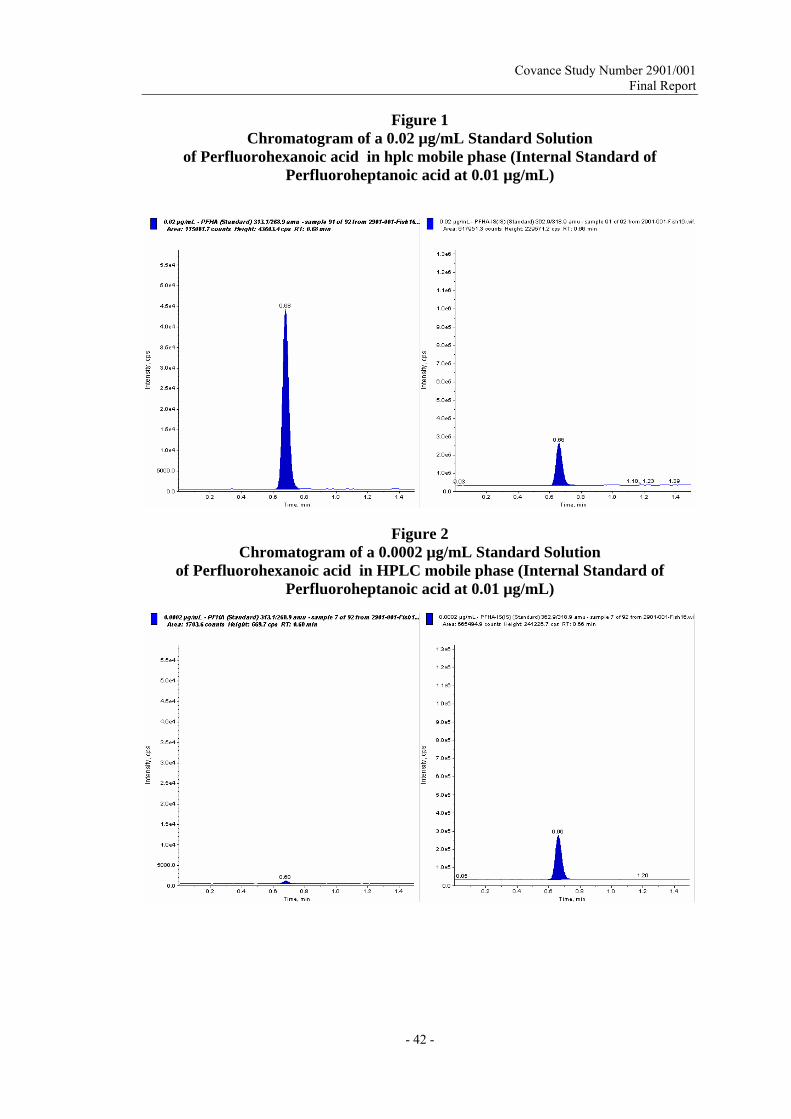
Figure 1 Chromatogram of a 0.02 µg/mL Standard Solution
of Perfluorohexanoic acid in hplc mobile phase (Internal Standard of Perfluoroheptanoic acid at 0.01 µg/mL)
Figure 2 Chromatogram of a 0.0002 µg/mL Standard Solution
of Perfluorohexanoic acid in HPLC mobile phase (Internal Standard of Perfluoroheptanoic acid at 0.01 µg/mL)

Covance Study Number 2901/001
Final Report
- 43 -
Figure 3 Chromatogram of a Control Test Water Sample at Day 0.)
(Dilution factor = 10)
Figure 4 Chromatogram of a 0.2 mg/L Test Water Sample at Day 0
(Dilution factor = 10)

Covance Study Number 2901/001
Final Report
- 44 -
Figure 5 Chromatogram of a 21 mg/L Test Water Sample at Day 0
(Dilution factor = 1000)
Figure 6 Chromatogram of a 0.2 mg/L Test Water Sample at Day 1
(Dilution factor = 100)

Covance Study Number 2901/001
Final Report
- 45 -
Figure 7 Chromatogram of a 21 mg/L Test Water Sample at Day 1
(Dilution factor =1000)
Figure 8 Chromatogram of a 0.2 mg/L Test Water Sample at Day -1 Post Hatch
(Dilution factor = 100)

Covance Study Number 2901/001
Final Report
- 46 -
Figure 9 Chromatogram of a 21 mg/L Test Water Sample at Day -1 Post Hatch
(Dilution factor = 1000)
Figure 10 Chromatogram of a 0.2 mg/L Test Water Sample at Day 0 Post Hatch
(Dilution factor = 100)

Covance Study Number 2901/001
Final Report
- 47 -
Figure 11 Chromatogram of a 21 mg/L Test Water Sample at Day 0 Post Hatch
(Dilution factor = 1000)
Figure 12 Chromatogram of a Control Test Water Sample at Day 28 Post Hatch
(Dilution factor = 100)

Covance Study Number 2901/001
Final Report
- 48 -
Figure 13 Chromatogram of a 0.2 mg/L Test Water Sample at Day 28 Post Hatch
(Dilution factor = 100)
Figure 14 Chromatogram of a 21 mg/L Test Water Sample at Day 28 Post Hatch
(Dilution factor = 1000)

Covance Study Number 2901/001
Final Report
- 49 -
Figure 15 Chromatogram of a New 3.2 mg/L Stock Solution at Day 0
(Dilution factor = 200)
Figure 16 Chromatogram of a New 356 mg/L Stock Solution at Day 0
(Dilution factor = 20000)

Covance Study Number 2901/001
Final Report
- 50 -
Figure 17 Chromatogram of an Old 3.2 mg/L Stock Solution at Day 4
(Dilution factor = 200)
Figure 18 Chromatogram of an Old 356 mg/L Stock Solution at Day 4
(Dilution factor = 20000)

Covance Study Number 2901/001
Final Report
- 51 -
Figure 19 Typical Calibration Line for Perfluorohexanoic Acid
over the range of 0.0002 to 0.02 µg/mL
Reproduced from Analyst batch Fish12

Covance Study Number 2901/001
Final Report
- 52 -
APPENDICES

Covance Study Number 2901/001
Final Report
- 53 -
Appendix 1 Typical Water Characteristics

Covance Study Number 2901/001
Final Report
- 54 -

Covance Study Number 2901/001
Final Report
- 55 -
Appendix 2 Analytical Procedure
INTRODUCTION
Concentrations of Perfluorohexanoic Acid in treated mains water, treated with PFH Ammonium Salt were diluted and then determined by LC-MS/MS. The detection of Perfluorohexanoic Acid was achieved by monitoring the ions 313.0 → 268.9.
APPARATUS, MATERIALS, REAGENTS AND SOLUTIONS
Apparatus and Glassware • HPLC system: Agilent 1100 series HPLC system • Various laboratory glassware • Various pipettes Materials • Acetonitrile Rathburn, HPLC grade • Water Rathburn, HPLC grade • Treated Mains Water In-house • Ammonium Formate, 98% Sigma Aldrich Ltd. • Methanol Rathburn, HPLC grade • Perfluoroheptanoic acid, 98% Sigma Aldrich Ltd. Reagents and Solutions 50 mM Ammonium Formate Ammonium Formate (3.153g) was weighed and dissolved in 1 litre of HPLC grade water.
HPLC Mobile Phase (and dilution solution) Acetonitrile (950 mL) and 50 mM Ammonium Formate (50 mL) were mixed together. Internal Standard solution Approximately 10 mg of perfluoroheptanoic acid was weighed and dissolved in 100 mL of HPLC mobile phase to give a solution of 100 µg/mL. This solution was serially diluted to obtain a 0.1 µg/mL solution in the mobile phase.
PROCEDURES
Standard Solution Preparation Initial Weighing of Stock Solutions Duplicate analytical standard solutions (A and B), corrected for purity, were prepared in a suitable solvent in volumetric flasks. The amount weighed was at or slightly above the desired weight so that the solvent volume could be corrected to ensure that

Covance Study Number 2901/001
Final Report
- 56 -
these stock solutions and their subsequent dilutions were whole units, (e.g. 100.0 µg/mL).
Dilution into Calibration Range One standard (A) was diluted over the range of concentrations to be used for the instrument calibration in the chosen injection solvent. The second standard (B) was diluted to a concentration near the mid-point of this calibration range, but was identical to a calibration point.
Standard Correlation The standard solutions were correlated by injecting each of the two standards (A and B) at a concentration near the mid-calibration point, 5 times into the chosen analytical system. The two solutions were injected alternately in the run sequence. The results for the correlation were between 98 and 102 % of the mean. The calibration line was injected to ensure that the standards met the acceptance criteria.
Calibration Standards Appropriate calibration standards were prepared in acetonitrile:50 mM Ammonium Formate (95:5 v/v) to cover the range 0.0002 to 0.02 µg/mL, with a lowest calibration level of 0.0002 µg/mL.
Sample Preparation Samples of test solutions were diluted with the dilution solution to bring the concentrations within the calibration range of 0.0002 to 0.02 µg/mL. Aliquots (1.0 mL) of the final dilutions and the standard solutions were taken for the calibration, 0.1 mL of the 0.1 µg/mL internal standard solution was added to each of them. These solutions were submitted for analysis by LC-MS.
Conditions for LC-MS/MS Analysis Analytical column SeQuant, Zic-Hilic, 5µM 200A, 100 x 2.1 mm (id) Guard column N/A In line filter (Acquity) N/A Column oven temperature Nominal 40°C Autosampler temperature Nominal 4°C Mobile phase 50mM Ammoinum Formate : Acetonitrile (5:95, v/v) Flow rate 0.4 mL/min Split N/A Switching Valve times N/A Slave pump solvent N/A Slave pump flow rate N/A Wash solvent 1 Weak Wash (Acquity)
50mM Ammoinum Formate : Acetonitrile (5:95, v/v) (Mobile Phase)
Wash solvent 2 Strong Wash (Acquity)
Methanol: Water (50 :50 v/v)
Injection mode (Acquity) Partial loop with needle over-fill

Covance Study Number 2901/001
Final Report
- 57 -
Injection loop volume (Acquity)
10 µL (50 µL is our standard, 5 µL is our preferred alternative if lower carry-over required)
Needle placement 1.0 mm from bottom Injection volume (Recommended)
10 µL (this may vary depending on instrument performance)
Waters Acquity
Weak Wash Volume (μL) 1000 (Range 200 to 5000) Strong Wash Volume (μL) 1000 (Range 0 to 5000)
Mass Spectrometer Parameters API 4000 Mode of operation Turbo IonSpray (negative ion) (MS/MS) Collision gas setting (CAD) 8 (± 5) [Where a setting of 12 is approximately equal
to 4.8 x 10⁻⁵ Torr] Curtain gas setting (CUR) 25 psi (± 5) Ion source gas 1 (GS1) 40 psi Ion source gas 2 (GS2) 60 psi IonSpray Voltage (IS) -4500 V (± 2000 V) Nebuliser Current (NC) N/A Temperature (TEM) 500°C (450-550°C) Interface Heater Status On Analysis time 2 minutes (± 1 minute)
Compound name Ions monitored (± 0.5 Da)
Dwell time (ms)
Declustering Potential (DP)
Volts
Collision Energy (CE)
Volts
Collision Cell Exit Potential (CXP) Volts
Perfluorohexanoic Acid 313.0 → 268.9 200 -10 -12 -7
Perfluoroheptanoic Acid 362.9 → 318.9 200 -10 -12 -7
Voltages and dwell times may have required optimisation therefore the above values were used for reference only.
Entrance Potential (EP) -10 V (± 5 V) Pause time 5 ms Collision gas Nitrogen

Covance Study Number 2901/001
Final Report
- 58 -
Study Specific Instrumentation
Name Specification (Model, Brand etc) Supplier/Manufacturer
Pump Acquity – UPB Waters LC-10ADVP Shimadzu Autosampler Acquity – UPS Waters Mass Spectrometer API 4000 Applied Biosystems Column oven Acquity Waters Switching Valve EMMA 10 port-2 position VICI A typical chromatogram of a 0.02 µg/mL Perfluorohexanoic Acid calibration standard is shown in Figure 1. The peak at the retention time of approximately 0.56 minutes is due to Perfluorohexanoic Acid. A typical calibration line for standard concentrations between 0.0002 and 0.02 µg/mL is shown in Figure 19.

Covance Study Number 2901/001
Final Report
- 59 -
CALCULATION OF RESULTS
The presence of Perfluorohexanoic acid in a sample was confirmed when the resulting peak, arising from the test sample, had the same chromatographic retention time as the appropriate standard. All peak measurements and calculations were performed using the current version of Analyst data system.
The calibration line was determined by plotting the responses from the calibration solutions (y) against the amount of Perfluorohexanoic acid injected (x) µg/mL to generate a quadratic curve, using a 1/x weighting.
y = ax2 + bx + c
Where: a = the quadratic coefficient (curvature) b = the linear coefficient (gradient) c = the intercept
Concentrations of Perfluorohexanoic acid (x) µg/mL in the samples are calculated from their response using the equation:
UP1UP2xUP3x
a2ac4ay4bb
x2 −+±−
=
Where: x = Amount (µg/mL)of Perfluorohexanoic Acid y = Area of peak due to Perfluorohexanoic Acid c = y axis intercept on calibration graph b = linear coefficient (gradient) of calibration graph a = quadratic coefficient (curvature) of calibration graph UP1 = Sample Volume (mL) UP2 = Final Volume (mL) UP3 = Dilution Factor
Linearity of Response The linearity of response of the LC-MS/MS system was determined with at least six different concentration standard solutions across the range 0.0002 to 0.02 µg/mL, with the lowest calibration level being 0.0002 µg/mL.

Covance Study Number 2901/001
Final Report
- 60 -
VALIDATION REPORT
This Analytical Procedure was validated using PFH Ammonium Salt (Perfluorohexanoic Acid). This validation was completed on 18 April 2008 and the validation raw data are archived with CLE study number 2901/001.
Linearity Check Procedure The linearity of detector response to Perfluorohexanoic acid was determined over the concentration range 0.0002 to 0.02 µg/mL. Peak area response was used for the test substance signal, and the linearity correlation was derived from a quadratic least-squares regression, with a 1/x weighting. The coefficient of determination (using a 1/x weighting) was better than 0.99 for Perfluorohexanoic acid.
Precision and Accuracy Procedure Five replicates of the lowest (0.0002 µg/mL), an intermediate (0.01 µg/mL) and the highest (0.02 µg/mL) calibration standards in (95+5 v/v) acetonitrile + 50mM Ammonium formate were assayed against a calibration line as described above.
The repeatability of the analysis at each standard concentration was evaluated by calculating the coefficient of variation (%) using the formula:
Coefficient of Variation (%) = Standard deviation Mean (measured) result of five determinations x 100
For an LC-MS/MS method of analysis, a coefficient of variation ≤ 10% was considered acceptable.
The accuracy (%) of the analysis at each standard concentration was evaluated using the formula:
Accuracy (%) = [Mean (measured) result of five determinations] nominal concentration x 100
For acceptability, the accuracy (%) must be within 90% to 110% of the nominal concentration of the standard at each level.
The results for the precision and accuracy of the instrument are shown in the following table.

Covance Study Number 2901/001
Final Report
- 61 -
Standard Concentration
(µg/mL)
Concentration Found
(µg/mL)
Recovery ( % )
Mean Recovery
( % )
Standard Deviation
Coefficient of Variation
( % )
0.0002 0.000223 112 0.0002 0.000199 100 0.0002 0.000195 97.5 105 5.86 5.61 0.0002 0.000216 108 0.0002 0.000212 106 0.01 0.010378 104 0.01 0.010808 108 0.01 0.009695 97.0 104 5.38 5.17 0.01 0.011033 110 0.01 0.010097 101 0.02 0.021315 107 0.02 0.020774 103 0.02 0.020174 101 103 3.09 3.00 0.02 0.020976 105 0.02 0.019767 98.8 Injections of 2 Blank solutions showed no peaks for the test substance
METHOD CRITERIA
Analysis by LC-MS/MS will be considered successful only if the following criteria are met.
• At least 6 calibration standards will be used in the determination of each calibration line. A 1/x² weighting should be used.
• A coefficient of determination (r²) for each calibration line will be ≥ 0.99 • All test samples will be within the appropriate calibration standards range
Covance Study Number 2901/001
Final Report
- 62 -
Appendix 3 Statistical Analysis

Covance Study Number 2901/001
Final Report
- 63 -

Covance Study Number 2901/001
Final Report
- 64 -
Appendix 4 Protocol Deviations
The study was conducted within a temperature range of 12 ± 1°C and not at the temperature ranges stated on page 2 of the Protocol.
The method of test media preparation deviated from that described on page 5 of the Protocol. The test media was prepared by combining concentrated stock solutions and dilution water continuously. Appropriate amounts were delivered to a mixing vessel which overflowed via a sidearm directly into each test vessel.
Fish weight measurements were carried out as dry weight measurements and not wet weight measurements as detailed on page 2 of the Protocol.
The experimental end date was greater than one month after the date stated in Protocol Amendment 1.
These deviations do not affect the integrity of the study.