Embed Size (px)
Citation preview
METHODOLOGIES FOR DETERMINING
CONSTRUCTION CONTRACT TIME AND EVALUATING
CONTRACT TIME EXTENSIONS
FINAL REPORT
SCDOT Research Project 652: Construction Contract Time/Construction Contract Time Extension
Barton Lee Stoll, James Edward O’Reilly, and Lansford C. Bell
Department of Civil Engineering
Clemson University April 2006

ABSTRACT
This study summarizes research conducted for the South Carolina Department of
Transportation on procedures for determining construction contract time and evaluating
contract time extensions. The objectives of this research were to identify best practice
approaches to project time duration estimates, to evaluate the current methods being used,
to recommend changes to improve SCDOT’s current process without significantly
increasing cost of construction, and to recommend changes to improve the process for
calculating contract time extensions.
It has been documented by the Transportation Research Board that there has been
a shift in the type of highway construction being performed and that current projects tend
to have a greater impact on the traveling public. Keeping construction times short on
heavily traveled roads is important to minimize economic impact and delays to public
users. Currently many states are working to improve the procedures they use for
determining contract times. Several methods are being used which range from manual
estimation techniques using spreadsheets, to specially developed computer systems which
use critical path scheduling techniques.
This study discusses methods being used by state Departments of Transportation
for determining contract time and evaluating contract time extensions. It also examines
using commercially available scheduling software in conjunction with production rate
data for calculating contract completion dates. Previously completed projects are used as
case studies to compare the current estimating method to the scheduling software

ii
estimation and actual project completion date. Several of these projects were also used
evaluate scheduling software’s ability to evaluate contract time extension.
The finding of this research indicate that commercially available scheduling
software can be used to consistently estimate contract time durations and evaluate
requests for contract time extensions. Computer generated contract time estimations are
comparable to the method currently being used and can be used on multiple project types
with favorable results. Computer scheduling software can also be used to estimate
contract time extensions and evaluate the impact of granting extension on the project as a
whole.

TABLE OF CONTENTS
Page
TITLE PAGE ............................................................................................................ i ABSTRACT............................................................................................................... ii LIST OF TABLES..................................................................................................... v LIST OF FIGURES ................................................................................................... vi CHAPTER 1. INTRODUCTION ................................................................................................ 1
Background.................................................................................................... 1 Research Objectives....................................................................................... 8 Research Methodology .................................................................................. 9
2. CURRENT PRACTICES ..................................................................................... 15
Current Practices Survey................................................................................ 15 General Findings and Survey Results ............................................................ 16 Specific Practices for Contract Time Determination ..................................... 27 Specific Practices for Contract Time Extensions........................................... 31
3. CPM SCHEDULING............................................................................................ 35
Logic Development........................................................................................ 35 Primavera Capabilities ................................................................................... 35 Using Primavera to Calculate Contract Time ............................................... 37 Using Primavera to Evaluate Time Extensions ............................................. 46 Primavera Templates ..................................................................................... 49
4. CASE STUDIES................................................................................................... 51
Case Study Methodology............................................................................... 51 Case Study Summery of Results.................................................................... 53 Case Study Results for Evaluating Contract Time Extensions...................... 71 Findings.......................................................................................................... 76 Primavera User Survey Results ..................................................................... 88
5. CONCLUSION AND RECOMMENDATIONS ................................................. 93
Summary ........................................................................................................ 93
iv
Table of Contents (Continued) Research Limitations ..................................................................................... 94 Conclusion ..................................................................................................... 95 Recommendations.......................................................................................... 99
APPENDICES ........................................................................................................... 101
Appendix A. Survey of Current Practices..................................................... 102 Appendix B. Primavera User Survey............................................................ 116 Appendix C. Project Type Logic Diagrams ................................................. 120 Appendix D. Case Study Data Sheets .......................................................... 140 Appendix E. SCDOT Working Day Conversion Tables .............................. 165
BIBLIOGRAPHY...................................................................................................... 167

LIST OF TABLES Table Page 2.1: Current Practices Survey Results for Question 2................................................ 17
2.2: Current Practices Survey Results for Question 3................................................ 18
2.3: Current Practices Survey Results for Question 5................................................ 20
2.4: Methods Used for Determining Production Rate Values ................................... 21
2.5: Percentage of DOT’s Using Detailed Analysis ................................................. 22
2.6: Circumstances that Alter Standard Approach to Determining Contract Time ... 23
2.7: Current Practices Survey Results for Question 1................................................ 24
2.8: Current Practices Survey Results for Question 6................................................ 26
2.9: Maryland’s Project Categories and Quantity of Work Items ............................. 29
3.1: Primavera Time Extension Results..................................................................... 48
4.1: Resurfacing Project Completion Date Summery................................................ 54
4.2: Resurfacing Project Working Day Difference.................................................... 54
4.3: Bridge Replacement Project Completion Date Summery .................................. 58
4.4: Intersection Improvement Project Completion Date Summery.......................... 60
4.5: Intersection Improvement Project Working Day Difference.............................. 60
4.6: Secondary Improvement Project Completion Date Summery............................ 64
4.7: Secondary Improvement Project Working Day Difference................................ 64
4.8: Interstate Improvement Project Completion Date Summery............................. 67
4.9: Interstate Improvement Project Working Day Difference.................................. 67
4.10: Completion Date Comparisons for Contract Extensions................................. 72

vi
4.11: Completion Dates Comparison with Modified Letting Date for
Contract Extensions ......................................................................................... 72
4.12 Estimated Total Number of Working Days ...................................................... 78
4.13 Estimated and Actual Completion Dates .......................................................... 80
4.14 Calendar Day Difference Between Primavera Estimation and Project
Substantial Completion Date ........................................................................... 82
4.15: Primavera User Survey Results for Questions 1 Through 9............................ 90
D.1: Bridge Activity Worksheet for 42.471A........................................................... 146
D.2: Bridge Worksheet for 29.106B......................................................................... 148
D.3: Bridge Worksheet for File No. 26.100B .......................................................... 150
E.1: SCDOT Working Day Conversion Chart.......................................................... 165
E.2: SCDOT Working Day Conversion Chart for Resurfacing Projects ................. 166

LIST OF FIGURES Figure Page 2.1: Time Requirement by Project Type.................................................................... 20
3.1: Primavera’s “No Current Project” Screen .......................................................... 39
3.2: Primavera’s Default Import Project Screen ........................................................ 40
3.3: Primavera’s Renamed Project Screen................................................................. 40
3.4: Primavera’s Activity Table View ....................................................................... 41
3.5: Primavera’s Calendar Association...................................................................... 42
3.6: Primavera’s Updated Project Completion Date.................................................. 43
3.7: Primavera’s Gantt Chart View............................................................................ 44
3.8: Primavera Logic Diagram................................................................................... 45
3.9: Adding Float Columns........................................................................................ 47
C.1: Resurfacing Logic Part 1................................................................................... 120
C.2: Resurfacing Logic Part 2................................................................................... 121
C.3: Bridge Replacement Logic Part 1 ..................................................................... 122
C.4: Bridge Replacement Logic Part 2 ..................................................................... 123
C.5: Bridge Replacement Logic Part 3 ..................................................................... 124
C.6: Bridge Replacement Logic Part 4 ..................................................................... 125
C.7: Bridge Replacement Logic Part 5 ..................................................................... 126
C.8: Bridge Replacement Logic Part 6 ..................................................................... 127
C.9: Bridge Replacement Logic Part 7 ..................................................................... 128
C.10: Bridge Replacement Logic Part 8 ................................................................... 129
C.11: Intersection Improvements Logic Part 1 .......................................................... 130

1
C.12: Intersection Improvements Logic Part 2 .......................................................... 131
C.13: Intersection Improvements Logic Part 3 .......................................................... 132
C.14: Intersection Improvements Logic Part 4 .......................................................... 133
C.15: Secondary Road Improvements Logic Part 1................................................... 134
C.16: Secondary Road Improvements Logic Part 2................................................... 135
C.17: Primary and Interstate Improvements Logic Part 1 ......................................... 136
C.18: Primary and Interstate Improvements Logic Part 2 ......................................... 137
C.19: Primary and Interstate Improvements Logic Part 3 ......................................... 138
C.20: Primary and Interstate Improvements Logic Part 4 ......................................... 139
D.1: Case Study Data Sheet for 20.106B.................................................................. 140
D.2: Case Study Data Sheet for 20.109B.................................................................. 141
D.3: Case Study Data Sheet for 20.2001 .................................................................. 142
D.4: Case Study Data Sheet for 20.2001.1 ............................................................... 143
D.5: Case Study Data Sheet for 04.149B.................................................................. 144
D.6: Case Study Data Sheet for 42.471A ................................................................. 145
D.7: Case Study Data Sheet for 29.106B.................................................................. 147
D.8: Case Study Data Sheet for 26.100B.................................................................. 149
D.9: Case Study Data Sheet for 30.779 .................................................................... 151
D.10: Case Study Data Sheet for 26.994.1 ............................................................... 152
D.11: Case Study Data Sheet for 26.994 .................................................................. 153
D.12: Case Study Data Sheet for 21.102B................................................................ 154
D.13: Case Study Data Sheet for 27.100C................................................................ 155
D.14: Case Study Data Sheet for 28.102C................................................................ 156

2
D.15: Case Study Data Sheet for 13.107B................................................................ 157
D.16: Case Study Data Sheet for 13.113C................................................................ 158
D.17: Case Study Data Sheet for 14.127B................................................................ 159
D.18: Case Study Data Sheet for 27.101B................................................................ 160
D.19: Case Study Data Sheet for 31.123B................................................................ 161
D.20: Case Study Data Sheet for 9.100B.................................................................. 162
D.21: Case Study Data Sheet for 23.135B................................................................ 163
D.22: Case Study Data Sheet for 12.129B................................................................ 164

CHAPTER 1
INTRODUCTION
Background As documented in a research report prepared by the University of Kentucky for
the Kentucky Transportation Cabinet (Hancher and Werkmeister, 2000), some states
utilize manual approaches to determining contract time, whereas others utilize CPM
software. At the time the report was issued, Florida and Indiana had comprehensive
manual systems in place. Texas utilized a computer based system utilizing software
packages Lotus 1-2-3, Flash Up, and Super Project. The report stated that the Louisiana
DOT developed a computer system similar to the system which was implemented in
Texas.
The report authored by Hancher and Werkmeister, describes in detail the
computer system that was developed for the Kentucky Transportation Cabinet. The
developed system was comprised of six project templates corresponding to the following
project classifications: reconstruction limited access, reconstruction open access, new
route, relocation, bridge rehabilitation, bridge replacement. A working committee was
formed to establish critical path controlling activities for each project classification,
activity logic relationships, and activity production estimates. There were a total of
approximately 40 critical path controlling activities for each category template. A range
of activity production rates were determined considering such factors as project location,
soil conditions and topography,

2
and project complexity. The system was incorporated into sets of Microsoft Excel and
Microsoft Project Templates.
Other reports and research documents have been developed for the purpose of
identifying methods for determining contract time for highway construction projects.
The National Cooperative Highway Research Program has examined this topic on two
occasions. The first document, Synthesis of Highway Practice 79 (Transportation
Research Board, 1981), was authored in October 1981 and provided basic suggestions to
improve the methods being used to determine contract times. This report also suggested
methods for improving contract time determination in the future. Most notably was the
suggestion for developing historical data to be used in determining production rates and
accounting for environmental impacts. The report also stressed the importance of
uniformly enforcing contract deadlines and monitoring work progress. In the following
years many changes to the highway construction industry caused a need for updated
information. In 1995 the National Cooperative Highway Research Program published an
updated report on this subject (Herbsman & Ellis, 1995). The second document,
Synthesis of Highway Practice 215 (Herbsman & Ellis, 1995), provided updated
information intended to improve the methods being used to determine contract times.
Synthesis of Highway Practice 215 (Herbsman & Ellis, 1995) was created by the
Transportation Research Board to identify the methods being used by DOTs to determine
contract time for highway construction projects. The report was based on a review of
literature current through the early 1990’s as well as interviews with practicing project
schedulers, construction contractors, and responses to a detailed questionnaire from 43
state and provincial DOTs in the United States and Canada. The report identified the

3
most frequently used techniques and contracting methods. It also touched on the
satisfaction level of the estimators and the accuracy of the techniques being used.
The Synthesis Practice 215 report specifically noted that there has been a shift in
the type of highway construction being performed and that current projects tend to have a
greater impact on the traveling public. Keeping construction times short on heavily
traveled roads is important to minimize economic impact and delays to public users.
Estimating project durations requires knowledge of construction and an understanding of
the uncertainties associated with a project. Some of the influencing factors identified by
DOT practitioners in Synthesis 215 are:
Geophysical o Weather o Location o Environmental
Construction Operations o Mobilization o Materials o Utility Relocation o Conflicting Operations o Traffic o Night/Weekend Work
Project Characteristics o Project Type o Dominant Operations
Economic/Legal o Budget o Letting Time o Permits
Miscellaneous o Project Size o Operation Overlays o Project Urgency o Community Events
It is suggested that each of these factors must be taken into consideration when estimating
contract time for a highway construction project.

4
State Departments of Transportation utilize a variety of techniques for estimating
contract time. The most popular are bar charts, CPM, and spreadsheets. Some DOTs use
simplified procedures for rapid determination of contract time for small or routine
projects. The most basic of these procedures uses a predetermined list of controlling
operations for which durations are estimated. The sum of the durations is then used as
the contract time. The scheduler will then adjust the schedule based on judgment and
convert the contract time to working days, calendar days, or a completion date as
appropriate using some conversion factor.
DOTs are currently using variations to their contracting practices to reduce
contract times. The most common practices are:
Incentive/Disincentive – the contractor is rewarded for early completion and penalized for late completion. The incentive is generally based on the road user cost.
Bidding Cost and Time A+B – Contracts are awarded based on a combination
of the bid cost and the contractor’s schedule. In this case the contract time is determined by the contractors bid.
Lane Rental – The contractor must rent the lane of traffic they will be closing.
The cost is included in the bid and finishing early results in higher profit for the contractor.
Flex time – The contractor is given a flexible start date.
According to Synthesis of Highway Practice 215 most practitioners interviewed
expressed satisfaction with their current contract time determination procedures but
indicated interest in making improvements. The synthesis survey found little evidence of
objective assessment of experience with contract time estimation. New Hampshire
compared 20 percent of completed projects from 1985 to 1991 with estimated contract

5
times. They determined that 63 percent of these projects under ran the estimated contract
time.
The report concluded that although DOTs expressed satisfaction with their
contract time determination procedures, they are generating durations longer than may be
required for actual project construction. There is evidence that innovative contracting
methods can be useful in shortening contract times. There are substantial benefits to the
public and lowered financial risk if contract time can be more accurately estimated. The
report suggests that the transportation agencies should pool data on construction project
durations and the factors which are likely to affect the durations in order to produce new
and accurate predictive models. The report indicated that a statistical data base is needed
for contract time estimation and that expert systems may be developed in the future to
help supplement the strong reliance on professional judgment as a factor for determining
contract durations.
Research on the subject has also been conducted by the Iowa and Texas
departments of transportation in an effort to develop better contract determination
procedures (Hancher et Al., 1992). Both states found that there were many methods
being employed to determine contract time. The most popular methods identified in the
reports were chart schedules based on production rate data and judgment of senior
personnel.
More recent research conducted by individual states has generally led to contract
time being determined with the aid of computer software. Improvements to computer
technology and the available software have made computer aided scheduling possible for
most agencies and it appears that many departments of transportation are adopting

6
contract time determination techniques which include the use of computer scheduling
software. The use of computer scheduling software has also made it possible to more
easily evaluate requests for contract time extensions. Using scheduling software state
departments of transportation are able to compare requests for time extensions with the
original plan to help determine if a delay results in a change to the critical path of work.
Time extension claims are common throughout the highway construction
industry, and often both the contractor and supervising engineers spend a considerable
amount of time substantiating and analyzing claims. There are multiple techniques and
approaches that can be used to analyze and review delays. Often, the contractor will
submit a claim for a time extension based on one or more methods and techniques
available, upon which the engineer will assess the claim. The engineer will then evaluate
the claims for excusable delays, and then analyze the impact on the project completion
date, using one of multiple approaches. The following are several delay analysis
techniques that are currently in use throughout the construction industry.
The global impact technique is a summarization technique whereby all delays are
plotted on a bar chart. The format displays the sum of all the delay durations for each
individual activity (Bramble, Barry, & Callahan, Michael, 2004). This method is
simplistic, and can therefore often overestimate the actual amount of delay on a project.
Because many activities are executed in parallel with others, there is no way to determine
concurrent delays using this method.
Another delay analysis technique currently used in the industry is the net impact
technique. This is a bar chart summarization format, where all suspensions, delays and
disruptions are plotted on the as-built schedule (Bramble, Barry, & Callahan, Michael,

7
2004). This method takes into account concurrent delays when estimating the net effect
of all the delays. Time extensions are requested based on the comparison of the
completion dates of as-planned vs. as-built.
The ‘as built but for’ delay analysis technique is used to analyze non-excusable
delays which are entered into the as-built schedule. This modified schedule is then used
to update the expected project completion date. Once completed, the as-built is
compared to the as-planned CPM schedule. For the party that accepts the responsibility
for the delays, the adjusted schedule would show the completion date what could have
been achieved ‘but for’ the party-caused delays (Alkass, Mazerolle, & Harris, 1996). The
difference in calendar or working days is then attributable to the contractor. This method
does not take in consideration the possibility for changing critical paths throughout the
project life cycle.
The time impact technique is another method used for analyzing delays in the
construction industry. In this method delays and their effects are analyzed during the
progress of construction. Each delay is then scheduled in with the activity at the stage of
construction in which it falls. The delay calculated is the difference between the
projected completion date and the delayed completion date for that stage. The total delay
of the project is the sum of all the delays for each stage during the project. This is
intended to show a ‘stop action picture’ of the project both before and after a delay
(Alkass, Mazerolle, & Harris, 1996). This method does not take into consideration the
possibility of concurrent delays.
The snapshot technique method is similar to the time impact technique, in that it
compares the as-planed to the modified as-built schedules during the life cycle of the

8
project. The snapshot technique however does not merely focus on specific delays, it
divides the total project duration into several time periods. These time periods, or
snapshots, coincide with major project milestones (Alkass, Mazerolle, & Harris, 1996).
Within the snapshot period, the relationships and durations of the as-built schedule are
overlapped with the as-planned schedule. The remaining durations that follow this
snapshot are still maintained in the process. The extended project completion date is
compared to the original as-planned completion date before the snapshot technique was
implemented. The difference in completion dates is the amount of time delay that
occurred to the entire project due to the delayed activities in that specific snapshot period.
Theoretically, the more snapshots used, the greater the accuracy is for evaluating the time
extensions.
The final technique is the adjusted as-built CPM technique. It involves an as-built
schedule that is developed using the Critical Path Method (CPM) format. Delayed
activities are depicted as new activities and are linked to the specific delayed work
activity within the network. The critical paths are then depicted twice; first as the as-
planned schedule, the second as the as-built schedule. The difference between the two
completion dates would be the time that a claimant would request compensation.
Research Objectives
The overall objective of the research described herein was to identify best practice
approaches to project time duration estimates and project time extension evaluations. A
CPM based methodology was to be developed and compared to the current method being

9
used within the South Carolina Department of Transportation (SCDOT). The SCDOT
Research Problem Statement upon which the research was based, listed four specific
research objectives as follows:
1. Identify the best practices to calculate construction time. 2. Evaluate current methods in use. 3. Recommend changes to improve SCDOT’s process for calculating
construction contract time without significantly increasing cost of construction.
4. Recommend changes to improve the process for calculating construction
time extensions.
The following section outlines the process which was utilized to meet these
objectives.
Research Methodology
In order to meet the project objectives, the following research methodology was
followed. A literature review was conducted to identify relevant material relating to
highway agency practices for determining contract time and evaluating contract time
extensions. With this information and input from a SCDOT Research Steering Team, a
survey was developed. The survey was intended to help identify current practices being
used by other states. The survey was also used to identify the effectiveness of each
system and its advantages and disadvantages.
Basic critical path logic templates were developed with the help of the research
steering team for 5 broad project types. The templates utilized production rate data
which is currently available, and project activities which are considered to be critical.
The template logic was incorporated into commercially available scheduling software and

10
used to evaluate projects which have already been completed. Template execution logic
was compared to the original estimate and actual project completion dates. A
demonstration of the software was presented to SCDOT scheduling personnel and
feedback was gathered about its potential usefulness and implementation. The following
paragraphs describe the research methodology in greater detail.
A meeting with the SCDOT Research Steering Team and other SCDOT personnel
was held September 24, 2004 to discuss current SCDOT practices for determining
construction contract time and construction contract extensions. The meeting was also
used to brainstorm specific questions about how other states were determining
construction contract time and construction contract time extensions. Results from this
meeting were used to develop a survey which was distributed to each state. A copy of the
survey can be found in Appendix A and the results are summarized in the current
practices section of this report.
A meeting and work session with the SCDOT road design schedulers was held
October 11, 2004 to examine the method currently being used to determine contract time.
Currently SCDOT is estimating approximately 30 projects per month. The method being
used is an integrated system using Microsoft Access and Excel software. Depending on
the complexity of the project being scheduled it will be assigned to one of two persons.
The less complex projects schedules are forwarded to an entry level estimator with a job
classification of CE1. The more complex projects are given to a more experienced
estimator with classification of CE2. The simple projects tend to be resurfacing and
rehabilitation. The CE1 will take general information about the project and the quantities
of work that need to be performed and enter them into a standardized spreadsheet. The

11
spreadsheet automatically detects the work items that have been designated as controlling
and places them into an appropriate workbook page. The estimator then runs a Visual
Basic program which queries an access database and extracts production rates for each
controlling item. The estimator will then narrow the retrieved data based on the date and
engineering district. The spreadsheet then retrieves an average production rate and places
it into the estimating worksheet. The computer automatically determines the time
required by each work item based on the quantity and production rate. The spreadsheet
automatically sums the time required to perform all of the controlling items. This time is
then multiplied by a concurrency factor to account for work that can be simultaneously
performed. The total adjusted time is used in conjunction with a working days chart to
determine a completion date for the project based on the letting month. The working
days chart takes into account weather conditions which are generally encountered and
allows a specific number of working days for each month. A copy of the working day
conversion charts can be found in Appendix E. Generally 20-25 of the schedules
prepared each month will fall into this category. More complex projects are completed in
much the same way. However it is more time consuming since the scope of these
projects is much broader and there are a greater number of controlling work items. The
CE2 will usually be assigned ten of these projects per month.
During this meeting concerns were voiced that any changes recommended would
need to be applicable without significantly raising the amount of time required to
generate an estimate construction contract time. Additionally it was desired that
production rates could still be automatically queried and filtered from the existing
database.

12
A meeting with the SCDOT Research Steering Team and other SCDOT personnel
was held 11 April 2005 to develop logic relationships for critical path scheduling. Five
critical path templates were created based on SCDOT pay items and project types that are
typically encountered. The five templates developed were for the following project
categories: Bridge Replacement, Intersection Improvement, Primary and Interstate
Improvements, Resurfacing, and Secondary Road Improvements. The CPM logic
relationships developed at this meeting are reproduced in Appendix C.
Following the April 11, 2004 meeting the Research Steering Team provided
project information from previously completed projects to use as case studies in
comparing the use of scheduling software to their current method. The case studies were
used to determine how close the CPM logic came to the actual project completion dates.
The case studies were also used to determine the amount of manpower needed to develop
construction contract time using scheduling software. Initially four case studies were
entered into two software packages. The software packages used were Microsoft Project
2003 and Primavera Project Management. Results generated from both packages were
the same. Eighteen additional case studies were examined using the Primavera software
package. Primavera was chosen since SCDOT personnel are more familiar with it and
some employees have received training on its use.
A meeting was held September 9, 2005 with members of the Research Steering
Team to discuss the case study results and demonstrate how scheduling software can be
used to determine contract time and evaluate requests for contract time extensions.
Initially a brief PowerPoint presentation was given to outline how Primavera is used to
create templates, generate schedules, and examine time extension. A demonstration of

13
the procedure was then given using different templates and the case study data. The five
templates demonstrated were based on the five project categories; primary, secondary,
bridge replacement, and intersection improvement. The presentation demonstrated how
to import the templates, enter in the activity durations, and interpret the scheduled results.
The demonstration also included case studies where modifications were needed, to
demonstrate the ease inserting activities and modifying the logic. Such modifications
included, adding activities, changing calendars, modifying logic, and filtering activities
based on durations and whether they were on the critical path.
A case study was also opened to demonstrate the process for determining time
extensions for delayed projects. Three scenarios were selected to demonstrate
Primavera's ability to determine if a contractors request for an extension is justified. The
first scenario was an activity that became critical due to a delay, which caused an
extension in the project completion date. SCDOT personnel were instructed how to
determine available float remaining and how to view the Gantt chart and distinguish the
critical activities from the non critical activities. The second scenario consisted of an
activity that was delayed, but did not cause a delay in the project completion date. This
was used to determine that an extension to the overall project duration was not justified.
The final scenario involved multiple activities that were delayed and how Primavera was
able to calculate the new project completion date.
After completion of the demonstration a general discussion about the software's
potential usefulness was conducted. There was a discussion about the bridge template
being used and how it should be modified to fit the department’s needs. The bridge
construction team brought some additional data for the bridge replacement templates and

14
one case study was modified during the meeting. The results were favorable and data
was furnished for two additional case studies. User surveys were distributed to those in
attendance to help identify the perceived difficulty of using the software and its potential
usefulness in determining contact time and evaluating contract time extensions. The
survey is reported in Appendix B and the results are summarized in the Primavera user
survey results section in Chapter 4.
CHAPTER 2
CURRENT PRACTICES
Current Practices Survey
Clemson University Construction Engineering and Management graduate
research assistants created a survey to address one of the objectives of the Contract Time
and Contract Time Extension research project. The survey was intended to help identify
current practices being used by other state departments of transportation for determining
contract time as well as their methods for evaluating contract time extensions. The
survey was forwarded to the SCDOT Steering Committee in January 2005 for approval
and revision, and was then transmitted to individual personnel at each of the 50 state
DOT’s.
The primary objective of the survey was to solicit information from state DOT’s
related to their methods for determining contract time and contract time extensions. Each
DOT was asked to rate the effectiveness of their system and comment about its
advantages and disadvantages. They were also asked to rate aspects of other commonly
used systems. Questions were asked to determine the quantity of personnel that are
involved with their scheduling activities and the amount of time being spent for various
types of projects. Each survey asked the respondents to rate commonly faced issues
related to determining contract time and granting time extensions. In addition, each
respondent was asked to identify the personnel responsible for granting time extensions,
and whether they have written policies on this procedure other than what is cited in their
Standard Specifications. A copy of the distributed survey appears as Appendix A.

16
General Findings and Survey Results
Of the fifty surveys distributed, only 10 were completed and returned.
Information was gathered from the responding DOT’s describing their contract time and
time extension systems and procedures. The first question of the survey was used to
determine the type of system each state was using. Of the ten surveys received, seventy
percent indicated they were using a manual method to determine contract time. These
manual methods include worksheets and spreadsheets where the estimator would enter
production rate data and estimate the contract completion date. The states using
scheduling software were Wyoming, Oregon, and Maryland. Wyoming uses Primavera’s
Suretrak software. Oregon uses a specially developed system called AMS which is
integrated with other state and DOT systems. Maryland uses a specially developed excel
program with functionality that is different than a standard spreadsheet. The following
paragraphs summarize the survey responses and give a general overview of the methods
being used by responding agencies.
The second question of the survey was used to evaluate general perceptions about
using manual methods, scheduling software, and integrated computer systems. This
question consisted of twenty six statements which were to be rated from 1 to 5 where 1
indicated strong disagreement, 3 indicated no opinion, and 5 indicated strong agreement.
The questions and their average response are shown in Table 2.1. It can be seen that
respondents agreed that manual methods were easily adaptable, and easy to learn, but that
they felt these methods rely heavily on the judgment of the estimator. There was a
neutral response concerning the time and resources required to use these methods, and the
probability of human error. The questions relating to scheduling

17
Table 2.1: Current Practices Survey Results for Question 2
Current Practices Survey Question 2: Please rate the advantages and disadvantages of each system listed below.
Question Avg
2.01 Manual methods are easily adaptable to different types and sizes of projects 4.11
2.02 Manual methods are easy to learn and understand 3.782.03 Limited resources are needed to implement manual methods 3.442.04 Manual methods require long periods of time to complete 2.782.05 Manual methods have a high probability of human error 2.782.06 Manual methods rely heavily on the judgment of the estimator 4.112.07 Manual methods can be easily changed to meet changing needs 3.562.08 Scheduling software is easy to use 3.252.09 Scheduling software allows multiple users to easily adjust the schedule 3.252.10 Scheduling software is easily implemented 2.752.11 Scheduling software is accurate 2.882.12 Scheduling software helps ensure nothing is left out of the estimate 2.63
2.13 Scheduling software is easy to integrate with other systems such as databases 3.00
2.14 Scheduling software requires considerable training before it can be efficiently used 3.63
2.15 Scheduling software requires less man-hours than manual methods 3.00
2.16 Scheduling software is difficult to adapt to different types and sizes of projects 2.13
2.17 scheduling software can be modified to meet the changing needs of the user 3.00
2.18 Integrated computer systems are easy to use 2.71
2.19 Integrated computer systems are easily adapted to different types and sizes of projects 2.86
2.20 Integrated computer systems are easily accessed and used by multiple users 3.00
2.21 Integrated computer systems require less manpower to generate schedules than manual methods 2.86
2.22 Integrated computer systems require less manpower to generate schedules than scheduling software 2.71
2.23 Integrated computer systems are difficult to develop 3.292.24 Integrated computer systems require special training to use efficiently 3.292.25 Integrated computer systems are accurate 2.43
2.26 Integrated computer systems can be modified to meet the changing needs of the users 2.86
software solicited responses that were primarily neutral. However, it was indicated that
scheduling software was not difficult to adapt to different types and sizes of projects.
The survey did show a perception from the states which do not use scheduling software

18
that it takes considerable training before it can be efficiently used. The average rating for
question 2.14 from states using manual methods was 4.00. States that do use scheduling
software had a neutral response and did not indicate considerable training was required.
All survey responses were neutral concerning the use of integrated computer systems.
The third survey question was intended to determine how each state rated the
system they are currently using. This question was broken into five parts which were to
be rated from 1 to 5 where 1 indicated not effective, 3 indicated no opinion, and 5
indicated very effective. The questions and average responses can be seen in Table 2.2.
It can be seen that respondents felt their system was effective in generating accurate
contract times which are being achieved on most projects. The responses also indicated
that both manual methods and scheduling software methods were easily applied to
multiple sizes and types of projects and that respondents felt that they were effective in
accounting for work items which are performed concurrently. There was a neutral
response pertaining to the difficulty of learning either type of system.
Table 2.2: Current Practices Survey Results for Question 3
Current Practices Survey Question 3: Please rate the effectiveness of the system you are using in the following areas
Question Avg 3.01 The system is easy to learn 3.50
3.02 The system generates contract times which are being achieved on most projects 4.00
3.03 The system is easily applied to multiple types and sizes of projects 4.60
3.04 The production rates used are effective in generating accurate contract time 3.90
3.05 The system accounts for work items which will be performed concurrently 3.86

19
The fourth survey question asked survey respondents if their system was utilizing
work activity production rate estimates. Work activity production rates are numeric
values which describe the rate at which work can be performed and are used to estimate
the time required to complete work tasks based on estimated quantities of work. Ninety
percent of responses mentioned that they utilize work activity production rate estimates.
Four agencies indicated that their production rates are listed in a production rate table
with low and high ranges. Seven agencies indicated their mean or high/low values were
obtained from historical data. Only two respondents reported using contractor input to
help determine production rates.
Question five was asked to determine the number of hours and manpower
requirements for generating schedules for various types of projects. Eight survey
responses included the number of people being used to generate contract time while only
five listed the number of hours required. Six of eight responses indicated that one person
is used to generate contract time regardless of the type. One response stated two people
are used to generate all contract times and one response stated three or four people are
used depending on the project type. There was a wide variation in time required to
generate contract time for each category. The category types and response range can be
seen in Table 2.3 and a graphical representation of the data can be seen in Figure 2.1.
The large standard deviation for large primary and large bridge are primarily caused by
survey respondent 4 who indicated more time to estimate these types of projects. Survey
respondent 1 and survey respondent 5 also contributed to the wide range since they
indicated less time was needed for each project type. It is possible that survey

20
respondents interpreted this question differently and included or excluded steps used in
their entire process for determining contract time.
Table 2.3: Current Practices Survey Results for Question 5
Current Practices Survey Question 5: Please indicate the time in a range of hours that is required to
generate a schedule using your current system for the following project types
Question Project Type Range (hours) AverageStandard Deviation
5.01 Large Primary 2 - 40 14.20 14.70 5.02 Small Primary 1 - 16 6.40 5.94 5.03 Secondary .5 - 8 4.73 3.38 5.04 Rehabilitation 1 - 8 3.80 3.01 5.05 Large Bridge 5 - 24 8.60 8.98 5.06 Small Bridge .75 - 3 2.65 2.04
Figure 2.1: Time Requirement by Project Type
Time Requirement by Project Type
05
1015202530354045
Large
Prim
ary
Small Prim
ary
Secon
dary
Rehab
ilitatio
n
Large
Brid
ge
Small Brid
ge
Project Type
Hou
rs
Survey 1Survey 2Survey 3Survey 4Survey 5

21
Question six asked if production rates were used only for what is judged to be
schedule controlling work items. Eight of survey respondents indicated that that this was
the case. The two responses which did not indicate using production rates were both
using scheduling software.
Question seven was intended to identify if production rate data was being stored
in data files by project category. Only one response indicated production rates were
being stored in this manner. Other respondents indicated the use of production rate tables
and databases containing all production rate data.
Question eight was used to determine how each state determines their production
rate values. All responding agencies indicated that their production rates were based on
historical data. State agencies were also adjusting their production rate estimates on
engineering judgment, contractor input, and Industry data. The percentage of
respondents using each of these sources can be seen in Table 2.4.
Table 2.4: Methods Used for Determining Production Rate Values
Production Rate Basis DOT Survey Practice Numbers Historical Data 10 Engineering Judgment 8 Contractor Input 5 Manufacture/Industry 1
Question nine asked respondents if production rates extracted from historical data
should be based on the number of previously completed projects. One survey indicated
that a greater number of projects improve the credibility of the data. Another response
indicated that it was taken into consideration but not based upon it. Responses from all
surveys were split with five stating it should and five stating it should not.

22
The next question asked survey respondents if a concurrency factor was being
applied to the estimated number of working days. A concurrency factor is a number
between 1 and 0 which is used to lower the total number of working days for a project.
The concurrency factor is intended to account for activities which may be happening
simultaneously. Two surveys indicated that this method was being used while seven
indicated they were not. Both states using this method were employing manual methods
to determine contract time. One response indicated the concurrency factor was adequate
and the other had no strong feelings about its adequacy.
The survey also asked respondents if there was a process for converting estimated
time into “contract working days.” Responses were split with 5 indicating yes and 5
indicating no. Several methods were being used for this conversion including weather
charts, set number of working days per month, and set number of working days per year.
This question asked if a detailed analysis was used which takes into account weather,
holidays, and the time of year. The following Table 2.5 shows the percentage of
respondents which use more detailed analysis for each of these factors.
Table 2.5: Percentage of DOT’s Using Detailed Analysis
Current Practices Survey Question 11: Is There a More Detailed Analysis that Takes into consideration
Question
Number of DOT’s Using a More
Detailed Analysis 11.01 Anticipated Weather 6
11.02 Holidays 5
11.03 Time of Year 7 The last question related to contract time determination was used to determine
what circumstances would alter the standard approach agencies use for determining

23
contract time. This question was broken into five parts which were to be rated from 1 to
5 where 1 indicated barely alter, 3 indicated neutral, and 5 indicated strongly alter. Table
2.6 shows the average survey response for this question. Incentive contracts with tight
schedules, complex coordination involving utilities, unusual traffic conditions, and time
of day restrictions were listed as events that would strongly alter the standard approach.
Concurrent projects were not indicated as something which would alter the standard
approach. It can be seen that many common problems require special consideration when
determining the contract time.
Table 2.6: Circumstances that Alter Standard Approach
to Determining Contract Time
Current Practices Survey Question 12:
Which of the following circumstances would alter the standard approach to determining contract time?
Question Avg 12.01 An incentive contract with a tight schedule 4.50 12.02 Concurrent Projects 3.50 12.03 Complex coordination involving utilities 4.00 12.04 Unusual traffic conditions 3.80 12.05 Time of day restrictions 4.30
For the contract time extension portion of the survey a list of potential problems
was presented and the respondent was asked to rate the relative delay frequency. This
question was divided into eleven sections where each were to be rated from 1 to 5, where
1 indicated a rare occurrence for time extensions, 3 indicated a neutral response, and a 5
indicated a frequent problem which required time extensions. The question and the data
collected from the survey responses are listed in Table 2.7. The most frequently cited
problem was identified as utility relocations, which was rated higher than other
responses. The second most frequently cited problem was major unanticipated work that

24
affects the schedule completion. As seen in Table 2.7, industry wide labor boycotts were
not commonly encountered by the responding DOT’s, therefore it had a low level of
consideration for time extensions.
Table 2.7: Current Practices Survey Results for Question 1
Current Practices Survey Question 1: Please rate the potential problems considered for time extensions based on rates of
occurrence Question Avg
1.01 3rd party delays not disclosed in contract documents 2.91.02 Existence of facility owned or operated by a 3rd party 2.6
1.03 Additional approvals, permits ,regulations, not attributable to a contractors submission 2.6
1.04 Restraining orders issued by court not caused by a contractors submission 2
1.05 Labor boycotts 1.61.06 Material shortages 2.81.07 Unusually severe storms 2.6
1.08 Determinations of the dept to open certain sections of the project before entire completion 2.9
1.09 Major unanticipated work that affects the schedule completion in the contract 3.3
1.10 Failure of state to provide individual rights-of-ways parcels for a period of the time beyond that indicated in the contract 2.3
1.11 Utility relocations 3.7 In addition to the list of potential problems considered for time extensions, the
survey asked if there were other commonly faced items that were not mentioned within
the survey. One state indicated that design errors were commonly encountered and cause
delays for many projects.
When asked if significant items of work overrun the bid quantities, seven
indicated that only under conditional agreements would the overruns result in contract
time extensions. The survey also asked the states to identify if time extension days are
computed as some percentage of the cost of extra work. Responses were split with five
saying yes and five saying no. Respondents using this approach were asked for
comments. One response stated that time extensions are calculated based on the dollar

25
value of the additional work and as a ratio of the original contract amount to the original
contract time. Another response identified the use of a negotiated number of days for
time extensions based on a supplemental agreement. The supplemental agreement is for
unanticipated extra work, where there are no existing pay items. Extra time is added
based on the actual time required to do the extra work if it is determined to be controlling
or a critical operation.
Survey responses concerning the effectiveness of liquidated damages in insuring
project completion time were inconclusive. Several states gave liquidated damages a
high effectiveness rating of 5, while others indicated a rating of 1. From this information,
a rating of 3 was averaged. Responses indicating a high level of effectiveness did not
mention their liquidated damages clause, or comment on why their measures are so
effective. One response mentioned that their liquidated damages are higher than the
majority of states, causing money issues for long delays. Another state mentioned that
often the standard rate of liquidated damages are too low and need to be adjusted to
represent road user costs.
When asked if there were any internal policies or documents not fully explained
in the Standard Specifications that give guidance to engineers when determining contract
time extensions, seven of respondents said that they do have internal policies. Three
DOT’s reported that they have construction administration manuals that are used as a
guideline to follow for determining contract time extensions.
State DOT’s were asked to rate the overall effectiveness of their system for
determining contract time extensions. Several subsections to the question were rated on a

26
scale of 1 to 5, where 1 was considered not effective, 3 was neutral, and 5 was very
effective. The questions and the state DOT’s average responses can be seen in Table 2.8.
Table 2.8: Current Practices Survey Results for Question 6
Current Practices Survey Question 6: Overall how would you rate the effectiveness of your states system to determine
contract time extensions? Question Avg
6.01 Easy to learn? 3.6
6.02 The system generates contract extension times which are being achieved on most projects. 3.9
6.03 The system is easily applied to multiple types and sizes of projects. 4.1
6.04 The production rates used are effective in generating accurate contract time 3.2
6.05 The system accounts for work items which will be performed concurrently. 3.0
When asked to rate the overall effectiveness of each state DOT’s system to
determine contract time extensions, responses were rated neutral to very effective. The
highest rated aspect of the responding states system was that they are easily applied to
multiple types and sized of projects. The lowest rated section of this question was that
the system accounts for work items that are performed concurrently. Comments
regarding this low rating include that there is often no CPM schedule to analyze the data,
and that time extensions are granted based on engineering judgment.
Two of the survey responses stated that time extensions are only granted for work
items on the critical path. This low percentage is based on the responding states and their
method for determining contract time extensions. Eight of the states that responded to
the survey do not utilize CPM scheduling software or techniques to analyze delay claims,
therefore this question did not apply.

27
A general question was asked in the survey about possible improvements that
could be made to the current methods for determining contract time extensions. There
were several responses which included updating production rates, better field
documentation, and requiring CPM scheduling for all contracts. One response indicated
that an improvement to their system would be to require all contractors to submit and
maintain a CPM schedule, and to tie contract extensions to the critical path. Two states
indicated that better documentation in the field would be relative to determine when extra
work was performed. They also mentioned that interim milestones should be used to
document project performance and to follow the time allowed for completion.
The following are summaries of additional information gathered from specific
survey responses that were determined to be relevant to the research objective. The
following paragraphs briefly describe the survey response and current practices of
responding states.
Specific Practices for Contract Time Determination
The Oregon DOT is using a scheduling software program that is integrated with
other DOT and State Systems. It was described as a ‘specially developed computer
system’ which was developed in-house, in coordination with other DOT’s. The survey
response showed that they did not approve of the manual methods low accuracy or the
long man hours needed to complete. They rated scheduling software higher in accuracy,
and adaptability with low man hours. The system Oregon is using was listed as difficult
to use, and has only moderate accuracy, although it is easy to apply to multiple projects
and accounts for concurrency.

28
Much like SCDOT, Oregon’s system uses work activity production rates with low
and high values based on historical data. They do not use contractor input in determining
production rates. The personnel required to generate contract time for typical projects
was one person. The time requirement for this system was not indicated.
Wyoming uses Primavera Suretrak specifically for determining their contract
time. The survey indicated that their specific scheduling software was rated highly in
ease of use, concurrency issues, and achievable contract times. Survey responses
indicated that they believed manual methods took too long to complete, and have a large
probability of human error.
Their Primavera Suretrak software system utilizes work activity production rates
with low and high values which are based on historical data. They also use contractor
input when determining their production rates and use it to help verify the accuracy of
their historical data. For work items that have little or no historical data, they will use
engineering judgment. Wyoming does not use a concurrency factor to modify the project
working days due to overlapping activities. Wyoming uses one person to generate
typical project schedules. All bridge, rehabilitation, secondary and small primary
projects schedules required approximately 2 hours to generate, while large primary
schedules took 8 hours to complete.
Maryland uses an in-house MS Excel program as their main software system to
determine contract time. Survey responses did not rate their opinions on the other
methods for determining contract time. Ratings for scheduling software were high,
including its level of accuracy, ease of use, and ability for modification. They rated their
In-house Excel program high in its ease of use, and applications, but “not effective” for

29
overall accurate results. Their Excel software does use work activity production rates,
but the software does not include low and high values of production. They also do not use
contractor input to determine production rates. Typically engineering judgment is used
when listing the production rates for work items. Their production rates are stored in a
data file by project category as shown in Table 2.9.
Table 2.9: Maryland’s Project Categories and Quantity of Work Items
Category # of Work Items Preliminary 4 Grading 7 Drainage 23 Structures 34 Paving 23 Shoulders 25 Landscaping 12 Utilities 34
The Maryland DOT uses one person to generate contract times. The range of
hours required to generate a schedule for many typical project types seemed much greater
than other state survey responses. For example, a large primary project would take
approximately 40 hours to complete, while the next highest response was 12 hours. It
appears that Maryland’s in-house software requires more time to generate schedules than
other scheduling methods.
Currently Arkansas uses a manual method to determine contract times for the
majority of their projects. It is assumed this is accomplished in either a spreadsheet or
worksheet format, which was not specified. They rated the manual method as having
multiple advantages compared to the other more advanced techniques. The survey
response showed that their manual method does not take much time to learn, is easily

30
adaptable, has low amounts of human error, and does not take extended amounts of time
to produce results. This was the highest rated manual method received from all the
survey responses. Their manual method does use historical data with mean/low/high
values of production rates for determining contract time, and they do not utilize
contractor input.
According to Arkansas, the range of hours typically required to generate
schedules using the manual method were quite low. For example, a large primary project
would take approximately 2-4 hours to complete using one person, and a small bridge
project would take approximately 45 minutes using one person. Contract time is
established quickly and consistently by using the previously completed projects upon
which work items are based. One comment in the Arkansas survey mentioned that the
initial production rate research is very time consuming, but after being implemented
several times, the man hours needed to generate a schedule are reduced. They also
indicated a problem related to utilizing historical rates is that contractors are continually
improving their work force efficiency, forcing constant historical production rate data
readjustments.
Currently Georgia uses a manual method to determine contract times for the
majority of their projects. This is done in either a spreadsheet or worksheet format, which
was not specified. They rated the manual method as easy to learn and adapt to different
projects, but indicated a high level of human error. The manual method relies greatly on
the judgment of the estimator and requires experienced personnel. Their system utilizes
work activity production rate estimates based on historical data with ‘low’ and ‘high’
ranges which are similar to SCDOT’s production rate data. Instead of using a

31
concurrency factor, Georgia uses engineering judgment, to account for the complexity
and scope of different projects.
Currently Iowa uses a manual method to determine contract times for the majority
of their projects. This is accomplished in either a spreadsheet or worksheet format, which
was not specified. They rate their system as accurate and easily applicable to multiple
types of projects. Iowa’s DOT uses historical data, engineering judgment, and contractor
input to determine production rate values. There is one person assigned to work on
generating schedules using the manual method, but they did not mention the time
requirement for generating a schedule, or how this varies depending on project type.
Specific Practices for Contract Time Extensions
The Oregon survey showed a low indication of problems considered for contract
time extensions. The only problems that were rated medium potential included right-of-
way troubles, and utility relocations. Oregon does not compute time extensions as a
percentage of the cost of the extra work, and their survey response indicated that
liquidated damages do not provide an effective impact to insure projects are completed
on time. There are written policies which are not included in the Oregon Standard
Specifications that help give guidance to engineers for determining time extensions, but
those publications were not listed.
The Wyoming survey identified several problems that had a high potential of
occurrence for contact time extensions. These included third party delays, weather,
material shortages, right-of-way delays, and utility relocations. Wyoming will grant
contract time extensions due to overruns, depending on the original pursuit of work.

32
Their survey indicated they believe liquidated damages do help insure project completion
times.
Wyoming’s Construction Administration Manual provided guidance to engineers
that was not listed in the Standard Specifications when defining the process of granting
time extensions and change orders. Their DOT only granted time extensions for items
that were on the critical path, but Wyoming made exceptions for instances where the
delayed item was newly critical based on a readjusted CPM schedule.
Survey responses from the Maryland DOT indicated that problems including third
party delays, third party owned facilities, severe weather, and utility relocations were all
considered as having a very high potential for occurring and requiring contract time
extensions. Significant items of work were only given a contract time extension under the
condition that the work item has overrun the bid quantities by a specified percentage.
The Maryland survey expressed dissatisfaction with the effectiveness of liquidated
damages in insuring completion time.
Maryland indicated no internal written policies other than the Standard
Specifications that explained the methods for determining contract time extensions. Their
method was rated overall as neutral, meaning there was no outstanding dissatisfaction
with their process.
Survey responses from Arkansas indicated that the main problems with high
potential for requiring contract time extension included an industry wide material
shortage, the department deciding to open certain sections of the project before
completion, and utility relocations. The Standard Specifications for Arkansas list the
occurrences that result in a possible contract time extension. Time extension

33
determinations are typically handled by the construction field engineer. Often, additional
work is authorized by change orders in the field. Additional contract time is frequently
included in these agreements. The only internal written policies not listed in the Standard
Specifications that give guidance to engineers when determining contract time extensions
are for fixed day contracts. Field engineers use a ‘historical average number of working
days per month’ document, similar to the SCDOT working days conversion chart shown
in Appendix E.
Survey responses from Georgia indicated that the main problems with high
potential for requiring contract time extension included third party owned facilities, major
unanticipated work, and utility relocations. Standard liquidated damages are rated as
being too low, and on projects where liquidated damages could be modified to represent
road user costs, survey respondents believe this approach should be taken. The survey
also indicated that current methods could be improved by removing the amount of
political constraints that exist.
The survey response from the Iowa DOT indicated that the main problems with
high potential for requiring contract time extension included additional permits, right-of-
way issues, and utility relocations. Iowa does not have any written policies other than the
Standard Specifications to give guidance to engineers when determining contract
extensions. They suggested improvements could be made by implementing an automated
method to reduce errors associated with the time extension process.
The survey forwarded to personnel at each of the 50 state DOT’s was intended to
provide information relevant to the methods being used for determining contract time and
contract time extensions. A limited number of responses were received, and from these

34
responses, some measures of system effectiveness, disadvantages, and advantages were
obtained. Respondents also provided information that involved the common problems
that are encountered that are often considered for contract time extension. Additional
information was disclosed about the internal written policies and procedures used when
determining their contract time extensions.

CHAPTER 3
CPM SCHEDULING
Logic Development To address the objectives of the research, described herein, it was decided that
critical path scheduling should be investigated with the aid of computer software for
determining contract time and examining contract time extension issues. The current
method being used by SCDOT to determine contract time involved querying production
rate data from a centralized database, and filtering it based on the date and engineering
district where the project was to be performed. The data being retrieved in this process
was for work tasks, which were considered to be critical activities. In an effort to
integrate the current method and continue using the historical data, logic networks were
developed for critical path scheduling using pay items from the existing database. These
items were used to develop generic logic diagrams which could describe the order of
work for several different types of projects that are typically encountered. Logic diagram
templates were developed for the following five project categories: bridge replacement,
intersection improvement, primary and interstate improvements, secondary road
improvements, and resurfacing. Logic diagram templates for the five project categories,
as utilized in Primavera, appear in Appendix C.
Primavera Capabilities Primavera Project Management is a flexible scheduling software package with
many capabilities. The software is easy to learn and has a user interface similar to many

36
other windows based programs. Primavera software is available in enterprise and stand
alone versions which make it versatile for use by single or multiple users. Primavera uses
Dynamic Data Exchange (DDE) and Object Linking and Embedding (OLE) to allow
users to insert data, graphs, tables, and figures from other applications. It will also allow
users to create project templates, which can be stored and used for future projects. The
program can also be used to group and view multiple projects at the same time.
Primavera provides the ability to view the project in Gantt or PERT format.
When viewing a Gantt chart, it will allow the user to roll up project activities to an
appropriate level of detail, and filters can be applied to show only specific types of
activities. Primavera also allows the user to customize colors and text to highlight
pertinent information. Additionally the ranges and units can be adjusted to create custom
views. The PERT view allows the user to focus on an activities predecessors and
successors. Primavera offers a split screen view which displays the activities and
adjacent activities in one window, and the entire network in the other window. Primavera
supports the standard logic relationships: finish to start, start to finish, finish to finish,
start to start, and is capable of showing lead and lag in these relationships.
Primavera has a number of features which allow it to track costs, schedules, and
resources. The software can be used to compare the completed work to the original
schedule, and can identify when resources are stretched beyond availability. Primavera is
capable of applying different work calendars to activities within the same project. This
helps account for activities which may have different work schedules and days off.
Primavera supports the use of three types of calendars: global, project, and resource. The
global calendar is applied to all projects. The project calendar is applied to the specific

37
project and the resource calendar applies only to a resource. The calendar feature is
especially useful for converting working days into calendar days.
Primavera features the ability to manage earned value through user input of the
percent complete for specific projects. The software will calculate: Budgeted Cost of
Work Scheduled (BCWS), Budgeted Cost of Work Performed (BCWP), Actual Cost of
Work Performed (ACWP), Schedule Variance (SV), Cost Variance (CV), Budget at
Completion (BAC), Costs Performance Index (CPI), Schedule Performance Index (SPI),
and Estimate at Completion (EAC). Each of these values is useful for project control and
can be incorporated into standardized or customized reports.
Primavera has multiple capabilities, which are in excess to what is required by
SCDOT to determine contract time. Additionally, using the software can improve
estimate accuracy and can be used to develop more accurate production rates for future
estimates. Collecting completed project data and entering it as a separate baseline on the
estimated schedule can easily show work items which may need adjustment.
Additionally, use of the Primavera Project Management software calendar feature
eliminates the need to manually determine project completion dates.
Using Primavera to Calculate Contract Time
The following paragraphs outline how Primavera can be used to determine project
completion times and evaluate requests for contract time extensions. The example
utilizes a case study which was examined and includes screenshot graphics most
applicable to the research effort.

38
The project used for this example is Project No. IM-IM88(012) File No. 12.129B
& 46.131B. This project uses the “Primary and Interstate Improvement” template
developed by the SCDOT Research Steering Team. A complete schedule analysis using
Primavera involves several steps which are outlined below.
After opening Primavera Project Management the desired template can be
imported. To do this, select the import option from the drop down file menu. The
templates are in .XER format which is the first option given in the “Import” dialogue
box. Selecting “Next” will bring up the “Import Type” dialogue box where the user must
select the project type. The project type is “Project.” Selecting “Next” will display the
“File Name” dialogue box which allows users to select the directory and file which
should be imported. Selecting “Primary&IstateImprovements.xer” will import the
desired template for this case study. The “Import Project Options” dialogue box will
appear where the user must complete the “Import To” field. Clicking the empty field will
bring up a list of available “Enterprise Project Structures.” Select the appropriate EPS
which will depend on how you choose to organize your projects. Selecting “Next” will
bring up the “Update Project Options” dialogue box. Leave the default selection and
select “Next.” Selecting “Finish” will cause the program to import the template which
should be followed by pop up box which indicates “The import was successful.” The
“No Current Project” Screen should now appear as shown in Figure 3.1.

39
Figure 3.1: Primavera’s “No Current Project” Screen
Selecting the “Projects” button will bring up a list of projects currently saved in
the database. The imported project will have the default file name which can be changed
by selecting the name and typing in the desired project name. Figure 3.2 shows the
default name and Figure 3.3 shows where it has been renamed to “Case Study 1”.

40
Figure 3.2: Primavera’s Default Import Project Screen
Figure 3.3: Primavera’s Renamed Project Screen

41
The template can now be opened by right clicking the “Case Study 1” and
selecting “Open Project.” The project will open with the activity table view as shown in
Figure 3.4.
Figure 3.4: Primavera’s Activity Table View
The “Original Duration” field should be filled in with the appropriate data
obtained from the “Calculation of Contract Time Spreadsheet.” While filling in each
activity, the bottom half of the screen shows general and specific information about the
task. Each task should be associated with the correct “Activity Calendar.” This process
is illustrated in Figure 3.5 where the activity “Borrow Excavation” has a 17 day duration,
and is associated with the “DOT Working Day Calendar.”

42
Figure 3.5: Primavera’s Calendar Association
Once all data has been entered the schedule can be calculated. Selecting the
“Schedule” option from the “Tools” drop down menu will bring up the “Schedule” dialog
box. Select the project start date as the “Current Data Date” and select schedule. The
activity table will update the dates and the project completion date can be seen at the top
of the activity table. This is shown in Figure 3.6 as “8-Jun-04” under the “Finish”
column at the top of the project activity list.

43
Figure 3.6: Primavera’s Updated Project Completion Date
At this point, several methods can be used to examine the project logic and
schedule. Selecting the “view” tab from the top menu allows the displayed data to be
examined in a variety of formats. One of the most useful views is the Gantt chart. This
view can be adjusted to a number of different time scales to make interpreting or printing
easier. The Gantt chart displays the activities in a bar chart format with time interpreted
by the length of the bar. The Gantt chart view can be seen in Figure 3.7.

44
Figure 3.7: Primavera’s Gantt Chart View
Another useful view is the project logic diagram. The logic diagram can be
viewed by clicking the “activity network” icon on the top toolbar. The diagram can span
several pages and may be difficult to print. When looking at the logic diagram it can be
seen that the critical path activities are highlighted and connected with red arrows. The
logic diagram can be seen in Figure 3.8.

45
Figure 3.8: Primavera Logic Diagram
If more activities are needed than are provided in the template they can be added
with minimal effort. To do this, select the activity table. Then, right click an activity and
select “Add New Activity.” Once this is completed the logic can be added by switching
to the “Activity Network” view and dragging the cursor from the end of the preceding
activity to the beginning of the new activity. The new activity should also be connected
to any following activities by dragging the cursor in a similar fashion.
Primavera Project Management can help evaluate the effect of time extensions to
the overall project completion date. It can also be used to determine whether time
extensions are for critical path activities or if granting an extension will make an activity
critical. To investigate the impact of a time extension simply change the “Original

46
Duration” to reflect the extension and repeat the “Scheduling” procedure to update the
completion date. If the activity is critical the project duration will be effected. If the
activity is not critical, it may become critical and change the project duration. Selecting
the “Activity Network” view will indicate if the modified activity is critical.
Primavera automatically saves all changes made to the project. To create a new
project simply import the desired file and make the needed changes.
Using Primavera to Evaluate Time Extensions
Primavera Project Management is an effective tool for evaluating time extensions.
The scheduling software can be used to evaluate a contractors request for a contract time
extension based on the delayed activities, remaining float, and the critical path. All the
activities that are not on the critical path can be delayed a certain number of working days
before they cause an extension in the project duration. This is the basic concept of float.
By definition, the amount of float associated with a critical activity is zero, meaning that
any delay in an activity will cause a delay in the entire project. By analyzing each
activities float, Primavera is capable of showing if a contractors request for a time
extension is justified. If the request is justified, the software can help determine the
appropriate adjusted completion date.
The project used to illustrate time extension concepts is Project No. IM-
IM88(012) File No. 12.129B &46.131B. This project uses the “Primary and Interstate
Improvement” template developed by the SCDOT Research Steering Team. A complete
schedule analysis using Primavera involves several steps which are described below.

47
Once the desired project template is opened, and the schedule has initially been
generated, right-click within the activity table view and select “Columns.” This will
produce a window listing multiple options for additional information in the activity table.
Click on the “+” sign next to the row labeled “Durations.” Highlight “Free Float” and
click the arrow to add it to the Selected Options box. Repeat this process to add “Total
Float” to the Selected Options box. This can be seen in Figure 3.9.
Figure 3.9: Adding Float Columns
Once this is completed, click OK and notice there are now “Free Float” and
“Total Float” columns on the Activity Table. Primavera automatically calculates the
amount of float for each activity, which is displayed in the appropriate column.
To demonstrate how Primavera Project Management can be used to evaluate
contractor requests and claims for time extensions, hypothetical durations were assigned

48
to both critical and non-critical activities. This is used to show how the software
calculates these delays in a real world situations. Table 3.1 contains three activities that
all had been assigned durations in the case study project. These activities were chosen to
demonstrate how Primavera Project Management calculates different scenarios for time
extensions. The original duration is shown as well as the hypothetical duration when an
extension is being evaluated. The table shows the original completion date and the
completion date when the extension is being considered.
Table 3.1: Primavera Time Extension Results
Activity Original Duration
Extended Duration
Float Available
(days)
Float Remaining
(days)
Initial Completion Date
Extended Completio
n Date
Example I Guard Rails 4 days 17 days 9 0
June 8, 2004
June 11, 2004
Example II
A.C. Binder Pave 47 days 65 days 42 24
June 8. 2004
June 7, 2004
Example III
A.C. Surface
Pave 89 days 96 days 0 0 June 8, 2004
June 15, 2004
Example I & II &
III June 8, 2004
June 19, 2004
Example I shows a Guard Rail activity with an originally estimated duration of 4
days. If the contractor requested additional time to complete this activity (13 additional
work days), it would create an extended duration of 17 days. Primavera previously
calculated that the guard rail activity had 9 days of available float until it became critical.
Any delays past 9 days on this activity would result in a completion date overrun. The
guard rail activity was not initially critical, but because the extension that was greater

49
than the available float, it became critical. After the extended duration was entered into
the activity duration field, regenerating the schedule allowed Primavera to recalculate the
remaining float and new completion date. The Gantt Chart was also updated and the
Guard Rail activity was highlighted in red, indicating it as a critical activity.
Example II illustrates a non critical paving activity that was extended and did not
result in a delay in the completion date. The original activity duration was 47 days, and
the extended duration was 65 days. The activity had 42 days of available float, and the
activity was delayed 18 days. Primavera showed that the project completion date was not
effected by a delay in the paving activity; therefore no contract time extension was
required.
Example III illustrates a critical paving activity with an 89 day duration and no
float days available. Primavera recalculated the project completion date and adjusted the
Gantt chart according to the 7 day delay. In addition to these three examples, a fourth
example combined the previous three delays demonstrating the software’s ability to
calculate multiple activity delays. The scheduling software automatically updated the
duration, completion date, and Gantt Chart based on the SCDOT working day’s calendar.
Primavera Templates
The primavera templates were created based on the logic developed by the
SCDOT Research Steering Team. The templates can be easily imported and changed to
meet the needs of a specific project. The logic used to develop templates can be seen in
Appendix C and represent the types of projects being encountered on a regular basis by
SCDOT scheduling personnel. The templates will not fully represent every project

50
encountered but can be easily modified for use on many types of projects. It is likely that
the templates will serve as a starting point for SCDOT personnel and will evolve as
project types and scenarios change.

CHAPTER 4
CASE STUDIES
Case Study Methodology
Three objectives of the research were to evaluate the current method being used
by the South Carolina Department of Transportation for determining contract time, to
recommend changes to improve their process without significantly increasing cost of
construction, and to recommend changes to improve the process for calculating contract
time extensions. The case studies were intended to determine if contract times could be
determined with reasonable accuracy using critical path scheduling software. They were
also used to determine the resources which would be required to use this method. In
addition the case studies were used to examine if scheduling software could be used to
evaluate contract time extensions.
It was originally intended that six case studies would be examined for each
template. Initially one case study was used to ensure each template was working
properly. After this five more case studies were requested for each project type. In all
thirty case studies were receive. Of these, one resurfacing case study and one secondary
road improvements case study were not used because actual project completion dates
were not available. Another secondary roads case study was later found to be the project
which was initially examined. Three of the bridge replacement case studies were not
used since bridge construction data was only available for three of the selected projects.
The remaining twenty four case studies were examined using Primavera scheduling
software.

52
The following case study data and results are based on information provided by
the South Carolina Department of Transportation. Previously completed highway
construction project data was provided that included information on the type of project, a
general description of the project, work activities, quantities of work, and work days
required based on historical production rates. Also included in each case study was the
appropriate letting date, estimated completion date, and substantial work completion date.
This data was used to compare the estimated completion dates from Primavera
scheduling software to the current method being used.
All the case study data was organized by its general description, and sorted to
match the appropriate Primavera template into which it would be incorporated. The case
study data sheets are reproduced in Appendix D and show the work quantities and
associated production rates which were queried from the SCDOT database. The
worksheets have already calculated the working day durations for each estimated work
item. The work items are based on work tasks which SCDOT uses as a basis for contract
payment. The database already accounts for variations in the production rates based on
engineering districts and historical data. The number of working days shown on the case
study data sheets were entered into the appropriate template and used to calculate
schedule durations. These durations were then compared to the originally estimated
completion date and the actual project completion date. Special calendars were
developed within Primavera to account for the number of working days in each month.
SCDOT anticipates contractors will work a specified number of days each month based
on the type of work they are doing. The special calendars account for weather based on
the number of days each month which are generally conducive to performing the work.

53
Work activities within the scheduling software were associated with the calendar which
best described the limitations of doing the work. The calendars were based upon the
working days conversion charts which can be seen in Appendix E. Case studies which
were granted time extensions were used to demonstrate a method for determining
contract time extensions. The extension time was loaded into the scheduling software
and used to recalculate the completion date. The new date was then compared to the
actual date to determine the scheduling software’s accuracy. The following section
summarizes each case study and discusses the results obtained from the Primavera
scheduling method.
Case Study Summary of Results
There were a total of five case studies used with the Primavera resurfacing
template. A summery of these case studies can be seen in Table 4.1 and Table 4.2. Table
4.1 shows the initially estimated completion date, the calculated Primavera completion
date, the difference in calendar days, and the difference in working days. Table 4.2
shows the total working days calculated by Primavera, the adjusted number of working
days estimated by SCDOT, the difference in working days, and their percent difference.

54
Table 4.1: Resurfacing Project Completion Date Summery
Primavera Completion
Template FILE NO. SCDOT Estimated Completion Date Date
Difference in Cal Days
Difference in
Working Days
Resurfacing 20.106B September 30, 2001 August 24, 2001 37 29 Resurfacing 20.109B June 30, 2002 June 7, 2002 23 19 Resurfacing 20.2001 June 30, 2003 June 10, 2003 20 17 Resurfacing 20.2001.1 September 30, 2003 September 26, 2003 4 3 Resurfacing 04.149B November 30, 2004 April 4, 2005 125 34
Table 4.2: Resurfacing Project Working Day Difference
Template FILE NO.
Primavera Total Working
Days
Adjusted Working Days From DOT
Spreadsheet Working Day
Difference Percent
Difference
Resurfacing 20.106B 106 91 15 15.23 Resurfacing 20.109B 76 71 5 6.80 Resurfacing 20.2001 66 60 6 9.52 Resurfacing 20.2001.1 148 134 14 9.93 Resurfacing 04.149B 286 167 119 52.5
The first resurfacing case study, File No. 20.106B, was a 10.01 mile long
resurfacing project in Fairfield County. The originally estimated completion date was
September 30, 2001. The case study data had a footnote indicating that there needed to be
an additional 30 days for curing of asphalt prior to placing thermoplastic. The logic was
modified to allow an extra 30 calendar days for this requirement to be fulfilled. As seen
in Table 5 the Primavera completion date given was August 24, 2001 which is 37
calendar days, and 29 working days earlier than originally estimated. The total number
of working days can be seen in Table 4.2 with a difference of 15 working days between

55
Primavera’s calculation and SCDOT’s estimation. There was a 15.23% difference
between these two estimations which indicates the developed logic uses less concurrent
activities than the originally estimated 20% value. The substantial completion date for
this project was August 29, 2001 which was very close Primavera’s estimated completion
date of August 24, 2001.
The second resurfacing case study, file number 20.109B, was a federal aid
resurfacing project in Fairfield County which involved resurfacing 23.4 miles of various
roads. The initially calculated completion date was June 30, 2002. There was one
footnote requiring an extra month for curing of the asphalt before the placing the
thermoplastic. This was incorporated into the Primavera logic as an extra activity.
Primavera Project Manager calculated the completion date to be May 9, 2002 as seen in
Table 4.1. This was 23 calendar days earlier, and 19 working days earlier than the
originally calculated completion date. A 6.8% difference in total working days can be
seen in Table 4.2. The concurrency factor used in the worksheet was .8 which means
20% of activities were completed simultaneously. The developed logic has less
concurrency than the original estimation. The substantial completion date for this project
was June 13, 2002 which was closer to Primavera’s estimated completion date than the
original SCDOT estimate.
The third resurfacing case study, file number 20.2001, was a 10.07 mile long
resurfacing project in Fairfield County that was originally estimated to finish on June 30,
2003. The scheduling software calculated the project completion date as May 28, 2003.
Table 4.1 shows the date generated by Primavera was 20 calendar days earlier, and 17
working days earlier than the original estimate. Table 4.2 shows the total number of

56
working days calculated by Primavera and estimated by SCDOT. There was a 9.53%
difference in these values which indicates that concurrency developed in the logic was
less than the 20% estimated by SCDOT. The substantial completion date for this project
was June 3, 2003 which was very close Primavera’s estimated completion date of May
28, 2003.
The fourth resurfacing case study was file number 20.2001.1. It consisted of
25.37 miles of resurfacing on various roads in Fairfield County. The originally estimated
completion date was September 30, 2003. Primavera generated a project completion date
of September 26, 2003. Table 4.1 shows this was 4 calendar days earlier than the
originally estimated project completion date. This date was also 3 working days earlier
than the originally estimated project completion date. Table 4.2 shows there was a 14
working day difference between the DOT estimation and Primavera’s calculated total
number of working days. There was a 9.93% difference in the estimated total number of
working days which indicates the developed logic used less concurrency than the case
study worksheet’s value of 20%. The substantial completion date for this project was
October 24, 2003 which was later than Primavera’s estimated completion date of
September 26, 2003. This project finished late and there was no time granted for a
contract time extension.
The final case study, file number 04.149B, was a 41 mile long milling and paving
operation in Anderson county. The initially estimated completion date was November
30, 2004. Primavera calculated a completion date of April 4, 2005. This was 125
calendar days and 34 working days later than the original estimate, as listed in Table 4.1
The total number of working days can be seen in Table 4.2 with a difference of 119 days

57
between Primavera’s calculation and SCDOT’s estimation. The percent difference
between the two estimations was 52.5%. This large percentage indicates that the
concurrency factor of 0.6 used by SCDOT for the project, was significantly lower than
the amount of concurrent activities associated with the Primavera template. The
substantial completion date for this project was April 15, 2005 which was much closer to
Primavera’s estimated completion date of April 4, 2005. This project was granted an
extension which adjusted the SCDOT completion estimate to December 14, 2004.
However, this project finished late making the actual completion 11 days later than the
Primavera estimate. The contract time extension portion of this case study is discussed in
the next section.
Three case studies involving the Bridge Replacement templates were examined
with Primavera Project Manager. These case studies are summarized in Table 4.3, which
shows the initially estimated completion date, the completion date Primavera calculated,
the difference in calendar days, and the difference in working days. There is no
additional table to show the difference in total working days calculated by Primavera
compared to that of the SCDOT worksheets. For the Bridge Replacement case studies,
information was collected from two different departments at SCDOT headquarters.
These case studies included special provisions to allow additional time for the
construction of new bridges. Data was collected from the CRM department at SCDOT to
determine in detail how these time blocks were calculated. The information received was
similar to the method being used in the SCDOT worksheets. Additional logic was
incorporated into the templates to combine the two groups of data. The CRM worksheets
can be found in the Appendix E with the bridge case study data sheets. Since there were
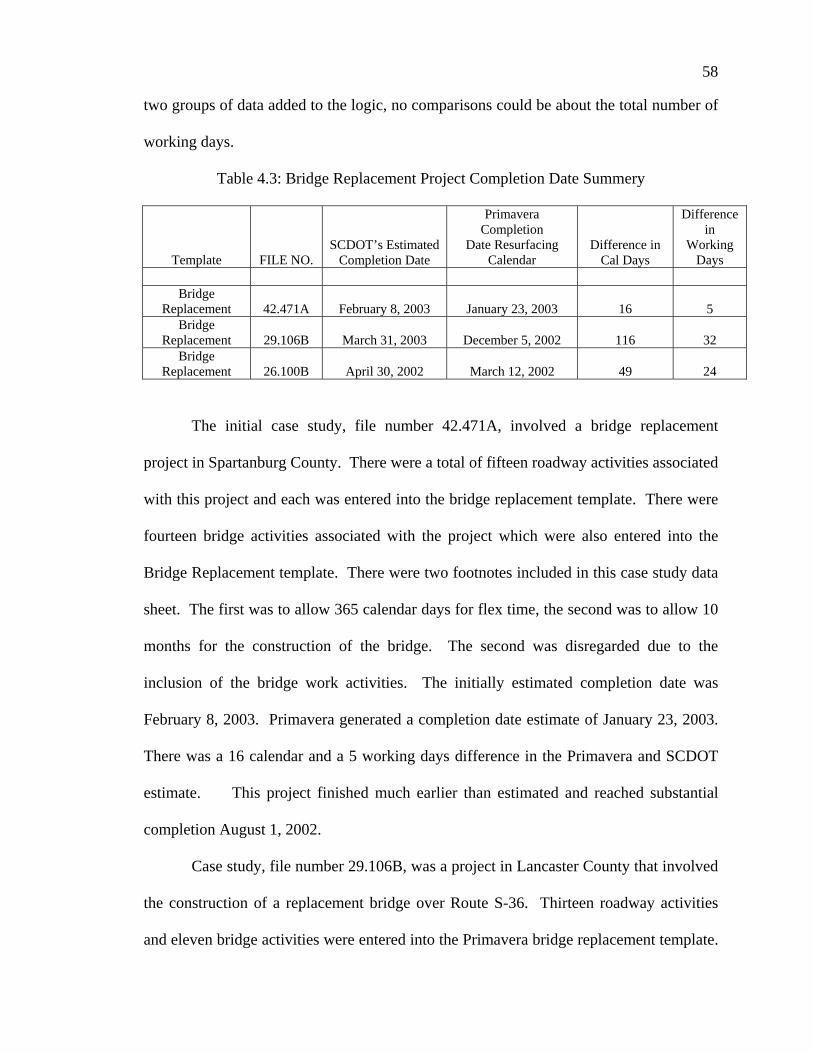
58
two groups of data added to the logic, no comparisons could be about the total number of
working days.
Table 4.3: Bridge Replacement Project Completion Date Summery
Template FILE NO. SCDOT’s Estimated
Completion Date
Primavera Completion
Date Resurfacing Calendar
Difference in Cal Days
Difference in
Working Days
Bridge
Replacement 42.471A February 8, 2003 January 23, 2003 16 5 Bridge
Replacement 29.106B March 31, 2003 December 5, 2002 116 32 Bridge
Replacement 26.100B April 30, 2002 March 12, 2002 49 24
The initial case study, file number 42.471A, involved a bridge replacement
project in Spartanburg County. There were a total of fifteen roadway activities associated
with this project and each was entered into the bridge replacement template. There were
fourteen bridge activities associated with the project which were also entered into the
Bridge Replacement template. There were two footnotes included in this case study data
sheet. The first was to allow 365 calendar days for flex time, the second was to allow 10
months for the construction of the bridge. The second was disregarded due to the
inclusion of the bridge work activities. The initially estimated completion date was
February 8, 2003. Primavera generated a completion date estimate of January 23, 2003.
There was a 16 calendar and a 5 working days difference in the Primavera and SCDOT
estimate. This project finished much earlier than estimated and reached substantial
completion August 1, 2002.
Case study, file number 29.106B, was a project in Lancaster County that involved
the construction of a replacement bridge over Route S-36. Thirteen roadway activities
and eleven bridge activities were entered into the Primavera bridge replacement template.

59
There were two footnotes given with the case study. The first indicated additional time
was needed for construction of the bridge. The second indicated the number of days for
A + B bidding should be 243. Both of these were accounted for when generating the
schedule using Primavera. The initially estimated completion date was March 31, 2003.
Primavera generated a schedule that estimated the completion date to be December 5,
2002. This is 166 calendar days and 32 working days earlier than the originally estimated
project completion date as noted in Table 4.3. This project finished earlier than estimated
and reached substantial completion November 7, 2002. This date was much closer to the
December 5, 2002 completion date generated by the scheduling software.
The final bridge replacement case study, file number 26.100B, involved a bridge
replacement in Horry County along South Carolina Highway 410. There were a total of
six activities associated with the roadway portion of this project and eight associated with
construction of the bridge. There was a footnote included in this case study allow 5
months for the construction of the bridge. This was ignored due to the inclusion of the
bridge activities in the Bridge Replacement Template. The initially estimated completion
date was April 30, 2002. Primavera calculated a completion date of March 12, 2002.
There was a 49 calendar day and a 24 working day difference in the SCDOT estimate and
the Primavera estimate. This project finished earlier than estimated and reached
substantial completion February 25, 2002. This date was much closer to the March 12,
2002 completion date generated by Primavera.
There were a total of six case studies examined with the intersection
improvements template. A summery of these case studies can be seen in Table 4.4 and
Table 4.5. Table 4.4 shows the initially estimated completion date, the calculated
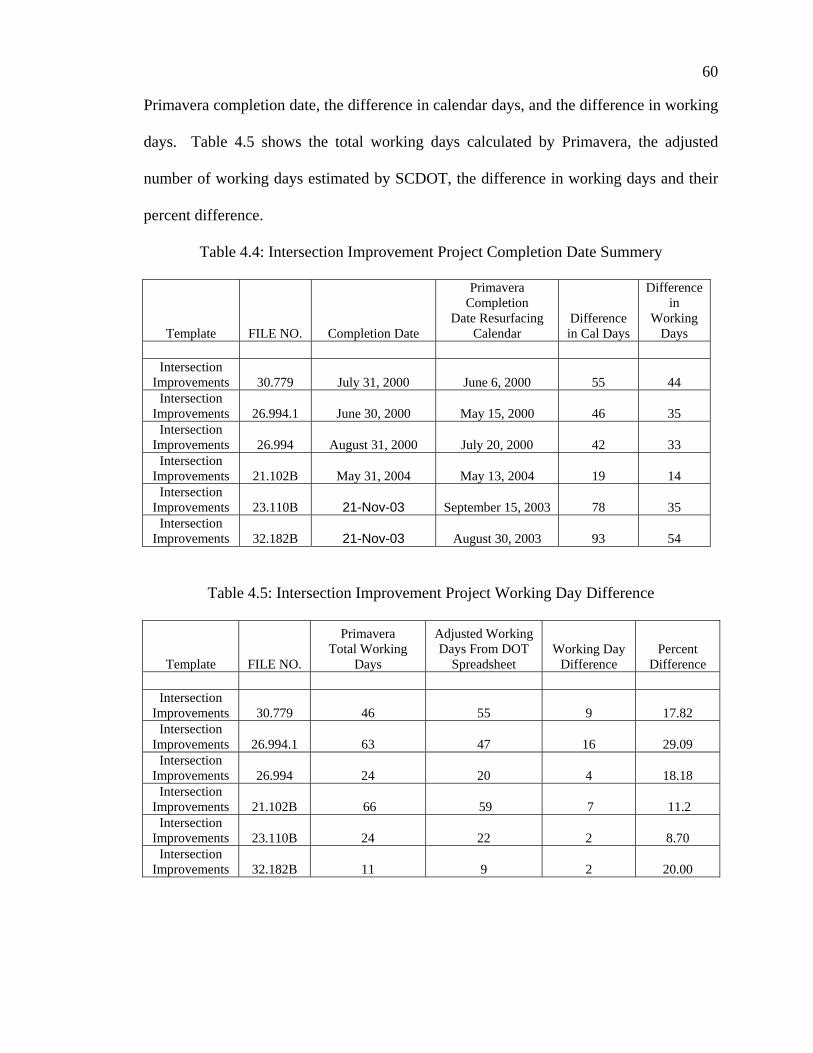
60
Primavera completion date, the difference in calendar days, and the difference in working
days. Table 4.5 shows the total working days calculated by Primavera, the adjusted
number of working days estimated by SCDOT, the difference in working days and their
percent difference.
Table 4.4: Intersection Improvement Project Completion Date Summery
Template FILE NO. Completion Date
Primavera Completion
Date Resurfacing Calendar
Difference in Cal Days
Difference in
Working Days
Intersection
Improvements 30.779 July 31, 2000 June 6, 2000 55 44 Intersection
Improvements 26.994.1 June 30, 2000 May 15, 2000 46 35 Intersection
Improvements 26.994 August 31, 2000 July 20, 2000 42 33 Intersection
Improvements 21.102B May 31, 2004 May 13, 2004 19 14 Intersection
Improvements 23.110B 21-Nov-03 September 15, 2003 78 35 Intersection
Improvements 32.182B 21-Nov-03 August 30, 2003 93 54
Table 4.5: Intersection Improvement Project Working Day Difference
Template FILE NO.
Primavera Total Working
Days
Adjusted Working Days From DOT
Spreadsheet Working Day
Difference Percent
Difference
Intersection Improvements 30.779 46 55 9 17.82
Intersection Improvements 26.994.1 63 47 16 29.09
Intersection Improvements 26.994 24 20 4 18.18
Intersection Improvements 21.102B 66 59 7 11.2
Intersection Improvements 23.110B 24 22 2 8.70
Intersection Improvements 32.182B 11 9 2 20.00

61
The first case study, file number 30.779, was a small primary project in Laurens
County. There was a footnote to add an extra month for the curing of asphalt prior to
placing the thermoplastic. This was accounted for by adding an additional activity into
the template. The case study data sheet indicated the project was let in July 2000 but
supplementary information indicated it was let in December and this date was used. The
initially estimated completion date was July 31, 2000. Primavera calculated a completion
date of June 6, 2000. Table 5.4 shows this was 55 calendar days earlier and 44 working
days earlier than the initial estimate. Table 5.5 shows the total number of working days
calculated by Primavera was 46 and the number estimated by SCDOT was 55. There was
a difference of 9 working days which corresponds to a 17.82% difference in these values.
Table 5.5 indicates that concurrency developed in the logic was greater than the 20%
estimated by SCDOT. This project finished late with a substantial completion date of
August 8, 2000.
The second intersection improvement case study, file number 26.994.1, was a
small primary project in Horry County. A footnote stated that there was an additional
month required for the curing of the asphalt before the placing of thermoplastic. This
was incorporated into the Primavera logic by including an extra activity. The initially
estimated project completion date was June 30, 2000. Primavera Project Manager
calculated a completion date of May 15, 2000. Table 4.4 shows that this was 46 calendar
days and 35 working days earlier than the initial estimate. It can be seen in Table 4.5 that
there was a difference in the total working days calculated by Primavera and estimated by
SCDOT of 16 days which corresponds to a 29.09% difference. SCDOT’s estimate of
20% concurrency was greater than the value developed in the activity logic. This project

62
was substantially complete June 16, 2000. SCDOT’s original estimate was closer to the
actual completion date by approximately 15 days.
The third intersection improvement case study, file number 26.994, involved a
project in Horry County. There was a footnote to add an additional month for the curing
of the asphalt before the placing of thermoplastic. The initially estimated project
completion date was August 31, 2000. Primavera generated a completion date of July 20,
2000. Table 4.4 shows this completion date was 42 calendar days earlier and 33 working
days earlier than the initially estimated project completion date. Table 4.5 indicates an
18.18% difference in the total number of working days calculated by Primavera and
estimated by SCDOT. The scheduling software calculated 24 total workdays while the
original estimate included only 20. The developed logic had less concurrency than the
original estimate by SCDOT. This project was granted a contract time extension which
adjusted the SCDOT estimated completion date to October 18, 2000. The project
actually finished September 6, 2000 which was earlier than this date. The contract time
extension portion of this case study is discussed in the next section. This project was
granted a contract time extension, however, details were not provided.
The fourth intersection improvement case study was file number 21.102B. The
project involved 0.9 miles of construction in Florence county. The initially estimated
completion date was May 31, 2005. Primavera Project Manager calculated a completion
date of May 13, 2005. This was 19 calendar days and 14 working days earlier than the
initial estimate given in the case study data. Table 4.5 shows the difference in the total
number of working days from the Primavera estimate and the SCDOT data to be 7 days.
The percent difference between the two estimations was 11.2%, which indicates that the

63
developed logic uses more concurrent activities than the originally estimated 20%
SCDOT value. The project was substantially completed May 31, 2004 which was the
date originally estimated by SCDOT.
The fifth intersection improvement case study, file number 23.110B, was a 0.25
mile long project in Greenville, South Carolina, that was originally estimated to finish on
November 21, 2003. The scheduling software calculated the project completion date as
September 15, 2003. Table 4.4 shows the date generated by Primavera was 78 calendar
days earlier, and 35 working days earlier than the original estimate. Table 4.5 shows the
total number of working days calculated by Primavera and estimated by SCDOT. There
was a 8.70% difference in these values which indicates that concurrency developed in the
logic was less than the 20% estimated by SCDOT. The contract time extension portion
of this case study is discussed in the next section.
The sixth intersection improvement case study was file number 32.182B. It
consisted of the construction of a turning lane in Lexington County. The originally
estimated completion date was November 21, 2003. Primavera generated a project
completion date of August 30, 2003. Table 4.4 shows this was 93 calendar days earlier
than the originally estimated project completion date. This date was also 54 working
days earlier than the originally estimated project completion date. Table 4.5 shows there
was a 2 working day difference between the DOT estimation and Primavera’s calculated
total number of working days. There was a 20% difference in the estimated total number
of working days which indicates the developed logic used approximately the same
concurrency than the case study worksheet’s value of 20%. The substantial completion
date for this project was December 12, 2003 which was later than Primavera’s estimated
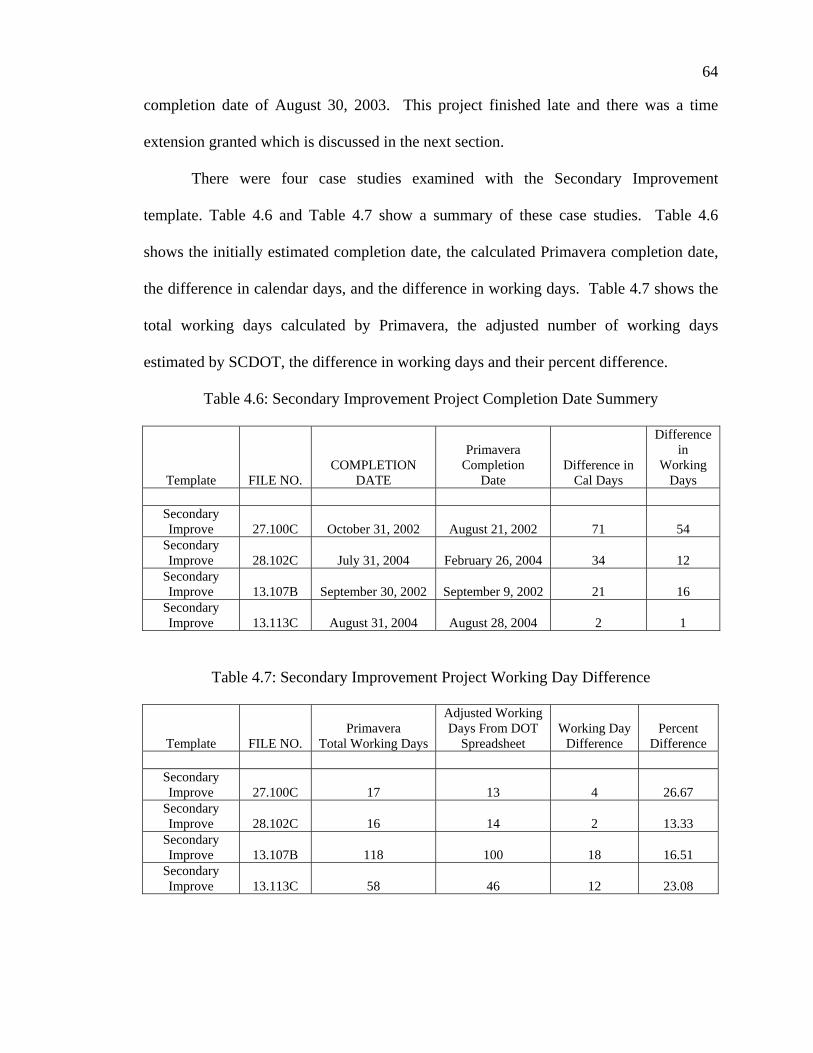
64
completion date of August 30, 2003. This project finished late and there was a time
extension granted which is discussed in the next section.
There were four case studies examined with the Secondary Improvement
template. Table 4.6 and Table 4.7 show a summary of these case studies. Table 4.6
shows the initially estimated completion date, the calculated Primavera completion date,
the difference in calendar days, and the difference in working days. Table 4.7 shows the
total working days calculated by Primavera, the adjusted number of working days
estimated by SCDOT, the difference in working days and their percent difference.
Table 4.6: Secondary Improvement Project Completion Date Summery
Template FILE NO. COMPLETION
DATE
Primavera Completion
Date Difference in
Cal Days
Difference in
Working Days
Secondary Improve 27.100C October 31, 2002 August 21, 2002 71 54
Secondary Improve 28.102C July 31, 2004 February 26, 2004 34 12
Secondary Improve 13.107B September 30, 2002 September 9, 2002 21 16
Secondary Improve 13.113C August 31, 2004 August 28, 2004 2 1
Table 4.7: Secondary Improvement Project Working Day Difference
Template FILE NO. Primavera
Total Working Days
Adjusted Working Days From DOT
Spreadsheet Working Day
Difference Percent
Difference
Secondary Improve 27.100C 17 13 4 26.67
Secondary Improve 28.102C 16 14 2 13.33
Secondary Improve 13.107B 118 100 18 16.51
Secondary Improve 13.113C 58 46 12 23.08

65
The first Secondary Improvement Project case study, file number 27.100C,
involved various roads in Jasper county that spanned 2.47 miles. There was one footnote
to allow for 30 days of flex time, and the template was adjusted to reflect this
requirement. The initial project completion date was estimated to be October 31, 2002.
Primavera calculated the project completion date to be August 21, 2002. Table 4.6 shows
this value was 71 calendar days earlier, and 54 working days earlier than the initially
estimated completion date. The total number of working days can be seen in Table 4.7
with a difference of 4 working days between Primavera’s calculation and the SCDOT
estimate. There was a 26.67% difference between these two estimations which is
primarily due to the small number of working days. This percentage indicates that the
developed logic used less concurrent activities than the original estimate of 20%. The
project was completed July 25, 2002 which was closer to the completion date estimated
by the scheduling software.
The second case study using the secondary improvement template was file
number 28.102C which involved grading, paving and drainage operations in Kershaw
County. The initially estimated project completion date was March 31, 2004. As seen in
Table 4.6, Primavera calculated that the project would be completed on February 26,
2004. This was 34 calendar days and 12 working days earlier than the initial project
completion estimate. Table 4.7 lists the difference in working days to be 2 days between
the Primavera and SCDOT’s estimation. The percent difference between these two
estimations is 13.33% which indicates the 20% estimate of concurrent activities is less
than the amount used in the scheduling software. This project was granted a contract
time extension which is examined in the next section.
66
The third case study, file number 13.107B, involved grading, paving and drainage
operations in Chesterfield County. There were two footnotes associated with this project.
The first was to allow an extra month for a 60-day award. The second footnote indicated
an extra month was needed for “set-aside”. These conditions were incorporated into the
secondary improvement template to match the footnotes. The initial project completion
date was September 30, 2002. Primavera generated a schedule completion date of
August 12, 2002. This calculated date was 49 calendar days, and 40 working days earlier
than SCDOT’s estimate. The total number of working days can bee seen in Table 4.7,
with a difference of 18 total working days. This was a 16.51% difference between
Primavera’s calculation and the original SCDOT estimation. This percentage indicates
that the develop logic uses less concurrency than the original 20% estimation. The
project finished early with a substantial completion date of July 8, 2002. The actual
completion date was closer to scheduling software’s estimation of August 12, 2002.
The last case study utilizing the secondary improvements template was file
number 13.113C. This was a 0.875 mile stretch of grading, drainage, and paving
operations in Chesterfield county. The initially estimated completion date was August
31, 2004. Primavera Project Manager calculated a completion date of August 28, 2004.
As seen in Table 4.6 this was 2 calendar days and 1 working day earlier than the initial
estimate. The total number of working days can be see in Table 4.7 with a difference of
12 working days between Primavera’s calculation and SCDOT’s estimation. The percent
difference between these two estimations was 23%, which indicates that the developed
logic has less concurrent activities than the originally estimated 20% value used by

67
SCDOT. This project was granted a contract time extension which is examined in the
next section.
There were a total of six case studies that involved the Interstate Rehabilitation
template developed with Primavera Project Manager. Those case studies are summarized
in Tables 4.8 and Table 4.9. Table 4.8 shows the initially estimated completion date, the
completion date Primavera calculated, the difference in calendar days, and the difference
in working days. The second table, Table 4.9, identifies the total working days calculated
by Primavera, the adjusted number of working days originally estimated by SCDOT, and
the percent difference between these values.
Table 4.8: Interstate Improvement Project Completion Date Summery
Template FILE NO.
COMPLETION DATE
Primavera Completion
Date Difference in
Cal Days
Difference in Working
Days
Interstate Impr. 14.127B August 31, 2003 August 21, 2003 10 8 Interstate Impr. 27.101B April 30, 2002 February 19, 2002 70 31 Interstate Impr 31.123B October 31, 2003 November 15, 2003 15 6 Interstate Impr 09.100B July 31, 2001 October 2, 2001 63 50 Interstate Impr 23.135B March 31, 2001 April 6, 2001 6 5 Interstate Impr. 12.129B July 31, 2004 July 19, 2004 12 10
Table 4.9: Interstate Improvement Project Working Day Difference
Template FILE NO.
Primavera Total Working
Days
Adjusted Working Days From DOT
Spreadsheet Working Day
Difference Percent
Difference
Interstate Impr 14.127B 21 21 0 0.00 Interstate Impr 27.101B 85 86 -1 -1.17 Interstate Impr 31.123B 6 6 0 0.00 Interstate Impr 09.100B 242 140 102 53.40 Interstate Impr 23.135B 38 39 -1 -2.60 Interstate Impr. 12.129B 130 145 -15 -10.9

68
The initial case study, file number 14.127B, was a 0.5 mile stretch of interstate
rehabilitation work in Clarendon and Orangeburg Counties. The initially estimated
completion date was August 31, 2003. Primavera Project Manager calculated a
completion date of August 21, 2003. This was 10 calendar days and eight working days
earlier working days earlier than the initial estimate given in the case study data. Table
4.9 shows the total number of working days, which was 21 for both Primavera and the
SCDOT spreadsheet. This indicates that the concurrency factor of 0.8 was approximately
the same as the concurrency developed in the interstate improvement template. The
project was substantially completed September 19, 2003. This date was later than both
estimated completion dates. This project finished late and was not granted a contract
time extension.
The next case study using the Interstate Rehabilitation template was file number
27.101B. This was an eight mile stretch of rehabilitation work in Jasper County. The
initially estimated completion date was April 30, 2002. Primavera Project Manager
calculated a completion date of February 19, 2002. As seen in Table 4.8 this was 70
calendar days and 31 working days earlier than the initial estimate. The total number of
working days can be seen in Table 4.9 with a difference of one day between Primavera’s
calculation and SCDOT’s estimation. The percent difference between these two
estimations was 1.17%, which indicates that the developed logic uses approximately the
same concurrency as the originally estimated 20% value. This project was granted a
contract time extension, however, details were not provided.

69
Case study file number 31.123B was a 3.61 mile stretch of interstate rehabilitation
work in Lee County on Interstate 20. The initially estimated project completion date was
October 31, 2003. Primavera calculated a project completion date of November 15,
2003. Table 4.8 shows that this was 15 calendar days later and 6 working days later than
the originally estimated completion date. Primavera and SCDOT both estimated the
project to have a duration of 6 working days. A 0% difference in total working days can
be seen in table 4.9 which indicates the initially estimated concurrency factor of 1.0 was
approximately the same as the concurrency developed in thelogic. The short nature of
this project led to activity logic with no concurrency. The project was granted a contract
time extension which is examined in the next section.
Case study file number 9.100B involved an interstate rehab project in Calhoun
and Orangeburg County. There were two footnotes included in this case. The first was
to allow an extra month for the curing of asphalt prior to placing thermoplastic. The
second was to allow 3 months for the construction of a bridge. Both of these were
adjusted into the template used to generate an estimated project completion date. The
initial estimated completion date was July 31, 2001. Primavera generated a completion
date estimate of October 2, 2001. This was 63 calendar days later than the initial
estimate. The Primavera estimate was also 50 days longer in working days. This
difference in the initial estimate can be seen in Table 12. The percent difference in the
working days between these two estimations was 53.4%, or 102 working days. This
large percentage is primarily due to the fact that this case study used a 0.5 concurrency
factor which was much greater than the concurrency developed in the logic. The project
reached substantial completion March 15, 2002. This date was eight months later than

70
the original estimate and approximately five months later than the Primavera estimate.
This project finished very late and no contract time extension was granted.
Case study file number 23.135B, involved using the interstate rehabilitation
template for a project in Greenville and Laurens County. There was a footnote to assume
15 working days per month. The initial project completion date was March 31, 2001.
Primavera generated a completion date of April 6, 2001 as shown in Table 4.8, this result
was 6 calendar days later and 5 working days later than the initial project completion date
estimate. A 2.6% difference in working days can be seen in Table 4.9. This value shows
that there was a minimal difference in the concurrency estimated by Primavera Project
Manager, and the SCDOT worksheets. The concurrency factor used in the worksheet
was 0.8 which corresponds to 20% of the activities being completed simultaneously. The
project reached substantial completion April 18, 2001. This date was closer to
Primavera’s estimated completion date of April 6, 2001.
The sixth interstate rehabilitation case study, file number 12.129B, was a 13.4
mile project in Chester and York counties. The initially calculated completion date was
July 31, 2004. The Primavera calculated completion date was July 19, 2004. This was 12
calendar days and 19 working days earlier than the originally calculated completion date,
as seen in Table 4.8. Table 4.9 shows the difference in total number of working days
calculated by Primavera and estimated by SCDOT. There was a 10.9% difference in
these values, which indicates concurrent activities developed in the logic were greater
than the 20% originally estimated by SCDOT. This project was granted a contract time
extension, however, details were not provided.

71
Case Study Results for Evaluating Contract Time Extensions
Several case studies provided by the South Carolina Department of Transportation
contained adjusted completion dates that were different than the originally estimated
dates. The case studies were used to demonstrate a method for determining contract time
extensions with Primavera software. Each case study identified the activities that
required additional work. The extension time was loaded into the scheduling software
and used to recalculate the completion date. The new date was then compared to the
actual date to determine the scheduling software’s accuracy for evaluating time
extensions. Table 4.10 summarizes the revised completion dates calculated by SCDOT
and the revised completion date calculated by Primavera when the extended activity
duration is added to the original estimate. Several of Primavera’s calculated completion
dates were different than the dates originally estimated by SCDOT. To better analyze the
effectiveness of the software’s ability to evaluate time extensions, the letting dates were
adjusted so the initial Primavera calculated date matched the original SCDOT completion
date. Table 4.11 summarizes the revised completion dates calculated by SCDOT and the
completion date calculated by Primavera when the letting date has been changed to make
the software estimate finish on the same date estimated by SCDOT. The following
section summarizes the case studies and discusses the results provided by the Primavera
software.

72
Table 4.10: Completion Date Comparisons for Contract Extensions
File No. Original SCDOT Completion Date
Primavera Completion Date
SCDOT Revised Completion Date
Primavera Rescheduled
Completion Date
04.149B November 30, 2004 April 4, 2005 April 10, 2005 May 5, 2005 28.102C March 31, 2005 March 31, 2005 April 28, 2004 April 22, 2004 13.113C August 31, 2004 August 28, 2004 September 4, 2004 September 6, 2004 32.182B November 21, 2003 September 15, 2003 December 27, 2003 September 29, 2003 23.100B November 21, 2003 August 30, 2003 December 31, 2003 September 18, 2003 31.123B October 31, 2003 November 15, 2003 November 30, 2003 December 20, 2003
Table 4.11: Completion Dates Comparison with Modified Letting Date for Contract Extensions
File No. Original SCDOT Completion Date
Modified Primavera
Completion Date SCDOT Revised Completion Date
Primavera Rescheduled
Completion Date
04.149B November 30, 2004 November 30, 2004 April 10, 2005 April 13, 2005 28.102C March 31, 2005 March 31, 2005 April 28, 2004 April 22, 2004 13.113C August 31, 2004 August 31, 2004 September 4, 2004 September 6, 2004 32.182B November 21, 2003 November 21, 2003 December 27, 2003 December 27, 2003 23.110B November 21, 2003 November 21, 2003 December 31, 2003 January 10, 2004 31.123B October 31, 2003 October 31, 2003 November 30, 2003 December 1, 2003
Case Study file number 04.149B, involved using the Resurfacing template for a
project in Anderson county. The originally estimated completion date from SCDOT was
November 30, 2004. All activities were entered into the template and the scheduling
software provided an initial estimate of April 4, 2005. Additional concrete work was to
be performed, including the removal of existing sidewalks, curbs and gutters. An
extension of 3 work days was provided for these activities. Additional time was
requested for additional full depth patching due to overruns, and 19 additional working
days were granted. The additional work days were entered into the activity durations
column in Primavera, and the completion date was recalculated. Primavera generated a

73
completion date of May 5, 2005. The revised completion date used by SCDOT was April
10, 2005. Because the original completion date estimate used by the SCDOT was
different than the initial estimate generated by Primavera, conclusions based on the
scheduling software’s accuracy to evaluate time extensions could not be made. When
Primavera was set to match the completion date originally estimated by the SCDOT,
similar revised completion dates were calculated. Primavera generated a completion date
of April 13, 2005, which was 3 calendar days different than the date calculated by
SCDOT. The 3 calendar day difference is likely caused by the configuration of the
working days calendar that was used in Primavera.
Case study 28.102C was a project in Kershaw county that utilized the Secondary
Improvements template. The originally estimated completion date by SCDOT was
March 31, 2004. This was the same initial completion date calculated by Primavera
scheduling software after all activities were entered into the template. Twelve working
days of additional time were granted for extra work involving graded aggregate base
course. Numerous items were also added to the project including unclassified
excavation, additional drainage pipe, and full depth asphalt patching. For these activities,
16 days were granted and calculated into a contract extension. Primavera generated a
revised completion date of April 22, 2004 after all extended activity durations were
modified. The extended completion date used by SCDOT was April 28, 2004. The
difference in the two dates was 6 calendar days. Because of the activity logic, the
additional time entered for the unclassified excavation and additional drainage pipe did
not make these items critical. Therefore they operated concurrently with other activities,
which created an earlier extended completion date than used by SCDOT.

74
Case study 13.113C was a 0.875 mile stretch of grading, drainage, and paving
operations in Chesterfield County. SCDOT's originally estimated completion date was
August 31, 2004. Primavera Project Manager calculated a completion date of August 28,
2004, after all activities were entered into the secondary improvements template. There
was an adjustment of time due to the death of certain individuals, where an additional 5
working days was added to the contract completion date. The additional work days were
entered into a new activity in Primavera, and the completion date was recalculated.
Primavera generated a completion date of September 6, 2004. The extended completion
date used by SCDOT was September 4th, 2004. Primavera was set to match the
completion date originally estimated by SCDOT by extending the award date. The
scheduling software then recalculated the completion date as September 6, 2004. The
two calendar day difference is caused by the configuration of the working days calendar
that was used in Primavera.
Case study 31.182B was a project in Lexington County and used the intersection
improvement template. The originally estimated completion date from SCDOT was
November 21, 2003. All activates were entered into the intersection improvement
template, and Primavera generated an initial completion date of September 15, 2003.
Additional time was necessary for completing grading operations due to utility relocation
conflicts. Eleven working days were granted to complete all grading, and this was
incorporated into its activity duration in Primavera. Primavera then recalculated the
completion date as September 29, 2003. The revised completion date used by SCDOT
was December 27, 2003. Conclusions on the scheduling software's accuracy could not be
made because the original completion date used by SCDOT differed from the initial
75
estimate generated by Primavera. Primavera was set to match the originally estimated
completion date used by SCDOT, and similar extended completion dates were calculated.
The scheduling software generated a completion date of December 27, 2003, which was
the same date calculated by SCDOT. The two dates matched because December 27 was
considered an available working day for the configured calendar used in Primavera.
Case study 23.100B was originally estimated to have a completion date of
November 21, 2003. Primavera provided an initial estimate of August 30, 2003 after all
activities were entered into the intersection improvement template. The project
completion date was extended due to conflicts with the relocation of utility poles. The
delay in utility relocations caused delays in the placement of curb, gutters, and paving
operations. An extension was granted in the amount of 14 working days, and the time
was distributed to the delayed activities in the activity duration column in Primavera.
The recalculated completion date in Primavera was September 18, 2003. Because the
original completion date estimate used by the SCDOT was different than the initial
estimate generated by Primavera, conclusions based on the scheduling software’s
accuracy to evaluate time extensions could not be made. Table 4.11 shows where
Primavera was set to match the completion date originally estimated by SCDOT.
Primavera then generated a completion date of January 10, 2004. The months of
December and January each have 7 working days available, therefore the ten calendar
day difference is caused by the configuration of the working days calendar that was used
in Primavera.
Case study file number 31.123B was a 3.61 mile stretch of interstate rehabilitation
work in Lee County on Interstate 20. The initially estimated project completion date by

76
SCDOT was October 31, 2003. All activities were entered into the interstate
rehabilitation template and the scheduling software calculated an initial project
completion date of November 15, 2003. There was a late award on the contract, and the
contractor was granted an additional calendar month. The additional month was entered
into the award date activity, which has a 7-day work week calendar associated with the
duration. Primavera then generated a completion date of December 20, 2003. The
extended completion date used by SCDOT was November 30, 2003. Because the
original completion date estimate was different between SCDOT and Primavera,
conclusions based on the scheduling software's accuracy to evaluate time extensions
could not be made. Table 4.11 shows where Primavera was set to match the completion
date originally estimated by SCDOT. Primavera then generated a completion date of
December 1, 2004. This is one calendar day different than the date calculated by
SCDOT. The one day difference is because of the configuration of the working days
calendar, where November 30, 2004 was not considered a working day for the month of
November.
Findings
The case studies examined twenty-four projects which have already been
completed. Of these projects, nine were granted contract time extensions. Details about
the granted extensions were not available for three of the case studies. The other six case
studies were used to examine contract time extension procedures. The remaining fifteen
case studies were examined to determine how the Primavera estimated completion dates
compare to the originally estimated and actual project completion dates.

77
Table 4.12 shows the total number of working days calculated for each project.
Table 4.12 does not include total working days for the Bridge Replacement templates
since this data was not available. Table 4.12 identifies the total working days originally
estimated by SCDOT which were used in conjunction with the working days conversion
table to determine the project completion date. These values were taken directly from the
case study data sheets which can be found in Appendix D. The working days conversion
charts can be found in Appendix E. The total number of working days reflects the total
number of calculated working days after being multiplied by a concurrency factor. Table
4.12 also shows the total number of working days calculated by Primavera. This number
was generated by associating all work activities within the template with a seven day
work week calendar and removing the letting and award day allowance. The Primavera
working day total reflects the number of working days required to complete the project
while taking into account concurrency within the logic. In addition, Table 4.12 shows the
percent difference between the DOT and Primavera estimation of total working days.

78
Table 4.12 Estimated Total Number of Working Days
Template FILE NO.
Primavera Total
Working Days
Adjusted Working
Days From DOT
Spreadsheet
Working Day
Difference Percent
Difference Resurfacing 20.106B 106 91 15 15.23 20.109B 76 71 5 6.80 20.2001 66 60 6 9.52 20.2001.1 148 134 14 9.93 Intersection Improvements 30.779 46 55 9 17.82 26.994.1 63 47 16 29.09 21.102B 66 59 7 11.2 Secondary Improvements 27.100C 17 13 4 26.67 13.107B 118 100 18 16.51 Interstate Improvements 14.127B 21 21 0 0.00 09.100B 242 140 102 53.40 23.135B 38 39 1 2.60
It can be seen that for all but two case studies the Primavera calculated number of
working days is greater than the DOT estimation. This indicates that the DOT estimation
of concurrent activities was generally grater than the concurrency developed within the
logic of the Primavera templates. Five of these projects had an estimated difference
which was less than 10%. All but one project had an estimated total number of working
days that were within 30% of each other. Project 09.100B was different by 53% and
shows the 50% concurrency factor used by SCDOT was much greater than the
concurrency within the developed logic. This indicates that special consideration will
need to be taken for projects with accelerated schedules.

79
In general the total number of working days estimated by Primavera was close to
value originally estimated by SCDOT. However, it should be noted that a difference of
18 working days can result in a completion date difference ranging from one to five
months. This difference is largely dependent on the time of year when the project is
scheduled to complete. Examining the working days conversion charts located in
Appendix E shows that the number of working days allowed for resurfacing activities are
greatly restricted during the winter months. Projects with paving activities falling in
these months can have completion dates which are delayed by several months.
Table 4.13 shows the fifteen case study projects with their originally estimated
completion date, the Primavera estimated completion date, and the substantial completion
date. Thirteen of the case studies were estimated by Primavera to complete earlier than
the DOT estimate. Table 4.12 revealed that Primavera’s estimated total number of
working days was generally greater than the SCDOT estimation. With this in mind, it
would seem that the DOT estimated completion dates should be earlier than the dates
calculated by Primavera. Two factors contributed to the Primavera estimates being
earlier than the SCDOT estimates. First, imprecision within the working days conversion
chart can lead to estimation differences of up to 25 working days. The estimator using
the conversion chart simply looks at the month containing the correct number of working
days and estimates the completion date as the end of that month. Primavera estimates an
exact completion date and does not “round” the result to the end of the month. Second,
SCDOT estimators add additional time to the completion date based on their engineering
judgment. Forty percent of the examined case studies were given one or more extra

80
months than the apparent date which would be estimated form the working days
conversion charts.
Table 4.13 Estimated and Actual Completion Dates
Template FILE NO.
SCDOT Estimated
Completion Date
Primavera Estimated
Completion Date
Substantial Completion Date
Resurfacing 20.106B 30-Sep-01 24-Aug-01 August 29, 2001 20.109B 30-Jun-02 7-Jun-02 June 13, 2002 20.2001 30-Jun-03 10-Jun-03 June 3, 2003 20.2001.1 30-Sep-03 26-Sep-03 October 24, 2003Bridge Replacement 42.471A 8-Feb-03 23-Jan-03 August 1, 2002 29.106B 31-Mar-03 5-Dec-02 November 7, 2002 26.100B 30-Apr-02 12-Mar-02 February 25, 2002Intersection Improvements 30.779 31-Jul-00 6-Jul-00 August 8, 2000 26.994.1 30-Jun-00 15-May-00 June 16, 2000 21.102B 31-May-04 13-May-04 May 31, 2004Secondary Improvements 27.100C 31-Oct-02 21-Aug-02 July 25, 2002 13.107B 30-Sep-02 9-Sep-02 July 8, 2002Interstate Improvements 14.127B 31-Aug-03 21-Aug-03 September 19, 2003 09.100B 31-Jul-01 2-Oct-01 March 15, 2002 23.135B 31-Mar-01 6-Apr-01 April 18, 2001
Table 4.14 shows the Primavera estimated completion date, the substantial
completion date, the working day difference between these estimates and the percent
difference base on the total number of working days. The percent difference is based on
the average number of working days calculated from the estimation and actual project
duration. It can be seen that 10 of the 15 case studies were substantially completed

81
within one month of Primavera’s estimated completion date. Of these, five were within
15 calendar days of the substantial completion date. One case study was completed 32
days earlier than the Primavera estimate, one case study was completed 32 days later than
the Primavera estimate and three were different by two months or more. Of the three that
were substantially different, two were completed late and not granted a contract time
extension. The other substantially different project was a bridge replacement which
finished much earlier than estimated. It can also be seen that twelve of the case studies
were completed within 25 working days of the Primavera estimate. Negative values
within the table indicate that the project finished earlier than the estimated date.
Table 4.14 shows the working day difference between the estimated and actual
project completion dates. The percent difference indicates how this value compares to
the total working day length of the project. Six of the estimates were within 15% of the
total project working day length. Twelve of the estimates were within 35% of the total
project length. Of the three projects which were different by more than 35%, two were
completed early. One of these projects was a bridge replacement which finished much
earlier than estimated. The other was a secondary improvements project which started 15
days earlier than estimated. The third project was an interstate improvement project
which started 15 days later than the estimate. It can be seen that short projects which do
not start on their estimated date can be greatly affected by these changes. Three other
projects were impacted by start dates which were not the same as the estimated value.
These projects had longer durations which led to smaller percent differences. It should
be noted that the scheduling software estimate is a deterministic model which seeks to

82
estimate durations for activities which have variability. It should be expected that
projects will have variability which can not be modeled using this deterministic approach.
Table 4.14: Working Day Difference Between Primavera Estimation and Project Substantial Completion Date
Type File No:
Primavera Completion
Date Substantial Completion
Working Day Difference Between
Primavera Estimation & Substantial
Completion Date
Percent Difference Based on
Total Working
Days Resurfacing 20.106B 24-Aug-01 29-Aug-01 4 days 2.91 20.109B 7-Jun-02 13-Jun-02 5 days 4.03 20.2001 10-Jun-03 3-Jun-03 -5 days -7.69 20.2001.1 26-Sep-03 24-Oct-03 20 days 12.35Bridge Replacement 42.471A 23-Jan-03 1-Aug-02 -95 days -60.90 29.106B 5-Dec-02 7-Nov-02 -11 days -11.83 26.100B 12-Mar-02 25-Feb-02 -11 days -9.91Intersection Improvements 30.779 6-Jul-00 8-Aug-00 25 days 34.48 26.994.1 15-May-00 16-Jun-00 25 days 33.56 21.102B 13-May-04 31-May-04 15 days 20.41Secondary Improvements 27.100C 21-Aug-02 25-Jul-02 -19 days -140.74 13.107B 9-Sep-02 8-Jul-02 -49 days -31.92Interstate Improvements 14.127B 21-Aug-03 19-Sep-03 23 days 86.79 09.100B 2-Oct-01 15-Mar-02 64 days 23.15 23.135B 6-Apr-01 18-Apr-01 8 days 21.05

83
Table 4.15 shows the SCDOT estimated completion date, the substantial
completion date, the working day difference between these estimates, and the percent
difference based on the total number of working days. It can be seen that the SCDOT
estimates were generally different by a larger percentage than the estimates generated by
the scheduling software. The SCDOT estimations were also affected by start dates which
were different than originally estimated. Negative values within the table indicate that
the project finished earlier than the estimated date.

84
Table 4.15: Working Day Difference Between SCDOT Estimation and
Project Substantial Completion Date
Type File No..
SCDOT Estimated
Completion Date
Substantial Completion
Working Day Difference
Between SCDOT Estimation & Substantial
Completion Date
Percent Difference Based on
Total Working
Days Resurfacing 20.106B 30-Sep-01 29-Aug-01 -25 days -19.23 20.109B 30-Jun-02 13-Jun-02 -14 days -11.52 20.2001 30-Jun-03 3-Jun-03 -22 days -35.48 20.2001.1 30-Sep-03 24-Oct-03 17 days 10.97Bridge Replacement 42.471A 8-Feb-03 1-Aug-02 -100 days -62.89 29.106B 31-Mar-03 7-Nov-02 -44 days -40.37 26.100B 30-Apr-02 25-Feb-02 -30 days -24.39Intersection Improvements 30.779 31-Jul-00 8-Aug-00 5 days 6.41 26.994.1 30-Jun-00 16-Jun-00 -10 days -15.04 21.102B 31-May-04 31-May-04 0 days 0.00Secondary Improvements 27.100C 31-Oct-02 25-Jul-02 -73 days -634.78 13.107B 30-Sep-02 8-Jul-02 -66 days 45.67Interstate Improvements 14.127B 31-Aug-03 19-Sep-03 15 days 56.60 09.100B 31-Jul-01 15-Mar-02 114 days 50.55 23.135B 31-Mar-01 18-Apr-01 13 days 33.77
Table 4.16 shows the working day difference between the Primavera estimate and
the original SCDOT estimate when compared to the project completion date. It also
shows the number of working days the more accurate estimate is closer by and the
percent closer based on the estimated total number of working days for each case study.
The values in parenthesis represent the projects which were better estimated by the

85
original SCDOT estimation. It can be seen that 10 of the 15 case studies were more
closely estimated by the Primavera scheduling software. Nine of these case studies were
more closely estimated by greater than 10% of the estimated total working days. It can
also be seen that SCDOT more closely estimated the intersection improvement case
studies.
Table 4.16: Working Day Difference Between Estimations and
Project Substantial Completion Dates
Project Type
Working Day Difference Between
SCDOT Estimation & Substantial
Completion Date
Working Day Difference Between
Primavera Estimation & Substantial
Completion Date
Number of Working
Days Closer
Percentage Closer
Based on Estimated
Total Working
Days Resurfacing 20.106B -25 days 4 days 21 19.81 20.109B -14 days 5 days 9 11.84 20.2001 -22 days -5 days 17 25.76 20.2001.1 17 days 20 days (3) (2.03)Bridge Replacement 42.471A -100 days -95 days 5 2.48 29.106B -44 days -11 days 33 33.33 26.100B -30 days -11 days 19 16.67Intersection Improvements 30.779 5 days 25 days (20) (45.45) 26.994.1 -10 days 25 days (15) (23.81) 21.102B 0 days 15 days (15) (22.73)Secondary Improvements 27.100C -73 days -19 days 54 317.65 13.107B -66 days -49 days 17 14.41Interstate Improvements 14.127B 15 days 23 days (8) (38.10) 09.100B 114 days 64 days 50 20.66 23.135B 13 days 8 days 5 13.16

86
For the resurfacing case studies, the Primavera estimates provided project
completion dates which were close to the actual project completion dates. Three of the
four case studies examined were more accurately estimated by the scheduling software.
These estimates were closer by 10 to 25 percent of the estimated project length. The
Primavera estimates were generally shorter than the SCDOT estimates and indicated that
SCDOT’s current method may be giving more time than is needed for these types of
projects.
The bridge replacement case studies which were examined finished earlier than
both estimations. The primavera estimates were closer to the actual project completion
dates by 2 to 30 percent of the estimated project length. Two of the Primavera estimates
were within 11 working days of the actual project completion date. It appears that the
scheduling software gives more accurate estimations for these types of projects and that
the current method gives more time than is required.
The three case studies which examined intersection improvement projects were
more closely estimated by SCDOT’s current method. The scheduling software
estimations were earlier than the actual project completion dates and were off by 15 to 25
working days. The performance of this template can be improved by using lower
production rates and ensuring that projects start within the estimated time.
The two case studies which examined secondary improvement projects finished
earlier than both estimations. The Primavera estimations were closer to the actual project
completion dates by 14 to 317 percent. One of these project started earlier than estimated
and had a small duration which made the impact of this change more pronounced. The

87
case studied indicated that SCDOT’s current method may be allowing more time than is
needed for these types of projects.
The three case studies which examined interstate improvement projects had actual
completion dates which were later than both estimates. Two of the three case studies
were more closely estimated by the Primavera scheduling software. These two case
studies were estimated better by 13 and 20 percent of the estimated total number of
working days. The other case study was estimated 38 percent better by SCDOT’s current
method. The case studies indicated that SCDOT and Primavera did not allow enough
time for these types of projects. This can be addressed by using lower production rates
and ensuring the project start times are accurately estimated.
The completion dates generated using Primavera scheduling software are similar
to the dates being generated by SCDOT’s current scheduling method. In most cases the
completion dates generated by Primavera are closer to the project substantial completion
date than the originally estimated project completion date. The case study data indicates
that Primavera scheduling software can be used to determine contract times which are
reasonable and achievable.
The case studies examining contract time extensions demonstrated that scheduling
software can be a useful tool for calculating extensions. Table 4.11 showed that
Primavera calculates extensions in much the same way SCDOT currently does. The
scheduling software calculated revised completion dates which were within ten days of
the DOT calculations. Some variation can be accounted for within the calendar of
Primavera which only allows work to be performed on certain days of the month.
Variation may also be caused by concurrency or float associated with the activity which

88
is being extended. Primavera takes into account concurrent activities and float associated
with a task when calculating a contract time extension. The current method used by
SCDOT does not take these factors into account.
Primavera User Survey Results
Graduate research assistants at Clemson University created a survey to address
the effectiveness of Primavera Project Manager’s ability to determine contract time and
contract time extensions for SCDOT personnel. The survey was distributed to SCDOT
personnel attending the September 9, 2005 workshop meeting. The meeting consisted of
a demonstration of the scheduling software and was intended address its potential
usefulness for determining contract time and contract time extensions.
The primary objective of the Primavera user survey was to solicit information
from SCDOT personnel related to their perception of Primavera Project Managers
software capabilities. Specific information was gathered to determine the scheduling
software’s strength and weaknesses based on the functions demonstrated. Each survey
asked the respondents to rate commonly used features of the scheduling software, such as
modifying logic, adding calendars, and displaying results. Information was also gathered
to determine if additional time and staff requirements would be needed to generate
contract times, and to evaluate contract time extensions. The survey appears in Appendix
B.
Primavera Project Managers software capabilities were demonstrated, and survey
information was gathered from five respondents who were in attendance for the
workshop meeting on September 9th, 2005. The survey was distributed after a

89
demonstration was conducted and all questions and comments had been addressed.
Personnel in attendance were also encouraged to exercise Primavera’s capabilities for
determining contract time and time extensions prior to filling out the survey. Survey
questions asked respondents to rate the software scheduling method in several areas. The
responses were to be ranked from 1 to 5 with 1 corresponding to very difficult, 3
corresponding to moderate, and 5 corresponding to very easy.
The first nine questions of the survey were intended to identify the difficulty level
of using the software to generate contract completion dates. These questions focused on
specific tasks which would typically be encountered while using the software. A
summary of these questions can be found in Table 4.17 with their average response. It
can be seen that respondents felt the software was easy to use for loading the appropriate
templates and adding activities. They also indicated that the Gantt charts were easy to
interpret for individual templates. None of the tasks typically required for determining
contract time were identified as being difficult to use or understand.

90
Table 4.17: Primavera User Survey Results for Questions 1 Through 9
Question Please indicate the ease of performing the following tasks: Average
1 Accessing the loading the project templates 4
2 Accessing and changing calendars associated with individual tasks 3.6
3 Accessing and changing calendars associated with all projects 3.8
4 Interpreting the Gantt chart for individual templates 4.4
5 Adding additional activities 4
6 Changing activity logic within the templates 3.6
7 Inputting and modifying activity duration for a project 3.6
8 Running the scheduling software and interpreting the results 3.6
9 Interpreting the calculated project durations and visualizations 3.8
Question ten asked respondents if the bar chart visualizations were useful in
determining the calculated project durations. Respondents indicated that the
visualizations were useful. The average user response to this question was 4 which
corresponded to “useful.”
Question eleven attempted to determine if the Primavera scheduling software was
more user friendly than the currently used working day conversion chart. The response
average for this question was neutral which indicated there was no strong feeling about
its user friendliness when compared to the current method.
Question twelve was used to determine if using the scheduling software would
take longer than using the current method. Most respondents indicated this method
would take longer. When asked what additional time would be required respondents
indicated approximately 5 minutes. It was also indicated that the bridge replacement
template would take longer but no timeframe was indicated. It is likely that bridge

91
replacement templates will take longer since two departments must collaborate to
generate these schedules. Comments indicated that even though determining contract
time using Primavera scheduling software added several minutes, the complexity of the
software may invite engineers to explore the “what-if” possibilities in determining
contract time.
Question thirteen was used to determine if the primavera results were within a
range that could be expected based on the data sheets and engineering experience.
Survey respondents indicated that the dates being generated were reasonable and
approximately what would be expected.
The last question was intended to determine if primavera could be used to
determine contract durations for all projects using their current staff. Eighty percent of
respondents indicated that it could. One respondent indicated an extra person would be
needed and one respondent indicated that a part time employee would be needed to help.
Additional comments mentioned that primavera would be good for the standard type of
project illustrated, but for more complex projects requiring staging additional personnel
and time would be required. This is also the case with their current method.
The survey was issued to SCDOT personnel who were in attendance for the
September 9, 2005 workshop meeting at SCDOT headquarters in Columbia, South
Carolina. The survey was intended to provide information regarding Primavera Project
Managers capabilities and level of effectiveness for determining contract time and
contract time extensions. A limited number of personnel were in attendance, however,
respondents were the actual personnel that are in charge of determining contract time,
therefore their input was highly relevant. Overall data received shows that Primavera

92
Project Planner is an effective tool for determining contract time and time extensions
based on its functionality and scheduling capabilities. When comparing Primavera to the
current working day conversion table method if was found that there was no considerable
increase in the amount of time required to determine a contract time, where the majority
of respondents felt that their current method was approximately 5 minutes faster than
Primavera. Primavera would also not require any significant changes in personnel
required to generate the same amount of contract times based on their current procedures.
Overall responses to Primavera’s ease of use were positive. In conclusion, the survey
information gathered was an important tool to conclude that Primavera Project Planner is
a useful software package for determining contract time and evaluating contract time
extensions.
Overall responses to Primavera’s ease of use were positive. Respondents
indicated the software was easy to use and understand even though only one person had
previous experience using it. Survey respondents also indicated that the visualizations
were a useful tool for understanding the schedule and identifying problems. The survey
information was an important tool to conclude that Primavera Project Management is a
useful software package for determining contract time.

93
CHAPTER 5
CONCLUSIONS AND RECOMMENDATIONS
Summary
The objectives of this research were to identify best practice approaches to project
time duration estimates, to evaluate the current methods being used, to recommend
changes to improve SCDOT’s current process without significantly increasing cost of
construction, and to recommend changes to improve the process for calculating contract
time extensions. In order to identify the best practices for calculating contract time a
literature review was conducted to find all relevant material on methods states are
currently using. With this information and input from the research steering team, a
survey was developed which was intended to help identify current practices being used
by other states. The survey was also used to identify the effectiveness of each system and
its advantages and disadvantages.
It was found that several state departments of transportation have been in the
process of developing new contract determination procedures. Research indicated that
multiple methods are being employed to determine contract time. The most popular
methods being used are software created bar chart schedules based on production rate
data, and manual methods using spreadsheets with judgment of senior personnel.
Research conducted by individual states has generally led to contract time being
determined with the aid of computer software. Improvements in computer technology
and software availability have enabled many agencies to adopt contract time
determination techniques that use computer aided scheduling software.

94
In order to evaluate the current methods being used critical path methodology was
developed using computer scheduling software. Case studies based on previously
completed projects were estimated using the computer software and compared to
estimates from SCDOT’s current method. It was found that the computer generated
contract durations were comparable to durations currently being estimated. In ten of the
fifteen case studies examined the computer generated contract completion date was
actually closer to the actual project completion date than the estimation generated by
SCDOT’s current method.
Critical path methodology using computer software was also used to examine
contract time extensions. Case studies with contract time extensions were compared to
the current method for calculating contract time extensions. It was found that the
scheduling software calculates contract time extension similar to those being calculated
with the current method. The scheduling software approach is very easy and is achieved
by modifying the activity duration within the project schedule. Calculating contract
extensions using the scheduling software has the added benefit of taking into
consideration concurrent activities and float within the schedule.
Research Limitations
The case studies examined in this research were based on data from completed
projects. This was not a controlled experiment where variability in the data could be
controlled and accounted for. The work activities were estimated using deterministic
techniques which were intended to represent average values which may be expected in
the field. This model is not capable of accounting for variability in production or changes

95
in the way the work is performed. The estimations are intended to represent the way
work may be performed but will not accurately model projects which are not performed
in the manner.
Differences in the estimated and actual project completion date can be attributed
to several factors. It is important that the project letting and award time be accurately
estimated. Changes to these values will influence the project completion date before any
work is actually performed. Contractor performance can also impact the actual project
completion date. Some contractors will perform better than the estimated average values
which will result in projects which are completed early. Similarly poor contractor
performance will cause projects to finish late since work is not being performed at the
estimated rate. Environmental conditions can also impact project completion dates. Bad
weather may result in less work being performed than is expected based on the allowed
number of working days for each month. There are many other factors which can
influence project completion and it is important to realize that estimations do not account
for these things. It should be expected that some projects will perform better than the
estimation and that others will perform worse.
Conclusion
As stated above, the main objective of this research project was to identify the
best practices for determining contract time and evaluating contract time extensions. The
initial stages of the research included a literature search to determine the methods used by
other state Departments of Transportation. The literature search concluded that there
were several different methods being used for determining contract time and time

96
extensions. A report prepared by the University of Kentucky for the Kentucky
Transportation Cabinet stated that most states utilized either a manual approach to
determining contract time, or use a form of CPM software. Literature findings indicated
that the Florida and Indiana’s Department of Transportation had comprehensive manual
systems in place. Texas utilized a computer based system utilizing software packages
Lotus 1-2-3, Flash Up, and Super Project. The report stated that the Louisiana DOT
developed a computer system similar to the system which was implemented in Texas.
The literature reviews showed that both manual and software methods are being
successfully used. It appears that many states are implementing software methods in an
effort to improve their current contract tine determining process.
Information provided by the literature review on time extensions indicated that
claims are common throughout the construction industry, and often both the contractor
and supervising engineers spend a considerable amount of time substantiating and
analyzing claims. There are multiple techniques and approaches that can be used to
analyze and review delays. Often, the contractor will submit a claim for a time extension
based on one or more methods and techniques available, upon which the engineer will
assess the claim. The engineer will then evaluate the claims for excusable delays, and
then analyze the impact on the project completion date, using one of the multiple
varieties of approaches.
There are six different techniques commonly used for evaluating time extensions.
The adjusted As-Built and As-Planned CPM Technique was the method selected for
development and implementation in the SCDOT. This technique involves an as-built
schedule that is developed using the Critical Path Method (CPM) format which is then

97
compared to the as-planned schedule. Computer software from Primavera is a common
tool used to create the CPM format required. Delayed activities are depicted as new
activities and then linked to the specific delayed work activity within the network. The
critical paths are then depicted twice; first in the as-planned schedule, the second in the
as-built schedule. The difference between the two completion dates would be the time
for which a claimant would request compensation.
In addition to the literature review, a survey was forwarded to personnel at each
of the 50 state DOT’s. It was intended to provide information relevant to the methods
being used for determining contract time and contract time extensions. The questions in
the survey were based on findings from the literature search as well as input from the
research steering team. A limited number of responses were received, and from this data,
measures of system effectiveness, disadvantages, and advantages were obtained.
Respondents also provided information that involved the common problems that are
encountered that are often considered for contract time extension.
Survey findings show that few state DOT’s require schedules to be generated and
updated using some form of CPM scheduling software for the process evaluating and
granting time extensions. Some states only require a CPM schedule for projects over a
certain monetary amount. This is similar to the SCDOT’s policy which requires CPM
schedules for projects costing more than five million dollars. Many states however do
not have a policy requiring a CPM schedule which the Field Engineer can use to evaluate
contract time extensions. Often the field engineer uses engineering judgment with
historical production range charts to evaluate the additional time required for delayed

98
activities. Some states will only grant time extensions if the work item has overrun the
bid quantities by a certain percentage, regardless of the critical path.
It appears that many DOTs are moving away from manual methods and investing
their resources in critical path scheduling techniques which use specially developed or
commercially available software. Critical path scheduling offers a specific and
repeatable method for consistently estimating contract time and evaluating contractor
requests for time extensions.
The case studies showed that CPM scheduling can be accomplished without
significantly increasing resource requirements. The case studies examined in this
research provided project completion times which are comparable to the dates currently
being estimated. Two thirds of the examined case studies had completion dates which
were closer to the Primavera estimate than the original SCDOT estimation. The current
system uses a concurrency factor determined by department personnel which is intended
to account for activities which occur at the same time. The CPM method eliminates this
estimation and allows for closer estimates of how the work will actually be performed. It
is likely that the SCDOT method for converting working days to calendar days gives
more time than is needed due to a lack of precision in the working days conversion chart.
The case study data indicates that projects can be consistently estimated using the
developed Primavera templates and that the estimated dates are both reasonable and
achievable. Although considerable effort has been made to develop CPM logic which
accurately represents how work is performed, it is possible that minor changes will need
to be made to reflect any deviations.
99
The case studies showed how Primavera Project Management and CPM
scheduling can be used to evaluate contractor requests and claims for time extensions.
Several case studies were examined which showed the scheduling software calculates
extensions comparable to those currently being granted. The scheduling software was
able to automatically update the duration, completion date, and Gantt Chart based on the
SCDOT working day’s calendar. The software also provides visuals showing all existing
and newly critical activities. CPM scheduling software can assist the engineer when
evaluating a delay claim, and will show if the delayed activities are justified to have a
time extension.
Recommendations
It is recommended that SCDOT incorporates CPM scheduling techniques for
estimating future contract times by using the templates developed in this research. The
resulting Critical Path Schedules can be used to evaluate requests for contract time
extensions and will provide easily interpreted evidence to support the decisions which are
made. The developed templates will provide a solid base to schedule the many types of
projects which are currently being encountered. Scheduling software allows the
templates to be easily modified to meet the changing needs of the department and will be
able to grow and change as needed for future projects.
It is also recommended that the database currently being used to retrieve and filter
activity production rates be continually updated and added to. Increasing the level of
activity detail will increase the accuracy of CPM estimates and can help in the
development of new templates as they may be needed in the future.

100
It may be possible in the future to utilize stochastic estimating techniques for
estimating project durations. These types of models account for some of the variability
which is encountered in the way work is performed. The current SCDOT production rate
database can be utilized to develop probability curves for each activity and logic can be
developed which is similar to the logic developed in this research. With the correct
software, stochastic contract times can be estimated which may more accurately represent
the possible range of contract times which can be expected for typical projects.
The shift from manual methods to computer aided scheduling can help improve
estimation accuracy. This improved accuracy is beneficial to both the Department of
Transportation and the public by lowering construction times without raising construction
cost. It is well documented that construction contract times which are too short cause an
increase to construction cost, and that contract times which are too long cause
inconvenience and economic difficulties to the traveling public and local businesses.
Critical path scheduling offers a specific and repeatable method for consistently
estimating construction time and evaluating contractors requests for time extensions. It
will be beneficial to both the Department of Transportation and the public, to incorporate
Critical Path Scheduling techniques and move past the manual methods which are
currently being used.

APPENDICES

102
Appendix A. Survey of Current Practices
South Carolina Department of Transportation CONTRACT TIME/ TIME EXTENSION Questionnaire Survey
Department:
Name: Email: Phone: Fax: May we further contact you with respect to the information provided from this questionnaire and our research goals? ____Yes ____No

103
SCDOT CONTRACT TIME/ TIME EXTENSION QUESTIONNAIRE 1. Please indicate the procedure which best describes the method being used by your state to determine contract time for the majority of major projects. (Contract time is assumed to be the maximum time allotted for bidding contractors to complete the project) _____ A manual method is being used (Spreadsheets or Worksheets) _____ A scheduling software program is being used specifically for determining contract times. Please indicate which program is being used. _____ Primavera _____ Microsoft Project _____ XProject _____ Other (Please List) ____________________________________________ _____ A computer program which is integrated with other DOT or State Systems is used to determine contract time. (Specially Developed Computer System) 2. Please rate the advantages and disadvantages of each system listed below: Manual Methods: Manual methods are easily adaptable to different types and sizes of projects. Manual methods are relatively easy to implement. Limited resources can be utilized to implement manual methods. Manual methods require excessive manpower. Manual methods have a high probability of human error. Manual methods rely heavily on the judgment of the estimator.
Strongly No Opinion Strongly Disagree Agree 1 2 3 4 5 1 2 3 4 5 1 2 3 4 5 1 2 3 4 5 1 2 3 4 5 1 2 3 4 5

104
Manual methods can be easily changed to meet changing needs. Scheduling software: Scheduling software is easy use. Scheduling software allows multiple users to easily adjust the schedule. Scheduling software is easily implemented. Scheduling software is accurate. Scheduling software helps ensure nothing is left out of the estimate. Scheduling software is easy to integrate with other systems such as databases. Scheduling software requires considerable training before it can be efficiently used. Scheduling software requires less man-hours than manual methods. Scheduling software is difficult to adapt to different types and sizes of projects. Scheduling software can be modified to meet the changing needs of the user. Integrated computer system Integrated systems are easy to use. Integrated systems are easily adapted to different types and sizes of projects. Integrated systems are easily accessed and used by multiple users.
Strongly No Opinion Strongly Disagree Agree 1 2 3 4 5 1 2 3 4 5 1 2 3 4 5 1 2 3 4 5 1 2 3 4 5 1 2 3 4 5 1 2 3 4 5 1 2 3 4 5 1 2 3 4 5 1 2 3 4 5 1 2 3 4 5 1 2 3 4 5 1 2 3 4 5 1 2 3 4 5

105
Integrated systems require less manpower to generate schedules than manual methods. Integrated systems require less manpower to generate schedules than scheduling software. Integrated systems are difficult and costly to develop. Integrated systems require special training to use efficiently. Integrated systems are accurate. Integrated systems can be modified to meet the changing needs of the users.
Strongly No Opinion Strongly Disagree Agree 1 2 3 4 5 1 2 3 4 5 1 2 3 4 5 1 2 3 4 5 1 2 3 4 5 1 2 3 4 5
3. Please rate the effectiveness of the system you are using in the following areas. The system is easy to learn. The system generates contract times which are being achieved on most projects. The system is easily applied to multiple types and sizes of projects. The production rates used are effective in generating accurate contract time. The system accounts for work items which will be performed concurrently.
Not No Opinion Very Effective Effective 1 2 3 4 5 1 2 3 4 5 1 2 3 4 5 1 2 3 4 5 1 2 3 4 5

106
4. Does your System (regardless of whether or not it is based on manual methods, commercially available CPM scheduling software, or an in-house developed system) utilize work activity production rate estimates?
_____ Yes _____ No If you answered Yes please refer to the attached production rate table and answer the following questions:
In your system are “low” and “high” ranges, as utilized by SCDOT, suggested in a production rate table?
_____ Yes _____ No Are mean and/or high and low values of production rates obtained from an analysis of historical data?
_____ Yes _____ No Is contractor input used to determine production rates?
_____ Yes _____ No 5. What is the time (range of hours) required to generate a schedule using your current system for the following typical projects? Please indicate the number of persons that would be actively involved in schedule generation. ______ Large Primary ______ Small Primary ______ Secondary ______ Rehabilitation ______ Large Bridge ______ Small Bridge
Number of Personnel _____
Number of Personnel _____
Number of Personnel _____
Number of Personnel _____
Number of Personnel _____
Number of Personnel _____
Comments:______________________________________________________________
________________________________________________________________________
________________________________________________________________________
________________________________________________________________________

107
6. Are production rates used only for what is judged to be “schedule controlling” or critical path work items? _____Yes _____No Comments: ________________________________________________________________________
________________________________________________________________________
________________________________________________________________________
________________________________________________________________________
________________________________________________________________________
7. Are production rates stored in a data file by project category? _____Yes _____No If Yes, please indicate your project categories and estimate the number of work items for which production rates are used in each category;
PROJECT CATEGORY ___________________ ___________________ ___________________ ___________________ ___________________ ___________________ ___________________ ___________________ ___________________
APPROX # OF WORK ITEMS IN PRODUCTION RATE FILE
___________________ ___________________ ___________________ ___________________ ___________________ ___________________ ___________________ ___________________ ___________________

108
8. Are your production rate values or ranges based primarily on:
Historical data Yes No Engineering Judgment Yes No Contractor Input Yes No Other_________________ Yes No Comments:
________________________________________________________________________
________________________________________________________________________
________________________________________________________________________
________________________________________________________________________
9. In your opinion, should production rates extracted from historical data be based on the number of previously completed projects?
_____ Yes _____ No Comments:
________________________________________________________________________
________________________________________________________________________
________________________________________________________________________
________________________________________________________________________
________________________________________________________________________
________________________________________________________________________
________________________________________________________________________
________________________________________________________________________
________________________________________________________________________
________________________________________________________________________
________________________________________________________________________
_______________________________________________________________________

109
10. Is the estimated number of days to complete the project determined by applying a concurrency factor to the work days computed from production rates? (Currently, SCDOT utilizes a contract duration estimating process that incorporate the use of production range charts for critical activities to determine a number of project working days, which is then modified by a concurrency factor) _____Yes _____No
If Yes, please rate the adequacy of this concurrency factor (where 1 is not adequate, 3 is neutral, and 5 is very adequate) Not adequate Neutral Very adequate 1 2 3 4 5 If Yes, please comment on the origin of the concurrency factor: Comments: ________________________________________________________________________
________________________________________________________________________
________________________________________________________________________
________________________________________________________________________
________________________________________________________________________
________________________________________________________________________
________________________________________________________________________
________________________________________________________________________
________________________________________________________________________
________________________________________________________________________
________________________________________________________________________
________________________________________________________________________
________________________________________________________________________
________________________________________________________________________

110
11. Is a process used to convert the time estimate, based on production rates, to “contract working days”? _____Yes _____No If, Yes, what is the standard conversion factor used? ______________________ Is there a more detailed analysis that takes into consideration such factors as: Anticipated weather Yes No Holidays Yes No Time of year Yes No 12. Which of the following circumstances would alter the standard approach to determining contract time?
No influence Neutral Strong Influence An incentive contract with a tight schedule Concurring projects Complex coordination involving utilities Unusual anticipated traffic conditions Time of day restrictions, (or day of week) Other________________________ Other________________________
1 2 3 4 5 1 2 3 4 5 1 2 3 4 5 1 2 3 4 5 1 2 3 4 5 1 2 3 4 5 1 2 3 4 5

111
CONTRACT TIME EXTENSION DETERMINATION 1. Please indicate on a scale of 1 to 5 (where 1 is low potential, 3 is neutral, and 5 is high potential) which problems are most frequently considered when generating contract time extensions. Low Potential Neutral High Potential Third party delays not disclosed in the contract documents The existence of facilities owned or operated by a third party Additional approvals, permits, restrictions, regulations, or ordinances, not attributable to a contractor’s submission Restraining orders or judgments issued by a court not caused by a contractor’s submission Labor problems Material shortages Unusually severe weather Determinations of the Department to open certain sections of the project before entire completion Major unanticipated work that affects the schedule completion in the contract Failure of the State to provide individual rights-of-ways parcels for a period of time beyond that indicated in the contract Utility relocations
1 2 3 4 5 1 2 3 4 5 1 2 3 4 5 1 2 3 4 5 1 2 3 4 5 1 2 3 4 5 1 2 3 4 5 1 2 3 4 5 1 2 3 4 5 1 2 3 4 5 1 2 3 4 5

112
1 Continued . Please indicate any additional factors your Department considers when generating contract time extensions.
• _______________ • _______________
• _______________ • _______________
• _______________
• _______________
• _______________
• _______________
2. When significant items of work overrun the bid quantities, do these overruns automatically result in contract time extensions?
_____ Yes _____ Conditionally, when the work item overruns by a certain percentage _____ Sometimes _____ No
Comments:______________________________________________________________
________________________________________________________________________
________________________________________________________________________
________________________________________________________________________
________________________________________________________________________
________________________________________________________________________
________________________________________________________________________
________________________________________________________________________

113
3. Are time extension days computed as some percentage of the cost of extra work? _____ Yes _____ No
Comments_______________________________________________________________
________________________________________________________________________
________________________________________________________________________
________________________________________________________________________
________________________________________________________________________
________________________________________________________________________
________________________________________________________________________
________________________________________________________________________
________________________________________________________________________
4. On a scale of 1 to 5 (Where 1 is strongly disagree, 3 is neutral, and 5 is strongly agree), how would you rate the following? Liquidated damages are effective to insure project completion time. Disagree Neutral Agree 1 2 3 4 5 Comments:______________________________________________________________
_______________________________________________________________________
_______________________________________________________________________
_______________________________________________________________________
_______________________________________________________________________
_______________________________________________________________________
_______________________________________________________________________
_______________________________________________________________________
_______________________________________________________________________
_______________________________________________________________________
_______________________________________________________________________

114
5. Are there any internal written policies/documents not fully explained in the Standard Specifications that give guidance to engineers when determining contract extensions?
_____ Yes _____ No Comments_______________________________________________________________
________________________________________________________________________
________________________________________________________________________
________________________________________________________________________
________________________________________________________________________
________________________________________________________________________
________________________________________________________________________
6. On a scale of 1 to 5 (where 1 is ineffective, 3 is neutral, and 5 is very effective), OVERALL how would you rate the effectiveness of your states system to determine contract time extensions? Ineffective Neutral Very effective 1 2 3 4 5 Please rate the effectiveness of the system you are using in the following areas. Not Effective Neutral Very Effective The system is easy to learn. The system generates contract times which are being achieved on most projects. The system is easily applied to multiple types and sizes of projects. The production rates used are effective in generating accurate contract time. The system accounts for work items which will be performed concurrently. 1 2 3 4 5
1 2 3 4 5 1 2 3 4 5 1 2 3 4 5 1 2 3 4 5

115
7. How could your current methods used to determine contract time extensions be improved? (Assuming that all required personnel and resources are available) Comments_______________________________________________________________
________________________________________________________________________
________________________________________________________________________
________________________________________________________________________
________________________________________________________________________
________________________________________________________________________
________________________________________________________________________
________________________________________________________________________
________________________________________________________________________
________________________________________________________________________
________________________________________________________________________
________________________________________________________________________
________________________________________________________________________
________________________________________________________________________
________________________________________________________________________
________________________________________________________________________
________________________________________________________________________
________________________________________________________________________
________________________________________________________________________
________________________________________________________________________
________________________________________________________________________

116
Appendix B. Primavera User Survey
Primavera User Survey Name: Dept: Email: Phone: The following survey will be used to identify the effectiveness of Primavera Project Planner’s ability to determine contract time and contract time extensions for SCDOT personnel. 1. Identification and loading of software and templates. Please indicate on the following scale, the ease of use for personnel to access and load the project templates. Very Difficult Difficult Moderate Easy Very Easy 1 2 3 4 5 2. Calendar. Please indicate on the following scale, the ease of accessing and changing calendars associated with individual activities. Very Difficult Difficult Moderate Easy Very Easy 1 2 3 4 5 3. Global Calendar. Please indicate on the following scale, the ease of accessing and changing calendars associated with all project. Very Difficult Difficult Moderate Easy Very Easy 1 2 3 4 5

117
4. Gantt Chart. Please indicate on the following scale, the ease of interpreting the Gantt chart for individual templates. Very Difficult Difficult Moderate Easy Very Easy 1 2 3 4 5 5. Adding Activities. Please indicate on the following scale, the ease of adding additional activities to a project. Very Difficult Difficult Moderate Easy Very Easy 1 2 3 4 5 6. Activity Logic Diagrams. Please indicate on the following scale, the ease of changing activity logic within the Primavera template. Very Difficult Difficult Moderate Easy Very Easy 1 2 3 4 5 7. Activity Durations. Please indicate on the following scale, the ease of use to input or modify activity durations in a project. Very Difficult Difficult Moderate Easy Very Easy 1 2 3 4 5

118
8. Scheduling Execution. Please indicate on the following scale, the ease of use to run the scheduling software and interpret the results. Very Difficult Difficult Moderate Easy Very Easy 1 2 3 4 5 9. Interpreting Results. Please indicate on the following scale, the ease of interpreting calculated project durations and visualizations. Very Difficult Difficult Moderate Easy Very Easy 1 2 3 4 5 10. Visualizations. Please indicate on the following scale, the usefulness of the bar charts in determining calculated project durations. Very Difficult Difficult Moderate Easy Very Easy 1 2 3 4 5 11. Ease of Use. Please indicate on the following scale, is using the Primavera scheduling software more user friendly than the current working day conversion table method? Very Difficult Difficult Moderate Easy Very Easy 1 2 3 4 5

119
12. Time Involvement. Does developing a project duration using Primavera take longer than the current working day conversion table method? Yes No If Yes, please identify the amount of additional time required on average. 13. Duration Results. Please indicate on the following scale, do the Primavera duration results appear to be; Very Short Short As Expected Long Very Long 1 2 3 4 5 14. Personnel. Please indicate on the following scale, could Primavera be used to determined the durations for all projects using the current staff. Yes No If Yes, please indicate the amount of additional personnel needed.
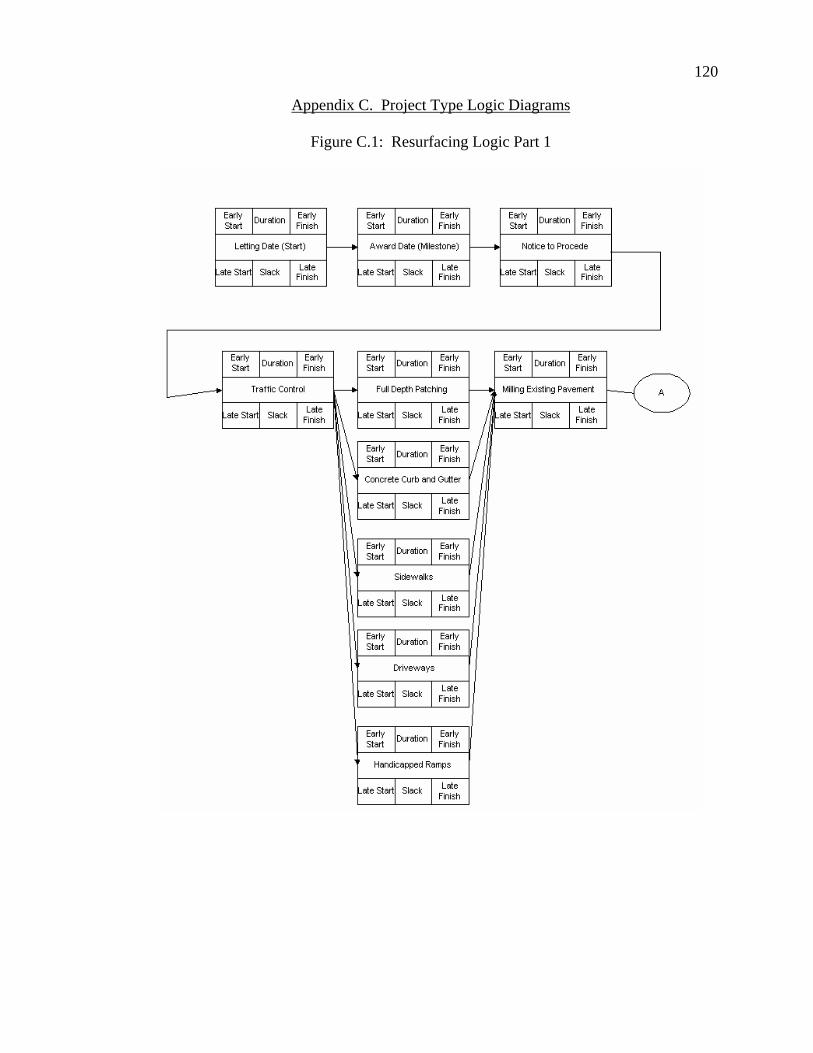
120
Appendix C. Project Type Logic Diagrams
Figure C.1: Resurfacing Logic Part 1

121
Figure C.2: Resurfacing Logic Part 2

122
Figure C.3: Bridge Replacement Logic Part 1

123
Figure C.4: Bridge Replacement Logic Part 2

124
Figure C.5: Bridge Replacement Logic Part 3
3

125
Figure C.6: Bridge Replacement Logic Part 4

126
Figure C.7: Bridge Replacement Logic Part 5

127
Figure C.8: Bridge Replacement Logic Part 6

128
Figure C.9: Bridge Replacement Logic Part 7

129
Figure C.10: Bridge Replacement Logic Part 8

130
Figure C.11: Intersection Improvements Logic Part 1
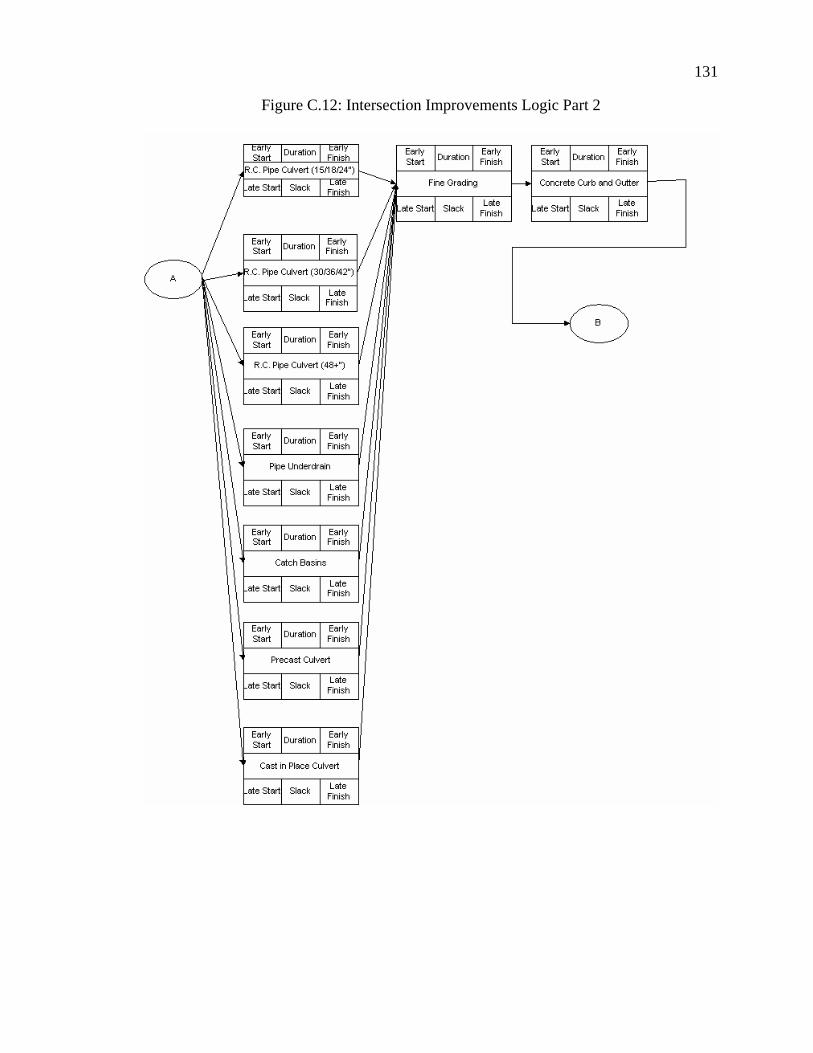
131
Figure C.12: Intersection Improvements Logic Part 2

132
Figure C.13: Intersection Improvements Logic Part 3

133
Figure C.14: Intersection Improvements Logic Part 4

134
Figure C.15: Secondary Road Improvements Logic Part 1

135
Figure C.16: Secondary Road Improvements Logic Part 2
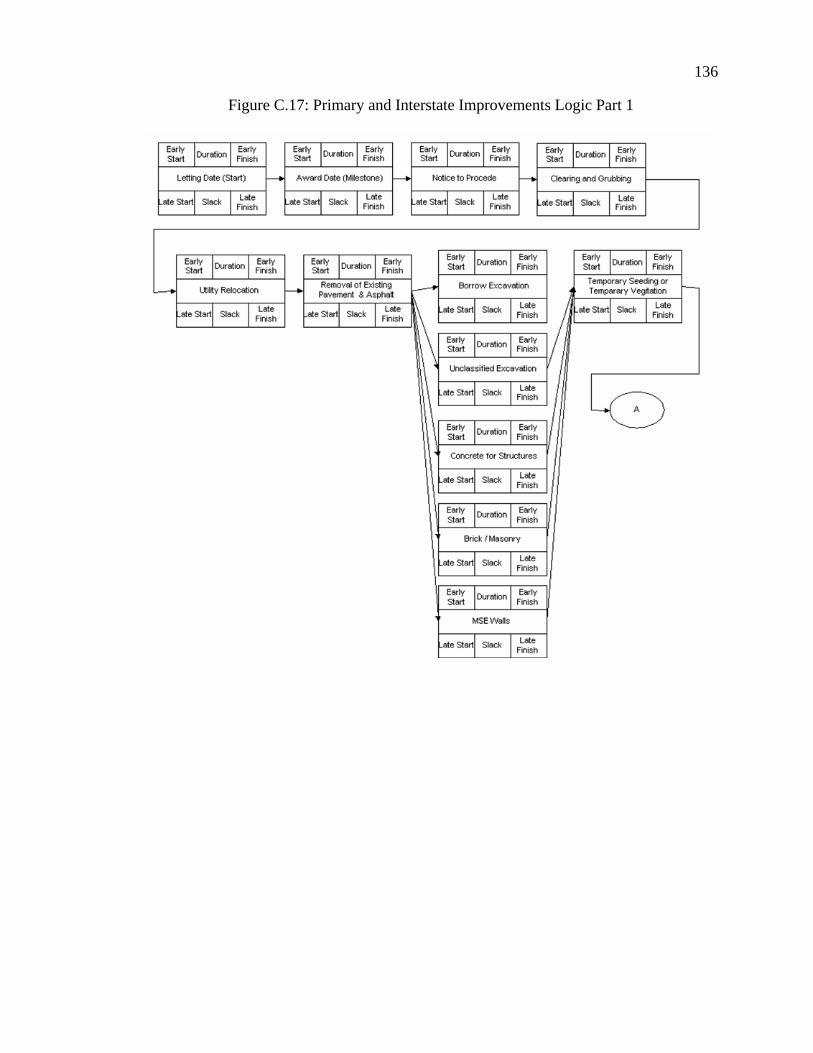
136
Figure C.17: Primary and Interstate Improvements Logic Part 1

137
Figure C.18: Primary and Interstate Improvements Logic Part 2

138
Figure C.19: Primary and Interstate Improvements Logic Part 3

139
Figure C.20: Primary and Interstate Improvements Logic Part 4

140
Appendix D. Case Study Data Sheets
Figure D.1: Case Study Data Sheet for 20.106B

141
Figure D.2: Case Study Data Sheet for 20.109B
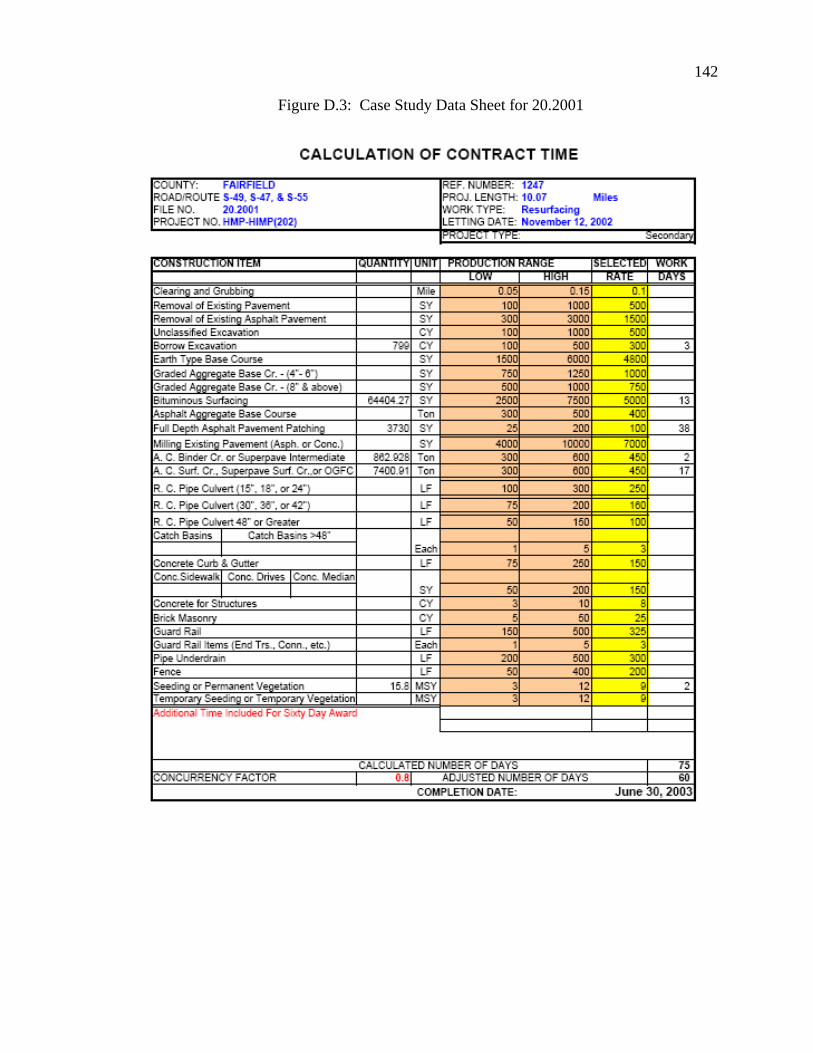
142
Figure D.3: Case Study Data Sheet for 20.2001

143
Figure D.4: Case Study Data Sheet for 20.2001.1

144
Figure D.5: Case Study Data Sheet for 04.149B

145
Figure D.6: Case Study Data Sheet for 42.471A

146
Table D.1: Bridge Activity Worksheet for 42.471A
FILE NO. 42.471A (425' CONT. PRETR. BM. BRIDGE)
CODE CONSTRUCTION ITEM NO. OF ITEMS
TIME/ITEM (WEEKS)
TIME (WEEKS)
TIME (DAYS)
PDD PILE DELIVERY DELAY 1.00 2.00 2.00 10
REB5 REMOVE EXIST. BRI. (CONC./ST. TRUSS EA 75 LF) 1.00 5.00 5.00 25
SPEB5/7 STEEL PILE END BENT (5-7 PILES) 2.00 0.20 0.40 2
DSRB DRILLED SHAFT TYPE B (</=60" DIA & </=50' L &R>=13') 8.00 1.60 12.80 64
CCA COLUMN CONCRETE TYPE A (<13 SF & 21' HT) 8.00 0.25 2.00 10
CBCA CONCRETE BENT CAP TYPE A (<4' SQ & <70' LONG) 2.00 0.60 1.20 6
CBCC CONCRETE BENT CAP TYPE C (4-5' SQ & 70' LONG) 4.00 0.75 3.00 15
SPCBA SET PRESTR. CONC. BEAMS TYPE A (1-10 BMS) 5.00 0.20 1.00 5
CPCSA CAST PRESTR. CONC SPAN A (</=75' L & </=50' W) 1.00 1.60 1.60 8
CPCSC CAST PRESTR. CONC SPAN C (>/=75' L & </=50' W) 4.00 2.00 8.00 40
CAS CAST APPROACH SLAB 2 1.00 2.00 10
SBBR SLIPFORM BRIDGE BARRIER RAIL (PER 100 LF) 8.5 0.10 0.85 4
FG & P FINISHING, GROOVING, AND PAINTING (PER 100 LF) 4.25 0.50 2.13 11
PGFD PRESTR. GIRDER FAB. DELAY (16.0 - 24.4 <0) 1 0.00 0.00 0
STT SUBTOTAL TIME 41.98
TCT TOTAL CONTRACT TIME - BRIDGE ONLY (MONTHS) 10.49
USE 10.2 MONTHS - NLT, 7-11-2001
ASSUME 20% CONCURRENCY - (1.00 -.2 = 0.8) 0.80 39.98 31.98
USE 8.0 MONTHS AS MAXIMUM TIME ROAD IS CLOSED 8.00
DUE TO BRIDGE WORK
LINES & GRADES BY CONTRACTOR AND ESTIMATES
& FINAL PLANS BY SCDOT

147
Figure D.7: Case Study Data Sheet for 29.106B

148
Table D.2: Bridge Worksheet for 29.106B
FILE NO. 29.106B (195' PRESTR. BEAM BRIDGE)
CODE CONSTRUCTION ITEM NO. OF ITEMS
TIME/ITEM (WEEKS)
TIME (WEEKS)
TIME (DAYS)
DSA DRILL SHAFT TYPE A (</=60" DIA </=50' L) 4.00 0.50 2.00 10
SPEBS STEEL PILE END BENT SPECIAL 2.00 0.60 1.20 6
CBCA CONCRETE BENT CAP TYPE A (<4' SQ & <70' LONG) 2.00 0.60 1.20 6
CBCC CONCRETE BENT CAP TYPE C (4-5' SQ & 70' LONG) 2.00 0.75 1.50 8
PBD PRESTRESSED BEAM DELIVERY (4 MONTH MIN.) 1.00 6.00 6.00 30
SPCBA SET PRESTR. CONC. BEAMS TYPE A (1-10 BMS) 3.00 0.20 0.60 3
CPCSA CAST PRESTR. CONC SPAN A (</=75' L & </=50' W) 3.00 1.60 4.80 24
SBBR SLIPFORM BRIDGE BARRIER RAIL (PER 100 LF) 4.00 0.10 0.40 2
CAS CAST APPROACH SLAB 2.00 1.00 2.00 10
FG & P FINISHING, GROOVING, AND PAINTING (PER 100 LF) 2.00 0.50 1.00 5
REB5 REMOVE EXISTING BRIDGE (EST.) 1.00 3.00 3.00 15 STT SUBTOTAL TIME 23.70
TCT TOTAL CONTRACT TIME - BRIDGE ONLY (MONTHS) 5.93

149
Figure D.8: Case Study Data Sheet for 26.100B

150
Table D.3: Bridge Worksheet for File No. 26.100B
FILE NO. 26.100B (120' CONT. FLAT SLAB BRIDGE)
CODE CONSTRUCTION ITEM NO. OF ITEMS
TIME/ITEM (WEEKS)
TIME (WEEKS)
TIME (DAYS)
IP/PDA INDEX PILE W/PDA (EACH) 0.00 0.10 0.00 0
REB2 REMOVE EXIST. BRIDGE (MAINT EA 30LF) 3.73 0.20 0.75 4
PCD PILE CAST DELAY 1.00 4.00 4.00 20
CPB5/6 CONCRETE PILE BENT (5-60 PILES) 5.00 0.75 3.75 19
CBCA CONCRETE BENT CAP TYPE A (<4 SQ &70' LONG) 5.00 0.60 3.00 15
CFSSA CAST FLAT SLAB SPAN TYPE A (L</=75 &W</50') 4.00 1.00 4.00 20
CAS CAST APPROACH SLAB (27.5' WIDE) 2.00 1.00 2.00 10
SBBR SLIPFORM BRIDGE BARRIER RAIL (PER 100 LF) 2.40 0.10 0.24 1
FG&P FINISHING GROOVING & PAINTING (PER 100 LF) 1.20 0.50 0.60 3
STT SUBTOTAL TIME 18.34
TOTAL CONTRACT TIME (BRIDGE ONLY) MONTHS
USE 5 MONTHS 04-06-01 BY NLT
MINIMUM ROAD CLOSURE TIME TO BRIDGE WORK 14.34 WEEKS OR 3.58
USE 3.6 MONTHS
LINES & GRADES AND CONSTRUCTION ESTIMATES &
FINAL PLANES BY SCDOT

151
Figure D.9: Case Study Data Sheet for 30.779

152
Figure D.10: Case Study Data Sheet for 26.994.1

153
Figure D.11: Case Study Data Sheet for 26.994

154
Figure D.12: Case Study Data Sheet for 21.102B
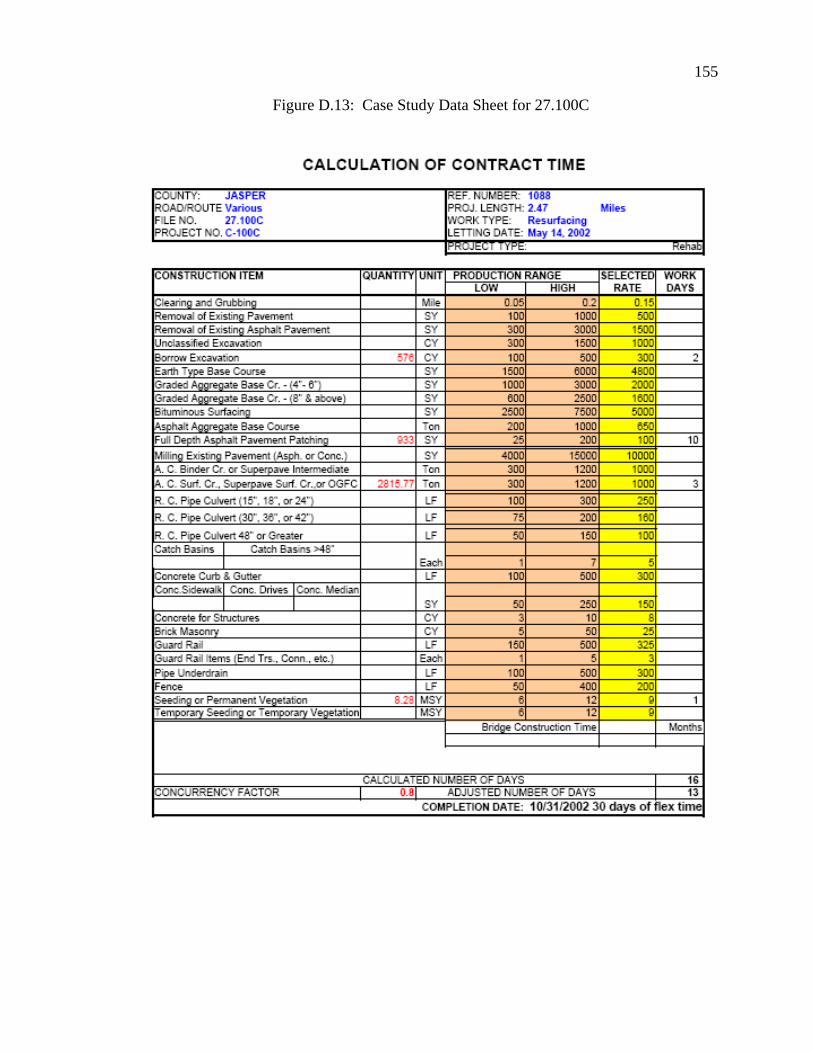
155
Figure D.13: Case Study Data Sheet for 27.100C

156
Figure D.14: Case Study Data Sheet for 28.102C

157
Figure D.15: Case Study Data Sheet for 13.107B

158
Figure D.16: Case Study Data Sheet for 13.113C

159
Figure D.17: Case Study Data Sheet for 14.127B

160
Figure D.18: Case Study Data Sheet for 27.101B

161
Figure D.19: Case Study Data Sheet for 31.123B

162
Figure D.20: Case Study Data Sheet for 9.100B

163
Figure D.21: Case Study Data Sheet for 23.135B

164
Figure D.22: Case Study Data Sheet for 12.129B

165
Appendix E. SCDOT Working Day Conversion tables
Table E.1: SCDOT Working Day Conversion Chart
Working Days Conversion Chart for Grading, Drainage, Base and Surfacing Projects
LETTING MONTH
Working Days Per Month Jan Feb Mar Apr May Jun Jul Aug Sep Oct Nov Dec
JAN 7 398 380 356 332 307 282 259 237 223 216 209 201 FEB 8 406 388 364 340 315 290 267 245 231 224 217 209 MAR 12 418 400 376 352 327 302 279 257 243 236 229 221 APR 18 18 418 394 370 345 320 297 275 261 254 247 239 MAY 24 42 24 418 394 369 344 321 299 285 278 271 263 JUN 24 66 48 24 418 393 368 345 323 309 302 295 287 JUL 25 91 73 49 25 418 393 370 348 334 327 320 312 AUG 25 116 98 74 50 25 418 395 373 359 352 345 337 SEP 23 139 121 97 73 48 23 418 396 382 375 368 360 OCT 22 161 143 119 95 70 45 22 418 404 397 390 382 NOV 14 175 157 133 109 84 59 36 14 418 411 404 396 DEC 7 182 164 140 116 91 66 43 21 7 418 411 403 JAN 7 189 171 147 123 98 73 50 28 14 7 418 410 FEB 8 197 179 155 131 106 81 58 36 22 15 8 418 MAR 12 209 191 167 143 118 93 70 48 34 27 20 12 ARP 18 227 209 185 161 136 111 88 66 52 45 38 30 MAY 24 251 233 209 185 160 135 112 90 76 69 62 54 JUN 24 275 257 233 209 184 159 136 114 100 93 86 78 JUL 25 300 282 258 234 209 184 161 139 125 118 111 103 AUG 25 325 307 283 259 234 209 186 164 150 143 136 128 SEP 23 348 330 306 282 257 232 209 187 173 166 159 151 OCT 22 370 352 328 304 279 254 231 209 195 188 181 173 NOV 14 384 366 342 318 293 268 245 223 209 202 195 187 DEC 7 391 373 349 325 300 275 252 230 216 209 202 194

166
Table E.2: SCDOT Working Day Conversion Chart for Resurfacing Projects
Working Days Conversion chart for Resurfacing Projects
LETTING MONTH
Working Days Per Month Jan Feb Mar Apr May Jun Jul Aug Sep Oct Nov Dec
JAN 0 362 344 320 296 271 246 223 201 187 187 187 187 FEB 0 362 344 320 296 271 249 223 201 187 187 187 187 MAR 12 374 356 332 308 283 258 235 213 199 199 199 199 APR 18 18 374 350 326 301 276 253 231 217 217 217 217 MAY 24 42 24 374 350 325 300 277 255 241 241 241 241 JUN 24 66 48 24 374 349 324 301 279 265 265 265 265 JUL 25 91 73 49 25 374 349 326 304 290 290 290 290 AUG 25 116 98 74 50 25 374 351 329 315 315 315 315 SEP 23 139 121 97 73 48 23 374 352 338 338 338 338 OCT 22 161 143 119 95 70 45 22 374 360 360 360 360 NOV 14 175 157 133 109 84 59 36 14 374 374 374 374 DEC 0 175 157 133 109 84 59 36 14 0 374 374 374 JAN 0 175 157 133 109 84 59 36 14 0 0 374 374 FEB 0 175 157 133 109 84 59 36 14 0 0 0 374 MAR 12 187 169 145 121 96 71 48 26 12 12 12 12 ARP 18 205 187 163 139 114 89 66 44 30 30 30 30 MAY 24 229 211 187 163 138 113 90 68 54 54 54 54 JUN 24 253 135 211 187 162 137 114 92 78 78 78 78 JUL 25 278 160 236 212 187 162 139 117 103 103 103 103 AUG 25 303 185 261 237 212 187 164 142 128 128 128 128 SEP 23 326 308 284 260 235 210 187 165 151 151 151 151 OCT 22 348 330 306 282 257 232 209 187 173 173 173 173 NOV 14 362 344 320 296 271 246 223 201 187 187 187 187 DEC 0 362 344 320 296 271 246 223 201 187 187 187 187

167
Bibliography: Abdul-Malak, M. Asem U. & Marwan Abou-Zeid, G. April 2002, ‘Process Model for
Administrating Construction Claims’, Journal of Management in Engineering, Vol. 18, No. 2, pp. 84-94
Alkass, S., Mazerolle, M., & Harris, F. (1996). Construction Delay Analysis Techniques.
Construction Management and Economics, Vol. 14, pp. 375-94. Alkass, S., Mazerolle, M., Tribaldos, E., Harris, F., (1995). Computer Aided Construction Delay Analysis and Claims Preparation. Construction Management and Economics, 13, 335-352. Bramble, Barry, & Callahan, Michael. (2004). Construction Delay Claims. Aspen Publishers. Carter, David J & Win G. Li, February 2005, ‘Construction Baseline Schedule Review
and Submittal Timeframe’, The AACE International Journal of Cost Estimation, Cost/Schedule Control, and Project Management, Vol. 47, No. 2, pp. 28-36
Chatfield, C., & Johnson, T. (2004). Step by Step: Microsoft Office Project 2003.”
Redmond, WA: Microsoft Press. Federal Highway Administration [FHWA] Legislation and Regulations, Technical
Advisory (T5080.15). (2002, October 15). Construction Contract Time Determination Procedures. Retrieved July 8, 2004, from http://www.fhwa.dot.gov/legsregs/directives/ techadvs/t508015.htm
Federal Highway Administration (FHWA] Construction and Maintenance Fact Sheets.
(2001, December). Improving Safety, Reducing Delays: Finishing on Time, on Budget with the Critical Path Method (FHWA-IF-02001). Retrieved February 3, 2005, from http://www.fhwa.dot.gov/construction /fs02001.htm
Finke, Michael. March/April 1999, ‘Window Analyses of Compensable Delays’, Journal
of Construction Engineering and Management, Vol. 125, No. 2, pp. 96-100. Hancher, D. E., McFarland, W. F., & Alabay, R. T. (1992, November). Construction
Contract Time Determination (Texas A&M University System Research Report 1262-1F). Texas Transportation Institute.
Hancher, D.E. & Werkmeister, R.F. (2000, June). Kentucky Contract Time
Determination System. University of Kentucky Research Foundation, Kentucky Transportation Center.

168
Herbsman, Z. J. & Ellis, R. (1995). Determination of Contract Time for Highway Construction Projects (NCHRP Synthesis Report 215). Washington, DC: National Academy Press.
Hegazy, Tarek & Kehui Zhang, April 2003, ‘Daily Windows Delay Analysis’, Journal of
Construction Engineering and Management, Vol. 131, No. 5, pp. 505-512 Hernandez, T. (1999). Software Solutions. Building Design & Construction, 40(11), 38. Kim, K. & de la Garza, J. (2005). Critical Path Method with Multiple Calendars.
Journal of Construction Engineering and Management, 131(3), 330-342. Kululanga, G.K., Kuotcha, W., McCaffer, R., Edum-Fotwe, F., (2001). Construction Contractors’ Claim Process Framework. Journal of Construction Engineering and Management, Vol. 127, No. 4, pp. 309-314. Kumaraswamy, M. M, and K. Yogeswaran. January 2003, “Substantiation and
Assessment of Claims for Extensions of Time.” International Journal of Project Management, Vol. 21, I. 1, pp.27-38.
Lientz, B. & Rea, K. (2002). Project Management for the 21St Century. San Diego, CA:
Academic Press. Nicholas, J. (2001). Project Management for Business and Technology Principles and
Practice. Upper Saddle River, NJ: Prentice Hall. Project Management Tools Working Group II. (2002). Enterprise Project Management
Tool Analysis White Paper. Retrieved May 4, 2005, from http://www.appl.nasa.gov/pdf/62195main_enterprise_level_tools_whitepaper.pdf.
Suddleson, Heath. 2001, ‘Avoid Unscrupulous Claims’, ENR: Engineering News-
Record, Vol. 246, I. 16, pp. 63 Transportation Research Board. (1981). Contract Time Determination (NCHRP
Synthesis of Highway Practice 79). Washington, DC. Yogeswaren, K., Kumaraswamy, M., & Miller, D., (1998). Claims for Extensions of Time in Civil Engineering Projects. Construction Management and Economics, Vol. 16, pp. 283-293.