Embed Size (px)
Citation preview
Final Report
Traffic Detector ADEC TDC3-8-F-B-45
Datei: Final Report ADEC 8+1 V1.4_E.docx Issue/Revision: 03.10.2014 Page 1/28
Final Report
ADEC – TDC3-8-F-B-45
Hardware- Version: 4 Firmwareversion: 1.4
8+1 Traffic Detector
Author Date Description Version
Rauch Peter 15.09.2014 First Version 1.0
Rauch Peter 15.09.2014 Adding sensor data 1.1
Rauch Peter 29.09.2014 Include changes submitted by ASFiNAG 1.2
Rauch Peter 03.10.2014 Minor content and formatting changes 1.3
Andreas Hartmann 29.10.2014 Translation to English, minor clarifications 1.4
Translation form German to English: by A. Hartmann, ADEC Technologies

Final Report
Traffic Detector ADEC TDC3-8-F-B-45
Datei: Final Report ADEC 8+1 V1.4_E.docx Issue/Revision: 03.10.2014 Page 2/28
1 Table of Content
1 Table of Content .............................................................................................................................................................. 2
2 Figures .............................................................................................................................................................................. 3
3 Tables ................................................................................................................................................................................ 3
4 Testing Procedure ........................................................................................................................................................... 4 4.1 Test Setup ............................................................................................................................................................................................... 4 4.2 Sample Data Acquisition...................................................................................................................................................................... 4 4.3 Analysis ................................................................................................................................................................................................... 4
5 Basics ................................................................................................................................................................................ 5 5.1 Introduction ............................................................................................................................................................................................. 5 5.2 Test Site .................................................................................................................................................................................................. 5 5.3 Setup of the ADEC Measurement Point .......................................................................................................................................... 5 5.4 Specification „ADEC TDC3-8-F-B-45“ .............................................................................................................................................. 7 5.5 Camera for Video Recording .............................................................................................................................................................. 8
6 Wiring ................................................................................................................................................................................ 9
7 Analysis ADEC TDC3-8-F-B-45 Detector .................................................................................................................... 11 7.1 Analysis of the Vehicle Classification ............................................................................................................................................. 11 7.1.1 Evaluation Process ............................................................................................................................................................................. 11 7.1.2 Formulas................................................................................................................................................................................................ 12 7.1.3 Template................................................................................................................................................................................................ 14 7.1.4 Testing conditions ............................................................................................................................................................................... 15
8 Results of ADEC Detectors .......................................................................................................................................... 16 8.1 Results of the Vehicle Classification ............................................................................................................................................... 16 8.1.1 Complete Test Protocol ..................................................................................................................................................................... 16 8.1.2 Additional Discussion to the Test Protocol .................................................................................................................................... 17
9 Speed Analysis .............................................................................................................................................................. 19 9.1 Measurement Site Setup ................................................................................................................................................................... 19 9.2 Specification ......................................................................................................................................................................................... 20 9.2.1 Reference System ............................................................................................................................................................................... 20 9.3 Evaluation ............................................................................................................................................................................................. 20 9.4 Results Lane 1 ..................................................................................................................................................................................... 21 9.5 Analysis ................................................................................................................................................................................................. 22 9.5.1 Histogram of Speed Differences for Speeds of up to 100km/h ................................................................................................ 23 9.5.2 Histogram of Speed Differences for Speeds greater than 100km/h ........................................................................................ 23 9.6 Results Passing Lane (Lane 2) ........................................................................................................................................................ 24 9.7 Analysis ................................................................................................................................................................................................. 25 9.7.1 Histogram of Speed Differences for Speeds of up to 100km/h ................................................................................................ 26 9.7.2 Histogram of Speed Differences for Speeds greater than 100km/h ........................................................................................ 26
10 Conclusion...................................................................................................................................................................... 27
11 Attachments Included by Reference ........................................................................................................................... 28

Final Report
Traffic Detector ADEC TDC3-8-F-B-45
Datei: Final Report ADEC 8+1 V1.4_E.docx Issue/Revision: 03.10.2014 Page 3/28
2 Figures
Figure 1: Map of the test site .............................................................................................................. 5
Figure 2: Image shows the gantry facing the traffic direction .............................................................. 6
Figure 3: Gantry with detector depicting the detection zones ............................................................. 6
Figure 4: Mechanical dimensions ........................................................................................................ 7
Figure 5: Camera................................................................................................................................. 8
Figure 6: Connector to the ADEC detector ........................................................................................... 9
Figure 7: Wiring overview ................................................................................................................. 10
Figure 8: Camera view of approaching traffic .................................................................................... 15
Figure 9: Test protocol ...................................................................................................................... 16
Figure 10: Measurement setup for speed analysis............................................................................. 19
Figure 11: Evaluation table................................................................................................................ 20
Figure 12: Average measurement values ........................................................................................... 21
Figure 13: Calculated results, includes outliers .................................................................................. 21
Figure 14: Speed difference table...................................................................................................... 22
Figure 15: Histogram of speed error for speeds ≤ 100km/h ............................................................... 23
Figure 16: Histogram of speed error for speeds > 100 km/h .............................................................. 23
Figure 17: Average measurement values ........................................................................................... 24
Figure 18: Calculated results, includes outliers .................................................................................. 24
Figure 19: Speed difference table...................................................................................................... 25
Figure 20: Histogram of speed error for speeds ≤ 100km/h ............................................................... 26
Figure 21: Histogram of speed error for speeds > 100 km/h .............................................................. 26
3 Tables
Table 1: Technical specification ........................................................................................................... 7
Table 2: Connector pin assignment ..................................................................................................... 9
Table 3: Evaluation Table .................................................................................................................. 11
Table 4: Result table template .......................................................................................................... 14
Table 5: Absolute vehicle counts, by class ......................................................................................... 17
Table 6: Relative share of each vehicle class in total volume ............................................................. 17
Table 7: Detection rates results......................................................................................................... 18
Table 8: ASFiNAG required classification accuracy ............................................................................. 27

Final Report
Traffic Detector ADEC TDC3-8-F-B-45
Datei: Final Report ADEC 8+1 V1.4_E.docx Issue/Revision: 03.10.2014 Page 4/28
4 Testing Procedure
The testing procedure is conducted in three steps. The setup includes the mounting and commis-
sioning of the traffic detectors. In the second step, traffic data are recorded by ASFiNAG. In the last
step the data analysis is performed.
4.1 Test Setup
The test setup consists of the following steps:
1. Setting up the detectors at the test site (ADEC)
- Mounting of detector devices
- Wiring
- Configuration of the detectors
2. Commissioning of the detectors at the test site by the manufacturer (ADEC) and
automationX
- Verification of the mounting
- Verification of the wiring
- Verification that data is acquired properly
In this phase, the communication between the detectors and the traffic data collector and subse-
quently the detection of the different classes is verified.
4.2 Sample Data Acquisition
The acquisition of test data includes the following steps:
1. Written request to ASFiNAG to initiate the recording process
2. All remote access to the test site is deactivated and blocked
3. Traffic and video data are recorded exclusively by ASFiNAG
4. Transmission of the raw data to the companies for analysis
4.3 Analysis
During the analysis, the traffic data acquired by the detectors are compared with the corresponding
video footage and the results are noted in the so-called evaluation table. The evaluation table fol-
lows rules set forth by ASFiNAG which must be strictly followed.
The hours during which the analysis is to take place is given by ASFiNAG and can be modified on-
ly in accordance with and permission by ASFiNAG.
The raw data are solely recorded by ASFiNAG and are provided to the respective companies only
upon request.
Final Report
Traffic Detector ADEC TDC3-8-F-B-45
Datei: Final Report ADEC 8+1 V1.4_E.docx Issue/Revision: 03.10.2014 Page 5/28
5 Basics
5.1 Introduction
The present report describes the final report of the test of the overhead detector “TDC3-8-F-B-45”
by ADEC. The detector uses three distinct sensing technologies: Doppler radar, ultrasonic and
passive infra-red. The report is based on TLS 2002 (Technical Delivery Requirements for Data Col-
lector Outstations, Issue 2002) in regards to the quality of the vehicle classification and the speed
acquisition. The primary goal of the analysis is to determine the classification performance. The
secondary goal is to determine the speed measurement performance using comparative speed
measurements by a speed reference system.
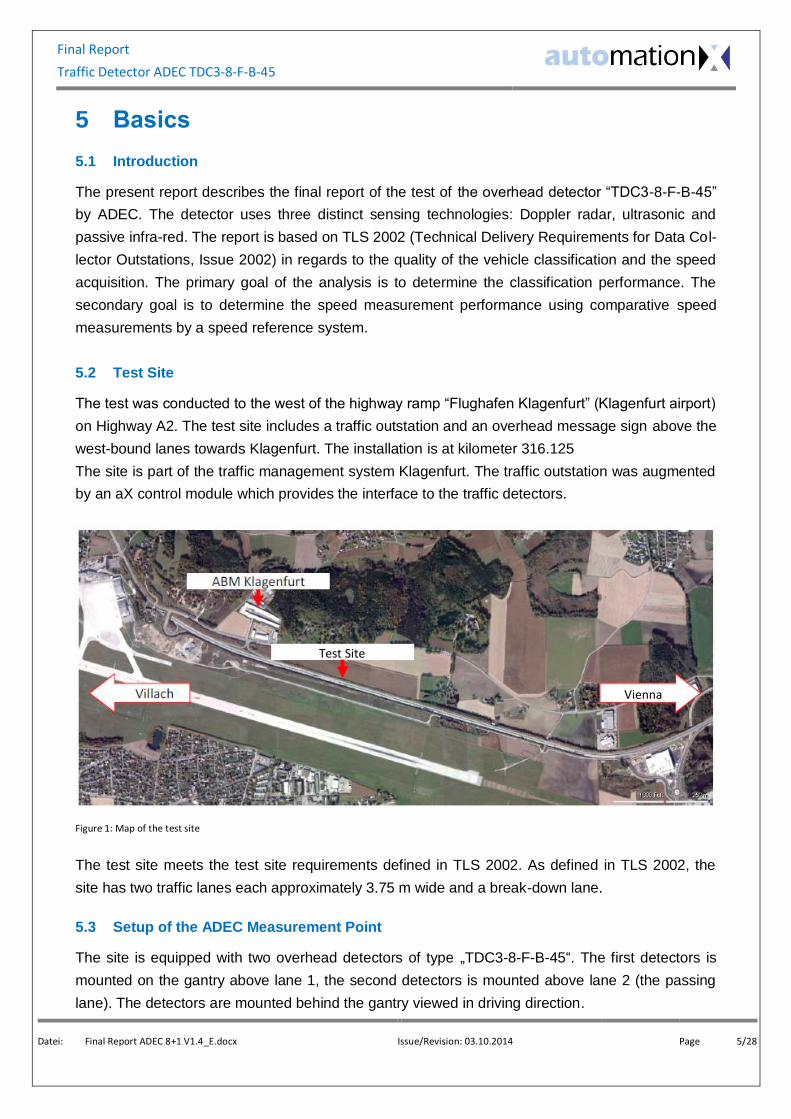
5.2 Test Site
The test was conducted to the west of the highway ramp “Flughafen Klagenfurt” (Klagenfurt airport)
on Highway A2. The test site includes a traffic outstation and an overhead message sign above the
west-bound lanes towards Klagenfurt. The installation is at kilometer 316.125
The site is part of the traffic management system Klagenfurt. The traffic outstation was augmented
by an aX control module which provides the interface to the traffic detectors.
Figure 1: Map of the test site
The test site meets the test site requirements defined in TLS 2002. As defined in TLS 2002, the
site has two traffic lanes each approximately 3.75 m wide and a break-down lane.
5.3 Setup of the ADEC Measurement Point
The site is equipped with two overhead detectors of type „TDC3-8-F-B-45“. The first detectors is
mounted on the gantry above lane 1, the second detectors is mounted above lane 2 (the passing
lane). The detectors are mounted behind the gantry viewed in driving direction.
Test Site
Vienna

Final Report
Traffic Detector ADEC TDC3-8-F-B-45
Datei: Final Report ADEC 8+1 V1.4_E.docx Issue/Revision: 03.10.2014 Page 6/28
Figure 2: Image shows the gantry facing the traffic direction
The detector with hardware configuration “Frontfire” has been mounted behind the gantry:
Figure 3: Gantry with detector depicting the detection zones
The detectors are mounted with ADEC original mounting equipment on a standard mounting loca-
tion for overhead detectors. The positioning of the detectors has been conducted by ADEC to op-
timally align the detectors with the traffic flow.
Radar
Ultrasonic
Infra-red
Outstation Cabinet

Final Report
Traffic Detector ADEC TDC3-8-F-B-45
Datei: Final Report ADEC 8+1 V1.4_E.docx Issue/Revision: 03.10.2014 Page 7/28
5.4 Specification „ADEC TDC3-8-F-B-45“
Hardware version: 4
Firmware version: 1.4
Supply Voltage 10.5 … 30 V DC
Power consumption Max. 110 mA typ. 80 mA @ 12 V DC
Output (data transfer) RS 485 (other options on request)
Turn-on time typ. 20 seconds from power on
Mechanical
Dimensions See drawing below
Case material Polycarbonate, dark grey
Weight app. 1,700 g (3.75 lbs) without bracket
Detection
Doppler radar K-Band 24.05 … 24.25 GHz
Ultrasonic frequency 40 kHz
Ultrasonic pulse rate 10 … 30 pulses per second
PIR sensors 7 channel PIR curtain (TDC3-3 /-5 /-8)
PIR spectral response 6.5 … 14 μm
Accuracy
Counting typ. ± 3%
Speed
typ. ± 3% (> 100 km/h) typ. ± 3km/h (≤ 100 km/h)
Classification
Vehicle classes according TLS. The specifications refer to free traffic flow, detector operated in recommended setup
Environmental
Operating temperature Between –40°C and +70°C (–40º to +158ºF)
Humidity 95 % RH max.
Sealing IP 64 splash proof
Table 1: Technical specification
Figure 4: Mechanical dimensions [mm]

Final Report
Traffic Detector ADEC TDC3-8-F-B-45
Datei: Final Report ADEC 8+1 V1.4_E.docx Issue/Revision: 03.10.2014 Page 8/28
5.5 Camera for Video Recording
The visual reference data at the test site are recorded using two Axis cameras. One camera is
aimed at the oncoming traffic; the other camera is aimed at the departing traffic.
Figure 5: Camera
The cameras are mounted on the gantry monitoring both lanes. The recording is accomplished
through the network of ASFiNAG onto a computer at Lakeside.
The recordings of any requested period of time have always been made available by ASFiNAG.

Final Report
Traffic Detector ADEC TDC3-8-F-B-45
Datei: Final Report ADEC 8+1 V1.4_E.docx Issue/Revision: 03.10.2014 Page 9/28
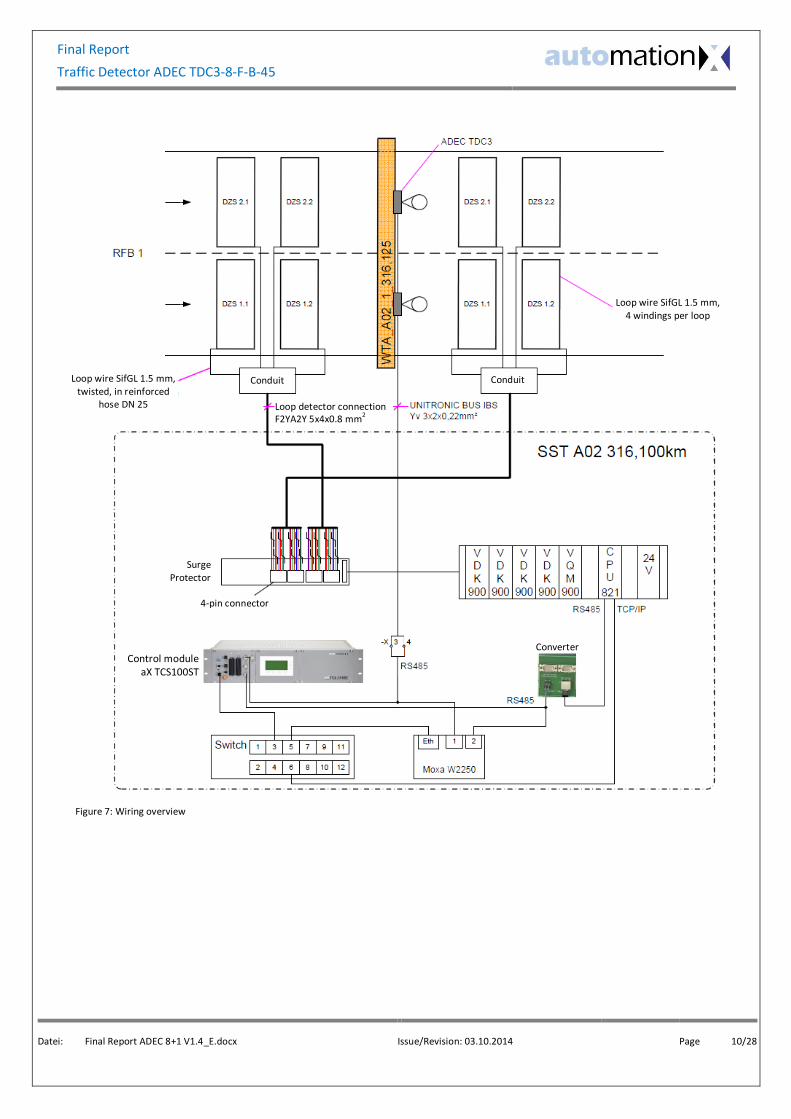
6 Wiring
The wiring of the test equipment was done by AutomationX following the instructions of the manu-
facturer.
The two detectors are wired to the control module (data collector) using a cable of type UNITRON-
IC Bus IBS Yv 3x2x0.22 mm2. The detectors are interconnected through five leads; one of them is
used for the synchronization between the detectors. The connection to the control module uses
four leads, two for supplying the power and two for the RS 485 (half-duplex) serial connection.
Figure 6: Connector to the ADEC detector
Pin number Description / Usage Color
1 Positive supply voltage, Vcc Brown
2 (not used)
3 GND White
4 Synchronization* Gray
5 RS 485 signal A Green
6 RS 485 signal B Yellow
* Synchronization is connected only between detectors, not to the control module
Table 2: Connector pin assignment
The bus is terminated at the last detector on the bus. ADEC supplies a terminating resistor plug
connector for this purpose that is connected to the female device connector of the device. The RS
485 bus is connected with the control module using two terminals. The terminals permit access to
the bus for configuration and software update purposes.
Final Report
Traffic Detector ADEC TDC3-8-F-B-45
Datei: Final Report ADEC 8+1 V1.4_E.docx Issue/Revision: 03.10.2014 Page 10/28
Figure 7: Wiring overview
Loop detector connection F2YA2Y 5x4x0.8 mm
2
Surge Protector
Control module aX TCS100ST
4-pin connector
Loop wire SifGL 1.5 mm, twisted, in reinforced
hose DN 25
Conduit
Converter
Conduit
Loop wire SifGL 1.5 mm, 4 windings per loop

Final Report
Traffic Detector ADEC TDC3-8-F-B-45
Datei: Final Report ADEC 8+1 V1.4_E.docx Issue/Revision: 03.10.2014 Page 11/28
7 Analysis ADEC TDC3-8-F-B-45 Detector
7.1 Analysis of the Vehicle Classification
7.1.1 Evaluation Process
The evaluation involves the comparison between the reference and the teste subject. The test sub-
jects are the TDC3-8-F-B-45 traffic detectors and the reference is the recorded video footage. Dur-
ing a period of 14 hours, traffic data has been acquired and stored in *.csv format. During the anal-
ysis, the vehicles from the video footage are reviewed and compared to the data acquired by the
traffic detectors.
Table 3: Evaluation Table
The table with the traffic data from the detectors is enhanced with the actual data extracted from
the video footage. The comparison is conducted on an hourly base and evaluated using the filter
function provided by Microsoft Excel. The results are entered to the result table that calculates the
detection rates according to TLS 2002.
As specified in the TLS guidelines, only vehicles are evaluated that correctly pass the test area.
Lane-changing vehicles are discarded. The rows that have been edited are changed to use a red
background. A row with traffic data of an incorrect detection is given a value of “-1” in the column
“Control”, a row with traffic data of a lane-changing vehicle is given an blank entry.
In addition to basic information such as date, time and examiner, the data from the evaluation table
are added to the results table.
Final Report
Traffic Detector ADEC TDC3-8-F-B-45
Datei: Final Report ADEC 8+1 V1.4_E.docx Issue/Revision: 03.10.2014 Page 12/28
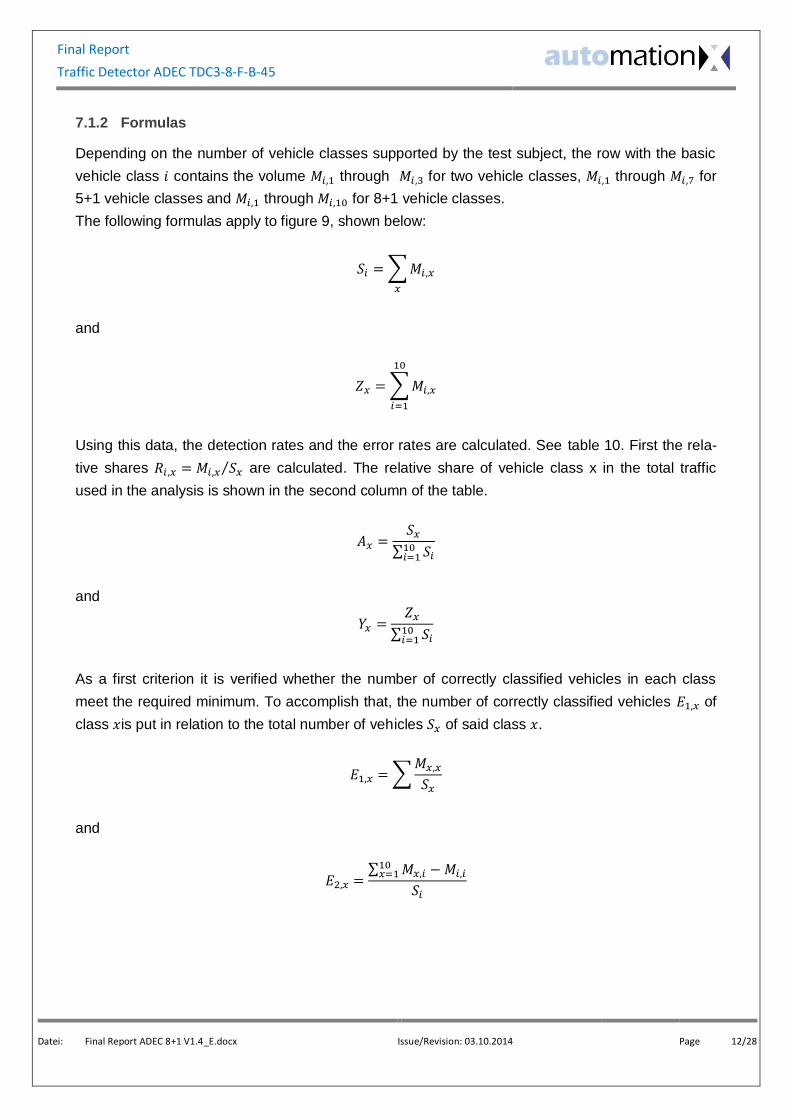
7.1.2 Formulas
Depending on the number of vehicle classes supported by the test subject, the row with the basic
vehicle class 𝑖 contains the volume 𝑀𝑖,1 through 𝑀𝑖,3 for two vehicle classes, 𝑀𝑖,1 through 𝑀𝑖,7 for
5+1 vehicle classes and 𝑀𝑖,1 through 𝑀𝑖,10 for 8+1 vehicle classes.
The following formulas apply to figure 9, shown below:
𝑆𝑖 = ∑ 𝑀𝑖,𝑥
𝑥
and
𝑍𝑥 = ∑ 𝑀𝑖,𝑥
10
𝑖=1
Using this data, the detection rates and the error rates are calculated. See table 10. First the rela-
tive shares 𝑅𝑖,𝑥 = 𝑀𝑖,𝑥 𝑆𝑥⁄ are calculated. The relative share of vehicle class x in the total traffic
used in the analysis is shown in the second column of the table.
𝐴𝑥 =𝑆𝑥
∑ 𝑆𝑖10𝑖=1
and
𝑌𝑥 =𝑍𝑥
∑ 𝑆𝑖10𝑖=1
As a first criterion it is verified whether the number of correctly classified vehicles in each class
meet the required minimum. To accomplish that, the number of correctly classified vehicles 𝐸1,𝑥 of
class 𝑥is put in relation to the total number of vehicles 𝑆𝑥 of said class 𝑥.
𝐸1,𝑥 = ∑𝑀𝑥,𝑥
𝑆𝑥
and
𝐸2,𝑥 =∑ 𝑀𝑥,𝑖 − 𝑀𝑖,𝑖
10𝑥=1
𝑆𝑖

Final Report
Traffic Detector ADEC TDC3-8-F-B-45
Datei: Final Report ADEC 8+1 V1.4_E.docx Issue/Revision: 03.10.2014 Page 13/28
To generalize the detection rate calculated for a finite number of vehicles, the binomial distribution
at a 95% confidence level is used. The lower interval boundary is called the “statistically relevant
detection rate”:
𝑃𝐸1,𝑥= 2 ∙ 𝑀𝑥,𝑥 + 𝑍2 − 𝑍 ∙
√𝑍2 + 4 ∙ 𝑀𝑥,𝑥 ∙ (1 −𝑀𝑥,𝑥
𝑆𝑥)
2 ∙ (𝑆𝑥 + 𝑍2)
where 𝑍 = 1.96 (two-digit 95% - quintile normal distribution)
and
𝑃𝐸2,𝑥= 2 ∙ 𝑅𝑥,𝑖 + 𝑍2 − 𝑍 ∙
√𝑍2 + 4 ∙ 𝑅𝑥,𝑖 ∙ (1 −𝑅𝑥,𝑖
𝑆𝑥,𝑖)
2 ∙ (𝑆𝑥,𝑖 + 𝑍2)
where 𝑍 = 1.96 (two-digit 95% - quintile normal distribution)
𝑅𝑥,𝑖 = 𝑆𝑖 ∙𝑇𝑖
𝐴𝑖− ∑ 𝑀𝑛,i ∙
𝑇𝑖
𝐴𝑖 | ∀ 𝑛 ≠ 𝑖
8
𝑛=1
where 𝑇𝑖 is the target volume of class 𝑖 and 𝐴𝑖 is the actual volume of class 𝑖
and
𝑆𝑥𝑖 = 𝑆𝑖 ∙𝑇𝑖
𝐴𝑖
and
𝑋1 = ∑ 𝑆𝑖,𝑥
10
𝑖=1
− ∑ 𝑍𝑖,𝑥
9
𝑖=1
+ ∑ 𝑀𝑥,𝑥
9
𝑖=1

Final Report
Traffic Detector ADEC TDC3-8-F-B-45
Datei: Final Report ADEC 8+1 V1.4_E.docx Issue/Revision: 03.10.2014 Page 14/28
7.1.3 Template
Table 4: Result table template
The results are automatically calculated in the lower section of the results table. The required limits are shown depending on the current requirements. In this particular instance the requirements set forth by ASFiNAG must be met.
Control number:
Manufacturer: ADEC
Device Type: TDC3-8
Loop Type: Typ 2
Link Length: 25m
Vehicle class
Anzahl Motorcycle Car Van
Car with
trailer Truck
Truck with
trailer
Tracotr with
trailer Bus
other / not
classifiable
not
detected
Motorcycle 490 456 21 7 0 0 0 0 0 0 6
Car 9433 1 9405 19 0 0 0 0 0 5 3
Van 1275 0 34 1234 3 3 0 0 0 1 0
Car with trailer 249 0 15 21 210 2 0 1 0 0 0
Truck 403 0 0 12 0 386 0 4 1 0 0
Truck with trailer 294 0 0 0 0 3 280 11 0 0 0
Tractor with trailer 891 0 0 0 0 4 7 878 2 0 0
Bus 66 0 0 0 0 0 0 0 66 0 0
other / not
classifiable 1 0 0 0 0 0 0 0 0 1 0
"Phantom" 0 1 0 0 0 0 0 0 0 0
Total 13102 457 9476 1293 213 398 287 894 69 7 9
Vehicle class
CountMotorcycle Car Van
Car with
trailerTruck
Truck with
trailer
Tractor with
trailerBus
other / not
classifiable
not
detected
Motorcycle 3.74% 93.06% 4.29% 1.43% 0.00% 0.00% 0.00% 0.00% 0.00% 0.00% 1.22%
Car 72.00% 0.01% 99.70% 0.20% 0.00% 0.00% 0.00% 0.00% 0.00% 0.05% 0.03%
Van 9.73% 0.00% 2.67% 96.78% 0.24% 0.24% 0.00% 0.00% 0.00% 0.08% 0.00%
Car with trailer 1.90% 0.00% 6.02% 8.43% 84.34% 0.80% 0.00% 0.40% 0.00% 0.00% 0.00%
Truck 3.08% 0.00% 0.00% 2.98% 0.00% 95.78% 0.00% 0.99% 0.25% 0.00% 0.00%
Truck with trailer 2.24% 0.00% 0.00% 0.00% 0.00% 1.02% 95.24% 3.74% 0.00% 0.00% 0.00%
Tractor with trailer 6.80% 0.00% 0.00% 0.00% 0.00% 0.45% 0.79% 98.54% 0.22% 0.00% 0.00%
Bus 0.50% 0.00% 0.00% 0.00% 0.00% 0.00% 0.00% 0.00% 100.00% 0.00% 0.00%
other / not
classifiable 0.01% 0.00% 0.00% 0.00% 0.00% 0.00% 0.00% 0.00% 0.00% 100.00% 0.00%
"Phantom" 0.00% 100.00% 0.00% 0.00% 0.00% 0.00% 0.00% 0.00% 0.00% 0.00%
Total 100.00% 3.49% 72.32% 9.87% 1.63% 3.04% 2.19% 6.82% 0.53% 0.05% 0.07%
Motorcycle Car VanCar with
TrailerTruck
Truck with
Trailer
Tractor with
SemitrailerBus
statistically relevant
detection rate E1 90.5% 99.6% 95.7% 79.3% 93.3% 92.2% 97.5% 94.5% 99.87%
statistically relevant
detection rate E2 94.0% 99.5% 91.5% 94.8% 96.5% 97.8% 95.2% 77.6% 99.96%
90% 97% 90% 90% 90% 95% 95% 90% 99%
for accuracy level A1 pass pass pass fail pass fail pass fail pass
85% 95% 85% 85% 85% 90% 90% 85% 97%
for accuracy level A2 pass pass pass fail pass pass pass fail pass
80% 90% 80% 80% 80% 85% 85% 80% 95%
for accuracy level A3 pass pass pass fail pass pass pass fail pass
required detection rate
Vehicle in
general
Vehicle class
detected by test subject as
detected by test subject as
required detection rate
required detection rate

Final Report
Traffic Detector ADEC TDC3-8-F-B-45
Datei: Final Report ADEC 8+1 V1.4_E.docx Issue/Revision: 03.10.2014 Page 15/28
7.1.4 Testing Conditions
The tests took place on 3-Sep-2014 from 8 AM until 4 PM, 4-Sep-2014 from 9 AM until 12 PM and
on 5-Sep-2015 from 8 AM until 2 PM. During these time periods the video and the traffic data have
been recorded for further analysis.
The pavement was dry during the entire measurement period and the sky was partially sunny. The
traffic volume for the site was within normal range and varied slightly during the measurement pe-
riod. The hourly volume of between 800 and 1100 vehicles is typical and can be considered in free-
flow. During the measurement periods there was no traffic jam or other irregular traffic situation.
Figure 8: Camera view of approaching traffic

Final Report
Traffic Detector ADEC TDC3-8-F-B-45
Datei: Final Report ADEC 8+1 V1.4_E.docx Issue/Revision: 03.10.2014 Page 16/28
8 Results of ADEC Detectors
A cumulative results table has been created for each hour for which the comparison between the
test subject (traffic detector) and the reference (video footage, manually classified) has been done.
In the end, the hourly results were combined into a total cumulative results table.
8.1 Results of the Vehicle Classification
8.1.1 Complete Test Protocol
Figure 9: Test protocol
Control number:
Manufacturer: ADEC
Device Type: TDC3-8
Loop Type: Typ 2
Link Length: 25m
Vehicle class
Anzahl Motorcycle Car Van
Car with
trailer Truck
Truck with
trailer
Tracotr with
trailer Bus
other / not
classifiable
not
detected
Motorcycle 490 456 21 7 0 0 0 0 0 0 6
Car 9433 1 9405 19 0 0 0 0 0 5 3
Van 1275 0 34 1234 3 3 0 0 0 1 0
Car with trailer 249 0 15 21 210 2 0 1 0 0 0
Truck 403 0 0 12 0 386 0 4 1 0 0
Truck with trailer 294 0 0 0 0 3 280 11 0 0 0
Tractor with trailer 891 0 0 0 0 4 7 878 2 0 0
Bus 66 0 0 0 0 0 0 0 66 0 0
other / not
classifiable 1 0 0 0 0 0 0 0 0 1 0
"Phantom" 0 1 0 0 0 0 0 0 0 0
Total 13102 457 9476 1293 213 398 287 894 69 7 9
Vehicle class
CountMotorcycle Car Van
Car with
trailerTruck
Truck with
trailer
Tractor with
trailerBus
other / not
classifiable
not
detected
Motorcycle 3.74% 93.06% 4.29% 1.43% 0.00% 0.00% 0.00% 0.00% 0.00% 0.00% 1.22%
Car 72.00% 0.01% 99.70% 0.20% 0.00% 0.00% 0.00% 0.00% 0.00% 0.05% 0.03%
Van 9.73% 0.00% 2.67% 96.78% 0.24% 0.24% 0.00% 0.00% 0.00% 0.08% 0.00%
Car with trailer 1.90% 0.00% 6.02% 8.43% 84.34% 0.80% 0.00% 0.40% 0.00% 0.00% 0.00%
Truck 3.08% 0.00% 0.00% 2.98% 0.00% 95.78% 0.00% 0.99% 0.25% 0.00% 0.00%
Truck with trailer 2.24% 0.00% 0.00% 0.00% 0.00% 1.02% 95.24% 3.74% 0.00% 0.00% 0.00%
Tractor with trailer 6.80% 0.00% 0.00% 0.00% 0.00% 0.45% 0.79% 98.54% 0.22% 0.00% 0.00%
Bus 0.50% 0.00% 0.00% 0.00% 0.00% 0.00% 0.00% 0.00% 100.00% 0.00% 0.00%
other / not
classifiable 0.01% 0.00% 0.00% 0.00% 0.00% 0.00% 0.00% 0.00% 0.00% 100.00% 0.00%
"Phantom" 0.00% 100.00% 0.00% 0.00% 0.00% 0.00% 0.00% 0.00% 0.00% 0.00%
Total 100.00% 3.49% 72.32% 9.87% 1.63% 3.04% 2.19% 6.82% 0.53% 0.05% 0.07%
Motorcycle Car VanCar with
TrailerTruck
Truck with
Trailer
Tractor with
SemitrailerBus
statistically relevant
detection rate E1 90.5% 99.6% 95.7% 79.3% 93.3% 92.2% 97.5% 94.5% 99.87%
statistically relevant
detection rate E2 94.0% 99.5% 91.5% 94.8% 96.5% 97.8% 95.2% 77.6% 99.96%
90% 97% 90% 90% 90% 95% 95% 90% 99%
for accuracy level A1 pass pass pass fail pass fail pass fail pass
85% 95% 85% 85% 85% 90% 90% 85% 97%
for accuracy level A2 pass pass pass fail pass pass pass fail pass
80% 90% 80% 80% 80% 85% 85% 80% 95%
for accuracy level A3 pass pass pass fail pass pass pass fail pass
required detection rate
Vehicle in
general
Vehicle class
detected by test subject as
detected by test subject as
required detection rate
required detection rate

Final Report
Traffic Detector ADEC TDC3-8-F-B-45
Datei: Final Report ADEC 8+1 V1.4_E.docx Issue/Revision: 03.10.2014 Page 17/28
8.1.2 Additional Discussion to the Test Protocol
The tests took place on 3-Sep-2014 from 8 AM until 4 PM, 4-Sep-2014 from 9 AM until 12 PM and
5-Sep-2015 from 8 AM until 2 PM. During these time periods the video and the traffic data have
been recorded for further analysis.
This period of time has been analyzed using the individual vehicle records and the video footage.
The hourly results of the entire 14 hours period of video-verified traffic data were eventually aggre-
gated into a cumulative results table. The volume of each vehicle class is shown below:
Table 5: Absolute vehicle counts, by class
The following table shows the relative share of each vehicle class in the total traffic volume during
the test period that has passed at the test site.
Table 6: Relative share of each vehicle class in total volume
Vehicle class
CountMotorcycle Car Van
Car with
trailerTruck
Truck with
trailer
Tractor with
trailerBus
other / not
classifiable
not
detected
Motorcycle 3.74% 93.06% 4.29% 1.43% 0.00% 0.00% 0.00% 0.00% 0.00% 0.00% 1.22%
Car 72.00% 0.01% 99.70% 0.20% 0.00% 0.00% 0.00% 0.00% 0.00% 0.05% 0.03%
Van 9.73% 0.00% 2.67% 96.78% 0.24% 0.24% 0.00% 0.00% 0.00% 0.08% 0.00%
Car with trailer 1.90% 0.00% 6.02% 8.43% 84.34% 0.80% 0.00% 0.40% 0.00% 0.00% 0.00%
Truck 3.08% 0.00% 0.00% 2.98% 0.00% 95.78% 0.00% 0.99% 0.25% 0.00% 0.00%
Truck with trailer 2.24% 0.00% 0.00% 0.00% 0.00% 1.02% 95.24% 3.74% 0.00% 0.00% 0.00%
Tractor with trailer 6.80% 0.00% 0.00% 0.00% 0.00% 0.45% 0.79% 98.54% 0.22% 0.00% 0.00%
Bus 0.50% 0.00% 0.00% 0.00% 0.00% 0.00% 0.00% 0.00% 100.00% 0.00% 0.00%
other / not
classifiable 0.01% 0.00% 0.00% 0.00% 0.00% 0.00% 0.00% 0.00% 0.00% 100.00% 0.00%
"Phantom" 0.00% 100.00% 0.00% 0.00% 0.00% 0.00% 0.00% 0.00% 0.00% 0.00%
Total 100.00% 3.49% 72.32% 9.87% 1.63% 3.04% 2.19% 6.82% 0.53% 0.05% 0.07%
detected by test subject as
Vehicle class
Anzahl Motorcycle Car Van
Car with
trailer Truck
Truck with
trailer
Tracotr with
trailer Bus
other / not
classifiable
not
detected
Motorcycle 490 456 21 7 0 0 0 0 0 0 6
Car 9433 1 9405 19 0 0 0 0 0 5 3
Van 1275 0 34 1234 3 3 0 0 0 1 0
Car with trailer 249 0 15 21 210 2 0 1 0 0 0
Truck 403 0 0 12 0 386 0 4 1 0 0
Truck with trailer 294 0 0 0 0 3 280 11 0 0 0
Tractor with trailer 891 0 0 0 0 4 7 878 2 0 0
Bus 66 0 0 0 0 0 0 0 66 0 0
other / not
classifiable 1 0 0 0 0 0 0 0 0 1 0
"Phantom" 0 1 0 0 0 0 0 0 0 0
Total 13102 457 9476 1293 213 398 287 894 69 7 9
detected by test subject as

Final Report
Traffic Detector ADEC TDC3-8-F-B-45
Datei: Final Report ADEC 8+1 V1.4_E.docx Issue/Revision: 03.10.2014 Page 18/28
The resulting detection rates in the results table were calculated as follows: These results show
that all detection rates are greater than the minimum detection rate demanded by ASFiNAG.
For the accuracy level A2, the detection rates of the classes “Car with trailer” and “Bus” do not
meet the required accuracy levels.
For the accuracy level A1, the detection rates of the classes “Car with trailer”, “Truck with trailer””
and “Bus” do not meet the required accuracy levels.
Table 7: Detection rates results
Note: The statistically relevant detection rate for buses is 87.5%, but because the standardized ve-
hicle mix calls for only 𝑇𝑖 = 0.3% of the vehicles to be buses, the number of buses is cut from 69
(𝐴𝑖 = 0.5%) to 39.3. This low volume greatly affects the statistically significant detection rate which
drops to 77.6%, slightly below the required level for A3.
Motorcycle Car VanCar with
TrailerTruck
Truck with
Trailer
Tractor with
SemitrailerBus
statistically relevant
detection rate E1 90.5% 99.6% 95.7% 79.3% 93.3% 92.2% 97.5% 94.5% 99.87%
statistically relevant
detection rate E2 94.0% 99.5% 91.5% 94.8% 96.5% 97.8% 95.2% 77.6% 99.96%
70% 95% 70% 70% 80% 80% 85% 70% 99%
for ASFiNAG 800.551.2000 pass pass pass pass pass pass pass pass pass
90% 97% 90% 90% 90% 95% 95% 90% 99%
for accuracy level TLS A1 pass pass pass fail pass fail pass fail pass
85% 95% 85% 85% 85% 90% 90% 85% 97%
for accuracy level TLS A2 pass pass pass fail pass pass pass fail pass
80% 90% 80% 80% 80% 85% 85% 80% 95%
for accuracy level TLS A3 pass pass pass fail pass pass pass fail pass
T i (target share of class i) 0.70% 75.00% 6.00% 1.00% 5.00% 5.00% 7.00% 0.30%
A i (actual share of class i) 3.74% 72.00% 9.73% 1.90% 3.08% 2.24% 6.80% 0.50%
Rx 90.6722847 9792.713 734.46063 129.17031 641.39589 647.894635 885.601038 35.62177 13101
Sx 91.714 9826.5 786.12 131.02 655.1 655.1 917.14 39.306 13102
required detection rate
required detection rate
Vehicle in
general
Vehicle class
required detection rate
required detection rate
Final Report
Traffic Detector ADEC TDC3-8-F-B-45
Datei: Final Report ADEC 8+1 V1.4_E.docx Issue/Revision: 03.10.2014 Page 19/28
9 Speed Analysis
Vehicle speeds were recorded on August 28, 2014 between 8h39 and 10h11 AM. The time differ-
ence between the ESO Type ES3.0 Speed Measurement System and the ADEC TDC3-8-F-B-45 is
1 minute and 27 seconds.
The analysis was done using 957 vehicles.
The raw data of the ESO reference speed measurement system is stored in the file
“Rohdaten_ESO-Gewschwindigkeitsmessung.txt”
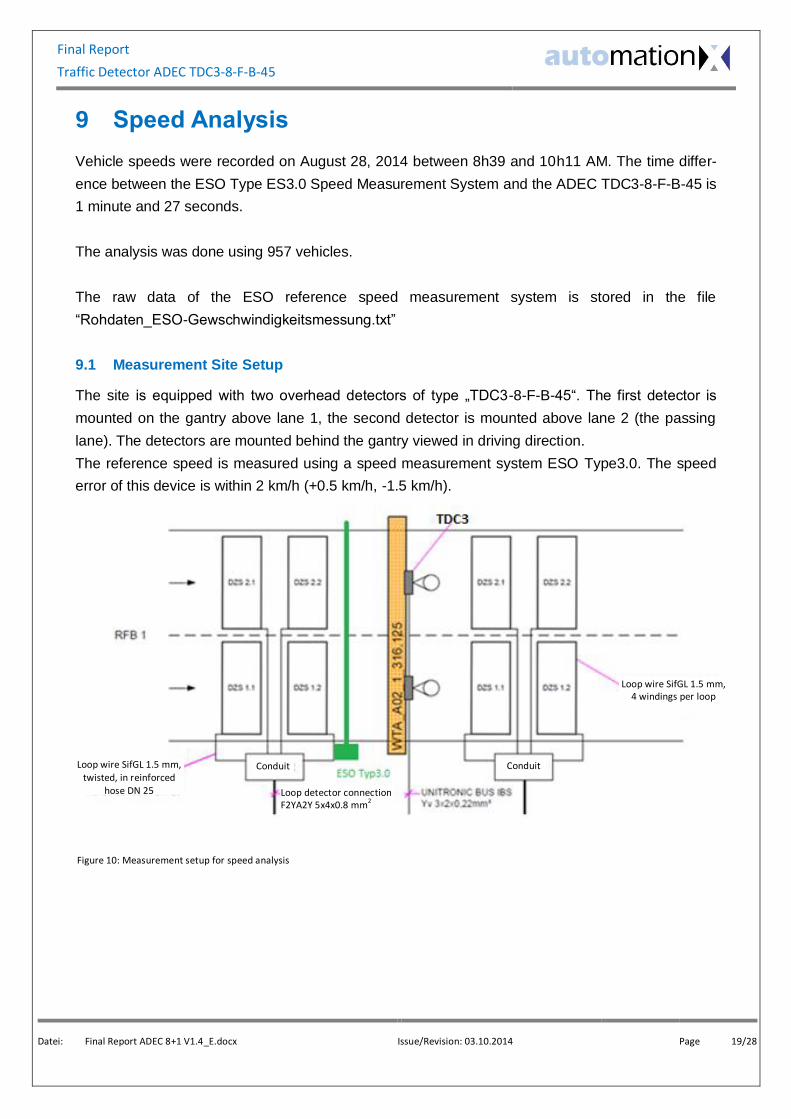
9.1 Measurement Site Setup
The site is equipped with two overhead detectors of type „TDC3-8-F-B-45“. The first detector is
mounted on the gantry above lane 1, the second detector is mounted above lane 2 (the passing
lane). The detectors are mounted behind the gantry viewed in driving direction.
The reference speed is measured using a speed measurement system ESO Type3.0. The speed
error of this device is within 2 km/h (+0.5 km/h, -1.5 km/h).
Figure 10: Measurement setup for speed analysis
Loop detector connection F2YA2Y 5x4x0.8 mm
2
Loop wire SifGL 1.5 mm, twisted, in reinforced
hose DN 25
Conduit Conduit
Loop wire SifGL 1.5 mm, 4 windings per loop
Final Report
Traffic Detector ADEC TDC3-8-F-B-45
Datei: Final Report ADEC 8+1 V1.4_E.docx Issue/Revision: 03.10.2014 Page 20/28
9.2 Specification
9.2.1 Reference System
The reference speed measurement system is a one-sided speed measurement sensor of Type
ES3.0 MATRIX
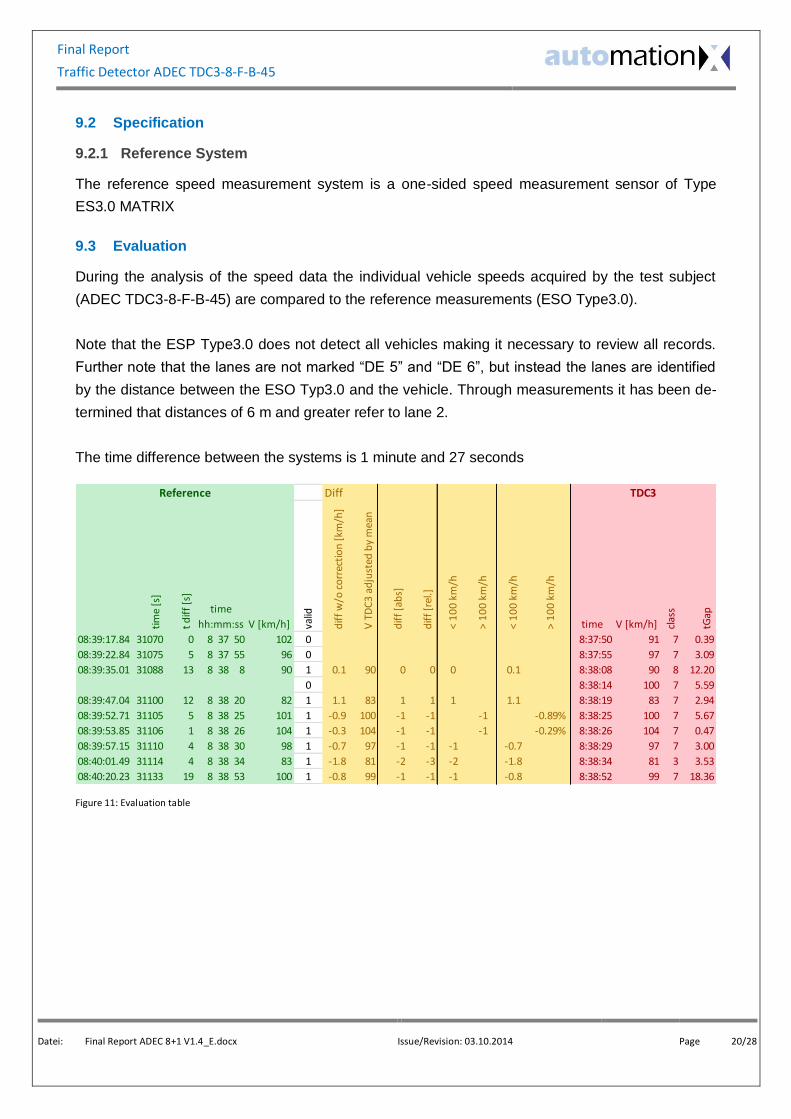
9.3 Evaluation
During the analysis of the speed data the individual vehicle speeds acquired by the test subject
(ADEC TDC3-8-F-B-45) are compared to the reference measurements (ESO Type3.0).
Note that the ESP Type3.0 does not detect all vehicles making it necessary to review all records.
Further note that the lanes are not marked “DE 5” and “DE 6”, but instead the lanes are identified
by the distance between the ESO Typ3.0 and the vehicle. Through measurements it has been de-
termined that distances of 6 m and greater refer to lane 2.
The time difference between the systems is 1 minute and 27 seconds
Figure 11: Evaluation table
Diff
tim
e [s
]
t d
iff
[s]
V [km/h] valid
dif
f w
/o c
orr
ecti
on
[km
/h]
V T
DC
3 a
dju
sted
by
mea
n
dif
f [a
bs]
dif
f [r
el.]
< 1
00
km
/h
> 1
00
km
/h
< 1
00
km
/h
> 1
00
km
/h
time V [km/h] clas
s
tGap
08:39:17.84 31070 0 8 37 50 102 0 8:37:50 91 7 0.39
08:39:22.84 31075 5 8 37 55 96 0 8:37:55 97 7 3.09
08:39:35.01 31088 13 8 38 8 90 1 0.1 90 0 0 0 0.1 8:38:08 90 8 12.20
0 8:38:14 100 7 5.59
08:39:47.04 31100 12 8 38 20 82 1 1.1 83 1 1 1 1.1 8:38:19 83 7 2.94
08:39:52.71 31105 5 8 38 25 101 1 -0.9 100 -1 -1 -1 -0.89% 8:38:25 100 7 5.67
08:39:53.85 31106 1 8 38 26 104 1 -0.3 104 -1 -1 -1 -0.29% 8:38:26 104 7 0.47
08:39:57.15 31110 4 8 38 30 98 1 -0.7 97 -1 -1 -1 -0.7 8:38:29 97 7 3.00
08:40:01.49 31114 4 8 38 34 83 1 -1.8 81 -2 -3 -2 -1.8 8:38:34 81 3 3.53
08:40:20.23 31133 19 8 38 53 100 1 -0.8 99 -1 -1 -1 -0.8 8:38:52 99 7 18.36
Reference TDC3
time
hh:mm:ss

Final Report
Traffic Detector ADEC TDC3-8-F-B-45
Datei: Final Report ADEC 8+1 V1.4_E.docx Issue/Revision: 03.10.2014 Page 21/28
9.4 Results Lane 1
The measurement results were inserted into the ASFiNAG provided template (file
“Geschwindigkeitsauswertung_28.8.2014.xlsx”) which meets the specifications of TLS 2002. The
analysis of the data has been conducted in accordance with the guidelines in TLS 2002.
Figure 12: Average measurement values
The average values are shown in the table.
The results have been calculated automatically using existing formulas in the excel template. The
table includes outliers.
Figure 13: Calculated results, includes outliers
Final Report
Traffic Detector ADEC TDC3-8-F-B-45
Datei: Final Report ADEC 8+1 V1.4_E.docx Issue/Revision: 03.10.2014 Page 22/28
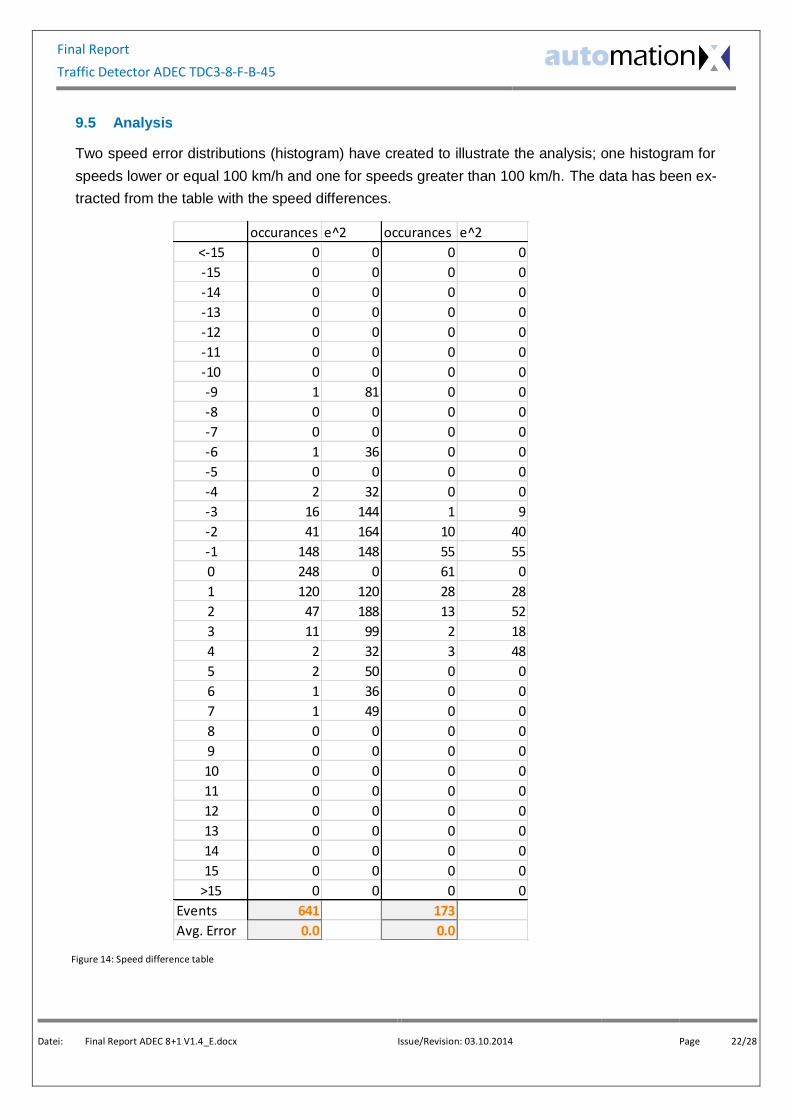
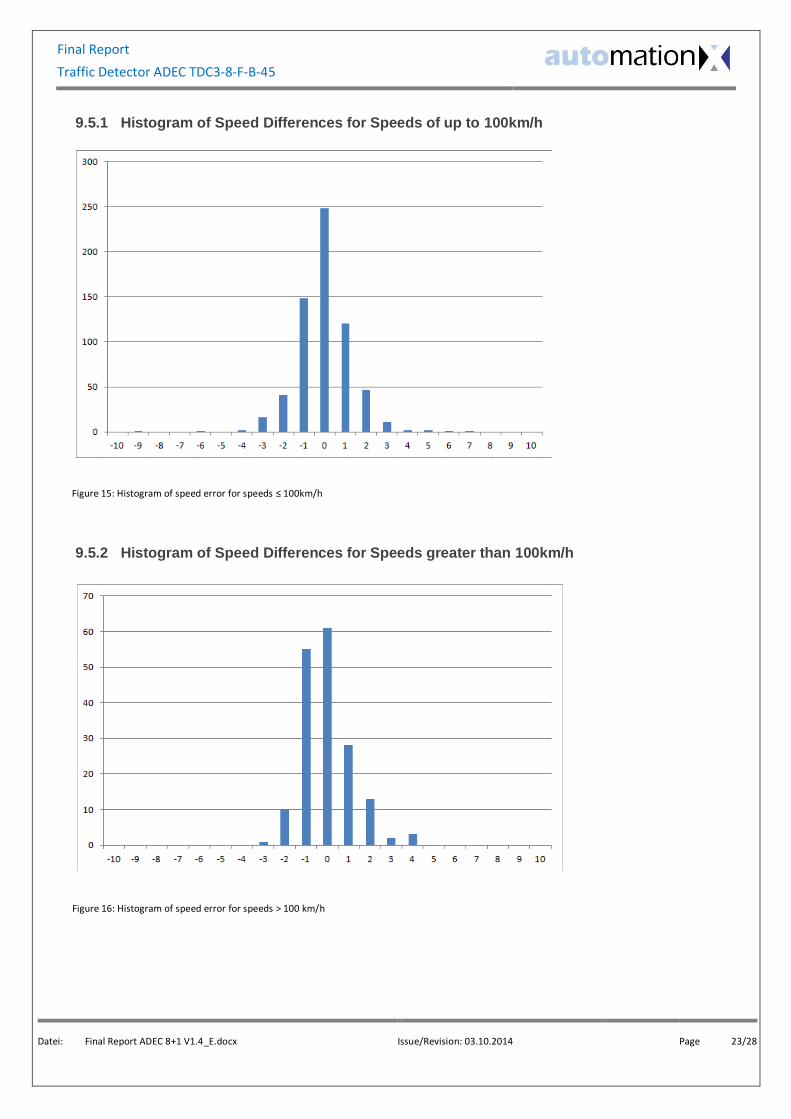
9.5 Analysis
Two speed error distributions (histogram) have created to illustrate the analysis; one histogram for
speeds lower or equal 100 km/h and one for speeds greater than 100 km/h. The data has been ex-
tracted from the table with the speed differences.
Figure 14: Speed difference table
occurances e^2 occurances e^2
<-15 0 0 0 0
-15 0 0 0 0
-14 0 0 0 0
-13 0 0 0 0
-12 0 0 0 0
-11 0 0 0 0
-10 0 0 0 0
-9 1 81 0 0
-8 0 0 0 0
-7 0 0 0 0
-6 1 36 0 0
-5 0 0 0 0
-4 2 32 0 0
-3 16 144 1 9
-2 41 164 10 40
-1 148 148 55 55
0 248 0 61 0
1 120 120 28 28
2 47 188 13 52
3 11 99 2 18
4 2 32 3 48
5 2 50 0 0
6 1 36 0 0
7 1 49 0 0
8 0 0 0 0
9 0 0 0 0
10 0 0 0 0
11 0 0 0 0
12 0 0 0 0
13 0 0 0 0
14 0 0 0 0
15 0 0 0 0
>15 0 0 0 0
Events 641 173
Avg. Error 0.0 0.0
Final Report
Traffic Detector ADEC TDC3-8-F-B-45
Datei: Final Report ADEC 8+1 V1.4_E.docx Issue/Revision: 03.10.2014 Page 23/28
9.5.1 Histogram of Speed Differences for Speeds of up to 100km/h
9.5.2 Histogram of Speed Differences for Speeds greater than 100km/h
Figure 16: Histogram of speed error for speeds > 100 km/h
Figure 15: Histogram of speed error for speeds ≤ 100km/h

Final Report
Traffic Detector ADEC TDC3-8-F-B-45
Datei: Final Report ADEC 8+1 V1.4_E.docx Issue/Revision: 03.10.2014 Page 24/28
9.6 Results Passing Lane (Lane 2)
The measurement results were inserted into the ASFiNAG provided template (file
“Geschwindigkeitsauswertung_28.8.2014.xlsx”) which meets the specifications of TLS 2002. The
analysis of the data has been conducted in accordance with the guidelines in TLS 2002.
The average values are shown in the table.
Figure 17: Average measurement values
The results have been calculated automatically using existing formulas in the excel template. The
table includes the outliers.
Figure 18: Calculated results, includes outliers
Final Report
Traffic Detector ADEC TDC3-8-F-B-45
Datei: Final Report ADEC 8+1 V1.4_E.docx Issue/Revision: 03.10.2014 Page 25/28
occurances e^2 occurances e^2
<-15 0 0 0 0
-15 0 0 0 0
-14 0 0 0 0
-13 0 0 0 0
-12 0 0 0 0
-11 0 0 0 0
-10 0 0 0 0
-9 0 0 0 0
-8 0 0 0 0
-7 1 49 0 0
-6 0 0 0 0
-5 0 0 0 0
-4 0 0 3 48
-3 0 0 1 9
-2 2 8 4 16
-1 6 6 17 17
0 13 0 33 0
1 5 5 15 15
2 4 16 2 8
3 2 18 4 36
4 0 0 1 16
5 0 0 0 0
6 0 0 0 0
7 0 0 0 0
8 0 0 0 0
9 0 0 0 0
10 0 0 0 0
11 0 0 0 0
12 0 0 0 0
13 0 0 0 0
14 0 0 0 0
15 0 0 0 0
>15 0 0 0 0
Events 33 80
Avg. error 0.1 -0.1
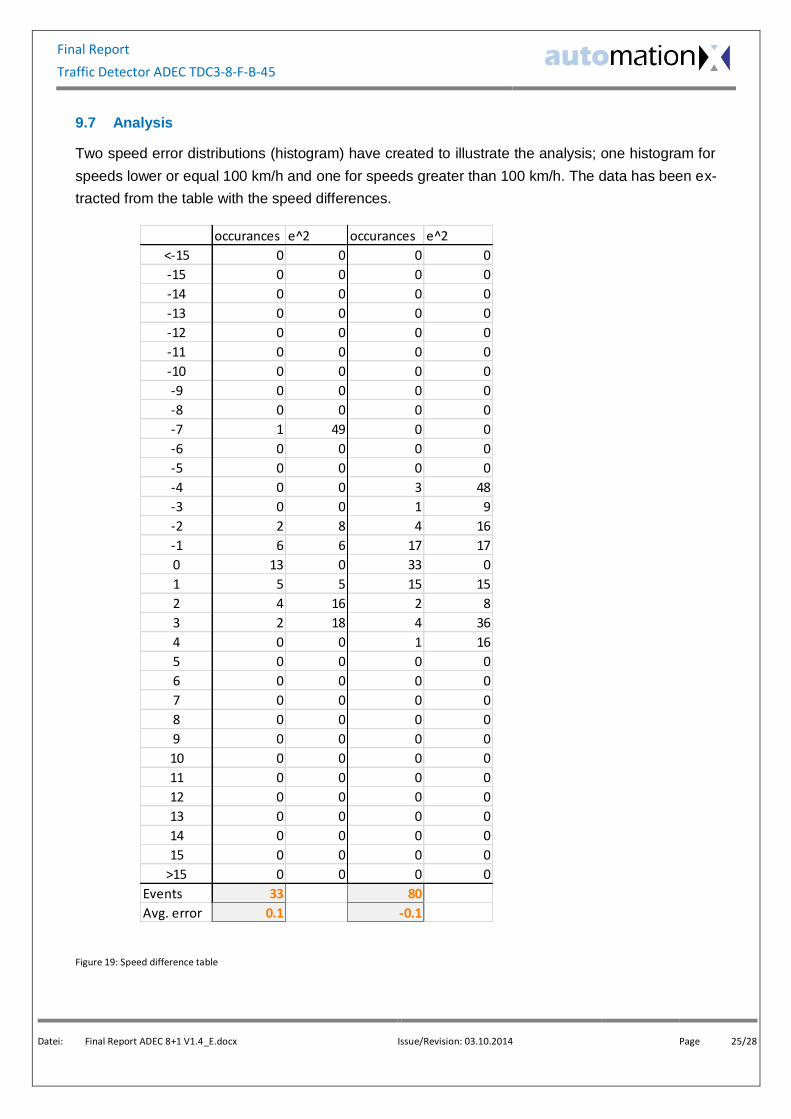
9.7 Analysis
Two speed error distributions (histogram) have created to illustrate the analysis; one histogram for
speeds lower or equal 100 km/h and one for speeds greater than 100 km/h. The data has been ex-
tracted from the table with the speed differences.
Figure 19: Speed difference table

Final Report
Traffic Detector ADEC TDC3-8-F-B-45
Datei: Final Report ADEC 8+1 V1.4_E.docx Issue/Revision: 03.10.2014 Page 26/28
9.7.1 Histogram of Speed Differences for Speeds of up to 100km/h
9.7.2 Histogram of Speed Differences for Speeds greater than 100km/h
Figure 20: Histogram of speed error for speeds ≤ 100km/h
Figure 21: Histogram of speed error for speeds > 100 km/h

Final Report
Traffic Detector ADEC TDC3-8-F-B-45
Datei: Final Report ADEC 8+1 V1.4_E.docx Issue/Revision: 03.10.2014 Page 27/28
10 Conclusion
The classification accuracy requirements set forth by ASFiNAG in the Document 800.551.2000
(“Verkehrsbeeinflussungsanlagen (VBA) Technische Spezifikationen”, Version 2.0) are defined on
page 57 of said document, the table excerpt is below:
ADEC TDC3-8-F-B-45
Det. rate [%]* TLS Class E1 [%] E2 [%]**
Motorcycle 70.00 not defined 90.5 94.0
Car 95.00 A2 99.6 98.9
Van 70.00 not defined 95.7 91.5
Car with trailer 70.00 not defined 79.3 94.8
Truck 80.00 A3 93.3 96.5
Truck with trailer 80.00 not defined 92.2 97.8
Tractor w/ semitr. 85.00 A3 95.7 95.2
Bus 70.00 not defined 94.5 77.6
* Minimum detection rate required by ASFiNAG according to Document 800.551.2000, p. 57 ** Statistically relevant detection rate using standardized vehicle mix
Table 8: ASFiNAG required classification accuracy
The traffic detector Type TDC3-8-F-B-45 by ADEC Technologies with Hardware Version 4 and
Firmware Version 1.4 meets the requirements set forth by ASFiNAG both regarding the classifica-
tion accuracy as well as the speed accuracy.

Final Report
Traffic Detector ADEC TDC3-8-F-B-45
Datei: Final Report ADEC 8+1 V1.4_E.docx Issue/Revision: 03.10.2014 Page 28/28
11 Attachments Included by Reference